M - *>--*• 3£«*- . 15»A«r * imerflatiiiiV ! Cgsnic Ray ...
305
1<\M - * > - - * • 3£«*- A«r *V . 15» imerflatiiii! Cgsnic Ray Conference VOLUME B MN SESSION /«* .\ PLOVDIV, B
Transcript of M - *>--*• 3£«*- . 15»A«r * imerflatiiiiV ! Cgsnic Ray ...

1<\M - *>--*• 3£«*-A«r * V
. 15» imerflatiiii! Cgsnic Ray Conference
VOLUME B M N SESSION
/«* .\
PLOVDIV, B

PREFACE
The present publication contains the proceedings of the 15th International Cosmic Ray Conference, Plovdiv, 13-26 August, 1977. This Conference is to be held under the auspices of the International Union of Pure and Applied Physics, organized by the Bulgarian Academy of Sciences.
The publication comprises 12 volumes. Volumes from I to 9 include the original contributions, which have arrived at the Secretariat of the National Organizing Committee by May 26, 1977. Papers which have been declared but not submitted by that date have been represented by their abstracts. Volumes from 10 to 12 include the invited and rapporteur lectures, as well as late original papers. Volume 12 contains the general contents of the volumes, an authors' index and other references.
All papers included in the present publication are exact reproductions of the authors' original manuscripts. The Secretariat has not made any corrections or changes in the texts. The original contributions have been accepted and included in the programme after a decision of the International Programme Advisory Board of the 15th ICRC on the basis of their abstracts. The full texts of the papers, however, kave not been refereed by the editorial board of the present publication.
The first nine volumes have been organized in accordance with the classical headings adopted at the cosmic ray conferences, which also coincide with the sessions.
Volume 1 - OG (Origin) Session Volume 2 - OG (Origin) Session Volume 3 - MG (Modulations and Geophysical Effects) Session Volume 4 - MG (Modulations and Geophysical Effects) Session Volume 5 - SP (Solar Particles) Session Volume 5 A**** vA**ucns anu nutnncsy hj&ssicn Volume 7 - HE (High Energy Physics) Session Volume 8 - EA (Extensive Air Showers) Session Volume 9 - T (Techniques) Session The National Organizing Committee is indebted to the invited reporters and rapporteur lec
turers, as well as to all authors of original papers, who, by their hard and highly qualified work, have contributed to the success of the Conference and have made possible the publication of the present proceedings.
We also express acknowledgement to the members of the Organizing Committee and the Secretariat of the Conference, as well as to the Publishing House of the Bulgarian Academy of Sciences, without whose diligent work the publication of the proceedings would have been impossible.
Acad. Christo Ya. Christov Chairman of the National
Organizing Committee
BULGARIAN NATIONAL ORGANIZING COMMITTEE
Honorary Chairman - Acad. A. Balevsky, President of the Bulgarian Academy of Sciences and Member of the State Council
Executive Chairman: Ch. Ya. Christov Vice-Chairman: P.K.Markov Secretary: B.L. Betev Members: M. Bcrisov, I. Todorov, G. Nestorov, K. Serafimov, Ts. Bonchev, Ts. ittkov, D. Pari-kian, N. Balabanov, J. Stamenov, L. Popova, St. Kavlakov, T. Stinev, N. Ahababian, S. Ushev, Ch. Tchernev, T. Palev, I. Kirov, J. Georgiev, L Katsaraky
MEMBERS OF THE COSMIC RAY COMMISSION OF IUPAP Chairman: Professor A.J. Somogyi (Hungary) Secretary: Professor S. Miyake (Japan) Members: Professor A.E. Chudakov (USSR), Professor R.R. Daniel (India), Professor R. Gall (Mexico), Professor B. Peters (Denmark), Professor K. Pinkau (FRG), Professor H. Reeves (France), Professor C.J.Waddington (USA), Professor A.W. Wolfendale (UK)
INTERNATIONAL PROGRAMME ADVISORY BOARD Chairman: Professor Ch. Christov Secretary: Dr B. Betev Members: Professor A. Chudakov (USSR), Professor H. Elliot (UK), Professor S. Miyake (Japan), Professor S. Nikolsky (USSR), Professor K. Pinkau (FRG), Professor A. Somogyi (Hungary), Professor C. Waddington (USA), Professor G. Yodh (USA)
The 15th International Cosmic Ray Conference is organized by the Bulgarian Academy of Sciences under the auspices of the International Union of Pure and Applied Physics.
ADDRESS OF SECRETARIAT Institute for Nuclear Research and Nuclear Energy Sofia 1113,72 Blvd Lenin Telephone: 73-41 Telex: SOFIA BAN 22424

TABLE OF CONTENTS
VOLUME 6 - MUONS AND NEUTRINOS
MUON INTENSITIES, SPECTRA, INTERACTICNS AND DETECTORS
P«ge
MN-1 Cosmic Ray Muon Charge Ratio at Sea Level and Charge 1 Composition of Primary Cosmic Rays L. V. Volkova, G. T. Zatsepln and L. A. Kuz'mltchev
MN-2 Energy Cosmic Ray Muon Spectrum at Sea Level and Primary 6 Cosmic Radiation Spectrum L. V. Volkova, G, T„ Zatsepln and L. A. Kuz'mltchev
MN-3 The Charge Ratio of Cosmic Ray Muons 12 Y. Mlnorikawa and T. Saito
MN-4 Energy Spectrum and Charge Ratio of Muons Related 18 to Primary Spectra S.Alessto, M. Iterdo and K. Sitte (Abstract)
MN-5 The Approach to Scaling and the Charge Ratio of 19 Cosmic Ray Muons A. Liland (Abstract)
MN-6 The Vertical Muon Charge Ratio and the Momentum 20 Spectrum A. K. Lee and E. C. M. Young (Abstract)
MN-7 The Momentum Spectrum and Charge Ratio of Muons 21 i ) 3 TeV/c M.G.Thompson, R.Thornley, M.R.Whalley and A.W.Wolfendale
MN-8 An Analysis of Momentum Spectrum of Muon 26 H. Komori
MN-9 Arrival Direction Dependence of Moon Charge Ratio 32 Y.Kamiya, S.Shlbata and S.tida
MN-10 Preliminary Results on Charge-Ratio and Spectrum 37 Measurements of Deis O.C.Allkofer, G.Bella, E.Böhm, W.D.Deu, H.Jolds«h,G. Klemtet, Y.Oren, R.C. Uhrand Y.Yetvin (Abstract)
MN-11 The Horizontal Moon Spectrum and Charge Ratio 38

VI
up to 1 TeV O.C.Allkofer, K. Carstensen, W.D.Dau, H.Joktschand H. J. Meyer
MN-12 The Energy Spectrum of Muons with Energies Above 44 3 TeV T.P.Aminteva, L. KuzrMchev, M.A.Ivanova, K. V. Mandrit-skaya, E. A.Osipova, I.V.Rakobolskaya, N.V. Sokolskaya, A. Ya. Varkovltakaya and G.T. Zatseptn (Abstract)
MN-13 Momentum Spectrum and Charge Ratio of Comslc 45 Ray Muons .'t the Zenith Angle 84 T. L.Asatlati, S.V.Alchudzhyan, JK. A. Gazaryan, L. L Kbzliner, V. N. Prochorov, K. K. Prochorova and A. A. Chllingarian (Abstract)
MN-14 Momentum and Zenithal Dependence of the 4 6 Enhancements of Intensities of Cosmic Ray MUOÜS M.S.A'odel-Monem, A.R.Osborne, J.R. Beafcook, W.R.Sheldon, N.M.Duller, P.J.Green, >1..M.Choate and C. E. Magnusson
MN-15 Measurement of Muon Spectrum and Charge Ratio 51 in the flange P^ =100^10,000 GeV/c S.Higashi, K.Honda, S.Ilda, Y.Kamiya, Y.Kawashima, T.Kitamura, K.Kobayakawa, S. Mika mo, Y.Minorlkawa, K. Mitsui, S. Miyake, Y.Muraki, LNakamura, Y.Ohashi, A.Okada, S.Ozaki, H.Shibata, T.Takshashi and Y. Teramoto
MN-16 The Cosmic Ray Muon Intensities Near Horizontal 57 Direction: Measurement by the Momentum Selection System of Mutron Spectrometer S.Higashi, K.Honda, Y.Kamiya, Y. Ktwashima, T.Kitamura, S.Ilda, K.Kobayakawa, S,Mlkamo, Y.Minorlkawa, K,Mitsui, S.Miyake, Y.Muraki, I.Nakamura, Y.Ohashi, A.Okada, S.Ozaki, H.Shibata, T.Takahashi and Y.Tsramoto
MN-17 Pair Meter - A New Muon Spectrometer 62 S.Higashi, K.Honda, S.IMa, Y.Kamiya, Y.Kawashima, T.Kitamura, K. Kobayakawa, S.Mikamo, Y.Minorlkawa, K. Mitsui, & Miyake, Y.Muraki, I.Nakamura, Y.Ohashi, A.Okada, S.Ozaki, H.Shibata, T.Takahashi and Y. Teramoto (Abstract)
MN-18 Predicted Cross Sections for Dlrectpair Production (DPP) 63 of Electron and Positron by High Energy Mi ons A. Paul and N. Chaudhuri (Abstract)

VII
MN-19 Experimental Study of Direct Pair Production (DPP) 84 of Electron-Positron by High Energy Cosmic Ray Muons A.Paul, N.L.Karmakar and N.Chaudhurl (Abstract)
MN-20 Electromagnetic Interactions of •<, ITeV Muons 65 S.Higashl, K. Honda, S.Uda, Y.Kamiya, Y.Kawaahima, T.Kltamura, K.Kobayakawa, S. Mlkamo, Y. Mlnorlkawa, K.Mitsui, &Mlyake, Y.Murakl, I.Nakamura, Y.Ohashl, A.Okada, S.Ozakl, H.Shlbata, T.Takahashl and Y. Teramoto
MN-21 Electromagnetic Interactions of Cosmic Ray Muons in 70 Iron W. Stamm, A. Bäcker, C.Grupen, H.Joklsch, W.D. Dau and O. C. Allkofer
MN-22 The Vertical Energy Spectrum of Cosmic Ray Muons 74 above 1 TeV at Sea Level M.Akashi, K.KaSahara, A. Misakl, LMlto, K. Mizutani, A.Ohsawa, I.Ohta, M.Shibata, T.Shirai, K.Taira, T.Taira, Y. Takahashl, N.Tateyama, S.Torii, Z.Watanabe and T.Yuda
MN-23 Scattering Horizontal Muon Measurement 79 T.Wada, Y.Iga, K.Hikasa, Y.Hirakl, T.Fukaya, I. Yamamoto and S, Katsube
MN-24 Depth Vs Intensity Relation and Integral Energy 85 Spectrum of Muons M.R.Krishnaswamy, M. G.K. Menon, V. S. Narasimham, N. Ito, S. Kawakami and S. Miyake
MN-25 Average Energies and Differential Energy Spectrum 91 of Muon at Various Depths J. Nishimura and A. Misaki (Abstract)
MN-26 On the High Energy Muons Deep Underground 92 K. Mizutani (Abstract)
MN-27 Measurements of the Energy Spectrum of Muons 93 Deep Underground at High Energy K. Mizutani and I. Ohta
MN-128 Experimental Investigation of the Muon Range- 98 Energy Relation W.B. Sheldon, J.R.Benbrook, N.M.Duller, P.J.Green, A. R. Bazer-Bachi and G. Verdrenne (Abstract)

v»: MN-29 Cosmic Ray Intensities at Shallow Depths 99
J. C. Percy and I. W. Rogers
MN-30 Angular Distribution of Muons Between 4000-9000hg 104 c m " 2 B. r . L. Bergamasco, B. Baschiera, C. Castagnoli, B.D'Ettore Piazzoly, G. Mannocchi, L. Bilokon and P. Ptcchi (Abstract)
MN-31 Muon Intensity at Sea Level with Flash Tubes Apparatus 105 S-Aleesio, B.Baschiera, C.Castagnoli, B.D'Ettore Plazzoli, G. Mannocchi, L. Bilokon and P. Picchi (Abstract)
MN-32 Angular Distribution of Low Energy Muons at a Depth 106 of 417 hg c m - 2 Underground P.N.Bhat and P . V. Ramana Murthy (Abstract)
MN-33 A Theoretical Study of the Possibilities for Localization 107 of Anomalous Density Distribution in Rock by Means of Underground Cosmic Ray Muon Intensity Measurements L. Jacobsson G. Jönsson, K. Kristiansson and L. Malmqvist
MN-34 Underground Anticoincidence Studies 111 J.C.Barton» R.Riley, LW.Rogers, A. J .Parsons and A. G. Wright
MN-35 Deep Underground and Underseas Stopping Particles 116 • and Their Possible Relation to Primordial Superheavy
Elements P. Kötzer, R. Lindsay, S. Anderson, J. Lord and K. Stehllng (Abstract)
MN-36 An Evaluation of Muon-Nuclear Interaction Formulations 117 for Cosmic Ray Experiments N. L. Karmakar and N. Chaudhurl (Abstract)
MN-37 Nuclear Interaction Cross Section of Cosmic Ray Muons 118 Estimated from the Results of the Accelerator Experiments T.Kltamura
MN-38 The Nuclear Etargy Loss Parameter B for Muons 124 W. Consta»» and W. D. Dau (Abstract)
MN-38 Nuclear Interactions of Cosmic Kay Muons 125 A.Dtekmann, W.Stamm, A. Backer, Vv.D.Dau, H. Joktach and K. Carstensen (Abstract)

IX
MN-40 Electromagnetic and Nuclear Interaction» of Coamlc 126 Ray lfuona T. L.Aaatlanl, S. V. Alchudzhyan, K. A. Gazaryaa, CE.Mlnaayan, L.LKozltner, S. V. Ter-Antonyan, V. N.Prochorov, K.ICProchorova and A. A. Chlllngarlan (Abstract)
MN-41 The Study of Non-Elastic Interaction of » 0.0 TeV 127 Energy Muona with the Iron Nuclei V. A. Aglamazov, L. D. Gsdevanishvtli and L L Sakvarelldze
MN-42 The Study of Cascade Showers of ^ 0.3 TeV Energy 133 Formed by Cosmic Ray Moons In Iron V. A. Aglamazov, L. D. Gedevanlshvill, V.D. Gokiell, J. S. Petrosyan, A. G. Kobulashvili, Z.P.Robakidze, I. L Sakvarelldze and N. G. Khazaradze
MN-43 Anomalous Showers In Deep Underground Observations 137 ln Kolar Gold Mines M. R. Krlshnaswamy, M. G. K. Menon, V. S. Naraslmham, N. fto, S. Kawakaml and S. Mlyake
MN-44 Calculation of Muon Momentum Spectra at Sea Level 143 K. Murakami, S.SagUaka, A. Inoue, Y.Mlshtma and K. Nagashlma
MN-45 The Lateral Distribution of Muons in Extensive Air 148 Showers at Sea Level F.Ashton, J. Fateml, H. Nejebat, A. Nasri, E.Shaat, A.C.Smith, T.R.Stewart, M.G.Thompson, M.W.Treasure and LA.Ward (Abstract)
MN-46 Studies of Muon Shower» Underground. L Techniques 149 and Methods B. D'Ettorre Piazzoli, G. Mannocchi, P. Picchi, R.Visentln and K. Sitte
MN-47 Studies of Muon Showers Underground. IL Analysis and 154 Discussion B. D'Ettorre Piazzoli, G. Mannocchi, P. Picchi, R.Visentln and K.Sitte (Abstract)
MN-48 Muon Energies in Extensive Air Showers 155 J.F.de Beer and F. A. Venter

x MN-49 Multiple lfuon Events Observed ln Kolar Gold Mines 181
M.R.Krlshnaswamy, M.G.K.Men>n, V.S.Naraatmham, N. Bo, S. Kawakaml and S. Miyake
MN-50 Muon Array and the Problems of Muon Measurements 167 Yu. N. Bazhutov, Yu.A.Nechln, S.M.Rozhdastvensky. B. A. Khrenov and G. B. Khrlsttansen
MN-S1 Detecting System of Multiple Parallel Muons 171 T.Wada, Y.Iga, Y.Hlrakl, K.Hlkasa, LYamamoto and SLKatsube
MN-52 Cosmic Bay Muon Pairs at Large Zenith Angle 177 T. L.Asatlanl, S.V. Alchudzhyan, K. A. Gazaryan, L. L Kbzliner, G. S. Martlrosyan and S. V. Ter-Antonyan (Abstract)
MN-53 The Search for Direct Multiple Generation of Muons 178 inEåS E.V. Basarov, R.V. Beisembaev, S.P.Beschapov, Yu. N. Vavilov, L. I. Vildanova and N. V. Kabanova (Abstract)
MN-54 The Search for Directly Produced Muon Pairs ln 179 Extensive Air Showers E.V. Basarov, R.U .Beisembaev, S.P.Beschapov, Yu.N. Vavilov and L. I, Vildanova
MN-55 On Locally Generated Bundles of the Penetrating 185 Particles at the Depth of 200 HWE . T. T. Barnavell, G. A. Grubelashvill, O. L Levlt, L V. Khaldeeva, D. A. Eristavi and N A. Erlstavl
MN-56 Investigation of Multiple Muons at Different Zenith 191 Angles T.T.Barnaveli, M.F. Bibllashvili, G. A. Grubelashvili, O. L Levlt, L. V. Khaldeeva, D. A. Eristavi and N. A. Erlstavl (Abstract)
MN-80 The Response Function of Cosiutc-ray Muons Deep 192 Underground L. K. Ng and C. H. Poon (Abstract)
MN-57 Energy Spectrum of a Lepton Pair (Contribution from 193 Virtual Bremsstrahlung) A.LNlkishov
MN-58 Direct Lepton in Cosmic Rays 199 L. G. Dedenko, V. A. Kuzmln and L M. Zheleznykh (Abstract)

XI
MN-81 Momentum Spectra and Charge Ratio of Muons as a 200 Function of Zenith Angles G. D. Badhwar and S. A. Stephens
MN-59 Pair-Production by LlgHtquantas and the New Inter- 205 pretation of the Conservation Laws of Physics K. R. Bagge
NEUTRINOS
MN-60 The Function of Distribution In the Interior of the 211 Sun and Neutrinos Def i o i t S. S. Vastllev and G. E. Kocharov
MN-61 Bayeslan Analysis of the Brookhaven Solar Neutrino 215 Experiment A.M.Aurela
MN-62 The Cosmic Ray Neutrino-Induced Background in the 219 Solar Neutrino Experiment A. W. Wolfendale and E. C. M. Young (Abstract)
MN-79 The Probing of the Sun by the Solar Neutrinos, and the 220 Terrestrial Ice Ages B.Kuchowics
MN-63 One More Analysis of Cosmic Ray Neutrino Experiments 226 L. V. Volkova and G. T. Zatsepin (Abstract)
MN-64 Cosmic Neutrinos and Search for W-Boson with the Mass 227 30-100 GeV in the Deep Underwater Experiments V. S. Berezinsky and A. Z. Gazizov
MN-65 Extraterrestrial Neutrinos and High Energy Neutrino 231 Astrophysics V. S. Berezinsky
MN-66 Diffuse Background of Cosmic Neutrinos at High 237 Energies R. SUberberg abd M. M. Shapiro
MN-77 Search for Neutrinos of Extraterrestrial Origin 243 W.Frat i , K. Lande, C.K. Lee, R.LSteinberg, E.Fenyves and O. Saavedra (Abstract)
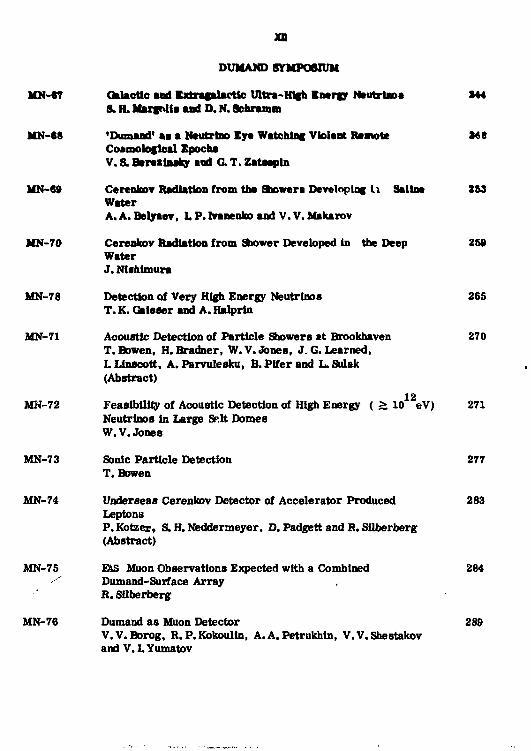
xn DUMAND SYMPOSIUM
MN-67 Galactic and Extragalacttc Ultra-High Energy Neutrtaoa S44 S. H. Margnlia and D. N. Schramm
MN-68 'Dumaad* as a Ntutrtno Eye Watching Vlolant Rratote Me Coamologlcal Epochs V. S. Bartalnaky and G. T. Zatsspln
MN-89 Cerenkov Radiation from the Shower a Developing l i Saline 253 Water A. A. Belyaev, h P. Ivanenko and V. V. Makarov
MN-70 Cerenkov Radiation from Shower Developed in the Deep 25» Water J. Ntshlmura
MN-78 Detection of Very High Energy Neutrinos 265 T. K. Gaisaer and A. Halprin
MN-71 Acoustic Detection of Particle Showers at Brookhaven 270 T.Bowen, H.Bradner, W.V.Jones, J,G.Learned, I. Linscott, A. Parvulesku, B. Pifer and L. Sulak (Abstract)
MN-72 Feasibility of Acoustic Detection of High Energy ( > 10 1 2 eV) 271 Neutrinos in Large Sp.lt Domes W.V.Jones
MN-73 Sonic Particle Detection 277 T. Bowen
MN-74 Underseas Cerenkov Detector of Accelerator Produced 283 Leptons P. Kötzer, S. H. Neddermeyer, D. Padgett and R. Silberberg (Abstract)
MN-75 E&S Muon Observations Expected with a Combined 284 Dumand-Surface Array R. Silberberg
MN-76 Dumand as Muon Detector 289 V.V.Borog, R.P.Kokoulln, A.A.Petrukhln, V.V.Shestakov and V. LYumatov

bUrUCrl COSMIC EAT MOOS CHAkOE RATIO AT SEA LEVEL AMD CHAMS COMPOBITIO» OP PüDUHT COßMIC RAYS
L.V.Volkova and G.T.Zatsepln Institut» for Nuclear Raaaarch of the USSR Academy of Scienoea, Moscow
L.A.Kus'mltchev Tha Moscow Stata University
It ia calculated auon charge excess at aaa level for a wide range of energies. Crone-sections for nuclear interactions of protons and piona found in accelerator experiments ara used. To agree calculated and experimental cosmic ray muor. ratio it is necessary to assume that the ratio of nuclei to protons in primary cosmic ray radiation begins to increase at energies mors
than soma Ter. 1. Introduction. On tha baa^s of a model that had bean used in cosmic ray calculations and was later named "sealing", it was calculated cosmic ray auon positive excess at aea level in (Volkova, Zataepin, 1965) for energy interval 1*10-*Gev. It was found there that averaged over cosmic ray spectrum the "R/S~ ratio for an act of proton-air nuclei interaction is to be 1.45 (if neutrons are 13% of nucleons in primary radiation, and the possibility for nucleon to change its Charge state is 0.5 in this interaction).
The appearance of accelerator data on piona generation in pp interactions has initiated many works (Prager et al 1972, Yen 1973, Tekitieli 1973, Volkova 1973, Adair 1974, Erlykln 1974, Hoffman 1975) where positive excess of cosmic ray noons was oalcnlated using this data. In the most part of these wc.rLa tha calculations were made for muona with energy max* than 50 Gev. The authors of these works have fon-id tliÄ-- there ar-e discrepences between their calculations azA experimental results* Possible causes of these discrepences ate considered in some works.
For energy interval 1 - 10*Gev the positive excess was calculated in (Badhwar at al 1976). Using modern accelerator experimental data on inclusive cross-sections for pions and kaons generation in pp interaction* ?&a authors have coma to tha conclusion that their calculations on positive excess agree with experimental data in all considered energy interval at assumptions 1. sealing is valid in all interval 2. primary radiation composition is constant, neutrons ara 10JS of protons, using thair cross-sections wa rave calculated cosmic ray positive excess and we can not declare such conclusions.

2
2. ?•+* PT"!ttft Mfl tJWflptlona. In oar oaloulationa ws naed inftlnaive a—aa aeotlaaa om piona and kaona generation in pp lnteraotlona reoeived la (Badhaar at al 1974, Dabna, 197*; trom aoealarator experimental data. On naaona generation ln an lntaraotiona tha following anau^ptiona vara aada 1. X * naaona ara generated aa Tt* naaona ln'pp iataraotlona 2. fron the noat rough oonaidaration of poeaible kaon gene-ratlon oanala that taka into account ooaaervation of charge, etrangeae and baryoa numbara wa nara received that, ratio ^/icT ia 1.$ ln na lntaraotiona and tha «hola number
of generated kaona ia tha aan« aa ln pp lntaraotiona. Tha aolutlon of kin»tie eouatlona for propagationa of nuo-leoaa. piona and kaona throng tha ataoaphere vaa received by ualag of tha aathod valen «aa daaeribad la (Volkova at al* 1977). Tha piona and kaona regeneration and logarith-aic daeraaaa la nuclaoa and aaaon nuclear lataraotion patha in tha atnoaphe'-e wara takan into account* 3. Tha raanlta of tha oalculationa. Tha ratio o\/Ol' for pp intaraetiona averaged over primary coaalc ray radiation apactron ia given in Fig. i (tha diffarontial primary spectrum ia takan ln tha forn JUT 2* 6 5)
10"
Fig.1. Tha ratio syg- for generation in pp intaraetiona averaged over priaary cosnic ray spectrum.
i' . „ 1 _
10
i —
1.5 . „ 1 _
10 • i
1 . „ 1 _
10 E
w1 id

Th* increaae otyCtov piona at low *nergl*e i* connected vitn
th* fact that at auch energlea th* scaling do** not tak* plao*
> 1.5 5
p?
100 200 300 H00 depth «/cm»
100 200 300 100
depkh*& m»
Th* ratio of differential ap*otra of X
aaaona to th*** of
*Ä aaaona aa functions of depths in th* at-ao*ph*r* on* can a*« in ?ig.2.
Th* fact that nuc-l*ona ax* pack*d in air nuclei van tak*n into account In th* •annar propoaed in (Badhvar at al 1976), Introduced th*r* parameter n van taken Ho be equal to 0,2,0.4. In (Badhvar et al.,1976) the authors nar« taken «1 =0.2.
Iig.2 The ratio fr»V£jr as functions of atmospheric depths
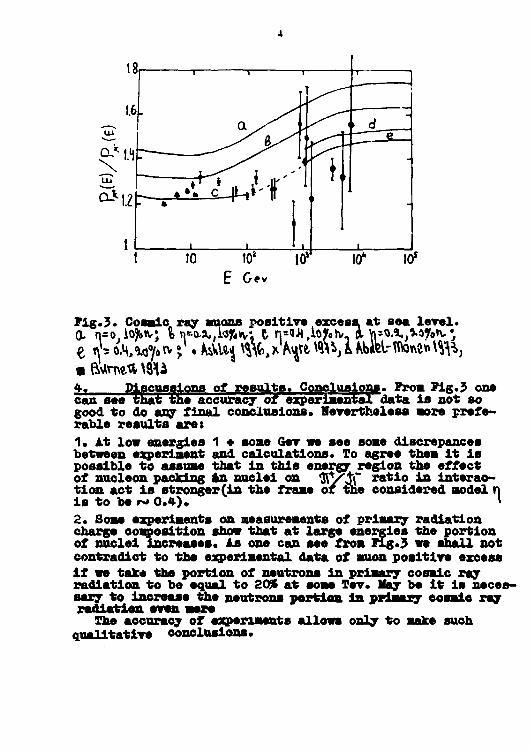
Coeaic ray anon positive excess at sea level calculated in this work is given in Hg.3 for different assumptions on soae used parameters. Boas experimental points are given there too.
4
Conclusions. Fron Pig.3 one rperimental data i s not so
r i g . 3 . Cosmic ray auons positive excess, at sea leTel.
• Bum*« WW 4. Discussions of results. can see that the accuracy of experiment good to do any final conclusions. Nevertheless more preferable results are:
1. Åt low energies 1 * some GOT we see soae discrepances between experiment and calculations. To agree them it is possible to assume that in this energy region the effect of nucleon packing an nuclei on tøVÆT ratio in interaction act is stronger (in the frame of the considered model n is to be r+ 0.4). I
2. Some experiments on measurements of primary radiation charge composition show that at large energies the portion of nuclei increases. Ås one can see from Fig.3 we shall not contradict to the experimental data of muon positive excess If we take the portion of neutrons in primary cosmic ray radiation to be equal to 20% at some Tev. may be it is necessary to increase the neutrons portion la, primary eosmlo ray radiation even mere
The accuracy of experiments allows only to make such qualitative conclusions.

5 Refereneea
Abdel I H M M.S. at «1 1973 ProcXIII Int.Conf.CR 3, 1811 Adair B.I.197* Fhya.RaT.Lett. 33, 115 kmhlmj 0.1., Xeoffel J.W., LareoB M.0.1975 Fhye.Rer.Dl2,20 Ayre C.A. et al. 1973 Proc.IIII Int.Cénf.C.R. 3. 1822 Badnaar J.D., Stephana S.A., Golden 1977 Preprint Botnat« T2H. at al, 1973 Phye.ReT.Lett j p . 937 Xrlykla A.D., Xg L.r., Wolfendale A.W. 197* J.Phye.A Math.
Xuel.Gen. 7, 2074 Frasar ff.R. at al 1972 Phya.RaT.p5, 1633 Tekitieli J.. Settar SB. 1973 Phya.Lett. 47B, 36 Tan X. 1973 Vhra.RaT.JB8, 1618 VblkoTB I.V.» Zataepin O.T., Xus'nitcheT L.A.1977
thia conferenoe MX 2 BoxKOia J.B., SaneniH r.T. 1965 Has.AH CCCP oep. $H3.,29,
1765

MWMH motor ooßMic RAT MOOR SPKCTSOM AT SKI LETXL AID
ranum COBMIC HADIATIOM BFKCTHOM L.T.Tolkova, gtTt^fffpla
Institute for Nuclear Research of the USSR Academy of Sciences, Moscow L.A.EUS'sicher
The Moscow State University
Cosmic ray noon spectrum at saa lerel is calculated for energy range 1-1CrGev* In the calculations the interaction cross-sections received in accelerator experiments are taken* For the lower part of energies the cross-sections hare not scaling behaviour* lor the higher part sealing takes place. The calculated spectrum is in good agreement with modern experimental one in all the considered energy range if we assume primary oosmic .radiation spectrum to have a oonstant index) 1= l.65±0.05 in its power law representation in all considered energies interval
1. Introduction. The sea-level spectrum of muohs has heen measured rather carefully in a wide Interval of energies* Therefore an attempt to determine with the help of it the spectrum of primary cosmic rays seems to be very tempting* In a number of works such an attempt has been undertakes (for example Srlykin 1974). In the work (Badhwar.1977) the authors have successed to describe experimental muon spectrum in the interval 1-10? Gov using a united picture of interactions between primary oosmic rays and air nuclei» In that work cross-sections for piona and kaons production in pp interactions obtained In accelerator experiments were taken* using these cross-sections we have calculated primary cosmic ray spectrum from sea level ituons spectrum and compared it with the spectrum of primary cosmic rays measured in (Webber, 1974, Grigoeov 1973). tit "iic''*onftf^«yff^""^^ protons and neutrons through the atmosphere can l>e described by the following equation
- the number of nucleons with energy X •? I-fit *•* * n e depth x in the atmosphere.

7
- the Interaction mean free path for
nucleons in air
- the probability that in interaction
of nuoleon with the energy E. nueleon with the energy £ ~ t+Ie *• created.
The solution of tills equation In the fora
gires the following fomula for <3„ (U *
We suppose the following spectrum of nucleons at the border of the atmosphere
^-1.65 " Å - const
I* X$) - const
P»M= AC'^ i * 1 ' ^ ,*-<«»£* ir-i/i^k A - the attenuation mean free path of nucleons in air
However according to experimental data
\$.\* X / ( 1 + 0.068Cj (t/SLo) ) (Qrigorov 197Ü)
If we take it into account we come to the following speetrum
if sh„ a 80 g/ca2 and A «110 g/cm2. Therefore the increase of cross-sections with energy leads to a nore steep spectrum of nucleons (analogous consideration was made in Grlgoror 1973).
3. Piona and kaons. The equation desribing piona passing through the atmosphere is the following one

The rifht part af the equation dearibea the decreasing of plena because of nuclear interaction and decay, increasing because of plans generation la. A W and Hü lnteractionsi X tr - energy, called critical (at thia energy the probability of decay is equal to the probability of nuclear interaction at the depth of one Interaction aean free path of plons); for rertical S e_ « 121 Gev.The others designations are analogous to the designations for nucleona' equation. The solution of thia equatiam \y «to aetfeod «aat fot- naalaons gives:
Quite analogous equation and solution we have for kaons (in thia case »e„= 897 GST). V , \ *.\
We consider that (E^Øbehava like A.«^
\ « «120 g/cn2; Xfc «150 g/ca2
Punctions W (££')/£ for piona, and kaons generation were taken In according to (Badhwar, 1977*, Collaboration 1974) whore they had been received on the base of accelerator's data*
4* Muona* Kinetic equation for nuons is
the first tern in the right part describes decay of nuons ( w:- auon's rest energy, %th,- life tiaa in its rest ays-tea, P(x) - density of air, *
B(E)«4MWJ. energy losses
\ K O = M Ü * K ( O E »here ^ and. fc. - weak func-una of energy. Cuffiv*) - generatif- -"—•"-tions of energy, (TMEX5*/ ~ S«a»ration function of anon*
The solution of this equation la

where t(e,x-0 = t fc# ( M * ^ * ^ V ^ M ^ ' O
— plon's rest energy tir,— lif« time of pion in its rest system.
In H.g.1 the experimental sea-lerel spectrum of auons and spectrum calculated in present work are brought. In the calculations Å was equal to 1.85»
58 *~'
/o ^ fO (&( tot /o3
£ &ev Fig.1. Sea lerel moons spectrum
Calculated spectrum ____«_—. primary spectrum I. 851T 2 ' 6 5
Grigorov, 1975 primary spectrum Experiment«! data ___ Mlfejtr }5}l, * hyi »Sli, &> MlMer 19%

10 It la Interesting t» say aome words on iailvar» on calculation» of muona apectrua of the following afreetax 1. Crose-aectlons of piona generation by ancleona baoauaa of tan U 1-Hl') don'* bara acaling behaviour. 2. Baganaratioa of ploma and kaoaa. I» fabla the ravla of anon epeetrum calculated with thaaa eff eete to that wlthomt the« is given. Table ? 3 *, «
Energy Oar 1 10 10 3 10* 10* 10* Xffeot
1 1,3 1.13 1.02 1 1 1 2 . 1 v 1.02 1,08 1.12 1.12 1.12
The decreasing of A« J-AJV,,**. taken In the present work doesn't influence on the calculation of noon spectrum.
In Fig.2 the primary cosmic ray spectrum we bare received fron the normalization of our calculations to experimentam muon spectrum la given together with experimental primary spectrum from (Webber 1974, Grigmror 1973).
/C
G-riqorob- &73
/O / tef te? /o* tf E6eir
Fig.2. Primary cosmic ray spectrum From our calculations
normalization on experimental muon sea level spectrum

II
aaauaed primary «pect
Experimental
GrigoroY 1973
• Webbar 197*
t« Conelualoitajt From Fig.1 it ia attan that our calcula-iona based on piona and kaono generation eroaa-saetlona from accalarator experiments describe rery «all experimental auon spectrum for tha whole measured interval ^ - 1 0 5 QVr^ For higher ener_l<is it is difficult to do any final oonclu-aions bacauae of poor experimental data but some experimental point« on auon spectrum in Tar*a region receired by photo-aaulaion aathod (Aalnyava 1975) aaaaa to agrao batter with primary spectrum recoired by aztrapolatlon fro« lower energies than with spectrum »assured (QrigoroY, 197?)*
References Allkofer O.G., Carstensen £.. Dau W.D.1971 Phya.latt.36B.425 Allkofer O.C.,JokiscL H. 1973 NuoT.Cia.15A. 371 Allkofer O.C.,Clausen K.,Dau V.D.1975 ti5t5.WuoY.Cim.13, 107 Ayre C.A. at al 1973 Proc.HH Int.Conf.CE_3, 1754 Badhwar J.D., Staphans S.A., Golden R.L.1977, Preprint Erlykin A.D. ,Hg L.E., Wolfendale A. 1974 J.Phys.A Math Nucl.
Gen.,_7, 2074 Hg L.E., Thompson M.G., Whalley, 1974fuov.Cia. 22, 328 Webber W.E., Lazniak J.A.1974 Astrophys.and Space Sei £0,361 AMHHeiia T.n. H ap.1975 HccneaoBaHHe MDOHOB CBepxBiicoKHx 3Hepr£.<t Hayica M. rparopoB H.JI., Panonop* K.J.» DlecionepoB B.fl. 1973 laciHim 6on max 3Heprntt B KOciMiecKHX jiy ax Hama. U. rpHropoB H.JI. H ap.1970 frø IT,814 flyöHa 1974 CorpyaHHvecTBo: Bybane DIT, ]>yxapec?,BapæaBa, flyÖHa-KpaaoB, MocKBa-Co$Hfl, TanmeHT, TöHflHCH-ynaH-EaTop, XaHofi. HunyjiBcrae H yraosue xapaK?epHc*HKH jjp B3awio-
fleKcTBHfl npH 40 TaB/c.

The Charge Ratio of Cosmic.Ray Muons
Y.Minorikawa1* and T.Saito 2 )
1) Faculty of Science, Kinki University, Higashi Osaka, 577 Japan 2) Cosmic Ray Laboratory, University of Tokyo, Tanashi, 188 Japan
Abstract The charge ratio(#Ac) of cosmic ray muons at sea levpl was calculated basically using the scaling hypothesis and the recent ISR experimental data on inclusive reactions p+p*i+X (l^p.n.TC*-,«1). Special attention is paid to the primary nucleus-air nucleus collisions. The observed scaling property and collective behavior in nucleus-nucleus collisions were taken Into consideration. It is found that for the M7i»-rat1o the Inclusion of nucleus-nucleus collisions results in a better agreement with experimental data in comparison with the values derived from the usual superposition models. The muon spectrum at sea level is also presented. 1. Introduction On the basis of the scaling hypothesis ^(S.H) the u7jur ratio of
cosmic ray muons at sea level near vertical has been calculated by many authors(2-8) using the data of firstly accelerator and later the ISR energies assuming the S.H. to be reached even at these energies. It has been shown that all the calculatedJUYjT ratios(l .37-1.56) are significantly higher than the observed mean value of 1.264(9). It may fairly be said at present that thejW/wratios are essentially constant independent of the muon energy, indicating the S.H. to be valid beyond the ISR energies. Thus *t become the most important problem to reveal the origin of the discrepancy between the theoretical values and the experimental ones. The so-called superposition medel in the primary nucleus-air nucleus collitions is discarded in the present calculation. The recent charge transfer distribution(10, 11) in hadron(h)-hadron(h) collisions showed that irrespective of the kind of projectile particles the quantum numbers(charge) were conserved in the target and projectile hemisphere in c.m.s respectively. It is natural to assume that the hadron can be replaced by the hadro-nic single matter and the projectile natter breaks up independent of the energy and the nature of the target matter, and vice versa. In other words, the projectile matter behaves according to the hypothesis of limiting fragmentation(equivalent to the S.H. in the forward region) for x> 0. Along this spirit we try to describe below the h-h, h-nucleus(A), A-A collision in terms of the known pp collision.
2. Part icle-Particle Collision
2.1. Pion-Proton Collision The features offt.+p-»te+ X reactions are. similar to that of p+p*(rc,p) + X reactions in the following points:

'3
l)<n > inxp collision is crwnparab1 •» with that 1n pp collisions. 2) The longitudinal momentum distributions cf pions in non-exotic inclu -sive reactions TL*+ P *7t?+ X is strongly affected by the presence of leading pions. 3) The growth of the invariant cross section for non-leading pion inu*p collisions near x=0 is similar to that in pp collisions. From these facts we can infer the Ttp collision to be the same as the pp collision. Moreover, it is appropriate to treat the leading pion and the produced pions in the non-exotic reactions separately as f„v(leading)=fPpand ^,t( produced)*^. In the exotic reaction 7C ± + p-?u.? + X we put fn*if= frit" • Here fju. is the normalized invariant cross section ( f^»*^ tJaa** ) in the inclusive reactions a + b-*c + X. d f
2.2. Hadron-Nucleus Collision
Multiparticle production in h-A collisions is similar to that in h-h collisions from the recent experimental results in h-A collision on 1) multiplicity ratio R^= <,infyfø,, 2) KNO scaling function, 3) dispersion D =C<i$>-<i(j>MIA- vs <n Ä> , 4) angular distribution of n in the forward region. There has been revealed further experimental facts: a) the mean number < N h > of heavy prongs are roughly independent of the incident energy, b) energetic protons are produced frequently. These facts suggest that in a h-A collisions U,.nucleons in A interact simultaneously with h and the remaining A-i^nucleons are left over as spectators. The V^nucleons which behave like a single hadronic matter may be called the effective target mass. The h-A collision so far has been treated as the h-h collision with the same projectile hadron energy Ei_ in Lab. system. Then the cm.energy squared s is given by s~2mE L(m is the nucleon mass). For the h-üjn collision s will be changed by s'->-2m(U,„EL.). Thus the h-lAjn collision with energy E L is replaced by h-h collision with energy li.Eu. Let E-it.be the energy of particle c for the inclusive reaction h + h -> c + X with energy E^, then the energy of c in h + U m * c + X js liEjt.. Consequently fhA{ x, p t K f h h ( x, p t) where x"=Eir/EL. x is equal to Feynman variable x for x»2mt/JT ( mt is the transverse mass).
2.3. Nucleus(Al)-Nucleus(A2) Collision
Experimental results(12,l3) on A, -A*, collisions which indicated collective behabiors not only in the projectile fragmentation region but also in the target fragmentation region suggest that the effective projectile mass »im ir. the projectile nucleus will interact with the effective target massltm. Therefore the h-A collision can be applied to the A, -A* collision. The A,-Urn pass through as spectators. The i-m -l/jn collision correspond to the i m -*im collision with incident energy (t*./u,)EL » where Ei_ is the energy per nucleon of A . Let E^ be the energy of particle c in t^m -I«,m collisions, then the energy of it in_U;m -l^m collision iscV^Eir . Hence we get f^ x, p f r) = f^( x, p t) . It remains a problem what U,m is. We take the plausible ansatz T> = A^* ( A is the

u «tonic mass number of the nucltMs). The notion of the projectile, target mass was proposed for the f irst time in Moscow Conf.(* 59). Recently a unified picture to grip with systematically the h-A, A-A collision In terms of a single hadron object was proposed by Berlad et al (14), Meng Ta-chung (15).
3. Method of Calculation of The Muon Charge Ratio «irt The Noon Spectrum
We can roughly assign 25 t of the primary nucleons to heavy nuclei, and replace them by an equivalent number of alpha(ot) particles. The differential energy fluxes of protons and dparticles at the top of the atmosphere can be written as p(E) - C, £-*»•*, a(E) • C* E"***w1th the same exponent T» 2 .7±0 .1 , where Cr» 1.46 and d a 0.122. p and d i s given by cmjsrt sec'.GeV*,' cm",* srV secV (GeV/nucleon)*,' respectively. For simplicity, the effective projectile mass number for particle is taken as 2 and the remaining p and n are regarded as spectators with energy Eü/nucleon of A . Then with the use of symmetry relations the diffusion equations and their solutions of protons Nj and neutrons NJ due to the primary J. particles and protons p and neutrons n due to the primary protons are given as follows: ^ - ^ $ « V W ^ * >
+ i f r NTWW- M/CVO r-r.] " -fX* (1) N*= -r M*= _ 4 i _ awft»» (e-*A«_ e"***; *«d KJ-«C--(2)
^ f =-J5 »* + kÜptä^n~+«>r&)^d-hr (3) P(.^)=i PCEJCC-^- -v e ^ v ; - ( 4 ) , *<=,« = i PC^e^-é^'*;-"©
, where fy,, are the interaction mean free path of particles and nucleons in air, respectively. dl(E,y) is the differential flux of primary «iparticles at energy E and atmospheric depth y g/cm1. 9*p. 9an.(E»E) are the rf-proton, neutron production functions, respectively. G*H= 2(l+2 r(Z r P+Zp, l)), A M = \0-Z P f-Zf»)"
1, A',=X«(l-Zrp + Zpn)" • F«(x) is the scaling function for the inclusive reaction a+b+c+X defined as p l c(») =J— ( " ° r , P>up> The fractional energy moment Z a tis defined as^ *l*«>' ^ » . f ^ f t . ^ ^ » - W O d * We can write a similar equation for the charged pion flux:
+ 7-Hp^(VO)^ + M?(^,«F^]^: (6)
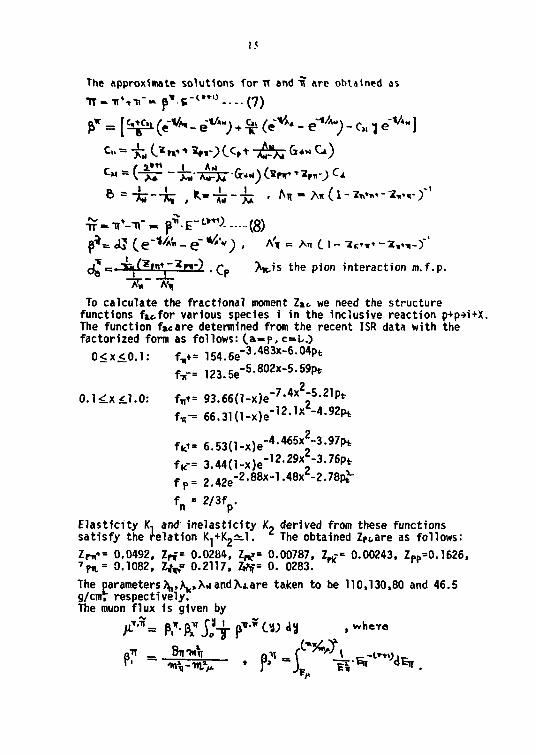
15
The approximate solutions for IT and "it arc obtained as
TT-TiVTr»p* .e - l , * , , - . - . ( 7 )
f = [&«a. ( e- - e ^ - ; • £ (e V A * - e * * - ; - c„ i e V A " ]
^-Tr^-n' -p^E-^i (8) p*= <£ ( e"^'" - e" */A'") • A', = AH c i - ^ K ' T ' -zv-,-3"'
J - - • " w ^ n - ) ^ ^ i s the pion interaction m.f.p. ~7T*~ A ' ,
To calculate the fractional moment Z» t we need the structure functions f»e.for various species i in the inclusive reaction p+p-»i+X. The function f»«are determined from the recent ISR data with the factorized form as follows: (>-P* c=*U)
0<x<0.1: V = 1 5 4 . 6 e "3 - 4 8 3 x - 6 - 0 4 P t
f,-= 123.5e- 5- 8 0 2 x- 5- 5 9P*
0.1<Lx£l.O: f„t= 93.66(l-x)e" 7- 4 x " 5- 2 1Pt
V = 6 6 . 3 1 ( l - x ) e - 1 2 - l x - 4 - 9 2 P *
fkt= e.ssd-xje- 4- 4 6 5^" 3- 9 7^ V - 3.44(1-x)e- 1 2- Z 9V 3- 7^
f P = 2 . 4 2 e "2 - 8 8 x - 1 - 4 8 x " 2- 7 8P*"
fn = 2 / 3 f
P-
Elast ic i ty K, and inelast ic i ty K» derived from these functions satisfy the relation K,+K 2riil. The obtained Zft,are as follows:
Z ,v= 0.0492, lri= 0.02Ö4, Z^= 0.00787, Z-r= 0.00243, ZP„=0.1626, 7
P n . = 0.1082, Z^= 0.2117, Z*r= 0. 0283.
The parameters \,\% Ad and A* are taken to be 110,130,80 and 46.5 g/cm, respectively. The muon f lux 1s given by

lb
Final results are
^ . * ; « F ^ ( ^ l u f r ^ K ^ - C . ^ ) - - - (9) and
^(^.«-Ffp^oUl*-^- 00) Similar expressions are obtained for the kaon fluxes. Finally we get for the P/p ratio and the muon spectrum
i • $:&:&':£,' •* KM)-)«™)***,*} —w —os
4. Results and Discussions It is useful to calculate the i*1"/*" ratio and the muon spectrum for other two cases i.e., superposition model (Case 1) (2,3,4) and semi-superposition model (Case 2) (16). Casel is obtained by putting C\= 0 and replacing Cp in eq.(9) and Cp in eq.(10) with respectively P.+ n» and p.- n,. Case 2 is obtained by the appropriate change of Cu and d| . The results for three cases including present case are as follows: Case 1:1.54, Case 2:1.59. Case 3(present case);!.30. This shows that even the same composition of primary heavy nucleus gives different results on the #7jrratio in terms of different nucleus-nucleus collision model. The muon energy spectrum for three cases are compared in Fig.1 with the curves derived from the spectrometer (17) and the range-energy relation (17,18).
References 1) R.P.Feynman, Phys. ReV. 23(1969), 1415. 2) W.R.Frazer et al., Phys. ReV. D5U972), 1653. 3) G.Yekutieli, Nucl. Phys. B47Q972), 621. 4) Z.Garraffo et al., Nucl. Phys.(1973), 419. 5) R.K.Adair, Phys. ReV. Lett.(1974), 115. 6) A.D.Erlykin et al., J.Phys. A7Q974), 2059. 7) H.J.Hoffman, Phys. ReV. D12(1975), 82. 8) M.G.Thompson and M.R.Walley, J.Phys. G3(1977),97. 9) M.G.Thompson, Cosmic Rays at Ground Level edited by
A.W.Wolfendale(1973) 10) P.Breitenlohner, Proc. 4th Int.Symp. on multiparticle
hydro dynamics, Pavia (1973), 282. 11) E.O.Abdrakhmanov et al., Nucl. Phys. B72(1974), 189. 12) A.M.Baldin et al., Yad.Fiz. 18(1973), 79.

I
13) A.M.Bald in e t a l . , Yad . r i z. ?0( 197<t) , 1701 . 14) G .Ber l ad e t a l . , P h y s . ReV. D 1 3 U 9 7 6 ) , 1 6 1 . 15) Meng Ta-chung, Phys. ReV. D1SC1977), 197. 16) A.Liland, Fortschritte der Physik 73(1975), S71. 17) E.V.Bugaev et al., Cosmic Muons and Neutrinos (Moscow
: Atomizd) ,(1970. 18) S.MiyaJce, 13-th Int. Cosmic Ray Conference VSU973)
, 3638.
10 <S
10
F1G.1
10
10
10
10"
•> o
~u o (/> Hl
R •E u
MUON ENERGY SPECTRUM
CA5E-3
12
13
11-
CASE I-2
R-E miyake
bugaev
10
MAG bugaev
10^—GEV-

18
K.. . ' ! . ' *i.-:c~.y: , .. r i . - . c . .•<<." 10 ; • . > „ .n.... , . . . . • • ' • ]
h . ' J I T : , o ;ir*j . ') , ü-j ,
I.u'Sor:'. lo r io Qi Co.'nro-OTof; r ; c . itl C .' . ' : . , ; o r i r o , . i j
>'ccul ty of Ihynicf., Univerfi *..>• cf » r ' ^ r f , Krv» mir,: i .:(r .
TJ!Oorctio.-a [x] ifcu-i-iracr.t.-a Q !>o:h [ H j ,
The or'i-J'tTy spoctruin a t d i f f e r en t zoi.i th ,:>!(;los and the enar^ r c t i o
of cosmic ray muonn .it eea l eve l ard a t mountain a l t i t u d e s urt- d»- I I
r ived , uning improved nucleon-nunleus urd nu cl euu-nucleus c o l l i s i o n j
mo&elis, und a l t e r n a t i v e assumptions coi;cei-nin£ cpectva and co.T.pori t ion |
of the p r imar i e s . In a comparison of the r e s u l t s v i t h the experiment :-J i I
da ta , poss ib le impl ica t ions r e l a t i n g to nodels of cosmic ray o r i g i n
are d i scussed .
j
i
Coordinates t I!N 2 .3
Mailing add^eps : Profeaeor K. Sitte,
Katthias-Grflneuald-Strassc 10,
7300 Freiburg i.Br.
F.R. Germany

19 THE ( \ n K"/-n- TV SCALING Mil VT CoS'MC KAY MIMN3
A. t.ilJM."
'üAHTL Prt?
Institute of Physich University of Trondheim, NLKT
• Rosenborg N - 70 00 Trondheim
Norway
Theoretical 0 Experimental (~ | Both D The Müller - Regge phenomenology predicts that scaling is approached as f = A + Bs s , where f is the Laurenz invariant roduction cross section and s the total cms energy squared.
We use a similar relation and fit this to acclerajor data in the region 10 GeV to 1500 GeV lab energy for r , »~,K , and K~ production from p - p collisions. We then ncrmalize to proton-Beryllium data at 24 GeV to account for nuclear effects and take Beryllium to be representative for the air nucleus.+Thus p;Be collisions give the production spectra of r , *• ,K and K at 24 GeV and p-p collisions+the energy+dep,endence of these spectra. We thus obtain that the » /»~ and K /K ratios are decreasing with increasing energy and approach+constante .values at high energies (scaling). This gives a A" Iv-~ ratio which agrees with measurements and has a minimum at about 100 GeV where the measured dip is.
Coordinates: MN 2.3. (Muon Spectra, Charge Ratio and Groups)
Mailing address: D r , A. Liland, Institute of Physics University of Trondheim.NLHT Rosenborg N - 7000 Trondheim Norway

20
the Vertical »uon Charge Batlo and the Homentu» Spegtrum
A.I. Lee and I.C.K. Young Department of Physics, Univereity of Hone long. Hong long.
Abstract
Using the scaling theory the vertical muon charge ratio and the differential muon spectrum for the energy range 250 GeV ^ En< 4,000 GeV have been calculated and compared with experimental values.
6g maß THE MOMENTUM SPECTRUM AND CHANCE RATIO OF MUONS TO 3 T*V/c
M C . Thompson. R. Thornley, M.R. Whalley and A.W. Uolfcndalc Department of Physic«, University of Durham, Durham, England.
The method of analysis of the final high momentum measurement» of the Durham spectrograph is described. Experimental measurements of the muon intensities to 3000 GeV/c are given, and new values of the muon charge ratio in the range 100 - 1000 GeV/c.
1. Introduction. Studies of secondary particle production at incident energies of 3000 GeV, and at ISR energies which are equivalent to laboratory energies of about 2000 GeV, have in recent years produced a considerable quantity cf data on the nature of the collision process at these high energies. These data are now available to the cosmic ray physicist and suggest strongly that the spectrum at sea level should now be used as a technique by which information on the primary spectrum can be obtained. Indeed this group, along with others, has interpreted the muon spectral data to 500 GeV in just this way. However, the direct measurement of the spectrum up to 5000 GeV is of very great importance because it takes the nuclear physics of the interaction processess out of the region in which they can be directly studied, and hence at these energies (1000-5000 GeV/c) from accurate measurements of the sea level spectrum information concerning both the primary spectrum and the nucleon-nucleon collision process can be obtained. The present measurement was undertaken with the aim of producing an accurate directly-measured spectrum up to about 5000 GeV which could be used as a basis for the studies just described. The data were collected using a multilayer solid iron magnetic spectrograph situated in Durham during the period 1973-1976.
2. The apparatus. The apparatus has been described extensively elsewhere (Ayre et al. 1972a, and b) and a diagram and brief description of the instrument are given elsewhere in these proceedings, - Hawkes, Thompson and Khrenov EA 126. The data were collected using the momentum selector in the apparatus and typically the efficiency of this devise rises from zero at py - 100 GeV to its limiting value of about 96Z at 400 - 500 GeV/c very approximately, the power of the instrument is contained within the expression p
u& = 400 GeV/c.cm. where p
u is the momentum of the penetrating particle in GeV/c and A is the linear transverse displacement of the particle in centimetres after traversing the instrument.
3. Method of data analysis. The momentum selector was designed so that events containing bursts emanating from one of the magnet blocks or shower particles incident on the top of the apparatus would not be rejected; indeed they would have a greater probability of triggering the spectugraph than would unaccompanied muons of the same momentum. Hence the data which had to be analysed had up to 5 useful trajectory defining points; a burst at a certain level in the spectrograph rendered the experimental data at that level relatively useless for accurate trajectory defination. Also if in a tray only two flash-tubes were discharged then that trav was not

22 used in the analytic. The analysed events can therefora be grouped •cording to the various configurations of level combinations of data that havi- been used in their analsi« There are clearly one S-tray fit, four possible 4-tray fits and ten possible 3-tray fit combinations. Due to th« symmetry of the apparatus these numbers of combinations are reduced; to .sssentially three different *-tray combinations and only four different ^ trr.y combinations. For each combination there are different scattering corrections and different m.d.m. corrections to be considered:
In the present work a trial spectrum has been adopted. The experimental data have been examined to ascertain the probability of a muon b«ing accompanied by a burst out of a magnet block pa. The conclusions are given in Figure )
500 Muon iMRMnkm (pi 6t*c
Figure 1. The probability of a burst or shower being recorded by the apparatus, compared with theoretical predictions of Said (1966) and Hansen (1975).
where the observations are compared with the theoretical calculation* of Said (1966) and Hansen (1975). The energy threshold for the burst particles is uncertain, hence it is considered that the agreement between the data and theory is satisfactory. ConsequentV for pg values from the theoretical curve of Hansen have been used, increased by 8Z of their value. For p5, a constant value of 1.33Z is considered. Taking a trial muon spectrum the anticipated 3, 4 and 5 tray-fit spectra have been calculated; overall (i.e. above 100 GeV/c)
2000
these correspond to 8%, 32% and 60Z of the trial spectrum respectively
The m.d.m. of the various combinations of tray fits has been found by a computer simulation of particles effecticely having infinite momentum. Effectively, a trajectory was constructed through the spectograph, allowance was made for the inefficiencies of the flash-tubes along the trajectory and for instrumental effects, and the apparent momentum of the particle computed using the normal analysis programmes. The distribution in inverse momentum so obtained is nearly but not exactly gaussian in form. From the standard deviation of the distribution the m.d.m. was obtained. The m.d.m. of the various combinations of trays is tabulated in Table 1.
The corrections to be applied to the experimental data have been estimated, considering the trial deflection spectra and the following tabulated m.d.m.'s for the various combinations of used trays. Similarly the scattering corrects have been estimated using the trial deflection spectra and considering the scattering to correspond to a gaussian of standard deviation 12Z for data considered which extended over 4 magnet blocks, the deviation being 17Z and 14Z for 2 and 3 magnet blocks respectively. The trial spectum did not have a constant exponent, but some idea of the magnitudes of the corrections can be

73
1 Tray* used
r. .. | D.d.a. Trays used a.d.a.
in analysis OV/c in analysis X-1 2660 1, 2 and 3 1
CeV/c
1, 2, 3, 4 and 5
OV/c in analysis X-1 2660 1, 2 and 3 1
1, 2. 3. and 4 ")
2, 3, 4 and 5 J
2. 3 and 4 •
i 3, 4 and 5.
550
1, 2. 4 and 5 2220 ; 1, 2 «nd O
• 1, 2, 3 and 5 \
1, 3, 4 and 5 J 2440 2, 3 and 5 's
1, 3 and 4 ,
2, 4 and 5 .'
1090
1, 3 and f i860
1, 2 and 5 1 V
1, 4 and 5 j 1720
Table 1. The m.d.n i. of the apparatus according to the conibinations of the trays used for data analysis.
obtained from Figure 2 which shows the correction factors as a function of the exponent, Y , of the muon spectrum.
The experimental data are summarised in Table 2. and the uncorrected spectra are shown in Figure 3
W f • • I i i i i I i i i i l i i i i
"55 JÖ T5 £ tt Sow ot the dilfmntiol imrantuni sptclium
Figure 2. The magnitudes of the corrections for the m.d.m. of the instrument, and for scattering in the instrument, as a function of the slope of the muon spectra.
"•' n" »» B* »WMfc
Figure 3. The uncorrected 3-tray fit and 5-tray fit differential momentum spectra. The errors are statistical.

24 Hoa, Haan Observed m.d.a. Scattering Corrected Hanga Mom. Mo. of «vents Correction Correction No. per C«V/c C«V/c GaV/c
100/147 122 5947 1.02 0.90 592 147/215 179 5864 0.99 0.99 169 215/316 261 3385 0.98 1.03 43.9 316/464 382 1613 0.99 1.05 11.9 5 tray 464/681 561 679 1.0C 1.07 3.13 fit 681/1000 - 824 270 1.05 1.08 0.774 data 1000/1470 1211 117 1.17 1.08 0.202 1470/2150 1785 36 1.45 1.09 0.0338 2150/3160 2621 25 2.10 1.10 0.0109
100/147 122 3044 1.01 0.40 302 147/215 179 2849 .99 0.99 82.3 215/316 261 1920 .97 1.02 25.2 316/464 382 1010 .97 1.04 7.65 4 tray 464/681 561 480 ..99 1.06 2.26 fit 681/1000 824 214 1.04 1.06 0.647 data 1000/1470 1211 94 1.14 1.07 0.167 1470/2150 1785 62 1.38 1.08 0.0614 2150/3160 2621 26 2.03 1.09 0.0122
100/147 122 549 0.99 0.93 53.7 147/215 179 534 0.96 0.97 16.1 215/316 261 388 0.95 1.01 5.33 316/464 382 211 0.94 1.03 1.66 3 tray 464/681 561 124 0.95 1,04 0.616 fit 681/1000 824 69 1.00 1.05 0.213 data 1000/1470 1211 45 1.10 1.05 0.085C 1470/2150 1785 27 1.45 1.05 0.0262 150/3166 2621 16 2.07 1.06 0.0074
Table 2. The experiment data and the correction factors for scattering and m.d.m. effects.
It is not possible at the present time to give the absolute intensities, although these will be determined shortly, hence, the data obtained by summation of the 3, 4 and 5 tray fit data have been normalised to the previous Durham measurement of Ayre et al. (1975) at 261 GeV/c, and are shown in Figure 4.
Figure 4. The corrected igui [fT differential momentum spectrum
compared with the previous MASS results of Ayre et al. (1975) and normalized at 261 GeV/c.
• i . M
oa-
wo-
J" • PrtMnt work o*nitalM7S)
I «r Muon nwntMum (p) fitV/e
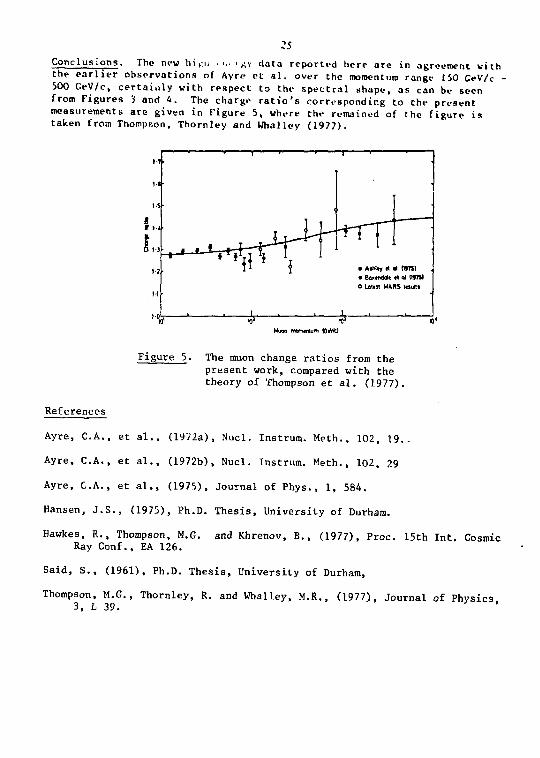
25 Conclusions. The new hi^n . ... i Ky data reported here are in agreement with the earlier observations of Ayre et al. over the momentum range ISO CeV/c -500 GeV/c, certainly with respect to the spectral shape, as can be seen from Figures 3 and 4. The charge ratio's corresponding to the present measurements are given in Figure 5, where the remained of the figure is taken from Thompson, Thornley and Whalley (1977).
11-& o,. J-J- »»lll fP \ a Ashtty it d tmS)
• Baxtndai« ft al CUTS) O Latin MARS mutts
-*-Muon mWTHntum (Gftti
Figure 5. The muon change ratios from the present work, compared with the theory of Thompson et al. (1977).
References
Ayre, CA., et al., (1972a), Nucl. Instrum. Meth., 102, 19..
Ayre, CA., et al., (1972b), Nucl. Instrum. Meth., 102, 29
Ayre, CA., et al., (1975), Journal of Phys., 1, 584.
Hansen, J.S., (1975), Ph.D. Thesis, University of Durham.
Hawkes, R., Thompson, M.G. and Khrenov, B., (1977), Proc. 15th Int. Cosmic Ray Conf., EA 126.
Said, S., (1961), Ph.D. Thesis, University of Durham,
Thompson, M.G., Thornley, R. and Whalley, M.R., (1977), Journal of Physics, 3, L 39. '

26
An Analysis of Momentum Spectrum of Muon H. Kotnori
Physics Laboratory, Tokyo University of Fisheries, 4-5-7 Konan, Minato-ku, Tokyo 108, Japan
A differential momentum spectrum of muon is assumed to have a form of a((p+b)c/mjjC ) dp, where a, b and y are parameter, and p represents a momentum of muon, m uc does a rest energy and c does a light velocity. From an analysis of MARS spectrograph ( Durham ), it is shown that three parameters arj as a = 764.18+0.11 ( particles /cm2 s str GeV/c ), b = 5.91±0.05 ( GeV/c ) and y = 3.137 ±0.035 for a momentum range of 21.3GeV/c ^ p ^ 442GeV/c. The value of x is obtained to be 0.0860. The standard error for each parameter does not contain any effects from propagation of errors of another terms.
1. Introduction. A number of muon spectra at sea level have been measured. A differential momentum spectrum of muon will be represented by a form of a((p+b)c/mllc )"Ydp under the simple and reasonable circumstnces, where reasonable circumstance comes from the shape of the energy spectrum of primary cosmic rays.
2 In the above expression, a,b and y are parameter, and p and m uc ; are a momentum and a rest energy of muon, respectively. It is ! necessary to estimate the standard error of y , to discuss a coincidence of value of y of various workers. The differential momentum spectrum of muon has been analyzed under the data processing method which has'been developed by the author (Komori, 1975). From the muon spectrum, we can estimate the differential energy spectrum of pions. 2. Method, Results and Discussion. A typical vertical spectrum at the present stage is, for instance, an observation of MAPS spectrograph of Durham (Ayre et al-, 1975). According to them, the muon momenta are determined from the curvature of |

:?
trajectories. Hayman and Wolfendalc (1962) have shown that the distribution function f(A) of apparent displacement A is given by
f(4) = const.( exp(- ^ j )+exp(- ^ ^ ^ j ) >.
where A t r, denotes the true displacement and o..t the standard deviation. From the extremum of f(A) for lower momenta, the value of standard deviation o sj is to be 5.21mm. l-'or higher momenta, some errors should be so taken for a given momentum as the apparent intensity may be higher than the true intensity by 44 percent at the maximum detectable momentum, from a result of llayman and Wolfendale (1962). These errors of moment.i are taken into account for an analysis of the differential momentum spectrum. If we take the form of a((p+b)c/muC2)dp as described in §1 for a differential momentum spectrum, we have the following value for three parameters, a, b and y after the data processing method ( Komori, 1975). That is,
a = 764.18+0.11 (particles/cm2 s str GeV/c), b = 5.91+0.05 (CeV/c)
and y = 3.137+0.035.
The standard error for each parameter does not contain any effects from propagation of errors o+ another terms. The observed, the expected and dx 2 values for each momentum are tabulated in Table ! 1. dx 2 is calculated by the formula dx 2 = (.lobs'^c-xp)2/^exp S',v~ en by Freund(1960), where lobs a n c' ^exp denote observed and expect- \
ed intensity, respectively. Thus, the value of x2i-s to be 0.0860. A comparison of the experimental and the theoretical intensities is illustrated in Fig. 1. In the figure, the solid curve represents the theoretical values and the broken curves do the upper and the lower limit of the 95 percent confidence region. The , upper and the lower limit of the ninety-five percent confidence j region are calculated by the standard error of the expected intensity multiplied by the factor tgs of t-distribution, where in this case tg5=2.018. Ninety-five percent of numbers of the true value I

:N
Tahle 1. Momentum spectrum. Intens i t y
No. Momentum Observed Expected Jr 1 442.0 2.764E-9* 3.207S6E-9 ~1.91229lf-2 • 2.764!-9 2 358.0 5.328E-9 6.15286E-9 1.7972413-2 means 3 274.0 1.260E-8 1.40140E-8
9.82928E-4 *' ° 4 1 U a 214.0 2.893E-8 2.98664E-8 9.82928E-4 *' ° 4 1 U
5 177.4 5.352E-8 5.35261E-8 3.04813E-5 6 145.0 9.603E-8 9.72931E-8 1.68S53E-4 7 128.0 1.454E-7 1.41S41E-7 7.43488E-4 8 112.0 2.037E-7 2.10965E-7 1.18584E-3 9 98.3 3.252E-7 3.10781E-7 2.1S270E-3
10 88.3 4.149E-7 4.26452E-7 7.33753E-4 11 80.0 5.753E-7 5.69502E-7 1.Ü3653E-4 12 73.7 7.084E-7 7.23164E-7 4.16799E-4 13 67.9 9.216E-7 9.16804E-7 2.73647E-5 14 63.0 1.123E-6 1.13722E-6 1.56430E-4 15 58.9 1.434E-6 1.37848E-6 1.62204E-3 16 55.2 1.646E-6 1.65758E-6 4.87714E-5 17 52.1 2.014E-6 1.95158E-6 1.02302E-3 18 49.3 2.217E-6 2.27915E-6 7.43555E-4 19 47.1 2.628E-6 2.58918E-6 2.24846E-4 20 44.8 2.962E-6 2.9756SE-6 2.10455E-5 21 42.8 3.420E-6 3.37592E-6 1.70485E-4 22 40.8 3.848E-6 3.8S035E-6 3.73860E-7 23 39.3 4.208E-6 4.26541E-6 1.81126E-4 24 367.0 4.843E-9 5.69900E-9 2.2S606E-2 25 236.0 2.171E-8 2.21464E-8 3.88357E-4 26 160.0 7.459E-8 7.22773E-8 1.02387E-3 27 118.0 1.842E-7 1.80552E-7 4.08344E-4 28 93.0 3.616E-7 3.66062E-7 1.48598E-4 29 76.6 6.585E-7 6.46397E-7 3.50561E-4 30 65.3 1.023E-6 1.02595E-6 8.24110E-6 31 57.0 1.525E-6 1.51332E-6 5.95538E-5 32 50.7 2.086E-6 2.10699E-6 9.92546E-5 33 45.8 2.797E-6 2.79887E-6 4.45098E-7 34 41.7 3.663E-6 3.62665E-6 1.00482E-4 35 38.3 4.547E-6 4.57538E-6 3.84756E-5 36 35.3 5.704E-6 5.70352E-6 6.96300E-9 37 33.1 6.947E-6 6.77443E-6 6.48904E-4 38 31.0 7.968E-6 8.05835E-6 1.25697E-4 39 29.3 9.130E-6 9.34270E-6 5.18321E-4 40 27.7 1.067E-5 1.08098E-5 1.67346E-4 41 26.3 1.224E-5 1.23530E-5 8.36634E-5 42 25.1 1.432E-5 1.39151E-5 8.46568E-4 43 24.1 1.574E-5 1.54218E-S 4.2S691E-4 44 23.1 1.708E-5 1.71513E-3 1.72781E-5 45 22.1 1.909E-5 1.91460E-5 8.54950E-6 46 21.3 2.096E-5 2.09675E-5 1.28386E-7
:«
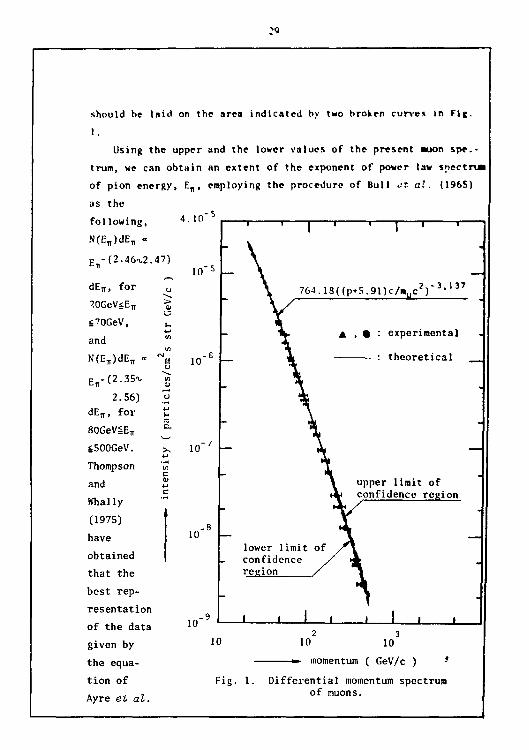
should be laid on the area indicated by two broken curves in Fig.
1.
Using the upper and the lower values of the present auon spe.-
trum, we can obtain an extent of the exponent of power taw snectru«
of pion energy, E„, employing the procedure of Bull et al. (1965)
as the
following,
N(E„)dE„ -
F -(2.46T.2 47)
dE„, for (J
?0GeViE„
GeV
/
4.10
10
£70GeV,
and
"(E^dE, «
E u-(2.35^
2.56)
dEff, for
ßOGeVSE*
sSOOGeV.
Thompson
and
Whally
(1975)
have
obtained
that the
best rep
resentation
of the data
given by
the equa
tion of
Ayre et dl.
10 —
10
10
10
764.18((p+5.9nc/»uc ) 3.137
experimental
theoretical
lower limit of confidence region
10
Fig. 1.
10 10
-•- momentum ( GeV/c )
Differential momentum spectrum of muons.
upper limit of confidence region

30
(1975) will be expressed by N(E )dE « E»-( 2- 6 3 7 t 0- 0 1 4^dnii > for JOGeViE.slOOGeV.
w n and
N(E„)dE„ . E^ 2 - 5 4 0*8:o*6 1dE l (, for 100GeViETj700GeV. where the effect of th<» K y 2 decay are also considered. They have concluded that the exponent of power law spectru« of pion energy decreases over the range of E , 30 \ 700GeV. However, if we consider the uncertainty of the exponent of the pion spectru«, we «ay not be able to say such a conclusion.
As a result, it should be noted that the data processing »ethod , for instance least square aethod, taking into account not only uncertainties of the ordinate but also uncertainties of the abscissa in Fig. 1 is necessary to analyze the experimental data.
3. Acknowledgements. The s'.ithor wishes to thank Prof. T.Kitaaura (Cosmic Ray Laboratory, University of Tokyo) for his valuable discussions. He is also indebted to Prof. A.W.Holfendale and Dr. M.G.Thompson (University of Durham.U.K.) for their discussions in his staying in Durham. The numerical calculations were perfora-ed by use of the TOSBAC 3400-21 of the Computation Centre, Tokyo University of Fisheries and by use of the TOSBAC 340Ü-M51 of the Computation Centre, Institute for Nuclear Study, University of Tokyo.
4. References. Ayre, C.A., J.M.Baxendale, C.J.Hume, B.C.Nandi, M.G.Thompson and
M.R.Whalley, Precise Measurement of the Vertical Muon Spectrum in the Range 20-500 GeV/c, J. Phya. G:Nualear Phys., 1, 584, 1975.
Bull, R.M., W.F.Nash and B.C.Rastin, The Momentum Spectrum and Charge Ratio of y-Mesons at Sea-Level II , Nuovo Cimento,XL At
365,1965. Freund, J.E., 'Elementary Statistics', Prentice-Hall Inc., 1960. Ha/man, P.J. and A.W.Wolfendale, The Momentum Spectrum-*of Cosmic
Ray Muons near Sea Level in the Momentum Range 5-1000 GeV/c, Proa. Phye. Soa., 80,710, 1962.

31
Koaori, H., An Application of Statistical Adjustment of Data to the Energetic Solar Cosaic Ray Increase jf August 7, 1972, Proe. 14th Int. Cotmia Ray Conferino*, 4, 1J56, 1975.
Thompson, N.G. and M.R.Nhalley, The Production Spectra of the Parents of Vertical Cosmic Ray Muons, J. Phy$. G : Huol. Phye., 1, MB, 1975.

MfZOQW ARRIVAL DIRECTION iCPENDLSCL OF KU)N CUKCL K\:'.K.
Y.Kaniya, S.Shibita Department of Physics, Sagoya University, Navjoya, Japan
and S.Iid«
Computation Center,Nagoya University, Nagoya, Japan
In order to study the geomagnetic influence on the charge ratio of cosraic ray muons observed at large zenith angles, the calculations of the notion of muons in the atmosphere have been carried out. The survival probabilities are computed as the function of momenta at sea level, zenith and azicuthal angles. The derived survival probabilities have been used together with a simplified model to give some qualitative estimations of the geomagnetic effects on the charge ratio in the case of che MUTRON spectrometer. It turns out that the geomagnetic effect on the charge ratio at sea level is still not negligible for muons of high momenta when the observations are made at large zenith angles or in east-west directions.
1. Introduction As several authors have pointed out, the geomagnetic influence on
spectra and charge ratio is important, especially in the case of large zenith angles or low momenta. The path length of a particle in the atmosphere depends on its charge because of the effect due to the geomagnetic field. In the eastern directions, the negative particle travels along the longer path length, thus its survival probability is depressed comparing with the positive particle along the shorter path length, and vice versa in the western directions. Therefore, the geomagnetic deflection of muons decreases the charge ratio in the eastern directions and increases it in the western directions. For comprehensive investigations of high energy inuons, the 'MUTRON1
(4) spectrometer has been constructed at Cosmic Ray Research Laboratory. The axis of this spectrometer is placed in the plane of 34* west from the local geomagnetic north, in the horizontal, so that the particles arriving from both directions (geomagnetic azimuthal angles 146°(S-E) and 326"(N-W)) are detected. Muons of momenta > 80 GeV/c arriving from the zenith angle range of 86°-90° are detected. The aim of this paper is to examine the influence of geomagnetic field on

J.I
the observation* of tlie NATRON. The caK'u!a!K"i h^v. > . * n rjjc of a charged particle in the atmosphere ualnu :'.c forsulati.m \.y (1)
Preliminary calculations (6) on it are refined tn this paper.
2. Motion of a charged particle in the atnospherc 2-1. Assumptions and equations The calculations are based on the formulation developed by 0!.. J', a» que tea
previously. Also, the calculations are limiteo to Tanashi (geoe.raphic longitude'139.8*E and geographic latitude 35.7'S) where the MIT ROS hai been placed. The following assumptions are taken into account: 1) As the geomagnetic field, the approximation as a E-.ag-.iet ic dipole is not used but the observed values at Tanashi are adopted. Horizontal component « 0.303 gauss, declination angle » 6.2CW and dip angle • 48.5°. The variation of dip angle along the earth's latitude is approximated as dö-räe=Kx where K-3.56x10 8rad/cm and d6, 68 and x are represented in Fig. 1. 2) The radius of curvature of the earth is 6368 Km and its surface is treated as spherical. 3) Muons lose their energies only by the processes of Couloirb scattering or collisions wich air and the rate of energy loss is calculated by Bethe-Eloch formula and reduced as
-dE/dx-[0.153xln{(E/mc2)2-l}+l.292)Mev/(ri/cn=) A) Air density p in the atmosphere depends only on the altitude, and the • variation of the scale height n is approximated as a linear function of the atmospheric depth d as follows
n=rio+Sd where r,o-8.3Km and ß=2-10_3Km/(g/cm::) . 5) All muon move with the light velocity. 6) Decay probability of muon depends on its energy. 2-2. Trajectory tracing The Runge-Kutta-Gill integration
method is employed in the present series of calculations. Trajectory of a-single positive muon having its
Fig. 1 Geometrical relation between geomagnetic field and zenith angle.

34 Initial conditions of ;:.v:..< in u:a Pg , renidl ... i'lc ^; jr.u aiiSEud.al i-:,;ic A ; ;*
traced backwards along the line of notion fron sea level to the »tau;(..T«. 5 Km is taken as a step length and in die interval vi each slep. the .-jj;r.etlc Held and the air density can be considered a* unifora. At die levels of 100 g/cm*, SO g/cm and 10 g/cm , the position and the direction of the partiel«, air density of the atmosphere, altitude, momentum and survival probability are derived. When the altitude takes negative value, the trajectory la regarded as a forbidden track and the calculation is stopped. The survival probabilities of positive and negative muons observed at sea
level from N-W and S-E directions are shown in Fig. 2.
N-W(A=326*) D«100gcnY2
S-E(A = U6- ) D-'IOOgcm"2
20 10* GaV/c MUON MOMENTUM AT SEA LEVEL MUON MOMENTUM AT SEA LEVEL
Fig. 2 Survival probabilities of muons arriving at the MUTRON
3. Geomagnetic correction factor for the charge ratio To find the charge ratio at production, the geomagnetic correction factor
for the charge ratio at sea level is derived . It is composed of three factors, representing the different energies at production, the survival probabilities and the decay probabilities of the pions (assumed to be the parent of the muon)for positive and negative charges respectively. Representing R-N(p )/N(u") with the subscripts s.l. and p. for sea level and production, we have

35
R..l.- Rp- <W" Y' (V /V ) , ( D^ / DTr->
D^-l/U+CE^/n^c) -(n/x) .cosC' ]
where Dfl is the decay probability for 'pions, S is the survival probability for unions and t and m^ are the life-tir.e and cass for pions respectively. r Is the exponent of the pion production spectrum assuned to 2.57 . r.' is the local zenith angle. «D-RS /R is defined as the ce°nagnecic correction factor. Using the survival probabilities calculated and tne n'oove equations, w's are plotted in Fig. 3 for the two directions, (S-W) and (S-E), of the MUTRON axis.
Z»89* D*100gcm"2
4 , Discussions As shown in Fig. 3, a significant
modification of the charge ratio by geomagnetic effect is expected for the observations by the KUTRON, especially for low momenta or large zenith angles. In N-W direction, the geomagnetic effect on the sea level charge ratio is increasing, on the other hand, it is decreasing in S-E direction. This effect is not negligible up to 100 GeV/c. A number of muon charge ratio
measurements at sea level have been carried out so far, and it is confirmed that the charge ratio is constant over the momentum range of 20 GeV/c - 1 TeV/c. In the experimental values of low momentum region, however, there have been several reports on the existence of dips or rises ( 1 ' ( - l l \ especially a
dip around 100 GeV/c. Those small variations are not compatible each other although their statistical accuracies are fairly good. One of the reasons seemed to. be attributed to the different orientations in zenith and azimuthal angles of those spectrometers
I0Z 103
MUON M O M E N T U M AT SEA LEVEL (G«V/c)
Fig. 3 Geomagnetic correction factors for the charge ratio in the case of the MUTRON.

36 Th« futura program»« of thee« calculators Is co give core precise
geomagnetic correction factors for spectrometers in order co refine the aumary ol thoa« useful experimental results.
5. Acknowledgement The authors are grateful to Professor S.Miyake, Professor T.Kitanura and
MUTRON group for their sincere encouragements. They also wish to thank Professor K.Nagachltu and cosmic ray group In Kagoya University for their useful discussions.
References (1) Maeda X.; J.Geophys.Res. ,.69,1725,(1964) (2) Allkofar O.C. et al ; Acta Physica,2_,689,(1969) (3) Bat «nan J. at al ; 13th Int.Conf .CR.Denver,Conference Paper,1816, (1973) (4) Hlgaahi S. et al ; 15th Int.Conf .CR.Sofia,Conference paper,MN2.2,MN2.3
and MN16 (5) Okuda H.; Proc.C.R.Lab.Nagoya Univ.,10,31.(1963).in Japanese (6) Kaalya Y. et al ; Proe.Asia Sympo.C.R.Hong Kong,(1976),in press (7) Rossi B.; High Energy Particles (8) Aahton F. «t al ;'Univ.of Durham Report,(1964) (9) Allkofer O.C et al ; Proc. Int. CR. Conf .High Energy CR. Modulation,
1*1170,26,(1976) (10) Flint R.V. at al ; 12th Int.Conf.C.R.Hobart,Conference Paper,1346,(1972) (11) Ayr« C.A. at «1 ; 12th Int.Conf .CR.Hobart,Conference Paper,1364, (1972)

37 PRELIMINARY RESULTS ON CHAROE-RATIO AMD SPECTRUM
MEASUREMENTS OF DEIS O.C. Allkofer*. 0. Bell»**, E. Bona*, V.D. Dau*, M. Jekisch*.
G. Kleake*, Y. Oren**, R.C. Uhr*, T. Yelvin**
*Inatltut für Kernphysik, University Kiel, Fed. Republic of Oermany
Departaent of Physics and Astronoay, Tel-Avlv-Unlverslty, »* Israel
The DEIS Magnetic spectroaeter is aeasuring horizontal sea level auon spectrua and charge ratio in the energy range 6-7000 GeV. Preliminary results are given.

38
TRI HORIZOHTAL MUON SPECTRUM AND CHARGE RATIO
UP TO 1 TEV
O.C. Allkofer, K. Caratenren, W.D. Dau, H. Jokiach, H.J. Heyer
Institut für Kernphysik, University of Kiel, Federal Republic "f Geraany
The spectrum and charge ratio of about one million muons in the zenith angle range 68° to 82° have been measured by a KIEL-DESY-collaboration at Hamburg. The best-fit of the data gives a pion-production-spectrum exponent jm 2.57 + 0.03« The comparison to recent theoretical calculations shows that the commonly used exponent 7» 2.75 is not compatible to our muon spectrum up to 1 TeV. The increasing charge ratio is in accordance with some calculations using recent accelerator data, 'normal' primary mass composition and charge exchange parameter of about 0.35 - 0.5.
1. Experiment. The muon spectrometer is described in detail by Carstensen (75,77). The most relevant figures are: The deflection power of the air-gap-magnet was 1.83 Tm, the trigger telescope consisted of 4 scintillation counters and was directed towards east under a zenith angle of 75°, the acceptance was Sil« 360 cmzsr. 14 wire mpark chambers with a resolution of 0.6 mm provided a mean 'mdm' of 750 GeV/c. To get a correct absolute intensity, a discrimination against air showers and noise triggers was performed by help of a time-of-flight measurement of the muons with a resolution fwhm * 2.5 nsec. 23000 muons with momenta >100 GeV/c have been recorded.
2. Data Handling. As the number of sparks determining a muon track varies because of inefficiencies between 4 and 14 most probable number • 12) an experimental deflection inverse momentum) error distribution was calculated from the errors of the parameters determined by each event-fit. This error distribution was the basis for the resolution correction of the measured Intensities. All the measured events were binned by zenith angles from 68° to 82° (bin size 2°) and by 30 momentum intervals. For each of the 7 zenith angle intervals a separate model spectrum with 4 parameters was fitted (least squares) to the scores of the 30 momentum bins. The spectra were at first folded with the acceptance and resolution distributions. The x 2-values for the fits are in the range from 20 to 30 for 26 degrees of freedom, i.e. the model fits give a good representation of the data.
f£m
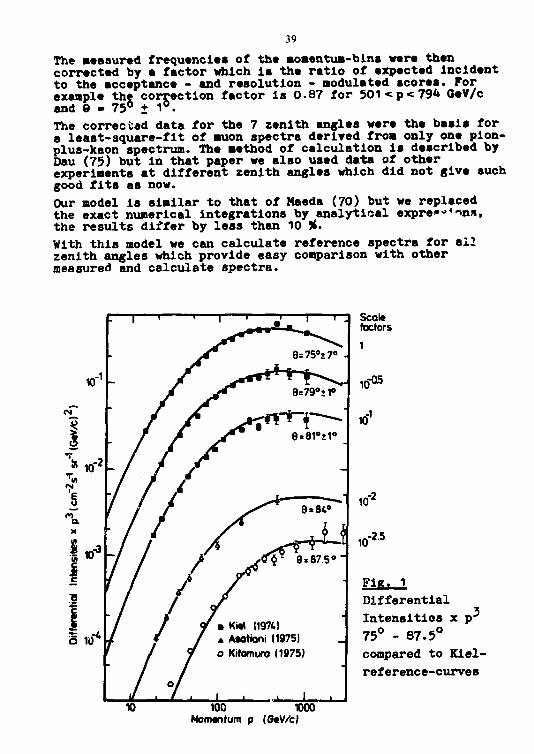
39 The «easured frequencies of the momentum-bins were then corrected by a factor which is the ratio of expected incident to the acceptance - and resolution - modulated scores. For example the correction factor is 0.87 for 501<p<79* OeV/c and 6 - 75° + 1°. The corrected data for the 7 zenith angles were the basis for a least-square-fit of muon spectra derived fro« only one pion-plus-kaon spectrum. The method of calculation is described by Dau (75) but in that paper we also used data of other experiments at different zenith angles which did not give such good fits as now. Our model is similar to that of Maeda (70) but we replaced the exact numerical integrations by analytical expre'-'ons, the results differ by less than 10 #. With this model we can calculate reference spectra for ail zenith angles which provide easy comparison with other measured and calculate spectra.
Seal« factors
e Kitl 11974) » Asatiani 11975) o Kitamuro (1975)
100 1000 Momentum p {GeV/c)
10
10
fQ5
10'
,-25 10
Fig» 1 Differential Intensities x p 75° - 87.5° compared to Kiel-reference-curves

•»0
3. Differential Intensities. Fig. 1 show» the data of this experiment /or 75° £ 7°, 75° + 1° and 81° ± 1° and the data of the other most recent experiments on Mount Aragat and at Tokyo. The curves are the Kiel-standard-spectra for the respective zenith angles. Note that the intensities are multiplied by p 3 and scaled down. The Kiel data for 750 + 70 a r e tabulated at Carstensen (75), more details at Carstensen (77). A comparison of our model with other experimental data can be found at Carstensen (75, 77) and Allkofer (76).
U. Production Spectrums Exponent . In our model calculations we used a fixed K^-/ 7 1 ~ r a t i o o f 0.09^5. A and f of the production spectrum AE ~V varied with energy to fit our data from 1 to 1000 GeV. But if we take fixed A and K , our data can fc3 well represented by J = 2.57 + 0.03 beyond 20 GeV as displayed in fig. 2.
?
20
8=75° 4
0 '^™P*X L j n - M ö i , V I 8C
0 '^™P*X J ^ D Q L I Ö Ö ¥$ - r - T W - ^ I ^ [ „, F \ y s 2 5 7
rroi
\
f -JO \ f \
1 \ a ^ i ^ ^ 7 = 2 . 7 3
lati
-«0 O Kwl 75"! V X
• V »
1
V . -
1 1 10 100
Momtntum (GtV/cl
1000
Fig. 2. Relative deviation from Kiel 75° -reference spectrum
An exponent r = 2.75 is neither compatible with our data (fig. 2) nor with the data of other high statistics experiments at Durham and San Diego (fig. 3).
Fig. 3 shows an apparent disagreement with respect to the spectral index of theoretical spectra (which were derived from a primary nucleon spectrum with f = 2.75) to our model-calculations which agree well with the experimental data in spectral slope. Concerning the absolute values there exist some differences:

Momentum IGtV/c I
Fig. 3. Relative deviation from Kiel reference spectrum at 0° If there exist no systematic effects and the Durham-data (Whalley 74-) are assumed to be correct, our 0°-standard derived from the 75°-data is too low. This effect was also seen by Kasha (75) comparing the Yale-BNL-data at 75° and 30° with calculations. *
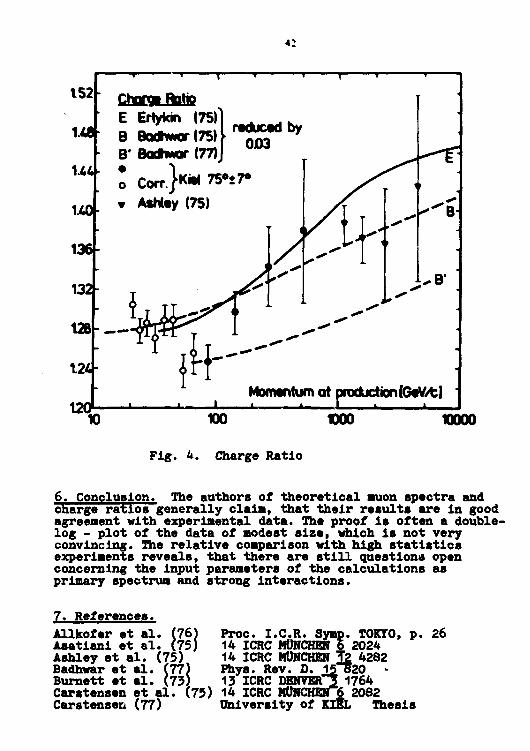
5. Charge Ratio. Fig. 4 displays the charge ratio K +/p as a function of the muon momentum at production. The open circles have been corrected upwards to take into account the geomagnetic effect. The correction is 16.3 % for the 21 GeV/c-point and 0.8 )t for the 66 GeV/c-point. The theoretical curves have been moved down by 0.03 (Erlykin 74) because they were calculated for vertically incident muons. The Kiel- and the Utah-data (Ashley 75) confirm the theoretical predictions of a rising charge ratio. In comparing absolute values it should be kept in mind, that the calculated charge ratios usually have an error larger than nearly all of the error bars at the data points in fig. 4. The error given by Badhwar (77) is the smallest: 0.03 - 0.05.So the curve B* in fig. 4 seems to be too low.
4 ;
1 5 2 " CtarqmRate E Erlykin (75)
1 4 8 B Bodh*or(75) • B* Badhwor (77)
U * i o CorrJK« 7S*l7» 1 X 0 _ v Ashlty (75)
136-
132-
128
1.24-
rtductjd by 0J03
1201
B
4^B*
Momentum at producti ion[G«V/tJ
10 100 two vooo Fig. 4. Charge Ratio
6. Conclusion. The authors of theoretical anion spectra and charge ratios generally claia, that their results are in good agreenent with experimental data. The proof is often a double-log - plot of the data of modest size, which is not very convincing. The relative comparison with high statistics experiments reveals, that there are still questions open concerning the input parameters of the calculations as primary spectrum and strong interactions.
7. References. Allkofer et al. (76) Proe. L C R . Symp. TOKYO, p. 26
L. (75) 14 ICRC MÜNCHEN 6 2024 Asatiani et al. Ashley et al. (75) Badhwar et al. (77)
L. (73) Burnett et al. Carstensen et al. Carstensen (77)
(75)
14 ICRC MÜNCHEN T2 4282 Fhys. Rev. D. 15~620 13 ICRC DENVER"3 1764 14 ICRC MÜNCHEfT6 2082 University of KIEL Thesis

4 J
Dau at »1. (75) Erlykin at «1. (74) Erlykin at al. (75) Kasha at ai. (75) Kitamura et al. (75) Maeda (73) Torsti (75) Whalley (74)
14 ICRC MÜNCHEN 6 1931 J. Phy». A7 2055* 14 ICRC MURCHEN 6 2003 14 ICRC MÜNCHEN 5 1868 14 ICRC MÜNCHEN 5 2031 Fortschr.d.Phys.Th, 113 Nuovo Ciaanto 25B 829 . DURHAM Theals

44 THE ENERGY SPECTRUM OP MUOltS WITH ENffiGIES ABOVE 3 TEV
T.F. Aminieva, L. KuEtnichev, M.A. Ivanova, K.V. Mandritskava, E.A. Oaipova, I.V. Rakobolakaye, K.V. Sokolekaya,
A.Yo. Varkovitekaya, G.T, Zataapin Inatitute of Nuclear Phyaica, Moscow State University;
Moscow 117234, USSR.
Theoretical Experimental Both X The global muon energy spectrum measured with the many-layer
X-ray emulsion chambers is presented. The total exposure ia 400 ton.year. The possible causes of the increase inthe muon spectrum exponent at muon energies above 7 TeV are discussed.
Coordinates:
Mailing address: Dr. I.V. Rakobolskaya, Institute of Nuclear Physics, Moscow State University; Moscow 117234, USSR.

4S
lat te
la r aaaaa a« tha Baalt»
Aa«la 14*
t«fc.åaa»te1« S.T.&laaadaa/aa, K.A.
UI .rr iaMaT t T»l.Fro»taiT t
K.K.fraaBMHi»a,A.A.flM11a»arfaa
Fbyaiea Xmti tuta, Axaaala, OSA
ffca «Mam Avagata apaotroøraph aoanrttai apaotmai aai aharga
i t te aaaaaraaaata raaalta l a anargf ragloa 10 • 2000 OaT/a ara

MOMENTUM AND ZENITHAL DEPENDENCE OF THE ENHANCEMENTS OF INTENSITIES OF COSMIC RAY MUONS
M. S. Abdel-Monem Physics Department, University of Petroleum and Minerals
Dhahran, Saudi Arabia
A. R. Osborne, J. R. Benbrook and w. R. Sheldon Physics Department, University of Houston
Houston, Texas 77004 (USA)
N. M. Duller, P. J. Green, L. M. Choate and C. E. Magnusson Physics Department, Texas A&M University
College Station, Texas 77843 (USA)
The absolute directional differential intensities of high-energy cosmic ray muons near sea level have been measured over the momentum range 2-700 GeV/c in the vertical direction and zenithal interval 55°-90*. The measurements were made with the AMH magnetic spectrometer-telescope. The enhancements Kss'l/KO*) and 1(80° )/I(0°) of the muon intensities as a function of momentum are presented and compared with the theoretical results of Maeda and Asbury et al.
1. INTRODUCTION
Muon spectra measured by magnetic spectrometers have been used to study a number of problems. Spectrometers which can be rotated have the advantage of being able to measure the enhancement I( 6 )/I(0°) directly, and thus to circumvent problems which may arise due to instrumental bias or to normalization procedures. Consequently, the comparison of directly measured enhancements permits a more straightforward comparison of various sea level spectrometer experiments, and when compared to appropriate underground measurements, results which are independent of the muon range-energy relation are obtained. The experimental data presented here have been obtained with the AMH solid iron magnetic spectrometer (Cantrell et al. 1973).
2. EXPERIMENTAL DATA AND DISCUSSION
The absolute directional differential intensities of high energy cosmic ray muons near sea level have been measured over the momentum range 2-700 GeV/c in the vertical direction and at zenith angles 65° and 80°. The enhancements at zenith angles 8 = 65° and 80° are listed in Table (1) and shown in Figs. (1) and (2) respectively as a function of the muon momentum.
The measured enhancements at 8 = 83° of Allkofer et al. (1973) are included in Fig. (2). The calculated enhancements of Maeda (1970) (muons produced by pions only) and Asbury et al. (1970) (muons produced by 80% pions + 20% kaons) are also included in Figs. (1) and (2) for 6 = 65° and 80° respectively. The calculated enhancements K 6 )/I(0) are shown in Fig. (3) as a function of the zenith angle 6 for different muon momenta (Maeda, 1970). The measured enhancements for zenith angles 65° and 80° of the present work are also included in Fig. (3). It can be seen from Figs. (1) and (2) that

47
ln« measured enhancement of the pr—tnt work is unity at 21 GeV/e for IS* and at 100 G«V/c for 10*. Pig. (1) shows that up to 25 GeV/e the measured enhancement! at 0 * «S* ara in good agraamant with th« theoretical prediction« of Maeda QtTO). However, for momenta greater than 40 OeV/c the measured values are higher than those calculated by both Maeda (1970) and Asbury et al. 0*70). On the other hand Pig. (2) shows that the measured enhancements of th« present work at 6 * 10* are In excellent agreement with the predicted values of Maeda (1970) 000% piona). A comparison with the measured enhancement at 6 * 13* of Allkofer et al. (1173) shows that the enhancements of the present work i t 0 > 80* are larger than those 6 =• 83* for momenta less than 100 GeV/c which is an expected result (see Maeda, (1970).
It should be noted that the enhancements K 6 )/l(0) of Pig. (3) are decreasing for increasing 0 for muon momenta below 25 GeV/c. However, above 25 GeV/c, the enhancements have maximum values. The zenith angle corresponding to the maximum enhancement is getting larger by increasing the muon momenta. The measured enhancements at 6 = 65* and 80* are in agreement with the calculated values of Maeda (1970).'
TABLE (1)
THE MEASURED ENHANCEMENT AS A FUNCTION OF MOMENTUM FOR ZENITH ANGLES 65° and 80*.
MUON I(65°)/I(0*) I(80°)/I(0°) MOMENTUM GeV/c
1.6 0.240 ± 0.004 0.054 ± 0.002 4 0.325 ± 0.006 0.082 ± 0.003 7 0.424 ± 0.015 0.122 ± 0.007 10 0.502 ± 0.012 0.172 ± 0.008 15 0.632 ± 0.025 0.252 ± 0.016 25 0.971 ± 0.094 0.450 ± 0.057 40 1.330 ± 0.116 0.638 ± 0.083 70 1.661 ± 0.422 0.812 ± 0.258 110 1.996 ± 0.334 1.054 ±0 .256
REFERENCES
O. D. Allkofer, K. Carstensen, and W. D. Dau, Proc. of the 13th International Conference on Cosmic Rays, (Denver) 3,1748 (1973).
J. G. Asbury, W. A. Cooper, L. Voyvodic, R. J. Walker, and T. P. Wangler, Nuovo Cimento, 66B, 169 (1970).
W. G. Cantrell, N. M. Duller, P. J. Green, J. R. Benbrook, A. R. Osborne, and W. R. Sheldon, Proc. of the 13th International Conference on Cosmic Rays, (Denver) 4, 2968 (1973).
K. Maeda, Proe. of the 16th Interam. Sem. on Cosmic Rays at Lapaz 4, 847 (1970).

48
• ^
Mao') Hu')
•
» ' * • *•*• ' • -* . V »
M H »J« t i ' * f I i-O. \ . * - - . '
— - * U * - I , •« (1 L I ' l j
I W \ r v . *NJ %*•*»»!
' /
I />"'
1 V
1
f/
10 100
MUON MOMENT UM (G«VA)
rig.(1) The enhancement at 6=65° as a function of the muon momentum.
• Th« prestnt work
0 Amol.r | I oJ.t?iS75)(l(61)/l(01)
Moxin 11970)1100% pconi)
»itury u S l H970|(807.p.oni . ; o % kaoi» )
i 10 100 MUON. MOMENTUM (Gav/c)
Fig.(2) The enhancement at 9=80° as a function of the muon momentum.

49 •
25 r
ZENITH ANGLE (DEGREES) Fig.(3) The enhancement at different muon
momenta as a function of zenith angle. Maeda (1970)
• for 10 GeV/c • for 20 GeV/c o for 50 GeV/c • for 100 GeV/c
(100 % pions) ) ) The present work

50

Sl
MHASURrMENT OK MUON SPFCTRUM AND UlARia CAT!"
IN THh RANGE P • 10(1 ^ 1 0 . 0 0 0 C I V / i M
S. H l g a s h i X \ K. Honda , S. l i d « , Y. Kamly. i* . V. K j w a i h l i a " t) fl) ")
T. Kitamura, K. Kobayakowa , S. Mikanio , Y. Minorikavu , K. H i n u l ,
S . M i y a k e , Y. M u r a k i , I . N a k a m u r a . Y. O h . i s h l , A. Oka. ld ,
S . O z a k l * ' , H. S h i b a t a + ) , T . T a k a h n s h l , and Y. l n . i r , . t o *
Cosmic Ray L a b o r a t o r y , U n i v e r s i t y of T o k y o , T a n a s h i , Tokvo 188
x) D e p a r t m e n t of P h y s i c s , Osaka C i i y U n i v e r s i t y , Osaka *) D e p a r t m e n t of P h y s i c s , Nagoya U n i v e r s i t y , Nafeoya +) D e p a r t m e n t of P h y s i c s , Okayama U n i v e r s i t y , Ok^yama If) D e p a r t m e n t of P h y s i c s , Kobe U n i v e r s i t y , Kobe ° ) D e p a r t m e n t of P h y s i c s , K i n k i U n i v e r s i t y , H l g a s h i Osaka v) D e p a r t m e n t of P h y s i c s , Kofu U n i v e r s i t y , Kofu @) H i g h - E n e r g y L a b o r a t o r y , T s u k u b a - O h o c h o , I b a r a g i
The exper imenta l r e s u l t s of Mutron on the h o r i z o n t a l
muon spectrum in the momentum range 100 - 10000 GeV/c
a r e r e p o r t e d .
1. Introduction Following the preliminary measurement of the muon spectrum by a quater
part of the Mutron apparatus ( we call this one-magnet run ), an operation of the full scale spectrometer was started at the end of January this year. About 50,000 muon candidates with momenta*.60 GeV/c coming from near horizontal direction were collected. Our installation is expected to have the highest mdm, though until now data analysis is not enough to discuss about it. Here we report preliminary results of experiment on muon spectrum using a part of data obtained so far. 2. Experimental Set Up
As shown in Fig. 1, Mutron consists of two magnet-spectrometers and a calorimeter which is located between two magnets. Each outside of these magnets, there are two trays of trigger counter,and two spectrometers are put into operation as a whole. Characteristics of the callorimeter and the trigger counters are described elswhere in this volume . The spectrometer is divided into two parts, upper arm and lower one. To measure a muon trajectory eight trays of wire spark chamber with magneto-strictive read-out are set in each arm. One tray of spark chamber consists of two modules ( east and west ) and each module has two gaps. The total number of spark gaps is 64.

52 The acceptance of th« lower spectrometer versus muon memantum la »hovn ln Flg. 2. Th« total »olid angle of our apparatus la 600 cm »r.
There arc aany factors which Influence the value of »dm of the apoctremoter. First of all an accuracy of the alignment of the track detectors la essential. Spark chambers are set up as carefully as possible by optical equipment«. But the optical «ethod for alignment Is not good enough to obtain sufficient accuracy. In the previous one-magnet run we examined alignment of track detectors and adjusted zero-point of fiducial signals by use of space muon which pass through the track detectors but not dense materials like Iron block. In the full scale running track detectors are set up so as to get large Sft for effective muons and flux of space muon Is too small to be used. Therefore we must use muon particles passing through the whole apparatus, though they are suffered from the effects of multiple Coulomb scattering in the Iron, especially for low energy muons. In the following data analysis we neglect the multiple scattering and assume a muon trajectory in the magnet is paraboloid.
3. Data Reduction Row data of all triggered events are once accumulated in magnetic tapes
through mini-computer. About 75 % of raw data are muon candidates. For data analysis we select this time only events in which every eight tray of spark chambers give at least one signal. This makes us possible to compare two momenta of a muon measured by two magnets independently. If true tracks are selected correctly, two momenta should coincide within the experimental errors.
Extra signals because of associating particles like as knock-on electrons or spurious sparks and lack of true signals because of dead space or inefficiency of the track detector itself sometimes disturb selection of genuine events and true signals. For a muon track extrapolated lines from particle tracks before and behind a magnet should coincide at the center of the magnet within the error expected by multiple scattering. In the one-magnet run muon events were selected under the condition that the difference AX was less than 3 a . And if there were signals more than one satisfying the above condition, the signal with smaller AX was chosen as a muon track. In the full scale running ambiguity to select true signals and to determine exact track positions is considered to be larger compared to the case of the previous run. So we add to -he above condition one more selection rule,i.e., for four trays between two magnets a summation of square of differences of track coordinates from a best fit straight line should be less than ( 100 mm ).

4. Remit« and Discussion»
Out of 13,000 raw data, 426 «vent* are ascertained to be (It (or
the above conditions. In Fig.3 distribution of the track coordinate«
froa the particle trajectory determined by least aquare method (or auons
passing through tvo magnets Is presented. It turns out from Fig. 3 that
accuracy of track detector alignment Is good asM).S mm. (Here we plotted
only the dlsitrlbutlon of the west upper chambers. )
In Fig. 4 we compare two momenta of muons measured by two magnets.
MDM of each spectrometer is considered to be ^1 TeV/c. ( Here we Included
events,without the straight line restriction In the central part. )
Lastly we show a differential anion spectrum .'n Fig. 5. In this figure
momentum of each particle is determined by two magnets. Slope of the
curve i3 2.8 in the energy region 300- 2000 GeV/c.
At the present state accuracy of detector alignment and resolution of the
apparatus are slightly worse compared with that of previous run. It is
because of multiple Coulomb scattering effects ( 2.5 mm ). Data taking
is now continuing and as data is accumulated much more, we will be able to
select higher events, which will improve the characteristics of our
spectrometer. Acknowledgements
The authors acknowldge to Prof. O.C. Allkofer for his useful comments
in his brief stay in our laboratory and thanks also due to Mr. Aoki
for his various assistance. Data analysis has been done using the
computer of the Institute for Nuclear Study.
References
1) Mutron group; Proc. 14th C.R.Conference ,vo!.6 (1975),2031. ( final result: soon be published )
2) Mutron group; this conference paper MN16 and 20. For the efficiency of each counter, see 14th conference papers, vol 9^3301,3339,3353.
Fig. 4 Comparison of the
momenta for a muon
measured by north
and south magnets
* indef-adently. [ the
spectrum of Fig.5
is obtained by as
a whole combining the
magnets ]
-3-
Ps — -r- -*~ 5-W.I
1*3 . . . ! . . . i-'-•
GeV/c — -
. • : : i • '
• • • • i ' -
! p
5-W.I •' ! ,,.
1000 ' M r • ,...|... ' 1000 rr ; h> - - /I "• 1 ' :'' ' -. ' rr ; - -
,. .. r : • • • • ;!
1 -^ " • ; ; • ' • • = ' : ' l '*'• i *' A
• Ä _ : ~ , ' ' ' ' . ' /-." •-. .'« i !
.... :.' » 1 t'i, **.w if • . ; ' ! . : :::•: : . ; H : : - :
;'•'•' :::::..;. >'::: ' '•v.'}.
'f:i . : = ; : . r. . ' -.' • • . ' • *.* •;• h *•!. .:.... . • : : : > • • :T •\:p •••: 3 - i ' y... . v & $
p.* .". :,::::.". :••'••
* : •
..." ^ • / • " • s å'!? ^ i:'-• \ : > • i " : r . •::•:• ^ ':- ::-: • :.
100 ::::
"1 ?im :f:i
• ; •
/:: '.".'. '.'.'.','" w * , - • - , '~ !'. ::::
"1 i If' T;|JJä ' | i ' [*•- ' i f l rnVTV'*' J" • • » r.;
: 11 WL *J. u » i t 'ill it-- '•• i r ! J f . 11 • 1 * | ! i [\\\ !L!! ih! :;!! !=•:!;: • : 11 £= i -ir :::: J?.f-J? ::• H • J : r. ;: iä =%f] S ; .: - : : L± :::; M iui ^jlijj £ J l 1 M t i i MM
100 1000 GeV/c P n
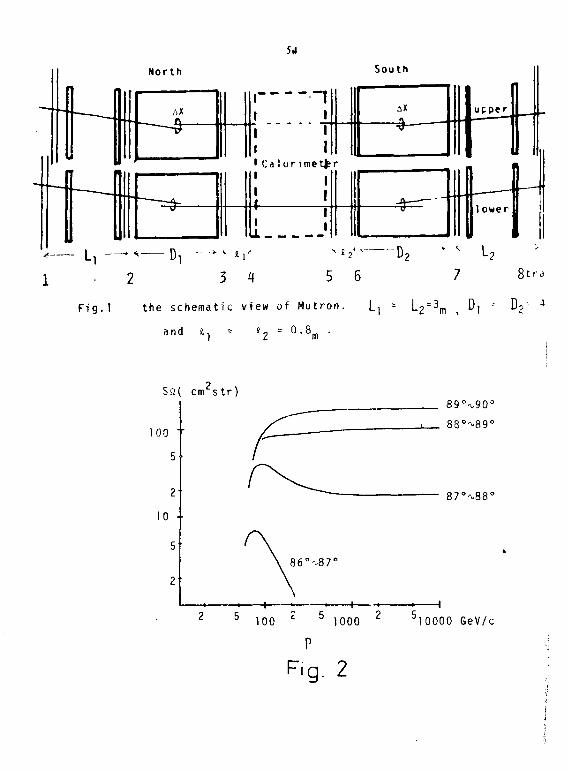
5.1
- ' K l ^
1 - 2 3 4 Fig. T the schematic view of Mutron. L^ = L2 = 3
m ( D] = Dj 4
and £, 1 2 m
Sfl( c n T s t r )
100 • '
5
2
10 +
2
8 6 - ^ 8 7 '
_ . H i h
89°<\,90°
88°^89°
87°'v880
-• 1 2 5 100 2 5 1000 Z 510000 GeV/c
Fin. 2

FIG. 3 TRAY 1
TRAY 2
TRAY
TRAY 4
-3-2-10 1 2 3 MM -3-2-1 0 1 2 3MM
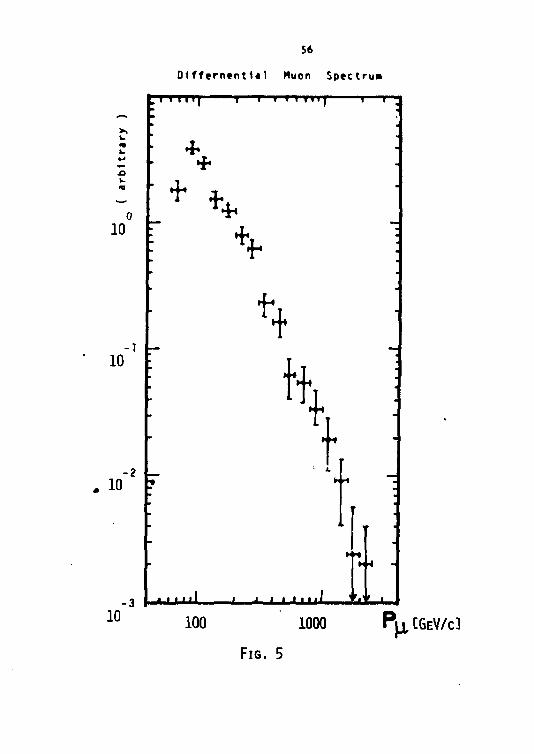
56 01 ffernenti«) Nuon Spectrui
M 11"
i.
1 0 •
10
•2 — . 10 ?
10 P|j, CGEV/C]

s?
THE COSMIC RAY MUCH INTENSITIES NEAR HORIZONTAL DIRECTION: MEASlR[*KT BY THE MOMENTUM SELECTION SYSTEM OF MATRON SPECTROMETER
S.Higashi? K.HondaJ Y.Kamlyat Y.Kawashimi' T.KiUnura. S . l ld«? K.Kobayakawa? S.M1kaho? Y.MIporlkaw»? K.Mitsui, S.MIyake. Y.Muraki, I.Nakanura, Y.OhasM, A.Okadi, S.Ozaki? H.SMbata* T.Takahashl? and Y.Teramoto*
Cosmic Ray Laboratory, Univers i ty o f Tokyo, Tanashl, Tokyo 188, Japan x) Department o f Phys ics , Osaka City Univers i ty , Osaka *) Department of Phys ics , Nagoya Univers i ty , Nagoya #) Department of Phys ics , Kobe Univers i ty , Kobe 9) High Energy Laboratory, Tsukuba-Taihocho, Ibaragl X) Department o f Phys ics , Kinki Univers i ty , Higashl Osaka Ä) Department o f Phys ics , Okayaim Univers i ty , Okayaira $) Department o f Physics , Yaimnashi Univers i ty , Yairanashi
We have measured the cosmic ray nuon i n t e n s i t i e s over the momentum r a n g e i 8 0 GeV/c a t sea l e v e l , using the momentum s e l e c t i o n system o f MUTRON spectrometer cons i s ted of high e f f i c i ency d e t e c t o r s . The muon i n t e n s i t y was measured in the zenith angle interval o f 8 6 ° - 9 0 ° . The measured absolute muon i n t e n s i t y was in good agreement with the value derived from the f oduction spectra o f cosmic ray muons. given by Dau e t a l . . However the s lope of the momentum spectrum i s s t eeper than the spectrum of Dau e t a l .
INTRODUCTION We had constructed the momentum s e l e c t i o n t r i g g e r system (MSTS) of the
MUTRON cosmic ray muon spectrometer. The MUYRON i s cons i s ted of the two s o l i d iron magnets and de tec tors and they d e t e c t the muons arrived from the near horizontal d i r e c t i o n s (zen i th angle range 8 6 * - 9 0 ° ) . The MSTS which i s c o n s i s ted o f the nul t iwire proportional chambers(MVJPC), that are high e f f i c i e n c y , s e l e c t s the only high momentum muons and t h i s method i s able to reduce the trigger rate without the loss of the Interesting events. The position s ignals of the MWPC system are also recorded In the paper tape and are used for the off-line track reconstruction analysis. The intensity of the muon measured in MSTS i s consistent with the value derived from the production spectra of cosmic ray muons given by Dau et al (1) . However the measured muon momentum spectrum has steeper slope than the reference (1 ) .
METHOD and OBSERVATIONS The MUTRON (2) i s consisted of two magnets and four systems: 1) momen
tum selection trigger system (MSTS), 2) wire spark chamber(WSC) track detector system, 3) calorineter system, 4) pairmeter system (see f i g . l ) . The MSTS i s consisted of twenty MWPCs. The readout electronics block diagram is shown in the f ig .2 . One MWPC has 224 anode wires (6 mm spacing) and the effective area i s 134cm X 230cm. The adjacent wires are e lectrical ly connected on the printed board, therefore the space resolution of the MWPC is 1.2cm, but time resolution Is better than 1.2cm wire spacing chamber.
For the each two wires amplifier, discriminator, fast buffer, delay and memory are associated and they form one channel. One MWPC has 112 channels and the whole MSTS has 2240 channels. A pair of MWPC are aliged side by side to form a layer and the MSTS has 10 layers. The each channel provides both the fast signal and the slow signal. The fast signals are the discriminator-

58
I J IL .-J
F ig . 1. The side view of MUTRON. ThicKlines show the MWTC for MSTS and th in l ines show the WSC. The numbers show the layer numbers.
out signals and they are analysed in the gales MATRIX c i r c u i t to generate the t r i gger signal candidates. In the MATRIX c i r c u i t the fast signals are reconstructed atid the track de f lec t ion in the nugnets is determind and i f the de f l ec t i on is srral ler than the preset value-this means the momentum of the muon is larger than the preset value ( about 90 GeV/c) - the t r i gge r candidate signal i s generated . The fast signals from the adjacent channels are added and form a reduced fas t signals and the number of the reduced fas t s ignals come from one MWPC simultaneously ( t ime resolut ion is bet ter than 500 nsec) is determined by the pa r t i c l e number analysis c i r c u i t and i f the number i s larger than the preset value-we set four and f i ve i n these runs-the ant i signal (we c a l l i t the pa r t i c l e number ant i s ignal) is generated. The p a r t i c l e number ant i re jec ts the a i r shower background i n the t r i g g e r candidates wi thout the e f f i c i e n t loss o f hor izontal muons. The t r i gge r candidate, a f t e r the se lec t ion o f p a r t i c l e number condit i o n , is become a t r i gge r and t h i s t r i gge r signal i s provided to a l l the MUTRON systems. The layers9 and 10 i n the f i g . l are not used for the t r i gge r purpose. In the MSTS the t r i g g e r signal al lows to preset the slow signals to the memories and they are recorded in the paper tape.
The events were gathered by two runs o f d i f f e r e n t condi t ions. In the f i r s t run o f about 24 days, only the lower layer : were working and the p a r t i c le number ant i preset valut. is fou r . In the second run o f about 25 days, both the lower and upper layers were working, but analysis was confined only in the lower layers and p a r t i c l e number an t i preset value was f i v e .
anode wires MWPC with 224 wires
20 MWPCs
particle number analysis
=3—""AMP. ^DIS.I ' « L , 1 - ! fasl signal
112 ch. lor one MWPC
particle number anli
momentum selection gale MATRIX
I trigger cand
slow signal
S©-
E preset
»trigger
F ig . 2. The block diagram o f the MSTS. The whole MSTS has 20 MWPCs. This f igure shows only one channel e l ec t r on i cs .

1 [ T
1 1)•<•! S J l " [ I' -
.'AAn MS and RISI« 7S We analysed the MS TS pos i t ion signals n \ i ' i ' i ; rJ in \ 'u- j.-.pei
•malysis wis l imi ted to the data acquired in the K.i.cr l . t > r i \ , the lower layers three layers arr' set up in the cwie v i l e i-f tin therefore the analysis of the events was very i l e a r . tin- uipi-i i tors were used only for the t r i gge r purpose.
f i r s t we select muons from a l l the ever ts . The i M U - r i a ut f a j \ .ire JS fol lowed. 1) A l l the s ix layers of the 'ower '-T„'PCs have si - jnals. 2) The si i j ' ia ls of the three layers in the one side of the nugnets ali>jn on .t s t i -M-ijht l ine w i th in the detector space resolut ion and we ca l l th is l ine a t r a i l . 3) The distance between the tracks of the both sides of the »n<jnets of the ve r t i ca l centra l plane of the magnets is smsller than 16c(n-this l im i t is determined from the MJPC's space reso lu t ion . 4) I f unny candidates that sa t i s f y the condit ions l ) - 3 ) , the combination of tracks that have the least distance on the centra l plane of the magnets is i den t i f i ed to be a muon track
Second we analyzed the case that a signal from one layer in one side of the magnets was l o s t but other nuon c r i t e r i a were s a t i s f i e d . By this analys is we determined the t r i gge r e f f i c i ency and memory store e f f i c i ency . I f the layers that are working fo r t r i gge r ( layers 1,2,3,4,5,6,7,8) miss the c . ignals in the second ana lys is , the signals are los t i n the store memory process. I f the layers tha t are not working for t r igger ( layers 9,10) miss the s ignals , the signals are los t because of the detector ine f f i c iency and store memory i ne f f i c i ency . The resu l ts are summarized in table 1 .
DISCUSSIONS and CONCLUSION
In the f i r s t run t r i gge r i ne f f i c i ency cor rect ion is 1.075 and store memory ine f f i c iency cor rec t ion is 1.147. In the second run t r igger correct ion is 1.034 and store memory cor rec t ion is 1.229. In both two runs the cor rect ion o f the magnetic f i e l d d isun i fo rmi ty i n the edge of the magnet is est i ra ted to be 0.95, i f the muon momentum spectrum is able to approximate as power form o f the momentum. A f te r these correct ions the muon races arv 4.72X10"3 muons/sec i n the f i r s t run and 4.76X10" 3 iruons/sec in the second run. The muon in tens i t y f o r our apparatus, geometrical acceptance is about 1300 crn^sr, is calculated from the reference (1) and th is expected spectrum
Table 1
a) f i r s t run
to ta l events to ta l muons to ta l running time e f fec t i ve sensi t ive t ime t r igger e f f i c i ency store e f f i c iency
12226 7475 2096160 sec 1866180 sec 93.1 + 4.6 % 87.2 + 6.0 %
b) second run
to ta l events t o t a l muons (lower layers) to ta l runn ing time e f fec t i ve sensi t ive t ime t r igger e f f i c iency store e f f i c iency
23201 7172 2207259 sec 1821420 sec 96.7 + 6.5 % 81.4 + 9.0 %

6Ü
is shown in f i g . 3 . The decrease of i n tensi ty below the 90 GeV/c fs the e f fec t o f momentum se lec t ion and f o r t h i s reason the rate of union is approxinutely an integral i n t ens i t y above 80 GcV/c. From th is ca lcu la t ion the muon rate is 4.95X)0"3 muons/sec for our apparatus, and th is value is consistent wi th our measurements. In our analysis the e r ro r of the muon rate is mainly from the correct ion factors and is estimated to be about l o t .
We also analyzed the muon tracks data wi th respect to the de f lec t ion angles in the iragnets and the resu l ts are shown i n the f i g . 4 w i th the Calculated value from the reference ( 1 ) . The muon momentum spectra r e f l e c t to th is d i s t r i b u t i o n and the measured in tens i t i e s below the bending angle of 2 .4-3.6 mrad are lower than the ca lcu la t ions , and above t h i s bending angle the mea-
10'
| i f f *
. IO"«
X 10
100 WOO OrWc momentum of muon
Fig . 3. Calculated muon momentum spectrum a f t e r the cor rec t ion fo r t h i s apparatus . The ca lcu la t ion is based on the production spect r a of cosmic ray mons from re fe r ence ( 1 ) . The decrease of i n t en s i t y below 90 GeV/c is the re f l ec t ion o f momentum se lec t ion .
- 6 4 - 4 8 - 3 2 -16 0 16 3 2 4 8 6 4 downward upward
BENDING ANGLE { mrad ) ^
Fig . 4. Def lect ion angle d i s t r i b u t i o n o f nuons. Thin so l i d l i ne w i th shaded area i s the ca l cu la t i on . Thick s o l i d l i ne i s the run I and broken l i ne i s the run I. Our apparatus has larger acceptance f o r upward bending muons than f o r downward bending muons.

61
sunwnents are higher than the calculations. The bending anyle of ?.4-3.6 mrad corresponds to about 150 GeV/c, therefore the intensUlc\ bclo» 1V0 Grt/c are higher than the intensities obtained from the reference (1) and «••»•kure ments above 150 GeV/c »re lower than the reference.
We also observed one parallel muon candidate: one nuon track was identified in the lower layers and one probable muon track was observed in the upper layers simultaneously and the two tracks are consistent to be para l le l .
We conclude from these results that absolute muon integral intensity above 80 GeV/c are In good agreement with the value of Dau et a l . in the reference (1) in the near horizontal direction at sea level . However the slope of the muon momentum spectrum is steeper than the spectrum of the reference ( 1 ) .
We thank Mr. Aoki for his assistance in the construction of our apparatus. REFERENCES 1) W.D.Oau, K.Carstensen, and H.Jokisch; 1975, 14th Int . Conf. on Cosmic Rays, München, 1931 2) S.Higashi, Y.Minorikawa, K.Honda, S. I ida, Y.Kamiya, Y.Kawashiira, T.Kitamura, K.Kobayakawa, S.Mikamo, K.Mitsui, S-Miyake, Y.Muraki, I.Nakamura, Y.Ohashi, A.Okada, S.Ozaki, H.Shibata, T.Takahashi, and Y.Teramoto; 1977, 15th In t . Conf. on Cosmic Rays, Sofia, MN 2.2 . and MN 2.3.

&: I'AIR MUTER
- A New Muon Spectroweter
S. Higashi*, K. Honda T, S. Iida", Y. Ka»iya*. Y. Kawashia** T. Kitamura, K. Kobayakawa , S. Mikiuao', Y. Minorikawa* K.Mltsi.1 S. Mivake. Y. Muraki, I. Nakamura, Y. Ohashi, A.Okada, S. Ozaki x, H. Shibata*, T. Takahashi x and Y. Tera»oto x
Cosmic Ray Laboratory, University of Tokyo, Tanashi, Tokyo 188, Japan x) Department of Physics, Osaka City University, Osaka *) Department of Physics, Nagoya University, Nagoya •) Department of Physics, Okayama University, Okayaaa ») Department of Physics, Kobe University, Kobe °) Department of Physics, Kinki University, Higashi Osaka v) Department of Physics, Yamanashi University, Kofu 8) High-Energy Laboratory^fsukuba, Ibaragi
We describe a new specrometer named "PAIR METER" xhich is able to measure the energy of the muon beynd 10 TeV.
The basis of PAIR-METER is in the dependence of the slectromagnetic interactions, particulary the direct electron )air production, on the energy of the muon giving rise to them.
The apparatus has been built up in the behind of Mutron and now got into operation.
In this conference, the muon spectra measured by this new spectrometer will be presented. Each muon energy which passes the pair meter is calibrated by the magnet-spectrometer, using the muons which traverse both spectrometers.
Coordinates : MN 2.1 Measured Muon*Intensities
Mail in address : Mutron group Cosmic Ray Laboratory Univers" y of Tokyo Tanashi, Tokyo 188, Japan

63
»•Koier*» anon »mstmm» (ort) er «.jer**» AND n a t m
ID« txMarvAx* »Hoouarxon
on»
A Mul «ad • CMwdhurt
t o f »hyaloa Ufclv«ralty o t «ortn »ang«!, radt*
X rapratantatlva calculat ion ln ttH c l*a*lc* l alaatroäynaaAc Co r u n l a * o f thabha for tha erosc aactlo." of tha op» procaaa in tha oouloati f l« ld of tha «toml3 nualai «nd alrctrona la aveiuataa In aoAparlaon with tha l a t a s t calculation» in tha VD Sorcrtllsa of qu*ntun «laetrodynaadas. Tha QED vars lona of the t^tory «ra fooni to praiJct a ^ at t a m of oro=»3 section *«rl«tlo:i y i th «nargy transfer very c lose ly ajr^clnj u l th «*ch otic»r *nd with the variat ion of Bfrabha cross «action upto tha intannejlata enarjy tranafar rag Ion. Tha f e a s i b i l i t y of dist inguishing by sxoor l -mta any ona «nen? th« l e t a s t ca lculat ions from others i s axaminad in different «naiyy transfer domains.
Ml 3. ? (nuen production, tttcay *n<3 interact ions )
Professor N, Chaudhuri, Department oÅ physics Uni vtani'y o£ tforth Uenj.n N
r>t, uarjf Jlln^, wast Bsngai, mdia
64
tvmrwsvTAi, groar at DXMCT »AIR mower»» (orr) or •.•CrRDR^SOSXTTMON BY « O H fltCKIY » S M C U T N3DNS.
fc.peul. W.L. K*(*sksr end w. ChStfdhart Department of physics University of Morth Bengal, xndie
The f lnei result» of the invest igat ion report«i et the l « e t eonferenee et Hm Ich ere presented. The underground end ^rcur.d l i v s l meesuremeits e t i»r je envies h*ve oe«n analysed to obtain t h e DPP cross section« and «lso to te i interact ion cross sect ions tor suons. The measure! cross sect ion data with • ooveroje In tae energy transfer fro* JM r to 16MV *nA for thras target nuclei are «x*mln«*a with ths l a t e s t cross sect ions predicted by the theory. Ooirparlson of the predictions with tne ;n?esarttä data i s c'.lscuaseu fron Che potnlCl. o f the present multipiate clou;} ch'trber dot* end appl icabi l i ty ot aie3S leol Dh'toha cross s r e t i e r s in the lower energy transfer region.
m 3.2 (Muon production, nec«y and interactions)
pre fos .«to r w. shau^huri. Department of Physics University of North Banzai Ct. ( larjeel lnj* :;e3t B 3.1:1«:!., Twlia

65 nectromagnetlc Interactions of S 1 Tev Huons
S.Higashi? K.Honda? S.Iida, Y.Kamiya, Y.Kawashima* T.KUamura. K.Kobayakawa* S.Mikamo; Y.Minorikawa* K.Mitsui, S.Miyake. Y.Muraki. I.Nakamura, Y.Ohashi, A.Okada, S.Ozaki? H.Shibatat T.TakahasM* and Y.Teramoto
Cosmic Ray Laboratory, University of Tokyo, Tanashi, Tokyo 188, Japan x) Department of Physics, Osaka City University, Osaka, Japan *) Department of Physics, Nagoya University, Nagoya, Japan #) Department of Physics, Kobe University, Kobe, Japan @) High Energy Laboratory, Tsukuba-Taihocho. Ibaragi, Japan %) Department of Physics, Kinki University, Higashi Osaka, Japan +) Department of Physics, Okayama University, Okayama, Japan t) Department of Physics, Yamanashi University, Kofu, Japan
Abstract. Calibrations of proportional chambers in a calorimeter as to the response to bursts are done using two magnetic spectrometers of Mutron. The resultant probability of burst (transfered energy — 1 0 Gev) does not contradict QED.
1. Introduction 1) There has so far been many studies of the electromagnetic interactions
of muon and so few suggestions of the break of QED. Unusual results being " inconsistent with QED predictions are usually ascribed to systematic error of the experiment. But direct measurements of electromagnetic interactions have not been done with known muon momentum over 1 Tev except for statistically poor data. Mutron calorimeter of the present experiment has enough aperture to measure them qualitatively.
In order to remove the systematic errors of an experiment, many-sided examinations of detectors especially about the response to a cascade shower are necessary. Since both incoming and outgoing momentum of a muon are measurable with Mutron magnetic spectrometers, we can estimate the transfered energy (V ) to a burst occured in the calorimeter,
V « P,K-P.ut and this gives a calibration to the proportional chambers which measure the transition feature of the burst. We can use electromagnetic interactions of low energy muons as another calibration of the detectors by assuming the exactitude of QED is established In the energy region of muon < 200 Gev.

66
From the viewpoint described above, preliminary reports »re given tn
following chapters.
2. Experimental Apparatus and Observation A schematic view of Mutron calorimeter is in Flg.l. Detailed
' j)
descriptions were presented previously. The full apparatus is now in •
operation triggered by a triggering system with momentum selector. In
this case, the aperture Sfl. is 900 cmxsterad..
The pulse from each proportional chamber is transmitted to a mini
computer through a logarismic amplitude and a A-D convertor. Spark
chambers are photographed with three cameras.
*-»
»- o *" C u u-<u w
Q. I/)
*-• c o 2
§ % >>•:•
' > ;
W
Fig.1 Calorimeter
i i r,*
'*>
m it; > æ
0; '
IP X ; :
a.
12 S I o tn
8.~ 10
c a» a
1m i&'toM Iron plate(12cm thick)
3 Proportional chamber ezzsa Spark chamber
3. Preliminary Results and Discussion
As described in the introduction, transfered energy to a burst, V ,
which is observed with proportional chambers, must be equal to i P
(= P*- PoA ) measured by the spectrometers, when y Is large enough
( 5 50 Gev) to be determined accurately. We determine V by fitting

67 a f-*oretical curve of a cascade shower (approximation B) to the observed numbers of electrons, Into which the pulse heights of proportional chambers are converted, at the f i rst stage, linearly. Here one unit of the number of e .-ctrons is defined to correspond to the average oulse height of vertical single muon incident perpendicular to the plate of chamber. Vertical muons have almost the same J*"-factor as electrons of critical energy — 21 Mev.
Thus obtained correlation between V and Aß is shown in Fig.3.
Fig.3

68 Though statistics are very poor, the dispersion seems significantly large. This is probably because the determinations of momenta are not so reliable in the present situation (without correction of track coordinate). Now the solid line 1n F1g.3, which 1s assumed to be best fitting, gives some correction to " the number of electrons". It is written down like,
N (corr.) * c*-N*. Suppose ol»l, '.nun |3* 1.11. Including this cor' ..ion, Fig.4 shows
i 3
o o
10 ,-i
7-
5-4
w 7 o
Fig.4 Integral probability of
burst-size
\ *
\i
K K
f l o 30 40 50 70 ioÖ"
number of particles

69 an integral probability distribution of the n.mber of particles detected per laypr of proportional chambers. Majority of noons have energies higher than 100 Gev because of "momentum selector" as described In ref.6). Dotted line shows the result of a Monte Ccrlo simulation considering; o muon energy spectrum as the result of "momentum selector", o knock-on,4> direct pair-electron,* bremsstrahl ung processes of muon, o cascade shower processes using one dimensional approximation B, o 40 X fluctuation of Ionization per electron in a chamber (equivalent
to that of sigle muon). Simulated values are lower than the experimental ones in the region less than ~ 30 particles. This Is mainly due to the fluctuation of ionization losses of low ener;y electrons with various inclined directions in the proportional chambers. Three-dimensional simulations including exact treatment of low energy electrons and photons must be required.
References 1) For example, C.Grupen: Fortschritte der physik 23_ (1976) 127. 2) C.-Grupen: Verhandl. DPG (VI) (1972) 16. 3) T.Kitemura, K.Mitsui and Y.Muraki et al: 14th ICCR 9 (1975) 3349. 4) H.J.Bhabha and W.Heitler: Proc. Roy. Soc. (London) A~159 (1937) 432. 5) R.P.Kokoulin and A.A. Petrukhin: 11th ICCR 4_ (11970T177. 6) See thus conference paper MN-16.
Mutron group: The Cosmic Ray Muon Intensities near Horizontal Direction; measurements by the momentum system of mutron spectrometer.
7) A.A.Petrukhin and V.V.Shestakov; Canadian Journal of Physics 46 (1968) 377 (10th ICCR). —

åQfzectfg KLKHUMAOIRXC IMTBUCTI0B3 OP COSMIC RAT
ROOKS XI IK»
V. Stamm* A. Bloker4, C. Orupea*, H. Joklacb, V.D. Dau, aud O.C. Allkofer
Institut für Kernphysik, university of Kiel, Federal Republic of Oermany
Electromagnetic Interactions of cosmic ray muons have been studied in a spectrometer-calorimeter system. The calorimeter «as a sampling total absorption counter (STAC) of removable iron plates (14 g/cm2 each) and optical current limited spark chambers. A thin plate version (each plate 8 g/cr>3) was designed to investigate the knock-on process and the direct pair production in the range of low energy transfer. For energies below 2 GeV the better energy resolution of this version of the calorimeter was established by a calibration measurement at the DESY accelerator.
The results of the Interaction experiment are consistent with the theoretical predictions. As a function of the muon energy the probability of secondaries produced by the muon are presented.
1. Introduction. In order to investigate the electro-aagnetic interactions of cosmic ray muons in iron, we have built up a spectrometer-calorlneter system. The experiment was performed at DESY, Hamburg, in 1974. Results were presented by Stamm et al. (1975) at the Munich Conference.
For a more accurate measurement at low energy transfer the target plates of the calorimeter were replaced by ones of half the thickness. After a calibration measurement at the DESY accelerator an additional muon interaction experiment was carried out.
Due to electromagnetic interactions in the target material a muon is often accompanied by secondaries. A theoretical prediction of the appearance of secondaries has taken into account all kinds of electromagnetic processes and in addition the absorj fcion of the muon induced cascade shower. This experiment gives a value of the probability of secondaries as a function of the muon energy.
2. Experimental Arrangement. Details of the experimental arrangement can be taker* from Stamm et al. (1975), Carstensen et al. (1975), and Allkofer et al. (1973). Ve recall here only its salient features.
*Mow at OHS Slegen

• * !
Th« experiment consist of a muon spectrometer and an interaction calorimeter. The spectrometer was a setup of an air-gap magnet and wire spark chambers. The mdm of the spectrometer came to 730 CeV/c. The calorimeter was a sampling total absorption counter (STAC) consisting of 20 removable iron plates and 21 optical current limited spark chambers. There were two versions of the calorimeter with different thickness of the iron plates: version I, each plate 14 g/ca2; vtrslon II, each plate 8 g/cm?.
120
Calibration Measurement. In a sampling total absorption ounier (STAC) the energy Is determined from the total track length of charget particle in the cascade, in our c«se from the total number of sparks. With decreasing thickness of the target plates in a STAC the energy resolution increases. For a given number of detector planes however, the maximum energy of a cascade to be totally absorbed, is reduced considerably. The calibration measurement was done at the DESY accelerator for both versions of the calorimeter. The total number of sparks versus the electron energy is plotted in Fig. 1. The bar6 present the fluctuation in the number of sparks for a given energy. For version I (thick plfttes the energy resolution could be expressed by <?= 0.3AVFGeV; for Version II (this plates) by ö = 0.19VF GeV. For energies less than 2 GeV the leakage rate of the calorimeter is neglec-tible. This was established from the shower photographs.
O THM TMOET PLATES
• THCK « M E T PLATES
3 t s t ELECTRON ENEMY I0.VI
Fig. 1. Total spark number versus electron energy
4. Data Analysis. The data of the 'version II run' of the muon experiment were processed analogous to the 'version I run' described by Stamm et al. (1975). Only those auon induced cascades were considered, which start in the first 10 plates /and within a 60x60 cm2 region of the 60x80 cm2 target plates. The energy transfer was determined from the number of sparks according to the calibration measurement. The rate of events of low energy transfer, based on 4130 muons, was compared to the theoretical.prediction of the knock-on frocess (Bhabha-fornula), and to the direct pair production Kokoulin and Petrukhin; 1969, 1971). Effect* due to the limited energy resolution of the calorimeter were carefully taken into account. For different values of energy transfer

the interaction probability aa a function of auon energy la plotted in Pig. 2.
C M W i y " « < i una) »iff • > HHW| f e »eeeeee—
Tr*N ttJWCT n o «MET
CICRGT nUN&TO«
5 S o my » t» woo MUON ENERGY (G«V|
Fig. 2. Interaction probability versus muon energy for different energy transfer
The data of the 'version II run' are consistent with theory and also with the 'version I run'.
5. Probability of secondaries. Due to the high multi-track efficiency of the spark chambers and to their high spatial resolution (sparks at a distance of 3 mm can be resolved clearly) the calorimeter is a good tool for determing the probability oi secondaries. This was done from the 'version I run'. It was assumed, that the production of secondaries and their absorption In the target is balanced, if the muon has transversed 10 radiation length of iron. Therefore only the last 10 chambers were considered. The probability of secondaries is plotted as a function of muon energy (Fig. 3).

M
?0
Irt Ul , c
fe >-
£
to
f - ' « i ' t] - i y i . - T | , f r T T | — , ^ i , T .«yi » y " i - T ^
I I
d. I 1 . I » I I I I
"1 t) WO MUON ENERGY [G*/|
Fig. 3. Probability for muon secondaries in the calorimeter versus muon energy
tooo
References.
Allkofer, O.C., W.D. Dau, C. Grupen, J. Pischke, W. stamm, and R. Uhr 13th Int. Cosmic Ray Conf., Denver 1973, 2761
Carstensen, K., H. Jokisch, H.J. Meyer, W.D. Dau, C. Grupen, O.C. Allkofer and W. Stamm 14th Int. Cosmic Ray Conf., Munich, 6 (1975) 2082
Kokoulin, R.P., A.A. Petrukhin 12th Int. Conf. on Cosmic Rays, Hobart 1971, Vol. 6, 2436
Stamm, W., A. Bäcker, C. Grupen, H. Jokisch, W.D. Dau, and O.C. Allkofer 14th Int. Cosmic Ray Conf., Munich, 6 (1975) 1926

74
THE VERTICAL ENERGY SPECTRUM OK COSMIC RAY MOONS ABOVE I TtV AT SEA LEVEL
M.Aknhi( l ) , K. Ka»ahara(.>). A.Mia*k»(J). 1 Mito(-I). K. MUutani(J). A. Ohsawa(2). I.Ohta(S). M Shibaia(fa). T.Shirai(7). K. Taira(8). T. Taira(7). Y Takahaihi(4).
N.Tateyama(7). S. Torii(2), Z. Watanabe(l) and T Yuda(2)
(l)Hirosaki Univ.. Hirosaki. Japan. (2)CRL. Univ. of Tokyo. Tanaahi. Japan. (3)Saitama Univ.. Urawa, Japan. (4) Shibaur.i 1ml of Tech.. Tokyo. Japan, (5) Utsunomiya Univ., Utsunomiya, Japan (6) Yokohama National Univ.. Yokohama. Japan, (7) Kanagawa Univ., Yokohama, Japan, (8)Sagami In»t. of Tech., Fujiaawa, Japan, (q)Osaka Univ., Toyonaka. Japan
The vertical energy spectrum has been measured of cosmic ray muons at sea level by means of the emulsion chambers arranged vertically at shallow depth underground. The present results have been performed with the amount of exposure of 12. 7 ton years of lead. The results of the vertical muon intensities of energies around 1 TeV are not inconsistent with the ones which were given indirectly by means of the emulsion chambers arranged horizontally of exposure of 61. 6 ton yaars of lead,' reported at München, 1975.
1. Introduction. The energy spectrum is measured of high energy showers induced by cosmic ray muoai by means of the emulsion chambers exposed at shallow depth underground. This enables us to establish the spectrum of muons at sea level, not only it» slope value but also its absolute intensity. In the previous work, the spectrum of oblique muons were measured by use of the emulsion chambers arranged horizontally with exposure of 61. 6 ton years of lead. The results gave indirectly the vertical spectrum of muons at sea level in the energy range of 1 TeV to 10 TeV, as reported by some of the authors at München, 1975(1 ]. In order to measure directly the vertical spectrum, in the present work the emulsion chambers arranged vertically have been exposed at the underground laboratory of about 10 m below the ground. In the present paper, the results with exposure of 12. 7 ton years of lead are presented.
2. Experimental Procedure. Eight emulsion chambers have been exposed for 348 days at the underground laboratory(Nokogiriyama laboratory). Each emulsion chamber is 50 cm x 40 cm wide and 75 cm thick of lead, and contains photosensitive layers in every 1 cm thick of lead, as shown in Fig . l . In the one emulsion chamber designed for energy calibration, each photosensitive layer consists of a nuclear emulsion plate(Fuji MA7B) and two sheets of X-ray fUms(Sakura type-N). In the others, photosensitive layers consist of X-ray films only.
Wien high energy showers are produced by muons in the emulsion chambers, they are recorded as black spots on X-ray films. These spots

75
L\\\l lead plate X-ray film nuclear emulsion
plate
I N \ \ \>~ E^
Fig . l . Emulsion chambers.
can be easily detected by naked eyes . The energy of each shower i> measured by the photometric method[2 J, i n which the optical density of each spot on the X-ray film is measured with a photometer and the maximum optical density of each shower is determined from the transition of the optical density. In the emulsion chamber designed for energy calibration, at the same time the energy of each shower is measured by the track counting method[3], in which the number of shower electrons on the nuclear emulsion plate corresponding to each spot is counted within a certain radius and compared with the numerical curves evaluated from the three dimensional theory of cascade shower. Fig. 2 shows the correlation of the maximum optical density of each shower determined by the photometric method and the energy measured by the track counting method. In the photometric method, the optical density has been measured with a slit of (200 pm) wide, and in the track counting method, the number of shower electrons has been counted within a circle of 50 urn radius. The optical density depends on the incident zenith angle of the shower. The figure is drawn for the optical density which i s nor.-nalized to one of a vertical shower by refering to the three dimensional theory of cascade showe r [4]. In the present photometric method, the energy of each shower has been determined
1.0 D
0.1
• /
& ' ' X > 0 '
f°. . 0.5 T e V
Fig. 2. Correlation of the maximum optical density D of a shower and the energy F asured by the track counting method. The 6olid curve and the dashed curves indicate the best fitting curve and the 95 % confidence levels , respectively.

f>
\j\ u>c o! the l>c»t t it 11 n>2 curvr in the figure
) K c i u l u and Discussions Among the detected ihowfrtll. 'O.' »htwters! the ones whose nenith .ingles «re larger than <S° by considering the detection inefficiency for the shower with the incident direction of large zenith angle
The energy spectrum of 4 52 showers thus selected is shown in Fig 1 The spectrum is approximated by a power function with the slope of 2. 8j.O. 2 in the energy region above 0. 7 TeV, where the showers a re detectable without any bias . This threshold energy coincides with the one examined in the previous work[5]. Most of these showers may be regarded as the ones initiated by bremss t rah lung photons from muons, as is expected from interaction c ro s s sections of muons. Because that the emulsion chambers a re exposed at about 10 m below the ground, the contamination of the showers induced by hadrons and e lect rons is est imated to be l ess than 10 aga-'nst the one induced by rr ions.
Fig. 4 shows the zenith angle distr ibution of showers with energy above 1 TeV, for which the average energy of the parent muons is est imated to be about 2. 5 TeV. The present r e su l t s a re displayed with the previous ones[5] in the same figure. The shape of the expected distr ibution depends on the production ra t io of kaons to pions in the a tmosphere . The observed shape shows good fit with the shape in the case of the ra t io being 0. 3 j ;0 . 1.
T e V
Fig. 3. Integral energy spect rum of showers induced by cosmic ray muons. The solid line indicates the best fitting in the energy region above 0. 7 TeV.
F rom the spectrum of showers, the ver t ica l energy spectrum of muons

T »i
'Si
10 -13
(g s st) -1
0. 0 0 . 2 .4 0. cos 0
0. 8 1.0
Fig .4 . Zeni thangle distr ibution of showers induced by cosmic ray muons. The solid c ros se s and the dashed c r o s s e s indicate the present resu l t s and the previous ones, respect ively. The solid curve shows the one expected from the zenith angle distr ibution of muons.
T e V
Fig. 5. Integral energy spectrum of the ver t ical intensity of muons at sea level. The solid frame and the dashed frame show the present resul t and the previous one, respect ively.
at sea level is given[5] and i ts slope value is es t imated to be the same as the one of showers. The present resul t is shown in Fig. 5, where a comparison is made with the previous resul t [ l ] given indirectly from the spectrum of oblique muons. Although poor s ta t is t ics of the present resul t , it may be concluded that both a re not inconsistent with each other. Especially, on the absolute vert ical intensity of muons at 1 TeV, both resu l t s a re in good agreement with each other, as shown in the figure.
4. Conclusion. The observation of the spectrum of muons at sea level provides an important information to the study of high energy interaction in the a tmosphere . By means of the emulsion chambers , the absolute intensity of muons is measured exactly within the framework of tha three

78 d imens ion»! theory of c a s c a d e shower
A c k n o w l e d g e m e n t s . The authors are grateful to P r o t e s t o r J, N i s h l m u r * and P r o f e s s o r S. Miyake for their valuable d i s c u s s i o n s . They a re indebted to the a d m i n i i t r a t o r of Nokog ir iyama laboratory for a s s i s t a n c e .
R e f e r e n c e « . ( l ) M . A k a a h i . Z. Watanabe, A. Misaki . K. Mizutani, T. Shirai and
Y. Takahashi ; The 14th Tntern. C o s m i c Ray Conf. . Conf. P a p e r s , 6, 2037(1975).
[2] I. Ohta; Suppl. P r o g . Theo . Phy«. . (46), (1971). [3] J . N i s h i m u r a ; Suppl. P r o g . Theo. Phya. . (32), 72(1964). ' [4] I. Ohta, K. Mizutani , K. KaSahara, T. Kobayashi , E . M i k u m o . A. Ohaawa.
K .Sato , M. Tsuj ikawa, S. Uchida, T. Yuda, l . M i t o , S. T o r i i and Y. T i k a h a s h i ; The 14th Intern. C o s m i c Ray Conf. , Conf. P a p e r s , 9, 3154(1975).
[5] K. Mizutani , T. Shirai , M. Akashi and Z. Watanabe; The 12th Intern. C o s m i c Ray Conf. , Conf. P a p e r s , 4 , 1392(1971).

79 SCATTERING HORIZONTAL MUON MEASUREMENT
T.Wada, Y.Iga, K.Hikasa, Y.Hiraki, and T.Fuk.nya Department of Physics, Okayama University,
Okayama, Japan, I.Yamamoto
Okayama College of Rcince, Ok&yama, Japan, and
S.Katsube Ashikaga Institute of Technology, Ashikaga, Japan.
We detect single cosmic ray ii.uon at sea-level (the zenith angle 87 o-90 o, the energy range 10-100GeV/c). In this experiment, we use new coincidence system(Tournament Circuit); for the larger detective area keeping up to the same zenith angle, and the 10 x 10 wall-less wire-wire proportional counters(Matrix Counter); for energy estimation by using the relativistic rise of ionization loss, then we take the method of minimum pulse selection or other statistical treatment circuits. For this investigation, we examined the characteristic of o.ur Matrix Counter and Triggering System.
1. Introduction. Cosmic ray muons at the large zenith angle give informations of the neutrino physics or large scattering. Especialy, it is very interesting to detect the muon which coires flying from more than 90°. In order to perform this investigation we must measure the value of incident energies, directions and angles. At present time, we use Matrix Counter which consists of wire-wire proportional counters for energy measurements; two scintillation counters for determing the incident directions; B.DiC. and digital electronic circuits ' for determing the zenith angles. The purpose of this experiment is to prepare techniques and detecter. So we present the preliminary result.

80 2. Apparatus and Method. The set-up of thi i cxp«-r ir-cnt is shown in Fig.l. This measurement system consists of three types;
A) The triggering and the determing an incident direction.
B) The measurement of an injection angle at the same solid engle.
C) The estimation of muon enerciies by ionization loss in a gas counter.
Triggering and Determing the Zenith Angle. The deter -mination of an injection angle is us>ed by Block detecting Counters (B.D.C.) and the treatment circuits which take the Tournament Circuits. In this direction for use all the block is 4 x 4 cm 2 (area) x 50 cm (length), and these 64 blocks have the same solid angle by using the Tournament Circuits, then the detec -tive area is the 64 times. If the setting of selec -tion circuits is free, we can gain the data of angles
1)
Anti counter
BDC-1 BDC-2
MATRIX COUNTER

81 The Matrix Counter. Thi« counter consists of wire -wire (anode wires-30p^ gilding tungsten-one hundred signal-outputs and 62i cathod wires-50urf), and is fulled with PR-GAS in the Al-box. When some signal -outputs are surrounded by anode wires which put on voltage (* few hundred), knock-on electrons from Al-wall are cleaned out. The F.VI.H.M. of C d 1 0 9 is 6.4%. Pulse Selection Method. For the measurement of ionization loss in a gas counter, we test the method of the Minimum Pulse Selection (M.P.S.) and the Geometric Means (G.M.). These methods are treated by using electronic circuits. At the Fig. 2a and b, we show an example of M.P.S. results (500 MeV/c electron beam). The validity of G.M. method is now testing.
-1500 500 MeV/c Electrons Beam
1 n 3 8.45 keV
£ •*. F.W.H.M.= 52.9 % 3 .500 O o
.,-.....-:' l o o '•"••••'•.••••..
i • — 1 •
P.H.A. Channel Number Pig. 2a. Single electron ionization distribution.

82
1000 500 MeV/c Electrons Beam
8.15 keV
•500 F.W.H.M.=41.2 %
100 P.H.A. Channel Number
Fig. 2b. Ionization distribution of 4 M.P.S.
3. Results and Discussion. In this experiment, we measured the triggering distribution; the zenith angle distribution. It is shown in Fig. 3. These were measured in some kinds of set-up. The cosmic rays were taken with 1-4 M.P.S, for a examples it is shown in Fig. 4. In Fig. 4., there is a pulse height distribution of an isotope Fe55(GamiT£a ray) for the comparison with cosmic ray muons. In this step, as we prepared the fundamental procedure, we hope this type of study will continue.

83
60° 70° 80° 90 c
Fig. 3. The zenith angle distribution.
Acknowlegements. The authors express thanks to Mr. O.Abe, S.Takami and Dr. A.Kuge for the useJul discussion and support.
References. 1) See this conference paper MN-51.

84
P.H.A. Channel Number
Fig. 4. The cosmic rays ionization loss distribution.

85
DEKr;i VB INTENSITY RELATION AND INTEGRAL ENERCY SPKCTR UM OK MUON5
M. R. Krlshnaswamy, M. G. K. Menem and V. S. Naraslmham T a u Inatitute of Fundamental Research, Bombay 400005, India
and N. Ito, S. Kawakami *nd S. Mlyake* Osaka City University, Osaka, Japan
* Now at University of Tokyo, Tokyo, Japan
A consolidated depth Va intenaity relation of atmospheric muona has been obtained from a aeries of measurements in the Kolar Gold mines n the depth region 750-10,000 h g / c m 2 . From this , the integral energy spectrum of muons la determined up to ener -gies of the order of 50 TeV. Cn the basis of scaling model for high energy coll isions, we determine the primary cosmic ray nucleoo spectrum up to 100 TeV and compare it with th« direct observations.
1. Introduction: In Kolar Gold Minea, muon intensities have been measured over the past fifteen years at various depths in the range 750-10000 h g / c m 2 . In this paper we present a conaolidated depth-Intenaity relation for Kolar rock (Av. density 3. 04 g m / c m 3 , < Z / A > = 0. 495, < Z 2 / A > = 6. 4) and obtain the sea- level energy spectrum of muona. We wil l use the results of the present measurements to study the validity of sealing at very high ener -gles and obtain an estimate of the primary nucleon flux in the energy range 1 0 2 - 1 0 5 GeV.
2. Depth -Intenaity R elation: In thia analysis we consider the reaulta on vertical intensities from the experiments of (a) Miyake et aL, 1964 (b) A char et a l . , 1965 (c) Krlahuaawamy et a l . , 1975 (Neutrino experiment) and (d) the exhaustive angular distribution measurements of Kriflhnaswamy et a l . , 1969, 1971. In Table 1, we liat relevant experimental details for the lateat aeries
Table 1
n ., ! ! Area of ! Depth region i Energy region ti*i• 2\ ' Detector ! detector { studied J studied ( h g / c m ' I ! (m 2) ! (hg/cm 2) J (T.V)
L t 1 - . J 754 Vertical telescope
(one aide triggering) 4 750-2270 0 .2 - 0 . 9
1500 Vertical tele« cop« (one aide triggering)
4 1500-4500 0 .5 - 3.6
1500 Horizontal telescope 4 1760-4750 0.6 - 4 .2 3375
6045
Vertical telescope (2 units)
Vertical telescope (2 unita)
4 x 2
4 x 2
3375-6250
6041-10000
1.9
8 . 4
- 24
- 5 0
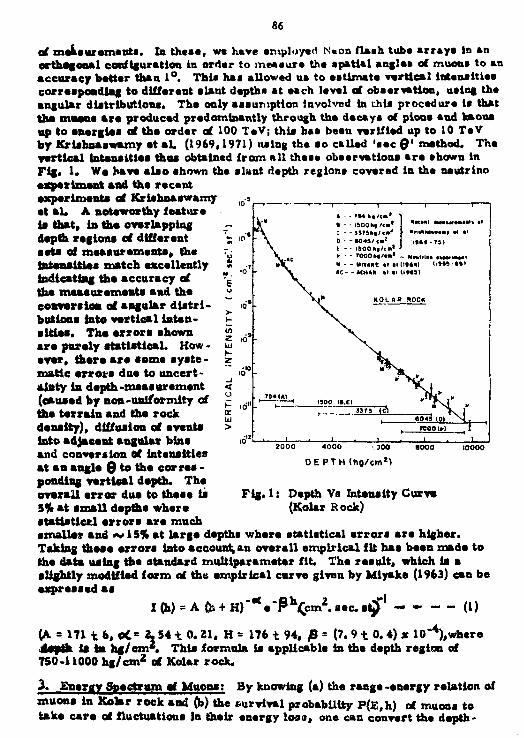
86
>• V>
z K Z
of measurements. In these, wa have employed N«on flaah tuba arraya In an orthogonal configuration in ordar to meaaura tha apatial anglaa of muona to an accuracy batter than 1°. Thla ha a allowed u» to eatlmata vertical intens it las correapoadlng to different slant depths at each level of observation, ualng tha angular distributions. The only assumption Jnvolvod in thla procedure la that the means are produced predominantly through the decays of pione and knons up to energlea of the order of 100 TeV; thia haa been verified up to 10 TeV by KrUhnaawamy et aL (1969,1971) «aing the ao called 'aec Q' method. The vertical Intenaitlea thai obtained from all theaa observations are ehown in Fig. 1. We have alao ahown the alunt depth regiona covered in the neutrino experiment and the recent experiments of Krlehneawamy et el . A noteworthy feature la that. In the overlapping depth region« of different •eta of measurements, the tntenaitiea match excellently indicating Ote accuracy of the measurement« and the conversion of angular dlstrl-butlona Into vertical intensities. The error« ahown are purely «tatlatical. How -aver, there are «on» systematic error« due to uncertainty la depth-measurement (caused by non-uniformity of the terrain and the rock density), diffusion of events Into adjacent angular bins and conversion Of intensities at an angle 6 to the cor res -ponding vertical depth. The overall error due to thee« la 5% at small depths where statistical errors are much smaller and <vlS% at largo depths where statistical errors are higher. Taking these errors into account, an overall empirical fit has been made to the data using the standard multiparameter fit. The result, which la a slightly modified form of the empirical carve given by Mlyake (1963) can be expressed as
I(h) = A Ch + H r ^ V P ^ c n Å s e c s ^ * ' - - - - (I)
(A. = 171 t 6, oC* 2, 54 + 0. 21, H = 176 t 94. ß = (7. 9 t 0.4) x 10"4),where daach. 1* la hg/cm*. This formula is applicable in the depth region of 750-11000 hg/cm 2 of Kolar rock.
3 . Energy Spectrum of Mnons; By knowing (a) the range-energy relation of muons in Kolar rock and fr) the uurvival probability F(E,h) of muons to take care of fluctuations In meir energy losa, one can convert the depth-
LÜ
>
i <« 1 ' •>•• ~ l ' - '
! - • I M ft./c»' It - - 1500I I * /c« 1
C - - J J T 4 l i , / c » '
i 1 . ,
MC.Rt M H M M * H l •)
• KnakMtMWf * • '
\ V
0 - - « M 5 / C « ' i l l M t l 1 - - ISOOhf 'c i 1 ' f • - TOOOM'C«' - Nmtllll. M .MM. . I * - - MIVAKE .1 . I l t , « . ) l i»»3-«»l
• \ «C- - ACHAR .1 .1 1,131
-\ . ^c KOLAR •toe«
* * • * '
-' ?a4i»i
i 1 i
1900 IB.EI -' ?a4i»i
i 1 i
1900 HT5 (cS -'
?a4i»i
i 1 i 1
•04J1 (0> N . , -'
?a4i»i
i 1 i 1 1 . . i 1,
reoo i.) , 1 i i
to" - •
D E P T H (hg/em z )
Fig. 1: Depth Vs Intensity Curve (Kolar Rock)

87
intensity relation into a aea level intogral energy »pcctrum.
3.1 Range-energy relation: been uaed:
The following average energy loa« formula hat
n>reina-etrahlung
b ln« lo- t ic > E
interaction (2)
production
with the value« of b „ . b b r and b„ aa ahown in Fig. 2.
From thia the range h for a muon of energy £ haa been found from V h = f (JE
(a+bE) 545 . g / e m 4 ; E in GeV. s
V» W
(3) I 3. 2 Survival Probability: The probability P(E,h) that a muon of energy E at aea-level , reachea a depth 'h' has been calculated In two way«,
—*n— • — i r- t • r - '
'^~~ • M l * MOOUCTlOf» ' •
M U M T U M J M
•
•
MWTO MKIEAII •
, , o' ' « •«.• t " ' * • » • ' ' ' K CNERCV OF MUON (GtVI
Fi«. 2: Variation ©I 'b' with muon energy, E .
(a) Monte-Carlo Method: Standard Monte -Carlo method was uaed to determine the-survival probabilities. The energy region from 100 GeV - 100 TeV was divided into 81 logarithmic interval« and at each energy 8000 muon« were considered. The uncertainties in the calcula -tion due to (a) statistical fluctuation» and (b) simplification of expressions for cross -sections are estimated to be ~ 5 % over the entire energy region.
(b) Direct Mathed: In this method we start with a «ingle muon of energy E at the boundary. The energy E is subdivided into 40 bins of equal width and the depth into bins of 50 h g / c m 2 each. The probability that the muon after traversing a depth bin will have energy corresponding to the each energy bin i s calculated, taking Into account the exact formulae for various cross -sections. Again muons with energy corresponding to the mean energy of each bin is considered and the process repeated until the depth of interest is reached. The probability P(E,h) is then obtained by summing up the probabilities for various bins at the depth h. The survival probability evaluated by these two methods are in very good agreement with each other.
The energy spectrum at sea- level haa been obtained by combining these survival probabilities and the depth-intercity relation in the following manner. First ly , starting with an adhoc energy spectrum of muons (i. e . ) F(E)dE = AE-v» *ll dE, we derive the D-I curve by using the survival probabilities P(E,h) and compare it with the actual observation. The best fit for the energy spectrum i s then obtained aa
1 ( > E ) = ( 3 . 4 0 t 0 . » 5 ) E •(2. 6 t 0. 05), ^-1 era" s re, .st.} (4)

88
for 200 < E <40 ,000 CoV. Thle la eh own In Flg. 3 »a a. aolld curve. Though a apectrum «1th a couatant a lop* ' f < glvea an adequate fit to th« data, a alewly increasing value of t (2. 5 for E «1 TeV alowly Increasing to 2. 68 at hlgheat energy) in thla energy range cannot be ruled out.
We have alao employed the atandard procedure L e. converalon of each depth to the correapondlng average energy with Eqn. 3 and correcting the obeerved intenattlaa with the calculated lluctuation factor a, to determine the energy apectrum of muone at aea-level . T h e experimental point* ahewn in Fig. 3 are obtained In thla manner. It la clear that both method* lead to eaeentially Identical reaalU. hi deriving the energy apectrum (Eqn. 4) w* have conaldered the uncertaintlaa In depth in addition to etatiatical error*. Furthermore there »re uncer taint lea In the theoretical valuea of b—, b b p
and t ; thla may give r lee to errora ~ 2 0 % In the lntenaltlea at high energlea ( > 1 0 T e V ) .
We would like to atreaa that the above apectrum la abaolute In nature and the main Inaccuracy at high energiea la due moatly to the uncertain»«» In the aaaumed 'b' valuea. At lower energle* (<1000 GeV) thia error and the effect of fluctuatlona are negligible. The energy apectrum derived here in the lower energy region la in good agreement with the aea level s p e c t . o -graph measurement of Allkofer et aL (1971) aa «hown in Fig. 4.
Moid Cn.rgj Iff Ocv E B t , „ M Mun « Sra-WHl I Ul K » G.VI
Fig. 3: Integral muon energy Fig. 4: Compariaon with magnetic apectrum at aea leve! spectrograph measurement
at aea level

89
At higher energlea (>1000 G«V), the muon energy apectrum ia alao obtained (rom experiment« conducted at very ahallow deptha using either burst detectora, lonleatlon calorimeter» or Emulsion chambera. In general they provide reasonable agreement with our reaulta except for the Ioolaatlon calorimeter experiment« of Erlykln et al. (1973) and Khrletianaen et al. (1971) who get the value of 2.1 - 2. 3 for the exponent of Integral energy apectrum. The energy «pectrum of Amlneva et al. (1973) la alao con«Utent with our re«ult« up to*v8 TeV; at higher energlea there la an Indication of ateepenlng of the apectrum baaed upon a email autist ic« 1 «ample.
4. Scaling and Ener£y Spectrum of Primary Coamlc Ray«: Aaaumlng aca -ling to ba valid In energy region« well above the ISR energlea and extrapolating the ISR data on inclusive spectra to higher energies, the ratio of differ -ential muon Intensities to the differential primary nucleon intensities at various energlee were calculated In a straightforward manner (e. g. Ramanamurthy et aL (1972) »ad Erlykln et al. (1974)). The primary nucleon spectrum thus obtained in the energy region 200 - 1 0 5 GeV is shown as a hatched band In Fig. 5, along with the direct measurements of Ryan et al. (1971) and Grigorovet a l . (1971). The band reflects the uncer -tainties In the energy estimation due to errors in the values of b and h. This calculation may have ~-10% error due to experiment*! errors In the Inclusive spectra of secondaries In nuclear Interactions and the uncertainty in the assumed values of pion and kaon absorption lengths in the atmosphere. We wish to point out that the present estimate la in r e a sonable agreement with the direct meaeurements within errors (not shown In Fig. 5 for sake of clarity) in the overlapping energy region» (0.2 - 2 TeV); at higher energiea however, the apectrum of Grigorov et al . ia ateeper in view of the rapidly diminishing proton component.
•«««KT M M
Fig. 5:
(0* ' ' 10-ENERGV PER NUCLEON (G*V)
Differential primary aucleon spectrum
The examination of validity of scaling at high energlea through the aea-level muon energy apectrum requlrea the knowledge of primary cosmic ray spectrum as to Its exponent and composition. Since the latter are not known to any reasonable certainty, what we can say from the present analysis is that there are no significant deviationa from scaling in the fragmentation r eg lor. which ia relevant for cosmic ray muon studies.
5. Direct production of muons; In accelerator e:cperiments direct production of muons in nuclear collisions have been observed with MA*-'10~*.

90 One could examine this proceea through the energy spectrum of mueni, at very high energi««, provided accurate information la available on the primary coiniic ray spectrum and the Interaction characterlatlca. It la well-known that any significant direct production will lead to a flatter energy apectrum of muona a« compared to one without such a new proceee.
There la no evidence for any direct production In the present observations. The reault la conaiateut with what one expects on the baals of normal parentage (i. e. piona and kaons) for the muona. However, one can set an upper limit of 0. 4% for A*d/ff In high energy collisions leading to muons of energy 10-50 TeV, from the present observations, consistent with errors . Combining this with our earlier observations on the angular distribution of muons (Kriahnaawamy et a t , 1977), it can be stated that the direct production of muone Is insignificant (A*d/fr < 0.4%) in the energy region 1 -50 TeV.
Acknowledgements; The authors wish to thank Shi I R.M. Weaker and Shri K, D, Salvekar for help In running the experiments. We are grateful to the authorities and staff of Bharat Cold Mines Ltd. for their ready cooperation in carrying out the experiments. We are Indebted to the Japanese Science Foundation for the Promotion of Science and the Toray Scientific Fund for partial financial support of the experiments.
References
Achar, C, V. et a l . , 1965, Proe. Phys. S o c , 86, 1305. Allkofer, O.C, et al. , 1971, 12th IC CR, 4, 1314. Amineva, T. P. et al. , 1973, 13th IC CR, 3, 1788. Erlykin, A . D . et a l . , 1973, 13th ICCR, 3 j l 8 0 3 . i . i lykin, A . D . et al. , 1974, J. Phys. A, ~Tj 2059. Grlgorov, N. L. et a l . , 1971, 12th ICCR, 5, 1746. Khristiansen, G. B. et al. , 1971, 12th ICCR, 6_, 2142. Krishnaswamy, M. R. et aL , 1969, Acte PhysTca Hunger lea (SuppL ), 4 ,221. Krishna«wamy, M.R. et a l . , 1971, 12th ICCR, 7 , 2 8 8 1 , 2886. Krlshnaawamy, M.R. et a l . , 1971, Proe. Roy. S o c (Load.), A323, 511. Krishnaswamy, M.R. et a l . , 1977 (to be published). Mlyake, S . , 1963, J. Phys. Soc. (Japan), 18, 1093. Miyake, S. , et a l . , 1964, Nuov. Cim. , 32, 1505, 1524. Ramanamurthy, P. V, and Subramaniao, A . , 1972, P r o c Ind. Acad, S c . ,
See. A, _1,1. Ryan, M. J. et a l . , 1971, UthICCR, 1, 173.

91 Average E. ergies and Differential energy Specrum of Muon at various depths J. Nishimur« and A. Misakl Institute for Aeronautical Science, University of Tokyo, Komaba, Japan
«»Department of Physics, Saitama University, Urawa, Japan
Theoretical 0 Experimental Q E o t h D
In a previous paper, authors obtained average energies and differential energy spectrum^ln the both various depths and varloud exponents of incident of muon. In this paper, corresponding quantities are obtained in the case that there are a kink in the incident muon spectrum, using our approximate form of differential energy spectrum of muon.
1) A. Mlsaki and J. Nishlmura ( to be published in the Proceeding of Asian Symposium on Secondary Cosmic Rays, Hong Kong, 1976 )
Coordinates: i_ •• 2.3 ( Muon'3 Differential energy Spectrum )
Mailing address: A. Mlsa'-.i,
Department of Physics, Saitama University, Urawa, Japan

92
ON THE HIGH ENERGY MUONS D E E P UNDERGROUND.
K. Mizutani Department -o f P h y s i c s , Sa i tama U n i v e r s i t y , Urawa, Japan.
Theoretical fx] Experimental Q B °«h Q
The s p e c t r u m of h igh e n e r g y m u o n s at s e a l e v e l has b e e n m e a s u r e d by m a g n e t i c s p e c t r o m e t e r s , by e m u l s i o n chamber t e c h n i c s and by intens i ty m e a s u r e m e n t s d e e p underground. T h e s e r e s u l t s s l ight ly dif fer f rom e a c h other in the e n e r g i e s above s e v e r a l T e V . The d i f f erence has an effect on the i n t e n s i t i e s of high e n e r g y m u o n s d e e p underground e x p e c t e d by t h e s e r e s u l t s . R e c e n t l y it i s p r o p o s e d t o o b s e r v e the s h o w e r s induced by m u o n s a n d / o r neutor inos at l a r g e depth underground a n d / o r underwater ; F o r t h e s e o b s e r v a t i o n s , it would be d e s i r a b l e to e s t i m a t e the expec ted s p e c t r u m of m u o n s d e e p underground a n d / o r underwater at high e n e r g y . In th i s paper , f i r s t l y , the fnuon s p e c t r u m at s e a l e v e l in the e n e r g i e s above 1 TeV i s d i s c u s s e d by c o n s i d e r i n g the at tenuat ion of high energy, m u o n s in the ground a s w e l l a s the e x p e r i m e n t a l e r r o r s of m e a s u r e m e n t s . Next ly , the e x p e c t e d muon s p e c t r a d e e p underground and underwater are d e r i v e d . Some c o m m e n t s w i l l be m a d e on the e x p e c t e d s p e c t r u m of the s h o w e r s induced by h igh e n e r g y m u o n s at l a r g e depth be low s e a l e v e l .
Coordinates: M N 2 . 1 . ( M e a s u r e d Muorj. In tens i t i e s ) or MN<1. 3 . or M N 2 . 7 .
The e x p e c t e d muon s p e c t r u m d e e p underground.
Mailing address: K. Mizutani , D e p a r t m e n t of Phys ics . , S a i t a m a U n i v e r s i t y , Sh imo-Okubo , Urawa 3o8 , Japan.

93 / MEASUREMENTS OF THE ENERGY SPECTRUM OF MUONS
DEEP UNDERGROUND AT HIGH ENERGY.
K. Mizutani Department of Physics, Saitama University, Urawa, Japan
and I. Ohta
Faculty of Education, Utsunomiya University, Utsunomiya, Japan.
Emulsion chambers were exposed with about 2 tons of lead in Okutadami Road Tunnel of 850 h g / c m 2 below the ground, and thereby the high energy showers induced by cosmic ray muons were observed. These exposures were carried out as the first step of the observations deep underground with use of emulsion chambers. A brief discussion is given on the spectrum of showers deep underground in a comparison with the spectrum of muons at sea level.
1. Introduction. By means of the emulsion chambers exposed deep underground, it is possible to observe the high energy showers induced by cosmic ray particles. These showers are mainly the ones induced by muons[l]. The observations of these showers enable us to measure the energy spectrum of muons deep underground.
Cosmic ray muons deep underground so far are observed mainly by intensity measurements[2]. The spectrum of muons at sea level is determined from these measurements by considering the energy loss and the range fluctuation of muons in the ground. It i s seemed that the result so far is not in good agreement with the others determined by different measurements[3]. By the observations with use of emulsion chambers, some informations would be given on the energy loss of muons in the ground.
Our observations were initiated by the test exposure of an emulsion chamber in 1973[4]. In this emulsion chamber, the examples of showers which were interpreted as the ones induced by muons were detected, and the possibility of observations was confirmed. Next exposure was carried out with use of the emulsion chamber of same type as the first step of the observations deep underground. In the present paper, the results given from these exposures are presented.

94 2. Experimental Procedure. Emulsion chambers were exposed in Okutadami Road Tunnel(37°08'N, 139°12'E) covered with homogeneous granite rock. The energy loss of high energy muons in the ground depends on the topography and the characteristics of covering rock. These were well investigated at the present experimental site in the earlier paper[4]. The average values of the density, the Z/A and Z^/A of covering rock are examined to be 2. 67 g / c m 3 , 0.495 and 5. 68, respectively, and to be very similar to those of standard rock which are 2. 65 g /cm , 0. 5 and 5. 5, respectively[5].
The present results are based on two blocks of emulsion chambers. One of these is 40. 5 cm thick of lead and another is 39. 5 cm thick. Each emulsion chamber is 50 cm x 40 cm wide, and contains photosensitive layers in every 1 cm thick, or partly 0. 5 cm thick of lead. Each photosensitive layer consists of a nuclear emulsion plate(Fuji MA7B) and two sheets of X-ray films(Sakura type-N).
These emulsion chambers are arranged at the vertical depth of 850 hg/cm^ of rock. On the depth of covering rock, details were shown in the earlier paper. One and another of these emulsion chambers were exposed during 11 months(26 Oct. 1973 - 26 Sept. 1974, the test exposure) and 10 months(16 Oct. 1975 - 24 Aug. 1976), respectively.
When high energy photons or electrons are produced by cosmic ray particles in the emulsion chambers, these develop to cascade showers and are recorded as black spots on X-ray films. These spots can be easily detected by naked eyes if the energy of the shower exceeds a certain value. The detection of showers is performed by the method of the X-ray film scanning, in which the black spots are searched for on X-ray films by naked eyes and the showers are detected on the nuclear emulsion plates corresponding to the black spots with a microscope. In this method, the threshold energy of the shower detection depends mainly on the background darkness of the X-ray films.
For each detected shower, the behavior of the shower electrons three-dimensionally observed with the nuclear emulsion plates. Most of the detected showers display the typical development of single photon incident. These are regarded as the showers initiated by bremsstrahlung photons from muons, as expected from the interaction cross sections of muons.
The energy of each shower i s measured by the track counting

95
mrthod[6], * n w h i c h the number of shower electrons on the nuclear emulsion plate i» counted within a certain radius and compared with the numerical curves given from the three dimeasional theory of cascade shower.
3. Results and Discussions. By the method described above. 33 showers were detected in the energy range of 0. 2 TeV to 1. 0 TeV. The result on ths energy spectrum of these showers are compared with the expected one and the threshold energy of shower detection which was examined preliminary 0. 3 in the earlier paper is confirmed.
The detection efficiency of showers depends on not only the energy but the incident zenith angle. The dependency on the incident angle was examined with use of the showers detected in the emulsion chambers exposed at shallow depth undergrour.i[7]. By considering the conclusion of the earlier examination, the showers whose zenith angles are larger than 60° are excluded.
s t
0.2
0 . 1
n i
L_ u t 1000 hg/cm 1500
Fig. 1. Width of solid angle for various depth of rock at the present experimental site. The depth is divided in every 50 h g / c m 2 of rock.
Under this selection criterion, the width of solid angle is estimated for various depth of rock at the present experimental site, by refering the topography and the average density of rock. The results are shown in F ig . l . The deptV corresponding to the sharp peak of shallow side is approximately equal to the vertical depth of 850 hg/cm^ of rock.
the energy spectrum of muons deep underground expected from

96
\ \ \ \ at sea level
A \ \ \
\ \
-lo-8 A \ -2 -1 - l \ \ cm s st V \
\ \ \ \
\ \ -IO' 9 \ \
\ \ i . i _ i 1
0.1 TeV
Fig. 2. Numerical evaluations on the integral energy spectrum of muons at 850 h g / c m 2 of rock. The integral energy spectrum of muons at sea level shown by the dashed curve is approximated by a single power function with the slope of 2. 7.
10
TeV
Fig. 3. Integral energy spectrum of showers at vertical depth of 850 hg/cm of rock. The dashed curve indicates the expected one.
the one at sea level i s given by evaluating the diffusion equation of muons in the ground, whose analytical solution so far is not available. The expected curve shown in Fig. 2 i s drawn as the results of numerical evaluations. The spectrum of muons at the present experimental site i s estimated by ronsidering the zenith angle distribution of muons at sea level and the solid angle for various depth and zenith angle, and thereby the expected spectrum of showers is given.

97
Fig. 3 shows the spectrum of showers, in a comparison with the expected one from the spectrum of muons at sea level measured with the emulsion chamberu exposed at shallow depth. As shown in the figure, although poor statistics, the present results indicate in good agreement with the expected curve, in the energy region above 0. 5 TeV. The threshold energy of shower detection without any bias is to be less than 0. 5 TeV. At the next step of the observations, the consistency of the observed spectrum with the expected one would be investigated more precisely with the emulsion chambers of larger size.
Acknowledgements. The authors are grateful to Dr. K. KaSahara, Professor I. Mito, Dr. A. Ohsawa and Dr. T. Yuda for their valuable discussions. They are deeply indebted to the members of Administration Office of Okutadami Road Tunnel for assistance.
References. [1] M. Akashi, Z. Watanabe, A. Misaki, K. Mizutani, T. Shirai and
Y. Takahashi; The 14th Intern. Cosmic Ray Conf. , Conf. Papers, 6, 2037(1975).
[2]S. Miyake; The 13th Intern. Cosmic Ray Conf. , Conf. Papers, _5> 3638(1973).
[3] T. Kitamura; The 14th Intern. Cosmic Ray Conf. , Rapporteur Talk, MN, (1975).
[4] K. Mizutani and I. Ohta; The 14th Intern. Cosmic Ray Conf. , Conf. Papers, 6, 1900(1975).
[5] P. H. Barrett, L.M.Boll inger, G. Cocconi, Y. Eisenberg and K.Greisen; Rev. Mod. Phys. , 24, 133(1952).
[6] J. Nishimura; Prog. Theor. Phys. , Suppl. , (32), 72(1964). [7] K. Mizutani, T. Shirai, M. Akashi and Z. Watanabe; The 12th Intern.
Cosmic Ray Conf. , Conf. Papers, 4, 1392(1971).

98
EXPERIMENTAL IXVrSTlGATIGJs 0.- VHF Ml,0\ RANf..-. MJK.'. W. R. Sheldon atiu J . R. Hcnbrook
Phys ics Department, U n i v e r s i t y ol" Houston, U.S.A. -..d
N. M. Duller -nd l\ J'. Green Physics Department, Texas AÜM University, U.5 A.
and A. R. Bazcr-Bachi and Gilbert Vcrdrcnnc
C.E.S.R., University of Toulouse, France
iiciirctical ! ' Expcrinvni.; ,... l ' t u 1 '
COSL'..>: r -y secondary nsuons can he used for cxperiir.er.tai i r .wr t . , t.> is i :" ener^: loi.s processes by charged pa r t i c l e s fron energies of a f< v. ... v to »cvcral :\\'. However, the straightforward approach to t h i s p.-oMcm, i . e . • d i rec t ;or.;iar -son of surface spc" ..oniecer moasurui.ients LO UI«! w . . u l.i-vcnsi t i»s bec-oroes tenuous a t energies above several tens of ilcV largely due to uncertainty introduced by normalizing the spectrometer rr.iT.-.i.rcæcr." s. :.ero an a l t e rna t ive method of evaluating the muon rangö-cr.Ti.y relr.r ion, 'i.-soi'. on . r.guisr enhancements, I ( e ) / I ( 0 ° ) , i s applied to data .'.-or; the French - J. £. Mor.t Blanc experiment and to other determir.acior.s of t.-.e underground muon in tens i ty . These r e su l t s are compared to those which are obtained b / d i r e c t l y comparing surface i n t ens i t i e s to underground in tens i t i e s . Final ly i t i s noted tha t angular enhancements and absolute i n t ens i t i e s obtained solely from underground data yield a surface nuon energy spectrun v.viich docs not depend on the muon range-energy r e l a t i on . Since spectrometers axe not involved in t h i s determination, t h i s approach f a c i l i t a t e s an independent evaluation of spectrometer instrumental e f fec t s .
Coordinates: MN 2 .2 . (Muon Production, Decay and Interact ions}
Mailing address: Professor W. R. Sheldon Physics Department University of Houston Houston, Texas 77004 U.S.A.

tCMØCÆct 99 V
COSMIC RAY INTENSITIES AT SHALLOW IiEITüS.
J.C.Percy and I.W.RoRerü
The Polytechnic of North London,London,N7 HD8, U.K.
Measurements of the cosmic ray intensity f.a-'e been
made using a scintillation counter telescope at
various depths under water down to 12.5 m, and
underground at a depth of 60 hg cm . Comparison
of the observed pulse height distributions from the
counters and distributions obtained using Monte-Carlo
techniques lead to values for the absolute vertical
intensities at these depths.
Introduction
This paper contains a description of apparatus which has been
designed and built to measure the absolute intensity of cosmic
radiation underwater. Also presented are the results which have been
obtained during a series of test experiments both underwater, down to
a depth of 12.5 m., and at a depth of 6l.6 hg cm underground.
Apparatus
The apparatus, figure 1, consists of seven cylindrical plastic
scintillation counters arranged in a hexagonal matrix. Associated
with each counter is a logarithmic ringing coil encoder so that whenever
an event occurs which satisfies the coincidence requirement indicated
in the figure the pulse heights from all of the counters are recorded
in digital form on magnetic tape. Also recorded on the tape is a
timing mark which is produced at approximately ten minute intervals by
an accurate clock.
In order to reduce the amount of data recorded while at the same
time detecting a statistically significant number of events, a facility
is included in the control circuitry which allows the recording of
either every event (the direct mode) or every fourth event (the divide-
bv—four mode)•

100 The apparatus is completelj self-contained, electrical power
being obtained from sets of batteries, and fits inside the cant aluminium pressure vessel shown in figure 1.
cast aluminium
Selection criterion A.(B+C+D).(E+F+G)
Figure 1. Th'j underwater apparatus.

101 Preliminary Experiments
Since its construction the apparatus hau been tMt'd by brinp operated both underground and underwater, the data fron these lefts bein<r used to derive the intensity of the cosmic radiation rst the teat positions.
The underground tests, which were carried out in the Holborn Laboratory at a depth of 6l.6 hg cm eclow sea level, were intended mainly to check the overall behaviour of the apparatus by comparing the measured cosmic ray intensity with the value obtained by Wright (iVfO. They were also used to determine the compatibility between data obtained in the direct mode and that obtained iri the divide-by-four mode.
The underwater tests, which were used to obtain experience of the use of the apparatus under field conditions, were carried out at Hanningfield Reservoir, Essex (courtesy of the Essex Water Company). Although the reservoir is relatively shallow, the maximum depth at the time was 12.5 m, it has the advantage of being conveniently situated with respect to the Polytechnic.
Results and Preliminary Analysis
The results obtained from the test experiments are presented in table 1 where the events are separated into a number of types as follows: Multiple events - events with more than three recorded pulse heights.
These are believed to be produced by incident showers and interactions.
Low/incomplete events - those events with less than three pulse heights recorded or with two or more low pulse heights, believed to be accidental coincidences.
Vertical events - events showing pulse heights only in counters C, A and F.
Comparison of the results obtained during the two experiments at Holborn indicates that there is no apparent bias introduced when going from the direct mode to the divide-by-four mode of recording. This being the case the underwater results,which were all obtained in the divide-by-four mode, should present a true picture of the types of event occurring and the relative probabilities of these.

HOLBORN HANNTNGFIELD (all f 1*)
direct • 1* 0m 5m 7.5m 10.'••n 12.5.1 • Lengt/i of run, s l*.l6 10 3 ,- 1*
1.67 10 1.17 10 3 5.90 10 2 ] .18 10 3 1.18 10 3 2.97 10 3
Mo. of recorded 1016 1057 9h8 310 555 1*39 850 event3
No. of multiple 139 11*6 1>*5 31 76 60 98 event 3
No. of low/incomplete 229 22J* 1*7 17 17 16 27 event 3
No. of vertical 260 225 261 87 lit 7 120 2 32 events
Vertical rate, s (6.25+0.39) (5.39+0.18) f8.92tO.28) 15.89+0.32) (U.98+0.21) (h. 07*0.19) '3.12;0.10) -2 x 10 X 10 x 10 _ 1 x 10 _ 1 x 1 0 _ 1 x IO" 1 x IO" 1
Intensity (6.56±0.l*o) (5.66±0.19) (9.37±0.29) (6.20+0.33) (5.23+0.221 (1*.27?0.?C) 3.28+0.1; ) -1 -2 -1 s cm sr - I t
x 10 -1* x 10 x 10~ 3 x lu x 1 0 _ i x 10~ 3 , 1 ^
Table 1. Experimental Data and Measured Intensities.
•corrected for dead time

icn
To obtain the value» for the vertical intensities quoted in the table, the rates quoted vere divided by the aperture of the vertical telescope. This vas calculated using a Monte-Carlo oiaulation of the
2 ? apparatus with a cos 8 distribution ard found to be 95.2 cm ;r.
Comments
The measured intensity at Holborn reported ht«re is approximately lOyC greater than_ that reported by Wright (1973). Possible causes for this discrepancy are being investigated during a critical analysis of the data which is in progress. This analysis makes full use of the pulse height information from the apparatus and from Mo.nte-Carlo simulations, and will also consider data from the other possible telescope combinations.
Reference
Wright, A.G., 1973, Proc. 13th Int.Cosmic Ray Conf.(Denver) 3, 1709-1711».

104
Angular Distribution or Ruona batvaan «U00 • 9000 hg :• ».r.
L. Barganaaco, 6. Baachiar», c. Cattagnoll, B. a'Cttetra
Piazzoli, G. flannoscchi
Laboratorio di Cos»o-geofiaica dal C.N.R., Torino
L. Bilokon, P. Picchi Laboratori Nazzionali dal C.N.L.N. - fi-atcati
Mesults obtained with the Spark Chambers situated in the
Itont Blanc Laboratory are elaborated in order to obtain an
angular distribution of mucins as a function of depth. The
maximum zenith angle is ^ 6 0 , the depth is between 4U00 and -2 9000hg cm s.r.
H comparison with theoretical results, taking into account
the primary spectrum, the hadron interactions and the energy
losses in the air and in the rock, is discussed.

105
Muon Intensity at bin Level with Clash Tutoi. «Li .»tu» S. Ale»ai.o( B. Baschiura, C. Cattagnoli,
6. D'Ettorre Piazzoii» li. flannocchi
Laboratorio di Cusmo-geofisica del C.N.H., Torino
I . Bilokon, P. Picchi Laboratori Nazionali del C.N.C.N. - Traacati
r
An apparatus for the measurement of muons stopping by means
of 330 flaah tubes (1400 x 2 cm 2) and liquid scintillator
(750 liters) has been built.
With this arrangement a measure of the spectrum and of the
absolute intensity of Lt at lou energy (<4Q0 HeV) at sea
level has been performed.

!06
AMUJLAB Mnammwmor um natar mow AT A ocrn or 4« ag «•"• «MSBMBOUMD
».». Ihat aaaW.W. • • • M I , Matty
*ptk af ill kg am"* aaiargffaaai a* Briar 0*14 rteUa tow aaaa aaafMa«.
Thaprajaatoé aaattaaagtoafaaaaavamtaataaaMtoraataaiaaaafBlaa
444 Utra MajaM aatoHHataréatoatar to awaaaiaa aatog Waaa Flaafe. Tafca
•nay«. A acilaa aavar lav af taa typa aasH hu aaaa aaaaaaai far tha
aaatta aagla éaaaaoaaaa af atapptog araaaa aaå aaaajarai «Ha tha tfata. Taa
feaatfltvatBaaftBaaayaaaat, a, afthaaagalar«totrftattoatol.lt• 0.H,
Tnai !•!• • • ! ••• f inlaai alaiiTllana ai fliaii if rtajilag aiaaia. wa
aaii grawi ripartaiaatal JaUlla aai tai raaatta alll aa Étoaaaaai.
YggÉga. hgpftttBnYj gtof V ^ _ _ W p j j _ _ w f KgaMBgWHaV

107 -\ THEORETICAL STUDY OF THE POSSI b . LITI ES FOR LOCALIZATION OF
ANOMALOUS DENSITY DISTRIBUTION IN ROCK BY MEANS OF UNDERGROUND COSMIC RAY MUON INTENSITY MEASUREMENTS
by
L. Jacobsson, G. Jönsson, K. Kiistiansson and L. Malmqvist, Department of Ph- sics, University of Lund,
Sölvegata.i 14, S-223 62 LUND, Sweden.
The possibilities for in situ rock density determinations by means of subsurface cosmic ray muon intensity measurements have been studied. The calculations are based on at hypothetical scintillation counter telescope intended for registration in a gallery.
It is shown that fairly accurate density measurements are possible and that a certain spatial resolution can be achieved. The measurements are only influenced by the density distribution in the forward direction which can make the muon technique valuable in connection with gravity measurements.
Different prospecting situations have been studied. It is found that in certain prospecting situations the accuracy needed *or
the indication of a massive ore body can be reached within an acceptable registration period.
Introduct ion Rock density is a fundamental physical property of the ground used in geo
physics. Information about in situ density and density anomalies can be obtained from gravity measurements which are also extensively used to solve structural problems in geology and in ore prospecting. The limitations of gravity measurements make it very important to explore other physical phenomena with potential possibilities to measure rock density.
Subsurface registration of the cosmic ray muon intensity offers such a possibility of absolute in situ rock density measurements if the level of observation below ground is known (Malmqvist et al. 1977a). Bondarenko et al. (1974) show an application of the muon method in the case of high background activity.
In this report we discuss the possible use of muon technique for in situ rock density determinations. Our calculations are based on a simple hypothetical counter telescope intended for measurements in mine galleries. The technique is also applied lo suiue special cases to localize a body with an anomalous density within the bedrock.

108
The detector
Ld
t SEZZZZZZZ3 []=> Z Ab:^:^^:: ;:fe,'::.!:!^'|::|
' s I / / / s y / / 7 A [ ] z> 0.75 m - Ld
Ps
Ps
Fig. 1. Principle of the muon telescope. It consists of two plastic scintillators (S), light detectors (Ld), a coincidence circuit (Coinc) and a power supply (Ps). Events in coincidence from the two scintillators are amplified and recorded. An absorber is placed between the scintillators to prevent locally produced radiation to reach both scintillators.
A sketch of our hypothetical gallery detector is shown in Fig. 1. The telescope is composed of two scintillator plates each of an area of 0.75x0.75 m 2. The space between them is arbitrary but fixed to 0.25 m in the calculations discussed in this report. An absorber is placed between the two scintillators to discriminate against local radioactivity. The size of the plates and the distance Z between them determine the geometrical aperture of the telescope.
Relations between intensity, depth and density With our detector we intend to measure the density of overlying rock or
the rise in mean density caused by an ore body with anomaleus density. A unique relation between muon intensity, depth and density exists for
depths down to approximately 600 meter below surface. Measuring two of the parameters the third can be calculated.
As an example the relation between intensity and density at approximately

109 D*i\tily
2.60-
700
1 (purticles/doy)
4-0 800
Fig. 2. The relation between intensity and density at 370 m depth for che gallery detector in vertical position.
200 400 600 (m standard rock) -« r> • . »
- 3 - • .2 , 1000 2000 (X10 kg/rr/)
Depth
Fig. 3. The relation between the relative change in intensity to the relative change in density as a function of depth.

no "O m level is shown in Fig. 2 for the telescope in a vertical position. This figure shows that ;i small change in density means a considerable chanRc in intensity. The relation between the relative change in intensity and the relative change in density at different depths is shown in Fig. 3. It is remarkable that for example a 11 change in density at 200-400 m depth corresponds to approximately 31 in intensity.
Detectability of a density anomaly within a geological formation The mean density of overlying rock within the sensitive solid angle of the
telescope can be calculated from the intensity measured. The accuracy in this measurement depends on the number of events recorded which has to be transformed to density by means of the intensity-density relation. The rise Ap in mean density p caused by a massive ore body in the bed rock can be identified if the mean density in the direction of measurement is measured with sufficient accuracy compared to Ap and if the mean density p of the side rock is known.
The detectability of an anomalous body which contributes to an increase in the rock density by Ap is defined in the following way. The object is said to be detectable in a measurement when the number of recorded events are sufficient to calculate the mean density with a standard deviation equal to Ap. The registration time needed to reach that level is called the minimum registration time.
Calculations of the minimum registration time for some different geological situations are carried out. The calculations postulate the existence of a massive sulphide mineralizations with a density 3.7 g/cm3 which means a density contrast to surrounding rock of 1.0 g/cm3.
The cosmic ray muon meajurements can be made with high accuracy. From the geophycisal point of view, however, we think that an accuracy much higher than II may not be significant since the uncertainty in the host rock mean density might be of that order.
Results We have chosen to illustrate our results by reporting the calculations of
the minimum registration times that are needed to find a thin sheet-like deep--seated ore body of a certain size. The ore body is supposed to start at 100 m below the surface. The reason for this choice is that an outcropping ore should have been localized by means of geophysical measurements from the surface. The depth for the dipping body is not limited. The calculations are made without

I l l
UNDERGROUND ANTICOINCIÜEKCt STODIES.
J.C.Barton, R.Riley, I.W.Roifcra.Å. J .Paraonn, A.G.Wright
The Polytechnic of North London,London,N7 SDB, U.K.
The recording system uaed with the Holborn 1 a
scintillation counter, which is surrounded by
anticoincidence counters, has been modified by the
addition of a linear gate so that muon decay events
can be studied in detail. These results help to
establish that the overall performance of the
apparatus iB satisfactory. The anticoincidence
inefficiency for 100 Mev events is less than O.OOlJ.
An excess of time-correlated events at times of less
than 500 usee has been confirmed; no satisfactory
explanation has yet been found for these events,
which occur at a rate of about 5 day .
Introduction
At the Munich conference Barton et al (1975) reported the
construction of a large volume anticoincidence detector at a depth
of 6l.6 hg cm underground and presented the early results obtained.
Since then the recording system has been modified by the inclusion of
a linear gate so that muon decay events can be studied in detail. This
paper contains a brief description of the apparatus and the results
obtained to date.
The Apparatus
The anticoincidence detector, figure 1, consists of a 1 m
liquid scintillation counter (the main tank) with five overlapping
scintillation counters arranged as an anticoincidence screen around it.
The space between the main tank and the screen contains 5 cm of absorber
as shown.

112
553
fc'jl n5uu Ic.nt.tUtor
Figure 1. Section through apparatus.
When the apparatus is active the recording cycle is initiated by a trigger event from the main tank which fulfils the externally imposed selection criterion e.g. no anticoincidence pulses and a main tank pulse height greater than some threshold value. During this recording cycle the information recorded includes not only the time of the trigger event and the pulse heights in the main and screen tanks associated with it, but also the times of any one event occurring in the screen tank within 32 us before the trigger, and up to two events occurring within 32 us after the trigger, these times being accurate to ± 0.25 ps. By including a linear gate in the recording circuit it is now possible to record the height of a second puis* from the main tank. This means that muon decay events can be recognised and studied, thus providing a check on the operation of the apparatus.
Preliminary Results a) Anticoincidence Inefficiency
One of the major advantages of this apparatus when compared with other anticoincidence arrangements is the short, 1.5 us, anticoincidence gate time combined with the ability to provide accurate pulse height and timing information for events occurring within ± 32 us of the trigger event. Although the short gate time results in the recording of events

113 other than true anticoincidence events, (using all of the available inforaation) these events stay be rejected during the data analysis to give a better estimate for the anticoincidence inefficiency. The aeasured event rates without anticoincidence are compared in table I with the rates with anticoincidence after data analysis and anticoincidence inefficiencies quoted for a number of main tank türeshold energies. Frost this it can be seen that for anions, energy threshold of 100 MeV, the anticoincidence
. . . -U inefficiency is less than 10 .
Table 1. Anticoincidence inefficiencies Threshold Rate,events sec Anticoincidence
Energy,MeV No Anticoinc. Anticoinc. Inefficiency 6 19.6 8.9 1 0 - 1 l*.6 10~*
lU 18.5 1.8 1 0 - a -1» 9.7 10 36 16.6 k.2 10" 3 -It 2.5 10 • 90 13.2 9.6 10-1* 7.3 10" 5
b) Muon decay events During a short, 6 hour, run without any anticoincidence
requirements and with a main tank threshold energy of 6 MeV a total of 15000 events vere recorded having a second pulse height from the main tank. These have been shown to be a mixture of accidental coincidences and auon decay events. Further analysis of the latter events leads to a value for
••2 —1 —1 the rate of stopping unions in the apparatus of (2.5 ± 0.3) x 10 g day , in good agreement with the valu. observed at the same location by Barton and Slade (1965).
c) Short time interval events As part of the analysis procedure it is normal practice to
determine the distribution in time separations between recorded events as a check upon the recording system. As reported at Munich one result of this procedure vas the discovery of an excess of events at small time separations , less than 500 us (Barton et al, 1975). Since the installation of the linear gate this excess has been confirmed and there are also indications that the excess increases as the main tank threshold is decreased and also that the excess extends to time intervals beyond
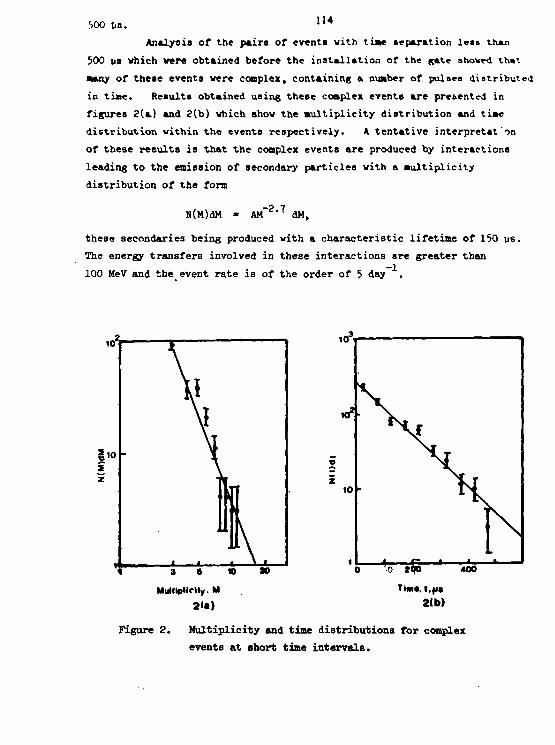
5>00 ba. " 4
Analysis of the pairs of events with tiae separation lets than 500 us which were obtained before the installation of the gate showed that •any of these events were complex, containing a number of pulses distributed in tine. Results obtained using these complex events are presentcJ in figures 2(a) and 8(b) which show the multiplicity distribution and ti»e distribution within the events respectively. A tentative interpretat'^n of these results is that the complex events are produced by interactions leading to the emission of secondary particles with a Multiplicity distribution of the form
S(M)dM -2.7 AM ' dM,
these secondaries being produced with a characteristic lifetime of 150 us. The energy transfers involved in these interactions are greater than 100 MeV and the event rate is of the order of 5 day .
Multiplicity. M
2<a) Tim«, t,fit
2(b)
Figure 2. Multiplicity and time distributions for complex events at short time intervals.
Reference» MS
Barton, J .C. , Carter, P.D., Panon*, A.J., Rogen, I.V. and Vriitht, A.C., 19T5, Proc.lUth Int.Conf. on Cosmic Ray» (Munich), 6, 2155-2160
Barton, J.C. and Slade, M., 1965, Proc. 9th Int.Conf. on Comic Ray» (London), 2, 1006-1008.

116 DEEP UNDERGROUND AND UUDERSEAS STOPPING PARTICLES AND THEIR POSSIBLE RELATION TO PRIMORDIAL SUPERHEAVY ELEMENTS
P. Kotz«r and R. Lind*ay, Western Washington Stat« Collegi S. Anderson and J. Lord, Univ. of• Washington K. Stehling, NOAA
Theoretical Q Experiment»! Q Both Q
Observations have been made to isolate the source of extremely rare stopping particle tracks found at depths nearly free of cosmic ray background due to muons. Some of the particles observed in emulsions arc alpha particles of energies considerably higher than can be associated with known natural radioactivity or, orders of magnitude more abundant than to be connected with ternary fission. Counter measurements of isotopes of uranium, polonium, and bismuth failed to show any evidence for the observed tracks. Scanning of an emulsion pellicle (no glass backing during exposure) and a thorium loaded plate failed to reveal other examples of the anomalously long range alpha particles. Similarities in the rare earth content of Gentry's monazite inclusions and the mounting glass used in our first exposure do not rule out the existence of new phenomena (primordial superheavy nuclei) as possible sources of these anomalously long range alpha particles.
Coordinates: MN 2.1 Measured Muon Intensities
Mailing address:
Dr. Steven N. Anderson Department of Physics University of Washington Seattle, Washington 98195 U.S.A.

117
Mf mMLUNTJO* OF W O I M O a i M JNTOlAcr»N m U C l U V B N t •0». OOWIC KAY KXWRIHMTS
N.L.K«r«ak«r and M.Cheudnurl
Department of physios, Univraity of North »*ng*l, Tndti
Th» di f ferent theoretlaal treatment for th« moon-nuclear lntaraotloa eros* section UAV« bean e r l t l o a i i y «x«raln*d with a view to ev*lu«tio? than« a« used In th» fc^alysis of aosatlo r»y a*p*rimants on Muon-nucia*r interact ions . Th« «ar l l«r tocwuiatioua including t h e * based on en« fore factor formalism hav« i>*sn ev?ljat«d in Ä>.v»rlx>r» with t:w predict ions from th* mora exact fom- ia t iona v hl eh heva a lso boon used in th* aa*lys ls et *ci«l«r*tor «xperlmtnta on th« daap i n e l a s t i c suoa-nucleon saat terLi j . Th«»« l a t e s t cross sect ion formulae h*v« b*«n numerically evaluated In the hedronllK» noda of interaction of virtual photons with nueleons unl*r vector mason domtnar.ee mo 3*1. Cc-tR>arl3on of th« predict ions fro« th«»« formulations and with sxparimants 1« duecuised. Th« f e a s i b i l i t y o f dist ln^ulahlnj by cosmic ray measurements th« form factor based fcmalaticne J a a th» «or« exact ca lcu lat ions i s considered.
W? 2. 2 ( men rrc duct Ion, Decay and interact iona )
professor S. 3heudhurl. D*partm>mt of Physics University of Sørth B9'>jai Dt. oarjeeling» **«t senj«! , tndl«

118 »»clear Infraction Cross Section of Co—lc Kay Huons »att—tad fro» the results of tha accelerator «xperl—nts
Takashl Kltaaura Coaalc Ray Laboratory, Unlvaralty of Tokyo, JAPAN
Abstract
Disceeeleg about recent expressions for interaction cross section of Chin and Botjf me Petruhkin, we ahowed their values of structure function for \«2 to be email eeaaared with the accelerator data. So, we obtained an expression with tha vela* for VH2 which is consistent with the accelerator data. However, a* «ela**- for the bn-term obtained fron the expression are contradict with •MawTfta value for the b n-tem, we ahall derive another expression in a 2 reaion of saall a, . Both expressions will be discussed and compared with the observed cajMlc ray anon results with large energies transfered.
1) Intro+Ktlen. Theoretical expressions for nuclear interactions of cosmic ray muons
have beea give*, by a lot of investigators . But, recent experimental results of leptoo* la accelerators are not much utilized yet in cosmic ray muon field. In this payer, we shall ~pply Drell-Walecka expression ' to cosmic ray muons fields, ««leg valuae for structure functions Wi and W 2 which have been obtained from th* exmerlaeetal results of accelerator electrons and muons beams.
2) Preview emroeelon* for Interactions cross section. leeeat expressions for nuclear Interaction cross sections used in cosmic.
ray muon* field* are Chin (DKMN) expression" and Borog and Petruhkin expression' Their calculated value* for bn-term obtained from both expressions arc shown in Table 1.
Table 1
bn-value (at 1000 GeV muon energy)
Chin 4.67 x IO"7 cm2/g (with^l.25 x 10" 2 8cm 2/ nucleon)
Petruekla et el. 4.48 x IO - 7 cm2/g (with*** 1.0 x I O - 2 8 cm2/ nucleon)

119
The neaaured valu« ha* been given aa nearly conatant with a value of (4 -
5) x 10 - 7 cm2g~' In a region of 100 CeV to 2 T*V of muons 5). So, the valu«
for bn-teraa obtained from both expreaalona seems to be conalatant with Che
measured value. However, behaviours of vW2 ontalned f roa both expreaalona are
different from the accelerator data 6) as shown in Fig. 1. The data arc in a
case of aissing Bass W i. 2 (GeV/c)2 obtained by SLAC electron beaa and, for a
region of q 2$ 0.12 (GeV/c) 2, the recent experimental results with transfered
energies, v, of 2.0 to 8.45 G«V obtained by Elckmeyer et al. 7) are also added.
These values sees to be connected rather smoothly with the other valuea of
q 2 > 0.12 (GeV/c)2 and also not contradicted with the data of 12 GeV accelerator6)
muons within large statistical errors though. From the figure, It is found
that both expressions of Chin and Petruhkin et al. have rather smaller values
of structure function vW 2 than the accelerator data have given.
3) Present expression for Interactions cross section.
We shall try to get the expression for cross sections having the structure
function which is consistent with the accelerator data. Using the experimental
results of R » oi/tft =
0.186> which has shown by the accelerator electron beam,
one can get the following expression by substituting W2 for V\.
4— ~ * # f I W2 cos2 f + 2WX sin
2! 1 dq^dv" " ~~q*~ E 0
l
Aw 2 I 5l r 1 + -i_ / 50. 4. 51 «1 „11 m
where V - Eo - E',
R » ai/at.
To be consistent with the accelerator results of shown at Fig. 1, the following
expressions for vW 2 are given as
vW 2 - 0.34 in q 2 i 1.4 (GeV/c) 2,
vW 2 - 0.307 ( q2 / M 2 ) 0 " 2 5 9 in 1.4 > q 2 5. 1.0 (GeV/c) 2,
vW 2 - 0.308 ( q2 / M 2 ) 0 ' 2 7 6 in 1.0 > q 2 » 0.6 (GeV/c) 2,
vW 2 - 0.324 (q2/!! 2) 0- 1* 6 7 in 0.6 > q 2 * 0.12 (Gev/c)2, ( 2 )
vW 2 - 0.716 ( q 2 / M 2 ) 0 - 8 7 2 in 0.12 > q > 0 (GeV/c) 2
Using the expressions (£) and (Ä), we shall get the total cross section with
larger transfered energies than v as follows,
o (>v) - »a 2 [ 6.462 (In E 0/v - E ° E ~
v ) + 2.851 ( E ^ V* )
- ° - 7 2 3 ( ^ - | 0
) + 2 i p l n E ° / v ' ] ( 3 a )
in q 2 1 0.12 (GeV/c) 2,

120
o (>v) - »a2 [173.6*8 (E 0/\>) 0- 2 5 6 + 69.406 (v/E0)°- - 237.109 + 32.802 ((E0-v)/E0 - In E0/v} - 19.329 (v/E0)' •'""' (Jb) + 1.757 (v/Eo)2-71"' + 13.899 (v/E0)2]
In 0 < q 2 < 0.12 (CeV/c)2. Here, each .nergy Is expressed by a unit of GeV. In this case, however, a calculation of the bn-value using the expression (2) for vW2 give a value of the bn-term as 2.98 x 10~6 cm /g at 1000 CeV auon energy that is very large compared with the Measured value mentioned above. In general, the value of the bn'tera vould be auch affected by values of vW2 in a region of very small q 2 -valuea as <,0.1 (GeV/c)2. So,if another expression of 1.66 (q 2/*! 2) 1* 3 for vW2
Is adopted In a region of 0.12 > q 2 > 0 (GeV/c)2, the bn-value In this case Is obtained as - 5.0 x 10~ 7 ca2/g which does not contradict with the measured value. In the case of this expression of 1.66 (q2/M2)->3 for vW2, the total cross section is given by
o (>v) - iro2 [13.828 UnE 0/v - (E0-v)/E0 + 5.859 (EQ -v2)/Eo - 8.336 + 4.600 (v/E 0) 0- 6 - 2.967 (V/EQ) 1- 6 (4)
"fTTT^v^AEo-v^.Sdv ° in 0 < q2 < 0.12 (GeV/c)2.
In three cases of vs. 10 GeV, 100 GeV and 1000 GeV, two behaviours of the total cross section are plotted with a real line of ( q 2 / M 2 ) 0 , 8 7 6 for the expression (3a) + (3b) and a real line of (q^M 2) 1« 3 for the expressions (3a) + (4). From the figure, it is clear that dependences of incident muon energy Eo of the real lines of (q 2/M 2) 0« 8 7 2 and (q2/*!2)1»3 are similar as those of Chin and Petruhkin et al., respectively, but their absolute values are about two times larger, and values of (q 2/M 2)l* 3 and of Petruhkln et al. are getting closer as transfer energies increase
4) Discussion and Conclusions. We shall compare the present expression with some observed results of cosmic
ray muon Interactions with large transfer energies as shown in Table 2. The observed rate of Otaka City University group9) has been obtained by a vertical observation of calorimeter at 40 mwe underground and one of Petrubkln et al.1*) by a oblique observation of calorimeter at sea level. Horizontal air shower which at first has been found INS group10) suggests, a nuclear interaction of a auon with an energy of more than 3 x 10¹¹* eV. In cosmic ray experiments, it is very difficult for determining absolute value of production croas section because of aabiquities of the cut-off threshold energy. So, we cannot assert definitely but we assume from the table that the observed v«lue with large transfer energies may be close to the expression of ( q 2 / M 2 ) 0 - 8 7 6 , whereas one

121 with email transfer energies which attribute to the bn-term Is rather fit to the expression of (q2/M2)'"' . In order to make sure this, lc Is most necessary to observe nuclear Interactlona with simultaneous measurement» of Its Incident muon energy and transfer energy.
MUTRON1') which consists of two big magnetic spectrometers and a big calorimeter between them Is able to do It.
Table 2.
observer tranafer energy
V
observed x 10 3 0 cm2/nucleon
expected with ( q 5 / M 2 ) 0 - 8 7 6
x 10 3 0 cm2/nucleon
expected with (q 2/»! 2) 1- 3
x 10 3 0 cm2/nucleon
OCU > 20 GeV oJ).09 o.9ol5;ii 0.84 0.43
Petruhkin et al.
* 250 GeV 1.30 + 0.08
using A - 56 1.77 ± 0.11 using A « 41
1.08 0.60
INS > 300 TeV
100 (one event)
1.41 0.J9
References
1) See, Y. Minorikawa: CKJ report-17 (Cosmic Ray Lab. Tokyo University) (1974).
2) S. D. Drell and J. D. Walecka: Ann. Phys. 2J3 18 (1964). 3) S. Chin: Dr. Thesis (Osaka City University) (1973).
K. Daiyasu, K. Kobayakawa et al.: J. Phys. Soc. Japan Supple A3 344, 367 (1962).
4) V. V. Borog and A. A. Petruhkin: Proc. 14th I.C.R.C. 6_ 1949 (1975). 5) For example, K. Kobayakawa: Proc. 13th I.C.R.C. 5_ 3156 (1973). 6) For example, B.C. Barish: CALT-68-477 (1974). 7) J. Eickmeyer et al.: Phya. Rev. Lett. 36 289 (1976).
Phys Letters 63B 104 (1976). 8) T. J. Braunstein, W. L. Lakin et al.: Phya Rev. D6 106 (1972). 9) S. Chin, Y. Hanayana and T. Hara et al.: Acta Physica Academlae Scientiarum
Hungaricae 29 Suppl. 4_ 59 (1970). 10) T. Matano, M. Nagano and S. Shlbata et al.:Phys. Rev. Lett. 15 594 (1965). 11) T. Kitamura, K. Mitsui et al.: Proc. 13th I.C.R.C. 3 1962 (1973).
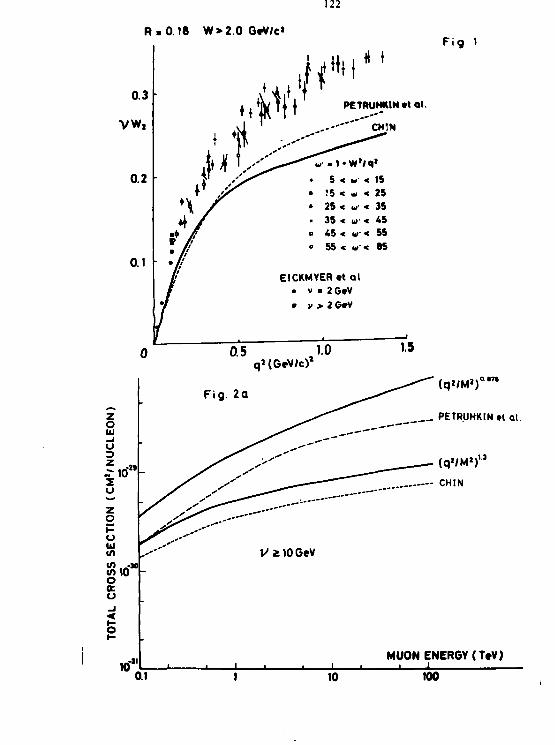
122
R.O.IB W>2.0 G*V/c«
PETRUHKIN •« al.
' CH!N
Fig 1
• 5 < w < 15 • !5 < w < 25 » 25 < «• < 35 • 35 < w < 45 o 45 < w < 55 o 55 < w < 85
EICKMYERct al • v • 2G»V • v > 2 OeV
0.5 1.0 q*(GeWc>2
1.5
^ - ^ " (q ' /M 1 ) " 7 * F g 2a ^ —
z ^ ^ ^ ^ PETRUHKIN et al . o j / ^ . _ — — — " "
UJ ^^^ —p<-. ———*** _J * ^ —'-*'"-' (J ^ ^ ^ ^ ^ » ' • * * * * * '
3
„-Io" / > ' " ' ^ ^ _ _ _ _ ^ (q'/M l ) u
r ^ o / y «IM* ^ * S * z S ^ » - * • * • " " * " * O
ll - -u 111 w ** ValOGeV tf> _-J0 «nlO O a o _i < t-o »-
id" i | MUON ENERGY (TvV)
- l i i l i i 1 ai to too

123
Z o ili - J
u £ KJ' z u
z o
u m
«A 10 o K U
K>
Fig 2b
V *100G*V (q»/M , ) ' w *
PETRUMKINHoi
(q'/M»)" CHIN
MUONENERGV (T*V)
Ü1 10 100
z o UJ
u 3 Z -» ~io" z o z o
u Ul <n .JO
gio
Kfl
F ig . 2c V i. 1000 GeV
-^ (qi/M*)"'«
. ^ ^ ^ - PETHUHWN «t al.
-
/ 4 $ * ^ _,. CHIN
-
/
• . I HUON ENERGY(TeV)
• i i i i i
0.1 10 100

124
THE NUCLBAR BORST LOSS PARAKITBt B,, POR HOOKS
W. Conatandt, V.D. Dau Inatitut fttr Kernphysik, UnlTeralty Kiel,
Pad. Republic of Oeraany
Tha nuclaar interaction of auona la treated on the baala of tha Hand reap. Drall - Valecka expression. Tha nuclear energy loaa paraaatar bn In tha energy loaa relation la calculated f roa the atructure functlona W 1 and vW 2, aeaaured in inelaatic experiaenta of charged leptona in high energy accelerator experiaenta. Ve will coapare and dlacuaa the results with ones froa coaalc ray auons.

us •OCUUR XKTBUCTIORS Of COSMIC RAY M X »
A Dlekaann, V. Staat, A. Blokar, V.O. Dau, H. Joklech, K. Caratensen
Inatitut fOr Keraphyalk, Qnlveralty Hal, Fad. Republic of Qeraany
Va atudletf tha nuclear Intaraetlona of aoaantua tagged eoealc rar anona (1Sp5600 ftef/e) In a aaapllng total absorption eaiorlaeter (280 g/ca 2). On tha basla of 20 000 caloriaeter triggers tha nuclear Intaraetlona hare been aaparatad froa the Knock-on, pair production, breaaatrahlung proceaaea. Tha photonuolear eroas section, the angle and energy distribution of the secondaries are presented and dlacuasad.

126 KlMtroMCMtU UM tool«* latttMtlaaa
• f Ooaal« Ray Mama
t . U M l l M l i 8.V.AlMMWMn«t KU.UUUIM, «.t.MlaMjma, U X . K M U M T , i . r . h r ^ i t a w « , V»!*XrOMMWVf K*K>fy#dMTCW( A«A«CaUuMjn4Mi
r««««« r rsiM iwtitat«, A M I I , OUR
fh« 10 • 1000 0t?/« « i r f f TCdoi in Mid n y « M M !•*•*»
firta t I H « plat«« «f 10 »•! • «Mh «at • « la***» •*• •*•»••

127 tHB STUDT OP VOI-IUSTIC DTTBRACTIDI 07 * 0.6 TeT ERKROT HTOIS WITH mo» 1IUCIK
V.A.Aglamesov, L.D.Gedevanishvili, I.I.Sakvarelidte Tbilisi State UniTereity
1, Chavchavadse Ave., Tbiliei - 380028, USSR
The paper deals with the analysis of cascade showers of 0.3 TeV energy produced by cosmic ray muons during their interaction with iron nuclei. The analysis has enabled to separate the cascade ehowere produced during electromagnetic and during nuclear interactions of muons. The growth of the cross-section of muon nuclear lnteaction within ~ 1 TeV energy has been proved.
1» Introduction. Experiments carried out on cosmic rays in order to study muon nuclear interactions give quite ambiguous results concerning relation of the cross-section of muon non-elastic interaction within several TeVa to energy /l - 3/. The main problem in the study of this matter is the Identification of nuclear cascades against electromagnetic processes and the small cross-section of the process.
Investigation« carried out in the Laboratory of Cosmic,Rays of Tbilisi State University can shed some light on the processes taking place in the muon interactions.
It was the purpose of this work to study the cha-, racteristics of the cross-section of non-elastic muon nuclear interaction with energies above 0.6 TeV,
The experimental complex underground equipment at the depth of 150 m.w.e. consisted of an Ionisation calorimeter, detector hodoscopes and a neutron monitor. The calorimeter was set at an angle of 45° in respect to the horisontal and was surrounded on three sides by the CHM-8-type neutron counters set into special paraffin and lead housings. The muon energy was estimated in terms of measured values of total energy of electron-photon showers produced by high-energy

128 auons in an iron absorber. Neutrons produced during auon nuclear Interactions were recorded and subsequently used together with the cascade characteristic shape as the criterion of Identification of suoh events among ordinary electromagnetic interactions*
%T Experimental results. About 3000 electromagnetic (BM) and nuclear cascade showers of 140 GeV threshold energy involving two or more Ionisation chambers were recorded during 6660 hours. Of the total number of the cascades 11% wers recorded in the extreme chambers, while 10% appeared to be nuclear cascades. Showsrs originated in the ground were qualified according to the existence of high Ionisation in the
At 0.16 >
1 a» 1 0.2
0.07
0.36
0.09
Al
* 1
i i 11
is—t r-E, Tie T W
Fig.l. Relation of the nuclear cascades proportion to energy: A - total proportion of the
nuclear cascades; &! - "shore" nuclear cascades A* - the nuclear cascades
with more than 4 ranks of the calorimeter involved.

129 calorimeter's upper rank and by the operation of many counters in the hodoscope'e upper rank. Of the remaining caecade showers those of E ^ 0.3 TeV were processed. There were 1183 of them recorded within the zenith angle of 0* 9<£ 90° and in the energy range of 0.3- 5 TeV, containing 1047 electromagnetic and 136 nuclear showers. 123 cascades of the latter 136 were accompanied by nemtrons. The measured proportion of the nuclear cascades facilitates understanding of nature of the cross-section of the muons- iron nuclei non-elastic interaction. Pig.l shows the relation of the nuclear cascades proportion to the cascade energy. This proportion, A , is studied in respect to the total number of electromagnetic and nuclear cascades within the given energy range.
All of the studied nuclear cascades were divided into two groups. 45 cascades in the first group involved 4 and moi-e ionization chambers. The shape of these cascades was very different from that of the ordinary electromagnetic cascades. 37 cascades of these 45 were accompanied by neutrons. 91 cascades of the second group involved two or three ranks of ionization chambers. These so-called "short" cascade were in most cases accompanied by neutrons. Pig.l illustrates th e relation of the "short" cascades proportion and of the casead« involving 4 and more ionization chambers to the cascade energj The figure suggests that, since the proportion grows with the energy increase, the effective cross-section of muon nuclear Interaction grows within the energy about 1 TeV,
As the ionization calorimeter Is set at 45° in respect to the horizontal and surrounded by neutron counters, 123 nuclear cascades with neutrons could be divided into two groups - cascades with neutrons generating Into the front se-misphere (the front cone), and cascades with neutrons generat ing into the rear semisphere. Pig. 2 presents the relation of these cascades proportion to energy, evidencing the growth of proportion of cascades revealing neutrons omitted into the front semisphere with the enrgy increase» however, as the figure shows, the cascades revealing neutrons emitted into the

130 rear eemisphere did not depend on energy fron 0.3 to 1.* TeV end did not exceed 4%. Thie value agrees with the proportion
046
ami-
03
0.051-
a* . •* •
am I aot }
03
' 1
00S
aw
a«
QOlf
006
aot f f
E, Tev'TV 03 IT
C, Tev 1W
Pig.2. Relation of neutron-containing nuclear cascade proportion to energy: A*» Ay» 4 9*~ proportions of all the nuclear cascades( "short" nuclear cascades, cascades involving 4 and more ranks with neutrons generated into the front aemisphere, respectively» &+ . Af9 4 y - the earn for cascades containing neutrons generated into the rear semlsphere.

131 of cascades with forward generated neutrons at o.3 - o.5 TeV. This experimental result has proved the theory that the neutrons produced during photonuclear process have an isotropio angular distribution, and the photonuclear interaction croee-section is independent of energy from 0 .3 to 5 TeV.
It should be noted that the energy range froa 1.5 to 5 TeV has not revealed any nuclear cascade containing a neutron generated into the rear semiephere, while it has revealed 10 nuclear cascades containing a forward generated neutron.
3»Conclusions, The results of our experiments show that muons of energy £ 1 TeV have an additional interaction which produces nuclear cascades containing neutrons generated basically into the fron semisphere. In other words, the growth of the cross-section of muons interaction is connected with a process producing nuclear cascades.
Our results concerning the growth of the cross-section of union nuclear interaction agree with the results in Refs /l, 5/ which demonstrated an abnormal behaviour of the cross-section of muon non-elastic interaction at ^ 0.3 TeV. though they do not agree with the results of /3/. Thv "short" cascade showers of energy 1 TeV, observed in this work seem to have resulted from the mfcon nuclear interaction.
Acknowledgement . The authors wish to express their appreciation to the workers of this Laboratory V.D.Gokieli, A.K.Kobulashvili, Z.P.Robakidza, J.S.Petrosyan, N.G.Khazaradze for their assistance in carrying out the measurements.
R e f e r e n c e s 1. Hfcra T..Kawaguchi S.,Mikamo S. ,et aL.Acta Phys.Acad.
Sclent.Hungaricae, 29, suppl.,4,125 (1970) 2 . Borog V.V.,Petrukhin A.A.,XIV IGCR,Munchen,Conf.Papers,6,
1949 (1975). 3. Brlykin A.D.,Kulichenko A.K.,XIII ICCR, Denver, Conf.
Papers, 3, 2057 (1973).

132 4 . Aglaaazov V.A.,Gad«vaniabTill L.B., Sa Irrar« l ids« I . I . , « t * 1 . ,
XIII ICCR, Danvar, Conf. Papara, 4 , 2987 (1973) . 5 . Khrlstianaan G.B. ,«t a l . , 1971, Proe. XII ICCR, Hobart,
6, 2122.
* t

133 THE STUDY OP CASCADE SHOWERS OP £ 0.3 T«V ENERGY FORMED
BY COSMIC RAY MUONS IN IRON V.A.Aglamasov, L.D.Gedevanishvili, V.D.Gokieli, J.S.Petroeymn, A.G.Kobulashvili,Z.P.Robakidse,1.1.Salcvarelidse,N.G .Khaearftdte
Tbilisi State University 1, Chavchavadse Ave., Tbilisi-380028, USSR
Experiments have been carried out on evaluation of energy spectrum of electromagnetic oascadoe formed by cosmic ray muons of 0,6 - 10 TeV energy within a varying range of zenith angle.
The resulting energy spectrum was in good agreement with that of electromagnetic cascades, assuming that the muons were formed only through pion decay.
The paper also provides analytical data for cascades containing neutrons produced by muons in the process of pho-tonuclear and nuclear interactions with the iron nuclei.
1.Introduction. High energy cosmic muons have become a matter of great concern in the recent years due to the Importance of their characteristics in the study of such basic prob lems of the elementary particles physics as possible existence of non-trivial processes of muon generation, identification of a muon and an electron and the nature of an elementary event at superhigh energies.
The Muon Laboratory of Tbilisi State University deals with the systematic study of cosmic muon characteristics. The underground Laboratory is located at the depth of 150 m.w* where minimum energy of muons is about 40 GeV.
The facility has already been described ln Refs. 2 and 3. It consisted of a special 8-layer Ionisation calorimeter occupying 9 sq.m. The layers of the calorimeter were relaid with a 10 cm thick iron filter. Each rank contained 25 Ionisation chambers of the MK-6-type. The calorimeter was Inclined at a 45°-angle In respect to the horisontal and was

134 surroundad on three aidaa by 54 neutron countara, modal CTQI-8, eaoh aat into a apecial paraffin and land housing.
Tha muon energy was estimated according to tha measured full energy of caacada ahowera produced in the absorber by the high energy nuona.
Three ranks of counter hodoscopes, model CM-5P • located above, under and in the middle of the calorimeter, and with each rank's sensitivity area about 6 sq.m., enabled tracing of tha BuonB' trajectory zenith angle and direction.
2.Experimental results and conclusions. Tha cascade
•—i x— £ 0—3
g, T«v7W
Fig.1.Integral energy spectrum of electromagnetic cascades 1-for tha zenith angle range 0£cos9£lt 2-for angles 6< 50° j 3 -for $> 50°. Calculated curve for pion mechanism of muon generation.

135 showers to be recorded involved two or more Ionisation oham-bere, the total Ionisation value in the chambers of eaeh rank corresponding to the minima passage of 500 oasoade partiolee. About 3000 cascade showers with the threshold energy ef 140 GeV were recorded during 6660 hours of continuous operatien. The oascade showers of . 0.3 TeV energy were treated using the selection criteria of Ref./3/. There were 1047 cascades recorded within the senith angle range of 0406 90°. In addition, there were 136 nuclear showers of ^0.3 TeV energy recorded during those 6660 hours, 123 of them being accompanied by neutrons*
0.36
0.09 f f f i 0.3 L 5
£,Tev,T« Fig.2. Relation of the nuclear cascades proportion to energy.
The integral energy spectrum for all of the electromagnetic cascades, cascades with0*50° and those with$>50° are shown in Fig.l. The solid lines indicate the cascade energy spectrum expected with the assumption that these cascades mainly result from muons bremsStrahlung while the mu-ons are produced only by pion decay. The spectrum has been calibrated at 0.3 TeV energy. Correction of about 4% has been made for underestimation of energy by the calorimeter within 0.3 - 0.6 TeV due to the recording threshold effect of separate channels.
As Fig.l shows, the experimental cascade spectrum agrees well to the shower spectrum of purely pion-generated muons within 0.6^E^£6 TeV. The muon different! al spectrum

136
i be expreaaed aa / £ \ . -
* (£„1,14, *<«•* M » » - * , r\l/lll}—• in terms of the measured cascade spectrum /4/.
Aa it has already been mentioned, 136 nuclear oae-cade events were recorded during 6660 hours, with their energy varying within 0.3- Bi 5 TeV. ?ig. 2 presents relation of nuclear cascades proportion to energy, this proportion being considered in respect to the total number of eleotromagnetio and nuclear cascades in the given energy range. Fig. 2 shows that the nuclear cascade proportion grows with the increase of energy, thus proving the growth of croBB-section of muons nuclear interaction in the energy range about 1 TeV«
R e f e r e n c e s LAglamazov V.A.,Gedevanishvili L.D.,Jtobakidse Z.P.,et a l . ,
XIII ICCR, Conf.Papers,4,2987 (1973). 2«Aglamazov V.A.,Gedevanishvili L.D.,Golcieli V.D.,Petrosyan
<J.S.,Robakidze Z.P.,Sakvarelidze I.I.,Khazaradze N.G. Trans. Ac.Sc.OSSR, 76, 3 , 597 (1974).
3.Aglamazov V.A.,Gedevanishvili L.D.,Sakvarelids« I . I . , e t a l . Trans. Ac.Sc.USSR, 40, 5, 889 (1976)
4.Aglamazov V.A.,Gedevanishvili L.D.,Kazarov R.E.,et a l . , Oanad. J . Phys., 46, 339 (1968).

137 ANOMALOUS SHOWERS IM DKKF tMDtftCROUM) OBSERVATIONS IM KOLAR GOLD KIMB3
H.K.Krishnaswsaqr.M.G.K.Menon and V.S.Nareslahsm Tata Institute of Fundamental Reaaarch,Bombay,India
and M.Ito.S.Kswakami and S.Mlyake* Osaka City University.Osaka.Japan •Cosmic Ray Laboratory.University of Tokyo
Abstract
In the K.G.F.experiments conducted at a variety of depths,in addition to single muon events, cascades of dlffsrsnt sites were recorded in telescopes comprising lead absorbers.scintillators and neon flash tubes. Most of these cascades are clearly due to electromagnetic as well as photo-nuclear processes Involving muons ; but there are some large showers (with energy content > few hundred GeV) whose frequency is much higher than the predicted values. A detailed analysis and plausible Interpretation of these cascades are presented.
1. Introduction In the past decade, a series of experiments were conducted In the
Kolar Gold mines at great depths underground to study atmospheric muons and neutrino induced processes. The detectors employed were vertical and horizontal telescopes and magnetic spectrographs comprising scintillators and neon flash tubes with a variety of absorbers. In these observations,in addition to single muons and multiple parallel muons, we have recorded showers of different sizes generated either in the rock enveloping the detectors or the absorbers inside the telescopes. A majority of showers could be explained as due to normal electromagnetic interaction of energetic atmospheric muons at the level of observation. In this paper we wish to report on a special class of showers which have the following distinctive features : (1) very high energy in the cascade (>1000 GeV), (2) broad angular distribution and (3) frequency of shower generation independent of depth between 3000 - 8000 hg/cm2. These features are difficult to understand in terms of conventional knowledge on the energy spectrum and interaction properties of atmospheric muons as well as neutrinos.
2.1. Experimental details For the present analysis, we shall consider the showers recorded
in deep underground detectors at 3375,6045 and 7000 hg/cm2. At the two depths 3375 and 7000 hg/cm2, horizontal telescopes and magnetic spectrographs (krishnaswamy et al 1975,1971) were employed so that maximum solid angle is offered for particles arriving at large angles. On the other hand, the detectors employed at 6045 hg/cm2 were vertical telescopes and these were primarily sensitive foe small zenith angles (8<60°). The relevant experimental details are given in Table 1.
In these experiments.showers are detected mainly from the Neon flash tubes array, which has limited resolution. Each of the NFT la 2 cm in diameter and 2 m in length and about 200 of them are arranged in 4 staggered planes to form a standard tray of size 1 m x 2 m. 5
Among the showers recorded in all these experiments, there are 2 each at the depths of 7000 hg/cm2 and 3375 hg/cm2 which form a special class with the features described In section 1. These are shown schematically In Fig. 1,2,3 and 4 to illustrate the extent of showers and the angle of incidence on the detector. All of them originated in the rock and tra-

138 Table 1
Depth* hg/cm2
Typ* of detector »r»« (-2)
Period of exposure (seconds)
No of iIngle BUOQB
Ho of large caacad**
3375 Zlagnetlc spectrograph with vertical detector 8 plane*
1.8 x 10 8 4330 (»>30*)
1-2
6045 Vertical telescopes with horlsontaldetector 4 planes (2 unite)
2.2 x 10 8 1349 (0<* <60*) 0
7000 Horizontal telescopes 6
(2 units) Magnetic spectrograph 8
(2 units)
1.8 x 10*
9 x 10 8
42 (20X»O°*)
84 (101(9 £90*)
l
1
versedan air gap of the cave before entering the detector.
2.2 Cascades 1 and 2 at 7000 hg/c»2
These stand out in the data as the largest cascade detected at such a depth. The cascade 1 was reported earlier by Achar et al (1965) in connection with neutrino observations with the same detectors. This cascade was recorded mainly in Telescope 2, but the NFT data was Incomplete due to a fault in the winding system of a camera which viewed the top section of the telescope. The most probable interpretation of this—event is that the cascade originated in the southern wall and travelled parallel to the wall such that the zenith angle of the cascade is very large ; this is based on the pulse profiles of individual scintillation counters in Tel 2 as well as Tel 1 (which was at a distance of 6 m) and the pattern of discharged NFT. It should be noted that the cascade has a width of at least 2 m in one projection.
The second cascade (Fig.2) was recorded in a magnetic spectrograph activating essentially the NFT's on one side of the magnet. Since no penetrating tracks were observed (through the 40 cm thick magnet), it is difficult to assign an exact angle for the cascade. However, from the pattern of discharged NFT and in particular the fall off in density in the top and bottom sections, the best estimate of projected zenith angle of the cascade is 45°, the width of the main cascade is about 1.5 m. The possibility that it is due to a vertically incident cascade, and thus of smaller width is considered to be highly unlikely.
2.3 Cascades 3, 4 at 3375 hg/cm2 These are the largest cascades recorded at this depth in a magne
tic spectrograph. All the others (about 300) generated in rock are consistent with the predicted energy transfer spectrum up to about 100 GeV for energetic muons. The cascade 3 (Fig.3) has traversed the detector diagonally discharging the NFT's distributed over at least 2 m in the top section. The pattern of the discharged NFT's over the entire detector and in particular the shadow cast by the magnet which is made up of 40 cm Fe, suggests that the zenith angle la very large i.e. 90° ± 20".
The cascade 4 (Fig.ft) is however not well known in zenith angle with the main core confined to one side of the magnet. The size of the cascade is very large as it has discharged the entire NFT array in the top,middle and bottom sections. The total energy transfer in these two cascades is at least several hundred GeV and much larger than that of other cascades obser-

139
• • : • *
Fig . 1
- : K I »OS-S2 «NNStOCfl **™ »*« 15 »6«» "•»
tiiSS-.!« -iZU;i,2j; — ,
o o o 21379" 18
*Q*O10 »KM JNOU Down wor£s A5' - 50*
r-1
Fig. 4 (a) East side view
Fig. 4 (b) West aide view
E W
Ifl 1U
IP rramihi 'i—ir i
Flg . 2 Flg. 3 East and West views Mixed

140 ved at tala eeata. To ewaaariaa, «a kava a tvtti of 4 vary klatt energy ev-anca and among these, at laaat t a r « ara initiated ay primaries incident at large, tamlth angle*, la the next sect loa, «a small examine the propert lee of thaae ehovera that distinguish thea as a separata category.
3.1. Energy of the caacadaa It la aot B O M la la to estimate tha energy of the cescadae accu
rately dua to tha uBcertalatlea la the data. Firstly, we record oaly a part of tha cascade and thla could ba at different stag** of development depending on the point of origin inalde tha rock. Secondly, tha resolution of tha visual detectors la vary poor and only a projection of the cascade on a vertical plane is available ; thus tha nunber of part I d e e In the cascade could not ba determined accurately. However, guided by the lateral extent and fall off In density outside the central region of the cascades, as well as the expected aziauth.il ayanetry, we aatiaata that there are at least 1000 particles in each of thea ; thla would than correspond to caacade energies in the region of aeveral hundred GeV and above.
These cascadea are well separated fron othcra Interna of lateral extent and energy. At the depth of 7000 hg/ca 2, there were only 10 small showers with energies Halted to about 30 GeV ; these are In reasonable agr-eeaent with predicted frequencies for ahower generation by ataospherlc auons. However, the rate of the high energy cascades seen here are auch larger (by at least a factor of 100) than predictions baaed on (a) the energy apectrua of ataospherlc auons and (b) probability of Interactions involving high energy transfers.
At the depth of 337S hg/ca 2 the energy spectrua of auons can be expressed as .
F(E) dE - ,i ° E
c c n x 3 . f i (E In GeV) (E + 550)3-6 In view of the higher flux at these depths as compared to 7000 hg/ca 2, the overall rate of shower generation is higher, and the separation of large cascades from smaller ones is correspondingly less spectacular. The burst size spectrum "for cascades generated inside the rock is shown in Fig.5. This spectrum can be predicted froa the auon energy spectrua at this depth and the electromagnetic processes (pair creation, breasstrahlung and photo-nuclear interaction) of muons. In Fig. 5, clearly, the two large cascades observed in the present experiment are in excess of the expected vslue by an order of magnitude.
•6
X
Energy (GeV)
Fig. 5 Integral energy spectrum of observed cascades at 3375 hg/cm 2. (including highest energy event)

141 3.2. Angular distribution of the cascades
As shown In section 2, three of the cascades have very large tenl-ch angles and the fourth one Is ciomewhet aablguoua. This la contrary to the observed angular distribution of atmospheric moons deep underground. At the depth of 7000 hg/ca2, this aay be expressed as
I<») - 10" 1 0 sec 0 exp[-9(eec 9-1)) c»"2sec"1sr"1
At large zenith angles (>40*) the flux will be extremely saall ; Indeed euch evente were considered aa due to neutrino Interactions. Thus the two caacadae at this depth are unlikely to be induced by otmospherlc muons In view of the zenith angles assigned to thea.
At the depth of 337S hg/ca2, the auon Intensity diminishes leee rapidly with zenith angle, but it will be extreaely eaall for 9>70*. Indeed we have observed only 2 such lsrgs angle single auone aaong a total of about 4400 eventa at thla depth. The zenith angle distribution of all detected cascades is shown In Fig. 6. Thus,the ceecade 3 which has in all probability a zenith angle «"90*, could not be due to atmospheric auona. It la not clear
whether the cascade 4, with unknown zenith angle, belongs in thia apeciel category of evente but for its very high energy content, which ie an extreaely rare phenomenon at this depth of observation
1 h. it
3.3. Depth dependence A detailed breakdown of periods
of observation, area of the detectors,and the no. of events recorded are given in Table 1. Froa thia, it is clear that the
tr frequency of the special class of cascades &~-_ iK ™i. under discussion, is approximately depth pto ct«i wn.th angle independent, within the available statls-
Fig. 6 angular distribution of tica, in the region 3375 - 7000 hg/ca2. shower events The null results at 6045 hg/ca2, la fully
consistent with such a frequency in view of the saall (SA) available In the vertical telescopes for large angle events.
If these caecadee are indeed due to atmospheric auons, we could expect a significant reduction in frequency aa a function of depth. For example we should have recorded about 20-30 auch caacades at 3375 hg/ca2, as compared to 2 at the depth of 7000 hg/cm2 but this Is la complete contrast to the observations.
4. Discussion and conclusions In the foregoing analysis we have shown that it Is extremely Imp
robable that these cascades are due to ataospherlc auons In the conventional framework. The large angle feature and the depth independence of the frequency of the cascades suggest that they are produced by a highly penetrating and isotropic component such as the cosmic ray neutrinos., But here too we encounter a serious problem in terms of the expected rate of generation of such large cascades. Taking Into account the fluxes of Jju.and#t, the cross section extrapolated to high energies froa the Fermilab data and about a mater of rock as target (otherwise the burst will be absorbed In the rock Itself) we estimate that the rate of such events is larger by at least a factor of 10 z conapared to observations. The assumption here is that it. is the hadro-nic energy transfer In the process V + N-» <-+ hadron or its neutral current counterpart that gives rise to the cascade. For A., Vt interaction, it could be the electromagnetic cascade generated by the secondary electron, but here

142
th« frequency will ba further reduced by a factor of about 10 cmopared to*)», >/r collisions, in view of the smaller fluxes of the forær la the cosmic ray baa«. ln ordar to obtain agreement between observation and prediction wa will have to invoke algh cross aactions for p-Interactions st energies larger than 1000 CeV (by a factor of 100 or ao) or aoae other new source« of neutrinos or analogous particles with fluxea higher by a few orders of maga-ltude.
One of the possible way to understand this type of phenomena say be to aaeuae the existence of aodlfled Glashow Resonance as follows ;
K + s - ^ H + . s n d W -» • + a* , This aodel could be favour to explain S O M features of the phenomena that of descrete high energy.flat angular distribution,lack of attenuation with depth and also that none of penetrating particles hsve been seen in these phenomena. However,the dlfficulity in this model is that even aasuming oscillation between muon snd electron neutrino\the cross section of above reaction should be an order of 10~33 cm'.
The observations at various depths underground will be continued by aophistlcated detectors and it 1.« hoped that this will lead to a better understanding of the anomalous showers reported here.
Acknowledgement The authors wish to thank Shrl R.M.Wankar and Shri H.K.Salvekar
for help in running the experiments. We are grateful to the authorities and staff of Bharat Gold Mines Ltd. for their ready co-operation in carrying out the experiments. We are indebted to the Toray Scientific Fund for partial financial support of the experiments.
References Achar A.V. et al l*b5,Proc. Int. Conf. of Cosmic Rays London F 1012 Krishnaswamy M.R. et al, 1971, Proe. Roy. Soc.London A 323 1489 Krlshnaswamy M.R. et al, 1971, Conference Paper, 12th Int. Cosmic Ray Conf. Hobart, Vol. 7 2881 ,2886.

143
c\ic"j<"'n". or '"JC: ."••crnrLr-" SFCCTPA I~ "~v.\ :zvn. K. ".c \ik<-T_l, S. f-a^isoi-uä''1, A. Inoue, Y. .'•Lshi-rvi''"5, and X. .'iafusiusu15**
'.*ho Ins t i tu t e of Physical ani Qicriical Research Ka .a 1-7, I tabashi , Tokyo
* 3e--vii'"t^nt of" P'-ysicr., fh-'rvjhu 'Jhiven.ity, V i J u i ü t o , Ilo^ano iV.v -y • .. •• - - 0> ": , '_. 'c: , U jti_» L h i v r s : "•/, "'-ttsuyaflu, '2iirv
-»* _« ,.."_ :-,-. o' -ys'c.;, .Ja^oya -.ravers, ry, ''afoya JAIYC:
!-'j'-.n : V . " I U I ' . J : ' . ' / ' . i f i H - . ' ; J 1<;V I . • •>; ' - I J ' - - • (•••! ' • >r ilii_- i i r . i<h. - l i ' zenit.-i u-i^l- ;, V'ana 7f/; by nui .^acal i n t i ^ u i m . . ~ ; uie equation- oi hacorv.c rar-'-ades in the atmosp .ere. On ludron-c i - i 'eruct ions, Feynman's :;c. ._irv i .-:'i.u::!od ov..\" t:'.«..• who.1...- uv-ri-y I V V . T . . IV- ih:.oIu"'e ve r t i ca l ••iaj:i :.x< vH.u c.ilcul.1 •.•.•• ic in J'.OUL: . ,., ,/\.V::..J\ I- wi'.::tne inonientum spectrum m^jr-<l -a ^ a l eve l . ..n the O'Jier 1 una, the revolt c a l c u l a t e lo r 75w
-':. a 1. it'-'; deviated J-xin. the cojurvat ia i . One-ci ic-nsiorjl development of a i r shower a lso i s computed. As seve
r a l aat.tcr-: .iireacy discussed, the discrepancy rr-om observed characters of a i " 'howur i s s t i l l remained even in th-s pr\.-s.-:-.t calculat ion with very rapic ly increasing cross sections of nadronic in te rac t ions .
L " C < / . ' x i ' y i l " j - \ t :~ l a s t four years , several authors have t r i ed t o explain muon
momen:.!r. : v.^etrvi ot nerve:: a t sea leve! or under-r.-ound by the assumption that "ey.ivu: V ccol.: . / i ; val Ld i:: h.a. ironic in f-.-ruction:; over ener.--y range concernc-.. fvoriv- o: the-:1, huve suecer:;' i l ly con' In-id th, :t the outl ine of •:.ior. s ;.«.-;• :rjrii i.r. :•• .irjnManunt with t)i'. <--x;.eot:.r : 'JII ' rf.n: hi; '.;cil-'n,', hypo-t . V j i i L . . n '..'i'-- p l \ . :.-•-:. 11 iJä./^r-, VA; euu CO.'iConi'-ü i l . inuon L,peCt lu u l ZcJi iUl angles CS-mc 7:.ri r.':-.c- nu-n.:rici;Z in tepr i t ions of iudronic cascade equations .ire n».oj vi"':: tne a:-.;:V:ior. „r' constant or enervy-dopcr.dent i n e l a s t i c cross t-c:C_io;.s. "ho ubnpdrinon with measoréjrent ( Allkofer e t a l , 1971 )
J..WU -i-.;-; ".v.e absolute ve r t i ca l rauon flay L'IUS calculated i s i n gooo e'lv.T.'iT wi-i-i thi; ronuntum r.pectrum nMnurvd a t -.oa üovol up to 1 TeV/c. :--•>: . .- .'.-U.1. iL'.jd 'or '/-fir.;, hfAvi.-vc-r.n. : i 11 It: r.^vitiltr'1 Irrjüi l.lu; nii-.i:;ui\:-
....;.!; ( Ca_" :OJ:L;I.-I C ; a l , 1'J75 ). One-..i!ie-nL;i.oiVi_ ciivelopment of a i r shower c.lso i s cemputsd by the same
as sumption. As ...: vera! autiiors already discussed about a i r showers expected iro.-!>. L-CL-CI:.^ hypoc/iedis, the discrepancy from the observed characters of a i r shc-we;' i s -«.-ry d i a t i n c i . Gaisücr e t a l (197:'), Fishbane e t a l (107U), Gaisser C.97'-), ildowc^yx and Wolfendale (1973) anc^ Vason e t a l (1975) have sur^estrfc i. poss ib i l i ty of predoininance of Fe or h ty ie r nuclei in primaries aDGve 1 J ' CeV LO cisscjive the ci:;orepancy. un- ti«; contrar-y, the rapid increase of" ine las t i c cross section in considered to be another poss ib i l i t y . T.-ifc ;in;',le f^nin ray r;;/;Ctr-a observed in ri'ir.-lo-ir- -.-.'riulr; ion-.: ..i1: riir-pl<ine a l t i t ude did 'Ax. Fuji ( Ohta ec a l , 1975 and Akashi e t a l , 1Ü75) üfiow that the attenuation* of ':hese fluxes through the atmosptiere becomes fas te r in higher en :r y of ( 'nma rays and e lec t rons . I t means that the i ne l a s t i c cross s jctior.s of hadron-air in teract ions rapidly increases with in terac t ion
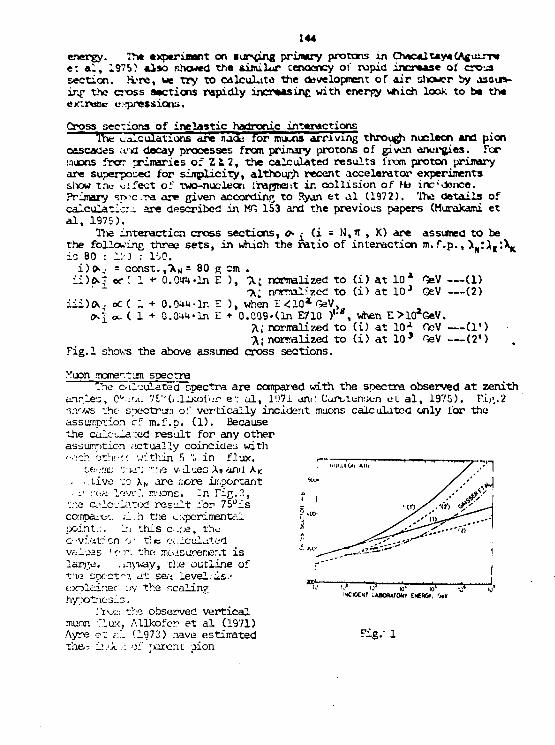
144
energy. Th» experiment on «taxing primary protons in Chac*lt*y«(AguLrr« e ; a l , 1975) also shewed the «imilur tendency of rapid increase of cross sect ion. hVre, we t ry to calcula te the development of a i r shower by asoum-inf the c o s s sections rapidly increasing with enerpy which look to be the extren».- oppressions.
Cross sections of i ne l a s t i c hadronic interact ions rne calculat ions a re nade for muuns a r r iv ing through nucleon and pion
cascades and decay processes from primary protons of given energies . For :auons frorr primaries of ZJ .2 , the calculated r e su l t s from proton primary are superposed for s implic i ty , although recent accelerator experiments show tn« d i rec t or" two-nucleon irarønent i n co l l i s ion of Ma inc'iienoe. Prj iary s p o c r a are given according to Ityan e t a l (1972). The de t a i l s of calculaticr.:. are described in MG 1S3 and the previous papers (Murakami e t a l , 1975).
Tl« in te rac t ion cross sec t ions , o* ( i = N,n , K) are assumed t o be the following three s e t s , in which the r a t i o of in terac t ion m . f . p . , ">_:i t:X_ i= 80 : i:-) : l'.O.
= const.,"X N = 80 g cm . ee ( 1 +• 0.014-In E ) , ">.; normalized to
-A; norrnali7.ee; t o ( i ) a t 1 0 J QeV (2) ) , when E<10*GeV, + 0.009'( ln E710 )' , when E>ltTGeV.
A,- normalized t o ( i ) a t 10* OcV •\; normalized t o ( i ) a t 1 0 3 GeV — ( 2 1 )
1 shows the above assuned cross sect ions .
i)(K, i i ) c :
iii)<X ^ J et
at. ( 1 ( 1
0.944' 0.044'
In In
( i ) a t 10* GeV — ( 1 )
—(!•)
Fig.
Xuon momer.fjit spectra The C'il'.'uläted spectra are compared with the spectra observed a t zenith
anr leo , 0°•;;«: 71"(.,.llkaU-.? e 1: a l , l'.)7i am: Carttunucn e l a l , 1970). Vi>',.2 MOWS the- spectrum of ve r t i ca l ly incident muons calculated only lor the assumption cf m.f .p. (1) . Because the ca lo_a :od r e s u l t for any other assumption .actually coincides with '•y.ir'. otVi'-'r within 5 '0 in f.lux.
Lfc-;:.i;; t.-iat tne vilues An and A.* .Live to A„ are :iore important
• i1 i-'ea level rrvjonc. In Tig.?., :r.e calculated rxjs'jlt for 75 ü i s co.'npai'ü'.. ,'i ..h t.k>.e Experimente.! points , ln t h i s c . r Æ , thvj C'.-viatr'on o l t i e o-rleuloted val-jas ! T' r . the mcas uraner.t i s l a rye . . inyway, the out l ine of t'i'i spectr'i a t se."i level : is.-oxolair-.ec' :>v the Dealing hypo trios:'.".
:'r-~i::-. the observed ve r t i ca l muon "lux, Allkofer e t a l (1971) Ayre e t c:l (1973) :iave estimated the-: •!'..<*•.•: of ;jürer:t pion
INCIOCNT .ABOBAR»« E I C R » , 0«V
Fig.' 1

145
MUON K*tN?i**,»>u«*A ***** *MX+tliM,*r<jm**;
PiE. 2 Fig. 3
production spectrum, and Etui e t a l (1975) and AlUcofer e t a l (1976) have sno.« the index f o r 7 5°e.stinated in the similar method. They a l l showed tha t the indices of pion production soectra are the values close to 2 .6 , tha t i s c-1'! w'vjit fxtwi the indices, ol primary snuctra obtained by Ryan e t a l (1.72). The present calculat ions by acr, Jiang scaling a lso sliow almost iie same tendency a t high momentum for ve r t i ca l ir.uons as well as largely inclined muons.
Air shower Cne-cimensional development of a i r shower i s calculated with the assu
mption o:"eriergy-de;jenaeiit m. i'.p. by uüing tno Approximation b given by Sr.yder CS' iüX'iei ' jen, 1956). As pointed out h..: therto by several authors, one can find out tint tine observed characters o:" a i r rhower are quite di f ferent flo;'-, the expectation by tlie scaling hypothesis, espec ia l ly , i n shower dt'volor<r-:nt curve and a lso in nuon s i z e . Jn other woiüs, the calculat ion !'•/ w ^ i v ; ' hy / i i j r s i : ; ^n'r.'g;;, a." the r»-:;ult, longer atl.ejiiHtion 3en^th ol ..•lovet' sj/ie uii'j 1U:,*J mx>n uJ •/£. than tho^e oi the observed a i r shower. .t cee-ii, that '.ho average pion energy Ln the development i s too high in the ca::o c scalir.'; ny-x>thesis. Then, some authors have introduced the pre-do.Ti_nc :ct-of Fe or heavier nuclei in primaries. Here, we t ry t o see the tender:, y of tho.:o characters by introducing rapidly increasing cross sections of haoonic iiYiir-actio.nn.
A ; d'.'scrÜA.'d in Introduction, the a l t i t ude var ia t ion of single gamma ray flax co-..-.erved in n .c lear emulsion i s ,of qui te different feature between l TeV oi'.d 10 'L'oV. Tha excxir-irneiYt of surying, primary nixrtons in Chacaltaya duo show; tha t very rapid increase of nuclear" interaction cross section is necesi xry in the szirilar energy region, i f the index of primary proton spectru':; is sijiiilar as the index a t lower energy than 1 TeV. Regarding "the case OS .i") consxaro. <ar ^ i i ) jjcaslviolly increasing cross sec t ions , XV» calcfLsxeC ?es'JJ.ts (KuraJcanuL e t a l , 197G) are of tendency similar to those done jy Gdis-jer (2°7t) ana Fishbæie et al (.1371). ^ig.t'ifiower developments calculated for rapidly increasing cross sect ions. Although the cross section

146
C l ' ) o r ( ? ' ) i n T i g . 1 nwy tie tno cxprcss -on : c: e.*trxi-ö cas<-s, tho rv-.uic i s not s a t i s f a c t o r y t o e v v l a i n t .V obi-'-rvoc a t*onui- . .on o!' A . r uh.-vn.-:- i i i u . I f wo co.-i a s s u r e a d d i t i o n a l l y t h a t h a c a i i c i n t e r a c t i c n s .\rv rc*r.i\l«si>'ly i n e l a s t i c a t t he enerijy above 10 ' ' GeV, ine a t t c . - i . u u o n of o lec ' . ron U M becc^eii c l o s e t o t he o b s e r v a t i o n . "Six.-. , of co—--;«, m:aru« t!«j v i o l a i . j i or scalir.,".. b a t t h e sane funct ion e s * v. t '. >r l o - v r energy i:>.t< m.- t ior . was a p p l i e - for t h e d i s t r i b u t i o n of p r o c e e d •.'.econdaries. Moreover, t he c iscnä ' iancy between the c a l c u l a t i o n .v . - the ob-e rvcc q u a n t i t y i s c l e a r i n the aevc-_opment of mua-i s i z e , as :.oer. n T.f.l. Tor • r i i ru iv energy 1J T
GeV, moa. s i z e i s s t i l l oe^e l op ing in the lower h a l : atmosphere c o n t r a r y t o t h e exper iment i n Chaca_taya ( EA 57 - C O . Ao shown i n Fip. .6 , t i e r a t i o of r^oon s i z e t o e l e c t r o n s i z e a l j o i ^ Ivzs th.m the o b s e r w c u i t i o (Ap.uirre e t a l , 1977) .
XlO'Or». ^^^^^
PR0TC*| :<R «.'Vlf * ^
™\&k:&J^-:.o - J O w . u. 1; •:..:
4T*.«CVrö*il. ? t 'P*- ,qcm'
io i -
PhOTON W C M . - S Y , E>C5fi - » - . 0 0 « • ' . ! <•!,* - Ok - iX « (LOG* A ' l . £ > ' 0 *
-00 600 800 1000 ATMOSPHERIC DEPTH, g e n 1
Sumrr.^ry 1) 1. L "obsolete v e r t i c a l rr-jor. f lux c a l -
c - l a t e u by Lcul ing rY/potnc-sis i s i n tii :•"!•/ ^i.od -\£re^:;.'i-." w i th the r>-'i: . r re^-nt .
2) l n : . /,; mor: rent I_T. r e . r ion , t h e r e i s a ui i f . t C i v . i r w . c e i.-i t ne in.aox o.'" the 'P.uon rpacLTCjn between t he . cose "/atiü.-i i-r.a tno c-xpeotaticr. from w.'.v..:!/ •jr'-cti-ii':-..
?) i'.j'- ".•• : o , Ak '• A t '• Ay, •;< '-il •: lo U-i.i:.'.o'••..•_•".- :.or- '-••. _'.-v<.'_ :MUO;I ;!...< r a •..-.;:r tnan the; enerpy coper :aence o: ': i r o n i c i n t e r a c t i o n c r o s s sec" >.-i3. F ig . 6
;+) I'v.-r; '.f we a n j r r a very r a n i d ir.cre_se of ir. teraet ion cros: S'i'Ct'on wi th ene rgy , tne c o n s i d e r -.: ..:.0" t"Jr 'c.r.l -i" c:fly i s rio~ i - • : Icier. - : t o i>.olr"jin a i r shewer O ^ I V A R V ENf.P0>,GeV

147
>.-.'«.-_cTor'. . i v . c r *~i\xrv."js t< c ' '. '-• - i : . ' . .y >:> •< ., • ' •• --.v - ••. CXT17 ". *. l:u c.-volo'yrer.i Leert: t o .».• :u.v .-•_,: . v .
VrknowI. a)v'"<.-'i-. '.T..j .;_•_• _ . . l i k e t c expn-"-'j thank:; to 2):. ..-.:*, . '_r . "• • ._ '..,-
Labora to ry , '.'•/.- ' J n l v e r s i t v of Toky<. one I r . .-..-.:. 17 :• .... .• . • '..•_. . i t y : o r ::\ei-- vd_jc-"-le d i s c o s , i r-rv- . ' c - - " ' c ;>•< •,.••.• <, . -C . i ' 1 • , •
Research ..>_-:v p r c v i c e c .
Reference;: Aju i r :^ . . . ' . , A .T re sp , C R . y . e j i a , .<..'•'..'uk.i::u , .<..<!-\.:'.a, '•'.'. c y c o j , T. at-._i,
CYokoyama, •'.K.'Vic.Kec'A'r., K.Scj-i, . . JL C • ,_• : ..-._.••.%_, C o , ..'OJVO J ine r . t o , ?7rf, 2 6 J .
A g u i r r e . C , F.^'akJiOLO, K.KauicT.a '.'.. .j-ieko, V.r.. '••:.-'.,-ow,, CR.'-"' ' i . i , Y. ."!;':<LJ o t o , K."!iii"-i--j."L , . " . . . . I . I L Y I . /".. . 'i: . ' . . . . ., :•,;>.* . . . . '.'•j . : u~ , 157'. , S'.'.'/L.. j'-jv. L/ ' ' . ; ; • J.'I'..
/ 'Xash- ,!•'.. , Z.Wti'-or.'tiA:, I . O n t a , : ' . . ! -Cor - , K./_.:'.-'.uni , r'.:vii<t)i^Ai, A . O ^ ' « j , T.Yi^-a, I .Mi t o , ' l . C h i r o i , I ' . T a i r n , . . ' . ' .atfva:. .; , y .^v i - t i ' - a , K . . a i r . , S .Tor i : , -ar .c Y.Takoha.;hi, 1375, Cor. r . .~n:.vr-., !«\:\ I n u r r . . J.':.. C m " . , .'•'a'._,. 1, 7_, 25M'J.
A H k o f e i , C C , K.Cars tensen and Vl.Z.Daa, 1971, Fhys. 2 x ; t t . , 253, -+2b. A122kofer,C.C., CCr-sr s t e m e n , V.'.D.Ja:, H.JokJ.Lh av2 il.'-'.&yer, 137b, P r o c .
I n t e r : ; . C R . Syrro. I-iigJ-i Eh. C.R. X c c a l . , .'c'-.yo, 25. Ayre ,C .A. . C ' . ' i a x e r . a ^ l e , E . J . J a rL i e i , C.J.hjr>?, .'.CT.-io.-nsor., " .R.Whal ly
anc A.W.Ablfendale, 2.97 2, Com". ?.--x;r£ 13th I n t e r n . 2..R. Con:"., Cenver, £ , 1 7 5 : .
3aclhwar,C J. , C.A.Stephens anc R . L . ' M a c n , 19 ' 7 5 . Con*. Riners l ^ t h Ir.t-:-m. C.R. Conf., .':_'l,.-.-., C, 2C77: 1975, : . re i r_ : i r .
C a r s t e n s e n , h . , H.JokiLVi, :.. J C o y e r , W.CI.'au, 2.CruDen, C'.C.,\lIko:"er, and \ W.Sta-m, 1975, Conf. P a t e r s 14th Irr:..nr:. C R . ' Co:.:. , 2'uriich, £ , 33'.-2.
Dau,W.D., -^Cars tensen a:\ti H . Jok i sh , 1975, Cor. - 7. I'a'Mrs 24th I m - m . 2.R. Con-'. . ' ^ : c i , G_, 1132.
D i x o n , : : . ! . . 2.C.32.vm2haw, J.-'..'lock:, 7 . J . " i i t h and K. 2. 3 _ v e r , 1373, Con:. Pdp;-~: 13th I n t e r n . C.R. 2bnf. , Denver, 4 , :'ii7'<.
'•..•i£»j. rii.;,.'.!<. , ' . ' . : ' . f ^. i :v:-(sr ' , K . l l . / u u ' : / " u/i'J J . . ' .T. 'r i ;! : J , I'jV'i , I •!.•/:,, l ' ' : 7 . IJ
.-licGÜ"", . A . , R.H.Maoer and C . J .Nob le , 1373, Conf. Pcoer^ 13th I n t e r n . C.R, Cor.i. , IJenvei 1, 4_, 2G52.
Gaisser-, '2.K., 1974, Jour' . F r ank l i n I n s t . , -298, 271. Greisen, ' : ' . . , 19.5G, Proß- :--R- P n y s . , I l l , '.'or''iV-i:o_lu'.a '3of). Co. :<asor. ,C.\ ' . , J .VJ .Elber t , CH.Lowe, J . - . .Morr i son and V.S.JJ.-UMsirriian, 1975 ,
Com.'. Papers 14th L i t e r n . C.R. C o m . , Munic i , Q_, 2943. MurakaTii,!«;., S .Sag i saka , A . Inoue , Y.Mlshiira and ;<.Kagashii:u, 197G, P roc .
I n t e r n . C R . "sym?. High En. C R . : : o d u l . , 2'okyo, 13 and 21 . O h t a , ! . , K.Kasahara, T.Yuda, K.Hoshino, CKuramoto , K.I.'iu, S . T o r i i and Y.
T a k a h a s h i , 1375, Coni . Papers 14th I n t e r n . C.R. Coni"., Munich,7_,2495. Ryan ,M.J . , J .F .Orr res , and V.K. Balas obrahrranyan, 1 9 7 2 , ' P h y s . Rev. L e t t . ,
28_, 985 and 1497 (E ) . Wdowczyk,J. and A.W.' . tolfendale, 1973, Conf. Papers 13th I n t e r n C.R. Conf. ,
Denver, 3 , 2326.

148 TI:E LATERAL DISTRIBUTION or MUONS IN EXTENSIVE ,\in SHOWERS AT SEA LEVEL
F._ Atjuort, J. Fntemi, H. Mejcbat, A. Nasri , E. Sh«at, A.C. Smith, X .RT Stewart, H.G. Thompson, M.W. Trtosurc and I.A. Ward.
Department of P h y i i c s , Durham Uni v e r s i c y , Durham, England.
Thcorclica! Q lixpcrimcnt.il (jjj
The lateral distribution of muons in EAf at sea level is being studied. Available results wil.1 be reported and compared with a summary of previous work.
Coordinates: m 2.4 (Muona and Neutrinos - Muons and Air Showers)
"VftiHng »iéren: Ot. F. Ash ton, Department of Physics, University of Durham, Science Laboratories, South Road, Burhm. DH1 3LE, taglaid.

149
STI'INKS ON Ml'ON SHOWERS UNDERGROUND. ]. TECHNIQUES AND METHODS.
B. D'Ettorre Pia/.zoli and G. Mannocchi, I.aboratorio di Cosmo-Geofisica del C. N. H. , Torino (Italy),
P. Picchi and R. Visentin Laboraton N'azionali di Frascati dcll'l. N.«F. N.%, Fraacati (Italy), and
K. Sitte Faculty uf Physics, University of Freiburg, Freiburg i. Br. (Germany).
Muon showers were observed at about 40 mwe underground with a spark chamber telescope arrangement. The data recorded in three 2 m ' arraya were analyzed by two methods, an analytical evaluation giving the absolute frequency of events of various multiplicities, and a Monte Carlo calculation giving multiplicity distributions. In both cases various assumptions concerning the size spectrum and the lateral structure function were tested, in particular with the aim to study a size dependence of the muon spread, and to investigate the possibility of a change in the primary composition around 10'^ e v . .
I. Purpose of the Experiment. - Beside the region of the giant air shower«, that of EAS with sizes around 10" particles merits renewed and increased attention. It is there that the new processes indicated by the apparent failure of scaling at the higher energies might become discernible. It is there as well that the primary composition might differ radically from that established below some 1 0 1 3 eV, the energy range to which most of our information on single atmospheric secondaries is related, if the flat energy spectra of heavy primary nuclei (HPN) extends beyond the range of present measurements, about 100 GeV/n. It is there, finally, that the presence of an extragalastic cosmic ray component, believed responsible for the giant showers, might begin to make itself felt, and if it does, very probably again affect the composition by gradually changing it to that prevalent at the highest energies. Although we do not know as yet what this composition is , evid ence has been reported against a dominance of medium and heavy nuclei, and for the presence of at least a substantial fraction of proton« (e. g. Watson (1)). Thus one might well find in this region of shower sizes around 10 particles two opposing trends : at first a rising effective mass < A> of the primaries, followed by a decrease of <*A"> as one goes to higher primary energies and particle numbers. To investigate this possibility, measurements carrying information on the muon/electron ratio are the simplest reliable tool since at equal electron numbers, showers initiated by HPN and observed at a stage past their maximum development contain more muons in a measure directly related to < A> .
This was the reasoning underlying already previous work with an array of two spark chamber telescopes'^ ' (in the following referred to as I .) . Indeed its results could be given a consistent interpretation only under the as«um£

I '1
l ion tha t in tili' c u s t o m a r y r e i n : . o n be ' .v .c in t!n- l o t a ! Min;l>er-. N : 1 ;I -i " , . • the two k i n d s of P I I U A I T p a r t i c l e s , v
u K N ., a so rncv i!.i' ! .i- t;<-r • • !' .< :•' K i 0 „ , m u s t be a p p l i e d for t he M o a l l c r show »• f thai , f of > v. i ;- s w ': \ • : . <\ xlO , ^hiuli- IlowcviT, il w .is also observed ann disi i.s-'e,: a, ' •>..-.: 't.i -.. -cond customary foundation of muon shower analysis, that o! a u que i.i'i . d structure furu don valid a' ail slimu'r si/es. .s :m' justified; the small«•:• \ , . . the flatter the muon distribu' on.
But if this is so, tin. en'in' basi.i of our analysis as well as tha' of jusi about all previous work evaluating or interprc'ing niui.n MIO« ITS IS O! dubious» rch ability. The sine- sj>eclru'n of ttiuou showers has been dem ed !'r\.m de::sxtv measurements, using a unique lateral distribution l.inciion chosen to reproduce the avei'age spread. Since normally small showers are de'eeted at s; .;•.'. ler, and large sliowers at larger mean core distances, the total size of '.lie first will have been underestimated and that of the second overstimated. Because the size spectra had to be used in our calculation of recording ra'es we are compelled to doubt the particulars of our results if not their cist, the oh served excess of m.uons in small showers. For these reasons we attempted to collect more and improved evidence from further measurements with an extended array.
II. The Experimental Arrangement. - The central part of the appai'attis, the two 2 m^ spark chamber assemblies of six units, each with two 1.4m x 0.7m scintillators above and below the chambers [modules M-| arid M2), has been described in I and previously. Three additional modules of slightly different construction have been installed since then. Here we shall report only on results obtained with Mj, Mr, and one of the new units, M,.
Module M3, located about 2fim from the central (Mj M.,) set, consists of two d-gap spark chambers of area l.'Ocmx 120cm and height 12 cm, arranged about 98 cm apart and with a variable Fe absorber - during the present runs about 200g/cm2 - between the two units. A system of mirrors collects the 90° stereoscopic views of both chaxnbers onto a single mirror, and the four reflections are photographed by a single camera after a 15 m optical path. All performance tests on the spark chambers of M, gave similarly satisfac tory results as those on ?.Ti and M,,.
The triggering scintillators, of dimensions 12Ü cm x 1 20 cm x 2 cm, were mounted above and below the spark chamber array in a mutual distance of 146cm, and again viewed by three 56AVP photomultipliers. Their coincident pulses, indicating the passage of at least one particle through the system of M3, provided an additional triggering signal if either M-j or M9 was traversed by at. least one further particle at the same time. Of courst the previous trigger modes {M\ Mg) and (M1 + M2) used in I (at least one particle crossing each of the telescopes M-| and Mg, or ai least two particles through either M-i or M2) were likewise recorded as before. Indicators on the display panel of the M3 scintillators were added, allowing complete checks on the triggering conditions. The other routine and reliability tests followed the procedures described in I.
The effective depth of module Mg was again determined by measurements of the single-muon counting rate, and found in agreement with that estima-

151
:<"rf from the top. graphical m«tps (1>1 m). The slight varuiiun >f tin- r'f<-< • \c depth with the multiplicity of the eventN - larger groups are recorded otilv I'VIT a slightly smaller i-enilh angle range - merely involve« er rors muih below the statistical uncertait.ties.
111. General Remarks on the Analysis. - Since the arrangement does .10". all.i« a location of the shower cores, we were compelled to apply statistical ri <•-thods. determining analytically the frequencies of groups of various multiplicities observed in the detectors. This has been shown in 1 to be both sei sihle and sensitive, sufficient to discriminate between even slowly vnr>ing .suuciij re functions. Applied in the present case this procedure offers one further advantage, and suffers from one disadvantage. All events of type (Mj M.>) or(Mj +M9) are still recorded - but with the additional information from M3 which allows us a much more restrictive estimate 01 (he core distance though not a proper core location. This is a substantial gain for the study of the structure function. Moreover, the new evidence of events involving M3 but not satisfying the earlier triggering conditions extends the range of the obse£ vations, another requisite of progress in the interpretation as stressed in the discussions of I. This is the case for the continued use of the analytical evaluation of the expected absolute counting rates for the various classes of events.
The disadvantage is obvious. Each of the groups recorded in I - twenty -one in all triggering modes - is now divided up into several subgroups according to the multiplicities recorded in M3. The labours of computing are drastically increased, the statistical significance of the individual data is reduced. Pra£ tically this amounts to the loss of part of the registered data. In order to avoid this loss an altogether different method of analysis was ap_ plied as well, supplementing the analytical calculation. Muon showers simu lated by Monte Carlo techniques and incident at random over an area of 200 m x 200 m about the central array were studied, recording the multiplicities in all three detectors whenever the triggering conditions were met. A simple chi-square consistency test against the experimental data then serv ed as the criterion for the accuracy of the various assumptions or. size and lateral distribution of the simulated muon showers. In this way the full set of the empirical records could be utilised.
IV. Particulars of the Analysis. - The body of experimental data available for the present analysis is certainly not large enough yet to justify attempts of re fineroent in the analytical technique, such as improvements in the choice of the parameters. Instead we decided to restrict the analysis to the use of two wets of assumptions, aiming at a comparison of their degree of compatibility with the empirical results in various size and core distance ranges. Also, we shall present here only results referring to triggering mode (Mj M2>s. The first of these sets is the "conventional" : as in I, we adopted the size spectrum of Bell et al. '^ ' together with the "Vernov lateral distribution"^). The second is "Case B" of the adaptations suggested and tested in 1, assum ing a niuon rate increased by a factor k= 1.47 for showers of N e '-1.3x10⁶, and a size-dependent structure (b = -0. 08, c = 0. 1 in the notation of I). In order to illustrate the procedure applied in the discussion later on, we list in

J52
Table I a few group» of «»vent« falling into certain ranges at sho*cr a u e lug por line) and of mean core distance (lower line). The symbols (m, n) herr denote • tot«! of m particle» passing through (Mj Mj). and n through Mj. One sees *hat, for instance, at m • 1 (where n • 0) la, of course, not record ed) one passes from "small" showers (n • 1 and 2) to "targe" (n * 3). covering decreasing distances. For m • 4 the mean distance remains nearly constant, but the average shower size is almost tripled between n • 0 and n - 4 .
TABLE I
R>^-JJ^ 0 1 2 3
1 2 . 8 x 1 0 s
78m
9.6x 10 5
58 m
a .ox io 6
54 m
4 2 . 5 x l 0 6
42 m
3 . 5 x l 0 6
42.4 m
5 . 2 x l 0 6
43.2 m
6.7 x l O 6
44.4 m
The Monte Carlo analysis was similarly restricted. After random selection of core location and direction, particulars on the muon showers were chosen under three assumptions: (a) The "conventional" distributions, that i s , a differential s ize spectrum dF(N^)oe Nudity, up to N^ = N 0 = 2.8 x 1 0 4 , and <* N £ 3 « 7 2 dN , for N^> N Q , together with the "Vernov distribution" for the lateral spreadW ; (b) Conditions resembling "Case B" of I, that i s , a muon number No arbitrji rily increased by a factor k = 1.48 at small shower s izes and a s ize-dependent lateral structure function, slightly modified to
Aßir) = C ( ( r + r 2 (1+0.13 log (N^/N^))-°-4 .
• expf.-r/tro + r ^ a - O . l S l o g O y N o ) ) ,
with r 0 = 8 8 m , r j = 5 m , ^ = 8.5 m at N ^ - N 0 , and r , = 0 for larger showers; (c) An attempt of analytical representation of a steady variation of <A> with the shower s ize according to the arguments of Section I: increase by a factor k= 1.48 around N„ = N 0 but return to the "conventional" frequencies at small and at large N^ expressed by d F f N ^ o t N ^ ^ d N ^ for N M i N 0 , dFfNu)«?^ 3 " 8 5
above N 0 . Relating this to a variation in <A"> , and taking k«.^AV»> , the appropriate lateral structure function becomes
Apir) = C(r + rj (1+0.13 l o g ( ^ / N 0 ) ) - ° - 4 e x p ( - r / R Q ) ,
with R 0 = 88 .8+51og(N M /N 0 ) for N é N , and R Q = 88.8 - 6.5 l o g 0 V / N o ) at N M > N 0 .
For each simulated event the mean density at the detectors was allowed Poissonian fluctuations, their outcome deciding whether the triggering conditions were satisfied, and what multiplicity was recorded. Here the different acceptance factors of the telescopes for groups of various multiplicity had to be taken into account.
The present analysis is based on the records of 1233 simulated 'Conventional" showers, 1274 showers of "Case B", and 1261 "continuous variation"

c\ cn t s . 15J
The exper imenta l reiiulli» will be p r e s e n t e d , and t o m i n r n l » i l h the analyt i cal and Monie Car lo eva lua t ions , in the follow UIK paper.
R e f e r e n c e s . -
(II A. A. Watson, P r o c . 14th ICRC, Munich, _U, 4 0 1 9 ( 1 9 7 5 ) . (2) L. B e r g a m a s c o , C. Cas tagno l i , M. Dardo, B. D'Kttorre P i a z z o l i , G.Man
nocchi . P . P i c c h i , R. Visentin and K. S i t te . Nuovo Cimento 34A, Gl 3 (1976) .
(3) M . C . B e l l , J . K o t a and A . W . W o l f e n d a l e , J. P h y s . A7 . 4 2 0 ( 1 9 7 4 ) . (4) S . N . Vernov , G. B . K h r i s t i a n s e n , A. T. A b r a s i m o v . V. B. Atrashkev i t ch .
L. F. B e l j a e v a , G. V. Kulikov, K. V. Mandri tskaya, K. V. Solobjeva and B . A . K h r e n o v , Can. J. P h y s . £ 6 , S. 2 , 197 (1968) .

m o - t i : c
154
B. 2 ' E t t o r r r l l a » o i l and G. Kannocchi , ! .-i bora to r i o di Coono-Geof loica Jol C.K.H., Torino,
P . Picchi and R. Viet>ruin, Laboraton National! del C.l-.E.U., Krascatl , ^nd
K . S i t t o , K;iculty of }"hyoicB,*UniverBl ty of Freiburg, Freiburg l . B r .
' F ] Kvprriatr".:.! Q j MoUijTj
fh<_ 1:2. jt riir.antai r o r u i t e arc urcd to derive a luttrc.1 d i o t r i l u t i o n
of rJ.o.-cr rauoiis V i>o methods, i t i s shown timt t h i s Btruoture
i'ujictioj. i s a co io i t i ve tool for deducing comr.or.i lion and opectru«
of ihc rrim^ry r i d i ü t i o n . Preliminary r e s u l t s h;id indica ted ;•- v a r i a
t ion in the primary c-cr.jjoaition v i th increas ing abundünoe of heavy
nuclei at e lectron rJiovpr Rise:; belov about 10 . 'Phey are comple-
r<?iitc:l "by the ana lys i s of the three- te loscope runs, and more
S':'':!.:ie cor.olucirnu ".r? r epo r t ed .
I.:ii]i>v; ;'.i^rezi^ : Professor K. ä i t t o . Hatthias-üruütjv.airi-f; t,rv.s;sc 10,
1 7&'.0 i'>c.ibur,; i .Ki-., j I1' .H. Gcrin-iny

tpXCCHC ". >'N I M K c I H IN t.XTKNSIVr A IK ShVkTKS
.}. de liror and K.A. Vrnin
i ot clwl si room I'niversitv ! or Christi.in Higher I'JMI.II I.III
A magnetic spectrograph triggered by an extensive .11 r sluwr arrjy, wai used to measure the momentum spectrum ot' muons in ext ..-r.-, i v*« .ur klover-, in the momentum range 1 - 40 GeV/c with .u-nith angle-. IUIIATII 0 - iu'', at an atmospheric depth of 880 g cm"" and a mean distance t rora the shout-1 core of 100 metres. The observed spectrum at this altitude vittuallv coincides with other measurements but disagrees with the theoretically calculated energy spectrum, using the model as in de Heer >-t al. (19bo'. A muon spectrum which satisfies the observations, is derived.
1. Introduction : It is generally accepted that the muon component of an extensive air shower is closely linked to the nuclear interactions occuring in the shower. Therefore any model suggested for t.K-se nuclear interactions, should also predict the properties of the muon component. In particular the energy spectrum and lar.eraj distribution should b> accounted lor. This paper conveys the results of an experimental investigation of the energy spectrum a> well as a comparison of these results with the predictions of a theoretical model.
2. The experiment : Ten liquiV scintillation counters 1-av.i1 with a area of 1 m"-, spread over an approximate area of 2 x 1( m" , at Potchefstroora. South Africa (atmospheric depth 88Ü g c m " 1 ) , constituted an extensive air shower array (figure 1 ) . The array detected showers in the size range 8 x 10 'x 10' narticles. In conjunction with this array and triggered by it, a magnetic spectrograph with a 60 cm solid iron core was used. A stack of flash tubes between two layers of spark chambers above and beneath the magnet were used to determine the number of raiotis traversing the spectrometti at the same time. The spark chambers were photographed in stereo. All events with incident angles between vertical and 45° were accepted provided the displacement between the upper track and lower track in the middel of the magnet was less than 5cm. The bias introduced by this c.ri terium is considered in paragraph 3.1.
3. A Theoretical Model : The model introduced by de Beer et al (1966) was used to find a muon energy spectrum for a given vertical angle, primary ener= gy and distance from the core. The computation shows that the primary ener= •y has little influence on the form of this spectrum over the range of the observed shower sizes. On the other hand the distance from the core and the zenith angle influence the muon spectrum appreciably. From the observed distributions in core distances shower sizes and zenith angles a weighted theoretical muon energy spectrum was calculated (figure 4 ) . The premissibi= lity of the use of a weighted spectrum to analyse this experiment was checked and found to be satisfactory. From the weighted energy spectrum predicted distributions corresponding to the observed scattering angles and deflection angles were obtained whilst certain corrections were taken'into account. 3.1. Corrections : Before a comparison between the observed and predicted distributions is made, either the observed or the predicted distributions

IS6 «Min f k
st-ai n • i^nt » i
•%jhm.-u •i»i«» -n
#«*t-»V-W) •* , ( - * i «rj
• « , IU.-MJ
Figure 1 : The extensive air shower array. S : sintillation counters H : momentum spectrometer' Co-ordinates are shown in brackets.
I a«
100 Energy
Figure 2 : The percentage of muons lost for observation, due to the finite dimensions of the spectrograph.

157 should be corrected for the following effects : energy lois.measuring error». large angle scattering, edge effect* (figure ?) and the arbitrary tui-olf condition imposed in the middle of the »agnet.
In practise it is simpler to adjust the predicted distributions to take account of all these effects. The predicted distributions for deflection and tcatte* ring which were adjusted in this way, are shown in figure J.
4. Comparison between Theory and Experiment : Frost figure 3 it is obvious that the experimental distributions do not agree well with the theoretically predict« ed distributions. ."Jo satisfactory agreement could be obtained by choosing other values than 0,4 CeV/c for the mean transverse momentum nor could agree« ment be reached by playing «round with the magnitude of other parameters in the model, such as multiplicity. A muon spectrum was postulated to produce the observed distributions. This spectrum is shown in figure 4. The predicted distributions based on this postulated muon energy spectrum, are shown in figure 3, to agree satisfactorily with the observations. Although many spectra could be chosen to satisfy either the observed deflection or the observed scattering of muons, very limited variation is allowed for a spectrum that has to satisfy both the scattering and deflection distributions.
5. Comparison with other recent investigations Comparison is made with respect to the energy spectrum of all muons in a shower and also with respect to the spectrum of muons at 100 metres from the shower core. 5.1. The total integral muon energy spectrum : A summary of various total muon energy spectra is given in table 5.1.
Table 5.1
Integral number of muoni Muon Energy Threshold Thi* Earnshav Grieder Dixon Crjeder (1975) (CeV) model (1968) (1973) (1974) Proton Iron
(1) (2) (3) (4) (5) (6)
1 2,29 2.5 2,3 2.2 2,1 2.0 5 1,0 1,0 1,0 1,0 1.0 1.0
10 0,61 0,58 0,64 0,59 0,63 0.6 30 0,21 0,18 0,22 0,21 0,23 0,2
50 0,11 0,10 0,12 0,11 0.14 0,11
In general the agreement between these spectra is surprisingly good, indicating that the total muon energy spectrum is relatively insensitive to the shower model. In particular, the agreement of the spectrum of the present calculation with the other spectra is significant when it is considered that the other calculations involved much more complicated models and/or computation techniques. 5.2. The integral muon energy < .^ctrum at 100 metres from the shower core : From the shower core distance distribution the mean and most probable distance at which the observations in this experiment was made, was approximately 100

I • l < I r 1
I OCFIECTION DISTRIBUTION
•2 SCATTERING DISTRIBUTION
a OBSERVED
b PREDICTED FROM WEIGHTED ENERGY SPECTRUM
; 1^ c »REDICTED FROM POSTULATED ENERGY SPECTRUM
T t
1 \ ~ • -~iv
1.Ü
^ V 5
Wai0ht«d N A .2
^ .1
_ _ 1 1
-
5 10
ENERGY E IN GeV
Figure 4 Experimental results of other in= vestigators (table 5.2.) are jointly indica= ted by dots and compared with the postulated and weighted energ} spec'.ra obtained in the present investigation.
V igure
10 70 ANGLE IN DEGREES
"1 : The observed deflection and scattering angular distributions, compared with theoretically predicted distributions.

159
• » • u r s . Tin - r c t o r c l O i n p a t i M i n IN tnadc w i t h o t f i r t i n v r i ( i ( j l : > T H J : t '> i ! . . n , f . (S«-<- ! a b l c 5 . ? . ) .
Tabic 5.2
Muon Energy Threshold (GeV)
Muon density (m ')
Present Earnshaw Earnshaw Rozhdestvensky Conrev ich Bürger Dinon c*lcu- (1967) (1968) (1975) (19/3) (1975) (1974) 1st ion (Exp.) (Exp.) (Exp.) (Th.-or.) (Exp.) (Thcor.) (I) (2) (3) (4) (5) (6) (7)
1 1,65 1.95 1.59 - 2.7 - 1 ,90
5 1,0 1.0 1,0 - - 1.0 1.0
10 , b0 0,52 0,61 0,55 0 , 6 0,62 0.57
30 ,10 0,21 0,22 0,22 - 0.21 0,11
50 ,03 0,06 0,12 0,1 1 0,06 0,06 0,03
\ prominent feature of the experimental results in table 5.2. is the relative good agreement among them. This is even more obvious from figure 4, where the experimental results of other investigators are shown together with the spectrum from the present investigation. The most serious discrepancy exists at the low energy end of the spectrum, where two points of Earnshaw et al. (1967 and 1968) are a factor of two below the presently obtained spectrum. Even after several possible onuses were investigated, the reason for this is still not clear. Turning to the theoretical calculation«, it is first of al: obvious that the present model with a mean transverse momentum of 0,4 Gev/c leads to a spectrum which disagrees with the present experimental tesults. (Figures 3 and 4). Although an attempt was made to obtain a better fit by altering the transverse momentum, the shapi- of the theoretical spectrum is such that it is not possible to reach agreement over the whole energy range. The theoretical spectrum of Dixon et al. (1974) agrees very woll with the present calculation. The relative small differences between these theoretical spectra are of the same magnitude as the variations that occur when the shower zenith angle and/ or level of observation is altered. Unfortunately it was not possible to deduce a 100 metre spectrum from the publication of Grieder (1975) since he only published spectra for the regions 0 - 50 and 400 - 600 metres from the shower core. However, comparing his spectrum for the region 0 - 5 0 metre with the experimental results of Burger et al. (1975) for the same core distances, it is clear that his predicted spectrum is much less steep than the observed spectrum.
6. Conclusion : When all the mentioned effects, such as the inaccuracy of the experimental energy distributions, due to the measuring orror, energy loss in the spectrometers, multiple scattering, selecting method and the edge effects, have been taken into account, the model did not givesatis= factory agreement with the experimental results. Ai'.ri'c-'Ticnt could also not be achieved by varying some of the parameters of the model, such as the mean transverse momentum and multipli ei tv.

160 One possibility to remove the discrepancy, is to postulate a transverse »o-nientunt that is a function of the collision energy. This and other possibilities call for further investigations. Acknowl edpe
The South African Council for Scientific and Industrial Research is thanked for its financial contribution towards this project.
References
1 . 2. 3.
7. 8. 9. 10.
Burger, J. , Böhm, E. and Suling, M.: De Beer, J.F.. (1960), Thesit, p.iO. De Beer, J.F., Holyoak, B., Wdowczyk, J S o c , 89, 567. Drixon, H.E., Earnshav, J.C., Hook, J.R son, W., and Turver, K.E.: (1974), Proc Earnshaw, J.C., Orford, K.J., Rochester, G.D., Somogyi, A.J K.E. and Walton, A.B.: (1967, Proc. Phys. S o c , 90, 91. Earnshaw, J.C., Orford, K.J., Rochester, G.D., Turver, K.E., »nd Walten, A.B. : (1968), Can. Journ. Phys., 46, SI22. Goorevich, L. and Peak, L.S.: (1973), 13th Int. Cos. Ray., Vol.4, 2617. Grieder.P.K.F.: (1973), Proc. Int. Conf. Cosmic Rays (Denver),4, 2639. Grider, P.K.F.: (1975), Proc. Int. Couf. Cosmic Rays (München), 8, 2889. Rozhdestvensy, S.M., Khrenov, B.A., Khristiansen, G.B., Yarochkina, Z.V.
(197?, 14th Coa.Ray Conf..Vol.8,2788.
. and Uolfendale, A.W.: (1966)..Proc.
.Hough, J.H., Smith, G.J., Stephan-R. Soc. Lond. A339,133-155.
Turver,
llyina, N.P. 2790.
Bezradin, S.N.: (1975), 14th Int. Cos. Ray Conf., Vol.8,

lt.:
MULTIPLE MllON EVENTS OHSimiå) IN K.HAI ..'.I' r I \ .
M. R.Krishnaavaiiiy ,M.i.. K .Monon O M J V . s . N41 a:. lahac Tat« Institute of Fuiularai-nt al Ri'-.r.in li, t>oral>av , lud 1.1
.inj
N.Ito.S.Kawakamt nn.l S.Mi>.ik«-* Osaka City University,Osaka,Japan
•Cosmic Ray Lab . .Univor;. i tv o' I >kvo
In a series of experiments in t tu Kolar '.old 'UI.I-S at the depth:, of 754,1500,3375 and 6045 hg/cm- underground ,wo nave oli . .1 > cuilttpK- :s>i- '• events in vertical telescopes comprising plast K' si-li.t 11 lators.Ph and K-absorbers and neon flash tube arrays. From thl;. d.it.i, the nuon number spectrum,angular distribution and decoherence distribution of the events at. obtained for muon energies in the region 200 GeV - 10 TeV.
1. Introduction In Kolar Gold Mines, a series of the observation for muon intensi
ties has been carried out at 754,1500,3375 and 6045 hg/cm2 by means of the same type of muon telescopes of the area of 4 n>2 which composed of plastic scintillators,iron and lead absorbers and neon flashtubes. The minimum energies of muons to reach these depths are roughly 200,500,2000 and 10,000 GeV respectively. At the same time of these muon observations,there are rarely (once per a few hundred muons) multi-track events which hit the detector simultaneously. Since the angular resolution of the detector is about l'.it is possible to identify wheather these tracks are atmospheric muon showers or penetrating secondary particles produced in the overlying rock. In the latter case, which is rather rare compared with the former (the rates of rock shower is about one per thousand muons), the vertex of tracks distributes within about 1 m deep in rock from the surface of the roof of tunnel. They have high probability to accompany soft cascade originated by neutral pions in the nuclear cascade started from nuclear interactions of high energy muons with rock nuclei. The average energy of muons passing through these observation levels is 100 GeV - 400 GeV from shallow to deeper places. Therefore, one will not have much interest to analyse these rock showers at the present stage of the development of accerelators. Our subject here will be concentrated to the parallel thrack events.
The parallel tracks are considered to be due to muons since their point of origin, within the uncertainties in the angle measurement, lies deep inside the rock. Typically for two vertically incident muons separated by about 1 m at the observation level, their meeting point is ^ 10 m inside the rock. This is consistent with the- assumption that their origin is in the upper layer of the atmosphere. 8owever,among the 2 track events with small separation of the order of 10 cm, there will be some events produced locally and which cannot be distinguished from parallel muon events in view of the uncertainty in angle measurement in the near vertical directions. From the analysis of the rock shower events, this contamination is estimated to be small.
From these data of parallel muons coffining from atmospheric origin, one can estimate interaction characteristics of cosmic rays in the atmosphere, because these parallel muons reflects first a few stages of interactions near the top of the atmosphere. However ithe experimental studies for this multiple muons underground are quite few in the past (Barrett et al 1952,Davis et al 1971 and Totsuka and Koshiba 1974) and most of them are the observations only at one depth of rather shallow place and non of the systematic work had been done yet.

162 OD tha othar hand, tha analyala of tha phenomena of parallel muona
which Imply a complex of varloua aourcaa In prlnclpla.ia not ao eaay. Flretly, they reflacta thalr production mechanism of thalr parents in which thara ara ao many factora to ba conaldarad,; lnelaatlalty,multiplicity,energy apectna of eecondarlea,kaon plon ratio and thalr aecondary lntaractlon and ouclaar •ffact for • Tafla. For elmplleity, tha problaa can ba raplacad whaathar acallnf law la applicabla or not at thaaa high energy region of tha ordar of 20 TeV - 1000 TeV.that tha primary cosmic raya of tha praant phanoaana aupp-oaad to ba. Secondly,decay probability of tha parenta,Pt dietributlon.ener-gy losaaa in rock(aspacially atraggllng In the ranga of muona la Important at the graat deptha), ara to ba conaiderad to aatlaate rata of event,number »pact ria etc. Moreover,ecattaring in rock and «agnatic daflaction etc alao auat be taken into account to explain tha lateral distribution.
Since our simulation (prediction» baaad on scaling model) to be compared with experimental data, have not been done yet. We will praaent here the experimental data obtained by us upto date,and ahow aome of phenomenolog-ycal analysis of the data to compare with different energy region». Tha problem of direct production of muons also to be discussed in future if there is any such trend in the data.
2. Experimental Details of the experiment and analysis of the data can be seen in
other publications ; Krishnaswamy et al 1970,1975 and to be published. We will write here crude experimental conditions below and summerize results in later sections.
2.1 Observation at 754 hg/cm2
, A telescope of area 4 m2 consisting of horizontal layers of plastic scintillators,neon flash tubes and absorbers, was operated under the trigger provided by only 1 m 2 of the tatal scintillator area of 4i'. The numbers of multiple track events observed have been corrected into the case triggered by a 4 i' detector by assuming a uniform distribution of tracks in the 4 m2. And the ratio of the events to single muons is estimated by a similar way. Tese values are shown in Tables later.(Table 1 and 2).
The zenith angle distribution of parallel muon events is similar to the distribution of single muons at least up to about 40°. The correction factor for the variation in the detection efficiency for multiple muons as a function of zenith angle will be small compared with statistical accuracy of the data at smaller angles. The ratio of multiple to single muon3 in a smaller zenith angles than 30° also shown later for the compareson with those of great depths where angular distribution is sharply collimated near vertical direction. (Table 2 and Fig.]).
To obtain a decoherence distribution, we employed two sets of data upto separation of 2m in main telescope of 4 m2, and in association with a second telescope set at distances of 4.8 m and 10 m. After a proper normalization of the results and correction for efficiency, the decoherence distribution is obtained. By the line fitting to the decoherence distribution assuming the function of the type A exp -7r*, r* is determined.
2.2. Observation at 1500 hg/cm2
The observation has been carried out using the same muon telescope •ised at 754 hg/cm2 but with the triggering of full 4 m 2 scintillation detector because the rate of muons is not as frequent as such shallow depths. However, decoherence distribution was observed only in the telescope area of 4 m2. The multiple/single rate from our observation can be compared with other depths in Table 2,but the value of r* we used in Table 3 is taken from the observation by Barrett et al 1952 at similar depth. The difference bet-

163 ween our observation and that of Barrett et al la that we do not have steep rise of rate of parallel auon events at short distances In the decoherence distribution. This extra rate at close distances aust be caused by the character of their detectors (CM. counters) which are very sensitive for accoapa-nled gaaaa rays. Therefore,we eaployed their data only in larger distances.
2.3. Observation at 3375 hg/ca2 Two vertical telescopes of the saae type of * •? area each were emp
loyed at this depth with a separation fron edgj to other edge by 4.1 a. Then, the decoherence distribution between parallel tracks in two auon events are obtained in each of the telescopes as well as those recorded simultaneously in thea. Thus, it has been possible to extend the measurement upto about 8 a. Detection efficiencies are corrected to full efficiency for each separation and the corrected frequenciea had been divided by 2Tlr dr to obtain an effective decoherence distribution. The method of correction Is siallar to those of other depths.
2.4. Observation at 6045 hg/cm2
Similarly to the observation at 3375 hg/cm2, two muon telescopes were used with a separation from each other by 2.8 m at this depth. Since the rate of parallel muon events are very low and it was difficult to get the decoherence distribution from only 8 events observed at this depth, the average separation of parallel events is used to estimate the distribution. Assuming the rate for the separation r Is proportional to r exp (-r/r*) dr.we calculate the average separationwith a parameter of r*,under the experimental condition of the present arrangement of the detectors. Then,fro"> the comparison of the experimentaly observed average separation with the calculated average separation, the most probable value of r* has been determined. The characteristic length r* thus obtained will be discussed later.
3. Summary of the data Summarizing data to know the depth (energy) dependence of the phe
nomena of parallel muon events,the experimental results are given in Tables below. Table 1 shows the number spectrum observed at each depth. Table 2 shows the ratio of events to single muona respective to the energy of muons. Table 3 shows the values of r* for various depths together with estimated values of r 0 (characteristic length of real distribution) and transverse momentum Pt.
Table Totai! No. events 243 239 146 8
where the data fey- 754 hg/cm2 are figures converted into 4 vfi (see text 2.1).
Table 2 The ratio <30°
3.07 x 4.31 x 6.89 x 6.57 x
E a v at 6045 hg/cm2 may be about 7 TeV if the fluctuations in energy losses are considered.
depth No. of single muons
754 hg/cm2 1.10 x 10 5
1500 5.98 x 10 4
2.28 x 10* 3375 5.98 x 10 4
2.28 x 10* 6045 1349
1 of 2 3 4 5 6
tracks Si' 11 n II 213 24.2 4.4 1.3 0 211 19 5 3 1 130 13 2 0 1 8 0 0 0 0
depth No. of events No. of muons
754 hg/cm2 2.21 x 10⁻³ 1500 4.00 x 1 0 - 3
3375 6.40 x 10⁻³ 6045 5.93 x 10" 3
:io E m E av io--3 200 GeV 300 GeV 10" -3 500 GeV 650 GeV 10" -3 1.9 TeV 2.2 TeV io--3 9.5 TeV 10 TeV

164
]<i
lü 100 GeV 1 TeV 10 TeV Fig.l The ratio of events to single
muons Vs E a v (Table 2)
Since both the angular dl»tt-IbulIons for nIngle auon» and r«rn-tK arc different at larßr tcnlth angles.the ratio» in the tenlth angles lens than 30* also h.nve been shown In Table 2, and they can be compared each other In Hg.l. In the Table, E„ Is the »Inlaua energy of muons to reach the level «»aiming average energy loss vithoit any fluctuation, and Eav 1* the average energy of vertical »uons pass thr--ough the level, at the surface of ground. Figures are shown as a function of E.„.
In Fig.l,it must be mentioned that the ratio at 10 TeV is low com
pared with the extrapolation from low energy side.
depth 754 hg/cm2
1500 3375 6045
28 t 4 m 13 ± 1 5.2 + 1 1.5 ± 0.5
Table 3 r 0
13 m 6.5 B. 2.4 m 1.0 m
<Pt> , 390 MeV/c 422 MeV/c 520 MeV/c 1000 MeV/c
remarks Ptexp(-Pt/195) dPt
[700 MeV/c]
exp(-r/r0)
where P t is the average transverse momentum and it's distribution function is shown in the remarks. The remarks for 6045 hg/cm2 is an estimation of average P t taking into account the fluctuations in energy loss of muons in rock. (see foot note of Table 2)
In Table 3,r* can be obtained directly from the observed decoherence distribution. The values of r„,however,has to be estimated from both the values of r* and the range of decoherence usad ro get r*. Fig. 2 shows a de-coherence distribution function for a lateral density distribution of the form exp(-r/r„). In the figure.it is shown that decoherence distribution is not exactly in a form of exp(-r/r*),if one knows approximated value of r* obtained within a certain range of separation,the value of r 0 can be estimated from this relation. Fig. 3 shows relation of r, and energy of muons,and r 0 at 10 TeV looks somewhat higher:
<P^of muons are estimated simply from r p and assumed production height ( 20 km) cf their parents, by the following equation,
< rt> " 20 km and It was shown ID Fig.4. Here, again, the <P t> at 10 TeV Is higher than the extraporatlon from low energy side.
decoherence distribution
1 2 3 4 5 6 in unit r 6
Fig. 2 Relation between real distribution and decoherence distribution

165
i . Di*cu*»ion . M i v a t a of decol .«r.nc. d t . c r lbut ion.«« hav. «»«I Throughout t h « • " • ^ ' U
b ° ' . „ n oi t h . lack of i n c l i n e NFT t r . y .
s*s isrü-^K Äis"~.-»— ~ - « - -be «een ln Table l .
One of the reault» froi the data of 3 depth«,754.1500 and 3375 hg/c»2.i« that<P t>
åo*u n o t
change much with primary energy „ithln a range of about 20 TeV to 200 TeV.
It looks to be sooe-wi-.t difficult to draw any other ^
luslve results fro» these data ^ because of large statistical error u
at the deepest observation level. However even for these 8 events of poor statistics ,it was necessary to operate two set of 4 m muon telescopes for about 4 years. It has been already pointed out that relative rate of multiple events respective to the single muon's is low and<fPt>is high at 10 TeV region of muon energies. ^ If one consider following points.^ such tendencies will be more em- > phasized. Because of scattering in rock by about 40 cm and also geomagnetic deflection of about 40 cm.a high energy muon will be scattered out from It s original axes by about 60 cm. Therefore,two muons emitted to the same direction like a Pencil beam at the upper atmosphere will have a separation of about 80 c» In average at the observation level.
100 GeV 1 TeV 10 TeV Fig.3 Characteristic lengt. r. Vs
average energy of muons
> ai o
p. V 1
o.i lOOGeV 1 TeV 10 TeV Fig.4<P(>Vs Eav Point A for average
energy loss and Point F with fluctuation in energy loss. "
In average at the ° b*f?"*°* J f * ^ 8 ( m e more of separation between theae Moreover, <P t> distribution will «"••«•• w l t h , 8 e p_ „uons. Fro« these point of view, £ • • * • £ £ £T. t n a n h a l f 0f the total aration less than 80 cm u l " *° " ^ f f L i e n c f must be considered). Neverthe-(of course.correction for d f e°5*°° " f J* 1*"'Repeat level are having separa-leas,5 events out of 8 events f ^ f ™ * statistical fluctuation or a tions leas than 80 cm. This may be J«* c ° a ^ £ a r l n t eractio n In the short conta-ination o local eventa like a tall or n ^ ^ ^ ^ separation gro. (aee I « ™ * * ^ : J ^ t h e latter case will give less freq-will give .till higher <Vt7 in «f-*»"~ ' 5 f t B " j e v e n t s l n Table 2 may be an uency in Fig.l at 10 T.V X h « " f « « i f $ " ^ V l o v e r limit for the deep-upper limit and<P t> " ^ " ^ J f «planttion to the above.that the dec-eat level. There i» an alternative <*P l a°* c - -..„„«buity of the muona £ « . . of rat« of event, to .i«ply f * " J ^ r ^ g l i S of low energy «uona
t-asars ' Ä " Ä 3 Ä sr

166 la »till high although It ia within a arror. Aa a raault. It may b« »a 14 that thar« ara BOB* Indication about tha po««lble violation of «callmg law at around 1000 T«V of tha energy of primary coamic ray». Ofcearvatloe* of th« avanta by meana of larger area datactora ara daalrad ln futura Co atudy thla problem.
Acknowledgement« Tha authora wish to thank Mr.R.M.Wankar and Kr.H.O.Salvakar for
help In running tha experiment». We are grateful to tha authorIt la* and ataff of Eharat Cold Hlaaa Ltd. for their ready co-oparatlon In carrying out che experiment«. We are Indebted to the Toray Scientific Fund for partial financial aupport of the experiment».
Reference» Barrett P.H. et al Review« of Modern Phyalcs Vol 24 No.3 133 (1952) Davi» K.H. et al Phyalcal Review D Third Ser. Vol. 4 No.3 607 (1971) Totauka Y. and M.Koahlba Jour, of Phya. Soc. of Japan Vol.36 341 (1974.) Krlshnaswaay M.R. et al Proe. Indian Acad. Sei. ]2_ Al 55 (1970) Kriahnasvaay M.R. et al Acta Phyalca Academlae Sei. Hungaricae 29_ Suppl 4_ 227
(1970) Krishnaavaay M.R. et al Pramana Vol 5 No. 4 211 (1975)

167
MUOH ARRAY AND THE PROBLEMS OP MUOH MEASUREMEOTS Yu.N. Bashutov, Yu.A. Nnchin, 3.M. Roahdeatvenaky,
B.A. Khrer.ov, G.B. Khriatianaen Inatitute of Nuclear Phyaica, Moacow State Univeraity;
Moscow .USSR. ABSTRACT: The muon underground detector installed at the center of the EAS array of the Moacow State Univeraity la described. The detector consists of (1) a solid-iron magnetic spectrometer for muon energies of up to several hundreds of GeV, (2) a many-layer detector of 8 trays of spark chambers and three trays of scintillation counters interlayered with lead. The following measurements are to be carried out with the help of the described detector: (1) the HAS muon spectrum, (2) the lateral diatribut ion of SAS muons, (3) the EAS muon groups, (4) the spectrum of the underground muon-generated showers, (5) the role of the nuclear interaction of muons in the shower generation underground.
1. Experimental array A new muon detector has been installed at 40 m.w.e under
ground. Fig. 1 shows the cross section of the detector. The upper part of the instrument is a muon magnetic solid iron spectrometer . Used as the track detectors are the large-gap spark chambers with the total length of the measured tracks 60 cm before and after magnetized iron. The significant length of track and the full-'fila'ment of the requirements necessary to obtain a high-quality track, namely: the minimum delay and the fast front of high-voltage pulse; high-quality of front chamber windows and camera lenses; uniformity of the electric field over the operational volume of the chambers - all made it possible to obtain an angular resolution for the muon track
5> = 6 x 10⁻⁴ rad. Por magnetic field, the maximum measurable momentum of the spectrometer is . ICjpßi
' V ' Cyi'J -640 GeV. The Coulomb scattering in iron is ?0T$ of the magnetic deflection. The total aperture of the spect -ometer for the muons of infinitely high energy in 6.'S = 0.09 m?* ster.
A ranlti-ti-ny detector of " trnys of spark chambers with ? 5 era gap and 3 trnys of scintillation counters 5 cm thick inte-lnyed with 4 cm lead wr;n mounted under the mni netie spectrometer. The area of ench spark chamber trny is 4.4 cm* r>nd thrit of scintillation counter trny iB 4.0 oi . The detector makes it possible to register the muon-generated secondary showers.
The spark chambers of the multi-tray detector are made of gloss with the outer electrodes (the current limited chambers). The chambers are photographed. The high-voltege pulse is fed to the spark chambers with a 3.5 mesec delay to give tine for recording the amplitudes of the scintillation counter pulses without interference from the sp-ir'' chambers. Before that moment, the scintillation counter pulse amplitudes were converted, with the logarithraic-t;;pe converter, into the didgits which are then stored and recorded. The accuracy

:he aaplit .åf t?.eaiu;r<v:;e:.'. .a of ICi . r. \hv '0 -V - ir -n- ;-c.
The nagnetic npectrotr.eter is trl^rerci ' .: the ac :".'•• ll:>-tior. countor telescopes nomted nr.der n-d :T. cue '.be r..->jv.pi - •"«• -iron in coincidence with i.'.J :irr;i\ (.".r.. 1). The o-.:l:. -i.-.».. detector ia triggered l-y the conrter:» or ihe detector- i'.npl: end by the outer triser int; pulseB, for oxur.ple, the '. r.rr -ing pulses of the F.'J army.
The above described array composed of tiie nar.:et:c a,fct o-meter and the multi-tray ''shower" detecto,- in urrnt.ee! :tt '.Vj» center of o lar^e detector of i. .1 nuot. rlu>c denoity of -50 -•-area. The density detector consists of hodurcopic u-.' co .•::<••;.• (1112 unita).
The underground room with the rnuor. detecto.- ia it the center of the EA3 array of the I.ioscow Jtite Vr; i vera i ty.
2. iroblems of muon measurements
The described array is used to measure the muons generated by the cosmic ,-ay primaries of various energies. If the primary energy is sufficiently low (<' 10'3 e'O, the detected muons are observed as the "single" p.-.rticles no; r
accompanied by S.iS. If the primary er.ergy is hi. h ( 10'-V.'), the muons are observed within h'.'.o.
The main problems of measurements are the folowing: (1). Investigation of the energy spectrum and 1 .teral
distribution of E/.3 muona. The muon energy spectrum and the lateral distribution
are known to be sensitive both to the character of nuclear-interactions and the primary cosmic cay composition. The measurements in the ranges of the highest energien of muons at given EA3 size are of special interest.
The measurements with the earlier version of the mugnet^c spectrometer /1/ show that the EA3 array of the Moscow State University supplemented with the new spectrometer can give information on the lateral distribution and energy spcct'-uip of muons in the 10-500 G.eV energy range at 6-?100 m distance" from EA3 axis for the shower aize3 of 10->-10" (the pri^a-y energies of about 10'-' e'/). The data for this size interval are precise due to the possibility of accurately determining the main EAS characteristics, i.e. position of k'.J axis, EAS size, and age parameter.
The multi-tray "shower" detector will be used to spread the muon energy range above 500 GeV. It was shown in the measurements with the earlier version of the multi-tray detector /?/ that the information on the form of the muon energy spectrum can be obtained by studying the cases of successive" -"generation of electron-photon cascades by muons. It is important in this method to know accurately the form of the muon energy spectrum in the range below , which is provided by the measurements of the magnetic '500 GeV spectrometer. The use of the magnetic spectrometer it- combination with the "shower" detector makes it also possible to carry out the absolute t.ormalizition of the shower detector energy measurements.

lt.«!
2. twtasureoentg of "•IOKIC" auona .'. disagreement between th« experimental resulto obtained
with ionization chnobera /3,4/ and X-ray filna /•/ OR the y size spectrum of the secondary cascades generated by > 10 GeV muono was observed. The difference in the -eaultB co :ld Ve probably connected with the difference in the spatial dimensions intervol within which the secondary cascades were measured (the distances from the shower axis we-e hundreds of microns for the X-ray filmo ind several an for the ionization chambers). The observations of the secondary cascades with spark chambers in combination with scintillators will probably make it possible to find the cense of the disagreement between the resultc of the earlier experiments. The spari- chambers make it also possible to measure sec irately the direction of the cascade-generating muor , to determine the point of interaction ( with accuracy of one layer of lead). The "shower size at a certain depth in lead can be determine-with the scintillators.
The central problem of the experiment with single rsuons is to measure the portion of the "nuclear" events anonc the secondary cascades of large sizes ( ft,. > 1000 i r. lead). It is /.nov/n from the experimental study of the low energy "nuclesr" interactions of rauons carried out at the "oscow rotate university with spar'-', chambers /G/ that the "nuclear" interactions can be distinguished from the electromagnetic interactions by presence of the penetrating secondaries (the energies of the penetrating particles were of the order of several Ge/). ..aen the large-size showers are studied, the "uuclear" interactions could be distinguished from the electromagnetic events on the sane principle by observing the penetrating secondary particles in the "tail" of the cascade where the energy of penetrating
secondaries is decreased down to several GeV. . To oT se,-ve "tails" of cascade the significant amount of sul stance in the array should -e used. That is the reason why. sufficiently thick lead layers {•", cm) are chosen for the '.nit i-iray detecto' so that the totc.I triebt,ess of lead is 4; cm.
3. .beasurener.ts of hAS muon groups The fluctuations of the 1-J..IT muon flax density in excess
of the pu~e stat i st Le«: 1 fluctuations were observed in the experiments /"/ with the spar'- chambers with the geometry close to the geometry of the discussed multi-tray detector, bale Kations were carried oat to show that the observed f1uctnatious can be explained by the fluctuations of the lateral dist.ri."--tioii of li'-i' wuors. it i3 important,, however, to continue the experimental study of the observed density fluctuations of the muon flux (or groups of rnnon.3) to obtain more information on the nata.-e of this phenomenon.
The comb-nation of a magnetic spectrometer, a mult i-tray de4ector, and a large nodorico.u c muon detector makes it possible to study the muon groups in more details, in p.rti-c.l-i-, 1. ponsibjiity appe'.ra to st"dy the muon energy spectrum in groups and to ex:'"ire the correlu ti ons between the muon energy ~r.ü the local density of ICJOI: flux.
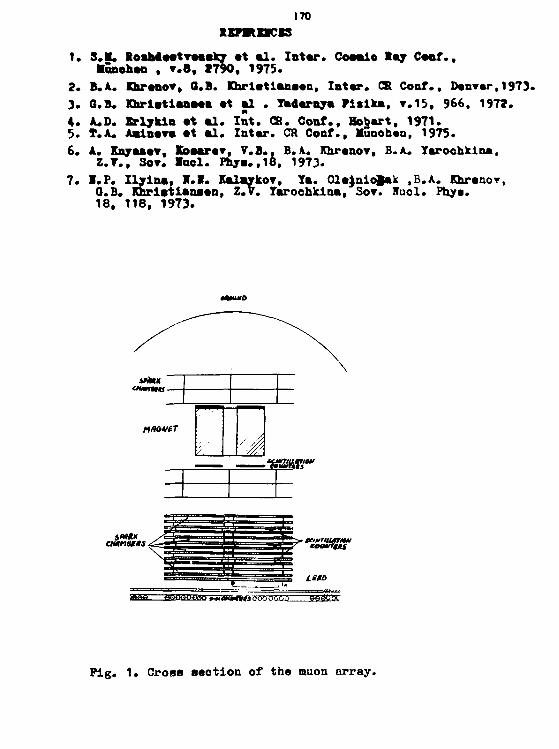
170 ft ETSt DCIS
t . 3.M. SoaMaatTaaaky at a l . Inter . Coaalo lay Ceaf., •ünohen , T.8, »790, 1975.
2 . B.A. Khrenov, O.B. Christiansen, l a t e r . CS Conf., Denver,1973. 3 . O.B. Xbrlatlanaea et al . Yederara Fie ika, r . 1 5 , 966, 1972. 4 . A.D. Brlykln at a l . l o t . CS. Coof., Hobart, 1971. 5. T.A. AainaTa at a l . Intar. CR Coaf., Munohea, 1975. 6. A. KnjaseT, Koaarar, V.B., B.A. KhrenoT, B.A. Yerochklna,
Z.T., SOT. Inol. Fnra.,18, 1973. 7. I.F. Ilyina, I.I. KelaykOT, Ya. Olejniojak ,B.A. Khreno*,
O.B. Khrletianaen, Z.V. Yaroehkina, SOT. Huol. Phye. 18, 118, 1973.
naoutrr
•aBHB"
toofTgas
Fig. 1. Cross section of the muon array.

171 DETECTING SYSTEM OF MULTIPLE PARALLEL KOONS
T.Wada, Y.Ig«, Y.Hiraki and K.Hikas« Department of Phygics, Okayama University,
Okayama, Japan,
I.Yamamoto Okayama College of Science, Okayama, Japan
and S.Katsube
Ashikaga Institute of Technology, Ashikaga, Japan.
Results are presented of a preliminary measurement of multiple parallel muons. The new detecting system is employed; proportional counters as B.D.C. (Block Detecting Counters) and digital selection circuits for detecting parallel muons and eliminating air showers. We have the scale-up plans for detecting parallel muons by using the system of this type. In this paper, we present results on driving one unit counters for the test. Our running time is about 1,000 hours at sea level.
1. Introduction. Multiple muons production mechanism will be a interesting problem of fundamental models at high energy interactions. There are some experiments of narrow multiple muons employing cloud chambersdi 2), neon hodoscopes*3), G.M. counters ( r 5), scintillation counters^, sonic counters'^) and spark chambers( 8 - 1°). But the experimental results and analysis entangle the selection criterions. Our approach is different from the above research method.
Our purpose of the present investigation is to carry out the new detecting system of multiple parallel muons:
a) employing only proportional counters and b) taking selection digital circuits for detecting
parallel inuons at large zenith angles and eliminating air shower particles or accompanying

r: particles for instance knock-on electrons.
In the present experiment, we obtained the result a on that eliminating shower particles, knock-on electrons and others. Therefore, in our measurements, multiplo-particlc events are very rare, but at present time we can not <J i SCUMS in detail due to the insufficient data (limited measuring time: 3 x 10^ sec and small detective area: 0.1 m?). So, we have the scale-up plans that reinforce detective counter unit:..
2. Apparatus and Method. The arrangement of the B.D.C. system is shown in Fig. 1. Block detecting counters are double proportional counters that consist of X-axis and Y-axis, and have each eight signal-out with an amplifier and a discriminator. By (X,Y) signal combination these counters are sectioned with 64 blocks (ono block size: 4x4 cm^). The Z-counter that decides the block combination is not used at present measurement. Upper counter is a air shower tray that is the multiwire proportional counter (50x50 cm^ area).
A.S.tray, anticoin. counter
Fig. 1. The arrangement of the one unit of B.D.C. system.

IM The locations .-«lonij the .i.vis of the p.P.C. .irr- r;.-r up with sonith angle 70*. 74» and 78*, respectively .nu! thm thr:.c 64 blocks have same solid amjle within ± l. >* aiul tot.il sensitive area is 0.1 m 2.
In this preliminary experiment, in which the system was used as the B.D.C. 32 outputs and an anticoincidence counter, the block diagram of digital electronic circuits is shown in Fig. 2. The 8x4 signals from B.D.C. (IX, 2X, 1Y and 2Y) pass out each circuits by the data bus line. At the first, the Memory Load Circuits take each four-fold B.D.C. coincidence. The Parallel Detecting Circuits (P.D.C.) carry out the following;
a). The same block position detecting: 1X=2X , 1Y=2Y. b). The checking that another block do not fire.
Mennry T: Timer Load C: Clock Circuits
Fig. 2. The block diagram of the electronics.

174 At the same time, in the Memory Clear Control an anticoincidence for air shower is checked. These output signals print out by using the Printer Controller and a digital printer. Some example of printer-out are shown in Fig. 3.
1 2 3 4 5 6 7 8 1 2 3 4 5 6 7 8 1-X - _ • _ _ _ i_Y _ _ - - _ - • -2-X _ _ • - _ _ 2-Y - _ _ - - - • -
(X,Y)-(5,7) Block Fire Parallel Event 1-X * * _ * _ _ _ * i-Y » * * _ * * _ _ 2-x * * * * * » - * 2-Y * * * • * - A
A.S. tray fire mark On Free, Off P.P.C. A.S. from vertical
Fig. 3. The example of printer-out.
Results and Discussions. The basic experimental system has been operated for a total period of 3xl0 6 sec. During this period 2644 events of parallel muons were printed, these events were selected by the P.D.C. Those events in which all four B.D.C.-out memorized at least one particle may be classified as muon like events. All the event at zenith angles 70°, 74° and 78° did not fire air shower tray, so did not print A.S. mark. About 1 % of total events fired double position and each other block, those may be estimate as accompanying knock-on electrons. The uniformity map of each block with single muon is shown in Fig. 4.
xl x2 x3 x4 x5 x6 x7 x8 42 38 26 34 33 36 29 46 41 26 22 27 26 33 22 30
30 27 23 26 32 40 34 29
32 29 43 32 31 42 23 35
35 23 23 30 27 38 28 31 36 28 35 23 29 29 26 35
44 22 29 33 29 29 25 34
* 38 3 2 27 1 3 3 30 26 45
iy 2y
3y
4y
5y 6y
7y
8y
Fig. 4. The uniformity map.
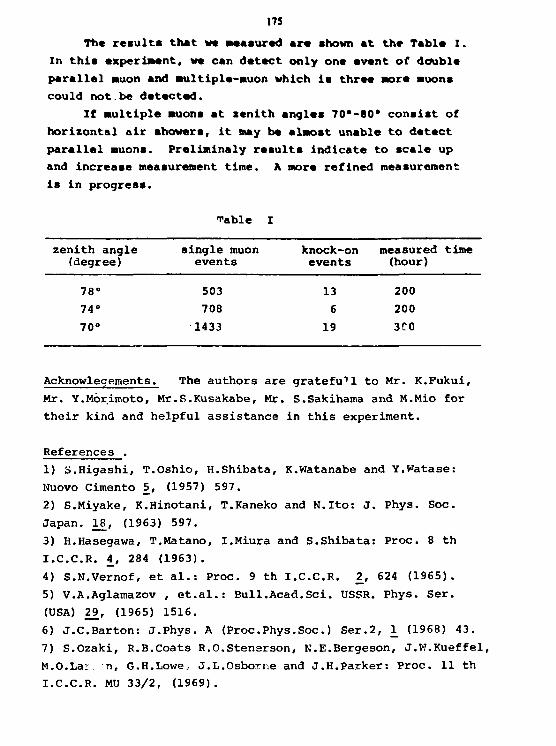
17$ Th« results that w« ••«•tired are shown at the Table I.
In this experiment, we can detect only one event of double parallel muon and multiple-muon which is three aort anions could not.be detected.
If Multiple muons at zenith angles 70*-80* consist of horizontal air showers, it may be almost unable to detect parallel muons. Preliminaly results indicate to scale up and increase measurement time. A more refined measurement is in progress.
fable I
zenith angle single muon knock-on measured time (degree) events events (hour)
78° 503 13 200 74" 708 6 200 70° 1433 19 3C0
Acknowlegements. The authors are grateful! to Mr. K.Fukui, Mr. Y.Morimoto, Mr.S.Kusakabe, Mr. S.Sakihama and M.Mio for their kind and helpful assistance in this experiment.
References . 1) S.Higashi, T.Oshio, H.Shibata, K.Watanabe and Y.Watase: Nuovo Cimento 5_, (1957) 597. 2) S.Miyake, K.Hinotani, T.Kaneko and N.Ito: J. Phys. Soc. Japan. 1£, (1963) 597. 3) H.Hasegawa, T.Matano, I.Miura and S.Shibata: Proc. 8 th I.C.CR. £, 284 (1963) . 4) S.N.Vernof, et al.: Proc. 9 th I.C.CR. 2_, 624 (1965). 5) V.A.Aglamazov , et.al.: Bull.Acad.Sei. USSR. Phys. Ser. (USA) 2£, (1965) 1516. 6) J.C.Barton: J.Phys. A (Proc.Phys.Soc.) Ser.2, (1968) 43. 7) S.Ozaki, R.B.Coats R.O.Stenerson, N.E.Bergeson, J.VT.Kueffel, M.O.Lar. n, G.H.Lowe,, J.L.Osborne and J.H.Parker: Proc. 11 th I.C.CR. MU 33/2, (1969).

I "6 8) ll.Shibata, T.Kaneko and S.Kishinoto: J. Phys . foe. .'.i«ir., 29-6, 1427 (1970). 9) L. Borgamasco, C .Castaqriol i , H.Piazzoli, A.Piano, r.PiccM and R.Visentin: Proc. 13 th I.C.C.R. hMJ, 1404 (I1»?!). 10) E.V. Basarov, R. V. Beisembacv, S.P.Bosch>pv, Vu, r1. V.ivilov and S.I.Nicolsky: Proc. 14th I.C.C.R. Mr'-3, 2007 (!97r,). and etc,..

177
Oo—I« Ray Muoaa Dalra at Zarg* Zaalta Arne*«
T.L.Aaatlaal, S.Y.Alahudah/an,K.A.0ftiAr7on,
L, I.Koalliwr, ü.S ..Uortlroa/an,S. V.Tar-Antonyaa
Yerevan Physios Institut«, Armenia» IRSR
Tha aoaantua and oharga ratio of auon palra ara •aaauisd
by daana of Aragats sp#otro£ppoph.
lb« spark ealorlmster data ar« uaod to idsatifleat« rani
auon paira.

17*
L.I.VUtaa«va, I .
fJMebeiav Pajaleal Xnatltvte,
ABSTRACT
JbtpaviaaBtal jx1
We aaarohed for the groape with three ani mora —ana near aliuaag axis with rertlcee la danaa Materia)., «be aneljaie of experinental data obtained «1th «park obanbem perwlta to aet ap« Unit far the eraea oeullon of direct aoltipla nton produotiooviby hadrona of KAS at the energies above aooeleratora ona.
Coordlnateat 101.2.4 («none and alrehowera) Beinling adreaat Daotor AuV.Tavllo«.
PJMabeder Pnjejical Institute,
i, 117333 Lenlnsky proapact 53

179
Tl IE SEARCH FOR DIRECTLY PRODUCED MUON PAIRS IN EXTENSIVE AIR SHOWERS
E . V. Basarov, R.U. Beisembaev, S.P. Beschapov, YuJsl. Vavllov, L.I. Vildanova
P.H.LebedeY Physical Institute Moscow, 117333, USSR. Abstract
Muon pairs ( id - pairs) registered by spark chambers at the depth 2o rruw.e. near the axis of EAS were analysed. The Spark chambers are constituent of the F ien-Shan complex EA S arrangement. The muon pairs created by hadrons of EAS in dense substance were searched. The c a s e s with vertices in upground calorimeter and upper layer of ground were found. The energy of muons in U -pairs and their transversal momenta have been estimated. The results give an evidence for creation in strong interactions at the super-accelerator energies the particles with masses > ( 3 - 4) GeV
-10 ind decay time < «rlO sec . with the cross section much larger then the /alue extrapolated from accelerator data.
1. Introduction
The discovery of new hadrons, * y particles in the experiments on the accelerators shows the existence of new sources ot direct ieptons, with high transversal momenta. The experimental data at the accelerators show a fast increase of the cross section for 'Y / ( 3 lOO) particle creation. It would be of great interest to investigate the muon pairs s generated in strong interactions of hadrons with energies more than equivalent energy of protons in the ISR at CERN. Now we can do this only in cosmic ray experiments. It seems valuably to perform the- registration of pairs and groups of muons g e n erated by hadrons in dense material, [jj This registration presents an impo r-tant progress a s compared to the attempts to receive the information about the possibility of direct generation of not trivial muon pairs and grous created in EAS in air. This is connected with large attenuation for muon background from JT-/J (k -ft) decays when we regisirate / / - p a i r s and groups, created in dense material with muon» energies greater than 10 GeV. Indeed, the relative probability for STp-M decay in dense material is small a s comparated to muon registration from the air to ratio flm/jt>a, where Am is the density of the material and fa. is the density of air i.e. more than looo times.

180
2. Experimental arrangement and processing of event»
The arrangement for //-pain» and groups registration contains 16
large sap cptica' spark chambers ( 100 x 90 x 10 cm - dimension of
each chamber). The spark chambers were placed in four
/ T - t - I - T
31
Fig. l . The experimental layout
rows, four chambers in each ( Stotal »
3,6 m ) . Fig. l . They were placed at the
depth of 10 m under the ground ( 20 mtafte) .
It is a part of complex EAS arrangement.
The triggering was performed with the help
of the scintillator counters situated in the
upground building. An important, feature of
the arrangement and the method of data pro
cessing is the achieved accuracy of angle
determination which is about 2 milliradian [l].
Por all c a s e s with four or more muons s i
multaneously passing through all area of spark
chambers (. 3,6 m ) the following quantities
were determined :
sirtØ, f, R, Ty, lz, O, R. Here Or is the spatial angle between two muons; I is the distance from the
centre of coordinate axis which is taken in the optical plane to the place
of nearest approachment of muon trajectories, uc, ty, Iz are the coordi
nate of the point of the shortest distance between the continuations of muon
tracks (this point is taken on one of the trajectories) ; J9 - is the shortest
distance between the continuations of muon tracks. R - is the distance b e
tween the points of intersection of two tracks with optical plane.
The necessary condition for muon pair to be created in one act is as
follows :
f/r $ oC (i) where cC. T£
&lfi- is the mean error of direction of one muon
A / c - is determined by Coulomb Scattering of two muons in U- pain
4 Ui Horisontal plane at which the back focuses of all cameras were adjusted.

181 2 2
(A'Jfc)f . (E. /Ej2) . t; (Ayc)2 . ( » £ / > £ ) . . E^ - 21 M«V E x 2 - the energy of muon,
t - is the amount of the substanc« in cascade unit« pass ed oy muon.
From (2) »t follows that
U T c ) 2 • E 2 / ( $ 2 . 1 ' ?"• E, E2
when E 1 , 2 » E 2 , 1 ; ^ ' E 2 , l (3)
when &x - E 2 then E 1 2 • E "/JT ( 4)
If we take t • 60, then if cC* 6 mrad, 6 ^ • 2 mrad, E*5i40 GeV
3. The experimental results
Por the search of JJ - pairs, satisfying the criterion ( l) with 0 t " 6
i -ad, the experimental material of arrangement exploitation during 1530 hours
was utilized. Further we name the //-pairs, which agree with the criterion
> l) with CC" 6 mrad-plane pairs. For the search of plane i i - pairs in
today analysis we used only such cases in which minimum four tracks of 2)
muons passed through all four spark gaps ' . The/fcwere 343 of such cases.
The spectrum of EAS relative the total number of electrons for these s e
lected cases is given in Fig« 2.
In Fig. 3 the distribution of plane U- pairs with øC' 6 mrad and s in£
^ 0 , 0 1 versus I z and also the distribution of background events con -
nected with occasional intersection of muon trajectories presented. The num
ber of occasional intersections was cal dilated for assumed values of oC and
condition s'mQ ^ 0,01 with util&SOkpf the distribution in angles between muons
determined previously our installation ^ The numbers of such events can be
determined also experimentally according to the number of intersection of muon
pair tracks, with vertices under the optical plane assuming that the number of
occasional intersections under- the installation is equal to the number of such
intersections above the spark chambers. The truth of this supposition is proved
2) This condition was imposed since we wanted in first place to investigate the region near to the centres of EAS. For example the data o f " show that for EAS with Ne • 4»lo 5 the average density of muon flux at 5 m ' from the coreis iS .
particle ~ - L 2
m

\?2
L*\ c -liculotior of the riamh.*r oi i i uon ^jciir li ^i.c-ctoi H*» inw*r *t_*t„.iri,; . it>u..-
.»•id uralar the spark chamber IndepjncieriUy ol Uic vo luu " i 3 / j ' . Tl •••>-.•.•
numbers a re equal with Die accuracy about I D £. We s i o ( T i g . ."*) Uwi,
un the average the ca lcu la ted v. i luo ui the o J t k ^ i u u r i d is m ayi i-omunt
v.ith an <=stimnteu ba>-kqround f rom h e experi 'ner.t. We s _-o i!.^t 1:1 tl i<--
in lervoi '* £ It £ 15 rn above spark chanib^-rb L'u-ro i.= an <_•* . . ^ -i \ '.-r
i icos o." p lan» A / - pa i rs above the backg round .
,/tXJJQti
//.
rt> W «3 Äi-/;
Fig 2 . I h e spectrum of E A 5 r e l a
tive the total number of electron for s e
lected c a s e s in which U - pa i r s were
s e a r c h e d
Fig. 3 . T h e distribution of plunc
I/- pa i r s v e r s u s I z - the height < J JU- pair ve r tex above spark chain
b e r s optical plane in metres . ?olid i
e f f e c t s background. Dotted line—expe
mental background; Dash - dot line
background ( e m u l a t e d ) .
Th i s interval of X z co r r e sponds the location of the ionisation calorimeter , 2
and upper part of the ground above the spark chambers . We obtain with 3f
test for the probability of the occasional e x c e s s a p p e a r a n c e in this interval th
value 2 -1%. We make an estimation of t ransversa l muon momenta in se lected
l/- pa i r s . With the help of ( 3) , ( 4) we rece ive :
P z C £, 7£ \fz • sin JL. <ST 3 - • sin© f o r
E l * E 2 and P~
n *£t s i n Ø for the case
. 2 vr C £ . 2 • sinØ for E 1 2 » E 2 > 1 .
W i e find that for se lec ted plane JLt- pa i r s © - 0,05 and s o P^. C }>, 1,4 - 2 G.i

183
•i. l'lu- J 'J=(_ü=.^ w rJ_oj _UT <.• _ r " a u l t a
l-'or Un.' pu ipos i . ' to c l cu t up Ulf n a t u r e of Uie i/xcoss> in Du- nu inbw
ol p l a n e . - p a i r s in Ihe in terva l 9 ,,, ^j I / I3 10 rn we l a k e into c o n s i d -
< ra t ion the iol lowing e f f e c t s :
1} T u e Lreui o h ol two o r more rriuons in the d e c a y s ol r i ons or k n o n s
i jenet-ated in n u c l e a r c a s c a d e in ion iza t ion c a l o r i m e t e r in l e a d .
2) , ' - p a i r s e r e c t i o n b y r e a l p h o t o n s in n u c l e a r c a s c a d e in l e a d .
3) - p a i r c r e a t i o n b y E A S m u o n s in e l e c t r o m a g n e t i c i n t e r a c t i o n s
in t he ma te r i a l ot c a l o r i m e t e r .
4) T h e b a c k g r o u n d from p h o t o n u c l e a r i n t e r a c t i o n s o( E A S m u o n s in
l e a d o r g r o u n d .
It w a s l o u n d that n o m o r e t h a n ~C>i3 e v e n t s c a n b e r e l a t e d to b a c k -£3j
g r o u n d e f fec t s 1 - 4 for all o u r s t a t i s t i c s
W e m a d e the e s t i m a t e of c r o s s s e c t i o n for / / - p a i r s c r e a t i o n b y E A S
hadronfa . tn t he s u p p o s i t i o n tha t t h e c r o s s s e c t i o n for //- p a i r s c r e a t i o n
b y E A S h a d r o n s i s £ \ . ? A , t he a tomic w e i g h t of t a r g e t n u c l e u s a n d know'ing
t h e e n e r g y s p e c t r u m of E A S h a d r o n s o b t a i n e d with o u r c o m p l e x a r r a n g erm? nl
a n d t h e a c c e p t a n c e for id - p a i r s r e g i s t r a t i o n b y s p a r k c h a m b e r s w e c a n J . ^ / , L-SJ
e s t i m a t e tha t 0 / 1 * ^ ^ 0 , 2 mb/n.
T h i s e s t i m a t e i s c o n s i d e r a b l y m o r e t h a n t h e v a l u e of ^MM/J, " «V* *"/*
o b t a i n e d in a c c e l e r a t o r e x p e r i m e n t s for jU - p a i r f f r o m *)[f - p a r t i c l e s ( a t
e q u i v a l e n t e n e r g y of p r o t o n s in ISR C E R N ( g ^ . / S . ^ 0 , 0 5 ubjri^) .
'^aar i-3 b r a n c h i n g for two muon d e c a y of j f - p a r t i c l e . It c a n b e s h o w n
tha t c a s c a d e mult ipl icat ion of h a d r o n s in t he ma te r i a l of c a l o r i m e t e r Of" in j £17
t h e g r o u n d c a n ' t e x p l a i n h i g h v a l u e of <Suj,/n • ' n F i g . 4 w e p r e s e n t t h e
e x p e c t e d r e l a t i v e d e p e n d e n c e s of jC/~ p a i r s o u t p u t a s f u n c t i o n s of h a d r o n
e n e r g y for different I/- p a i r s c r o » - s e c t i o n d e p e n d e n c e s o n h a d r o n s
e n e r g i e s a n d for h a d r o n s . i e c t r u m in E A S o b t a i n e d o n o u r c o m p l e x a r r a n g e
ment .
It i s s e e n tna t t h e m e d i a n e n e r g y £Jv i s a b o u t 10 T e V to r a s s u m p t i o n
in a c c e l e r a t o r a n a a b o v e a c c e l e r a t o r e n e r g y r e g i o n s j c u r v e l . y a n d is a b o u t
20 T e V w h e n & M / / I ( E h ) s t a r t s to i n c r e a s e * » E h from E h Cr 100 T e V
( u n i t a r y limit r e g i o n ) , c u r v e 2 . Now a s s a u m e t h a t o b s e r v e d At ~ p a i r s
with t h e v e r t i c e s in c c J o r i m e t e r o r u p p e r l a y e r of g r o u n d c a u s e d b y two

184
ilh n
law of energy and momentum we then have that M -c" ^ 2P^ • c
particle decay oi noi stable particle wilh mass M . From the- conservation x 2 .
where P, • c is median value
of Pu • c tor muons in Zf-pair.
frtfjfatä T h e n M . c 2 > 3 - 4 OoV. If
we assume that these particles
are created by hadrons on the
depth about One nuclear mean
path then the decay path (d for
them would be Of 2 - 3 m
Mi • c 2
*-—
-4: . ^ KM_L J ^ ( 5 )
oi / m m mm ' t k - n v Substitute in (5) fe 2r2 - 3 m,
Fig. 4. The relative output cf / / -pairs Mx- c 0»3 - 4 GeV, Ex jj,
of direct production. Abscissae: laboratory J-00 GeV we obtain Z^ «£ ( 2-f 4) • — 10
hadron energy. Ordinates : product of cross * 10 sec. Since £t - pairs
section for JU -pair creation on differential can be created by hadrons gal -
energy spectrum of EAS hadrons (in arbi- loped the calorimeter thCh Z^ is
trtjry units) . the- upper border of Z , .
We conclude that our results
show the evidence for appreciable creation in strong interactions «t the energies
greater than energies at CERN ISR approximately Several times/ the pairs
of new particles, charmed hadrons or heavy leptons.
References
1. E.VJBasarov, R. U. Beisembaev, S.P. Beschapov, Ju. N. Vavilov et al. 13-th Intern. Cosmic Ray Conferences 1973, Vol. 3, 1908, Denver USA
2. [JN. Kirov, J.N. Stamenov et al, (svestia AN USSR physical seria Vol.40, 1008, 1976
3. E,V, Basarov, R.U. Beisembaev, S.P. Beschapov, Ju. N.Vavilov, L.I. Vil-danova, Trudi FIAN, Vd!. 109, "Nauka" ( Inpress) 1977
4. A. Donnachie and P.V. Landshoff "Nuclear physics" B 112 ( 1976) , 23 Z
5. V.A. /^imachin, N.M. Nesterova and A.G. Dubovi, submitted 15-th
Intern. Cosmic Ray Conferences 1977 .

ISS
CV LOOAU.T GSnRATK) BHDUS OT TM fWmTBATIIG PABTICLmS iff IBB DBTH OP 200 M.W.B.
T.T. Baaaavelt. G.A. OntDelaahvlll, O.I.Levi* I.V. KhaMeeva* D.A. Brlatavl» I.A. BrUtand..
Institute of fnysiea, Academy of Saiemeas of the Georgian SSM, 3*3077, Guraniahvlli a tr .6 . ,
Thtllaal-77, DBSR.
Uslag eight-layer spark calorimeter of 2,*» 2 area, located at the dapth of 76» of rock, bandies of penetrating particle«» generated at different a l t i tude above tha- installation ara studied» Number of partlelaa ln the- bandies l a ^. 2» riv« event» with convergenca point in tha air above tha calorimeter hava bean registered» Sona geometric: and energetic characteristics of these bundles are considered and
mechanism of their generation i s dlacuasad.
Bxperlnental material was obtained by means of tha spatk calorimeters of tha Institute of Physics of the Academy of Sciences of the Georgian SSR in Tbilissi» Tha installations are located in tha underground compartment at the- depth of 200 m.w*e. The "big spark calo rimet er" consists of eight roan of "TO cm gap spark chambers» separated by lead absorbers» each 10 cascade units thick« Th» area of each layer of the chambers la 2.4 m • The distance between upper and lower layer i s 2m* Tha average clearance between the upper shelf and the ceeling of the compartment i s 66 emu The "small apark calorimeter" l a Inclined towards the vertical at 64° angi*» I t has analogous arrangement» The area of each layer of chambers Is 0,6m » The triggering system on both calorimeters i s composed of three -trays of Geiger-Müller counters of an area of 14000 on Th« traya are located in the upper, middle and lower parts of each of the calorimeters and earn generate different trigger pulses»
Material included into treatment was obtained during tha experiment aimed at investigation of tha groups of parallel penetrating particles in SAS composition» For the triggering of big calo-

186
passing of on» os novo partlalas threngb the apper Calami two oz novo psvtiolos rhrnngh too nlddlo and lønar
trsyo (1x2 »2) van reqaired. In th» pxoeoaa of hi« ealorlaeter data proeaoaing an attantion had baas draan to the necass l^ to broaden
tjp» sang» of th» registered eventsi therefore tho triggering of mal l calorimeter nan adjusted to respond «ban «van a
singl* partial» posses throng* «ash of th» trays (1 «1 »1). Tb» nat working t in« of th» largo ealoxlneter i « 3600 hours. In» snail oa-lorimeter bas bean working 400 hens» to data» Th» «vants was» registered by noons of the atareopbotocanera on 190 an aid» Photographie fita» More than 800 cases of noltipl» panotrating particles passing tferongh tbo wait was» recorded»
Th» events consisting of 2 or nor» particles converging at Altitude- of up t o 10 n. aba*» the unit wer» selected . I t -was required tbat each of these tracks would pass through not l e s s than two spark: cbanbaxs. A tota l of ?2 events with nol t ip l ie i ty ranging f sos 2 t o 10 war» selected» They can conditionally be devided into thro» kinds* events with tb» convergence point in the rock above tbft unit (44 events)« events witb th» convergence point within the unf.t (23 events) and: events nLth th» convergence point in the air-above the unit (5 events). Let «a consider possible mechanisns of fotmation of these events.
M«" r i» iif weight i e processes locally generating multiple events under ground, f a l l s on elactroproduotion process, caused by high energy noons» Cross section of th» process o M-D can be presented in tb» following
os» taking into account the rang» of essential energies of nuons and tnair energy spectra» ^ _
er^p = 1,2s tt & rp where o yp -average total cross section of photoproduction, equal
to 125 pt> t V, -transf ered energy, Ej* - energy of incident nuon. (Cross sections per on» nucleon is kept in nind).

J87
Th» expected mxtber of electroproductions YV in the so l l lagrar (standard rook) with V thickness above the unit ia given by th» expression.
«tor« N ia tha f lax of •nona with energy ^ 4£ Gov during th» operation pariod within tha solid angla acceptance of instal lation, />-number of nuclaons (taking into account that A «ffA =
th* nattar «ola» consideration. All the valnes used in calculations are taken in their upper boundary area» Maxiaua expected number YV of •leotraproduations in one neter of so i l above the «nit («a take this valne to exclude as far as possible abaor-btion of secondary particles in s o i l doe to the nuclear and electromagnetic interaction*.) and within the solid angle acceptance of installation i s equal to 25*. sxparimentally obaerved number of events locally generated «Lthin 1m of s o i l above the unit i s equal to 20» Thus» for these events the recording efficiency i s not leas than 0.08. This i s explained by absorbtion of secondary hadrons in the so i l and in th» calorimeter matter ( total thicknesa of lead absorbers- in calorimeter i s equal t o 1 mean path for nuclear interaction for pions) and by s tr ic t requirements imposed on the tr igger, aa said above» the experiment was aimed at recording the par -r a l l e l muon groups» This result i s in qualitativ» accordance with the recording efficiency of eleetraproduction in th» installation absorbers. Hera, the expected number of eleetroproduotions i s equal to 204, while experimentally observed number i s 20. Hence, the recording efficiency here i s somewhat higher, and equals 0 , 1 . Thus, viewed as a> wholes the recording efficiency of eleetropro-duction does not exceed '10£»
Let us consider no» 5 events with convergence point in the air show» th» unit» These events as» schematically presented in Fig» 1» Brrors i s determination of track convergence points position are du» t o errors in measurement of tracar slop» and location in th» sneak- chambers» The average error in determination of track «loa* I s 2 ft rd, errors in determination of trank location i s about 2 mm along to» front sid» of the unit» By depth th is error
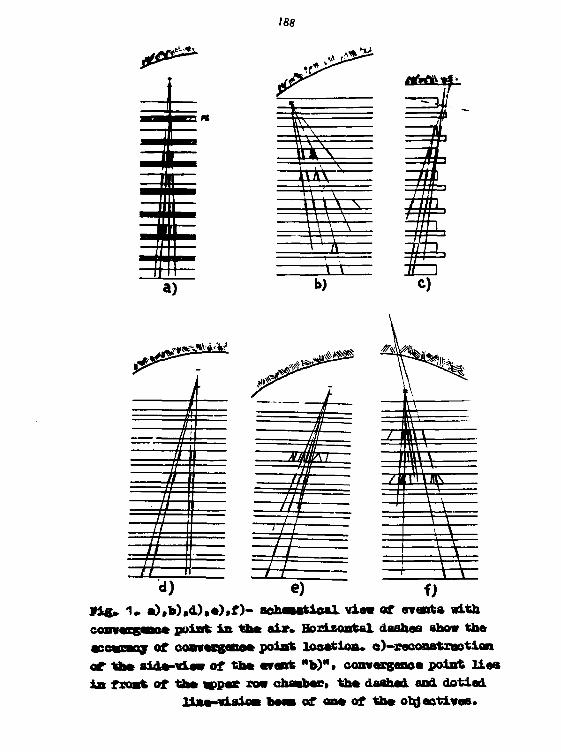
188
Vig» 1» a) ,b) ,d)»«)tf)- *oh—tlcal via« of event» with convaxgano* point i n tha- air» Horizontal dastaas sho« tha acevraøj of aomazgaBo* point location* oVraconatrnotion of the aida-vla« of th* «rant "b) H , convaxgano« point l i a s in front of that «pp«r roa chaabar» th* daahad and dotiad
lina-vlnlo» baa» of on« of th« objectives.

189 l a larger» doe to. l i t t l e stereo base of the camera. Thla reduce« the accuracy of track angle and location determination In perpen-dicalar direction (compare» for exanple fig» 1b and 1c). In the composition of a l l f ive events there are three tracks, converging Into a single point located within the area» determined by the accuracy of measurement. 2 event« have 1 additional track each, pea-sing, through one spark chamber and going to the sane point, however*, these tracks did not satisfy the selection criteria» In a l l 5 events not less than one track gives additional interaction in the unit absorber with a fomation of one additional part ic le .
Interpretation of these events causes great d i f f icul t ies . In view of small cross-section i t i s possible to neglect processes of electropxodnction and direst /*.+/*~ p a i r P rodaation b j high energy moons on qir nuclei» tube only process, which can give a real contribution to generation of auch events I s three pionio decay of
« - -mesons, created i n the process of electroproduction in s o i l above the uui
Let us evaluate the expected number of events
where \ H k /> i s the average number of K- mesons per one act of electioprodnetion, equal to 0,4 at muon energies substantially contributing to> the process under consideration, P -probability of the decay of K± mesons in 3. pions, equal to 5»t.10~ ,
UT -probability of K 4 , decay in the s i r above the unit, k -efficiency of event recording with K' decay. The rough consideration of th i s efficiency showed, that i t exceeds the efficiency of recording of electroproduction events without creation or decay of K'" mesons not sore than three times. Let us take for fe the value JC*. Considering that « - meson can be crested at any alt itude in s o i l above to* unit and demanding that K mesons energy mast be higher than 1 Gev» that i s minimum energy , required to pass the particle through a l l f i l t e r s of the unit, we obtain the expected value l\lK~i , with 5 events observed during the experiment., I t should be underlined» ishat for a l l the quantit y « In the calculation only the top values were considered, fro».

190 tability of the observing of 5 K meaona decays at the expeo-ted average number of 1 ia only about O.jPJ.
We do not interprete thla rtault for the time being. The only poaaibility (if the obtained data ia sufficiently provided) is the existence of a stable particle with life time 10~ 9-10~ 1 0, having the three-particle decay mode. It ia poaaible that these events are of the same nature aa the obaerved onea in the well-known experiment in Kolar Gold Mines''.
Analisis of the secondary particlea nature (hadrona or muons) is a complicated matter, however, it ia atill being carried on. The assembly of installation with larger acceptance and registration accuraay able to give more camplete information about registered events is in its final staget
The authors express their indebtness to E.L.Andronikashvili for his support of this work and O.V.Kancheli for valuable advices and discussions.
References 1. L.H.Hand. Phys.Rev. 122, 183*»- (196?)
S.D.Drell and J.D.Walecka, Ann.Phys. (H.Y.) 28, 18 (1964) 2. V.Heyen, H.Meyer, B.Naroska, D.Notz. DESI, prepr int 71/5
(197D 3« M.R.Krishnaswaray, M.G.K.Menon, V.S.Narasinham, H.Ito,
S.Kawakami, S.Miyake. Physics Letters, 57B, N.l, 105 (1975)

191
xaraøraurion or ntnrxpu HUOM At MI
T.T.BWMTOU, «•»•UaUaaaaUl, 0#j»G**aalaaBViU C.l.Lari», I.V.Qialdaavat D.i.trlatavl, n,:.,*x\*$wri.
laatlttata of Pbjalaa, Aaaaaagr of fieaaaoaa of ana 0«acB>aa 3a»,
Tblltaal, UB8R
Wltb tb» htlp of tvo ldeatloal apark ealorlaafeara -
aartlaal aad sloping a« «h* angla of 6«°« lntaaai«ya anaxgaaie
aad gaoaaaric ehanctarlatloa of aaltlpla auoaa arc asuAiadu
A oompariaoo witü toa data of os^or authors la eavxlod
out and tba dagroe of agreaaent with tøa accepted aodel of
foxaoaloa of peootratlog eoapooent of cosaic radiation la
considered*
5

>«: The Response Funct ion of Cosa ic - ray
Muons Seep Underground
L.K. Ng and C.H. Poon Physics Department, University of. Hong Kong,
Hong Kong.
Theoretic»! [2J Experimental Q Bolh Q
I The response curves at Bea level for several muon cut-off energies were obtained. They are then used to calculate the ennancexnent factors and hence the response function at various depths underground.
Coordinates:
MG 6.8
Mailing address: Dr. L.K. Ng, Physics Department, University of Kong Kong, Hong Kong.

193
rrmoY SPECTRUM OP A LEPT« PAIR (Contribution froa Virtual Breaaatrahlung). A.I.Hikishov, Lebedev Physical Inatitute, Leninsky Proa-
pect 53, Moacow 117333, USSR. Abstract: The energy spectrum of a lepton pair produced
by an incident lopton via virtual bremsatrahlung ia obtained. The masses m and M of pair leptona and of an incident lepton are kept arbitrary. For a nonacreened Coulomb centre aa a target the result is relatively simple. In a case of screened Coulomb centre we use an analitical approximation for the acre en ing functions yd ' r» °* Bethe. The corrections due to elastic nuclear form factor are also included. For real photon emission by an inciden* "mon these corrections are ir a good agreement with the earlier used parametriaation.
1. Pair production by a lepton colliding with a Coulomb centre.
We denote by r , P , K » Q, the 4-momenta of the incident and scattered leptons, virtual bremsstrahlung photon (K—p + pf ) and Coulomb photon. Similarly p , p* are 4-momenta of pair leptons. Finally,P —P =~At, p^syO'^r- mlt «l=-Alfmd k = C =1 , cl. = eytX* 1/137.
The cross section 6p has the form
where Gg-fjf) ifl t a e virtual bremsstrahlung cross section:
The trace/jT^ in (2) can be obtained from Jj/n,V defined in eq. (2rin [ 1J by substitutions^'-*/?' ,y&* -P ,K~+~K . Similarly the integral over the directions of p and K in (2) can be obtained from eq.(33-b) in [ Jby substitutions 7^'ifj ' £-£""*• . W"-»iV .«£"*-£ ,/4.+M. ,
p(+ jj?j , p •* | P'J ,4-»J , G "+'- (iJi) f£yn . (Justification: the integration over ft'gives a function of K- P and the subsequent integration of this function over the

194
dir»otlone of P ia äquivalent to the integration over the directiona of K ) .
6\ in (2) together with 6 ^ obtained in l 2 ] de r in« the quantity of intereet<T=6y + tf^ { the integrande give the differential oroaa aaotiona.
Por ultraralativiatio oaaa (P0 , P^ . A , » ^ / | ) »a get fro« (2) P-M ** , .
c = i&XlpnäL f ' d^f^'i* ia').
I r, tf^r/ J l ^ p T ^ 'J*
Setting hare (*n/A)*~ X(f-~x) a n d Integrating over / we obtain
fltV- j ^ - * rJ<-njiK0& Jl) (4)

195
Por i » i wr find fo-i J *»d Jf *n ej.(b)
Jf=- f('+jl) + h * f W ' - y+ti:«1*?')**!!"' 2, Screening and f ini ta nnolaar aisa oorraotiona. Rapaating aalnly Bath« oaloulationa £ Jwe gat { P0, r0 ,
K0i>M, Å i mt
i B t b * « l^tron aaaa)
3 ^ }-w^ vfalfwni iK). Hera by definition * *¥ •
*--f/t£\ •**-..*«*, *.*• 4; Ä £ ,
In oqa. (6), (7) tlf) and fytyj mr» respectively atoalo and nnelaar fora factors, d ia tha laaat aoaanton tranafarred to
tho atoa, fa , A^ ara oorraotiona dua to a finita nnolaar
aisa«
For \—0 aqa. (2), (€) give tha' breasstrahlong
cross saotion (of. \ty

To integrate over \ (see •<)•. (1), (2), (6)) we uae the approximation« [5J
Here 1/ ia • coefficient «ligbtlj depending on / . Por the anon M. ~ *M,* end we find l/ % J/^ .
Finally we get «'•»'*/* -/ ^ ^
*^(A) -4(^57) **k(i) * AwjA i ,
i i, 9 Si ltfx B+61 fff,'

19?
The oaat <£ -* 1 oorraaponda to tha abaanca of eoreeninc.fhen Jf-* «X da/lned In aq* (4 ) . For tha «oat iaporta^t (torM*>*i) oaaa 2 » 1 we hava ä
For 2 » 1 and (complete acre^nlng) wa gat
'J ia the aaae aa in aq. (5).
For a point nucleus we hava , For a point nucleus we have
til IT
Fron here for 2 >> 1 we obtain
J is defined in eq. (5)«
For -0>"i, £ • » 1 eq. OS) *ak#s the fora

•98
*t[-3(**ft)*iy}i--y <"> Bq. (15). (16) agraa with aq. (7) la [bJ with logarithmic accuracy.
For »ore dataila on the aubjeot aae A.I.Iikiahov, Preprint FIAI I 69,1976.
Referenoaa
1, A.I.Hikisho*, H.V.Pichkurov. Jadern. Pi*. 24^ 153, 1976. 2» G.Racah. Kuovo Cin. 21» 93, 1937. 3. H.A.Bethe. Proo. Cawb. Phyl. Soc. 0,524, 1934. 4. E.V.Bugaev, L.S.Dedenko. Krat. aoob. po fis. H 7,
44, 1976. §. A.A.Petrukhin, Y.V.SheatakoT. Canad. Jour. Phya. 4,6,
S 377, 1968. 6. S.B.Kelner, Tu.D.Kotor. Canad. Jour. Phya. j 6, S 387, 1968.

199
l..C.i"iOdwilro
..ÜÜCCV, :;tuti IniVvirclty
V.^..:.uzmin, 1. »".h&røt.vkh
Institute for Uuclacj ..joacrch of
thi iioadany of Sciincas of th; I. ..
Thsoretical
Spectra of diraet leptone (mons end nautr^CQ) produced
In eti-iosphera era coleulatad. Poøalbilltlao of detection of
direct uuons produced ln dansa mattar by cosmic ray h&drona
with energies higher than IQr Gav ara considered.
Coordinates: III« 2.3» iuon spectra, chsnga ratio sod groi
fa l l ing eddrese:
Dr. T.^.Zhelesnykh
Institute for i\"ucl»ai- Research
of the Academy of Sciances of the LioSii
Profsojuzneje 7 a, Moscow 117312, USSR

200 MOMENTUM SPECTRA AND CHARGE RATIO Or MUONS AS A FUNCTION OF ZENITH ANGLES
6. D. Badhwar and S •'. . phens* NASA Johnson Space Center Houston, Texas 77058 USA
The sea-level muon momentum spectrum and charge ratio, w +/u", have been calculated In the 1 to 5000 GeV/c momentum range for incident zenith angles of up to 79°. This calculation 1s an extension of our earlier vertical muon calculation in which an excellent interpretation of both the absolute vertical muon spectrum and the u +/u" ratio 1n the same momentum range was provided. A comparison of the present calculations with the observed data again shows excellent agreement In both the absolute differential intensity and v lv~ at all of the calculated zenith angles. Thus, it reinforces our earlier conclusion that, at present, there is no need to Invoke a change either 1n the cosmic ray energy spectrum or the hadron-hadron collision characteristics up to about 101* GeV/c.
1. Introduction. In the last few years a number of attempts have been made to understand the observed sea-level muon momentum spectrum and v /v~ charge ratio assuming that scaling 1s valid in nuclear interactions over the energy range of interest. Most of these calculations have used approximations such as neglecting kaon contribution, energy dependence of p-p inelastic cross-sections, and nuclear effects. Based on such approximate calculations, some of the authors have concluded that in order to explain the observational data one has to invoke some new feature of high energy interactions and (or) a rather drastic change in the chemical composition of the primary cosmic rays at high energies compared to that observed at energies £ 400 GeV/n. Recently, Badhwar et al. 1
(henceforth refered to as Paper I) developed a representation of the pion and kaon invariant cross-sections that fits all available data In proton-proton and proton-nucleus collisions In the 6.6 to 1500 GeV/c momentum range. This representation was used to explain satisfactorily, and in great detail, both the observed vertical muon momentum spectrum and the charge ratio 1n the 1 to 5000 GeV/c range without Invoking a change in either the cosmic ray chemical composition, the spectral shape or the characteristics of hadron-hadron collisions as suggested by other workers. It 1s Important to point out that In this calculation, the transport equations of plons and kaons were rfgoruously solved and account was taken of the observed Increase of the p-p Inelastic cross-section and the variation of scale height with atmospheric depth.
However, to make the situation more confused, Allkofer et al. 2 and Kasha et al.3
have pointed out recently that the results of their calculations for an Incident zenith angle of 75° do not fit the scaling hypothesis and require a change in the primary cosmic ray chemical composition and spectral shape to understand their data. In view of this and the fact that the calculations of Paper I fitted well the vertical muon data 1, we have extended our previous calculation to Incident zenith angles of up to 79° and compared them with the available experimental data. 2. Need and Justification of a New Calculation. In order to bring out the drawbacks of earlier calculations and to focus attention on the Improvements •NASA NRC Sr. Research Associate now at Tata Institute of Fundamental Research

201 we have Incorporated, Me consider briefly the earlier works 1n this field. At the time of the calculations of Maeda1* and Ashbury «t il. s, in the late sixties no accelerator data from ISR and FNAL on pion and kaon production WAS available. They, therefore assumed that the pion and kaon spectra fall off exponentially with depth without any change in the shape of the spectru*. In Paoer I, we have already shown that this assumption is not valid and the shape of the spectrum changes continuously with depth. Moreover, as noted by Ashbury et al. 5 themselves, their treatment 1s not valid below about 100 GeV «won energy due to large uncertainties In the effective altitude at which meson production and decay occur. Kasha et al. 3 made a Monte Carlo calculation for muons of energy above i30 GeV using a plon and kaon production due to Adair 6; however, they grouped all mesons together and used a proton spectrum flatter than the one measured by Ryan et al .7
It 1s however evident that one cannot treat plons and kaons together because they propagate differently In the atmosphere due to their different decay kinematics and lifetimes. It should also be remarked that they calculated only the ratio of the Intensities at zenith angles of 30° and 75° and not the absolute differential flux. The disagreement between their own measurements and calculation 1s very large and Increases with the muon momentum, thus making 1t necessary for then to conclude that the cosmic ray flux above 100 GeV Is richer in heavy nuclei than is indicated by observations. As for the model of Adair 7 used 1n the above calculation, It predicts in high energy p-p collisions a production ratio for ir +A~ of 1.80 which Is very high compared to the value of 1.66 obtained In three separate recent investigations'»8>9 and in fact is the highest calculated value in the literature. This model also predicts a ir+Ar" ratio In p-beryllium collisions that is very high compared to observations. Finally, 1t utilizes the invariant cross-section at only one fixed value of p-), namely 0.4 GeV/c. Dau et al. 1 0 adopted the simplified equations of Maeda1* in which all numerical integrations were replaced by approximate analytical expressions. They also assumed that (i) all muons are produced after a penetration of 100 g cm-2 of the parent particle at the local zenith angle and (11) that the spectral index of pions and kaons 1s the same as the Input proton spectrum, Independent of the atmospheric depth. Both of these assumptions are in error. A rigorous calculate n of the plon and kaon spectra as a function of depth (Paper I), from first principles, shows that the spectral Index changes continuously as a function of depth. Thus, the conclusion of Oau et al. 5 that the spectral Index changes around -v-300 GeV/n from 2.73 ± .03 to 2.57 + .03, In contradiction with direct measurements of the proton spectrum of Ryan et al. 7, cannot be taken seriously. Murakami et al. 1 1 have made a more rigorous calculation 1n which they have solved the cascade equations of charged plons and kaons. They restricted their calculation to only 0° and 75° and did not calculate the ir+/it" ratio. The following points are worth noting about this calculation: (1) 1n setting up the transport equation they neglected the term due to the finite Inelasticity of the collisions; (11) they used a power law proton spectrum with Index 2.75 down to 1.2 GeV contrary to observations; (111) they used the Carey et al. 1 2
representation of the Invariant cross-section and assumed that the $ame representation applies to both iT and ir~; and (1v) they used the same representation for K+ and K". It was noted by Carey et al. 1 2 that their representation Is valid for p, » m for n* and ir° only. Indeed, the representation Is not valid for low values *

202 of p, and xt,. Since a fair fraction of tne cross-section 1s below P ] ^ this representation is clearly not accurate. Moreover, the assumption that w and »" have the same representation forces the tr/*" ratio at production to be 1.27 and r.ot 1.66 as mentioned earlier. Clearly, therefore, there 1s a need for a more accurate calculation of the muon momentum spectrum and charge ratio at various zenith angles. 3. Derivation and Results. Following the procedure adopted In Paper I, we have calculated 1n the present paper the muon momentum spectra and charge ratio as a function of zenith angle. Briefly, the method involved the solving of the pion and kaon transport equation rigorously. The transport equation describes the depth dependence of plons or kaons and Includes all possible production and loss mechanisms. In Figure 1, we have compared our calculated intensity (solid lines) for an incident zenith angle of 75°, with those due to Murakami et al. 1 1
(dashed lines). Curve A gives the contribution due to plons produced from proton-air collisions alone, and Curve B from heavy nuclei collisions. Curve B of Murakami et al. 1 1 falls within 5* of our curve. We note that the calculations of Murakami et al. 1 1 yield muon intensity from the pion chain of proton-a1r collisions alone to be equal or larger than the experimental data of Allkofer et al. 2 at all energies, though the general shape appears to be consistent up to * 400 GeV. At higher energies, the calculated vertical and 75° spectrum of Murakami et al. 1 1 is steeper than the observed spectra. Since this happens at about the same energy for both angles and does not appear to be the case 1n our calculation, we suspect the origin of this to be a combined effect of the representation differences, the neglect of inelasticity term by Murakami et al. and some approximations made In the solution of the transport equations. In Figure 2, we have plotted the product of the cube of the muon momentum, P y, and our calculated differential muon Intensity at Incident zenith angles of 30°, 65°, 72", 75° and 79°. For comparison the data of Lelpuner et al. 1 3 at 30°, Abdel-Monem et al. 1 5 at 65°, Allkofer et al. 2, Ashbury et al. 5 and Lelpuner et al. 1 3» 3 at (75°) and of Allkofer et al. 2 at 79° are shown. The most accurate measurements here are those of Allkofer et al. 2 at 75° and 79°. It has been noticed before by Allkofer et al. 2 that the 75° data of Lelpuner et al. 1 3 fall systematically below their data and that the shape of the muon spectrum below about 150 GsV/c 1s significantly different from their's. This effect appears to us to be present at 30* also. We, therefore, note that except for this
Fig. 1 - A comparison of the present calculation with those of Murakami et al. at an Incident zenith angle of 75°. Curve A is for pion chain from p-air collisions, Curve B 1s for pion chain from Z >. 2-air collisions and Curve C for Z >. l-a1r collisions and the K-u chain.

small discrepancy, the agreement between our calculation and th accurate measurements 1s good . all angles given here. Our calculations show that the charge ratio, y+/u", IS extremely Insensitive to the zenith angle. This Is experimentally supported by the data of Kasha et al. 5 and Burnett et al. 1 5. In Figure 3, we have plotted the calculated ratio u /u" at 75° as a function of momentum and compared 1t with the experimental data of Allkofer et al. 2, Burnett et al. 1 5, and Kasha et al. 1 3. We find that our calculated P + / P " varies from 1.265 at 10 GeV/c to 1.271 at 500 GeV/c. Burnett et al. 1 5 and Kasha et al. 3 find that n +/u~ 1.254+.021 in the 10 to 500 GeV/c range. Similarly, we find that the ratio between 1 and 5 TeV/c varies from 1.34 to 1.355 compared to the measured value of 1.378±.01516. There is thus good agreement between the calculated and observed values.
4. Conclusion. A detailed calcula-tion of both the sea-level muon momentum spectra and charge ratio at angles up to 79°, shows excellent agreement with the available experimental data in the 1 to 5000 GeV/c range. It shows that there is no need at present to Invoke any change in the cosmic ray chemical composition, the proton and helium spectra or the nature of the hadronic Interaction from what Is presently observed at proton energies up to ^1500 GeV. Indeed, 1f scaling in the relevant Sf 1= energy in c m . system/maximum transferable energy) region holds for hadrons of enerrles £ 1500 GeV, our calculations and the resultant excellent agreement with observations shows that cosmic ray proton and helium spectrum above 100 GeV continues with the same spectral
F1g. 2 - A plot of the differential muon Intensity multiplied by the indicated scale factors 1n (GeV/c)3/m2 sr sec GeV/c as a function of the muon momentum, P y, in GeV/c at 30°, 65°, 72°, 75° and 79 s. The data points A at 30° are due Leipuncr et al. 1 3, «due to Kasha et al. 3, A at 65° due Abdel-Monem et al.1"*, 75° • due to Allkofer et al. 2 and o due to Ashbury et al. 5, • due to Kasha et al. 3 and 79° points • due to Allkofer et al. 2.
F1g. 3 - A plot of the muon charge ratio, v+/v",at 75° zenith angle as a function of the muon momentum. The data 1s taken from • Allkofer et al. 2, • Burnett et a l . 1 5
and A from Kasha et al. 3. The solid U n e 1s the present calculation. Index of 2.75 up to at least about 10 TeV.
5. Acknowledgement. We would U k e to acknowledge very profitable discussions with professor R. R. Daniel regarding the contents of this work. Part of the

20« work of S. A. Stephens was supported by KASA-MtC and the Lockheed Electronic! Company, Inc., Houston, Texas. References 1.' G. D. Badhwar, S. A. Stephens, and R. L. Golden, Phys. Rev. 015. 820 (1977). 2. 0. C. Allkofer, K. Carstenson, H. D. Dau, H. Joklsch and H. JTHeyer, Proc.
of International Cosmic Ray Symposium on High Energy Cosmic Ray Modulation (published by Cosmic Ray Laboratory, University of Tokyo, Tokyo, Japan, pp 46-52, 1976).
3. H. Kasha, R. Kellog, B. H1ggs, L. Lelpuner and R. Larsen, Proc. 14th Int. Cosmic Ray Conf. (Nax Planck Institut für Extraterrestrische Physik), Vol. 6, 1868 (1975).
4. K. Haeda, Proc. 6th Interamerlcan Seminar on Cosmic Rays, La Paz, Bolivia (1970).
5. J. G. Ashbury, W. R. Cooper, L. Voyvodlc, B. J. Walker and T. P. Uangler, II Nuovo Clmento B66. 169 (1970).
6. R. K. Adair. PhysTTev. Letts. 33, 115 (1974). 7. M. J. Ryan, J. F. Ormes and V. K7 Balasubrahmanyan, Phys. Rev. Letts..
28. 958 (1972). 8. TT J. Hoffman, Phys. Rev. D12, 82 (1975). 9. M. G. Thompson and M. R. WfiaTley. J. Phys. G3, 1 (1977). 10. W. D. Dau, K. Carstensen and H. Joklsch, Proc. 14th International Cosmic
Ray Conf. (Max Planck Institut für Extraterrestrische Physik), Vol. 6, 1931 (1975).
11. K. Murakami, S. Saglsaka. A. Inove, Y. Mashlma and K. Nagashlma. Proc. of International Cosmic Ray Symposium on High Energy Cosmic Ray Modulation (published by University of Tokyo, Tokyo, Japan), pp 21-24 (1976).
12. D. C. Carey et al., Phys. Rev. Letts., 33, 327 (1974). 13. L. Lelpuner, R. Larsen, L. Smith, R. AdTir, B. H1ggs, H. Kasha and
R. Kellog, Proc. 13th Int. Conference on Cosmic Rays, Denver (Colorado Associated Univ. Press, Boulder. 1973). Vol. 3. 1771.
14. M. S. Abdel-Monen et al., Proc. 14th Int. Conference on Cosmic Rays (Max Planck Institut für Extraterrestrische Physik). Vol. 6. 2043 (1975).
15. T. H. Burnett et al., Phys. Rev. Letts., 30. 937 (1973). 16. G. K. Ashley. J. W. Keuffel and M. 0. Larson, Phys. Rev. D12, 20 (1975).

20S (/
l'a ir-product ion by 1 ightguantas and UK- new interpri-tjt >m. of tin* conservation iaws of physics.
Erich R. Bagge Institut für Reine und Angewandte Kernphysik, University of Kiel, 23 Kiel, Fed. Republ lc ct iVrmuiy
Abstxact: The new interpretation of the conservation iaws of physics has been apf iitii iu tiie process of electron pair production by light guantas, involving the states of negative energies of electrons in a more direct way than it has been done until now. There are remarkable differences between the predictions of this theory and the theory of Bethe and Keitler concerning the energy spectra of positrons and electrons.
1. The new conservation laws In ß-decay In several papers ((1), (2), (3), (4)) the idea has been discussed that the missing solar neutrinos can be understood by a new interpretation of the conservation laws of physics in the ß-decay of atomic nuclei. The basic assunption is that our world of physical phenomena has two sheets of real existence like the two sheets of a Riemanian plane. One of them is our normal physical world of observe ine facts and events and the other part is that one of nonobservabie facts and events which nevertheless is existing and in which particles also occupy states of well defined energies and momenta.
The two separate parts of this physical world as a whole are exactly corresponding to the well-known positive energy states on the one side (furthermore called: world) and to the states of negative energies in Diracs theory of holes (called: antiworld) for the creation of positive and negative electrons by high energetic light quanta.
We iwstulate now that the conservation lavs of physics have to be fulfilled strongly for the totality of positive and negative states together as an un-sepurablc unity. Normally we cannot observe particles in negative states of energy. Only when transitions of [articles from one to the other part of the whole world are going on we get informations on the states of particles in the antiworld and on their behaviour there. So the processes of creation and annihilation of particles are our sources for the knowledge of the physical nature of states in the antiworld. What we have learned about these states in studying the phenomena of ß-decay is that the particles behave like quanta without rest masses as long as they are members of the antiworld.
Nevertheless well-defined values of energies arv.1 mui.enta must be attributed 1o them and these must be taken into account vhen transitions from the opi
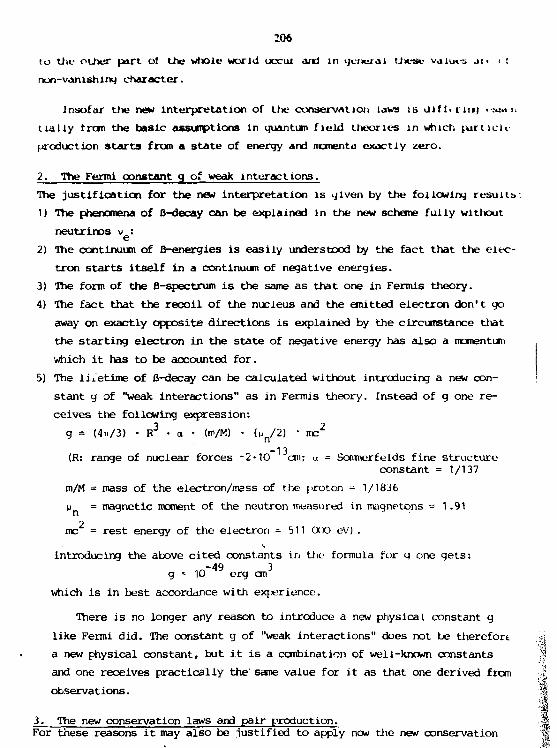
206
(o live other part o! the whole world occur and in general Utese values» ,iti i :
non-vanishing character.
Insofar the new interpretation of the conservation laws is d i l N r m j i-swii
t i a l l y from the basic assumptions in quantum f ie ld theories in which purlieu-
production s tarts from a s tate of energy and nomenta exactly zero.
2. The Fermi constant g of weak interactions.
The jus t i f i ca t ion for the new interpretation i s given by the following resuiit.
1) The phenomena of ß-decay can be explained in the new scheme fully without
neutrinos v : e 2) The continuum of ß-energies is easily understood by the fact that the elec
tron starts itself in a continuum of negative energies. 3) The form of the ß-spectrum is the same as that one in Fermis theory. 4) The fact that the recoil of the nucleus and the emitted electron don't go
away on exactly opposite directions is explained by the circumstance that the starting electron in the state of negative energy has also a momentum which it has to be accounted for.
5) The lifetime of ß-decay can be calculated without introducing a new constant g of "weak interactions" as in Fermis theory. Instead of g one receives the following expression:
g = (4*/3) • R 3 • a • (tr/M) • (M /2) ' n c 2
(R: range of nuclear forces -2-10 an; m = Sommerfelds fine structure constant = 1/137
m/M = mass of the electron/mass of the proton - 1/1836 u = magnetic noment of the neutron measured in magnetons = 1.91
2 mc = rest energy of the electron - 511 000 eV) .
Introducing the above cited constants in the formula for g one gets: -49 3 g - 10 erg cm
which is in best accordance with experience.
There is no longer any reason to introduce a new physical constant g like Fermi did. The constant g of "weak interactions" does not be therefore a new physical constant, but it is a combination of well-known constants and one receives practically the' same value for it as that one derived from observations.
3. The new conservation laws and pair production. For these reasons it may also be justified to apply now the new conservation

207
i<*ws to another fundamental process of particle creation, rusnely the JTUUIM.-
tion of electron-positron-pa Irs by high energetic light-quanta. This moans wi
have to recalculate the cross section for thin process, which originally «a«
calculated firstly by Sauter, Eethe and Heitier under the assunptlon that the
conservation of energy will hold for the world of positive energy states alom..
In this case the energies E_ for the electron and L + for the position producer
by a light quantun of the energy k are determined by the equation:
k - E + + E_ .
The momenta p_ for the electron and p for the positron have the values:
p =Æ^7 ~ 2
! p = mc ; c =» 1 ) P + = Æ + - w
Itiis is the nowadays generally accepted interpretation of pair production by
quantas in the world of observable events.
On the basis of the new interpretation of the conservation laws for the
combined world and antiworld as an unseparable unity this is not correct and
has to be replaced by the following equations:
Before the transition of the electron is going on it has a negative entry
E and correspondingly as a particle of rest mass zero the momentum, which is ;i
vector: E
p = - • e c c -
Here e is a unity vector in the direction of p-.
The light quantum k (also a vector) together with the energy E determines
the total energy of our system in its initial state.
After the transition - produced by the light quantum - we have two partic
les, positron and electron of energies L and E_.
Conservation of energy in _ne systar. of world and antiworld means now: The suii;>
of energies before and after the transition must be the same:
E + k = E + E . (E < 0) .
I Conservation of momenta for the two parts of the whole world on the other
side postulates the equality of the sums of momenta before and after the tran
sition: £ + k = p + + p_
In this way the energies and the momenta of positron and electron are fully
fixed when you know the energy E and the momentum r> of the starting electron
in the antiworld. In a single process this energy E and the momertuir p at\' con-

208 [jirLety unknown and uan be oeterminod only alterwuius by a direct imiiujaim ol t , p , E_ and p_ 4. The energy spectra for positrons and electrons. But by quantum mechanics the probabilities for all possible values of t and p can be calculated by statistical methods of phase space, if one doe« so one receives a formula for the cross section • of liyht quanta of energy k against nuclei of atomic numer Z producing positrons of energies between E and E + • dE and electrons of fixed energy E_, or vice versa for •_. Trie result is:
* + d E + = Z 2-r o2-E +- (B1+B2+B3+B4+B5)/(137.k3- (E++fc_-k) -p*) -dE +
B 1 = 4 P +p_(2p +2-9k 2-8-(E +
2+E_ 2-2E +k)-12E_(E +-k)) B 2 = 2L Q((2p + (E_ (4 (E +E_-k) 2 - p +
2 ) +k 2 (E++2 (E_-k)))) +1^ (E_2-p_2) • (4E_ (E ++E_-k)-p +
2+k 5)) B 3 = L2(-2(E++E_) (p +
2(E +-k)+k 2E_) + (p+2-k2-4E_(E++E_-k)) (<E ++E_) 2+p +
2-P_2>>
B 4 = 2p +L 3(-p +2{E +-k)-k 2E_+(E ++E_) (p+
2-k2-41_(L++L_-k))) B^ = 2p_L4 (-p+
2 (E+-k) -k2E_) L o = in((E_+p_)/(E_-p_));L1 = In!(E++E_+p+*p_)/(t++E_-p++p_)) L 2 = ln(((E++t;_)2-(p++p_)2)/((E++E_)2-(p+-p_)2)) L 3 = ln((p +
2-(E ++E_+p_ 2)/(p +2-(E ++E_-p_) 2))
L4 = in(<p_2-(E++E_+p+)2)/(p_2-(E++fc_-p+J2)> (rQ=e2/(nie2))
This is the anaJogon to Bethe-Heitlers f annus formula for pair production under the new auspices. Its predictions are completely different from those one in Uie bethc-lleit lers theory and we think it would be of highest interest to study experimentally which one of the two theories is fitting better the observations. (Generally spoken the main difference is that in the Kethe-lleitler-theory for c fixed positron energy the electron energy is also fully determined while in our case also for fixed positron energy there is still a spectrum of electron energies and vice versa. This is a fundamental difference in behaviour. To demonstrate the differences more in detail in figure 1 the positron energy
2 spectra for quanta of k = 4nc = 2.04 MeV are represented when the electron energies are kept fixed at E = 2.5; 2.0 and 1.5 me . The interesting result is
" E+* 2 that we have sharp "resonances" at energies 1.5, 2.0 and 2,5 mc , id est at energies for which the classical conservation of enercry is perfectly fulfill«'

.v-
, .
* t^UÜ
,.ß Fig. 1 Fos i tron spectra for fixed
electron energies E_ t = 2.5; 2.0; 1.5 ne 2
Fig. 2 Liectron sptctru for fixui positron energies L +
t + = 2.75; 2.25; 1.75; l.^.f* but each of the three curves has a small tail on the lower energy side and when you follow this tail you find another peak of the positron spectrum ut the point whrre the kinetic energy of the positron is nearby zero. This maximum may have been overseen in experimental investigations until now.
Another result we see in fiyure 2. Here the electron spectra are st<-n fci 2 fixed positron energies (now: E = 2.75; 2.25; 1.75 and 1.25 mc ) for quanta
2 of k = 4 ire . Also in this case there are "resonant" peaks exactly at the enci -gies (t;.= 1.25; 1.75; 2.25 and 2.75 mc 2) for which the sum of L + + L_= k is equal to the energy of the original quantum k, corresponding to the classical conservation law, but the left hand tails to the lower energies are the biuyc-i the higher the energies of the "resonant" peaks are. There are no maxina of zero kinetic energy for the electrons.
The symmetry in the behaviour of electrons and positrens as it is given n Bethe-Heitlers formula is lost completely in our theory and this becomes still nore significant if one looks to the integral spectra of positrons and electrons for each sort of particles for it alone.
One receives this integral spectra by summing up ail singular sptvtrj lii the fixed energies of the particles of the one sort regarding their [icLvibi lilies of occurence given by the new formula of the pair production. Tins IAH; U
done by a computerprogramme in which the integration is going on step by step while every new spectrum is added to the other ones calculated Lefoiv.
The results are represented in figures 3 for the positrons and in 4 n>i the electrons. We see here a big difference in the integral spectra lor the two sorts of particles. While the positrons produced by quantas of ciu-niy k 4 mc 2 show a peak at E + = mc 2 with a right hand tail to L.UMCI values of eneraies for the electrons there is a peak at h_= 3 nie: with <» I'

210
tin*
Flg. I 1 ne* I
_3 Integral positron spectrum 0 < > 1 a t * — l
Fig. 4 Integral electron spectrin hand tail to maller energies. Insofar the new theory'of pair production is differing ocmpletely from Bethe-Heitlers theory which predicts a distribution of positrons with nearly constant probabilities over the whole range of all possible positron energies. Xt should not be difficult to distinguish between the two very different theoretical predictions. Experiments to determine the integral spectra of the electrons and positrons in pair production are already on the way.
References: (1) Erich R. Bagge, 'Can the nässing solar neutrinos be explained by a new in
terpretation of ß-decay?" VII. Internat. Leningrad Seminar, p. 25-32. (1975)
(2) Erich R. Bagge, "New aspects in the theory of ß-decay without neutrinos" VIII. Internat. Leningrad Seminar, p. 51-53. (1976)
(3) Erich R. Bagge, "Eine neue Deutung für den ß-Zerfall des Neutrons" Atomkernenergie 25. 251-256. (1975)
(3) Erich R. Bagge, "The ß-decay of nuclei as an electromagnetic phenomenon" Atomkernenergie 26. 73- 75. (1975)
(4) Erich R. Bagge, "The derivation of Fermis constant g of weak interactions in the new theory of ß-decay without neutrinos"
Atemkernenergie ^ 7 . 109-111. (1976) (5) W. Heitler, "The quantum theory of radiation"
Oxford, at the Clarendon press. Third Edition, p. 261 (1954)

211
THE JUNCTION OP DISTRIBUTION IN THE INTERIOR 0? THE SUN AND NEUTRINOS DEFICIT
S . S . V a o i l i e v , O.E.Kocharov
loffe Riysical^Technical Institute, Academy >f Sciences of the USSR, 194021 Leningrad, USSR
The effect of turbulence on function of particle distribution in the interior of the Sun and predicted neutrinos fluxes are considered. The results of solar models and solar neutrinos fluxes calculations are presented.
To remove of the discrepancy between theoretical prediction and observation (Davis and Evans,1974) of the solar neutrinos Kocharov (1972 a,b, 1973 a,b) and Clayton (1974) had proposed the new possibility connected with a tiny deviation of particle distribution from Ilaxwellian» This proposal was developed by Vasiliev et al(1974t 1975) and Clayton et al.(1975).In noted papers the possibility of depletion of high energy tail of the distribution function inevitably leading to low fluxes of high energy neutrinos was discussed. The analysis (Vasiliev and Kocharov, 1976 ) shows that there is once more, may be more real, possibility of deviation of distribution function from Maxwellian. In this re -port we are going to consider just this new possibility.
According to conventional notion there is no convection in the region of solar energy generation:then gradients of temperature and density are so small,that the matter is in local thermodynamic equilibrium state and the function of distribution is almost Ilaxwellian. The correction to the distribution function is about 1/L, where 1 - free length, L - density variation's scale. Such correction is too small to influence directly the rate of thermonuclear reactions. If we take intc account the properties of plasma one can expect new nonpredicted in hydrodynamic model of solar interior phenomena.
At the VIII-th Leningrad International Seminar and V-th European cosmic rays symposium the authors of this paper (Vasiliev and Kocharov,1976, Kocharov 1976) supposed that in solar core of plasma may be in turbulent state due to one of the types of non-stability (see Mikhailovskii, 1971). It is known, that in this case the influence of Plasmons and particles interactions on the stationary function of distribution becomes essential and as the result the function of distribution will differ from equilibrium one. The character and degree of difference depend on the type and energy of turbulence. As a rule, turbulence leads to particles accelerating.
To illustrate the importance and efficiency of considered mechanism we have examined the influence of ion-acoustic turbulence. For the isotropic oase when velocities of ions are less than the mean velocity of electrons at first approximation the function of

212
distribution My b« find from the following aquation
Here D t ia turbulent coefficient of diffusion C 0 i s diffusion coefficient in the equation of Fokker-Planclc for equilibrium plasma (Akhieser, 1974), which i s constant in considered case
Let us assume that there are only small number of helium and more heavy nuclei in plasma besides of protons and e l ec trons. Then the coefficient of diffusion for acceleration of particle by ion-acoustic pulsations equals (Kaplan and Taito-vich, 1972). ^ M e 2 u ) M
D *"T 7 7 5 e ( Vt.e/V)V (2) P
In this formula V t • tyKTe/Me • w - energy density of ion-acoustic pulsations. Por ratio of diffusion coefficients we obtain following expression
"o Mp v 3 e 2 n e
For the centre of the Sun at V= V + _ *tP
D + , W (4) *TT ~ 1 0 U o
Where U - is the density of internal energy of plasma. Prom the last relation one can see that if the energy of collective motion of proton is equal to 0,1% of internal energy of plasma then D+/ D„«1 . Is it much or no?
In plasma at the equilibrium conditions all types of low-damping plasma pulsations, namely electromagnetic and Langmuir waves are presented. At density and temperature typical for the centre of the Sun the ratio between density of electromagnetic radiation and internal energy density of plasma is equal to 10~3 and the ratio of density of Langmuir oscillations energy to thermal energy density is 10~2. At the equality of electronic and ionic temperatures ion-acoustic waves are absorbed strongly . If the temperature of electrons exceeds the ionic temperature an ionic acoustic fluctuation oscillations arise, energy of which is equal to 10"-5 öf internal plasma energy. Hence, the turbulence may influence essentially on the distribution fluctuation of ions when the energy of ion-acoustic turbulency is the order of fluctuation one.
To obtain the effect of turbulence on the distribution function the equation (1) was solved. The functions of distribution for protons at the equilibrium case (curve 1) and in case of turbulence (curve 2) are given in figure.
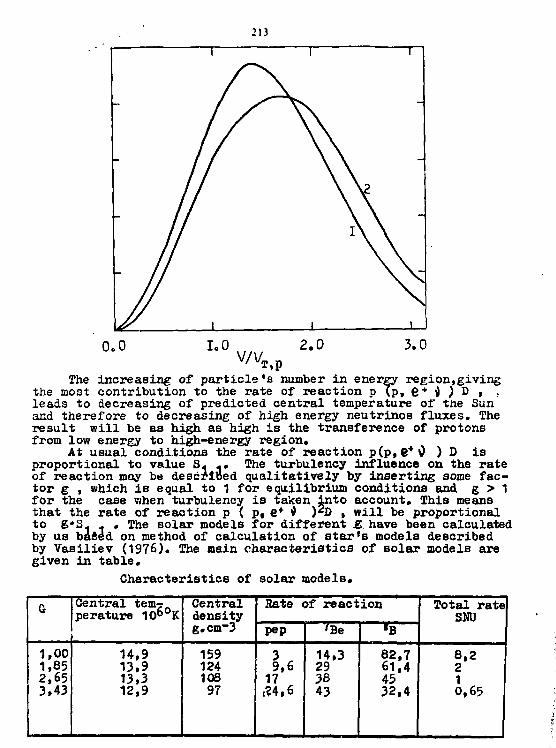
213 T 1 r
The increasing of particle's number in energy region,giving the most contribution to the rate of reaction p (p, e* l) ) D » leads to decreasing of predicted central temperature of the Sun and therefore to decreasing of high energy neutrinos fluxes. The result will be as high as high is the transference of protons from low energy to high-energy region.
At usual conditions the rate of reaction p(p,e +0 ) D is proportional to value S 1 ... The turbulency influence on the rate of reaction may be described qualitatively by inserting some factor g , which is equal to 1 for equilibrium conditions and g > 1 for the case when turbulency is taken into account. This means that the rate of reaction p ( p, e* i> )2D , will be proportional to 6«31 1 . The solar models for different £. have been calculated by us based on method of calculation of star's models described by Vasiliev (1976). The main characteristics of solar models are given in table.
Characteristics of solar models.
G Central temperature 10 f e OK
Central density g.cm~3
Hate of reac t ion Total rate SNU G Central tem
perature 10 f e OK Central density g.cm~3 pep 'Be «B
Total rate SNU
1,00 1,85 2,65 3,43
14,9 13,9 13,3 12,9
159 124 108
97
1.6 17 t?4,6
14,3 29 38 43
82 ,7 61,4 45 32,4
8 ,2 2 1 0,65

214
It is Been that *otc] rate of reaction -"CI (v,l )-"Ar strongly dropa i.it). increasing of c« Relative contribution of different groups of neutrinos ia changed too.
üo, the question io what is the real value of g for the interior of the Sun? To answer this question firat of all we have calculated the function of distribution of pair interacting particles taking into account a turbulency. Then the rate of different reactions of p-p and C-N cycles and neutrino fluxes were calculated. Let us consider the concrete results for the case Skr/$c • 1. In this case £i almost constant in the interval 10<-T < 15 and equals 1.5, This means that if the energy of collective motion in the solar plasma is about 10" 3 plasma internal energy one can coordinate the theory and experiment on solar neutrino registration.
REFERENCES
1. Akhiezer A.I.,(1974X Electrodynamics of Plasma,Moscow, 2. Davis R. Jr.,Evans J.C.,(1974),Proe.YI Leningrad,International
Seminar,Edited by Kocharov G.E. and Dergachev V,A..Leningrad, p.91.
3. Clayton D.D.,(1974),Nature 249, 131. 4. Clayton D.D.,Dwelc E.,Newman K.J.,Talbot R.J.,Jr,(1975),
Astrophys.J.,199,494. 5. Kaplan S.A., Tsitovich V.U.,(1972), Plasma Astrophys.
Moscow, 6. Kocharov G.E. ,(1972 a), Report PTI All SSSR,If,298, (1972 b),
Invited Paper at the III European Syiap.Cosmic Rays,September, West Germany,
7. Kocharov G.E,,(1973 a), Preprint N 453 PTI AN SSSR, (1973 b) Proc. 5-th Leningrad Int.Seminar, Ed.Kocharov G.E,, Dergar-chev V.A,(Leningrad, p.194,
8. Kocharov G.E., (1976) Report at the European Symp,Cosmic Rays, England,
9. Mikhailovskii A.B.,(1971) Plasma instability theory,Moscow. IC-.Vasiliev S.S., 0976)„Preprint 506, PTI AN SSSR, Leningrad, 11,Vasiliev S.S..Kocharov G.E,»Levkovskii A.A., (1974) Izv,
AH SSSR,ser,fiz.,38,l827;1975,ibid 39,310, 12,Vasiliev S.S.,Koeharov G.E.,1976, Proe.VIII Leningrad Inter
national Seminar, Edited by Kocharov G.E, and Dergachev V.A., Leningrad, p.55.

21S
BAYiitSlAM ANALYSIS Ol' THii BKOOKHAVEN JOl.An 11 lUT lNO KXPKUIKEKT
A.M. Aurela
«Vihuri Physical Laboratory, University of Turku, Turku, Finland
Runs 18 - 39 of the Solar Neutrino experiment were analysed by a Bayesian method keeping all numbers of 3<Ar atoms non-negative. The weighted mean of the 37Ar production rate R was (0.43 ± 0.05)/day. The authors' result was (0.32 i 0.08)/day. The increase in R was due to a statistical adjustment of background rates, and the decrease of the error was caused by the non-negativity constraint. Chi-square tests suggested a non-statistical variation of R. By assuming methodological variation and by rejecting seven suspected runs, the lower limit (0.34 ± 0.06)/day was obtained. If the variation were astrophysical, the time average of R would be (0.55 1 0.06)/day.
1. Introduction. The present work concerns the observations made by Davis
and Evans [1] by means of the Brookhaven Solar Neutrino Detector. A few years ago Wolfendale [2,3] initiated an extensive statistical analysis of these observations. The method of the analysis and the corresponding computer program have since been elaborated. The results of a new analysis of runs 18 - 39 of the Solar Neutrino experiment are reported here.
The basic problem is the determination of the frequency function P(II) of the posterior probability that the neutrino detector contained N atoms of 3?Ar at the end of the exposure period, when the counts in the subsequent counting periods are known. Prom P(N), the rate of ?'AT production R and its standard deviation a can be easily calculated for each run. A chi-square analysis can be carried out to see whether R is constant. However, special methods are needed in the chi-square analysis, because P(H) is usually far from Gaussian. 2. Basic method.
In general, the present method was designed for the analysis of very small amounts of radioactive atoms, and the method should be especially useful, if the background of the counter is of the same order of magnitude as the signal. In view of this general purpose, the method and the program will be published separately. The principle of the method is accounted for in the following.
First, P(N) is computed in a Bayesian way for the beginning of the last counting period by using the observed count number of that period and all a priori knowledge about the probability

:i6 .listributions of the counter efficiency K and of the av«ra«e background counting rate B. These distributions are presented by means of nixed binomial distributions and nixed Poissonian distributions [4]. Then P(N) is used as a posterior probability for computing a new P(N) for the beginning of the preceding interval, if there was an interval. Thereafter P(N) lc computed in the same way for the beginning of the preceding counting period, and so on. Finally, P(N) is obtained for the end of the exposure period, taking into account a binomial probability distribution in the gathering of the 37Ar atoms from the detector tank into the san.jle. Notable features in the method are the repetitive application of Bayesian arguments to the multiple branches of possibilities and the built-in a priori constraint that the number of 3(Ar atoms is non-negative at all stages. The constraint reduces the error estimates, and in some cases the reduction is large. If the number of counting periods is larger than two, B can be adjusted by the method of maximum likelihood. 3. Results of the Bayesian analysis.
The adjusted values of B are shown in the second column of Table 1. The probability distributions of B were not Gaussian, but with reference to the Gaussian distribution, some kind of error estimates of B were obtained by noting the values of B at which the probability decreased to a value of exp(-l/2) = 61 ?2 of the maximum at each side. Many of the values of B are smaller than previous estimates, which might have included a few genuine 37AT counts. Some support for the present results is found in the cases where the same counter has been used for two samples. The comparable pairs of runs are 24 & 33, 30 & 35, and 31 .& 36. The corresponding distributions of B overlap very well. Further support comes from section 4, because the new B's decrease the value of \ 2 ,
The present values of R are slightly higher than previous values [1], apparently because of the revision of B. Most of the standard deviations a have decreased because of the non-negativity constraint. 4. Chi-square analyses.
Attention should be drawn to the fact that the quantity s *(R, - R) 2A? = 22.1
i i x
cannot be assumed to be x2» because many of the probability distributions of the R^'s are far from Gaussian. In order to make a chi-square analysis possible, the observed count numbers from the first and second counting periods were combined consecutively into groups so that the sum of counts of each group would obey the normal distribution. The expected values of the sums were based on the weighted mean of the production rate, E w« Furthermore, the number of degrees of freedom should be slightly reduced because of the influence of the observed counts on B. By forming seven groups, the value y£ = 13.1 was obtained, whence the probability of the constancy of R would be about 3#. By forming six groups in a different way, the result v 2 = 13.9 was obtained, and the corresponding probability would be about 1%, In any case, the analyses suggest that the variation of R is not statistical.
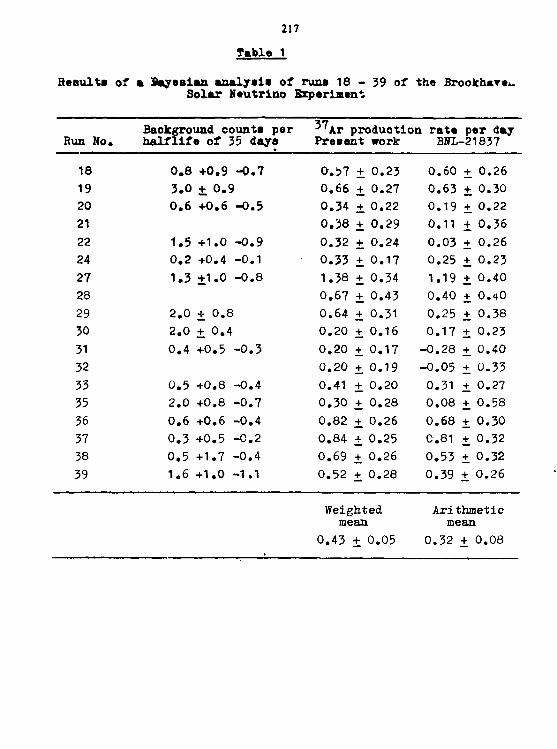
217 Table 1
Beaulta of a Bay«Blaa analyaia of runa 18 - 39 of the Brookhare^. Solar Neutrino Experiment
Background count« per ^'Ax produotlon rate per day Run No. naiflife of 35 days Preeent work BNL-21837
18 0.8 +0.9 -0.7 0.57 + 0.23 0.60 + 0.26 19 3.0 + 0.9 0.66 + 0.27 0.63 + 0.30 20 0.6 +0.6 -0.5 0.34 + 0.22 0.19 + 0.22 21 0.38 + 0.29 0.11 + 0.36 22 1.5 +1.0 -0.9 0.32 + 0.24 0.03 + 0.26 24 0.2 +0.4 -0.1 ' 0.33 + 0.17 0.25 + 0.23 27 1.3 +1.0 -0.8 1.38 + 0.34 1.19 + 0.40 28 0.67 + 0.43 0.40 + 0.40 29 2.0 + 0.8 0.64 + 0.31 0.25 + 0.38 30 2.0 + 0.4 0.20 + 0.16 0.17 + 0.23 31 0.4 +0.5 -0.3 0.20 + 0.17 -0.28 + 0.40 32 0.20 + 0.19 -0.05 + 0.33 33 0.5 +0.8 -0.4 0.41 + 0.20 0.31 + 0.27 35 2.0 +0.8 -0.7 0.30 + 0.28 0.08 + 0.58 36 0.6 +0.6 -0.4 0.82 + 0.26 0.68 + 0.30 37 0.3 +0.5 -0.2 0.84 + 0.25 C.81 + 0.32 38 0.5 +1.7 -0.4 0.69 + 0.26 0.53 + 0.32 39 1.6 +1.0 -1.1 0.52 + 0.28 0.39 + 0.26
Weighted Arithmetic mean mean
0.43 + 0.05 0.32 + 0.08
:is 5. Discussion and conclusion».
As«the first possible explanation of the observed variation of R, conceivable methodological errors should be considered. Davis and Evans [1] have directed special attention to spurloua counts and contamination of samples. While awaiting possible experimental corrections, lower and upper limits could be determined for the average of R from the available data.
If we rejected runs 23, 27, 28, and 36 - 39, which were suspected by the authors for various reasons [1], then x would be 5.6 for 11 degrees of freedom and the new weighted mean ft« would be (0.34 + 0.06) per day. Thus, the value of x became even suspioiouaTy low. In fact, the rejected runs included the highest values of R, and this could be considered aa a selection effect. Consequently, R"w would be a lower limit of R\». If the observed variation were genuine, i.e., if the neutrino flux varied, the best estimate of R would be the time average
fft = (E t±R±)/Zt±.
In principle, the times ti should not be the actual exposure times t, but the effective times
T(1 - e - * / T ) , 37 where T is the mean life of Ar. The time average is then
0.55 + 0.06 per day. This could be taken as an upper limit. Tn conclusion, the remaining non-statistical variation
of the 37AT production rate is probably due to variable methodological effects. As regards the comparison between experiment and theory, presented by Davis and Evans [1], the situation remains practically the same.
Acknowledgements. The writer is grateful to Professor A.W. Wolfendale of the University of Durham, England, for his unfailing support and useful correspondence. Warm thanks are due to Dr. Raymond Davis Jr., Dr. B. Cleveland, and Dr. J. Evans Jr., Brookhaven National laboratory, USA, for the supply of experimental data, for discussions, and for hospitality during a visit at Brookhaven. The writer is indebted to Professor Väinö Hovi for the facilities of the Wihuri Physical Laboratory of the University of Turku.
The present work was supported by the National Research Council for Sciences, Finland, in 1974 - 1977. References. [1] R. Davis Jr. and J.C. Evans Jr., Brookhaven National
Laboratory Report BNL-21837 (1976). [2] W.S. PalJ.ister and A.W. Wolfendale, Nature 251, 488 (1974). [3] A.M. Aurela, W.S. Pallister, and A.W. Wolfenaale, Proc.
14th Int. Cosmic Ray Conf., Munich, Vol. 6, 2125 (1975). [4] N.L. Johnson and S. Kotz, Discrete Distributions, Houghton
Mifflin, Boston (1969), p. 111.

219
THE COSMIC RAY NEUTRINO-INDUCED BACKGROUND IN TOE SOLAR NEUTRINO EXTERIKE.VT A.W. Wolfendale, Fhysici Department, tinivtraity of Durhaa, England
and E C M . Young.. Physic« Department. University'of Hong Kong
Theoretical [x\ Experimental Q Both | |
At very great depths underground the limit to the detectability of solar neutrinos is set by the presence of cosmic ray mu^n and and electron neutrinos. Attention i« directed to the magnitude of the cosmic ray neutrinc induced background in the Brookhaven solar neutrino detector in which the t a ? f 6 t " f ' 0 " 3 1 i s CC*,. Recent estimates of the cross section for 2(*/C£,J7Ar) e" as a function of neutrino energy and the cosmic ray neutrino spectra are examined and the likely range of backgrounds is calculated.
Coordinates: MN 2.5 (Neutrinos)
Mailing address: Professor A.W. Wolfendale, Department of Physics, University of Durham, South Road, Durham, England. DH1 3LE.
??0
THE PROBING OF THE SUN 3Y THE SOLAR KEUTRIKOS, AND THE TERRESTRIAL ICE A3ES
Bronislaw Kuchowlct Dept. of Radiochemiatry and Radiation Chemistry, University
02-089 Warszawa, ul. Zwirki i Wigury 101, Poland
A b s t r a c t . Davis' experiment has stimulated whole areas of physical and astrophysical research that is going on to find why the hunt for solar neutrinos is yielding so low fluxes of high-energy neutrinos. One possible explanation is in terms-of solar models with a low metal abundance Z. Such models can be reconciled with the observed heavy-eleEent abundances in the solar atmosphere by a galactic contamination of the Sun «hen it was passing several times through the spiral arms of the Galaxy, with their increased gas and dust concentrations. This concept is related to the glaciations of the terrestrial surface, and to the protective role of the solar wind.
1. Introduction. Davis' solar neutrino experiment (see e.g. the latest re
sults in /1,2/) is since years a constant stimulus to numerous areas of physics and astronomy. Attempts are permanently made to explain the meagre harvest of solar neutrinos.,A series of disciplines, starting from graviJation theory and cosmology, through stellar evolution theory, analysis of elemental and isotopic abundances, cosmic ray research, nuclear and weak interaction physics, radiation chemistry, and even climatology, have been reinvestigated from the standpoint of the solar neutrino discrepancy. The aim of all such studies is to find some factor that would be responsible for the suppression of the high-energy part (the boron-8 neutrinos) of the solar neutrino spectrum.
A majority of the relevant suggestions was discussed in my recent review /3/ where references to original papers may be found. I wish to concentrate here only on e single but interdisciplinary aspect of the solar neutrino problem? on the interrelation between the motion of the solar system in the Galaxy, the resulting contamination of the solar atmosphere by galactic fallout, and the triggering of the ice ages. But first it is necessary to talk a bit on the observational data> out of whioh all such speculations arise*
221 During the latt ten year«, Davis systematically reported
on the argon-37 production in aucosasive experimental runa. Though sino« 1974 the produotion ratt of •"Ar in hi« tank ia somehow going up, and the discrepancy between observation and theoretical prediction is not aa sharp as it was five years ago, it nevertheless remains. Let us give some numbers. It is convenient to express the neutrino capture- rate in solar neutrino unita (SNU), where 1 SNU is 1-10 _ J D neutrino absorptions per target atom per second. The average rate for argon-37 produotion in the tank, with all nftie from 1970 up to January 1976 taken into account, amounts to (1.4 • 0.4) SNU, where we gave the standard deviations. The upper limit at a 68.26 )t confidence level is as iQ* as 1.8 SNU (which corresponds to the produotion of one "Ar atom in the whole tank per 3 days). The oapture rate is by a factor of four below the prediction of the standard solar mod'el /4/. Also theoretical estimates in the framework of conventional solar models made by other authors do not differ much from the result of Bahcall's group /4/t the numerical values are usually between 4.5 and 9 SNU. The abovementiormd Hiacreoancv is to" serious, even as for astrophysics, though it is not of order of magnitude as it appeared in 1972/73 (but it may also be as big as this because what is actually determined in the experiment is only an upper limit!).
2. The low-Z models of the Sun. In order to achieve an agreement between theory and ob
servation, astrophysicists were trying to derive solar models in which one or more of the standard set of assumptions were violated. Let us give a list of these assumptions.' A. The spherical shape of the Sun. B. Production of energy by hydrogen burning, mostly in the
p-p chain. C. Energy is transported by radiation and convection. D. At each point inside, a hydrostatic equilibrium between
the gravitational force and pressure gradient is established.
E. t homogeneous Initial composition of the Sun is assumed. F. Primordial solar abundances are taken as identical with
the present surface abundances. G. Since the Sun started its evolution, no major loss of its
mass lid occur. H. Solar rotation is negligible. I. No fall or partial mixing exists or existed in the Sun
except in oonvective regions. J. The magnetic field of the Sun does not play any role. K. The gravitational constant 5 did not change during the
evolution of the Sun. It was shown in a lot of work /see section 6 of ref.
3/ that by violating some of these assumptions one is able to reduce the theoretical prediction. Unfortunately, there is rather poor evidence against any of these standard assumptions, and many of the theoretically derived estimates

223 represent merely a wishful thinking. Recently, howawr; aooe insight hee accumulated that during the billions of years of aolar evolution, under the influence of environmental conditions, a final violation of the standard assumption P might have developed, and this alone would be sufficient to reconcile theory with observation.
This indication for one of the possible directions of solving the solar neutrino puzzle follows from the calculations of solar models by theoreticians who varied the fractional abundance Z of metals. (In the calculations of stellar models all elements heavier than helium are taken together and named the metals; their masa fraction in the matter under study is denoted by the symbol Z). Usually, the range of values of Z in standard solar models does not extend beyond the extremes of 0.02 and 0.014. It is also assumed that the heavy-element abundance throughout the whole Sun corresponds to the results of observing the photospheric abundances, and the primordial solar abundances are identified with the present photospherio abundances. Though there was never any direct observational support in favour of these t*o assumptions, they fit quite well into the standard theory of stellar evolution of low-mass stars, and no necessity to express doubts was felt dur.'ng many years.
But Bahcall and Ulrich /5/ evolved in 1971 a model with with an extremely low value of Zs 0.001 which give a reduction in the neutrino capture rate to 1.9 SNU. After some improvements in the code for calculating opacities, this rate amounts now to 1.4 SNU /4/. It is just the observational average. But how can we justify this value?
When I was looking at this possibility some years ago /6/, it came into my mind that details of the cosmogony of the solar system might be of interest to the solar neutrino problem. Let us imagine first that the primordial Sun had accreted some remaining matter from the protoplanetary nebula, after the convective Hayashi phase has terminated. In this case, the proportions of elements in the accreted matter might influence the atmospheric abundances. Now the main point here is that the matter in the protoplanetary disk, in the vicinity of the Sun (e.g. closer than the orbit of Mercury, where conditions might have inhibited the formation of another planet) would be significantly fractionated. All the volatile elements (especially hydrogen and helium) would have escaped, and the remaining mass could be significantly enriched into high-Z (this means here the atomic number!) elements. The presence of certain amounts of matter in the nebula in the form of dust (even in micrograins) would enhance this chemical segregation. A final collapse of these innermost parts of the disk» onto the solar surface oould be responsible for violating assumption ¥ already for the young Sun.
Another cosmogonic mechanism of violating assumption.P might have been the contraction of the primordial solar nebula to the first opaque state on a dynamic time scale, with a bypassing the convective Hayashi phase /6/. Primordial in-homogeneities in the Sun could result in a reduction of the

223 hlgh-energ/ neutrino flux /7,8/.
In the following I reetriot myself to coneideratione on an eeeentially homogeneous Sun, with the only dlfferencea In chamical compoaition (apart from those resulting from central hydrogen burning) between the thin surface layer and the rest of ita voluma« It ia poaaible that the coamogonlc mechanism of heavy element accumulation in the atmosphere is supported by another mechaniam following from the motion of the Sun in the Galaxy. Thia is the mechanism of the accretion of inter-etellar matter.
3» The accretion of interstellar matter, and some of its consequences. There is nothing new in the suggestion that interstellar
matter may be accreted by the Sun. One may trace references back to an old paper by Harlow Shapley in 1921 /9/, and to another one by Hoyle and Ityttleton in 1939 /10/. Recently this problem was revived in a lot of papers /11 - 16/. It is characteristic for all these papers that accretion of interstellar matter is related to climatic changes. When Shapley /9/ speculated on the encounters of stars with nebulae, he recognized that these conditions "must also gravely affect the atmosphere surrounding any attendant planet".
The periods of enhanced accretion in the history of the BOlax system are related to the passage of this system through the spiral arms of the Galaxy /11/« Independently of any specific theory of this spiral structure, it is reasonable to treat the spiral arms as the place where out of the compressed olouds of cosmic gas and dust clusters of new stars are born. The most massive among these young stars are evolving quite faBt, and they can end up their evolution (most probably by an explosion) before they leave the spiral arms. Hence the medium here is enriched into the products of their evolution: elements with atomic numbers beyond 2. The accretion of matter from the spiral arms, with a time-increasing fraction of metals, is what Auman and McCrea /12/ call the galactic .contamination of the Sun.
With the simple theory of accretion, it is possible to estimate the total amount of matter that was swept up by the Sun during its -10^ year* of existence as a main-sequence star. This amount varies between 0.01 5» and 0.5 "f> of the solar mass, depending on specific assumptions concerning the density and velocity of the clouds of gas and dust in the spiral arms. Due to the chemical evolution of the Galaxy, leading to a continuous increase of the heavy-element abundances in interstellar matter, the accreted matter contains a higher fraction of metals than the matter out of which the Sun was born /12, 13» '15/. Thus we see that the passage of the solar system through the spiral arms may be responsible for a validity of the low-Z models of the Sun, in spite of the much higher metal fraction in the solar atmosphere.
This explanation of the solar neutrino puzzle may provide at the same time a mechanism responsible for a triggering of
224 the ice agea which are now known.to hav« occurred in th« past of th« Earth. Various hypotheses dealing with astrono»lcal or endogenic faotora or with combination« of both aa a possible reason for the origin of climatic change hav« bean proposed since years- Climatology is «till far from finding a definite answer, in apite of a reoent aupport /M/ for the simple model of Milankovich /18/. This ia an "astronomloal" theory of the ice ages, which links major climatic changes to changes in the orientation of the Earth and the ellipti-city of its orbit. Though one cannot deny the role of these factors for details of the coming and going of the ice cover during the last 500 000 years, it is diffioult to assume changes in insolation as the only oauee of the ioe ages. An important argument is the faot that during long epochs in the past of the Earth there were no glaciations.
On the other hand, the ooincidence of the intervals T ±
between the ice epochs on Earth (ca. 2.5*10 yr /19/) and the intervals at which the solar system circulating round the Galaxy enters a successive spiral arm is astonishing /11/. The duration t^ of eaoh ice epoch is by two orders of magnitude less than the interval T^; the same relation holds between the time the solar system needs to pass the compression lane of a spiral arm, and the time it needs to pass from one arm to another. Now even this compression lane is no homogeneous medium, it may be imagined rather as a set of dense clouds. When the solar system passes this com** pression lane, it has to cross several of these clouds. The "fine" structure" of the last ice epoch, with its glaciations and interglaciations, may reflect the details of this passage.
Each time the solar system enters a dense cloud, the solar wind is prevented from reaching the Earth /20/. It is possible to think that just this wind keeps the Earth warm, e.g. by affecting the ionization balance in the lower atmosphere, its conductivity and ozone content, and determining thus indirectly what part of the incoming solar radiation can penetrate dowja the atmosphere. The recession of the solar magnetosphere under the influence of the dense medium through which the solar system is ploughing makes it also possible for stae material of this medium, especially for dust particles, to penetrate the terrestrial atmosphere, to change its transparency and albedo, to provide nucleation sites and induce precipitation. Both the decoupling of the terrestrial magnetosphere from the solar wind, and the infall of dust are going in the same direction." toward an overall cooling, and possibly also glaciation.
The low-Z .models, proposed initially in the role of an explanation of the discrepancy between theory and experiment in the solar neutrino hunt, have brought us to another still unsettled question: that of the ice ages» The aim of my emphasis on this was to point that a seemingly strange assumption invented to obtain a low neutrino yield from the Sun is not merely an ad hoc assumption. Support for low-Z models may be obtained in some indirect way from climatology. It is necessary, of course, to look for some direct evidence in favour of this suggestion. Solar data would be required

225 which could reveal the «till hypothetical layered- structure of the surface. Provided there la in fact a contaainatlon of solar aurfaoe by heavy elementa, one might expect a proof for this from various typea of solar flares. Solar cosalc rays from weak flares should be enriched into heavy nuclei, while the heavy—element content of matter ejeoted into space during strong flares should decrease - even in spite of any possible selective mechanism of acceleration. This has been reported /21/.
I did not mention here another possible relation between the solar neutrinos and ice ages which seemed to be of some importance a few years ago! through solar models with mixing or rotation that could reduce the neutrino flux. At the same time these models led to a decrease in solar luminosity, and glaciations could occur at times when the flux of high-energy neutrinos was abnormally low. I refer the reader to the section 6.1 of my survey /3/> and to a paper by Cameron /22/ in which these models and their consequences are studied in enough detail.
R E F E R E N C E S /1/. R. Davis, Jr., J.M. Evans, Bull. Amer. Phys.Soc, 21,
683 (1976). /2/. J.N'. Bahcall, R. Davis, Jr., Science, 121, 264 (1976). /3/. B. Kuchowicz, Reports Progress Phys., .39., 291 (1976). /4/. J.N. Bahcall, W.F. Huebner, N.H. Magee, Jr., A.L.
Merts, R.Z. Ulrich, Astrophys. J., .184, 1 (1973). /5/. J.N. Bahcall, R.K. Ulrich, Astrophys. J., 170, 593 , , (1971). , /6/. B. Kuchowicz, Astrophys. Lett., ±5, 107 (1973). /!/. J.A.R. Prentice, Mon. Not. Roy. Astr.Soc, 163, 331
(1973). /8/. J.C. Wheeler, A.S.W. Cameron, Astrophys. J., 196, 601 , / (1975). ,
r 9/. H. Shapley, J. Geology, 29_, 502 (1921). 10/. P. Hoyle, R.A. Lyttleton, Proc. Cambridge Phil. Soc, Math. Phys. Sei., 35, 405 (1939).
/11/. W.H. McCrea, Nature, 25_5_, 607 (1975). /12/. J.R. Auman, W.H. McCrea, Nature, 2_6_2, 560 (1976). /13/. M.J. Newman, R.J. Talbot, Jr., Nature, 262_, 55-9 (1976). /14/. R.J. Talbot, Jr., D.M. Butler, M.J. Newman, Nature,
262. 561 (1976). /15/. R. J. Talbot, Jr., M.J. Newman, preprint OAP-446
(California Institute of Technol.,- March 1976). /16/. R.J. Talbot, Jr., M. J. Newman, preprint OAP-474
(California Institute of Technol,, November 1976). /17/. B. J. Mason, Quart. J. Roy. Meteorol. Soc.102, 473 . , (1976). /18/. M. Milankovitch, Acad. Roy. Serbe, EdiSpec.,J_33 (1941). /19/. C.W. Allen, Astrophysical Quantities (London7i"973)« /20/. M.C. Begelman, M.J. Rees, Nature, 26J_, 298 (1976). /21/. S.S. Konyakhina, L.V. Kurnosova, V.l. Logachev, L.A. Ra—
zorenov, M. I. Fradkin, Kosmich. Luchi, T3, 162 (1973). /22/. A.Cx. W. Cameron, Rev. Geophys. Space Phys., 11, 505
(1973). ~
A

226
ore fiu JIVLY: ir ^- ex JC ;.vjf .: u: rx> :*.• n I.TTS
L.?..«lkovu, ii
institute for "ucloar Komoren of the tt~H Aeadøey of
Ccionoee, oooow
Theoretical
Cosisie ray neutrino cpoctra and uncular dictrlbutlone aro re
calculated using
1) nov experlaental eosraic ray auon spectrum at coa leveli
2) nucloon-oudei Interaction crooe-Goctions for plans and
kaons generation»
2) last exporloental results on noutrlrio interactions
received in accelerators*
The analysis of cosmic ray noutrino esQoriuonts choas that
linear increase of total noutrino-nucleoa crous-section takos
place till very high energies» 2he estimation of the value of
possible neutrino oscillation is node.
Coordinates a }SR 2 , 5 # H e a****> sad neutrino Interactions
Mulling adages« Professor G.T.Zatsepia, Institute for
Nuclear Research of the uses Academy of
Selene—» ftcofaoyusnaya» 7a, Moscow V-I17?1.?f
OBSB

227
COSMIC HEUl'RIliüS AUD SÜJUWH FÜR V-BÜSO» Villi THS NASS 30-100 QEV IN TOE DEEP UUBBHUTCB KXPERIWEITS.
V.S.Beresineky and A.Z.Oasisov
Inst i tute for Nuolear Reaearob, Aoademy of Soienoes of the USSR.
The p o s s i b i l i t y of V-boson search in the underwater experiments due to the resonant reaotion ^ e • •~~r ""-*" hadrona la diaouaaad. For the power-law spectrum of neutrinos, the rate of re sonant events ia shown to be so le ly determined by integral f lux of antineutrinoai
<tyO.SM>-*-J--fe f c m V s r ' where E ia the resonant energy of antineutrino, y is the exponet of the integral energy spectrum, V ia the rate of resonant evanta
(in. years' ) and V is the detectoz- volume (in
m 3 ) .
The searer. for V-boson in the underwater neutrino experiments seems
to be most af fect ive due to the Olaahow resonant reaction. (Qlaahow I960)i
V« + e"-** V-»» hadrons. The V-boson masa (JLJ in the ranga from 3D to.
100 OeV oorvresponds to the resonant antineutrino energy E • • _ / 2 a i a IA 16 o s a
the range from: 9.I0"^eT to 1.10 eV. In Weinberg model, ( a - » 70 GeV) thm IS
resonant energy i s 5.10 -'eV. The neutrino f luxes suff ic ient for the detec t ion of V-bosons at these energies can be expected from extragalaot io source n (Beresinsky and Smirnov 1975) • Tba background from atooapherm muons i s neg l ig ib ly small at these energies and the resonant produotlom, of V-bosons results in the narrow peak in d i f ferent ia l energy apeattrum of the events produced by other neutrino reactions ( VM • N -*• M •*• hadrons t
V« + »-»• VJH • hadrons a t o . ) .
Recently there was proposed the deep underwater' experiment (iXJXAND)
for deteotion of high energy neutrinos at the depth of 5 km im the ooemn
(Kotier 1975)• Th« ins ta l l a t i on w i l l be oonstruoted as a l a t t i o e of
photomultipliers, the to ta l volume of whioh i s planned as The
ooean water around the photoault£pliera works aa a neutrino dateotort
the hadrons produoed in the co l l i a ion give a r i s e to the nuolsar-eleotro-
magnetio oaaoade, the Cerenfcov l ight from which ia to be deteoted by the
photomultipliers. At the energy E ^ X.IO eV the oaaoadas produoed by
neutrino oan be deteoted mora e f f i o i e n t l y by aooustio signala (Askarjan

228
and Dolgoshain 1977)'
The cross-Motion of the reaotion V» • • " - » ¥~-»* hadrona near the
resonance i s given by Breit-Wigner f omul» i
(r- Miriü ÜLÜ ( I )
where J - I i s the spin of W-boson, V. » V 2 i" t b e » P i n o f ** «l«o -
tron, (g - ( l /6 ir \nC ^ p 0 1 ^ *•• t h e width of lepton «ode of decay
« - » t V , 0„ ia the Permi oonatant, lii, i s the width, of hadron «ode and
I i s the tota l width of W-boson decay. In the four oolour quark nodal
and in the case of two leptons modes W-»fc*v and V-*f*^ , Tj, »6 Ij
and 1 »3/4 T • I f nu. 30 OeV the whole upper hemisphere over detector i s tranapa -
rent for neutrinos with resonant energy. The rate of resonant events
Vg + e~ -* W~-*> hadronB in the detector with the to ta l number H of
electrons i s easy to find integrating over the neutrino spectrum with.
the cross-sect ion given by Eq.( l )«
res 3^2TIXNe G p q ^ ( > E o ) , (2)
where Jf i s the exponent of integral neutrino spectrum and. 0_ corres --33 2 ponds to the cross-sect ion 4 .4 10 cm. .
Eq.(2) demonstrates that the rate of resonant event* S) „ _ i s solely determined by the antineutrino flux at the energy highes than ii =m„ /2m independently on W-boson mass. The Eq.(2) can be readily v e r i f i ed since S> ~ ^PJ • « ( E ) " I~T V." (T f where ^ „ J E )
v res ' diff x o' ' lab " max ' _ i d i f f x o'
i s the di f ferent ia l energy spectrum of antineutrinos " e ,
fl . «(nu./m ) | r^> Q j i ; /m i s the resonance width, in lab . system
and (J" „ „ ^ l/m„ i s the cross-sect ion in resonance maximum. Taking max nti into account E -m„ /2m and T L ^ E )E r*j t+T> E_) we conclude that o W' e 'diff o' o ' *' o'
the rate of resonant events does not depend on. W-boson mass otherwise
then through dependence of the flux on the resonant energy E . _ T O
The rate of resonant events \) (in years" ) with the energy de-2 "res . . ,
position E =nu. /2m in volume of detector V (in m ) is connected, with
the flux of antineutrino ( e ) T? (> E ) by the relationi
^(> E o)= 5.3IO-^.±.k c r a - V ^ (3)

229
If neutrinos ar« produoed in tho collisions of ooonio ray protonu with, nuclei (pp-neutrinos) the flux of electron antineutrlnoi( V e ) la 1/6 of the total flux. At the rate S> -10 year« DUMAHD installation of 10 m volume can detect the flux 3.I0 - on - s~ ax~ . In the caee of Weinberg model it is necessary to have this value of flux at the energy
15 5.10 yeV. According to Berezinsky and Smimov 1975 this flux exoeeda by two orders of magnitude the total flux from the normal galaxies, but the real flux can be expected three orders of magnitude higher than from the normal galaxieB (Berezinsky and Zatsepin 1976). The effective volume of installation can be made 100 times larger if the acoustic detection is to be used (Askarjan and Dolgoshein 1977). In this case W-boson can be discovered in the total flux of antineutrinos from normal galaxies and from our Galaxy.
The background for resonant events is produced due to reactionsi Stu + N -*• f* + hadrons, "vp + N -* ""v« + hadrons, S(e. + S -> e+hadrons, S>c + N -> "ve + hadrons, S>e + e -r V c + e , S)„ + e -* M • "*e and "iff,* ° —* « + e • Ti16 resonance width is only 5-656 of the resonant
energy E and the width of resolution in the underwater experiments is expected to be much larger. Thus as a condition of W-boaon detection we demand the exceeding the resonant rate over the background rate with the energy deposition^ E from the upper hemisphere. Taking into account all the neutrino background reactions, listed above we find the ratio of resonant events to that of background!
'r*i - (Wf-^-Y (4) where nu. is in OeV. The ratio (4) can be encreased if background events are discriminated by muon detection and by counting the eventa only within the width a S of the energy resolution of the installation. For neutrinos produoed in collisions of protons with miorowav» photons ( Jrp -neutrinos) the ratio (4) diminishes due to the deoreasing of the fraction of the antineutrino Vg in the neutrino flux.
The number of anions traversed the installation and produoed outside in the reaction V e • e~-» W" -f M~ + "v^ exoeada considerably the rate of hadronio resonant events inside the installation. However the ratio (4) from mion «vents decreasee by a faotor «v 25«
If the neutrino oscillations (Ponteoorvo 1967) have place then due

230
to transi t ions ^ ^ V» t h e *5 € - fract ion in neutrino flux and the rat io (4 ; increase. This effeot i s most substantial for py -neutrinos.
The authors are grateful to G.T.Zataepin, B.L.Joffe and Yu.P.Nikitin for the useful discuss ions .
References. Askarjan G.A. and Dolgoshein B.A. 1977 Pisma ZHTEF ( in Russian) 25,85, 279 Beresinaky V.S. and Smirnov A.Yu. 1975 Astroph. and Sp.Soi. 32, 461 Berezineky V.S. and ZatBepin G.T. 1977 Proo. Summer Morkahop"DÜMaII>-7615
215 Glashow 3.L. i960 Phys. Rev. 118, 316 Kötzer P. (Editor) 1975 Proo.Summer Workahop "DUMAJID-75" Pontecorvo B.M. 1967 ZHTEF 53,1717.
« e

231 /
EXTRATERRESTRIAL NEUTRIHOS ANS HIGH ESERQT HEUTBHO ASTROPHYSICS
V.S.Bera«in*ky
Inst i tute for Huolear Research, Aoadaay of Solana*« of th* USSR.
The souro** of ooaaio neutrinos of u l tra high analgias ara ooanidaredt th* dansa supernova shal l* around, young pulsars and c o l l i s i o n s of o . r . protons with stonio nuolal sad ra -l i o t photons in i n t e r s t e l l a r and intargalaotio spao*. Th* aims of high energy (E>10 •'eV) neutrino astrophyslos ars definedt the search for o . r . bursts in renote oosaologioal epochs (a £ 1 0 - 2 0 ) , the deteotion of high energy neutrino* fron young supernova s h e l l s , the ütearoh. for W-boøon with the mass 30-100 GeV and measurement of neutrino oross-sac-
t ions at E , £ 10 ^eV.
I. Introduction. High energy cosmic neutrinos are produoed by cosmic-
rays (c.r.) through decays oflf - and K-mesonB. Ve shall call neutrinos pro
duced in the nuclear collisions of c.r. in interstellar and intergalaotic
gas pp-neutrinos and those produced in collisions with photons (mainly re
lict microwave) we shall call p8 -neutrinos. The neutrino fluxes are re
lated to generation of high energy c.r. which acceleration is thought to
take place mainly at the late stages of massive star evolution (supernova
explosion, acceleration by pulsar etc.). The birth of such stara predomina
tely takes, place at the early stages of star formation in galaxies ("bright
phase") and consequently the rate of high energy neutrino production is
expected to be the highest at the same epochs. This is emphasised by the
following« the rate of star formation dN/dt is proportional- to the density
of the galactic gas J and thus neutrino, generation is enhanoed by the in
crease of the target density in pN-colliaions. The same is true'for pr -neu
trinos since the density of relict photbns vas alBO higher in the past. Of
all the high energy particles the Universe is transparent only for neutri
nos and therefore their fluxes carry the information about the burst of o.r.
production at the stage of early star formation.
Due to the steep energy spectrum of o.r. production of pjr -neutrinos
takes place near the threshold of 1f -production in referenoe system of
proton at rest. The cross-section of this reaction is measured with high
accuracy, the space density of relict photons is well known for every coa-
nologioal epoch and therefore the value to be found (the o.r. flux) is

232
so le ly determined by the measured value (noutti.no f lux) , l t> lov or>crt:.v out off of neutrino d i f ferent ia l energy opeotrum determines the value of red-shift * of the epoch of neutrino production.
nie second aim of neutrino astrophysics i s the study of neutrino interactions at energy (E>10 eV) nonacoeaaible for accelerators of a foreeeen future. The possible research include« the measurements of ^ M-cross—Motion and the search of V^boson with the mass fron 30 to 150 QeV. The remarkable feature of the proposed experiments i s the poss ib i l i ty of independent measurements of neutrino flux and cross-seot ion. 2.Cosmio souroes of high energy neutrinos. The souroe of high energy
1 -n
Fig.I Neutrino speotrai I neutrinos from o.r. burst at the stage of galaxy formation, 2 neutrinos from normal galaxies, 3 neutrinos from our Galaxy in the direotion of Qalaotio Center and 4 - - atmospheric neutri' nos«

lii
noutnno« lo f l r o t of a l l intorotol lar and mn>n alaot ic upnoe, f i l let ! with o.r«, gas and r e l i c t photono. The rigorous upper bound on the flux ! thea« nautrinoB oan be obtained fro» the observed intensity of diffuse X-and jr -radiat ion. The reason iB that high enorgy noutrino produotion (through I T - -decays) i s aocor anied by high onergy Jj -ray (through
TT -dsoays) and electron produotion. Colliding with re l i c t photons the. 3tart an eleotromagnetio cascade, whose energy transfers for th-j noet nar-to the observable X- and J -band. The derived upper bound in nhavn in P ig . I (Beresinsky, Smirnov 1975, Berezinsky, Zntsepin 1976). Cui-ve I represents neutrino flux calculated in the model of c . r . burst at the stage of an early star production (Berezinsky, Zatsepin 1976) . Curves 3 and 2 give f luxes from our Galaxy and from normal ga lax ie s .
The dense supernova s h e l l s around young pulsars can be another source of high energy neutrinos (Berezinsky, Prilutsky 197°) . Let us consider as an example the model by Gunn and Ostriker (1969) for Crab pulsar. During rv 80 years the pulsar i s slowing down due to gravitat ional radiation and i t s magnetic dipole radiation diminishes as L , =L (I+t/Xa ) * vhere L »4.8 10 ' e r g / s and Ta =1.4 10 s . This radiation accelerates protons at each moment of time t up to the energy
E(t) - B 0(i+Vrj ) - l / 3 (i) where E = 3>I0 eV. The protonE hit the shell (M=IM@ ) and produce nuclear cascade. The production of high energy neutrinos in the cascade begins at the stage of expansion of the shell at which the decay path length of the parent pion becomes less than the interaction path length. Neutrinos of maximum energy (9.10 eV) are emitted at t = 4.10 s after supernova explosion, later on the neutrino energy decreases due to diminishing of the primary energy (i). The neutrino production lasts up to the moment
•7 t a= I.3-I0 B (Berezinsky, Prilutsky 1976) ( later on adiabatic energy losses dominate over that due to nuclear collisions. At moment to, the energy of
15 emitted neutrinos is I.5-I0 eV. A fraction of energy transferred from a proton to a neutrino i s ^ 20$ at the beginning of the expansion and~ 50$ at trv t«, . The total energy of leading neutrinos emitted from t =4.10 s
7 "i till to_ -1.3 IO's is
W,«o.iJALe(1+VTs)"'«lt = 0 - 1 A U ^ ^ W t
m Ä 4 . < 0 A er^s (2)

: j 4
?his cjrn>ii"ouio to the eniaoion of ~ l.IO'-'"A. ntsulrinua .>!' ih» «.-..,•. onorgy 3-10 ''•V (here ^ IB the f ract ion of rwynetlc di"olc cn«*nti" '.rat.al«-:-red to the acce lera ted nrotono) .
The search for the o o i n t - l i k e sources ic the second a in of neutr ino a s tronomy. In p a r t i c u l a r , de tec t ion of high onorcy noulrmou from oupernova explosion in our Galaxy or nearby wil l solve the problem of the or ig in of a l t r a high energy c . r . 3 . I n t e r a c t i o n of high ener/r.v neu t r inos . At energy &v -3-10 eV the ener gy in c m . system of neutr ino and nucleon i s lf"s » 2.5 10 GeV and neutr ino and e l ec t ron i s \f"s" =55 GeV. If W-boson i s not very heavy (n ^ 1 0 0 GeV) the c ros s - sec t ions of the r eac t ions "\)i* + d—» iV + UU and "v^ •*• d-»- e + U. on va lent quarks a t the considered energies reaches the constant
(T0 =(G^/1T)m2 (6~0 = 6.9 I 0 " 3 5 c m 2 i f mv - 70 GeV). If neu t r a l cur ren ts tre suppressed only by la rge mass of Z -boson, the " sa tu ra t i on" c r o s s - s e c t i on of the processes V + d —* S + d and V • I t - » V + U. can be la rgers
•j p
(J~ Si (GT,/ir)m„ . This i s not the case in Weinberg model« the crOBS-secti-1 2 4
jns are a d d i t i o n a l l y suppressed by the f ac to r -^ - s i n 9 +(20/27)sin 9 - 0 . 2 7 , •.•:iere © i s the Weinberg ang le . Production of new leptons and quarks ( VM + d-> E + M. , Vu + d —* (w + f e t c . ) can considerably cont r ibute t o the t o t a l c ros6-sec t ion j c ros s - sec t ions of new p a r t i c l e production can even
2_/ _ ' c>.ceed the conventional c ros s - sec t ions by a f ac to r tg © , where 9 i a a nixing angle of new leptons or quarks .
2 At s > m logari thmic r i s e of c ross - sec t ion can be expected due to d i f -
w 2
i r a c t i v e p rocesses . At B » m these processes become dominant since large values of t ( | t | > m J are suppressed by W-boson propagator and the soa t t e r i nc occurs in Eegge region |t|<<_ s , i . e . a t large d i s t ances from the t a rge t nucleon.
Berezinsky and Smirnov (1976) considered the "extreme" gauge theor i e s of weak and electromagnet ic i n t e r a c t i o n s in which n e u t r a l cu r ren t s are explained by two charged W-boson. exchange. The mass of W-boson in these t h e o r i e s can
-32 2 reach 500-700 GeV and N N-cross-sec t ion a t s a tu r a t i on ~ I .10 cm . o
For fu r the r es t imates we s h a l l use Weinberg modal (sin. & «• 0 .3 m
w » 70 GeV) negleot ing the new p a r t i c l e production and poss ib le logari thmic 2
r i s e of cross-sect ion, a t s > m„ . The t a r g e j i s supposed t o consis t of an equa l number of protons and neu t r inos , so t ha t an "average" nucleon cons i s t s

:3S
of 1.5 u. -quarka and l.rj d-quarka. itoen V l»-oroca-sool ion at t a i u r a u « :
i s ff£ - 1.5(0 /IT )m - I .O'IO - OB 1 the croao-aeotlon of noutral current:-
At • • turet ion ie 0 .49* . Ine ^ N-orosa-oeotion In aocepted as O.SiJ^ , 2
which ia rather a lover l imit at a/æ £ 400. The oroae-aection of
•>)e • e -"»V« • e and - \ ) r •»• e —» f»' • ^ t ia (Te -(Qp / T ) > z 4 . I0~ 3 5 ca*
and beooaea ~ 30% higher i f neutral ourrenta are taken into a0count. The
croee-eection of V e • e~ —» a l l ia (8/31T)G • s - I . I 10~ ~m in the nodal
of 4 coloured quarks.
Therefore the predicted values "of v N-oroas-section at E > 3.10 'eV -34 2 / range between »v I.5«I0 cm (Weinberg model without new part ic le production
and logarithmic r ise of cross-sect ion at s > m ) and 1.0-10 cm (extreno
gauge models) . O T C
At E^ m m /2m (5«I0 eV in Heinberg model) the resonan-'. W-boson pro
duction occurs in the reaction "v e + e~ (Glashow I960) . In deep underwater
experiments the resonant V—production* can be observed due to reaction
V e • e~—»• hadrons, providing the narrow resonant peak in the spectrum o:
underwater showers (Berezinsky and Gazizov 1977). Besides W-boson discover;,-
and determination of i t s mass, the detection of the peak in the spectrum or
the showers enables us to evaluate neutrino flux independently on the value
of V N—cross-section because the rate of the resonant events for power-law
spectra i s so le ly determined by the flux of antineutrino with energies high* .•* 2
than E »m /2m » **t*s- 3 f 2 - i r V u 4 G / P ( > B 0), (3)
where "g is the spectrum exponent and K is the number of electrons within
the installation.
4. Detection of neutrinos and weak interaction research. Deep underwater
experiments seem to be most adequate for the aims of neutrino astrophysics.
Neutrinos can be detected due to production of nuclear-electromagnetic casca
des; and single muons of a very high energy. The detection of these muons is 13 especially effective at E « ^ 10 eV when accompanied showers, generated due
+ •• to production of e e -pairs with the small energy transfers overlap each
other and muon trajectory i s surrounded by continous glow of Cerenkov l i g h t ,
the in tens i ty of which i s proportional to muon energy (Berezinsky, Zatsepin
1977). The project (DUMAMD) of a deep underwater detection of high energy neu
tr inos was put forward by the croup of american physicist leading l>y i'.iicinec

236
(kottor 1 '7'_J) . At proaont thoy oonaider th« und«rvntor ins ta l la t ion of IO -
volum« (Roberto 1976). Koutrinors are ouppoood to bo dotect*d by r* »na of C»-
:-onkov l icht emitted by nuolear-oloctroraagnotio caooad«« produced at nuclear
interactions of neutrinos in the water. Neutrinos with E ^ ^, 10 oV can b«
e f fec t ive ly detected in underwatjr experiment« by acouatio method (Askarj&n,
Jolgoshein 1977). The detecting volume can reaoh in thin caae 10 • .
lleutrino flux in the model of galaxy formation (Curve I) i s 2.4-I0~
cm s~ sr~ at E v ^. 3-4 10 eV. This corresponds to the rate of neutrinu
ovents in DUMAffD ins ta l la t ion (iO'm 3) in the range from ~ 2.10 y e a r - (Vein-
berg model with constant cross-sect ion ~ I . I0~ cm at s>> a ) to*» 1.10
year (extreme gauge models). Near the half of a l l events are represented by
s ingle high energy muons (E^IO eV) produced outside the i n s t a l l a t i o n .
The neutrino flux can be measured independently due to the resonant W-pro-
duction i f m ^ 150 GeV. In the case m > I50GeV the to ta l >>N-crosB-sectiaai
exeeds 6 . I 0 - cm . At <5~%. 2.4 I0~ cm the Earth becomes opaque for the neu-
tr inos and therefore the value of cross-sect ion at (T£, 6 . I 0 - cm can be e s
timated by zenith angle anisotropy of the events .
The following program of weak interaction research can be suggested«
I)measurement of t o ta l V N-cross-sect ion, 2)measurements of c'ross-section3
of muonless and many muon events (Cline 1976) and 3) search for W-boscin with
m C 150 GeV. w ~ The author i s grateful to G.T.Zatsepin for detai led discussions of a l l
problems of t h i s paper.
References Askarjan G.A.,Dolgoshein B.A. 1977 Pisma ZhETF (in. Russian) 25,279 Berezinsky V.S.,Smirnov A.Yu. 1975 Astroph. and Sp.Soi. 32, 46L Berezinsky V.S. ,Pri lutsky O.F. I976 Proo.Int.Conf."Neutrino-76" Berezinsky V.S.,Zatsepin G.T. 1976 Proo.Workshop "BUMAHD-76", 229 Berezinsky V.S . , Smirnov A.Yu. 1976 Proo.Workshop "DUMAHD-76",35 Berezinsky V.S . , Cazizov A.Z. 1977 Pisma ZHBTF ( in Russian) 25, 276 Berezinsky V.S . , Zatsepin G.T. 1977 Usp.Phys.Nauk 122,3 Cline D. 1976 Proc.Workshop "DUMAND-76" Glashow S.L. i960 Phys.Rev. 118,316 Gunn J.E.jOstriker J .P . 1969 Phys.Rev. Let t . 22,728 Kötzer P. (Editor) 1975 Proc.Workshop "!XJM&irD-75" Roberts A. (Editor) 1976 Proo.Workshop "DUMAHD-76".

6&m cm DIFFUSE BACKQHOUND OF COSMIC NEUTRINOS
AT HIGH ENERGIES
R. Sllberberg and M. M. Shapiro
laboratory for Cosmic-Ray Physlee Naval Research laboratory
Washington, D. C. 20575, U.S.A.
The ataospheric neutrinos doainatc over the extra-tcireöu-lal csxa up to ~ 10 1* eV; (though the flux of v e and 'v from the central regions of the galaxy should equal that from the atmosphere from near-vertical directions at ~ 1 0 1 3 eV). At higher energies (10 1 0
eV) the diffuse flux iE relatively uncertain and model-dependent with the values given below in units of km"2 sec - 1 ster - 1. The minimum value is 10~ 8; it represents the galactic flux off plane; in the galactic plane towards the center the flux is 10" e. If direct muon production in the atmosphere is accompanied by neutrino production, the atmospheric flux is 10 - 7. If cosmic rays are accelerated at youi.g pulsars, interactions in the supernova shell would contribute 10" 8 to 10"*.
1. Introduction. The detection of high-energy (E -•» 1 0 1 1 eV) neutrinos requires huge detectors, like those proposed for the DUMAMD (Deep Underwater Miion and Neutrino Detector) project. Bie present paper explores the neutrino fluxes to t i expected in such an underwater investigation.
The diffuse background of neutrinos is due to three sources: those generated in (a) the earth's atmosphere, (b) in the disk of our galaxy and (c) in other galaxies. The first two can be estimated rather precisely. The third one has large uncertainties, since we do not know well (l) the contribution of neutrinos generated in dense, young supernova remnants, (2) the evolutionary effects (e.g. supernova rates at galaxy formation), and (3) the acceleration mechanisms in the powerful radio galaxies and the neutrino contributions therefrom. We shall explore the various sources in the subsequent three sections.
2. Atmospheric Neutrinos. These particles are generated in the decay of pions and kaons produced by cosmic rays that collide with the earth's atmosphere. In the present paper, the principal interest is in extra-terrestrial sources of neutrinos. Hence, the atmospheric neutrinos are explored here from the point of view of determining the degree to which they can obscure the detection of astronomical sources of high-energy neutrinos.
The expected energy spectra of atmospheric neutrinos have been calculated by Osborne et al. (I965), Cowsik et al. (1966), Volkova and Zatsepin (1972), Choi and Young (1975), and Margolls et al. (1977). The calculations are commonly based on the measured muon spectrum (due to Joint production, e.g., in the TT -• p, + v. process), and pion and kaon production models (e.g. scaling) in nuclear interactions.
The degree of obscuration by the atmospheric neutrinos can be reduced by studying the electron neutrino (v_) component in near-vertical directions.

238 In tenuous astronomical sources, the production of v_ 1» not Inhibited, since anions will decay. In the atmosphere, however, at higher enargleK, the paths for muon decay are sufficiently long so that the process LI - e + v (v ) +
I* M v e (v ) Is greatly suppressed, and only
_ ° - „ * + e % ^2 - * T i ~ - t - e ' + v e {\>^) Is an effective source of electron neutrinos. The near-vertical neutrino flux is further suppressed, because plons and fcaona move in a shorter time into denser regions of the atmosphere Increasing the rate of col l i s ions at the expense of decay.
Margolis e t a l . (1977) consider an additional possible atmospheric neutrino source that could become dominant above 1 0 l B eV. Several recent experiments have shown direct production of muon or electron ( i . e . , lepton) pairs, at a rate of 10" 4 relative to pions. If neutrinos are produced in this process, these would become dominant at energies for which the probab i l i t y of pion (or kaon) decay becomes suff iciently small.
Figure 1 shows the estimated atmospheric neutrino flux, the vertical v flux, and the possible flux of direct neutrinos.
i 1 1 r
ATM0*««IIC » • ' • ATI*. VWTtCAl.,
— - K K M U ATM. OMCT .
_ 1 I I
GALACTIC NEUTRINO FLUX
EVENT/YEAH 10" TONS
DISK, TOWARD CENTER
DISK, AWAY _ FROM CENTER"
OFF DISK
DISK ITOWARD CENTER) DISK (AWAY FROM CENTER)"
OFF DISK i_
IO 1 0 I 0 1 1 10" 10" 10™ 10" 10* ENERGY (»VI
Fig. 1. The flux of neutrinos generated in the atmosphere. The v from the vertical direction are shown separately. The possible direct neutrinos (if produced in the lepton pair production process) are also shown. The dotted curve shows the flux that generate one event in 1 0 1 1 tons of water in 1 year.
Fig. 2. The flux of galactic neutrinos, those from the disk, at -6o° to 6o° longitude are shown, as well as from anticenter longitudes. The lower curve shows the galactic flux, off the disk. The dotted curves have the same meaning as in Fig. 1; several curves are shown, corresponding to the fraction of the solid angle subtended by the region considered.

239
V; Galactic Weutrlnoe. The flux of galactic neutrinos can be calculated fro« the distribution aud energy spectrua of cosmic rays In the galaxy and the density distribution of the Interstellar fas. The energy spectrue or the high energy comic rays Is known froa experiments. Recent reviews on this subject have been given by HI11a« (1975), Wolfendele (1973) and Watson (1975). Estimates of the distribution of cosaic rays and/or galactic hydrogen are given by Flehte 1 e t a l . (1975), Stecker et a l . (1971*) and Gordon and Burton U976). Toe distribution of galactic gamma rays above 100 MeV and of neutrinos should be similar--both originateaalnly ln pion production. Bereslnsky and Smlrnov (1975) present an estimate of the flux and energy spec trua of galactic neutrinos fron the central regions of the galaxy. Fro» the data of Fichtel e t a l . (1975) and of Share e t a l . (1971*) we infer that this flux should mainly come from a band distributed along galactic longitudes -60° to + 6b°, and l e s s than 6° in latitude. In the galactic plane, but outside this central longitude interval, the flux should be lower by about 5 or by one order of magnitude than in the central interval. The flux off-plane can be estimated from the relative amount of material along the l ine of s ight—it i s ~ Ijt of the flux in the galactic disk. Fig. 2 shows the fluxes from the inner annulus, from other regions of the galactic disk and from directions off-plane. Above 1 0 1 4 eV, the flux from the galactic center exceeds (per steradian) the atmospheric neutrino flux. The latter i s steeper because at high energies, the probability of pion and kaon decay i s greatly and increasingly exceeded by the probability of co l l i s ion .
h. Extragalactlc Heutrinoa. One ccoponent of the extragalactie neutrinos can be calculated with a sufficient (better than order-of-magnitude) precision—the flux due to cosmic-ray Interactions in the interste l lar gas of normal galaxies. Berezinsky and Smirnov (1975) have calculated t h i s , but their value i s too high by a factor of ~ 100. They had adopted a density of normal galaxies of 5 x 1 0 " 7 5 cm"3. This i s too high, because i t includes dwarf galaxies, or i s based on the local (rather high) density of galaxies, or i s based on catalogues prior to the reduction of the Hubble constant to 55 km e~* Mpc"1. With a supernova frequency of 1 in about 20 years, they would get ~ 3 i 1 0 ~ 7 a Supernovae per cm3 per year, or p a n « 7 x 10" 3 Mpe"3 yr" 1 . Tammann (1976) shows that outside the Virgo super-cluster, the value i s p s n = 6 x 10" 5 Mpc"3 yr" 1 , i . e . , 100 times lower. The corresponding neutrino flux i s shown in Flg. J.
We shall nov explore the evolutionary effects of normal galaxies. Truran and Cameron (1971) find that in order to explain the abundance of heavy elements in.our galaxy, about 5 x 1 0 9 Supernovae are needed, most of these during the f i r s t 1 0 9 years after galaxy formation. The mean rate over the whole age of the galaxy i3 thus about 5 x the present rate. The factor 5 implies « k in the earl iest epoch, which i s offset by a redshift diminution o f . ~ 3 . So the early contribution i s comparable to the subsequent one. The net flux could thus be about twice that calculated from the current supernova rate.
However, the contribution from anomalous galaxies could exceed that of the normal galaxies by an order of magnitude. The radiogalaxy Cen A a t ~ 5 Mpc exceeds the radio output of our galaxy by a factor of 1 0 s . I ts gamma-ray emission (Grindlay, 1975) i s more powerful by a similar factor, maybe even by 10* and implies the presence of electrons with E > 1 TeV. The above factor of 10 3 exceeds the value of « 200 given by Tammann.(1976) for the ratio of the supernova rate within a radius of 22 Mpc to the rate in our own galaxy. The Virgo superduster has another strong radio source, M-87.

240
Another source of n«utrlnoa—due to col l is ions of protona accelerated at a pulsar and interacting In the young supernova shell—bas been proposed by Bererlnsky (1976). The Crab pulsar la a very eff ic ient accelerator of highly re la t lv l s t l c electrons (Final and Volf 1969). However, the »ein process by which the particles are actually accelerated la not yet known. Direct acceleration has been proposed by Goldreich and Julian (l9t>9), the action of vacuum electromagnetic radiation has been suggested by Pacini (r>'^) and Gunn and Oetriker ( l9°9) , and that of hydromegnetic wave «mission by Kulsrud ( l97 l ) . We adopt Ruderaan's (1972) estimates for the range of i n i t i a l pulsar spin-down rates—between k x 10"*° and IO'13 erg/sec—and a period of 0.5 year of neutrino production. Since the Feral nechanisa Invoked by Scott and Chevalier (1975) Is applicable only below ~ 10 r eV, we shall assume that above this energy, particles are accelerated at pulsars. Fig. 5 also shows the estimated neutrino fluxes from pulsars with acceleration eff ic iencies of 1 and 1CT2, respectively. For the low energy input requirements of the Petera-Weatergaard model (1977), the lat ter efficiency i s probably more representative.
Appreciably higher fluxes are possible If one assumes that many galaxies go through a quasar phase; in this scenario a small but highly massive galactic core i s bui l t up in which Supernovae are generated with a high frequency. The particles (E > 1 0 1 5 ev) generated at pulsars are trapped at the galactic core and further accelerated by a second order Fermi process: high densities of magnetic knots are activated by the merging of supernova shel ls into each other.
5; Advantages of neutrinos over gamma ray». The high-energy neutrinos (E > 1 TeV) provide a useful method for exploring high-energy reactions and acceleration processes—perhaps the best method in the case of distant galaxies. High-energy photons (above 1 0 1 4 eV) are readily degraded by interactions with the 3° K microwave radiation over distances > 1 0 s or 1 0 e l ight years, i . e . , i f they arise beyond the local group of galaxies. Even above 1 0 1 S eV, photons from distances > 10 9 l ight years are suppressed by interactions with optical photons. No such limitations affect the arrival of neutrinos from distant galaxies.
6. Resolution of Flux Components; Conclusions. Above energies of 1 0 1 3 eV, the flux of v e from the -66° to + 6o° annulus of the galactic disk wi l l exceed those from the atmosphere. If high-energy cosmic rays (E > 1 0 1 S ev) are accelerated at young pulsars, their interactions in the supernova nebula generate "shell showers", which result in an appreciable flux of neutrinos i l lustrated in Fig. k.
For E > 1 0 1 5 eV, various components have nearly equal fluxes (see Figs. 1, 2, 3 , and U): (a) possible direct neutrinos from the afcnosphera, (bf possible flux from radio galaxies, (c) galactic neutrino flux, off plane and (d) flux from pulsars with the lower I n i t i a l spindown rate of the pulsar, for eff ic iencies « = 0.01 to 0 .1 . To determine which component dominates, complementary observations are needed: For component (a) , the ataospheric ultra-high energy neutrinos are accompanied by air-shower muons. Component (b) can be estimated by measuring the neutrino flux from individual strong radio galaxies, e . g . , Centaurus A; cusponent (d) can be estimated from the flux arising in a new supernova she l l , in our galaxy, or In a nsarby galaxy.

241
10» IO'2 10" IO1» 10" 10» 10° ENERGY («VI
Fig. 3 The flux of extragalftctic neutrinos. Curves are shown for neutrinos from normal galaxies, radio galaxies, plon photoproduction against the microwave background radiation, and for neutrinos from supernova shell showers. The symbols H and L denote the high and low pulsar spindown estimates of Ruderman, and c the assumed efficiencies for the conversion of spindown energy into cosmic-ray energy.
7. References
. 'Jan M'^sa!
W* L. M» t0" 10" »« W «P MBOVMM
Fig. k An illustration of the obscuration of extraterrestrial neutrino fluxes below 1 0 1 3 eV by the atooapheric background, tor the optimum case of vertical atmospheric v e. Above 1 0 1 3 eV, the galactic disk becomes discernible, as well as possible neutrinos from shell showers in young (< 0.5 years) supernova remnants.
Berezinsky, V. S., 1976, Proc. 1976 DUMAND Summer Workshop, Univ. of Hawaii, P. 229.
Berezinsky, V. S. and Smirnov, A. Yu., 1975, Ap. Space Sei 3_2, l»6l. Berezinsky, V. S. and Zatsepin, G. T., 1976, Proc. 1976 DUMAND Summer Workshop, Univ. of Hawaii, p. 215.
Choi, M. C. and Young, E.C.M., 1975, l'+th Internat. Cosmic Ray Conf., Munich, 6, 213!*.
Covslk, R., Pal, Y., and Tandon, S. N., 1966, Proc. Ind. Acad. Sei., 63A. 217. Fichtel, C. E., Hartman, R. C., Kniffen, D. A., Thompson, D. J., Bignami, G. F., ögelman, H., özel, M. E. and Turner, T., 1975, Ap. J. 198, 163. Finzi, A. and Wolf, R. A., 1969, Ap. J. (Letters) 155, L107. Goldreich, P. and Julian, W. H. 1969, Ap. J. 157, 869. Gordon, M. A. and Burton, W. B., 1976, Ap. J. 208. 3l*6. Grindlay, J. E. 1975, Ap. J. 199. 1*9.

242
Gunn, J. K. and Ostrtker, J. P. 1969, Phys. Rev. Letter» 22. 726. Hillu, A. M., 1975, Phil. Transac. Hoy. Soc. Iondon, A 277. 13-Kulsrud, R. N., 1971, Ap. J. l6j. 567. Margolls, S. H., Schräm, D. X. and Silberberg, R. 1977, to be published. Osborne, J. L., Said, 8. S., and Wolfendale, A. W., 1965. Proc. Phys. Soc. 66. 93.
Pacini, F., 1968, lature 219., ll»5. Peters, B. and Vestergaard, H. J., 1977, to be published. Ruderaan, M., 1972, Ann. Rev. Astron. Astrophys. 10_, 1»27. Scott, J. S. and Chevalier, R. A., 1975, Ap. J. (Letters) 197. L5. Share, G. H., Kinzer, R. L. and Seeman, H., 1971*, Ap. J. 167. I»5. Sllberberg, R., 1976, Proc. 1976 DUMAHD Sumner Workshop, Univ. of Hawaii, P. 55.
Stecker, T. V., Puget, J. L., Strong, A. W. and Bredekaap, J. H., 1971», Ap. J. (Letters) 168, L59-
TaoBann, G. A., 1976, Proc. 1976 DUMAMD Sumner Workshop, Univ. of Havaii, P. 137.
Truran, J. W. and Cameron, A. G. W., 1971, Ap. Space Sei. 1^, 179. Volkova, L. V. and Zatsepln, G. T., 1972, Soviet J. Nucl. Phys. l|»_, 117. Watson, A. A., 1975, Rapporteur Papers, lVth Internat. Cosmic Ray Conf., Munich, 11, J*019.
Wolfendale, A. W., 1975, Phil. Transac. Roy. Soc., London, A 277. *»29-

249 Search for Rewtrlaoe of Extraterrestrial Orixl»
;
W. Prati, K. Lande, C. K. Lee, t . I. Steinberg
Physics Depaif—t university of Pennsylvania Philadelphia, I«. 19104 U.S.A.
I . Penyvea
University of Texas at Dallas Dallas, Texas 75230
0. Saavedra Laboratorlo di COSMO Geoflslca 10125 Torino, Italy
An intercontinental array of neutrino detectors with stations in the United States in the Hooestake Gold Mine, Lead, South Dakota and the PPG Limestone Mine, Barberton, Ohio and in Italy in the Mt. Blanc Tunnel has been in operation for several years. The array Is designed to search for neutrinos from extraterrestrial sources such as neutrino bursts from collapsing stars. Data from this search will be presented.

åCttcctøe Galactic and Extragalactlc Ultra-High Energy Neutrinos
Steven H. Hirgolls and David N. Schräm
Enrico Feral Institute and Department of Astronomy
University of Chicago
Chicago, I l l inois 60637
The flux of ultra-high energy (E > 10 GeV) neutrinos from a variety of types of astronomical sources Is estin«ted. I t 1s shown that there may be a detectable level of high energy neutrino flux and that compact source high energy neutrino astronomy may also be feasible with detectors such as DUMAND.
J. Introduction. The development of 1 km undersea neutrino detector (Roberts, 1976) will open a unique eye on the universe. The Interaction of ultra-high energy cosmic rays (E i 10 4 GeV) with protons at rest will generate * ' s , K's and u's, which will decay to produce detectable high energy neutrino?. These neutrinos will travel through the universe unimpeded; typically, the mean free path of these neutrinos is much greater than the distance equivalent of the age of the universe. Thus, high energy neutrinos provide a picture of conditions in regions ranging from the Earth's atmosphere to the nuclei of active galaxies. Detection of these neutrinos will yield information about cosmic rays throughout the universe, high energy physics and weak interaction physics. In addition, measurements of the flux from compact objects will provide information on cosmic ray acceleration of high power astrophysical objects such as Supernovae, pulsars, and radio galaxies.
The diffuse flux of high energy neutrinos was f i rst calculated by Berezinsky, Grigoreva and Zatsepin (1975). In the work presented 1n this paper, and a more complete version by Margolis, Schramm, and Silberberg (1977), i t 1s shown that the variations in models proposed to account for high energy interactions responsible for neutrinos and in determinations of the cosmic ray intensity of those energies throughout the history of the universe produce a wide range in the estimated neutrino flux. The Margolis et a l . results Indicate that a detectable flux might be present even under relatively pessimistic assumptions. Figure 1 shows the dominant contributions to the diffuse background. Each range provides information about a different regime.

245
lo« (E/G«V)
6 8 KD 12 4 . T r
A CONSERVATIVE VIEW OF THE NEUTRINO SKY
.ATMOSPHERE
10
U 12 -
J 14
o 7 16
18
2 0 -
22 -
i/day/10*tons ' v N constant
GALACTicX \ l / d a y / i o * tons 9
VH a E CENTER
PULSARS^
PHOTOPRODUCTION
Figure 1. The minimum neutrino Intensity est i røte, showing the dominant source in each regime. Galactic center f lux 1s based on the low CKP model. The sol id curve Is the integrated diffuse contribution. Point sources w i l l stand above this curve 1n certain directions. The broken lines represent 1 count/day for a 1 km3 detector for two dependences of neutrlno-nucleon cross-section a „ w i t h energy.

24« 2. Low Energy Diffuse Background. At the lowest energies. (C { 10* GeV), cosmic ray collisions in the atmosphere will generate mesons which decay to neutrinos. The effect of time dilation above about 10 3 GeV on meson decay steepens the observed v spectrum relative to the production spectrum. In this range one can look for the production particles such as the intermediate vector boson (W) [c.f. Cline 1976].
Contributions from the galaxy become Important at 10 - 10 GeV. The Galactic center will dominate at 10* GeV; regions of lower gas density will rise above the atmospheric background towards the higher energies. The flux In this region m y provide sufficient events to examine the neutrino-nucleon cross-section o v 0 by observing attenuation produced by the Earth. In addition, the cosmic ray energy density towards the center of the galaxy can be derived from these measurements. 3. High Energy Sources. Above 10 GeV, the falling neutrino-spectrum could make observations of the flux impractical If o v n does not continue to rise. The diffuse background below % 10° GeV could result from neutrino shell sources surrounding regions of cosmic ray acceleration. For example, if pulsars accelerate cosmic rays, then the pulsar splndown energy might be converted to neutrinos. This also suggests that a nearby young pulsar might be detectable as a compact source. Other possible sources of cosmic rays, such as active galaxies, might also appear at detectable levels, yielding important information about cosmic ray sources.
Q Above ^ 10 GeV, photoproduction of pions by cosmic ray interactions with the microwave background may become the dominant source. If this flux 1s detectable, it could provide evidence for the spectrum of cosmic rays above 10'' GeV. An additional factor Is that a dearth of protons at those energies will reduce the flux below the predicted values.
4. Summary. Almost certainly, we have not exhausted possible sources of ultra-high energy neutrinos. Exotic sources might exist, which could boost the flux above the lower limits presented here. However, very conservative estimates seem to yield a flux which may enable the measurement of otherwise unknown quantities.
We gratefully acknowledge discussions with our collaborator R. Silberberg and additional frequent discussions with 6. Cocconl. This work was supported 1n part by U.S. NSF Grant 76/21707 at the University of Chicago, and in part by the Shirley Farr Fund and the Enrico Fermi Institute Research Fund.

References 247
Berezlnsky, V .S . , Grlgoreva, S . I . , »nd Zatsepln. C.T., 1975, Ap. Sp. Set. 36, 17 ^
Cl IneTT). . 1976, Proe. 1976 DUWHD S i — r Workshop. FMAL: Batavla, *65 Nargolls, S.H. , Schräm». D.N.. S l lb t rb t rg , R., 1977. Ap. J . (Submitted) Roberts, A .D. , 1976, Proe. 1976 PUMAMO Suwwr WorkshopTTRAl: BatavU
fätfCC&f 24« "TVKAXVr AS A i 'TKIKO dXd HkTOilSQ VIOUCMT HEKOTü COSKUI.OQICAX KKCHS.
V.S.Be res in sky and O.T.Zeteepin
-net i tute for Uuolear Ra search, Aoadeay of Soienoea of the USSR.
A buret of oosmio ray generation ia suggastad at the stafe of
galaxy and the f i r s t generation of atara formation. I t explains
the observed diffusa X- and g -radiat ion. Aoooapaning neutrino
flux with energy £ 3 . I 0 I 5 e V can be deteoted by "WXAXJT.
1. Burst of ooarolo rays and diffusa X- and If -ray or ig in . It saeas al -
oat certain that the rapid formation of the f i r s t generation of oaaaiv*
..tars was accompanied by oosmio ray ( c . r . ) production. Large explosions
associated with quasars, radio galaxies and young galaxies at the early
: tage of the Universe (Schmidt 1968) are generally accepted conceptions of
riodern astrophysics . Morrison (1969) suggested that protogalactio sources
crn release 10 ergs energy each over 1 0 - 1 0 years period. Schwarte e t . a l . .
(1975) using observed metal abundances estimated the energy output of an I I 62 •
er.rly galaxy with M ~ 10 M© as 5-10 ergs and the net k inet ic energy of
p.ll supernova s h e l l s as I .10 ergs) the same amount of energy must have been
released in c . r . The c . r . burst at a very high red-shi f t z Ä 70-100 was sug
gested by Stecker ( I97I ) .
We suggest here that i_t the epoch in which galaxies and early type stars
-.•ere formed, there occurred a burst of c . r . production with the energy out-
nut *v 5.IO ergs per galaxy and that the observed diffuse X- and X - r a d i a
t ion in theerange I keV-30 MeV i s produced by high energy c . r . fron th i s
burst . We assume the red-shift of the epoch z ~ 3 0 and the generation speot-
rum of cosmic protons of the form d*Pp /dE /v B -^ ' extending from E , to
,1 . He shal l use the value of }f x I.1-1.2 which i s s l i g h t l y smaller than max
llalaotic one ( y -1 .3 ) &ue to the IS -d is tr ibut ion of the sources (Berezin-
sky e t . a l . I975) . The interaction of high energy protons, with r e l i c t photons at the epoch z \
i s characterized by two ene'jy values. The f i r s t i s ö p ( z ) " © p o / ( l+s) ,where i 17 -J
0 p ( z ) and 9«o™4»0 10 aV are proton energies at the epochs z and s-0 o o r - | respondingly at which energy losses, due to pair production p+Jf - * p+e~+o+ k reach the energy lo s se s due to the red—shift. The second value. |
01J-(Z)" 6 i r o / ( I + z ) defines the proton energy at which photopion energy l o s s | I

249
• -x:;:i to ajrinate over oair production! 0 V O « 6 . I lü «V, bota fjjx.-ul.io
j-o valid at i £. 10.
The tota l energy of protona with individual energies at h-o tie rati on hl£t:- r
". .n © p ( s ) transferen almost ent ire ly into diffusa X- and y -radiation
d.-o to the electromagnetic cascade in i t ia ted by a high enexgy electron or
•^hoton and developing through the c o l l i s i o n s with ro l iot photons (Stront
o t . a l . I 9 7 3 ) . 'The c . r . burst at z x 30, suggested hore, resul ts in oasoads
A-rcy radiation with spectral index J,. »1.5 in 1-30 keV range andJ l t »2 .U
in 30 kflV-300MeV region with speotrum turn over at K-30 keV due to interac
t ions of ~g -quanta with (JV-photons (Berezinsky and Sraimov 1975). In
contrast to Strong e t . a l . (1973) we do not need to postulate the metagalac-
t i c origin of the bulk of c.r.'observed in the Galaxy; in our model the
ei.ergy density of metagalacyic c . r . i s 3.6-10 eV/cm at "g - I . I , i . e .
3.10 times l e s s than that observed in the Galaxy.
2. Heutrino radiat ion. The present (z»0) spectrum of metagalactic o . r .
conerated in the cosmological burst d <Pp /dB • AB~ has a low energy
cut off at E . / (1+z) and. high energy out off at 0 p ( z ) / ( l + z ) , the l a t t e r
being caused by energy lo s se s due to pair production. The energy density
lust by c . r . ia equal to the energy density of diffuse X- and Jf -radiation
U ) x - / / _ ! ) * • [ 8 p ( . ) / { ! + « ) ] " ( * _ I ) X I . I O - V o m 3 ( I )
Then the present (z»0) energy density of metagalactio o . r . ia
Neutrinos are generated at the epoch z in the c o l l i s i o n s of high energy pro
tona with r e l i c t photons through U~ -decays. They are produoed mainly by
the protons with the energy higher than 9ir ( z ) . The present (z-0) apeotrum
of these (p Jf —) neutrinos i s
where C i s the fraction, of the energy transferred, from proton, to neutrino
( p Si 5.10" ) , ^ i s the fraotion of the energy retained by the proton
af ter o o l l i s i o n (at threshold «A »I-^A /m Ä O.85). The speotrum (3) has

ISO
tho low oncujy cut ol'f a t K • t GL.(*) / ( 1*~ ) • Account o: æ-_-»ll i-iwrrjr
cion* leads to the maximum in di f ferent ia l neutrino apeclrun at i- . TV.la n
energy ia so le ly defined by the red-ahift of the burst epoch i C - 3 . M O l 8 / ( I « - i ) 2 ~ 3.4 I 0 I 5 e V at i ~ 30. The total integral flux of
ID
Q | -neutrinos i a
-ithTO)- J ( I - " I » ) ( I S ) ' The calculated values of ^p*' (in cm" s or ) for different -g are lie-
ted below
J" I.I 1.2 1.3 1.4 1.5 1.6
("tø) 2.2 I 0 - 3 2.25 I0~ 3 1.76 I0" 3 1.22 10~ 3 8.4 I0" 4 5.1 I0 - 4
<f£* 2.4 I 0 ~ 1 2 2.4 I 0 " 1 2 1.9 I 0 ~ 1 2 1.3 I 0 ~ 1 2 9 .0 I 0 ~ 1 3 5 * 5 I 0
Let us now estimate the necessary energy output of a source in c . r . The t o
t a l energy output i s W »(U) M .+W X )n~ ( l + z ) ~ 4.5-10 ergs , vhere
n =5.10 iycm~ i s the present density of ga laxies in the Universe. I f a du-S S/2 7
ration of the hurst i s a t - flz/H (i+z)^' ~ 10 years ( a z » 3 ) , then the necessary power at production i s L - w\ +/A t 'v 10 ergs / s while the pre—
dl sent power of our Galaxy in c . r . iB *v/ 2.I0 ergs /a .
One must keep in mind that diffuse X- and g -radiation places the r i g o
rous upper bound on p y -neutrino flux which does not depend on spectrum
shape (Berezinsky, Sraimov 1975)« <R,P* (> E) < ( c / l 2 t r )( W x / E ) , where
W „ c 1.10 eV/om . The model considered above i s a reasonable example
whioh yealds a neutrino f lux at about, the maximum value.
3 .Pos s ib i l i t y of neutrino detection by "DÜMAHD". Neutrinos with any reaso
nable energy do not undergo o o l l i s i o n s during the la te stages of the expan
sion: of the Universe (Bereiinaky, Zatnpin 1979) and therefore they ara the
l i v ing witnesses of v io lent oosmologioal epoch» of galaxy formation or the
ture t of star formation. The maximum of neutrino speotrum (E ) i s the measu-m
re of the red-shift of that epooh. Lat ua oonaidax the p o s s i b i l i t y of de-tco-
tiott of t h i s flua: by IC^m3 de teat or "DOJUBD" (A.Roberta 1976). The oouat ra
t e , i . e . the number of neutrinos whioh undergo interactions within the de tec
tor per unit time i s
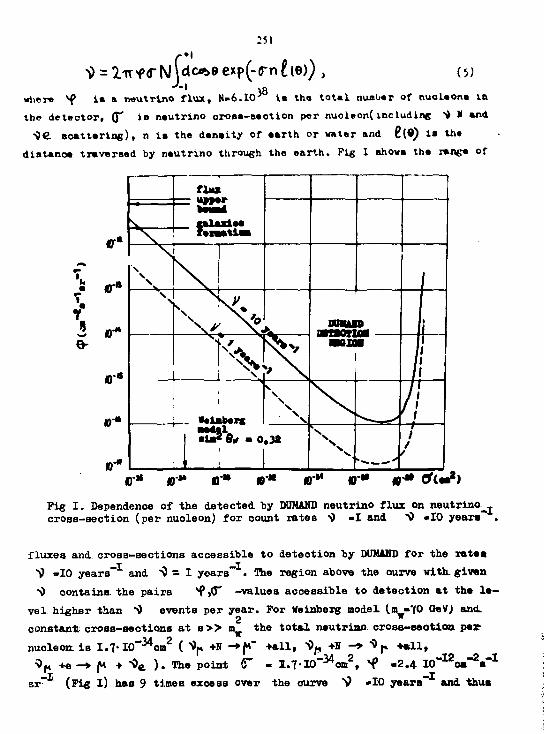
251
i»I d<*>eexp(-(rn£(e)), (5)
where f ia a neutrino f lua , N-6.I0"'" t» the to ta l number of nucleone ia the deteotor, ( f io neutrino orooa-seotion per nuoleon( including "v * and
^ e scat ter ing) , n i s the denalty of earth or water and Cl*) i» the diatanoe traversed by neutrino through the earth. Pig I show« the range of
o* r» • * r" -r - r » «•* er<eV> Pig I . Dependence of the detected by DUMAHS neutrino flux on neutr ino^ cross-sect ion (per nucleon) for count rates S> »I and "0 »10 years
f luxea and. cross-seot ions accessible to detection by DUMABD for the rate« V »10 years and " 0 = 1 years" • The region above the curve with, given ^ contains, the pairs *f |0~ -values accessible to detection at the l e
ve l higher than "0 events per year. For Weinberg model ( m - 7 0 G*V) and. 2 constant, cross-sect ions a t s > > m_ the t o t a l neutrino, oross-seotion per
nucleon. i s 1 .7'IO - 3 *om 2 ( S>p +N -+f»" + a l l , S» +H -*• "* r Mi l l , 3 ^ +e -*• ft + S>e ) . The point <T - 1 . 7 - l 0 ~ M a a 2 , *f - 2 . 4 I O * " 1 2 « " 2 - " 1
-I sr~ (Pig I) has 9 times excess over the curve S> »10 years" and thua

252
c orr» «ponda to tho imta ^ a:. 90 yaara . Huona generated by aautnuaa
out alda tha dataotor doubla thla rata ( ^ ^ "X, I60 yaara ) . In tha
extra »a gauge aodala of weak and eleotrOBagnetio interaction«
(Bereainaky, Sairnor 1976) VN-oroaa-eeotioa and».the rata of tha evante
ara 100 tlaaa higher.
Åt f > 2.4-10 " o a nautrlno-nuolaon oroaa-aaotlon oan ba »atla*tad
by «enith ang la aniaotropy of tha aranta. At 2.4- I 0 - i * £ <T £ 1 .2 - ID~ i 2 e« 2
tha ooaan abcnra tha inata l la t ion ia traneparent for nautrlnoa «hila tha
earth gradually beoonea opaqua and oonaaquantly tha total, laotropy trana-
forma Into isotropy only in tha uppar heniaphere with the diainiahing of
the »Tanta from the lower hemiaphera«
References
Berezinsky V.S. and Smirnov A.Yu. 1975 Aatroph.Sp.Sci. 32,461
Berezinsky V.S . , Grigor'eva 3 . 1 . , Zatsepin G.T. 1975 ilsixL 36,17
ierezinsky V.S. and Zatsepin G.T. 1970 Yader.Piz. I I , 200
Berezinaky V.S. and Smirnov A.Yu. 1976 Proc.1976 DUMAHD Workshop, 35
Morrison P. 1969 Ap.J.Levt. 157, L75
Roberts A.(Editor) Proceedings 1976 DUMAHD Workshop, Batavia, KJL
Schmidt M. 1968 Ap.J. I5I»393
Schwarz J . , Ostriker J . P . , Yahil A. 1975 Ap.J. 202, I
Stecker P.W. I97I Nature 229,105

253
COT BAHATIG* f&OK THB BHORBB D1YILOP1BO TM BåJJME t A S f t A.A.Belyeev, I.P.Iveaenko, T.T.aekarov Institute of luolear Physios, Moscow Universltr, • M M * , 11723*. UBS1
Abstract. Che electron function of ' " r l f distribution valid VB to large angles has been used to solve the problem of the lateral distribution of OereakoT radiation (Ol) fron electron-photon showers developing in water. Tas solution has been obtained for the approximation of a luminescent point, las offset of the finite length of the oasoade is analysed. The results may be used to analyse the experimental data of the DOMiftD experiment.
1. Introduction. Solution of the problem of lateral distribution of OB from the showers developing In water pxoTea to be noossaary to aest the requirements of the USAexperiment VöUiXl/l/ The aim of the experiment is to study neutrino and auons. A recording system is submersed down to an about 5 km depth in ocean The information on the / / o r A' interactions in the detector is obtained by recording GB from a shower generated by the interacting particles. Analysis of the experimental data demands that OS WIH (function of lateral distribution) should be known.
2. OharacteristicB of the medium. Saline water contains some 3.5% of salts, which must be taken into account when calculating the cross-sections. The saline water composition is presented in Table 1.
XableJL Substance HgO Ha K Mg Ca Ol 8
% 96,5 i,05 o,0* 0,13 0,0* 1,9 0,09
The interaction cross-sections in saline water were found for each type of interactions, and the relevant cross-section in substance of given Z were borrowed from (Habbel,1969). The re- ' aultant cross-seoticns wore used in calculating the shower parameters.
Table 2 l i s t s the values of the refraction index of water n as a function of wavelength ^ .It can be seen that the refraction index varies insignificantly with Å , and below we shall use the value of nél.33. In the general case, 0c(Cerenkov angle) i s energy-dependentt £få 9o.z=. il JJZ7v7f[ Here V is

2 5 4 Ifcblc 2
A U ° ) 3062 4341 56*0 106000
a 1.35 1.3* 1.33 1,32
tta* «loetxoa action wolooilyt o la the apood of light la veouua.
As tba eleotroa •nasty laoraaaaa froa OR threshold energy 1. »
ttaa Oereakow aasla ineroaaoa froa aoro to Q?** . table 3 pro»
aonta ttaa roaulta of ttaa QJLB) calculations. It oan bo aoan froa
ttaa labia that at E*5 10 6 eV 9t, ooinoidaa practically with øf*£ 41o20«.
K(oY) 7.8 10 5 10 6 2 10 6 5.11 10 6
0 C(R) Ö 16°10 38°30 *1°19
The total nuabor of tbo cascade-generated ptaotona ia dator-
f *> (1)
Here fi -fr* $(.(&) i s tbe suaber of ptaotaas generated by an e l e c -tron with energy I along a path unit) P(S^ ,B a sa l ) i s the equil ibria« differential apeotsua of electrons in a cascade produced by a priaary with energy X 0 | ^«36 .4 g / e a 2 la the radiation unit in water; Pw i s the sal ine water density. Let us find the contribution of A Q to 08 generated by the shower particle« in the energy range *£ B, where A % ? " * - (9^-ØMfUtlCfii 20%, ZOJk. Table 4 presents the results of oaloulatioaa of *Q/Q. and t>. I/I» the ratios of the Oerenkow photon nuaber, and e l e c tron nuaber In the energy range fyj- I , to the tota l nuaber of the OerenkoT photons and electrons ( in %) respectively«
Bable 4
u9/£ 0») 10 20 30%
MVi ot) |,9 1.9 o.a *>%} (*) j ,3 0.5 0.3
I t oan be aeon from table 4 that the energy dependenoe of & aay be neglected. & w i l l mean heaaeforth ft*** . Thejra-lue e^mO.12 radian i s close to o V * » ? * 0»** t »*»re &* i«

255
the aeooad moment of FAD (function of angular dlatrlbutlom)
calculated by the many-group method (Belyaev,et al. ,1975)«
be expeoted that la tba DOUAID experlasat tba OR intensity »HI
be above tba detection threahold at dlatanoea L auch la aaooea
of tba length Z • 5 m from of tha oaaoada from partlolaa with
E.^.10 1 2 aT. To obtala information oa tba lataraotlom looation,
tha aotloa of tha primary» aad tha energy ralaaaad by tba prima
ry la ita interaction, it la aaoaaaary that eaoh ahower ahould
ba dataotad with a auff leiaatly graat wiabe r of Oeraakov deteo-
tora. la eaaa of dataetioa of light at graat diatameaa S7L*>*1,
tha longitudinal dimaaaloa of tha oaaoada may ba negleeted, all
tha alaotroaa may ba aaauaed to aalt tha Oeraakov photoaa from
tha oaaeada oaatar of gravity, aad thalr angular dlatrlbutlom
may ba ooaaldarad to eolaoida with tha alaotroa BIB. the total
radiatioa of tha eaaoada will ba written, la aeoordaaoa «its
where H_ la the equilibrium integral apectrum of tba oaaoada
electroaa. Uaiag tba espreaaioa for «_, we ahall obtala tba to
tal number of tba eaaoade-goaerated photoaa t I •«•10"* B 0, whara
K i s a ooaataat cloae to 1, B Q la aaaaurad im aT. Slaee tha ra
diating ayatam la a point, FLID eaa ba oonvtalently areal aad oa
a apbere. Because of the radiatioa ayametry relativa to tba
shower azia, tha looatioa of tha polat tha radiatioa Intensity
of which we are iateraatad will be defiaed by tha ooordlaatea L
(tha aphara radium) aad 90 (the angle with tha o asanas axis).
Tha radiatioa integral will ba written la tha foam
whara f(.ø) ia the alaotroa IAD; la tha light abaorptioa
path ia water; Q ia determined from tha ooaditioa ooa 9 •
-eos0,oos0(.<Mla&tsla£0?At B„A ^ 10 3, tha electron FAD la
Independent of B #. Sous, after oaloulatlag $ ( ©•) for various 0« wa obtaia FLU» for various X« aad L by multiplying ^ ( ft) by tha
givem function of B Q aad L . It eaa ba aaaa tram (2) «hat tha
aoat alghifieamt dependenee of BL4D oa L at lSfa>£ i» datar-
aimed by tha espoaentlal factor, i.e. by light absorption.

256
I t i s of importance to the DUMAID experiment to estimat« th« back flux of th* generated photons relativ« to th« dlreo-t ion of th* primary partial« motion. Therefore, J(6») was calculated, using th* *l*otron FAD valid l a th* angular rang« 0—Vf (I.P.Ivan«nko,1957). Tn« f l a i t* length of th« cascade should be taken into account in th« angular rang« naar
9ctff X&l'n*dd+6C' Sine« at larg« L th« «ff«ot of th« cascade f ln i t« length on FLAD 1» inconsid«rabl«, w« assum«_as a f i r s t approximation that / / ' (f», E*r / ^ ^ ^ » / ^ « t t - 2/^ 2 « ^/L. and rffCa.E&r ,2)-0 ** Z beyond thi* rang«. Bearing in mind th is circumstance and th« «xpr«ssion for th« electron PAD f(e) - oi etf>(-J-9) fef 9 (I.P.Ivanenko.et a l . ,1976) and integrating over Z. we obtain the solution in th« f ona
I t w i l l be noted that the 6o range determined by the area of the spherical layer between the sections of the sphere L by the cones with apex angles $c -ti'4^i&e./L (where the f initeness of the cascade should be included) i s snail as compared with the to ta l area cowered effect ively by the cascade. F ig . l presents the results of $(&<,) calculations« As i t was noted above, the f i n i t e length, of the cascade near$= {^±4£,was included according to (3) with LBIOO nu I t can be seen fron F ig . l that the intensity decay rapidly at Q07> 9c . The back flux i s about 7%. The narrow peak of the curve near 6c attracts attention; in th is case & &0 which, comprises 50% of photons i s 0.2 radian. Table 5 presents the results of calculations of the integral<
Table 5
A M 0 - 0 1 0.31 0.61 0.64 0.67 0.7 0.72 0.74 0.77 ,7/9^6.70-2 8.82-2 261-1 3.28-1 4.41-1 1,21+0 1.91+0 1.10+0 4.17-1
09 0.81 0.91 1.11 1.31 1.51 1.81 2.21 2.61 2.91 ^ , )2 ,71-1 1.35-1 557-2 3.11-2 2.01-2 1.27-2 8.76-3 7.17-3 6.59-3

257
The width of the region of APO where the radiation in-
teaaity exoeede or equals the intensity in the depreaeion, ia
1.1 radiane. The dimenalona and volume of the region where the
CR intensity la the deteotor, Zdti «0.3 » i» above the deteo-
tion threahold which ia aaauned to be 100 photona, are presen
ted in Table 6.
B0(«T) 10 1* 10 1 2 1 0 x o
L^^CM) 110 50 13
V__,(M3) 121 55 1*
Table 6
The value Lmm^ is also of laportanoe to the analysis of
the experimental data for the directions corresponding to the
depression and peak alnce the cascade may develop in auch sone
near the detecting equipment that the deteotor most distant
from the shower and corresponding to the PULD peak will pro
duce a pulse« whereas the closest deteotor will not produce a
pulse as it corresponds to the £LåD depresalon. Table 7 pre
sents the relevant da+j*
Tattle 7
B0(eVO 1 0 1 2 1 0 1 4 1 0 1 0
L ^ , peak 140 70 20
1 ^ , depr. 110 50 13
The high value of the water refraotion index results in
the faot that the electron-generated photons in the Initial
stage of shower development is delayed relative to the photons
generated later. The time divergence of the photons is deter
mined by the formula &T s^-zpCn-D/C. Vor Z<-Z~ 5 n we
get AT rr 6 10" 9 sec.
4. Conclusions. (1) The most significant dependence of
PLiD on L is determined by light absorption In water.
(2) The photon back flux ia smaller than 7%. (3) The 0c. direction la strongly pronounoedi 50% of the
cascade-generated photons fly within the cone determined by the
angles 0 C -»0.1 and Ä -0.1.

1. Prooaadiag» of tha DUMAHD Matting, Bo tavtm, USA.Vflfy, 2. J.H.Habbal. Photon Groaa Saotlon fro« 10 la? to 100 0*T
HSR D6-HBS, Waaalngton, 1969. 3 . A.A.BalyaaY, Y.Y.QuBharin, I.P.InuMoko. Preprint FIAI,
Bo.3*. 1975. 4 . I.P.Irananko. ZhBTP, 22, 1, 1957. 5. I.P.ITUMDJCO, T.T.MucaroT, L.A. Ha In. Preprint TCA1, Ho. 188,
Part 2 , 1976.

259
Cerenkov Radiation fro« a Showar Developed ln the Deep water
Jun Nlahlmura
Institute of Space and Aeronautical Science, University of Tokyo, Komaba, Tokyo, Japan
Analytical results on the lateral distribution of Cerenkov Radiation from an electron shower developing In the water is derived on the basis of three dimensional cascade theory. The results are discussed in relation to the DUMAND project.
1. Introduction Recent development of technology in the Oceanography has openned the
wide possibilities to observe the cosmic ray phenomena occuring in the deep sea water. Thus the "DUMAND" project is proposed to observe interactions M mesons and neutrino in the deep sea water to see the features of those particles at extremely high energy region In this respect, it is 2'proposed to observe the Cerenkov Radiation emitted from an electron shower produced by these p mesons or neutrinos in deep water.
The Cerenkov Radiation from an electron shower developing in the water has a different feature from that observed in the Extensive Air Shower. Thus It is necessary to have the accurate knowledge of lateral distribution of Cerenkov photons from the shower in the water to see the feasibility of such an experiment.
In this paper, first, the characteristics of the Cerenkov Radiation from an electron shower developing in the water are discussed. Next, the analytical solution of the lateral distribution of these Cerenkov photons are derived on the basis of the three dimensional cascade theory in App.B.3-, and the solution is derived without using other approximations.
The numerical evaluations of the analytical solution are made, and the results are shown at different incident energies as well as at different depths from the starting point of the electron shower. The results are compared to those given by Soviet group. • '
2. Characteristics of the lateral distribution of' the water Cerenkov Radiation from an electron shower
The characteristics of the Cerenkov Radiation form the shower developing in the water have widely been studied by Soviet group. Quoting to their works, some basic quantities related to the water Cerenkov Radiation are shown in Table 1.
As seen in the Table 1, the water Cerenkov Radiation from a shower is characterized by high refractive index n and thus by the large Cerenkov cone angle 9o. Thus the lateral distribution of the Cerenkov Radiation from an electron shower can be determined by this large Cerenkov angle and the

260
Tablå 1. taste Quantltlea for Cerankov Radlatloo
ii **k ©. photons / cascade unit
water 1.33 .778NeV 41*1»' 6.13110' ( 3500-5000 A)
air( lata.) 1.00027 22.8 H«V 1*20' 1.27X10* ( 3500 - 6'JOO A)
angular distributions of the showar electrons st aach depth as ahown In Plg.l. The degree of contribution of each quantities to the lateral sprsad can ba evaluated by coeperlng the Cernekov cone angle and the angular apraad of shower electrons.
The angular spread of ahower electrona la calculated by using the angular distribution given in the three dlaenalonal cascade theory In App.B.3).
The numerical reeults are shown In Table 2, together with those given by other authors.
Table 2. Average Scattered Angle of Shower Electron
E <e> <e*>v* <e*>% 2- 0 23*45' 00 00
>. 1 MeV 14°32' 34*30' 60*37'
>. 2 MeV 13*14' 26*54' 47*07'
>. 5 MeV 11°04' 18*05' 33*08»
App. A 4°42' 6*36' 10*01'
Ivanenko 36*40'
FIGJ CERENKOV CONE AND SCATTERED ELECTRON
The results show that the average deviation angle of ahowar electron la coaparable to the Cerenkov cone angle. Since average anglea for electrona emitting photons are aa large aa 40*, lateral apread of the photons at observation place becoaea coaparable to the distance from origin of the electron showers. Thia la quite a different feature ae compared to the caae of Extensive Air Shower In which the lateral distribution of Cerenkov photons are essentially detemlned by the angular apread of ahowar electron«.
3. Derivation of the lateral distribution of water Cerenkov Radiation The lateral distribution of the Cerenkov photons at the depth T «Bitted
by a electron at th« height of t and t + dt fro« the obaervation point T la flveu by,
a*f(r9Keir'«*-«'(*w-'i-)*¥'»lt , <i>
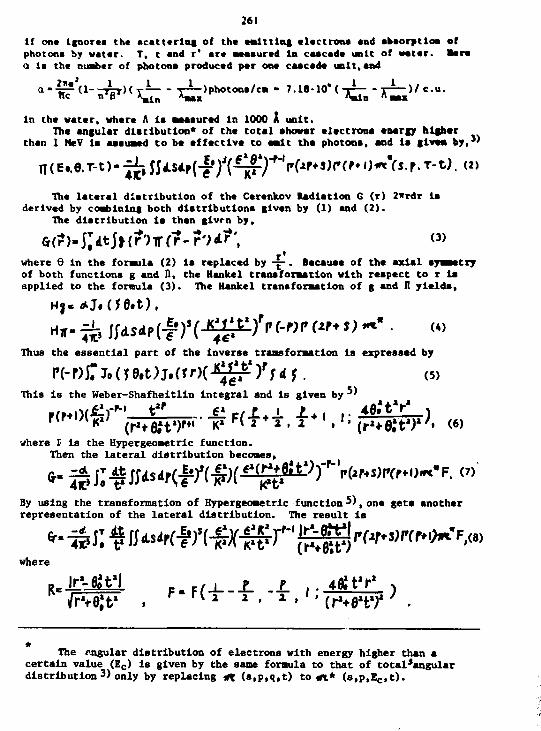
261 if on« ignores the scattering of tha emitting electrons and abeorptloa of photons by water. T, t and r' are measured In caacada unit of water, lere a Is the nuaber of photons produced per one cascade unit,and
2]ie Wc • < 1 - - T W H V * T -)ph<»t«>«>»/cBi - 7.1>-10*(TT T-i-)/c.u.
n e *mln *•*» Atia Amex In the water, where A la measured In 1000 I unit.
The angular dlatlbutlon* of the total showar electrons energy higher than 1 HeV la assumed to be affective to emit tha photons, and la give« by,3'
TT(E..0.T-t>- - ^ JJ^s^ J?^(l^^pf^sirff• 0 « V r- T-t). (2> The lateral distribution of tha Cerenkov Radiation G (r) 2*rdr la
derived by coablnlng both distributions given by (1) and (2). The distribution la then glvrn by,
Gtf>-EitJ» (ft ftf-?')*?', <» where 6 in the formula (2) ia replaced by — . Because of the axial ayaatetry of both functions g and II, the Hanke 1 transformation with respect to r la applied to the formula (3). The Hanke 1 transformation of g and II yielda,
Thus the essential part of the Inverse transformation Is expressed by
r(-r;j:ja(5e.t;j.frr)C-«^)rMj. ( 5 )
This is the Weber-Shafheitlin integral and is given by 5'
where I- is the Hypergeometric function. Then the lateral distribution becomes.
By using the transformation of Hypergeometric function 5), one geta another representation of the lateral distribution. The result Is
*"4lF J: f a****&(•$(•$&" {£f$ rwo&F,™ where
The angular distribution of electrons with energy higher than a certain value (Ec) is given by the same formula to that of total'angular distribution 3 ) only by replacing «t (s,p,q,t) to a\* (s,p,Ec,t).

262 The physical meaning of the expression (8) Is better understood than
that of (7), simce I Is a certain average value of the distance fros the observation point to the annual ring determined by the Cereakov cone. In fact the formula (8) Is aore appropriate for the numerical evaluation than the expression of (7).
To see c e consistency of this solution, the total flux of the Creaeakov photon Is calculated by putting T -» and integrating over the area, JTWrdr, which being proved to be coincide with aZ*, where Z* Is the track length of the shower.
The formula (8) can be reduced to !>• a simple form at the limiting cases r » 0 and r-«.
At the point of shower axis, we have
*-e.t , fcgff-» — F<±-4. - •£- . ' • • •>-• . and the formula (8) becomes
This is Just the superposition of the Cerenkov Radiation from the shower electron having deviation angle of Go, as is simply expected by the physical reason.
Far from Che shower axis, we have
" • r • - " r ^ P 1 • ' - ' < + - * • . - * - . " • > - ' • Then we have again a simple expression of the formula (8), representing also the superposition of Cerenkov Radiation from the electron with deviation angle of -jj-,
4. Numerical results The Hyper Geometric Function F in Che formula (8) is slowly varying
function of p except at very near the place of r-9»C*. Using this feature of F, the evaluation of the Integrals with respect to p In the formula (8) is first performed. In the place of integral of p, we have an angular distribution such as £/>
(w where p" is determined by the saddle point method, namely
Then Integration with respect to s is performed by Che saddle point method, and finally the Integral of c is performed by numerical way.
r (-f+P) Acr-e,e, F(-§---i-—§- i ; i ) - - ~ _ 2 2 • 2 » r<-§-+-|->r<i+-e-)
and has a pole ac p » — 5 " .

26J
Th* result« for the lnclden. energy of 10"eV, 10"*V. 10"*V and 10*'«V at a different depth la ehown ln Fig*.2 aud J, where attenuation aeaa f ra« path ln the aea water la aaauaed to be 20 • * ) , end A between JJ00 A and 5000JL Starting froa the ahovar axle, the photon denalty Increaaea up to the diatane* corresponding to the Carenkov cone, and dacreaaea rather rapidly with Increasing the dlatance. The photon denalty change« alaoat is proportion to the depth T. However thla proportion la alightly dependant on T becauae Cerenkov Radiation cornea on average at a place near the ahower aaxlaua, hence the lateral diaplaceaent of the hump la proportional to T-T«»,.
3. Dlacuaalona Shape of the lateral dlatrlbutlon calculated by Soviet group la
compared to ours given In Flga. 2 and 3. Both reaulta agree well with each other la aplte of the different approximation« uaed by each auchore. However, alight dlfferencea are aeen between both reaulta. Aa an example the ratio of the photon denalty at the hump to thet at ahower axla 1« about 7 In our caae, while their result glvea a value of about S.
Aa to the detection of theae Cerenkov Radiation, the lower limit for the detection Is tentatively assumed to be 100 photon«/• at the shower axla. The maximum depth from the «tartlug point for the detection is thus obtained using the calculated results for different incident energies. The depth increases with increasing the shower energies, and the results are shown in Table 3.
Table 3. Depth for 100 photons/«2 at a given energy
E 10 1 0eV 10 MeV 10 l 2eV 10 l 3eV 10l"eV T 15 m 30 a SO m 80 m 110 a
W-IIT3 1.1•10"ton 8.5-10"ton 3.9-105ton 1.6-10s ton 4.2-10*ton B i b i v i 2-10*ton 8«10"ton 3-105ton 8-10ston H.A.S. 5000 ton
W : Effective Weight of Producing Material E.C.C. : Corresponding Amount of Pb for Bremsstrahlung H.A.S. : Detection Area 1000 a 2. Effective Thickness 500 gr/cm2
These Cerenkov Radiations spread within a circle of radius of about T, and the effective amount of water for producing the interactions by p - mesons sad neutrinos are estimated as about irr'. The amount is some order of 10 6
tons for the shower of energy beyond 10 l seV. If this is compared to the case of B.C., the amount corresponds to the order of 10 5 tons of Pb for the case of U meson bremsstrahlung. H.A.S. is also considered to be quite efficient to detect the high energy p meson bresasstrahlung. The effective amount of material for producing bremsstrahlung In this case is estimated .to be 5>10* tons by assuming.
Detection Area : 10 m, Effective Depth : 500 gr/cm2
One« the lateral distribution of the Cerenkov Radiation is observed in the water, position of the humps gives us the information of the depth from where the shower is Initiated. The total photon flux is estimated by

16*
k**M«å »»»»111*» t
i * » (.» t« »
results of ref.3
L
w'
••. m -
/V^A-
ours results of ref.4
• c.«.iM«a
i • /1
Integrating the lateral distribution of the observed photons, as usually adopted in the analysis of E.A.S.. From the total photon flux, the incident energy of shower is estimated, and thus referring to the information of the starting depth, the probability of the occurence of such an event Is estimated.
These features as described above are useful to explore the flux as well as interactions of U mesons and neutrinos at extremely high energy.
References
1) Deep Underwater p - meson and Neutrino Detection 2) Proceedings of Work shop; DUMAND, Hawaii, 1976 3) J. Nishimura ; Hand bd.Physik. 46/2, Springer Verlag. 1967 4) I. P. Ivanenko, V. V. Makarov and I. A. Hein J Preprin 98, P. N.
Levedev Physical Institute, 1976 5) Hand b. Math Functions ed. M. Abramowitz and I. A. Segun, Dover Pub.
G.N.Watson ; A Treatise on the Theory of Bessel Function, Cambridge University Press, 1966

165 9 Detection of Very High Energy Neutrinos
T. K. Calaeer Bartol Research Foundation of The Franklin Institute
University of Delaware Newark. Delaware 19711
A. Balprln Department of Physics, University of Deli
Newark. Delaware 19711 Abatract. We review the kinematic« of Interaction» of neutrinos at E > 10 TeV. We discuss implications for detecting and measuring such Interactions with the deep underwater muon and neutrino detector (DUMAKD).
I. Introduction. The general features of neutrino interactions *t center of mass energies much greater than the mass of the weak Intermediate boson, W, have been known for a long time. Bjorken and Paschos (1970) discussed charged current interactlona of the type (see Fig. 1-a)
V + H •*• I
within the general framework of (see Fig. 1-b)
+ hadrons a par ton model. The process
V + A + Ä + W + A '
(1)
(2> has been discussed oy many authors. [Here we use the results of von Gehlen, 1963.] In particular, Cllne, Mann and Rubbia (1970) have emphasized the importance of the fact that the produced W carries olf virtually all the energy of the Incident neutrino as a signature for W-productlon.
V
W
01 b)
Fig. I Inelastic neutrino interactions Since these
early calculations, experimental lower bounds on the mass of the V hava steadily increased. Unified theories of weak and electromagnetic interactions [Weinberg, 1967; and Salaa, 1968] now lead us to fxpect M w ^ 70 GeV iBjorken, 1977]. This corresponds to a threshold energy (In the 1*^) of E v a MW/2M_ * 2.6 TeV, which is much too large for production of W'e to be observed at present accelera-Coric
The suggestion has recently been made fBowen, 1976;
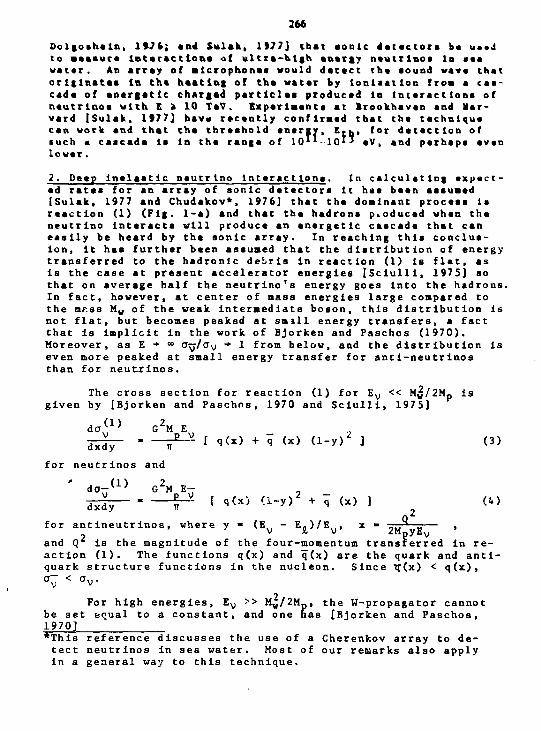
266 Dolgosheln, 1*74; an« Sulak, 1177.} that ionic detectors b« u»»J to ••asur* interaction« of ultra-high anaTgy niutilnoi In ••• water. An array of alcrophon«« would detect the aound wav« that originates In tha hasting of tha water by lonliatlor. from a caa-cade of energetic charged particles produced In lnteracttona of neutrinos with E a 10 TeV. Exparlaenti at lrookhaven and Harvard (Sulak, 1977] have recently confirmed that the technique can work and that tha threshold energy, Egh, for detection of such • cascade Is In the range of 10*1-10" eV, and perhaps even lower.
2. Deep lnelaatlc neutrino Interact lona. In calculating expected rates for an array of sonic detectors it haa been aaauaed [Sulak, 1977 and Chudakov*. 1976) that tha doalnant process is reaction (1) (Fig. 1-a) and that tha hadrons produced when the neutrino interacta will produce an energetic caacade that can easily be heard by the sonic array. In reaching this conclusion, it has further been asauaed that the diatribution of energy transferred to the hadronic debris in reaction (1) is flat, as is the case at present accelerator energies ISciulli, 1975] so that on average half the neutrino's energy goes into the hadrons. In fact, however, at center of lass energies large compared to the mr.ss M w of the weak intermediate boson, this distribution is not flat, but becomes peaked at small energy transfers, a fact that is Implicit in the work of Bjorken and Paschos (1970). Moreover, as E •+ °° Oy/0\) •* 1 from below, and the distribution is even more peaked at small energy transfer for anti-neutrinos than for neutrinos.
The cross section for reaction (1) for E v << M w/2M p is given by [Bjorken and Paschos, 1970 and Sciulli, 1975]
do* 1* G 2M E„ _ ,, j ^ - - - ^ - V - I q(x) + q (x) (1-y) 2 ] (3)
for neutrinos and ' d a - ( 1 ) G 2M E-
J& ^ [ <.<*> (i-y) 2 + q <*> ] (4) for antineutr inos, where y « (E,, - E„)/E ,, x - n^f-s'-
v x, v ^MpyEy and Q is the magnitude of the four-momentum transferred in reaction (1). The functions q(x) and q~(x) are the quark and anti-quark structure functions in the nucleon. Since Tj(x) < q(x),
For high energies, E v >> M„/2M_, the W-propagator cannot be set equal to a constant, and one has [Bjorken and Paschos, 1970] *Thisreference discusses the use of a Cherenkov array to detect neutrinos in sea water. Most of our remarks also apply in a general way to this technique.

do ( 1 ) 2 4 C K w
dxdv
q(x) • q(x)O-y)'
o> (yx • n;/2M pE v>-4*N E
P ^ with an iiiilo|oui expression for V. Since y, x < l. equation (5) reducei to (3) for E v << M w / 2 M p . The peaking at «aall y for E v >> M w / 2 M p la explicitly displayed ln Eq. (5) and «hovn l :> H_. 2. The «olid line« ln Fig. 3 show neutrino and antlneutrino cross sections per nucleon. Here we use M - 70 CeV.
Fig 2
1 l i f t
I d 3 4 cr{[)
^ ~ ~ ~ ~ ^ --—V ^ sf
C O
E <-> „-35
— 10 / s ( y c / (1) [ /
leo
o 2 I O " 3 6
\ b
i o 3 7 _ \ _ , r coherent
• • i l
10" 10° 10° 10'
E v(GeV)
10°
F i g .
For these calculations we have taken
ind
q(x) = ^1.79(l-x) (1+2.3x) + 1.107 (1-x)
q(x) = 0.3 (1-x) 7
3.1 Æ X + q (6)
(7)
Eq. (6) is due to McElhaney and Tuan (1974) and Eq. (7) is a modification of the sea quark distribution [i .'., . W3ng 19773. These quark structure functions are determined by deep
inelastic electron and muon scattering.
3. Production jf W-bosons. The dominant source of W-boson production at ultra-high energies is coherent vroduction in the Coulomb field of the target nucleus. The condition for coherent
production is <min
M w / 2 E v < i • (8)
here Q m i n is the minimum momentum transfer accessible at E v , nd R is the nuclear radius. For 0 1 6 Eq. ( 8) leads to the
wh a condition > 50 TeV for M„ = 70 GeV.
Von Gehlen (1963) has given an explicit approximate

:6g
expression for coherent produclSon of the W ln th« Coulomb field R M 5 16
of the nucleus, valid when E >* . For 0 and M -70 CeV, v (Za)2G, 4 r2 n
( 136 + ^ ) in(e) - 264 + ^ (9) v c J >" )
where c 5 2EV/RM^. The dashed line In KIRN 3 shows the cross section per nucleon for coherent W-product Ion on oxygen, le. a v(2)/16.
A significant kinematlcal feature of reaction (2) is that the produced W carries off virtually all the energy of the incident neutrino. The importance of this fact as a signature of W-production was emphasized by Cline, Mann and Rubbia (1970): when the W decays hadronically it leads to a spike at y«l in Fig. 2. The W is expected to decay in one of the modes
W + y Vj, , W - » e v , or W -*• hadrons. Since I\, , , + r„ __ > r„ ^ , [Palmer, et al.,
W -* hadrons W •* ev W •* u vu
1976],reaction (2) should be easily audible in DUMAND if there are sufficient neutrinos with E v ä 100 TeV.
It is also worth asking whether production of other possible new, massive particles.might show up in DUMAND. As an illustration, we compare in Fig. 3 (dotted line) the cross section for production of a heavy lepton ( 2 GeV) and a Higgs boson ( 4 GeV) in a process that violates conservation of muon number [Gaisser and Halprin, 1977] w
4. Discussion and Conclusion. The effect of the increasing elasticity at the lepton vertex in reaction (1) has different consequences for sonic detection of v e and of Vy. For v e, i • e in Fig. 1-a, and for E v >> M^/2Mp a large electromagnetic cascade will be produced by the fast electron. This will produce a signal that can readily be detected when E v >> E th. On the other hand, for incident Vy the outgoing lepton, Ü, in Fig. 1-a is a muon, which radiites in relatively low energy bursts (characteristic length between bursts ^ 100 m in water). The muons energy musi: be estimated from its observed dE/dx [Chudakov, 1976]. It is thus more difficult to observe an energetic muon than an electron or hadron(s) of the same total energy, for which all the energy is dumped into a single cascade. Since for Ey>>2.6 TeV most of the energy is retained by the muon when a Vy interacts, it will be more difficult to detect and measure interactions of Vy than of v e. Because Vy constitute t ,e bulk of high energy atmospheric neutrinos, this is ai: important consideration for experiments designed to study properties of > 10 TeV interactions of neutrinos produced by cosmic rays in the atmosphere. As an example, if in practice the threshold for detection of a burst by the sonic detector turns out to be 10^5 ey (rather
! it .j n 1 0 iV or less) then t kc rauon produced b v a . In rrac ( U n (1) c .in not be «I e tee ted. In this case, because of the »harp leaking neat \- 0 for reaction (1 ) , a large fraction of type (1 ) : n I e r ac t i on s will no t be seen and the rate of detection of r n i -tion (.' ) will be comparable to or greater than reaction ( 1 ) .
The difference in appearance between Intel . c t i o n s of v r
.ind of \> will also be an important consideration for high energv neutrino astronomy. If the electromagnetic cascade from the energetic electron in v e + N * e -t- X can be distinguished I rum the hadronic cascade in reaction v u -t- N • u + h a d r •> n s , then .',. will be distinguishable from Vy. Since virtually all high energv electron neutrinos must be of astrophysica1 (rather than atmospheric origin) this could be a useful tool for detecting neutrinos of astrophysical origin [Berezinsky, 1976 and Berezinsky and Zatsepin, 1976).
Explicit calculation shows that production of a Higgs boson in a process which violates rauon conservation is unlikely to represent a significant fraction of the events in a DUMAND exper iment.
References Uerezinsky, V.S., 1976, Proc. DUMAND Summer Study (ed. A.
Roberts) p. 229. Bereninsky, V.S. and G.T. Zatsepin, 1976, Proc. DUMAND Summer
Study (ed. A. Roberts) p. 215. Bjorken, J.D., 1977, SLAC - Pub-1841. Bjorken, J.D. and E.A. Paschos, 1970, Phys. Rev. D_l, 3151. Bowen, T., 1976, Proc. 1976 DUMAND Summer Workshop (ed. A.
Roberts) p. 523. Chudakov, A.E., et al., 1976, Proc. DUMAND Summer Workshop (ed.
A. Roberts ) p. 297. Cllne, D., A.K. Mann and C. Rubbla, 1970, Phys. Rev. Letters
2^, 1309. Dolgoshein, B.A., 1976, Proc. DUMAND Summer Workshop (ed. A.
Roberts) p. 553. Galsser, T.K. and A. Halprln, 1977, Bartol-University of
Delaware preprint. McElhaney, R. and S.F. Tuan, 1974, Nuclear Physics B72, 487. Salam, A., 1968, in Elementary Particle Theory, ed. by N.
Svajtholm (Almquist and Forlag, Stockholm) p. 367. Sciulli, F.J., 1975, Proc. of Meeting of Division of Particles
and Fields (Seattle) Sulak, L., 1977, Proc. XII Rencontre de Moriond (to be published) von Gehlen, G., 1963, Nuovo Cimento 3£> 8 5 9 -Wang, L.L., 1977, (private communication). Weinberg, S., 1967, Phys. Rev. Letters 1J), 1264. Palmer, R.B., et al., 1976, Phys. Rev. D14, 118

270
ACOUSTIC DETECTION OF PARTICLE SHOWERS AT BROOKHAVEM
T. Boven1, H. Qradnor2, W. V. JonaS? J. 0. Learned'*, I. Linacott?
A. Parvulescu6, ß. Pifer7, L. Sulak8
1 7 2 4 Universities of - 'Arizona, California, Sao Diego, California,Irvine,
R 6 3 5 4 Harvard, Hawaii, Louisiana, Syracuse, and Wisconsin
Theoretical £ ] Experiment«! 0 B o , h Q
Acoustic pulses due to the passage of charged particles through water have been observed at Brookhaven National Laboratory The signal magnitude is determined to be 10 to 100 times naive predictions.* Tho pulse amplitude is proportional to energy over the range 1 0 1 9 - 1 0 2 1 eV of energy deposition. The Fourier transform is proportional to 1 up to the frequency corresponding to the dimensions of the particle bunch. The initial pulse looks like one cycle of a sinusoid. Further measurements are in progress (1/77).
* 1976 DUMAND Summer Workshop, A. Roberts, ed.. Office of Publications, Fermi National Accelerator Laboratory, Batavia, Illinois, USA
Ccjrdinates: T 7 3 (calorimeters)
but also could be T 7.4 (trajectory Location, Detectors) or DUMAND Symposium
Mailing address: D r J o h n G L e a r n e d Telephone W 714-833-7036 Department of Physics University of California, Irvine •Irvine, CA 92717 USA

271 « /
npwmTT.TCT or ACOUSTIC DBBCTKM or KKX (£ IOU«V) NHTRDOS IN I M S SUT
W. V. Dapartje>nt of Physic« and Astronomy
Louisiana State university Baton Rouge, Louisiana 70*03
Abstract It has been suggested that acoustic emissions say be associated
. with the rapid thermal expansion of natter absorbing the dense core ~; of particles in high energy cascades. The Acoustic Subgroup of Pro-/ ject DUMAND has observed acoustic emissions from a oollimated bean r of protons at Brookhaven and the Harvard Cyclotron. Further tests
i) at Fermilab will attempt to detect single cancaflas down to energies ft) of 100 GeV. Plans are underway for using Bevalac beams to check the '•'$ possibility of resolving heavy ions via ultrasonic signals. Nt are ;<J also studying the feasibility of detecting high energy neutrinos via ^ * acoustic emissions in a large salt dome.
I.v Introduction Two independent calculations presented at the Deep Underseas Muon and
Neutrino Detection (DCMAND) 1976 Summer Workshop (university of Hawaii, Honolulu, 6-19 September, 1976) indicated that the heat deposited by electromagnetic and hadrcnic cascades with energies above % lO^eV might produce detectable acoustic pulses in water. 1' 2 Both calculations assumed that the cascade approximates an acoustical antenna. Following these suggestions, the Acoustic Subgroup of Project DUHAND conducted same test experiments at the Brookhaven National Accelerator Laboratory (BNL).3 These experiments yielded unamplifled audible pulses from total beam energy depositions equivalent to ^ 10 1 9eV. Subsequent tests4 at the Harvard Cyclotron have been successful in detecting acoustic signals from total energy depositions in water of 3 x 10 1* eV. At this energy the signal was about equal to the background noise of 2 x 10⁻² dynes/cm? (the human ear is sensitive to <x< 2 x 10⁻⁴ dynes/cm2).
The tests at BNL and the Harvard Cyclotron indicate that the period of the sound wave emitted by the particle beams is directly proportional to the beam diameter. The amplitude of the pressure wave in water varies linearly with the total energy deposition. Based upon the acoustic intensities which have been observed it «eons that improved experimental techniques (noise shielding and multiple hydrophones) may allow detection of single cascades in water down to much lower energies, perhaps as low as *v lO^eV. A proposal has been submitted to the Fermi National Accelerator Laboratory (Fermi lab) to tast this possibility.5 If this experiment is successful In detecting single 100 GeV cascades, the acoustic technique may have an important application in the design of large "next generation" neutrino experiments at high energy •ton as «ell A S in coimia rays.
272
It ahould alao be noted that the aoouatlc defctinn tanhnlqne aay nave application In other areas of high energy phyaloa and ooaaic ray reaearah. Extrapolations of our prevlcue reeulta iaply that it aay be pnaaihla to Idasr tify heavy lone even over relatively ehort path lengths. A 2 CMT/aeol iroa nucleus M e a total energy content of 2 x M - 112 OeV. therefore, if the praeeure amplitude corresponding to a 100 OeV oaaoaoa can be detaotert la «eter, a 2 GeV/hucl iron nucleue amy alao be detectable, the frequency of the eignal generated by an Iron nucleus ahould be in Ota upper ultraaonlo region, eince the core of an iron track ia several adcrona In width and the delta ray halo extends out aeveral tana of adcrona froa the track. For cea-pariaon, the eignal from a 100 OeV ceacade ahould be around 10* B* «1th higher frequency components fro» local particle bunching in the ceacade. By judi-cloualy selecting aateriale which have greater reeponaa than water to rapid tharaal excitation, one ahould be able to resolve lone having chargaa considerably leaa than iron. The DU4MO Jtoouatlc Subgroup ia planning to check this possibility using Bavalac beans.6 The feaaibility of resolving individual heavy iona via ultrasonic signals would have laportant practical application in the design of large detectora required to ocapanaate for low fluxee In coanic rays. Large area exparimtmta to detect low energy euperheavy nuclei (Z>30), aa well aa large voluae experiments to detect highly energetic nuclei of analler chargee, could be exposed with the Space Shuttle. Note that an iaotropically sensitive acoustic calorlmater would have about tan tinan the geometry factor of abaorbar-scintillator "sandwich" calorlaartere having the same weight.
It ia not the intent of this paper to dwell on the aeveral new experimental ideas which have been spawned by the DUMMD Interest in acoustic detection of high energy particles. Instead, we want to focus on sone original DUØND objectives i.e., (1) detection of high energy coanic ray neutrinos formed outside the earth's atmosphere (coamploglcal investigations) and (2) study of interactions of high energy neutrinos generated by coaadc ray interactions in the earth's atmosphere.
II. DUMRND Scale Experiment in a Salt Dane
7 S Theoretical arguments ' indicate that there may be a substantial flux
of high energy (> lOlGeV) neutrinos produced during galaxy formation. Detection of this extragalactic flux would imply unique observation of the epoch when galaxies were being formed. It ia speculated that above *v lO^eV the cone-logical flux may exceed the neutrino flux resulting from the Interactions of high energy cosmic rays in the earJi's atmosphere. Direct extrapolation of the linear energy dependence of the neutrino cross section observed at accelerators up to much higher energies leads one to suspect that the earth may become opaque to neutrinos at energies above t 10 1 5eV. If this were indeed the case, an isotropic flux incident on the earth would result in an anisotropic distribution of arrival directions on a large detector placed just below the earth's surface.8 Measurement of the anisotzopy In the neutrino flux incident from the upper and lower*' hemispbora could be transformed into direction information on the neutrino interaction cross section at ultrahigh energies.
Observation of high energy neutrinos of atnoecberic or extraterrestrial origin requires a detector with very large mass. Project DtMAND has been primarily concerned with a large (M. km 3) detector array in the, deep ocean. Both acoustic and Oerenkov techniques would be employed. It should be clear that acoustic detection requires a homogeneous medium so that acoustic waves ars not strongly attenuated by scattering at discontinuitia». Since liquids propagate only ooapressional waves, use of the ocean aay almplify the inter-

273 pretaticn of data, The amin disadvantage in utilising tha deep ooaan is tha costly deep aaa engineering which would ba involvad.
Tha author has suggested that perhaps a viable alternativa ia to oak» uaa of large salt dome.2.10 salt doaas eidat over large regiona along the liulf of Naxlco and in sevaral other parts of the world. A typical doae extends fro» near tha surface to depths of t 10 km and la several kilcaatera in disaster. The purity of various donas range from 97% to 99% pure Ned. At depths below *x. 1 km high pressures causa the rock salt to undergo extensive plastic flow, which essentially fills all voids. A comparison of tha relevant parameters for aaa water and rock salt shows that tha relative pressure amplitude (which would be observed for tha sane total cascade energy at tha ease distance pwrpwnrtinilar to the cascade axis) is between 20 and 200 ti—a larger in rock salt than in water.' The different nuntiar« stam fron differences in the »odels used for calculating the expected signal. the larger algnal in salt implies a correspondingly lower energy threshold for <totection of cascades. This could be critical for a successful high energy neutrino astrophysics experiment. However, the loss of the supporting Oerenkov technique, which is available in the ooaan, would probably preclude detailed studies of neutrino interactions in salt denes.
A sufficient number of transducers appropriately spaced around a large volume of natter would be sensitive to acoustic emissions from anywhere inside the volume. Either a salt dome or the ocean would offer a geologically homogeneous medium of sufficient size to contain the experiment. Although the ocean offers some advantages, the experiment would be more economical If carried out in a salt dome. Acoustic detectors could be placed in a few; meters apart in the vertical direction In the lower half of deep (* 2 km) boreholes filled with fluid having density near that of salt. III. Acoustic Signals
S Function Ho« Rod +NMdlM
/(Ccncado Cor»)
Cylindrical Acou»«c
Figure 1 illustrates acoustic emission from a dense cascade coca, which approximates a cylindrical antenna. For a neutrino of energy £ 10l5eV the effective antenna would have a length L of <v> 10 m, and a diameter of d of about 10 cm. One might naively expect that the wavelength X of the emitted wave would be approximately
X J: 2d. This simplified picture approximates the observed results from the BNL tests in water. Since the speed C of the sound in salt is about 4500 m/sec the corresponding frequency f would be
d — Naar PMd Oiotonot A
-V * . s 4500 m/sec £ 2 l — " 0.1m 45 kHz.
The extent of the near field A, distance «a BT», ia given by
when ths pressure pulse with radial
t2 go mr 0.1 »
lkm.

274
For radial distances larger than A, i.e., the far field, ths tute teer—— as r*.
The sonic signatur«, of a high energy nsutrino event is illustrated in racts in Fig. 2. If a 20 TsV nsutrino interacts in ths voluee occunisd by ths >
a large cascade of particles will emanate murmm IMTEIMCTION mmtøtnm fras the point of ths interaction. In sost •wants the cascade will hava a total energy of * 10 TeV, while ths «seining 10 TeV of energy will be carried away from ths interaction by a "leading" auon. Alsost all of the cascade will be absorbed within e distance of 5-10 a, although a snail number of suons from pion decays will create a tail out to distances of about 50 m.
A relatively large acoustic signal should progagata almost perpendicuarly outward from the cascade. Oils disk-shaped signal should be observable out to distances of several hundred meters. Detection of this sound disk by transducers surrounding the volume containing the interaction would per-mit determination of the line-of-f light of HUON the incident neutrino. The direction of the neutrino would be specified by also detecting the weaker sound signals generated along the path of the leading nuon. Typically a 10 TeV nuon would deposit about 6 TeV of its energy within a distance of 1 km. This energy deposit occurs via several discrete bursts, each a casoafle with energy £ 50 GeV. The frequency of acoustic amission from these bursts should be in the region of several hundred Hertz. Even if these lower energy cascades produce signals at, or below, the noise level of the dame, it should be possible to resolve them by triggering on the main cascade and scanning the transducers covering a narrow cone from the vertex of the initial neutrino interaction, i.e., by employing phased array astronomy techniques.
IV. Proposed Experiment Configuration
A detector array which might suffice for carrying out this experiment would require perhaps 1000 transducers spaced v i m apart in the vertical direction in the lower half of at least four deep ( 2 km) boreholes. The dome must be large enough that the boreholes would cover an area of *> 1 km. The boreholes could be filled with a high density fluid, which has acoustic im-pedence near that of salt. Perhaps even brine would suffice. At large depths one might take advantage of the plastic flow of salt to achieve direct bonding between a transducer and the dome. A schematic diagram of the proposed configuration using four boreholdes, 1 km apart, is shown in Fig. 3. The active volume of the detector would be 1 kn3, which is 2 x 10 9 metric tons of rock salt. The earth around the sensitive volume would provide a shield from the surface noises and cosmic rays. Some high energy ituons would penetrate the earth to the detector volume. In fact, the same detector array could be used to study those high energy rauons.
V. Planned Feasibility Studies
Some preliminary tests are needed to determine the feasibility and/or practicality of a large scale neutrino experiment utilizing acouaito radiation detection in salt domes. The following experiments ars planned for achieving

275
Por radial distances larger than A, i . e . , the far field, the pressure aanii-tude decrease* as R-i. *»•—»« " ^ " r.j ? * P ? * i c • 1 « n * t u r « of * high energy neutrino event i s illustrated in Fig. 2. i f a 20 W neutrino interacts in the values occupied by the det» ris- ** ir a Æ w neutrino interacts in the voluae occupied by the a large cascade of particles will emanate NCUTMMO MTOUCTMN ewKruei fro» the point of the interaction, m noet "«»TU» wmmm events the cascade will have a total energy of % 10 TOV, while the regaining 10 TeV of energy will be carried away from the interaction by a "leading" nuon. Almost a l l of the cascade will be absorbed within a distance of 5-10 m, although a snail number of nuona from pion decays wil l create a ta i l out to distances of about 50 m.
A relativily large acoustic signal should prcgagate almost perrendicuarly outward from tne cascade. This disk-shaped signal should be observable out to distances of several hundred meters. Detection of this, sound disk by transducers surrounding the volume containing the interaction would permit determination of the linc-of-flight of mum the incident neutrino, The direction of the neutrino would bo spoolfl«! by also detecting the weaker sound signalB generated along the path of ths loading nuon. Typi.ca.lly a 10 TOV nuon would deposit about 6 TW f/f i t* mnwf/ within a distance of 1 km. Mils nnertjy deposit ocuuni via twv««l fliwsf&M bursts, each a cascade with www > r>0 CV?V. W« frwjunfit« t>T ntrtmtUi mtM* sion from thoso burnLs nhmht )JP In lln> »«JIMI nr ttr«j>>i*\ \^H*U'"S lint IM I Even if thwio ltwn: MIMI i iy <<n&wiati |.IM»1II<IO «1'jiwl« «t, m \m\nn, M** ttAw* level of the demo, i t nliouW IJH I*HMH)1U to «IUOJVÖ i i mn I// itUfjafUøJ ist the main cascade and scanning the transducers covering a riirrow cone fru« ti» vertex of the init ial neutrino interaction, i . e . , by employing phased array astronomy techniques.
IV. Proposed Experiment Configuration
A detector array which might suffice for carrying out this experiment would require perhaps 1000 transducers spaced 1 m apart in the vertical direction in the lower half of at least four deep fv. 2 km) boreholes. The dene must be large enough that the boreholes would cover an area of * 1 km. The boreholes could be filled with a high density fluid, which has acoustic iro-pedence near that of salt. Perhaps even brine would suffice. At large depths one might take advantage of the plastic flow of salt to achieve direct bonding between a transducer and the dome. A schematic diagram of the proposed configuration using four boreholdes, 1 km apart, is shown in Fig. 3. The active volume of the detector would be 1 kn£, which is 2 x 10» metric tons of rock salt. The earth around the sensitive volume would provide a shield from the surface noises and cosmic rays. Some high energy nuons would penetrate the earth to the detector volume. In fact, the same detector array could be used to study those high energy nuons.
V. Planned Feasibility Studies
Sana preliminary tests are needed to determine tho foaaJbi^ifcy and/"* practicality of a large scale neutrino experiment utilising acounlto radiation detection in salt dome. The following experiments are Planned for achieving

276 of rock aalt waa exposed during the BNL test.3 Oontrary to all expectation«, the aignala fron aalt ware observed to be smaller than the eintala fro* weber. We believe this can be explained largely by the attenuation due to lapadenoe miamtchee. The aalt cylinder waa pieced in mineral oil in a plaatic bag auapanded in the water tank containing the hydrophonea. It la elao liioaly that the ahort tiiua lag between the primary aignal and reflectix» from the cylinder boundary reaulted in oonalderabla destructive interference which oon-fuaed the measuramanta. VII. References 1. T. Bowen, in Proceedings of the 1976 DUMMP Summer Workahop (Honolulu,
6-19 September, 1976), Arthur Roberta, ed., p. 523 (Farad National Accelerator laboratory, Batavia, IL 60510).
2. B. A. Dolgoahein, in Proceeding of the 1976 D U M P Summer Workshop (Honolulu. 6-19 September, 1976), Arthur Roberta, ed., p. 553 (Fermi national Accelerator Laboratory, Batavia, IL 60510).
3% T. Bowen, H. Bradner, W. V. donee, J. Learned, I. Linacott, A. Pazvulescu, B. Pifer, P. Polakos, J. Strait, and L. R. Sulak, "Acoustic Detection of Particle Showers," (to be submitted to Nucl. Inatrum. and Methods).
4c L. R. Sulak, private communication 5. T. Bowen, B. Pifer, L. R. Sulak, V. Stenger, A. Parvuleacu, W. V. Jones,
I. A. Linscott, H. Bradner, D. Cline, J. Learned, R. Lundy, A. Roberts, L. Voyvodic, R. Walker, B. A. Dolgoshein and A. A. Petrukhin, "Proposal for a Study of Acoustic Calorimetry at Fermilab Energies," A. Roberts, spokesman, Proposal P-528, Fermi National Accelerator"Laboratory, Batavia, IL., (January 1977).
6. Letter of intent to L. Schroder from W. V. Jenes dated 8 Nay, 1977. 7. V. S. Berezinaky and A. Yu. Smirnov, Astrophys. and Space Sei. 32, 461
(1975). ~~ 8. V. S. Burezinsky and 6. T. Zatsepin, in Proceedings of the 1976 DtMMP
Sunnier Workshop (Honolulu, 6-19 September, 1976), Arthur Roberta, ad.,' p. 215 (Fermi National Accelerator Laboratory,"Batavia, IL 60510).
9. T. Bowen, in Proceedings of the 1976 DUMMP Summer Workshop (Honolulu, 6-19 SeuUaiiier, 1976) Arthur Roberta, ed., p. 531 (Fermi National Accelerator Laboratory, Batavia, IL 60510).
IP. W. V. Jones, in Proceedings of Symposium on Salt Dame Utilization and Environmental OonaiaerationB, (Louisiana State University, Baton Rouge, IA., 22-24 Notoazmber, 1976), J. Martinez, ed., p. 366,, Institute, for Envizonmantal Studias, LSU, Baton Rouge, ZA 70803.

277
SONIC PARTICLE DETECTION* Theodore Bowen
ept. of Physics, University of Arizona, Tucson, Arizona, 85721, U.S.A.
ABSTRACT Detection of the sound wave emitted by high energy particle
ascades offers promise for events in sea water or other acoustically homogeneous media. Experiments with electron beams have emonstrated that sound is produced by charged particles due to he sudden thermal expansion caused by local heating of the media ssociated with energy loss by ionization and excitation. The heory of the pressure signal to be expected is given from the iewpoint of calculating the acoustic pulsation produced by a ery small spherically symmetric region 'n which a given amount f heat energy is deposited at t=0, taking into account the ubsequent heat diffusion.
The development of less expensive particle detectors could ave an enormous impact on cosmic ray experimentation at very igh energies where large sensitive areas are needed for reason-ble event rates. Detection of the sound emitted from hadronic-lectromagnetic cascades in water or other homogeneous material ffers promise for detecting high energy neutrino interactions, > well as other types of high energy events. A quantitative leory of the acoustic signal to be expected from the passage of iarged particles must be developed. It has already been experi-jntally established that the acoustic signal originates from the lermal stress caused by the local heating due to ionization en-"gy loss by charged particles.1>2 It is also well known that le energy loss along the path of a charged particle is subject 3 large statistical.f1uctuations , with roughly one-half of the jtal loss transferring energy to 6-rays or knock-on electrons, lich in turn lose their energy in small local regions.3 In this )rk a quantitative theory is presented of the acoustic signal 'suiting from local "hot spots" caused by charged particle energy )ss. Since the particle velocities in a cascade are of the order F the speed of light, 3x10" m/s, and the speed of sound in water, jr example, is about 1.5xl0 3 m/s, the energy deposition process sn be regarded as instantaneous. Also, the ionization and excita-ion energy becomes thermalized in 10- - 1 0 " 1 1 sec, which also is istantaneous compared to the acoustic frequencies of interest, ithematically, the local hot spot is a Gaussian temperature dis-'ibution which suddenly appears at t=0 with dimensions which ight be as small as a few mc^ecular diameters or as large as the »avily ionizing portion of the range of a 6-ray (~10" 6cm in water).

278
ACOUSTIC WAVE FROM A GAUSSIAN HEAT IMPULSE The mathematical theory of thermoelasticity is well develope
and the point Instantaneous heat source problem has been discusse by Kowacki*. While wave equations can be developed for the parti cle displacements £, the particle velocity v, or the pressure change p, it is mathematically simplest to write a differential equation for the displacement potential *. The observed quantlti i, v, and p are related to 4> by
5 • -V* (1) » - |f - - ^ ( 7 0 • -V(ff) (2) P - pf|* (3)
where p is the equilibrium density of the acoustic medium. The equation for *(r,t) is
v** - £r f- r = -ee(r.t), (4) where c is the velocity of sound, 0(r,t) is the temperature chang distribution, and (3 is the volume coefficient of thermal expansio If we restrict our examination of Eq. 4 to case?, where 0(r,t) is not so large as to cause changes of state (e.g. from liquid to gas) or large density changes, then it is reasonable to assume that the functional form of 0(r,t) is not significantly altered by the generation of an acoustic wave and is given to a good approximation by the solution of the thermal diffusion equation:
D 7 > 0 . | | . y i ^ t ) ( 5 )
where D is the thermal diffusion coefficient, c p is the specific heat at constant pressure, p is the density, and W(r,t) is the external heat input. For an instantaneous Gaussian source of heat of amount E , the solution to Eq. 5 is
E r 2
e(r.t) = -fij- • - jjy e"4D(b + t) (6) V [4TrD(b + t ) ] 3 / 2
w^iere the initial size is specified by <r1>
t-n = 6°°- Note that b=C corresponds to the limit of a point source of heat. When the expression given in Eq. 6 is substituted into Eq. 4, one can look for a solution in the form:
*(r,t) = • (r.t) + J- <l>+ (r-ct) + J- *"(r+ct) (7) where *_ is a particular solution of Eq. 4 and ty~ are arbitrary functions of r ± ct which are general solutions of Eq. 4 when 0=0.

279 Nowacki has found a particular solution, • , to Eqs. 4 and
6, which is
• p(p.t)-=^p(r.t) - £ -erfc
r+2c(b+t) [40(b+t)]"2
where
and
§[c(b+t)-r] [4D(b+t)?
+ie& K c ( b + t ) + r]
erfc
erfc r-2c(b+t) [4D(b+t)]*
JA. 4nc p
2 f" .-x 2
;rfc(u)= 1 - t f e " x dx. /if Jo
(8)
(9)
(10)
The validity of Eq. 8 f ° r a Particular solution can be verified by direct substitution into Lq. 4. Nowacki derived this result starting with a point instantaneous heat source, but it is also applicable to the Gaussian instantaneous heat source. It is important to find expressions for -p+ and i/j" which satisfy boundary and initial conditions distribution.
for an initial Gaussian temperature
While the particular solution * is 5 smoothly varying function for all values of raO and t° the ty± functions must be separately determined for two cases: (J) ctsr and (II) ctsr, so that we obtain two complete solutions *i and * u which can then be examined near ct=r, which is the location of the primary outgoing acoustic wave. At ct=r we can ask whether $1 = <Mi and whether or not any derivatives are continuous. In region I (ct<r), ijjf and ij>! are completely determined by the initial conditions
*!(r,0)=0
3$, 3t Jt=0
0,
(ID
(12)
In region II (ct>r) \\>n and ljiii are constrained by the boundary conditions at r=0. If Eq. 8 is evaluated for r=0, one finds that $n does not remain finite. In order for the complete potential * to remain finite at r=0, we must require that
•p(0,t) + *j I(-ct) + *jj(ct)=0. (13)

180 Tht physical Interpretation of the Ingoing wave <v\ or *YI •ay seen puzzling, since causality demands that only an outgoing wave be observed. The particular solution •„ C q . 8) Is completely symmetric to a reversal of the direction of time, so ft contains both outgoing and Ingoing wave components; the i>~ term cancels the Ingoing components of * p. Since the Ingoing components of >n and the function of <Ji-(r+ct) have no discontinuity at r»ct, the ingoing term must have the same form In reqions I and II:
•J(r+ ct) - *jj(r+ct) (14) It is found that the same function satisfies the initial conditions in region I and the boundary conditions in region II, so there 1s no discontinuity at r*ct in * or any of its derivatives.' The solution is most simply expressed for |*. Since the pressure changes are expected to be very rapid, a n y " physical detector would respond to the pressure Impulse I(r,t) given by
I(r,t) = /* p(r,t')dt'
p at
(15c.)
(15b) The solution for I(r,t) is
E 6c 2
Kr. t ) = 4 ^ c b r [F(ct-r.O)-F(ct+r,0)+F(r,t)-F(-r,t)] , (16)
where F(x,y) is given by
F(x,y)=§ fexp^ [c(b+yH xJ (17) The radiated acoustic Eq. 16. When c(b/D)l> If we take parameters water, then (2Db)£=(<r 10 5)=0.9xl0- 8cm. which sec, respectively. Un from zero as the press to zero due to a negat immediately follows, detector response time
wave is >1, thi sui tab 1 2>/3)l = corres fortuna ure amp ive pre Such a were i
e r f c x * 2c(b+t) [4D(b+t)] 2
contained in the F(ct-r,0) term of s term varies as exp[-(ct-r) 2/4Db] . e for a heavily ionizing 5-ray in 2.9xl0-7cm and D/c=(l.43xlO-9)/(l.57x pond to 1.8xl0" l 2sec ard 0.6x.l0 - 1 3-tely, I(r,t) at specified r rises litude increases, but quickly returns ssure wave or rarefaction which wave could only be detected if the n the picosecond range. It 1s of interest to examine whether waves with a picosecond time scale will travel far in water. For liquids such as water where the attenuation coefficient is proportional to the frequency squared, a 6-function wave passing through a thickness x becomes a Gaussian waveform with standard deviation a given by
a * (2ax)^ (18)

281 where the amplitude attenuation of angular frequency w Is exp(-a(u*x). For water a • 1.2 x 10"l7sec2/cin, so for a • 10 _ ,*sec, x » 4 x 10 _ ,cm.
THE PRESSURE MOMENT FROM A HEAT IMPULSE It would appear that no direct Information can reach acous
tic detectors' from the local hot spots. However, each wave from a local hot spot has a non-zero value of J, where
after J = ;t'p(r,f)dt'
before * (19) and it can be shown that J Is not altered by the greater attenuation of the higher frequency Fourier components. Solving for J by integrating by parts and using only the F(ct-r,0) term of Eq. 16, we find , E ßc 1 »
Radiated " " / F(cf ,0)df , (20a) radiated 4„ c D r —
E o P * 4-; -45FTT- 1 f c(b/D)*»l. (20b)
The approximation in Eq. 20bjiS reasonable since the numbers mentioned for 6-rays give c(b/D)T=4.5; smaller values for this parameter or other mechanisms of acoustic wave generation may alter Eq. 20b. Remarkably, the dependences on media parameters D, c, and p disappear from Eq. 20b.
Contributions from all the waves Incident on an acoustic detector will result in a total pressure moment J given by Eq. 20b, but with E being the total cascade energy, and r being some average distance« Of course, the various contributions will be spread out In time, so the appearance of the pressure wave at the receiver will be like one cycle of a sine wave: a pressure rise followed by a pressure decrease, the total time spread being characteristic of the sound transit time over cascade dimensions or the receiver resonant period, whichever is longer. Suppose the observed signal can be approximated by one cycle of a sine wave:
p « p sin (ct/1) (2V) where p is the observed amplitude and 1 characterizes the size of the cascade along the direction of observation. Then p Ä 1s related to J by °
P 0 *. -(J/2*)(c/l)* (22a) 0 « (E 0ßc*)/(8ir 4c pl*r). (22b)
Notice that this argument can be used for a detector located in any direction relative to a cascade with an appropriate adjustment of the effective acoustic thickness. 1. We are not led to expect a sin x/x type acoustic pressure distribution,' where x-2k sin 6, which 1s characteristic of a continuously oscillating source, because we are dealing with an Impulsive source which results 1n a single cycle of oscillation and all sources contribute with the same algebraic sign to J. The time dependence has been confirmed by recent observations.7
282 Conversely, if p(t) 1s the observed pressure waveform,
it Is clear that the distance distribution of energy deposition and the total energy can be obtained from p(t), and that information from several receivers could be deconvolved to obtain the three-dimensional cascade profile and location. Our analysis not only has shown that a simple relationship exists between energy deposition and acoustic pressure, but the approach outlined above may be essential if other mechanisms of sonic wave generation are to be considered.
FOOTNOTES 1. R. M. White. J. Appl. Phys. 34, 3559 (1963). 2. B. L. Beron and R. Hofstadter, Phys.Rev.Letters 23_, 184
(1969); B. L. Beron e_t aj_., IEEE Trans .Nucl .Sei . 17. 65 (1970). 3. E. Segre, ed.: Experimental Nuclear Physics, v.l (John Wiley,
New York, 1953) pp. 166-259. 4. W. Nowacki: Thermoelasticity (Polish Scientific Publishers,
Warsaw, 1962), p. 267. 5. The complete solution given by Nowaki, reference 4, for a
point source contains discontinuities at r=ct. In an earlier report (T. Bowen, Proceedings of the 1976 DUMAND Summer Workshop, Univ. of Hawaii, Sept. 6-19, 1976, p. 523) some mistaken conclusions were drawn; only if there were a discontinuity in 3$/dt at r=ct could a unipolar pressure pulse be radiated. It has been shown in this work that no discontinuity can exist at r=ct for a Gaussian heat pulse distribution; this result can be shown to be generally true for any impulsive heat source with a smoothly varying, finite 0(r,t).
6. G. A. Askarjan and B. A. Dolgoshein, Proceedings of the 1976 DUMAND Summer Workshop, Univ. of Hawaii, Sept. 6-19, 1976, p. 553.
7. T. Bowen, H. Bradner, W. V. Jones, J. Learned, N. Levi, I. Linscott, A. Parvulescu, A. E. Pifer, P. Polakos, J. Strait, and L. R. Sulak, ibid., p. 559; L. R. Sulak (private communication).
* Supported in part by the National Science Foundation.

283 UNDERSEAS CERENKOV DETECTOR OF ACCELERATOR
PRODUCED LEPTONS Peter Kötzer, Western Washington State College, U.S.A. Seth H. Neddermeyer, Univ. of Washington, U.S.A. Doran Padgett, Office of Naval Research, U.S.A. Rein Silberberg, Naval Research Laboratory, U."S.A.
Theoretical Q Experimental Q Both [7]
In the first DUMAND workshop , design configurations for underseas cerenkov detector arrays were considered in the study of high energy natural neutrino sources, interactions and low energy neutrino bursts. These studiet; have been iterated at a second workshop which has identified several specific physics experiments. Here we discuss a unique configuration which can be used to calibrate large scale muon and neutrino detectors with the aid of accelerator produced neutrinos having a known energy spectrum and also to test for the proposed existence of neutrino oscillations2 and decays3 at long distances from the accelerator neutrino sources.
1 Peter Kötzer, Editor, "Proceedings of the 1975 Summer Workshop on Neutrino Interactions in the Ocean Depths and on Oceanographic Physics and Marine Engineering" Western Washington State College, Bellingham, WN 931225
2 K.T. Petkov, "Processes v+ey, p+eee", \>'-»v y in the Model of Weinberg and Salam with Neutrino Mixing" DUENA Preprint, 1976
3 Shalom Eliezer and Douglas A. Ross,"A Cabbibo Theory for Leptons and Neutrino Masses", Phys. Rev. 10D 3088 (1974)
Coordinates: MN 2.5 (Neutrinos and Neutrino Interactions)
Mailing address: o r. Peter Kötzer Bureau for Faculty Research Western Washington State College Bellingham, Washington 98225 U.S.A.
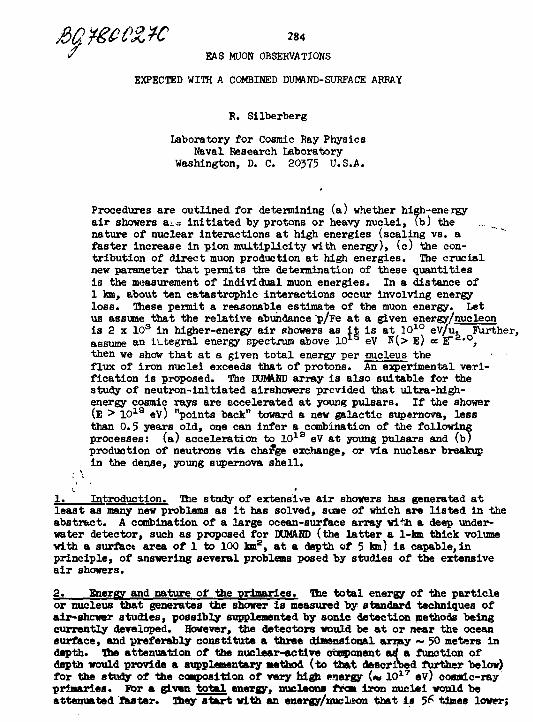
EAS MUON OBSERVATIONS
EXPECTED WITH A COMBINED DUMAND-SURFACE ARRAY
R. Si lberberg
Laboratory for Cosmic Ray Physics Naval Research Laboratory
Washington, D. C. 20375 U.S.A.
Procedures are ou t l ined for determining (a) whether high-energy air showers aj.« ini t iated by protons or heavy nuclei , (b) the --._^ nature of nuclear interactions at high energies (scaling vs. a faster increase in pion multiplicity with energy), (c) the contribution of direct muon production at high energies. The crucial new parameter that permits th« determination of these quantities i s the measurement of individual muon energies. In a distance of 1 km, about ten catastrophic interactions occur involving energy loss . These permit a reasonable estimate of the muon energy. Let us assume that the relative abundance p/Fe at a given energy/nucleon i s 2 x 1 0 3 in higher-energy air showers as i t i s at 1 0 1 0 eV/u. Further, assume an integral energy spectrum above 1 0 1 5 eV N(> E) æ E ~ a , ° , then we show that at a given tota l energy per nucleus the flux of iron nuclei exceeds that of protons. An experimental verification i s proposed. The DUMAND array i s also suitable for the study of neutron-initiated airshowers provided that ultra-high-energy cosmic rays are accelerated at young pulsars. If the shower (E > 1 0 1 9 eV) "points back" toward a new galactic supernova, less than 0.5 years old, one can infer a combination of the following processes: (a) acceleration to 1 0 1 8 eV at young pulsars and (b) production of neutrons via charge exchange, or via nuclear breakup in the dense, young supernova she l l .
• \
1. Introduction. The study of extensiv« air showers has generated at least as many new problems as i t has solved, some of which are l i s t ed in the abstract. A combination of a large ocean-surface array with a deep underwater detector, such as proposed for DUMAND (the lat ter a 1-km thick volume with a surface area of 1 to 100 km2, at a depth of 5 km) i s capable, in principle, of answering several problems posed by studies of the extensive air showers.
2 . Energy and nature of the primaries. The to ta l energy of the particle or nucleus that generates the shower i s measured by standard techniques of air-shcwer studies, possibly supplemented by sonic detection methods being currently developed. However, the detectors would be at or near the ocean surface, and preferably constitute a three dimensional array ~ 50 meters in depth. The attenuation of the nuclear-active component arf a function of depth would provide a supplementary method (to that described further below) for the study of the composition of very high mergy (« 1 0 1 T eV) cosmic-ray primaries. For a given to ta l energy, aucleona from iron nuclei would be attenuated faster. They start with an energy/nuclson that i s 5^ times lower;

285 hence fewer col l i i ion« and less traversal of material are required, for degrading the residual nucleon» and mesons to ~ 1 OeV (below this energy, additional buildup of nuclear-active particle» 1« minor).
I »hall now »how that a large fraction of a ir showers la Initiated by heavy nuclei, even If the relative abundances of eleaant» are similar to those at 10 to 100 OeV/u. This is Illustrated In Fig. 1, which show» the integral energy spectrum of protons, « E " 2 , ° , with fluxes such as those estimated by Watson (1975).
While the abundance of heavy nuclei like Fe i s not known at high energy, I shall assume (for purposes of Il lustration) the ratio of p : c : Fe to be similar to that in the low-energy" (~ 10 OeV/u) «ource composition, i . e . , 5 x 10* : 100 : 22, and plot the spectrum of iron (aee Fig. l ) . An air ehow-er init iated by a proton at 1 0 1 7 eV i s similar to that of iron at 1.8 x IO 1 3
eV/nucleon (aee Fig. l » ) . A transformation of these spectra to an energy per nucleus scale, (as in the lower half of Fig. l ) shows that iron nuclei can be the dominant source of a ir showers; in fact , air showers init iated by CN0 and by He can be as abundant as those due to protons.
Fig. 1 (a) The integral spectrum N(>E) of high-energy cosmic-ray protons, in eV per nucleon (Watson, 1975). The spectrum of iron nuclei i s also shown, assuming that the relative abundance i s similar to that at 10 GeV/u.
10* I \ I I I
a IO"»
(,.«
„"IO" 1» "! -Ul)
X
< (3 Ul
s i o - "
I i V p
I
-
1 0 2 0
E/uteV/ui
(b) The corresponding spectra of protons and iron nuclei on an energy per nucleus scale, representative of air shower events.
E TOTAL («V)
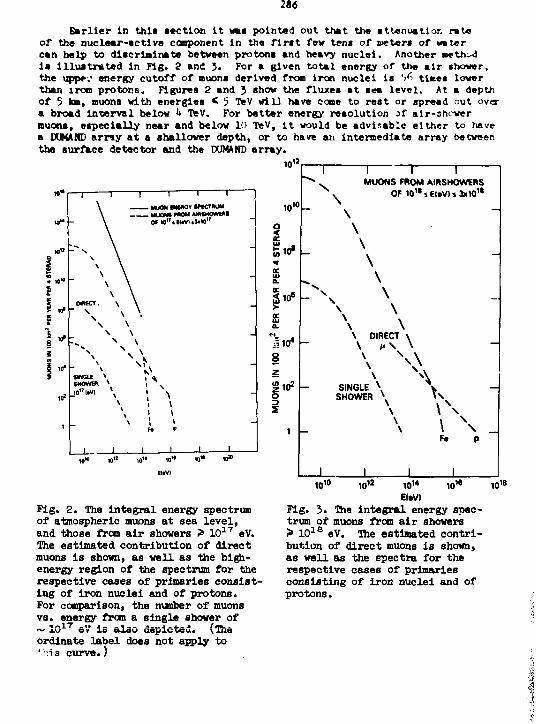
286
Earlier in this section i t was pointed out that the attenuation rate of the nuclear-active component in the f i r s t few tens of Bieters of water can help to discriminate between protons and heavy nuclei. Another »*th~J i s i l lustrated in Fig. 2 and 3. For a given total energy of the air shower, the uppe.- energy cutoff of muona derived fron Iron nuclei is '/•> t lces lower than iron protons. Figures 2 and 3 show the fluxes at sea level . At a depth of 5 loa, muons with energies < 5 TeV wil l have come to rest or spread out over a broad interval below 4 TeV. For better energy resolution of air-shower muons, especially near and below 10 TeV, i t would be advisable either to have a DtNAMD array at a shallower depth, or to have an Intermediate array between the surface detector and the DUMAND array.
MUON wow» wtem« MUOM M K »1MM0WW1 «»"•mvi.J'»"
Fig. 2 . The integral energy spectrum of atmospheric muons at sea leve l , and those from air showers > 1 0 1 7 eV. The estimated contribution of direct muons i s shown, as well as the high-energy region of the spectrum for the respective cases of primaries consisting of iron nuclei and of protons. For comparison, the number of muons vs . energy from a single shower of
10'
10'
o < feio» cc 111 0. or _ >
£ i» 4
8
"T
\
H 1 1 MUONS FROM AIRSHOWERS
OF lO^iEltVljJxlO'*
ho2
o £
DIRECT
\ \
,10
SINGLE \ SHOWER \
_L
\ \
I 101 10 ,« 10 ,1« 1014
E<*V) Fig. 3. The integral energy spectrum of muons from air showers > 1 0 1 8 eV. The estimated contribution of direct muons is shown, as well as the spectra for the respective cases of primaries consisting of iron nuclei and of protons.
10"
1 0 1 7 eV i s also depicted. (The ordinate label does not apply to M'i s curve.)

:«7
While the er.ergy ipectnm of muom derived fron air ahovara auaakttl over »11 energies is known up to 10 i * eV, that corresponding to air ahovera at • given energy is nearly unknown. For rauon energies between 10 e and 1 0 1 1 eV, the calculated values of Hi lias et a l . (1973) »re used. At a glv»n proton energy (say, 1 0 1 7 eV), the relative flux of directly produced auona (<, l o i e eV in this example) is estimated by assuming (a) that each proton generates a pion at ~ 0.1 of the energy of the proton, and (b) that the ratio of direct muon to pion production is 10" 4 . According to Cllne (197^) the probability of pion decay in the atmosphere at 1 0 1 5 eV Is 1)~4. Hence, above 1 0 1 5 eV, direct muons wi l l dominate, (in fact, this could already happen at lower energies, i f the ratio should be > 10"* at high enerples.) Between 1 0 1 1 and 10 1 eV, a linear interpolation on a log-log scale is used, since the actual spectrum is now known. The experimental determination of the muon energy spectrum becomes feasible in a 1 km-deep array. One can then sum over several interactions of pair production (and bremsstrahlung and nuclear interactions). Since the energy loss in pair production i s rather well known to be ~ 0.005 of <ihe muon energy, the latter can be determined rather precisely. A determination of the muon spectrum (at 0.001 to 0.1 of the total primary energy) for an ensemble of air showers at a given energy thus i s l ikely to shed l ight on the composition of th» primary particles that in i t ia te the air showers.
5. Kature of nuclear interactions at high energy. Kalmykov and Khristianam (1975) have analyzed data on the n/e ratio in large air showers. These data suggest the break-down of scaling at high energies, and high particle multip l i c i t i e s in high-energy interactions. However, the possibl large fraction of a ir showers init iated by iron nuclei (shown in Fig. l ) implies that i t may not be necessary to resort to exotic explanations of changes in the nature of nuclear interactions. A determination of the composition of high-energy primaries (E ä 1 0 1 S eV) by methods proposed in section 2 would also shed l ight on the problem of whether scaling applies at these energies.
h. Directional correlations of a ir showers with new galactic Supernovae; neutrons from supernova shel l showers. For a Loreniz factor of 1 0 i u , i . e . , at energies of 1 0 x a eV, the lifetime of neutrons i s so dilated that traversal across the galaxy becomes possible. I t i s known that pulsars are highly eff ic ient accelerators of particles (Finzi and Wolf, 1969). The actual acceleration mechanism i s not known, though various means (direct acceleration, or acceleration by electromagnetic waves, or hydromagnetic waves) have been proposed (Goldreich and Julian 1969, Gunn and Ostriker 19^9, Kulsrud 197l). Suppose that a young pulsar (< 0.5 year old) can accelerate nuclei to 1 0 1 9 eV/u, The supernova shel l i s s t i l l suff iciently dense for these nuclei to interact in i t , generating neutrons by charge exchange or nuclear breakup. Unlike protons or nuclei, neutrons are not deflected by magnetic f i e lds , and their directions of arrival can be correlated with the positions of galactic Supernovae. Recent estimates by Tammann (1976) of supernova frequency are 1 in ~ 13 years in our galaxy, when corrected for obscured regions. The flux of neutrons i s di f f icul t to calculate; one would have to know (a) the fraction of nuclei at E > 1 0 1 9 eV that are accelerated during the period 1 to h months after the s te l lar Implosion (during the f i r s t month the shel l i s too thick, after h months i t becomes too thin) , (b) the total number of protons or nuclei per supernova at these energies. The lat ter quantity can be estimated from the flux of air shower part ic les , assuming a galactic confinement time, say ~ 1 0 4 years at 1 0 1 S eV, or ~ 10® years with a halo model. A detector area of 100 km2 (such as considered ultimately for the DUMAND sonic array) should be sufficient for observing several neutrons from one galactic supernova, by means of the showers they would generate.

2M
5. Conclusions. Tb« KDeVHD array proposed for the study of high-energy neutrino« appear« promising for air «bower «tudle«, i f I t la supplemented by a aurface array (preferably also 3-dlmenalonel, about 50 • thick). We have shown that among the problaaa which can be reeolved or Illuminated are the following: (a) the composition of air shower primaries, (b) the rate of direct-auon production at high energies, and (c) the nature of nuclear Interaction (scaling) at high energies. One can determine whether young pulsars are the source of particles at energies above 1O 1 0 eV by searching for directional correlations of a ir showers ( init iated by neutrons) with newly formed Supernovae. The latter showers should occur every one or two decades, a few months after the supernova explosion.
6. References. Cline, D. 1976, Proc. 1976 DUMMID Summer Workshop, Univ. of Hawaii, p. 265. Finti, A. and Wolf, R. A. I969, Ap. J. 151, ua'^' Goldreich, P. and Julian, W. H. 1969, Ap. J. 15J, 869. Gunn, J. E. a».d Ostrlker, J. P. 1969, Phys. Rev. Letters 22, 728. Hillas, A. M., Hollows, J. D., Hunter, H. W. and Mar«den, D. J. 1971 Conf. Papers, 12th Internat. Conf. on Cosmic Rays, Hobart £, 1007.
Kalmykov, H. H. and Kh:.'lati'-",en, G. 3. 1975 Conf. Papers, lVth laternat. Cosmic Ray Conf., Munich, Ö, 2875.
Kulsrud, R. M. 1971, Ap. J. Ib5. 567. Tanmann, G. A. 1976, Proc. 1976 DUttHD Summer Workshop, Uuiv. of Hawaii, P. B7. Watson, A. A. 1975, Rapporteur Papers, 14th Internat. Cosmic Ray Ccnf.,
Munich, 11, 4019.

øCtføcÅH
. ' /
289
DUIUSD AB mm ninoToa T.T.Borog, £.P.Kokoulin, •.A.Petrukhln,
Y.T.ShMtakor, and T.i.Xuaatov
ktosoow Physical Bngineerlng Institute
Moscow 115*091 ÜSSH
Beoent discussions [1] of the DOMAto projeot hare dealt with the programme of neutrino experiments only, it the seas time DÖMAHD gives a unique possibility for the investigations of oosmio ray auons with energies greater than 1 0 " eV. She sise of the deteo^or allows to measure the auon energy speotrua up to 10 ' eT, where * the change of the auon spectrum oonneoted with the direct anon production and the bieak. In the primary spectrum at about 3*10" eT should be observed. She large thickness of the deteotor aakes it possible to use the aethod of the auon energy aeasureaent based on the multiplicative pair production by auons. The accuracy of about 25% aay be obtained with the 1 km water thick detector. The large number of auons penetrating a sensitive volume (~10 9 per year) gives the possibility of the study of the anon arrival direction aniaotropy and the time variation of the anon flux.
Introduction. The DUMJHD project will be an array with the sen
sitive volume up to 10* ar located at the depth near 5 km water. Zhe size and the principal parameters of the arrangement are
determined by the programme of neutrino experiments at energies
1 0 1 2 - 10 13 eT. But such installation gives a unique possibili
ty for cosmlo ray union Investigations at energies 10 - lo'^eT.
Some questions of muon investigations with the DUMAHD array
have been considered in the paper [2]. In the present report
the probleas oonneoted with the extremely high energy muon spec
trum are analysed.
1. Study of the absorption curve. If the arrangement is sensi
tive enough to register single muons, it will be similar to an
ordinary underground (underwater) installation assigned for the
measurements of the absorption ourve, i.e. the depth-intensity
relation or the zenith, angle dependence of the muon Intensity
at a fixed depth. She possibilities of such apparatus are de
termined practically by their area S. The comparison of the
DUUAID project and its prototype (DUM1HD 1 with the 10 or vo-

290 luae) with the existing inatallati- *<*>.*.«'<,•<, ons and installations beins under construction is siren in lig.1. Inergiea for which the anon count eojuala 100 partiolea per year are indloated aa upper limits. It should be noted that the figure is only illustrative, for example, Utah installation registers only horisontal anion flux whereas the Installation which is being constructed in the Caucasus is assigned to register vertioal as well as horisontal auons. so its effective
2 area will be more than 200 a which
fig.1. Integral energy spectrum of cosmic rays. 1 - primaries i 2 - muons from TC- and K-deoayai
DUHAHD project would make it possible 3 ** direct muons [3] . to achieve the energy range up to 10 eV, where-the change of the muon spectrum connected with the break of the primary spectrum (ÄY"»0.5) should be e^aerved. On the other hand, the expected intensity of direct muons may be comparable with that of deoay muons at these energies« She possibility of the investigation of these effects depends to a high extent on the background of muons induced by the atmospheric neutrinos. Pig.2 shows the muon Intensities vs the zenith
E..V
is indicated 1A the Tig.1. The oomplete realisation of the
Pig.2. ingular distribution of muons at the depth of 5 km water. 1 - deoay muons t 2 - direct muons i 3 - v-induced muons. Solid curves -S>10TeV| dashed-BS0.3 TeTf dashed-dotted curve « all V-induced muons.
- i i 1 — •• i - i -
io 8
7 \
\ K B * is -=^<2 ^ -
1 i^^S ^ * — • *.*
9 • ~ N $ r ~ ^ • ;
*»*
.—?T i i
ID 05 00 -05 cose

291 angle at tba dapth of 5 km water. Tba absorption of muona in thick layers of matter bar baan takan into aooount according to [4]. Oca can aaa from tba figure that tba Intensity of v-in» duoad auona at large aanitb angles (coe©<0.3) ia aora tbaa tba atmospheric anion intanaity «niob oould give the inf oxaation about tba energy apaotrua jehariour at energies aa high aa 101-* aT. Ina thraahold energy 0.3 ToV corresponds to tba miaimum energy of auona panatrating tba arrangaaant (1 ka of «atar). It abould ba noted that tba average energy of V-induced auona ia auch laaa than tbe average energy of atmospheric muons, therefore tba intanaity of auons induced by neutrinoa strongly depends on tba minimum energy required for registration. So, the total nuaber of atmospheric auoos (with energies B > 0) ia twice as auch as the nunber at S > 0.3 whereas tba V -induced muon intensity increases by «ore than a decade (dashed-dotted curve). 2. Study of the energy spectrum. The energy spectrum behaviour in the 10 - 10 eV range may ba considered if soma assumptions are made about the muon energy values at which the influence of direct muons and of the break in the primary spectrum is significant. Let us suppose that the change of the primary
spectrum power index from JT =1.7 to Y"* 2.2 at 3x10 1 5 eV leads to the change of the muon apaotrua index on the value AY"» 0.5 at energy 8 » 3x10" eV (underwater). Then three variants may ba realised in which the intensities of direct and decay muons ara equal to each other at anergiea lesa.
14 equal to and mora than 3x10 eV. fig. 3 shows tba integral spectra of muona at the depth of 5 km water. The values of the jm/T -ratio accepted in the calculation are listed in the figure caption. The line 4 represents the spectrum of
** • 1 1 . £ V - 3 <• £*>7 -6 T v *»• - 2
In* 7 -— I . Hi / $• — i
K)8
i • ' K)' I0z E.TeV
Tig.3. Main features of the muon spectrum at high energies. V/1C - ratio, ia 10~?i 5x10r>,and artO^for lines 1, 2, and 3 respectively. Line 4- v -induced muons.

:9;
\ «joduoed nuons calculated under assumption of unlimited Increase of the neutrino Interaction cross-section with neutrino energy. It la evident that the contribution of the v-induoeU muoos tj the total muon flux at the considered energies i» negligible. The cutoff of the neutrino cross-section increase even for eV gives the such lower value of the v-induoed muon background. Thus the muon energy neasurement should allow to study this extremely Interesting energy range. The daahed-dotted line in fig. 3 Indicates the level of 100 muons for 5 year period.
It is obvious that these problems could be solved if the intensity of super high energy extraterrestrial neutrinos is lower than that of the atmospheric ones. If the intensity of extraterrestrial neutrinos is as high as the value predicted in the paper [5], the study of the atmospheric muon spectrum at 1 0 1 5 eV will be difficult. But the registration of the extraterrestrial neutrino flux will be a good compensation of this loss. 3. Muon energy measurement. There are two methods of the muon energy spectrum measurenant through muon interactions. The first of these is based on the registration of large cascade showers, mainly due to muon bremsstrahluug. in this case muon loses nearly half of its energy and the registration of such cascades is not quite difficult even for the large PMT spacing in the array. But the number of cascade showers due to bremsstrahlung is equal to 5J6 of the number of muons at the same energy.
The second method is based on the multiplicative electron pair produotion by muons . As the registration of single interactions with respectively low transferred energy is too difficult, the modified method based on the measurements of the total energy loss in several subsequent layers of the absorber is more appropriate. In order to reduce the Influence of very fluctuating losses due to bremsstrahlung and nuclear interactions which are significant at c/B?0.1, the thickness of a single layer AX should satisfy the condition A X « 1/ö"(u>0.1),

293
«hara 0* la tba auaaary auon interaction oroee-aeotion which ia a function of ttaa ratio ir of tba tranafarrad euergy £ to tba i n i t i a l auon energy 1 . DM value 1/CT( ir > 0.1) la nåar 2 ka of «atar. If tba energy dapoaitiona AI^ ar« «aaaurad ln X .Layers , then tba log likalihood function la
LCK) . Z l n [ v k I ( V k , A X ) ] , ? k « å\/{X - ^ » j ) -
Tba probability distribution for auon to loaa a fraction 7 of
ita initial energy in AX layer bar« baan oalculatad undar ap-
praziiiation A by uaing tba functional transformation aatbod
describod in [6j. Tba function W(V,AX) for tbraa Taluaa of AZ
is presanted in the fig.4. The probability dlatrlbution for a
VW(V,AX) ~i 1 1 1 1 1 1 1
lig.*. Ih« probability dlatrlbution of tba anargy loaa of bigb anargy auona in a layer of tba aattar.
arror (0\ne ) Tabla 1. £M3 •ixw WinL of tba auon anargy derived froa tba anargy deposition« In subsequent layers AX for rarlous total thickness of tba detector X (ka «atar).
AX X 0.4 0.6 0.8 1.0 1.2
0.1 0.2 0.3
.42
.50 .31 .38 .44
.26
.31 .23 .27
.20 ">9
.26
single layer is rather «Ida, but the consideration of several
layer* gives a good result. The corresponding accuracy of the
auon anargy aeasureaent la given in the Tabla 1. It is seen
froa tba Tabla that the aoouracy near 25% aay be obtained for the total thickness of 1 ka and a reasonable nuaber of layers.
4. Other problaaa. Th» total number of auons penetrating a sen
sitive voluaa 1 ka 3 at the depth of 5 ka water ia about 10^ par
year and «1th energies aore than 1 TeV near 10 s par year.
, '<•/ ~<A
%. }7'x * '
PRINTED rø THE PEOPLE'S REPUBLIC OF BULGARIA ^
# " W BULGARIAN ACADEMY OF SCIENCES