m÷
10
areppim: information, pure and simple 15 March 2016 http://stats.areppim.com insight U © 2016 areppim AG, Bern, Switzerland 1 GigaRich & NanoPoor Y C T Can More Than 700 Million Extreme Poor Pass Unseen? Y insight 2016 Billionaires Some Bruises, and yet 8% of Gross World Product Fig.1: Billionaires per capita as a function of GDP per capita.
Transcript of m÷

areppim: information, pure and simple
15 March 2016
http://stats.areppim.cominsight
U
© 2016 areppim AG, Bern, Switzerland 1
GigaRich & NanoPoor
Year after year the world displays further
instances of the same degrading show of
lavish riches rubbing
shoulders with
extreme poverty. In
2016, we can find a
number of low GDP
(gross domestic
product) per capita
countries such as
Vietnam,
Tanzania,Swaziland,
Algeria, or Colombia
boasting their own
bil l ionaires. That
may be offensive
enough, but what
comes across
as downright outrageous is the coexistence in
some countries of individual bi l l ionaires and a
swarm of people trudging in utmost poverty.
Consider the sample of countries in the table
below (Bil l ionaires and Extreme Poverty).
They all maintain a collection of bil l ionaires,
and quite a shining one in the cases of
India, Indonesia, China and Brazil .
Those bil l ionaires
possess vast
wealth, weighing
from 4% to 11% of
the country's GDP.
Occasionally, the
tabloid press
reports on the
glittering social
parties given by
some of their i l lustrious members. But it is
nowhere reported that they might experience
difficulties to sleep peacefully, or that they
might suffer from painful stomach ulcers
caused by an uneasy
conscience. The
knowledge that crowds
of their country fellows
ramble around,
desperately trying to
survive another day,
neither brings them
insomnia, nor impairs
their digestion.
Can More Than700 MillionExtreme PoorPass Unseen?
You may argue that
bil l ionaires cannot see the wretched crowds
from their palaces' terraces. That does not go.
There is no way to conceal the hundreds of
mil l ions of human beings living on less,
sometimes a lot less (see poverty gap above)
than $1.90 per day. There is no way to hide
away 53% of the population in Nigeria or 21%
in India. They
exist, they are
everywhere, one
cannot avoid
bumping into
them. I t seems
rather that this
bipolar distribution
of wealth is
viewed as a law of
nature by all
insight
2016 Billionaires Some Bruises, and yet8% of Gross World Product
Fig.1: Billionaires per capita as a function of GDP per
capita.

areppim: information, pure and simple
15 March 2016
http://stats.areppim.cominsight
© 2016 areppim AG, Bern, Switzerland 2
insight
concerned, a law of nature that is taken as a
blessing by the happy few, and is perceived as
an utter misfortune by the innumerable
destitute people.
The chart (Fig. 1, see also Table 1) shows thescatter of bil l ionaires per mil l ion inhabitants (y
axis, logarithmic scale) as a function of the
country's GDP per capita (xaxis). The lower
left area is crowded by countries with low GDP
per capita that generally have not so many
bil l ionaires, e.g. Vietnam, Tanzania or Nepal.
The central area of the chart is fi l led with rich
countries such as the United Kingdom,
France, Germany, that have a sizable l ist of
bi l l ionaires. At the top right one finds the
exceptional cases of extremely small countries
l ike Monaco or Liechtenstein that specialized
as tax shelters for superrich people.
It is easy to visually grasp the meaning of thescatter distribution. Common sense should
lead us to expect that bil l ionaires prosper in
highincome countries, those that assemble in
the center of the chart. They actually do, and
there is no surprise here. The disturbing fact is
conveyed by the densely populated lower left
corner of the chart. I t is disturbing because it
exposes the fact that bil l ionaires can thrive
also in poor or even very poor countries.
Putting it differently, bi l l ionaires may flourish in
all environments, in rich ones of course, but
also in indigent ones. Indeed, this is
corroborated by the statistics. There is only a
weak linear correlation between the number of
bil l ionaires per mil l ion and GDP per capita (r =
0.61). The variation of GDP per capita can
explain only 38% of the variation of the ratio of
bil l ionaires per mil l ion (R² = 0.38).
Epic New Century
The 21st century is a liberal provider of
novelties in the economic and social fields.
Since the middle of the 19th century, when
Marx and Engels published their Communist
Manifesto, a relentless struggle of socialism
against capital ism was engaged for roughly
150 years with uncertain results. Come the
years 2000, and the whole scenery becomes
blurred. Capital ism puts on its fancy, gleaming
neoliberal garments, and throws its old
Christian, benevolent, paternalistic clothes
away for good. As for socialism, one would be
hard pressed to reconcile the venerable
socialist ideals of brotherhood, equality,
solidarity and fairness to their contemporary
implementation by selfnamed "communist"
societies.
Where Opposites Do Meet
Two countries epitomize this transformation
process. The United States remain the
archetype capital istic bil l ionaire nation: high
GDP per capita ($ 59,503), and a record 540
bil l ionaires (an index of 1.67 bil l ionaires per
mil l ion people). The fl ip side of such a
glamorous tableau is a widening gap between
rich and poor, the growing masses of
degraded poor abandoned to themselves, cut
off from federal food, health, and shelter
subsidies, the dire prospects for those living on
uncertain laborwages, and the free fall of
middle classes to poverty levels.
The "socialist" counterpart is China, an
alleged communist society, ruled by a strong
communist party, and not a bit selfconscious
of its revolutionary legends. There is no need
to detail the heavy economic role that China
plays in the contemporary world. The
meaningful point is that China, second only to
the United States, is the country with most
bil l ionaires, a total of 251 weighing 5% of the
country's GDP. There is, however, a sharply
contrasting side to this prodigal wealth. A total
of 155 mil l ion people, or 11.2% of the entire
population, l ive in extreme poverty, surviving

areppim: information, pure and simple
15 March 2016
http://stats.areppim.cominsight
© 2016 areppim AG, Bern, Switzerland 3
on less than $ 1.90/day. Normal people would
feel uncomfortable to bring into agreement
such a sickening state of affairs with the motto
"From each according to his abil ity, to each
according to his needs" that allegedly
encapsulates the communist goals. Normal
people should, but people in the central
committee of China's communist party do not.
The End of History Did Not HappenYet
By the end of the 20th century it was
fashionable to earnestly declare the "end of
history", asserting that the spread of free
market capital ism and of its l ifestyle signaled
the ultimate form of social organization. The
initial decade and a half of the 21st century
quickly exposed the construct as a trifle. We
have undisputed evidence that, far from
reaching its end, history is taking a turn that
opens into a wide array of possible forms of
human government, some of which do not look
very palatable. Just to mention a few
examples: the emergence of asymmetric wars
successfully challenging the mil itary might of
the big world powers; the worldwide spread of
small group or individual terrorism that
governments find impossible to curb; the
departure from such basic rights as the right to
due process of law, to freedom of movement,
to freedom of expression or to privacy, all
sacrificed on the altar of the security of the
state; the deepening estrangement between
the people and the officeholders; the long
lasting financial and economic crisis that is
ruining the social fabric, while exposing the
fallacy of the freemarket ideology; or the
uppermost threat posed by the rapid man
made wreckage of planet earth.
Against such an agitated background it is
sensible to prognosticate that sooner or later
people wil l rise to their feet and demand urgent
and primary changes. Since it chiefly affects
the everyday life of bil l ions of people, the
dichotomy between superrich and deeppoor
is bound to become a source of exasperation,
and to effect structural and policy voltefaces
liable to turn the social status upside down.
Upward Trend
Unfolding crisis, unemployment, over
indebtedness, poverty, precariousness — that
is today's cocktail for the commoner. For
bil l ionaires, courtesy of their tooth fairy, the
road is much smoother and unencumbered.
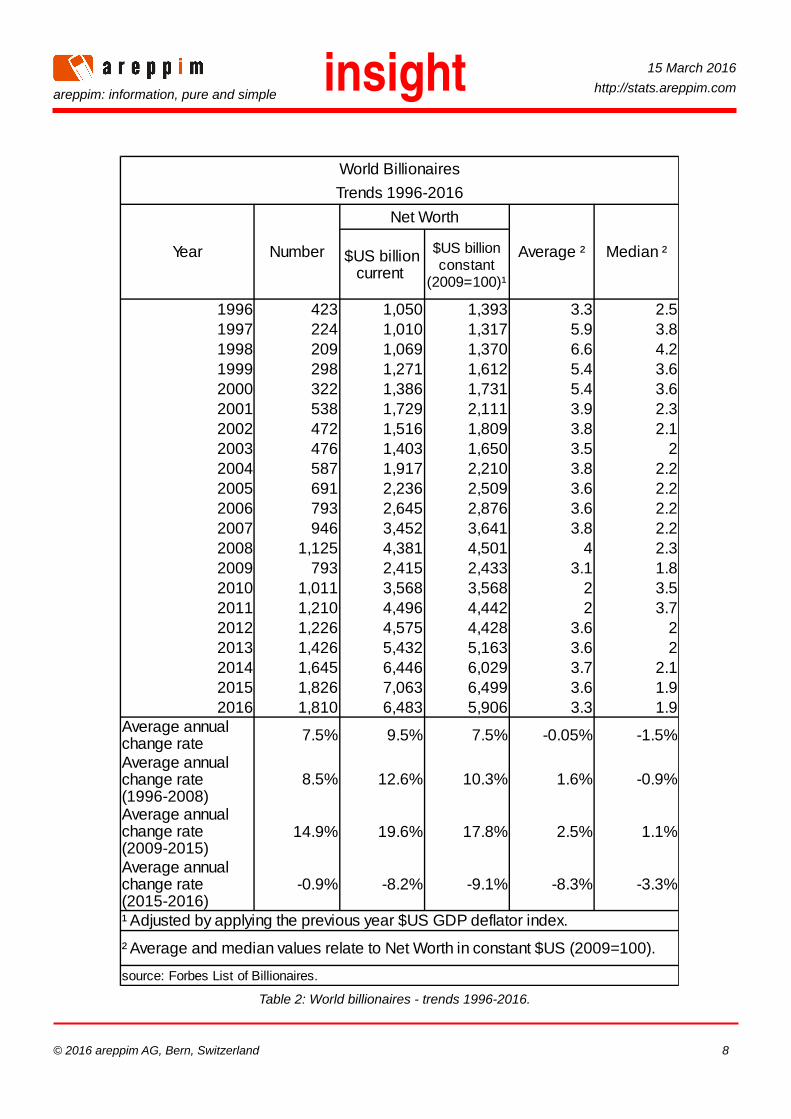
The number of bil l ionaires (Fig.2, see also
Table 2) grew from 423 in 1996, to 1,810 in
2016 (7.5% annual average growth, or a 9
year doubling time). Their net worth swelled in
parallel from $US 1,393 bil l ion (constant,
2009=100) to $US 5,906 bil l ion (7.5% annual
average growth).
Funny enough, bi l l ionaires replicate inhouse
what they callously imposed on the world at
large: the rising polarization of the wealth
distribution. A handful of archwealthy grab the
lion's share, while the crowd of lesser
bil l ionaires are stuck at the 1 bil l ion threshold.
Currently, the top 15% of bil l ionaires own 50%
of the total bi l l ionaires' net worth, while the
lowest 15% own only — if the adverb makes
sense in the context of gigadollars — 4.5% or
11 times less.
Ruin for Some, Triviality for Others
The world did not, as yet, regain health from
the financial and economic downturn that

areppim: information, pure and simple
15 March 2016
http://stats.areppim.cominsight
© 2016 areppim AG, Bern, Switzerland 4
knocked it out in
2008. The living
conditions of the
majority of the
people have been
severely hampered:
700 mil l ion people
or 12.7% of the
world population
survived on less
than $1.90 per day
in 2012; 122.3
mil l ion people, or
24.4% of the
population in the rich
European Union (28
members) were at risk of poverty or social
exclusion in 2014. Across the planet mil l ions of
people are fall ing below the poverty l ine
(generally placed at 60 percent of the average
national income) victimized by the evanescing
labor wages, the rising unemployment, the
evaporation of jobs, and the increasingly
delinquent state.
Bi l l ionaires are not
immune to crises but,
contrary to the average
man in the street, they
recover well and fast.
While the world
endures the pain of a
sluggish economic
engine, bi l l ionaires
aptly redirected to their
balance sheets a
growing chunk of the
assets produced by the
common people, thus
achieving the expansion
of their net worth at a
much faster rate than the world output. They
are liable to consider it as a justified reward for
their talents and energy. The hardheaded wil l
retort that the whole affair boils down to a clear
case of relative strengths — the stronger wins
and the winner takes all .
Fig.2: Trends of billionaires' number and wealth, 1996
2016.
Monaco and Swaziland in the SameLeague
The bigger the GDP (gross domestic product)
of a country, the wealthier the bil l ionaire class.
Right? Yes, that is correct. The US, Germany,
Japan have a plateful of superrich that weigh
$US bil l ions aplenty. Now, look at it from the
angle of the GDP per capita. The higher it is,
the heavier the bil l ionaires' share, right? No —
this time you have got it wrong. Swaziland with
a low GDP per capita of $US 3,717 can have a
bil l ionaire's wealth weighing 87.9% of the
country's GDP, a performance only exceeded
by the unique and very rich Monaco. The
sleight of hand is that wealth and income are
so unevenly distributed that bil l ionaires' net
worth bears close to zero relationship to the
GDP per capita.
The chart (Fig.3, see also Table 3) shows thescatter of the bil l ionaires' net worth as percent
of GDP (yaxis), as a function of the country's
GDP per capita (xaxis). The bil l ionaires'
wealth is strongly correlated to the country's
GDP (r = 0.92, R² = 0.85), but not the least
with the GDP per capita (r = 0.10, R² = 0.01).
In other words, the average financial condition
of people, as measured by the GDP per
capita, has no bearing on the relative weight of
the bil l ionaires' wealth.

areppim: information, pure and simple
15 March 2016
http://stats.areppim.cominsight
© 2016 areppim AG, Bern, Switzerland 5
Impecuniouseconomies canharbor hugeprivate fortunes
The 2016 world
bil l ionaires are a set
of 1,810 individuals,
owning net assets
worth of $US 6,5
tri l l ion or about 8%
of the world's total
output. Their
distribution is
uneven. Net worth
weighs between 0.4%
of the country GDP for
Romania, and 117% for Monaco. The mass of
data points is concentrated close to the xaxis
— indeed, fifty percent of bil l ionaires' wealth
weighs less than 5.1% of GDP, although the
bil l ionaire citizens of Liechtenstein, Cyprus,
Guernsey, Hong Kong, Swaziland and Monaco
hold assets that are worth between 49% and
117% of their home country GDP.
The distribution of
bil l ionaires' wealth
provides one more
instance of the overall
inequality pattern that
has been identified
elsewhere
(http: //stats.areppim.co
m/stats/stats_ginixpara
m.htm) for the
distribution of incomes.
Many impecunious
economies, for
example Vietnam,
India, Tanzania or Nepal,
harbor huge private
fortunes in spite of their minuscule GDP per
capita, far below the listed countries average
and median values. In the last two countries,
GDP per capita is below the $US 1,000 mark,
but they have bil l ionaires owning fortunes
worth 1.3 mil l ion to 1.4 mil l ion times as much.
No need to comment, the facts are a strong
enough indictment.
Fig.3: Billionaires' wealth in percent of GDP, as a
function of the country's GDP per capita.
Billionaires' Wealth Upwards Only
World bil l ionaires' net worth as percent of the
gross world product (GWP) has been on a fast
ride since 1996, as highlighted by the trend
(red regression line) for the period 19962016
(Fig.4, see also Table 4). In 1996 the whole
world should have to work 8 solid days to
produce an output equal to the total net worth
of the then existing bil l ionaires. In 2016 the
world would have to contribute an additional
10 workdays, bringing these to 18 days, to
match the wealth of the current 1,810
bil l ionaires.
Some highlights
Bi l l ionaires have a knack for grabbing
growing shares of the world's wealth. The
relative weight of bil l ionaire net worth in
constant US$ follows an upward path from
3.5% of GWP in 1996 to 7.9% in 2016,
corresponding to an annual average growth
rate of 4.2% — considerably faster than the
3.3% annual average growth of real (inflation
discounted) GWP. To put it plainly, bi l l ionaires
have been deflecting to their balance sheets a
growing share of the world's output — indeed
their cut increases annually about one percent

areppim: information, pure and simple
15 March 2016
http://stats.areppim.cominsight
© 2016 areppim AG, Bern, Switzerland 6
point faster than the world product, crises or
no crises.
More bluntly, the whole working world have
been prodigally letting go, year after year, of a
bigger chunk of their output to fatten the
wallets of a handful of highly privi leged
individuals. I f this transfer to the richest were
instead directed to the extremely poor — the
portion of the 700 mil l ion extremely poor
people that fall in the poverty gap — a major
step towards eliminating extreme poverty
would have been accomplished. Unfortunately,
regular people, contrary to the bil l ionaire
breed, tend to forget that charity begins at
home.
Bi l l ionaires form a very exclusive club. A
group of 1,810 people or 0.000024% (24 per
hundred mil l ion) of the 7.405 bil l ion world
population own 7.9% of the world's annual
output. They numbered 423 or 7 per hundred
mil l ion in 1996, which means that the club
membership has been growing at an average
rate of 7.5% per year, doubling in size every 9
years. By contrast, the world population grew
only by 1.2% per year during the same period.
The bil l ionaire club includes some
heavyweights and numerous comparatively
l ightweights. The average fortune is 3.3 bil l ion
real US$, but 50% of the members have
assets below the median 1.9 bil l ion. The top
5% own 30% of the total net worth, thus
mimicking the worldwide inequality pattern of
which they astutely reap the benefits.
Crises exist indeed, and they are a veritable
affl iction for common people. For bil l ionaires,
however, they are a mere flash in the pan, if
not an helpful lever to push their fortunes
further up. Both the 2001 dot.com burst and
the 2008 global financial meltdown have been
quickly outdistanced. From 2008 to 2009 the
bil l ionaires' total net worth plunged 2 tri l l ion or
46% in real US dollars, but from 2009 to 2015
it regained its previous upwards trend, growing
by 4 tri l l ion or 67%.
The 2015 depression has caused murderous
commotion among world bil l ionaires, to an
extent unparalleled since 2009. In 2016, 221
bil l ionaires got wiped out of the bil l ionaire l ist,
of which 42 from China, 25 from the United
States, 23 from Brazil , 19 from Russia and 15
from India — a sure sign that the crisis is
global, spreading over the oncevaunted
"BRIC" (Brazil , Russia, India, China)
economies. Most of the 221 slots, however,
were immediately fi l led in by new entrants with
the result that, after consolidation of ousters
and new entrants, the 2016 list is shorter than
the 2015 one by only 16 slots.
A World Clockwork Going Berserk
In hindsight, the 2008 crisis looks like the
initial tumor of a metastatic cancer that has
been spreading alarmingly thereafter. Nothing
seems to work properly in the world economy
anymore. Global economic uncertainty is
peaking in this present time, opening the way
to the ominous sluggishness of both
consumption and investment. The skies
become the more menacing as the monetary
policies of zero or negative interest rates, and
of the germane increases of the money supply,
courtesy of the central banks, keep flooding
financial institutions with inexpensive capital
that ends up overwhelmingly in profits for the
already wealthiest. The profl igacy of
government spending, especially steri le
defense spending, adds to the turbulence.
Symptoms of the metastasis are ubiquitous.
The instabil ity of international currencies. The
equitymarket pandemonium. The
commodities debacle (oil at the top of the list).
The creeping unemployment. The standsti l l of
labor income. The climbing indebtedness of

areppim: information, pure and simple
15 March 2016
http://stats.areppim.cominsight
© 2016 areppim AG, Bern, Switzerland 7
Table 1: Billionaires by nation, 2016.
both public and private economic agents. The
shrinking redistribution by the state. All of the
above impact the poor as well as the wealthy.
But they come harder on the regular consumer
and the regular taxpayer, rendering their l ives
more difficult and more precarious. Bil l ionaires,
as a caste, have demonstrated their power to
stand the test virtually unscathed.
areppim: information, pure and simple
15 March 2016
http://stats.areppim.cominsight
© 2016 areppim AG, Bern, Switzerland 8
Table 2: World billionaires trends 19962016.

areppim: information, pure and simple
15 March 2016
http://stats.areppim.cominsight
© 2016 areppim AG, Bern, Switzerland 9
Table 3: Billionaire's net worth as
percent of GDP.

areppim: information, pure and simple
15 March 2016
http://stats.areppim.cominsight
© 2016 areppim AG, Bern, Switzerland 10
References :
http://stats.areppim.com/rich.htm
see complete billionaire lists at http://stats.areppim.com/stats/links_billionairexlists.htm)
Table 4: World billionaires' wealth as percent of GWP.


![Q 4ÝNÇBg < Æ ¶ e D ,NÇ 6 >B9B · R&S RTO/p# ,ºFFT Õ73 ¾+^ mF? -$ =NÇ!ë ¸FPEý ¦ A NÇ ¶ eE¢ f 0 \ ¾J¾ /F? Ð,ºNÇ!ë ´ L t ]G](https://static.fdocuments.in/doc/165x107/6057bc76ac78692d9f118699/q-4nbg-e-d-n-6-b9b-rs-rtop-fft-73-mf-.jpg)