Lynn E. Browne and Eric S. Rosengren*
43
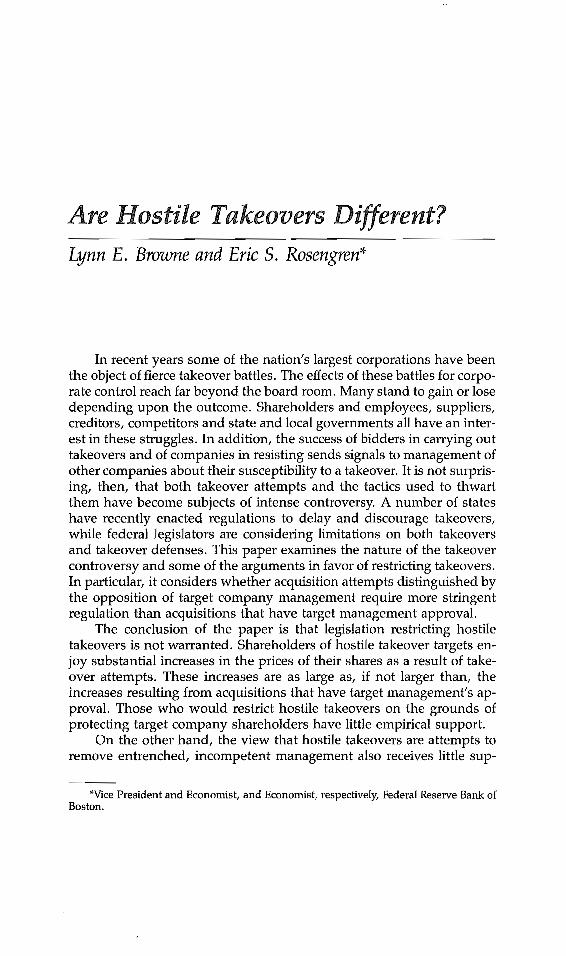
Lynn E. Browne and Eric S. Rosengren* In recent years some of the nation’s largest corporations have been the object of fierce takeover battles. The effects of these battles for corpo- rate control reach far beyond the board room. Many stand to gain or lose depending upon the outcome. Shareholders and employees, suppliers, creditors, competitors and state and local governments all have an inter- est in these struggles. In addition, the success of bidders in carrying out takeovers and of companies in resisting sends signals to management of other companies about their susceptibility to a takeover. It is not surpris- ing, then, that both takeover attempts and the tactics used to thwart them have become subjects of intense controversy. A number of states have recently enacted regulations to delay and discourage takeovers, while federal legislators are considering limitations on both takeovers and takeover defenses. This paper examines the nature of the takeover controversy and some of the arguments in favor of restricting takeovers. In particular, it considers whether acquisition attempts distinguished by the opposition of target company management require more stringent regulation than acquisitions that have target management approval. The conclusion of the paper is that legislation restricting hostile takeovers is not warranted. Shareholders of hostile takeover targets en- joy substantial increases in the prices of their shares as a result of take- over attempts. These increases are as large as, if not larger than, the increases resulting from acquisitions that have target management’s ap- proval. Those who would restrict hostile takeovers on the grounds of protecting target company shareholders have little empirical support. On the other hand, the view that hostile takeovers are attempts to remove entrenched, incompetent management also receives little sup- *Vice President and Economist, and Economist, respectively, Federal Reserve Bank of Boston.
Transcript of Lynn E. Browne and Eric S. Rosengren*
Lynn E. Browne and Eric S. Rosengren*
In recent years some of the nation’s largest corporations have beenthe object of fierce takeover battles. The effects of these battles for corpo-rate control reach far beyond the board room. Many stand to gain or losedepending upon the outcome. Shareholders and employees, suppliers,creditors, competitors and state and local governments all have an inter-est in these struggles. In addition, the success of bidders in carrying outtakeovers and of companies in resisting sends signals to management ofother companies about their susceptibility to a takeover. It is not surpris-ing, then, that both takeover attempts and the tactics used to thwartthem have become subjects of intense controversy. A number of stateshave recently enacted regulations to delay and discourage takeovers,while federal legislators are considering limitations on both takeoversand takeover defenses. This paper examines the nature of the takeovercontroversy and some of the arguments in favor of restricting takeovers.In particular, it considers whether acquisition attempts distinguished bythe opposition of target company management require more stringentregulation than acquisitions that have target management approval.
The conclusion of the paper is that legislation restricting hostiletakeovers is not warranted. Shareholders of hostile takeover targets en-joy substantial increases in the prices of their shares as a result of take-over attempts. These increases are as large as, if not larger than, theincreases resulting from acquisitions that have target management’s ap-proval. Those who would restrict hostile takeovers on the grounds ofprotecting target company shareholders have little empirical support.
On the other hand, the view that hostile takeovers are attempts toremove entrenched, incompetent management also receives little sup-
*Vice President and Economist, and Economist, respectively, Federal Reserve Bank ofBoston.
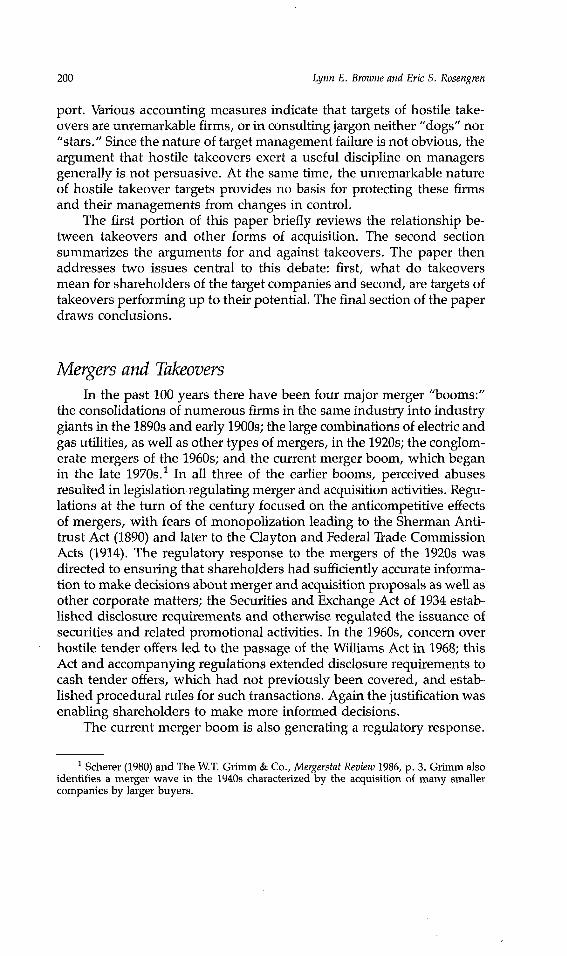
200 Lynn E. Browne and Eric S. Rosengren
port. Various accounting measures indicate that targets of hostile take-overs are unremarkable firms, or in consulting jargon neither "dogs" nor"stars." Since the nature of target management failure is not obvious, theargument that hostile takeovers exert a useful discipline on managersgenerally is not persuasive. At the same time, the unremarkable natureof hostile takeover targets provides no basis for protecting these firmsand their managements from changes in control.
The first portion of this paper briefly reviews the relationship be-tween takeovers and other forms of acquisition. The second sectionsummarizes the arguments for and against takeovers. The paper thenaddresses two issues central to this debate: first, what do takeoversmean for shareholders of the target companies and second, are targets oftakeovers performing up to their potential. The final section of the paperdraws conclusions.
Mergers and TakeoversIn the past 100 years there have been four major merger "booms:"
the consolidations of numerous firms in the same industry into industrygiants in the 1890s and early 1900s; the large combinations of electric andgas utilities, as well as other types of mergers, in the 1920s; the conglom-erate mergers of the 1960s; and the current merger boom, which beganin the late 1970s.~ In all three of the earlier booms, perceived abusesresulted in legislationregulating merger and acquisition activities. Regu-lations at the turn of the century focused on the anticompetitive effectsof mergers, with fears of monopolization leading to the Sherman Anti-trust Act (1890) and later to the Clayton and Federal Trade CommissionActs (1914). The regulatory response to the mergers of the 1920s wasdirected to ensuring that shareholders had sufficiently accurate informa-tion to make decisions about merger and acquisition proposals as well asother corporate matters; the Securities and Exchange Act of 1934 estab-lished disclosure requirements and otherwise regulated the issuance ofsecurities and related promotional activities. In the 1960s, concern overhostile tender offers led to the passage of the Williams Act in 1968; thisAct and accompanying regulations extended disclosure requirements tocash tender offers, which had not previously been covered, and estab-lished procedural rules for such transactions. Again the justification wasenabling shareholders to make more informed decisions.
The current merger boom is also generating a regulatory response.
1 Scherer (1980) and The W.T. Grimm & Co., Mergerstat Review 1986, p. 3. Grimm alsoidentifies a merger wave in the 1940s characterized by the acquisition of many smallercompanies by larger buyers.

ARE HOSTILE TAKEOVERS DIFFERENT? 201
Many states have already passed antitakeover legislation.2 Other states,as well as federal lawmakers, are considering legislation that wouldmake hostile takeovers more difficult. The model for many of the mostrecent legislative proposals is the Control Share Acquisitions Chapter ofthe Indiana Business Corporation Law, the legality of which was upheldby the U.S. Supreme Court in April 1987. Under the Indiana Act, theacquisition of shares in Indiana corporations above certain thresholdsdoes not automatically include the voting rights normally associatedwith these shares. The transfer of voting rights must be approved by amajority of shareholders, not including the bidder or inside directorsand officers of the target company. By its requirement of a shareholders’meeting, the Indiana Act stretches out the time required to consummatea tender offer and makes the outcome of a hostile offer more uncertain.The requirement of shareholder approval of voting rights does not applyif the acquisition is part of a merger agreement, in other words, if it hasthe support of the target’s l~anagement and board of directors.
What distinguishes the current regulatory thrust is the focus onhostile takeovers. As the Indiana Act illustrates, most of the antitake-over proposals would not affect mergers or other acquisitions supportedby target management. They are directed at hostile takeovers, especiallytender offers opposed by target management. While the Williams Actwas also prompted by hostile tender offers, its effect was to ensure thatthe disclosure requirements governing such transactions were compara-ble to those for other forms of acquisitions. In contrast, current legisla-tion seems designed to discourage hostile tender offers by makingacquisitions that are opposed by target management more difficult thanthose that have its approval.
What Constitutes a Hostile Takeover
Firms can be acquired by merger, purchase of assets, proxy fight, ortender offer. The method chosen depends upon such factors as the atti-tude of the target company’s management, taxes on shareholders ofboth companies, the time required to complete the acquisition, and costsof the acquisition. A merger occurs when the boards of directors of.bothcompanies agree to combine. A vote of the shareholders of the targetcompany and, sometimes, of the acquiring company is required to con-summate the merger. Since shareholders generally vote with manage-ment, the outcome of the vote is usually a foregone conclusion. Apurchase of assets also requires the agreement of target managementand, if a major portion of the firm’s assets is to be purchased, the ap-
2 An article by Robert Lenzner in the Boston Globe, July 9, 1987, counted over 20 stateswith antitakeover legislation.
202 Lynn E. Browne and Eric S. Rosengren
proval of target shareholders.Most bidders seeking to acquire a company would prefer the coop-
eration of the incumbent management. Friendly management is morelikely to disclose "skeletons" that may not appear on financial statementsand to help make the change in c.ontrol go smoothly. Target managementmay also be an important asset--one of the reasons the bidder wantedthe company in the first place.
Sometimes, however, a bidder faces opposition from target manage-ment and sometimes a bidder does not place great value on target man-agement’s support. Under these circumstances the bidder may bypasstarget management and go directly to the shareholders with a tenderoffer. In a tender offer, the bidder announces his willingness to purchaseshares of the target company on the open market; to induce sharehold-ers to sell, a premium over the current market price is usually offered.Engaging in a proxy fight is also an option for a bidder facing manage-ment opposition to an acquisition proposal. However, proxy fights,which are determined by shareholder vote, are difficult to win becauseso many shareholders routinely vote with management. They can alsobe very expensive. While proxy fights were used in the 1950s, the tenderoffer has been the preferred mechanism for making hostile takeovers forthe past 25 years.
Although tender offers are used to accomplish hostile takeovers, byno means are all tender offers hostile. Since no shareholder meeting isrequired, tender offers can be completed quite rapidly. Thus, if time is animportant consideration, a tender offer may be an advantageous meansof effecting a combination even when target management has been in-volved in the negotiations and supports the transaction.
While not all tender offers are hostile, not all mergers are friendly--even though mergers require a shareholder vote and shareholders com-monly vote with management. The fact that a bidder has the option ofresorting to a tender offer if merger discussions break down can leadtarget management to acquiesce to mergers that it might otherwise op-pose. The point is simply that what constitutes a hostile takeover at-tempt is not always clear-cut. Target management may know one whenit sees one, but the researcher looking at merger and acquisition statisticsmay have difficulty. In the following discussion, contested tender offersare taken to represent hostile takeovers. Tender offers that were notcontested by target management are not considered hostile, eventhough they may have been unwelcome.
Hostile Takeovers in the Current Merger BoomContested tender offers account for a very small fraction of mergers
and acquisitions and a very small fraction of the recent increase in merg-

ARE HOSTILE TAKEOVERS DIFFERENT? 203
Table 1Merger and Acquisition Announcements, 1976-86
Privately PubliclyNet Owned Foreign Traded Tender Offersa
Year Announcements Divestitures Sellers Sellers Sellers Total Contested
1976 2,276 1,204 856 53 163 70 181977 2,224 1,002 971 58 193 69 101978 2,106 820 969 57 260 90 271979 2,128 752 1,049 79 248 106 261980 1,889 666 988 62 173 53 121981 2,395 830 1,330 67 168 75 281982 2,346 875 1,222 69 180 68 291983 2,533 932 1,316 95 190 37 111984 2,543 900 1,351 81 211 79 181985 3,001 1,218 1,358 89 336 84 321986 3,336 1,259 1,598 93 386 150 40
alncluded in publicly traded sellers.Source: The W.T. Grimm & Co., Mergerstat Review 1986.
er and acquisition activity. Table 1 compares the pattern of merger andacquisition announcements by major category over the period from 1976to 1986. As can be seen from the table, announcements of mergers andacquisitions rose sharply from 1980, with all categories contributing tothe increase. Total tender offers and contested tender offers more thandoubled between 1976 and 1986, with much of the increase coming in1986. Even so, tender offers accounted for fewer than 5 percent of totalacquisition announcements in 1986 and contested tender offers just over1 percent. Why then all the fuss?
One answer is size. Almost half of all acquisitions involve the pur-chase of privately owned companies. These are generally quite small,although the size is increasing. According to Mergerstat Review, the aver-age purchase price in 1986 for those private companies for which suchinformation was available--presumably the largest--was $40 million. Incontrast, the average purchase price for publicly traded companies,which include targets of tender offers, was $255 million. The averagepurchase price for divestitures, the second largest acquisition category,was also considerably smaller than the average for publicly traded com-panies. The larger the company the more people--managers, employ-ees, investors, suppliers--who might be affected by a change inownership and the greater the attention the acquisition will receive inthe press.
Not only are publicly traded companies larger than other acquisi-tions, but also the targets of tender offers are larger than other publiclytraded targets. Table 2 shows the average market value in 1983 and 1984

204 Lynn E. Browne and Eric S. Rosengren
Table 2Average Market Value in 1983 and 1984 of Companies Trading on the MajorExchanges That Were Targets of Takeover Attempts in 1985
Number of Average Market ValueTarget (Millions of Dollars)
Nature of Attempt Companiesa 1984 1983
All Attempts 133 692.4 (111)b 578.2 (129)b
Tender Offers 49 1532.2 (39) 1139.5 (48)Uncontested 29 1072.4 (20) 834.0 (29)Contested 20 2016.2 (19) 1605.9 (19)Contested, excludingRefining Companies 17 485.8 (16) 460.9 (16)
Mergers and Other Offers,Excluding Tenders 84 237.4 (72) 245.5 (81)
Private by Management 23 162.5 (20) 164.4 (22)Mergers 61 266.3 (52) 275.7 (59)
aTarget companies consist of (1) companies that were removed from the CRSP files in 1985 because theywere acquired in a transaction that appears in the Transactions Roster of either the 1984 or 1985 volumesof Mergerstat Review and (2) companies appearing in the CRSP files that were targets of unsuccessfulacquisition attempts according to the 1985 volume of Mergerstat Review.bNumber of companies with data for that year.Source: CRSP Stock Files, Center for Research in Security Prices, University of Chicago, 1987; Merger-stat Review, various issues.
of companies trading on the New York or American stock exchanges that(1) were acquired in 1985 in a transaction reported in Mergerstat Review in1984 or 1985 or (2) were targets of an unsuccessful acquisition attemptreported in Mergerstat Review 1985.3 (Limiting the sample to companiestrading on the major exchanges increases the average size.) The compa-nies are grouped according to whether they were targets of contestedtender offers, uncontested tender offers, acquisitions in which the bid-ding entity was a private group including company management (pri-vate by management), and mergers and any other forms of acquisition(mergers). Companies that were targets of more than one acquisitionattempt in this period are classified according to the initial announce-ment. Tender offers by company management are considered uncontest-ed tender offers.
Targets of tender offers were larger than companies taken private bytheir management or acquired in mergers. The average market value ofcompanies that were targets of tender offers was over a billion dollars;
3 More specifically the companies shown in table 2 consist of (1) companies that wereremoved from the CRSP files in 1985 because they were acquired in a transaction thatappears in the Transactions Roster of either the 1984 or 1985 volumes of Mergerstat Reviewand (2) companies appearing in the CRSP files that were targets of unsuccessful acquisi-tion attempts according to the 1985 issue of Mergerstat Review. The CRSP Stock Files areproduced by the Center for Research in Security Prices, University of Chicago.
ARE HOSTILE TAKEOVERS DIFFERENT? 205
the average market value of companies targeted in other acquisitionattempts was less than one-quarter of a billion. The average size of tar-gets of contested tender offers was roughly double that of companiesreceiving tender offers that were not contested. Among the contestedgroup were three refining companies with very large market values; buteven excluding these three, targets of contested tender offers were stilllarger than companies that were targets of merger proposals or thatmanagement attempted to take private.
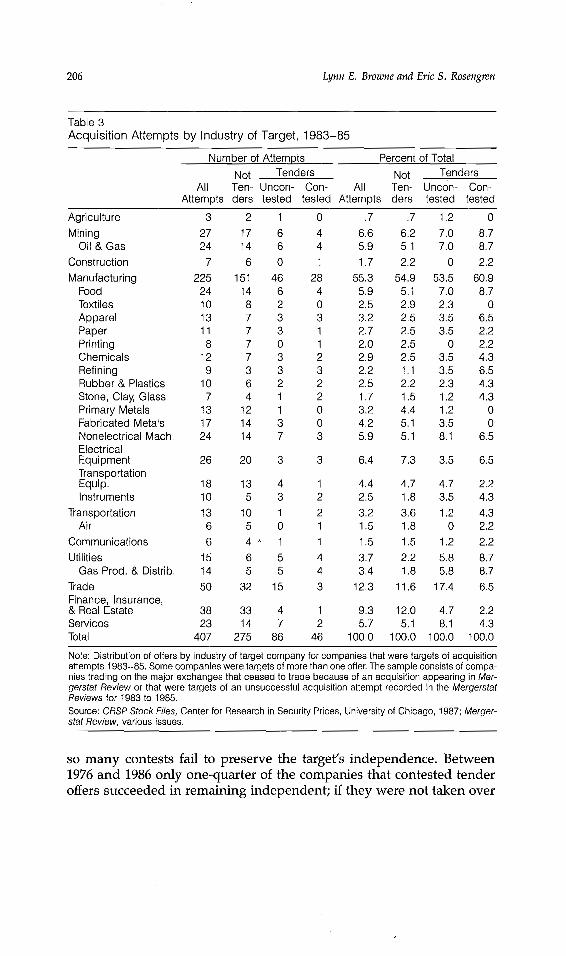
The three refining companies that were targets of contested tenderoffers were the only firms in table 2 that were members of this industry.Since hostile takeovers were so few in number this concentration in asingle industry is striking. However, an examination of acquisition pat-terns by industry over several years suggests that the usual pattern isnot markedly different for hostile takeovers than for other types of acqui-sition. Table 3 shows the distribution of offers made from 1983 to 1985 forcompanies trading on the major exchanges, according to the industry ofthe target company. (Some companies were targets of several acquisitionoffers and consequently appear in the table more than once.) As can beseen, contested tender offers were more concentrated in oil and gasrelated activities--exploration and development, refining, utilities--than acquisitions generally. Contested tender offers were also more con-centrated in manufacturing and they were relatively infrequent in thetrade and the finance, insurance and real estate industries. However,the differences do not seem dramatic.
Michael Jensen and others have suggested that hostile takeoversoccur in response to a need for restructuring in an industry, with the oilindustry providing a particularly good example of a radical change inenvironment leading to an increase in takeover attempts. The figures intable 3 indicate that while such a view has some basis as regards oil andgas, hostile takeovers are not confined to a few industries in the throesof deregulation or otherwise undergoing major changes. Of course, itmay simply be that many industries have encountered unusual competi-tive pressures in recent years. In any event, the distribution of hostiletakeovers is fairly similar to that of other acquisitions. This similaritymay itself explain why such a small number of transactions generatessuchwidespread concern. If hostile takeovers were concentrated in justa few industries, only those involved with these industries need beconcerned about the possibility of a takeover; everyone else could restsecure. If hostile takeovers are widely distributed, no one is safe.
Finally, it is important to recognize that the number of contestedtender offers understates the number of unwelcome offers. Probably asubstantial fraction of uncontested tender offers, and possibly of mergerovertures as well, are not welcomed by target management. Some ofthese acquisition attempts might be contested were it not for the fact that
206 Lynn E. Browne and Eric S. Rosengren
Table 3Acquisition Attempts by Industry of Target, 1983-85
Number of Attempts
AgricultureMining
Oil & GasConstructionManufacturing
FoodTextilesApparelPaperPrintingChemicalsRefiningRubber & PlasticsStone, Clay, GlassPrimary MetalsFabricated MetalsNonelectrical Mach,ElectricalEquipmentTransportationEquip,Instruments
TransportationAir
CommunicationsUtilities
Gas Prod. & Distrib.TradeFinance, Insurance,& Real EstateServicesTotal
Not TendersAll Ten- Uncon- Con-
Attempts ders tested tested
3 2 1 027 17 6 424 14 6 4
7 6 0 1225 151 46 2824 14 6 410 8 2 013 7 3 311 7 3 18 7 0 1
12 7 3 29 3 3 3
10 6 2 27 4 1 2
13 12 1 017 14 3 024 14 7 3
Percent of TotalNot Tenders
All Ten- Uncdn- Con-Attempts ders tested tested
,7 .7 1.2 06.6 6.2 7.0 8.75.9 5.1 7,0 8,71.7 2.2 0 2.2
55.3 54.9 53.5 60.95.9 5.1 7.0 8.72.5 2.9 2.3 03.2 2.5 3.5 6.52.7 2.5 3.5 2.22.0 2.5 0 2.22.9 2.5 3.5 4.32.2 1.1 3.5 6.52.5 2.2 2.3 4.31.7 1.5 1.2 4,33,2 4.4 1.2 04.2 5.1 3.5 05,9 5.1 8.1 6.5
26 20 3 3 6.4 7.3 3.5 6.5
18 13 4 1 4.4 4.7 4.7 2.210 5 3 2 2.5 1.8 3.5 4.313 10 1 2 3.2 3.6 1.2 4.36 5 0 1 1.5 1,8 0 2.26 4 " 1 1 1.5 1.5 1.2 2.2
15 6 5 4 3.7 2.2 5.8 8.714 5 5 4 3.4 1.8 5.8 8.750 32 15 3 12.3 11.6 17.4 6.5
38 33 4 1 9,3 12.0 4.7 2.223 14 7 2 5.7 5,1 8,1 4.3
407 275 86 46 100.0 100.0 100.0 100.0Note: Distribution of offers by industry of target company for companies that were targets of acquisitionattempts 1983-85. Some companies were targets of more than one offer. The sample consists of compa-nies trading on the major exchanges that ceased to trade because of an acquisition appearing in Mer-gerstat Review or that were targets of an unsuccessful acquisition attempt recorded in the MergerstatReviews for 1983 to 1985.Source: CRSP Stock Files, Center for Research in Security Prices, University of Chicago, 1987; Merger-stat Review, various issues.
so many contests fail to preserve the target’s independence. Between1976 and 1986 only one-quarter of the companies that contested tenderoffers succeeded in remaining independent; if they were not taken over
ARE HOSTILE TAKEOVERS DIFFERENT? 207
by the initial bidder they were acquired by a third party.4 Moreover, for anumber of companies that did succeed in remaining independent, theprice of independence was severe cost-cutting or the sale of major por-tions of their business.
Although the large size of the targets of hostile takeovers and thefact that no industry is immune mean that the economic significance oftakeovers is greater than their numbers would suggest, this is not reasonto treat them differently from other forms of acquisition. The followingsection summarizes the central issues in the dispute over whether take-overs should be restricted.
What Is Wrong/Right with Takeovers?Discussions of whether or not takeovers should be restricted are
often mixed up with discussions of the positive and negative conse-quences of mergers in general. Do mergers "work:" Is the resulting entitymore competitive and more profitable? What is the source of any in-creased profitability? Is too much debt incurred in the acquisition pro-cess? What will be the impact on employees? However, while the debateoften follows these lines, much of the opposition to hostile takeoversseems to derive less from the adverse consequences of corporate combi-nations than from the mechanism whereby combinations occur andfrom the relationship between acquirer and acquired. Among the mostvociferous critics of hostile takeovers are some of the chief executives oflarge companies that have been active participants in the merger andacquisition process, although as bidders rather than targets. Clearly theyare not opposed to acquisitions in general. Moreover, most antitakeoverlegislation does not address problems arising from acquisitions in gener-al; it would not preclude friendly combinations. It is directed only atacquisition attempts opposed by management of the target company.
Why should the opposition of target management be the basis forimposing more stringent requirements on an acquisition attempt? Man-agers typically defend their opposition to takeover proposals on thegrounds that the offers are inadequate. The true value of the companyexceeds the value offered and in opposing the proposal, management isacting in the shareholders’ interests. The protection of shareholders isalso the ostensible purpose of recent antitakeover legislation. Propo-nents of the Indiana Act argue that it enables shareholders to decidecollectively upon the desirability of a change in control; in particular, theAct is said to permit a more considered response to potentially coercivetwo-tier and partial tender offers. This view was apparently accepted by
4 Mergerstat Review 1986, p. 79.
208 Lynn E. Browne and Eric S. Rosengren
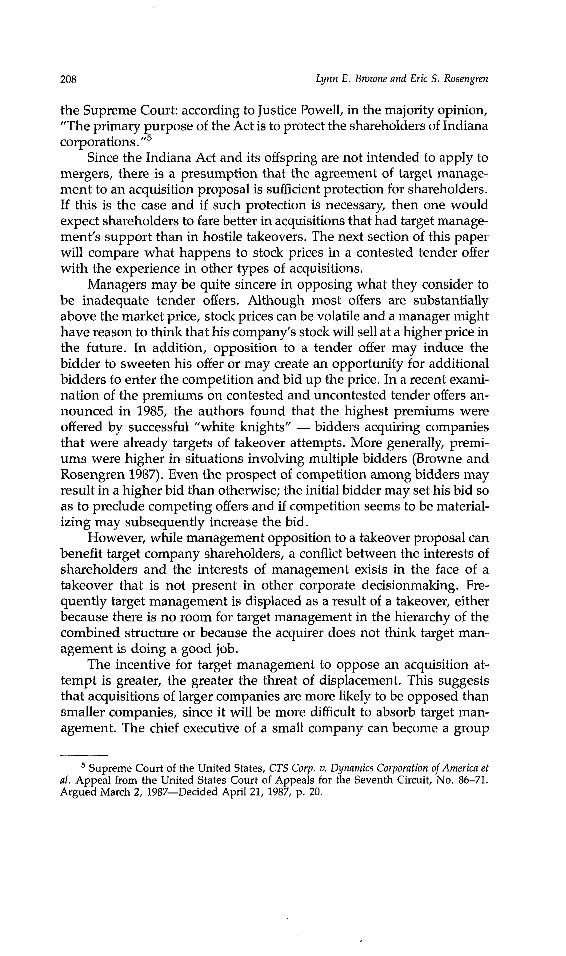
the Supreme Court: according to Justice Powell, in the majority opinion,"The primary purpose of the Act is to protect the shareholders of Indianacorporations. ,,5
Since the Indiana Act and its offspring are not intended to apply tomergers, there is a presumption that the agreement of target manage-ment to an acquisition proposal is sufficient protection for shareholders.If this is the case and if such protection is necessary, then one wouldexpect shareholders to fare better in acquisitions that had target manage-ment’s support than in hostile takeovers. The next section of this paperwill compare what happens to stock prices in a contested tender offerwith the experience in other types of acquisitions.
Managers may be quite sincere in opposing what they consider tobe inadequate tender offers. Although most offers are substantiallyabove the market price, stock prices can be volatile and a manager mighthave reason to think that his company’s stock will sell at a higher price inthe future. In addition, opposition to a tender offer may induce thebidder to sweeten his offer or may create an opportunity for additionalbidders to enter the competition and bid up the price. In a recent exami-nation of the premiums on contested and uncontested tender offers an-nounced in 1985, the authors found that the highest premiums wereoffered by successful "white knights" -- bidders acquiring companiesthat were already targets of takeover attempts. More generally, premi-ums were higher in situations involving multiple bidders (Browne andRosengren 1987). Even the prospect of competition among bidders mayresult in a higher bid than otherwise; the initial bidder may set his bid soas to preclude competing offers and if competition seems to be material-izing may subsequently increase the bid.
However, while management opposition to a takeover proposal canbenefit target company shareholders, a conflict between the interests ofshareholders and the interests of management exists in the face of atakeover that is not present in other corporate decisionmaking. Fre~quently target management is displaced as a result of a takeover, eitherbecause there is no room for target management in the hierarchy of thecombined structure or because the acquirer does not think target man~agement is doing a good job.
The incentive for target management to oppose an acquisition at-tempt is greater, the greater the threat of displacement. This suggeststhat acquisitions of larger companies are more likely to be opposed thansmaller companies, since it will be more difficult to absorb target man~agement. The chief executive of a small company can become a group
5 Supreme Court of the United States, CTS Corp. v. Dynamics Corporation of America etal. Appeal from the United States Court of Appeals for the Seventh Circuit, No. 86-71.Argued March 2, 1987 Decided April 21, 1987, p. 20.

ARE HOSTILE TAKEOVERS DIFFERENT? 209
vice-president within a larger entity with no loss of prestige or salary;but how many companies--no matter how large--have room for two"captains of industry"? By this reasoning, one might also expect acquisi-tions of companies that are performing poorly, since target managementcould expect to be judged inadequate. Thus, opposition to a takeovercould be an admission of poor management.
Whether or not target management considers itself to be inad-equate, the fact that a bidder makes a tender offer without engaging innegotiations with management may foster opposition. Such a tenderoffer is a statement that at least one entity--the bidder--views the targetcompany as not performing up to its potential and, further, that thesupport of target management is not necessary to achieve a better per-formance. Such a statement obviously will not sit well with target man-agement. However, to the extent that it is an accurate assessment,shareholders will be better off if the company is taken over than if itremains independent. At least from a shareholder’s perspective, onewould not wish to make such takeovers more difficult or less certain inoutcome.
Equally importantly, if targets of hostile takeovers are not maximiz-ing shareholder returns, takeovers may benefit not only the sharehold-ers of the targets but also those of other companies. Managers of othercompanies will see that poor performance increases their companies’vulnerability to takeover and will, therefore, have an added incentive toachieve good results for their shareholders. Those who oppose restric-tions on takeovers typically hold this view, arguing that takeovers notonly result in gains to shareholders of the target companies but alsoexert a useful discipline on managers to the benefit of the economy as awhole.
This position does assume, however, that good performance can bediscerned fairly readily: targets of hostile takeovers must be recognizedto be performing below their potential if takeovers are to have a salutoryeffect on firm management in general. Moreover, if targets of hostiletakeovers are not underperforming--or are underperforming accordingto criteria apparent only to the bidder hostile takeovers will appear tomanagers as random "bolts from the blue." In this case, takeovers willnot provide positive incentives, as management will not see servingtheir shareholders" interests as protecting them from takeovers. Indeed,takeovers may have a negative effect, as managers may be led to protectthemselves in other ways. At a minimum, defensive activities distractmanagement’s attention from running the company, and in some casesthey may actually be harmful, as when management embarks on its ownacquisition program simply to make the company too big to swallow.
A later section of this paper will compare the performance of com-panies that were targets of contested tender offers and companies in-
2!0 Lynn E. Browne and Eric S, Rosengren
volved in other types of acquisition attempts. It will also discuss some ofthe ambiguities surrounding the concept of good performance.
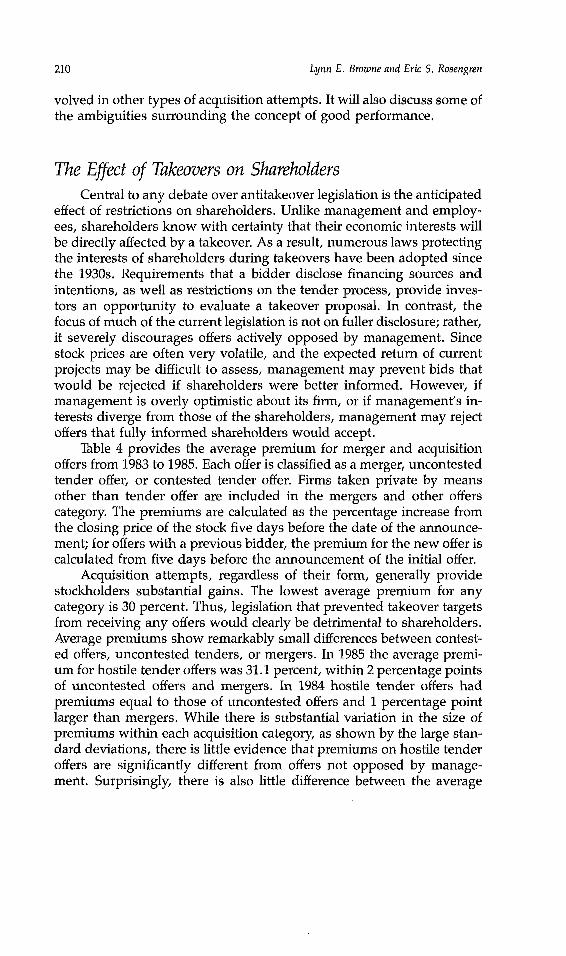
The Effect of Takeovers on ShareholdersCentral to any debate over antitakeover legislation is the anticipated
effect of restrictions on shareholders. Unlike management and employ-ees, shareholders know with certainty that their economic interests willbe directly affected by a takeover. As a result, numerous laws protectingthe interests of shareholders during takeovers have been adopted sincethe 1930s. Requirements that a bidder disclose financing sources andintentions, as well as restrictions on the tender process, provide inves-tors an opportunity to evaluate a takeover proposal. In contrast, thefocus of much of the current legislation is not on fuller disdosure; rather,it severely discourages offers actively opposed by management. Sincestock prices are often very volatile, and the expected return of currentprojects may be difficult to assess, management may prevent bids thatwould be rejected if shareholders were better informed. However, ifmanagement is overly optimistic about its firm, or if management’s in-terests diverge from those of the shareholders, management may rejectoffers that fully informed shareholders would accept.
Table 4 provides the average premium for merger and acquisitionoffers from 1983 to 1985. Each offer is classified as a merger, uncontestedtender offer, or contested tender offer. Firms taken private by meansother than tender offer are included in the mergers and other offerscategory. The premiums are calculated as the percentage increase fromthe closing price of the stock five days before the date of the announce-ment; for offers with a previous bidder, the premium for the new offer iscalculated from five days before the announcement of the initial offer.
Acquisition attempts, regardless of their form, generally providestockholders substantial gains. The lowest average premium for anycategory is 30 percent. Thus, legislation that prevented takeover targetsfrom receiving any offers would clearly be detrimental to shareholders.Average premiums show remarkably small differences between contest-ed offers, uncontested tenders, or mergers. In 1985 the average premi-um for hostile tender offers was 31.1 percent, within 2 percentage pointsof uncontested offers and mergers. In 1984 hostile tender offers hadpremiums equal to those of uncontested offers and 1 percentage pointlarger than mergers. While there is substantial variation in the size ofpremiums within each acquisition category, as shown by the large stan-dard deviations, there is little evidence that premiums on hostile tenderoffers are significantly different from offers not opposed by manage-ment. Surprisingly, there is also little difference between the average
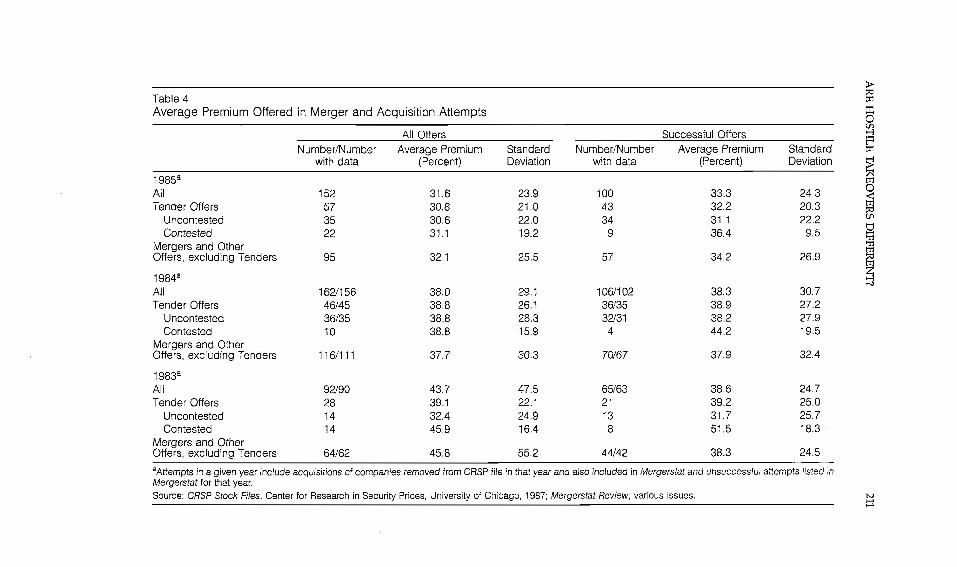
Table 4Average Premium Offered in Merger and Acquisition Attempts
All Offers Successful OffersNumber/Number Average Premium Standard Number/Number Average Premium Standard
with data (Percent) Deviation with data (Percent) Deviation
1985a
All 152 31.6 23.9 100 33.3 24.3Tender Offers 57 30.8 21.0 43 32.2 20.3
Uncontested 35 30.6 22.0 34 31.1 22.2Contested 22 31.1 19.2 9 36.4 9.5
Mergers and OtherOffers, excluding Tenders 95 32.1 25,5 57 34.2 26.9
1984aAll 162/156 38.0 29.1 106/102 38.3 30,7Tender Offers 46/45 38.8 26.1 36/35 38,9 27.2
Uncontested 36/35 38.8 28.3 32/31 38.2 27.9Contested 10 38.8 15.9 4 44.2 19.5
Mergers and OtherOffers, excluding Tenders 116/111 37.7 30.3 70/67 37,9 32.4
1983aAll 92/90 43.7 47.5 65/63 38.6 24.7Tender Offers 28 39.1 22.1 21 39.2 25.0
Uncontested 14 32.4 24.9 13 31.7 25.7Contested 14 45.9 16.4 8 51.5 18.3
Mergers and OtherOffers, excluding Tenders 64/62 45.8 55.2 44/42 38.3 24.5
aAttempts in a given year include acquisitions of companies removed from CRSP file in that year and also included in Mergerstat and unsuccessful attempts listed inMergerstat for that year.Source: CRSP Stock Files, Center for Research in Security Prices, University of Chicago, 1987; Mergerstat Review, various issues.

212 Lynn E. Browne and Eric S. Rosengren
premium on successful offers and that on all offers, indicating that evenunsuccessful acquisition attempts generally offer substantial premiumsto stockholders.
While table 4 suggests that there is little difference in premiumsbetween offers opposed by management and those without active oppo-sition, it fails to control for several variables that could substantiallyaffect the size of the premium. Premiums applied to only a fraction ofthe target shares, particularly those that provide a controlling interest inthe company, may be higher than bids for all outstanding shares. Move-ments in the general level of stock prices around the time of the offermay influence the bid. Since stocks tend to move in conjunction with themarket portfolio, failing to control for the movement in the market indexat the time of the announcement could bias the results. Finally, theriskiness of the target stock may affect the size of the premium. Sincemovements in the market portfolio cannot be diversified away, stocksthat move together with the market, frequently referred to as high betastocks, subject the investor to greater risk. Our event study, a techniquewidely used in the finance literature, controls for these factors.
Event studies are an application of the capital asset pricing model.Using a simple model of stock returns, a forecast of what the returnwould have been in the absence of an event is compared with the actualreturn. The difference between the forecasted return and the actual re-turn is attributed to the event. Equation 1 summarizes the calculation ofexcess returns, the difference between the actual return and the forecast-ed return after controlling for movement in the market portfolio and theriskiness of the stock.
(1) ERit = Rit - ai - bi Rmt
where Rit = return on stock i for day tRmt = return on the market portfolio for day t
ai = constant, estimated from a period prior to the eventbi = beta of stock i, measure of non-diversifiable risk,
estimated from a period prior to the eventIt is assumed that the forecast errors are not attributable to other
events possibly occurring at the same time or to a badly specified fore-casting model. The latter assumption is particularly important. Whilethe "true" market portfolio is unobservable, this study, like most eventstudies, uses the value-weighted New York and American Stock Ex-change index as a proxy for the market portfolio. Roll (1977) has shownthat applying the Capital Asset Pricing Model with the wrong index canbias the results; however, it is assumed that using the value-weightedindex as a proxy for the "true" market portfolio does not introduce sig-nificant biases into the study. It is also assumed that ai and bi are stableand are not sensitive to the arbitrary choice of estimation period. In this
ARE HOSTILE TAKEOVERS DIFFERENT? 213
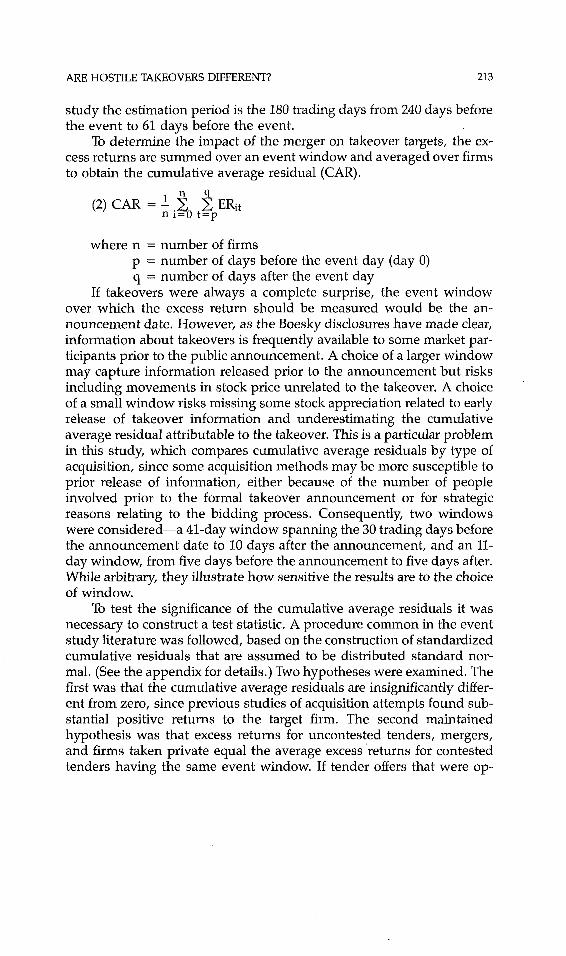
study the estimation period is the 180 trading days from 240 days beforethe event to 61 days before the event.
To determine the impact of the merger on takeover targets, the ex-cess returns are summed over an event window and averaged over firmsto obtain the cumulative average residual (CAR).
(2) CAR = ~i=~0 t__~pERit
where n -- number of firmsp = number of days before the event day (day 0)q = number of days after the event day
If takeovers were always a complete surprise, the event windowover which the excess return should be measured would be the an-nouncement date. However, as the Boesky disclosures have made clear,information about takeovers is frequently available to some market par-ticipants prior to the public announcement. A choice of a larger windowmay capture information released prior to the announcement but risksincluding movements in stock price unrelated to the takeover. A choiceof a small window risks missing some stock appreciation related to earlyrelease of takeover information and underestimating the cumulativeaverage residual attributable to the takeover. This is a particular problemin this study, which compares cumulative average residuals by type ofacquisition, since some acquisition methods may be more susceptible toprior release of information, either because of the number of peopleinvolved prior to the formal takeover announcement or for strategicreasons relating to the bidding process. Consequently, two windowswere considered--a 41-day window spanning the 30 trading days beforethe announcement date to 10 days after the announcement, and an 11-day window, from five days before the announcement to five days after.While arbitrary, they illustrate how sensitive the results are to the choiceof window.
To test the significance of the cumulative average residuals it wasnecessary to construct a test statistic. A procedure common in the eventstudy literature was followed, based on the construction of standardizedcumulative residuals that are assumed to be distributed standard nor-mal. (See the appendix for details.) Two hypotheses were examined. Thefirst was that the cumulative average residuals are insignificantly differ-ent from zero, since previous studies of acquisition attempts found sub-stantial positive returns to the target firm. The second maintainedhypothesis was that excess returns for uncontested tenders, mergers,and firms taken private equal the average excess returns for contestedtenders having the same event window. If tender offers that were op-
214 Lynn E. Browne and Eric S. Rosengren
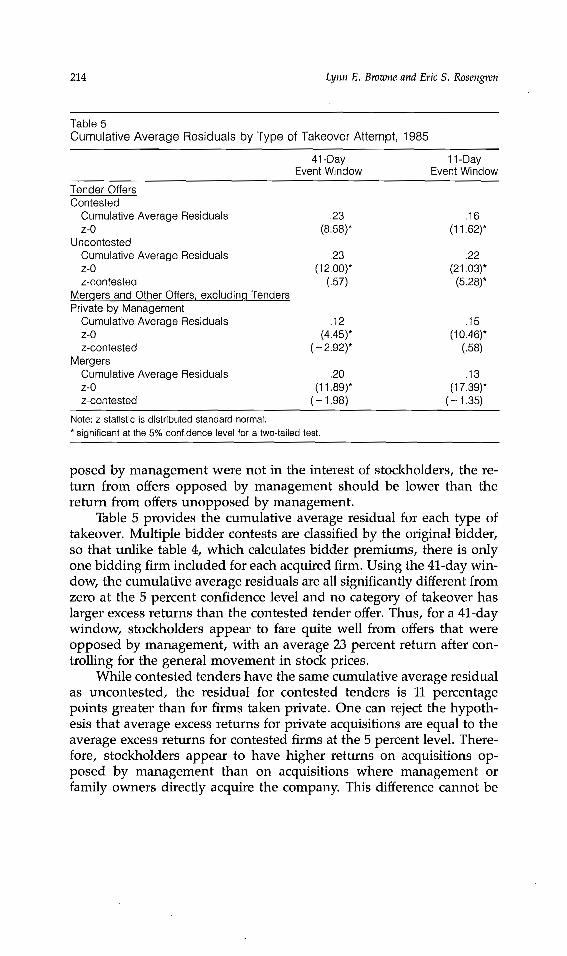
Table 5Cumulative Average Residuals by Type of Takeover Attempt, 1985
41-Day 11-DayEvent Window Event Window
Tender OffersContested
Cumulative Average Residuals .23 .16z-0 (8.58)* (11.62)*
UncontestedCumulative Average Residuals ,23 ,22z-0 (12.00)* (21.03)*z-contested (.57) (5.28)*
Mergers and Other Offers, excluding TendersPrivate by Management
Cumulative Average Residuals .12 .15z-0 (4.45)* (10.46)*z-contested (- 2.92)* (.58)
MergersCumulative Average Residuals .20 .13z-O (11.89)* (17.39)*z-conteste~l (- 1.98) (- 1.35)
Note: z statistic is distributed standard normal,* significant at the 5% confidence level for a two4ailed test,
posed by management were not in the interest of stockholders, the re-turn from offers opposed by management should be lower than thereturn from offers unopposed by management.
Table 5 provides the cumulative average residual for each type oftakeover. Multiple bidder contests are classified by the original bidder,so that unlike table 4, which calculates bidder premiums, there is onlyone bidding firm included for each acquired firm. Using the 41-day win-dow, the cumulative average residuals are all significantly different fromzero at the 5 percent confidence level and no category of takeover haslarger excess returns than the contested tender offer. Thus, for a 41-daywindow, stockholders appear to fare quite well from offers that wereopposed by management, with an average 23 percent return after con-trolling for the general movement in stock prices.
While contested tenders have the same cumulative average residualas uncontested, the residual for contested tenders is 11 percentagepoints greater than for firms taken private. One can reject the hypoth-esis that average excess returns for private acquisitions are equal to theaverage excess returns for contested firms at the 5 percent level. There-fore, stockholders appear to have higher returns on acquisitions op-posed by management than on acquisitions where management orfamily owners directly acquire the company. This difference cannot be
ARE HOSTILE TAKEOVERS DIFFERENT? 215
explained by the probability that an initial offer is successful. Both con-tested tender offers and offers to go private have a 50 percent chance ofsuccess, and the returns over the 41-day window are very similar be-tween successful and unsuccessful takeover attempts.
One possible reason for the higher premiums is that contestedtender offers are more likely to become multiple-bidder contests. Rough-ly 40 percent of the contested tender offers attract additional bidderswhile approximately 30 percent of the private offers result in additionalbidders. Therefore, part of the excess return experienced by hostiletenders may reflect investors’ expectations of higher future bids. Con-tested tender offers that eventually became multiple-bidder contests hada cumulative average residual of 30 percent, while contested tendersthat remained single-bidder contests had a cumulative average residualof only 19 percent.
Using the 11-day window, the cumulative average residual for con-tested tender offers is larger than for mergers or for firms being takenprivate. However, uncontested tender offers have the highest cumula-tive average residual and the excess returns are significantly larger thanthe average excess returns for contested tender offers. The higher cumu-lative average residual for uncontested tenders may partly be explainedby differences in bidding strategies. In contested tender offers, earlyrelease of information about a tender offer may apply pressure on thetop management of the target firm and help to place the firm "in play." Inaddition, given management’s opposition, it may be more profitable tosell to a "white knight." Therefore, encouraging additional bidders maybe more rewarding than successfully acquiring the firm. Firms withoutactive opposition by management are much more likely to successfullyacquire the firm and may prefer to maintain secrecy to prevent addition-al bidders from entering the auction and driving up the price. If so, thecumulative average residual would follow the pattern we observe in thetable, with most of the increase in returns for uncontested offers occur-ring around the announcement, while relatively less of the total appre-ciation of the contested firm occurs around the announcement.
From a shareholder’s perspective, restricting tender offers that areopposed by management would be undesirable. In cases where existingmanagement is firmly entrenched, no offers may occur, thus deprivingthe shareholders of the appreciation in share prices that normally resultsfrom a takeover offer. Policies requiring management approval are alsolikely to discourage multiple-bidder contests, contests that frequentlyprovide the highest returns for shareholders. Acquisitions requiringmanagement approval, mergers and firms taken private by manage-ment, have lower average returns than tender offers that managementactively opposes. Thus, legislation that discourages offers not supportedby management are not likely to be in the best interests of shareholders.
216 Lynn E. Browne and Eric S. Rosengren
Characteristics of Targets of Hostile TakeoversAs was discussed above, there is some basis for thinking that targets
of hostile takeovers might be more poorly managed than companiesinvolved in friendlier acquisition attempts. If takeover targets are, infact, poorly managed, this poor performance is a powerful argumentagainst restricting hostile takeovers. Shareholders of potential targetswill suffer; current management will remain in place or, if a change incontrol does take place as a result of a merger, it will be on terms deter~mined by a management that has not represented shareholders well inthe past. Of perhaps even greater significance is the message that pro-tection of poor performers from possible displacement sends to manag-ers of other companies. Assessing what constitutes poor management isfar from simple, however.
One view-~commonly held by those opposed to restricting take-overs--is that stock prices are the best guides to performance. Stockprices embody all that is publicly known about both a firm’s currentcircumstances and its future prospects. If one thinks of the stock price asthe present value of the stream of earnings that an owner of a share ofstock can expect to receive, then a firm that has a promising future withrising earnings will have a higher stock price than one with the samecurrent earnings but a more negative outlook. In other words, the ratioof price to earnings will be higher for the first firm. It is management’sresponsibility to maximize share prices and thus, shareholder wealth.Poorly managed firms, according to this view, are firms with low stockprices and price-earnings ratios.
However, while the price-earnings ratio may provide some indica-tion of how investors see a firm’s future, the quality of management isnot the only factor that affects that future. The world may change inways that even the best management could not anticipate, brighteningthe future for some firms and darkening it for others. In addition, price-earnings ratios are only meaningful for firms with earnings in somenormal range. A firm may suffer losses, but the value of its shares willstill be positive, resulting in a negative price-earnings ratio; or a firmmay experience very small positive earnings, causing its price-earningsratio to be very large even though the firm’s prospects are not verypromising.
The book value of shareholders’ equity provides another basis forevaluating share prices. Comparing the ratios of price to book value (pershare) for different firms is equivalent to comparing the firms’ shareprices with what earnings would be if the firms all achieved the samereturn on equity. For example, if all firms earned a 12 percent return onequity, comparing the resulting price-earnings ratios would produce thesame results as comparing ratios of price to book value. Thus, the ratio

ARE HOSTILE TAKEOVERS DIFFERENT? 217
of price to book value can be seen as a price-earnings ratio in which thedenominator is not the firm’s actual earnings but what earnings wouldbe if the firm achieved some "normal" return on equity. A low price-to-book ratio could reflect either below-normal earnings today or normalcurrent earnings but an unpromising future.
In addition, a price-to-book ratio that is below one means that a firmcannot issue new stock without diluting the value of the’ holdings ofcurrent shareholders. This can be a deterrent to expansion, or at least tothe use of equity to expand. From the standpoint of those who see stockprices as providing accurate assessments of future prospects, a lowprice-to-book ratio indicates that a firm’s investment plans will not yieldsatisfactory returns and should be curtailed.
A more fundamental question is whether share prices are reason-ably valid representations of firms’ prospects. Despite a substantial lit-erature based on this view, many people believe that the stock market issubject to whims, fads and unfounded rumors and, consequently, thatshare prices are unreliable indicators of future earnings. To the extentthat there is some truth to this view, share prices are not useful guides towhether management is doing a good job. A low share price may meansimply that the firm in question is not "in;" perhaps there have been norecent developments to bring the firm to the attention of market partici-pants or perhaps the price has been discounted on the basis of rathersuperficial analysis.
However, even if stock prices are not good guides to managementperformance, they might still be good indicators of vulnerability to take-over. Share prices are, after all, prices; and the significance of a lowprice-earnings ratio or price-to-book ratio may not be so much that thefirm’s future looks bleak--at least under current management--as thatthe price of acquiring the firm’s assets and the associated stream ofearnings is low. In other words, the firm is cheap.
Various accounting ratios offer another approach to measuring theperformance of takeover targets. The problem with these is that theyshow only what the firm is doing today--or over some specified timehorizon--and performance at any one time may not be a good guide tothe future. Thus, earnings may be high today as a result of wise deci-sions by past managers; but today’s managers may have embarked on adifferent course. Conversely, the future may be bright even though earn-ings are low today. Indeed, many start-up companies encounter lossesin their early years. Some companies have highly cyclical earnings. Stockprices can capture both the present and what is known about the future.
The return on equity is one of the more common measures of firmperformance. It is also one that does not suffer from any ambiguityabout what is desirable. Higher is better. This is not true of some of theother standard accounting ratios. In particular, measures showing the
218 Lynn E. Browne and Eric S. Rosengren
use of financial resources may be subject to different interpretations.According to one view, companies with relatively large liquid assets andlow use of debt are likely to be takeover targets. These firms do not usetheir financial resources as efficiently as they might; by relying more heavi-ly on debt and reducing the proportion of their assets in low-yieldingworking capital they could achieve higher earnings. However, othersmight see these firms as prudently managed, particularly if the firmswere already achieving high earnings. High liquidity and low leverageprovide managers with flexibility in the event of a downturn and reducethe firm’s vulnerability to bankruptcy. These ambiguities suggest that anassessment of how well a firm is managed may depend upon one’sattitude towards risk.
One variant of the view that takeover targets are not managingfinancial resources efficiently is the free cash flow hypothesis developedby Jensen. "Free cash flow is cash flow in excess of that required to fundall projects that have positive net present values when discounted at therelevant cost of capital" (Jensen 1986, p. 323). Companies that generatesubstantial cash flows and that use these funds internally in low-valueuses rather than pay out the cash to shareholders will be targets oftakeovers. The share price will reflect the fact that the cash flow is goingto projects with lower returns than could be obtained elsewhere. A bid-der acquiring control of these companies can increase the share pricesimply by ceasing these low-value activities and paying out more cash.
Table 6 presents averages of financial ratios, representing some ofthese elements of performance, for the acquisition targets of table 2.Ratios in both 1984 and 1983 are shown for the 1985 targets. The financialratios vary greatly within acquisition categories and outlying observa-tions frequently result in large distortions. Consequently, the averagesin table 6 are based on the 50 percent of observations around the medianobservation in each acquisition category; in other words, they are aver-ages of the "normal" values for each acquisition category. The averagesfor all observations, along with associated standard deviations and thenumber of observations in each category, appear in the appendix. (Thenumber of observations is smaller than the number of target companiesas some financial variables were not available for some firms.)6
To provide some indication of what these financial ratios might looklike for firms that are not targets of acquisition attempts, the table alsoincludes the relevant ratios for "all industrials" from the Compustat in-dustry aggregates file. (To be included in this file, the firms must be
6 Also, financial reports for 1984 were not available in some cases. The annual dataprovided by the source, Compustat, are based on companies’ fiscal years. Data for compa-nies with fiscal years ending in the first five months of the calendar year are treated asoccurring in the previous calendar year. This is one reason why there are more observa-tions for 1983.

ARE HOSTILE TAKEOVERS DIFFERENT? 219
Table 6Financial Characteristics of 1985 Acquisition TargetsAverage Values for Middle Two Quartiles of Observation
inverse of Ratio of Cash Ratio of PriceMarket Value Price-Earn- Flow to to Book
Target ($ millions) ings Ratio Market Value Value1984 1983 1984 1983 1984 1983 1984 1983
Contested Tenders 425.8 429.5 .096 .086 .179 .170 1.11 1.15Uncontested Tenders 719.5 496.9 .087 ~084 .158 .138 1.36 1.45Private by Management 101,0 102.3 ,088 ~066 .146 .155 1.37 1.43Mergers 139.6 126,6 .093 ,066 .164 .129 1.22 1.39All excluding Contested 175.8 162.0 .090 ,072 .158 .137 1.29 1.41
All Industrials 621.7 671.2 .093 .072 .180 .149 1.44 1.58
inverse ofReturn on Coverage
Target Equity Pan’out Ratio Ratio1984 1983 1984 1983 1984 1983 1984
Contested Tenders .118 .096 .347 .329 .231 .247 .185Uncontested Tenders .138 .132 .315 .215 .197 .197 .159Private by Management .129 .114 .120 ,063 ,172 .141 .213Mergers ,117 ,096 .194 ,171 .217 ,265 ,179All excluding Contested .124 .110 .201 ,156 ,196 .219 .180
Leverage(Long-Term
Debt/Assets)
1983
.192.145.225.176.171
All Industrials .133 .113 .382 .438 .206 .215 .178 .169
CapitalExpenditures/
Target Liquidity Depreciation1984 1983 1984 1983
Contested Tenders 1.94 1.94 1.64 1.31Uncontested Tenders 1.84 2.18 1.81 1.62Private by Management 2.02 2.08 1.31 1.49Mergers 1.96 2,36 1.52 1.14All excluding Contested 2.05 2.23 1.56 1.33
R&D Expen-ditures/Sales
1984 1983
.014 .013
.015 .016
.009 .011
.022 ,019
.015 .015
All Industrials 1.56 1.61 1.76 1.55 n.a, n.a.
Source: Standard & Poor’s Compustat Services Inc.
followed regularly by Compustat and must meet certain size and indus-try representation criteria.) It should be noted, however, that the indus-trials" ratios are ratios of aggregate industry variables, while the ratiosfor the various acquisition categories are averages of individual firms’ratios.
The variables appearing in the table are as follows:(1) Total market value, calculated as the calendar year closing price
(Compustat data item 24) multipled by the number of common shares

220 Lynn E. Browne and Erie S. Rosengren
outstanding (item 25).(2) Inverse of the price-earnings ratio, calculated by dividing income
before extraordinary items adjusted for common stock equivalents (item20) by the market value. The higher the price-earnings ratio, the lowerwill be the inverse.
(3) Cash flow, defined as income before extraordinary items (item18) plus depreciation (item 14), relative to market value. This was includ-ed on the grounds that cash flow might be a more meaningful indicatorthan income of the stream of funds available to those controlling thecorporation.
(4) Price relative to book value, calculated as the market value rela-tive to common equity (item 60).
(5) Return on equity, or income before extraordinary items adjustedfor common stock equivalents relative to common equity.
(6) Payout ratio, or the ratioof common dividends (item 21) to incomebefore extraordinary items adjusted for common stock equivalents.
(7) Inverse of the coverage ratio, or interest (item 15) relative to thesum of interest and pre-tax income (item 70). The lower the interestrelative to interest and pre-tax income, or conversely the higher thecoverage ratio, the more debt the company can carry without experienc-ing difficulties. Bond indentures often specify minimum coverage ratios.Thus, a higher coverage ratio may make a firm an attractive takeovertarget, while a very low coverage ratio may be an indicator of a firm infinancial difficulty.
(8) Longmterm debt (item 9) relative to total assets (item 6), a mea-sure of leverage. A low value would indicate that a firm could assumemore debt.
(9) Current assets (item 4) relative to current liabilities (item 5), ameasure of liquidity.
(10) Capital expenditures (item 30) relative to depreciation.(11) Research and development expenditures (item 46) relative to
sales (item 12).The last two items are included because opponents of takeovers
have claimed that fear of takeovers causes firms to focus on increasingearnings in the short run to the detriment of the long run. By implica-tion, firms that are targets of hostile takeovers are firms that have failedto adopt a short-run mentality and have continued to pursue long-runprofit goals. Capital spending and research and development expendi-tures are intended to capture an orientation to the long run.
An examination of these financial characteristics reveals that targetsof contested tender offers were not statistically different from targets ofother acquisition attempts in any respect except size. In other words, allone can say with confidence is that targets of contested tender offers hadlarger market values than other acquisition targets. This conclusion is
ARE HOSTILE TAKEOVERS DIFFERENT? 221
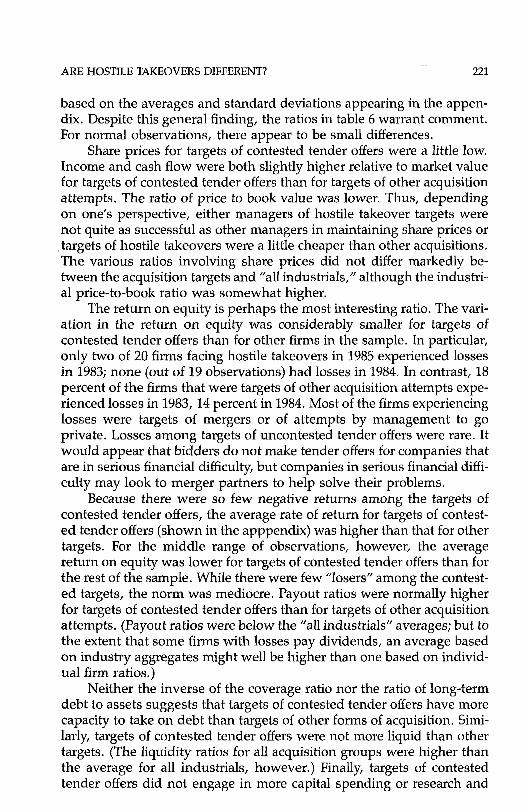
based on the averages and standard deviations appearing in the appen-dix. Despite this general finding, the ratios in table 6 warrant comment.For normal observations, there appear to be small differences.
Share prices for targets of contested tender offers were a little low.Income and cash flow were both slightly higher relative to market valuefor targets of contested tender offers than for targets of other acquisitionattempts. The ratio of price to book value was lower. Thus, dependingon one’s perspective, either managers of hostile takeover targets werenot quite as successful as other managers in maintaining share prices or¯ targets of hostile takeovers were a little cheaper than other acquisitions.The various ratios involving share prices did not differ markedly be-tween the acquisition targets and "all industrials," although the industri-al price-to-book ratio was somewhat higher.
The return on equity is perhaps the most interesting ratio. The vari-ation in the return on equity was considerably smaller for targets ofcontested tender offers than for other firms in the sample. In particular,only two of 20 firms facing hostile takeovers in 1985 experienced lossesin 1983; none (out of 19 observations) had losses in 1984. In contrast, 18percent of the firms that were targets of other acquisition attempts expe-rienced losses in 1983, 14 percent in 1984. Most of the firms experiencinglosses were targets of mergers or of attempts by management to goprivate. Losses among targets of uncontested tender offers were rare. Itwould appear that bidders do not make tender offers for companies thatare in serious financial difficulty, but companies in serious financial diffi-culty may look to merger partners to help solve their problems.
Because there were so few negative returns among the targets ofcontested tender offers, the average rate of return for targets of contest-ed tender offers (shown in the apppendix) was higher than that for othertargets. For the middle range of observations, however, the averagereturn on equity was lower for targets of contested tender offers than forthe rest of the sample. While there were few "losers" among the contest-ed targets, the norm was mediocre. Payout ratios were normally higherfor targets of contested tender offers than for targets of other acquisitionattempts. (Payout ratios were below the "all industrials" averages; but tothe extent that some firms with losses pay dividends, an average basedon industry aggregates might well be higher than one based on individ-ual firm ratios.)
Neither the inverse of the coverage ratio nor the ratio of long-termdebt to assets suggests that targets of contested tender offers have morecapacity to take on debt than targets of other forms of acquisition. Simi-larly, targets of contested tender offers were not more liquid than othertargets. (The liquidity ratios for all acquisition groups were higher thanthe average for all industrials, however.) Finally, targets of contestedtender offers did not engage in more capital spending or research and
222 Lynn E. Browne and Eric S. Rosengren
development activity than other targets. They were not victims of acommitment to the long run.
In summary, targets of hostile tender offers in 1985 were not verydifferent from targets of friendlier acquisition attempts, except as regardssize. Targets of contested tender offers were larger than targets of otheracquisition proposals, although not larger than targets of uncontestedtender offers. The stock prices for the targets of contested tender offersseem to have been a little lower than the prices for other targets, particu-larly when measured against book value, but these differences cannotwithstand much scrutiny. Targets of acquisitions, both hostile and other-wise, were smaller than the average company in Compustat’s industrialfile; they also appear to have had higher liquidity ratios. Once again,however, differences were not striking except as regards size.
These results are generally consistent with those of other studies.John Pound, in a study for the Investor Responsibility Research CenterInc., examined the financial characteristics of friendly takeover targets,hostile takeover targets that were acquired, hostile targets that remainedindependent and a control group (Pound 1985). He found that the vari-ation in characteristics was so great within groups that the groups couldnot be distinguished statistically. Pound also found that the variableschanged considerably from year to year, so that one’s perception of therelationships among acquisition categories could differ depending uponthe year in question. This caution should be borne in mind when look-ing at the ratios in table 6.
A recent working paper published by the National Bureau of Eco-nomic Research looked at financial and other characteristics of Fortune500 companies acquired in hostile and friendly transactions (Morck,Shleifer and Vishny 1987). Again, there was little difference among thecompanies for most financial variables. An exception was the ratio ofmarket value to replacement value of tangible assets, which was lowerfor the hostile targets. This variable was not considered in the currentstudy, but some of its influence may have been captured in the price-to-book-value ratio, which seems to have been lower for targets of contest-ed tender offers. The NBER study also found that the companies takenover in hostile acquisitions had earlier incorporation dates and differedin some ownership characteristics from friendly acquisitions.
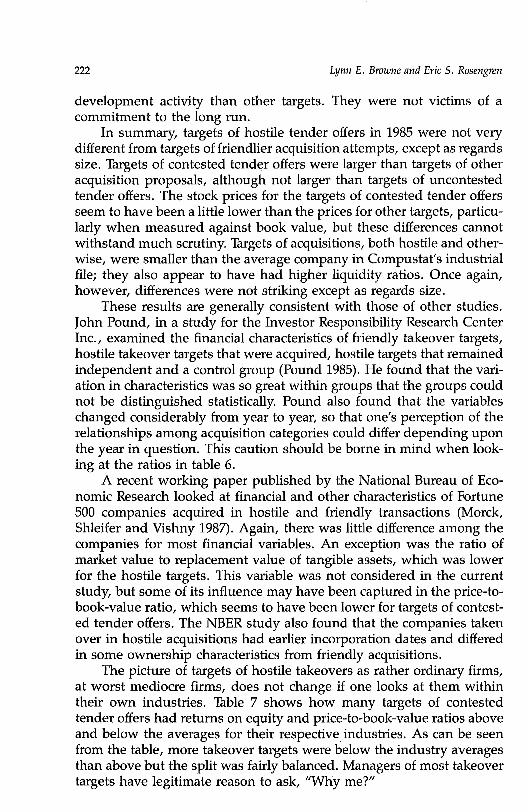
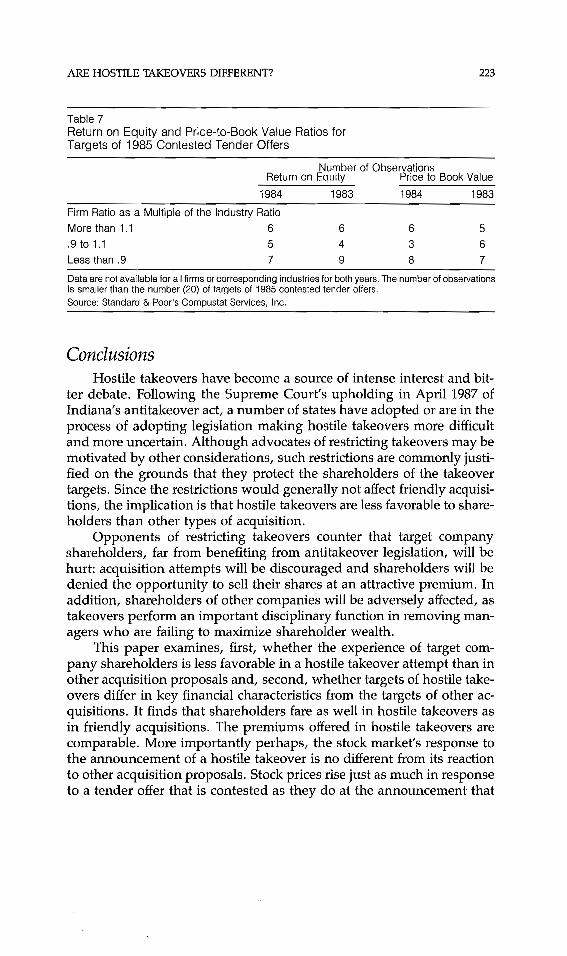
The picture of targets of hostile takeovers as rather ordinary firms,at worst mediocre firms, does not change if one looks at them withintheir own industries. Table 7 shows how many targets of contestedtender offers had returns on equity and price-to-book-value ratios aboveand below the averages for their respective, industries. As can be seenfrom the table, more takeover targets were below the industry averagesthan above but the split was fairly balanced. Managers of most takeovertargets have legitimate reason to ask, "Why me?"
ARE HOSTILE TAKEOVERS DIFFERENT? 223
Table 7Return on Equity and Price-to-Book Value Ratios forTargets of 1985 Contested Tender Offers
Number of ObservationsReturn on Equity Price to Book Value
1984 1983 t984 1983
Firm Ratio as a Multiple of the Industry RatioMore than 1.1 6 6 6 5
.9 to 1.1 5 4 3 6
Less than .9 7 9 8 7
Data are not available for all firms or corresponding industries for both years. The number of observationsis smaller than the number (20) of targets of 1985 contested tender offers.Source: Standard & Poor’s Compustat Services, Inc.
ConclusionsHostile takeovers have become a source of intense interest and bit-
ter debate. Following the Supreme Court’s upholding in April 1987 ofIndiana’s antitakeover act, a number of states have adopted or are in theprocess of adopting legislation making hostile takeovers more difficultand more uncertain. Although advocates of restricting takeovers may bemotivated by other considerations, such restrictions are commonly justi-fied on the grounds that they protect the shareholders of the takeovertargets. Since the restrictions would generally not affect friendly acquisi-tions, the implication is that hostile takeovers are less favorable to share-holders than other types of acquisition.
Opponents of restricting takeovers counter that target companyshareholders, far from benefiting from antitakeover legislation, will behurt: acquisition attempts will be discouraged and shareholders will bedenied the opportunity to sell their shares at an attractive premium. Inaddition, shareholders of other companies will be adversely affected, astakeovers perform an important disciplinary function in removing man-agers who are failing to maximize shareholder wealth.
This paper examines, first, whether the experience of target com-pany shareholders is less favorable in a hostile takeover attempt than inother acquisition proposals and, second, whether targets of hostile take-overs differ in key financial characteristics from the targets of other ac-quisitions. It finds that shareholders fare as well in hostile takeovers asin friendly acquisitions. The premiums offered in hostile takeovers arecomparable. More importantly perhaps, the stock market’s response tothe announcement of a hostile takeover is no different from its reactionto other acquisition proposals. Stock prices rise just as much in responseto a tender offer that is contested as they do at the announcement that

224 Lynn E. Browne and Eric S. Rosengren
management is trying to take a company private or that a company is theobject of a merger proposal. If one looks at stock prices over a very shortspan around the announcement date, prices do not rise as much inresponse to a contested tender offer as an uncontested tender offer.However, for a somewhat longer event window there is no significantdifference. It appears that shareholders do not require protection fromhostile takeovers.
It also appears that companies that are targets of hostile takeoversare not very different from targets of friendlier acquisition proposals andprobably not very different from companies generally. The share pricesfor takeover targets appear to be a little lower relative to book value thanthose of other acquisition targets, but the difference is not statisticallysignificant. Rates of return are not impressive for takeover targets, butlosses are rare. Targets of hostile takeovers are certainly not the worst-managed firms. This is not the same as saying they cannot be bettermanaged-~only that simple measures do not show obvious failings.
Given the small number of firms that are targets of contested tenderoffers, it is certainly possible that individual bidders could have suffi-ciently detailed understandings of these companies to conclude thatcurrent management is inadequate, even though standard financial ra-tios do not reveal problems. In other words, takeover targets may beperforming below their potential, but the management failures and theindicators of management failure may be unique to each case. It is alsopossible, given the small number of hostile takeover targets, that thechoice of target has less to do with the failings of target managementthan with the characteristics of the bidders. Some bidders are obviouslymore willing to engage in hostile takeovers than others; and their knowl-edge_of particular industries and preferences for particular types of firmswill have a strong influence on target choice.
In any event, the message that managers will find their firms vul-nerable to takeover attempts if they fail in their responsibilities to share-holders is fuzzy. To the extent that there are differences between targetsof hostile takeovers and targets of friendlier acquisition proposals, theyare very small and they certainly do not provide management with aguide to what sort of performance will protect them from takeovers.Discipline is only effective if the nature of the failure is clear and thisdoes not seem to be the case for hostile takeovers.
In conclusion, target company shareholders benefit from hostiletakeovers. Stock prices increase as much, if not more, in response to ahostile tender offer as in response to a merger or management buyout.However, the unremarkable nature of hostile takeover targets and theabsence of clear evidence of management failure casts doubt on theargument that hostile takeovers exert a useful discipline on managersgenerally.

ARE HOSTILE TAKEOVERS DIFFERENT? 225
AppendixThe event study procedure followed in this article is the same as that found
in Dodd and Warner (1983), Linn and McConnell (1983), Malatesta (1983), andPatell (1976). Patell provides the most thorough description of the assumptionsunderlying the event test. The first step is to estimate what the expected returnof the stock would be in the absence of the event. Equation 1 is estimated from240 days before the first event to 61 days before the event.
(1) Rit = ai + biRrn t + eit
where Rit = return on firm i on day tRrat = return on market portfolio on day teit = disturbance term with E(eit)= 0
t= -240, -239 ....-61
An event window, the period during which the event is expected to influ-ence the return series, is arbitrary. Ideally, the event window would be deter-mined by the day of the event. However, early release of information may causethe return series to be influenced before the public announcement of a takeover.Two event windows are used in this study. The first extends from 40 days beforethe event to 10 days after the event, while the smaller window extends from 5days before the event to 5 days after the event. Over each window, the excessreturn (ERit) is calculated.
(2) ERit = Rit- ai - 6iRrnt
To determine whether an excess return is significantly different from 0, atest statistic is created (Johnston 1972, pp. 154-55).
(3) SERit = ERit/sit
Sit = 82 1 +V + v _
1~ (Rmt - Rm)
where s2
RmtR~ntV
= residual variance from equation 1= average market return over the period estimated in equation 1= return to the market on day t= return on the market on forecast day t= number of days in estimation period
The standardized errors are summed to get the standardized cumulativeresidual.
t=y(4) SCRi = ~ SERitXY-°’s
t=lY = number of days in event window

226
The test statistic is then calculated as
Lynn E. Browne and Eric S. Rosengren
(5) z = ASCR * N°’s N = number of firms
1NASCR = ~__ISCRi
The z statistic is assumed to be distributed standard normal.
Table A1 (1 of 3)Financial Characteristics of 1985 Acquisition Targets
Inverse of Ratio of Ratio ofPrice-Earnings Cash Flow to Price to
Market Value Ratio Market Value Book ValueType of Acquisition 1984 1983 1984 1983 1984 1983 1984 1983Contested Tender OfferObservations 19 19 19 19 19 19 19 19Average 2016.2 1605,9 .094 .086 .198 .187 1.185 1.247Standard Deviation 408,3 2985,1 .039 .039 .079 .068 .370 .355Uncontested TenderObservations 20 29 20 29 20 29 20 29Average 1072.4 834~0 .063 .077 .146 .141 1.537 1.760Standard Deviation 1116.7 966.9 .116 .046 .102 .060 .776 1.213Private by ManagementObservations 20 22 20 22 20 22 20 22Average 162.5 164.4 .061 .040 .166 .140 1,765 3.241Standard Deviation 174.7 17,2 ,091 .094 .092 .091 1.465 7.657
Observations 52 59 53 59 49 55 53 59Average 266.3 275.7 -.122 .013 .236 .099 1.378 1,612Standard Deviation 436.4 505,0 1.430 .285 .680 .288 .875 1.323All excluding ContestedObservations 92 110 93 110 89 106 93 110Average 419.0 40.6 -,043 .035 .200 .119 1.496 1.977Standard Deviation 711.1 676.8 1.098 .216 .510 .215 1.025 3.668
t-statistics for difference between meansContested- Uncontested .97 1.27 1.07 .75 1,75 2.42 - 1,74 - 1.76Contested-Private 1.98 2.20 1.41 1.97 1,15 1.79 -1.63 -1.11Contested-Merger 3.00 3.24 ,65 1.11 -.24 1.29 -.92 -1.17Contested-All Other 3.47 3.69 ,54 1.03 -.01 1.34 -1.29 -.86
ARE HOSTILE TAKEOVERS DIFFERENT? 227
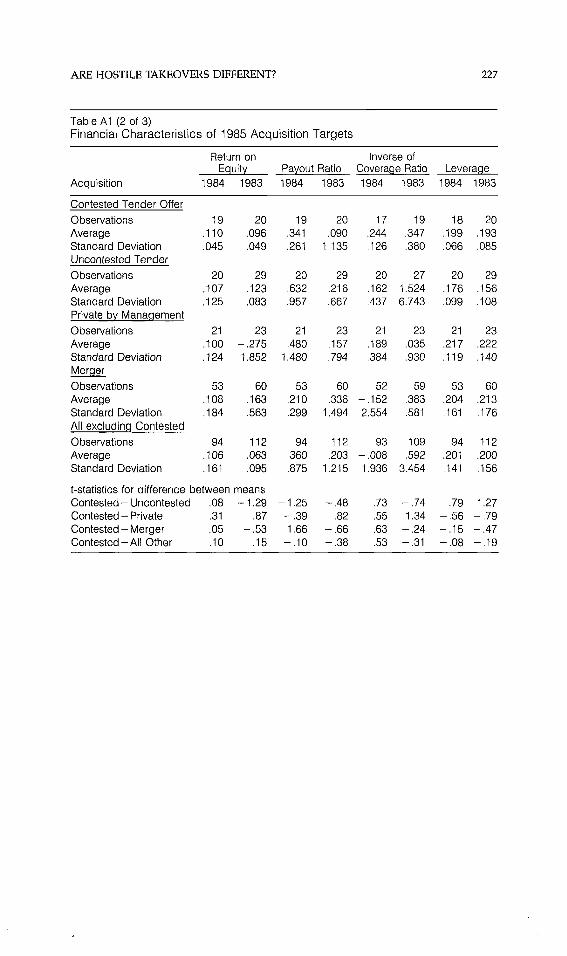
Table A1 (2 of 3)Financial Characteristics of 1985 Acquisition Targets
Return onEquity Payout Ratio
Acquisition 1984 1983 1984 1983
Contested Tender OfferObservations 19 20 19Average .110 .096 ,341Standard Deviation .045 .049 .261Uncontested TenderObservations 20 29 20Average .107 .123 .632Standard Deviation .125 .083 .957Private by ManagementObservations 21 23 21Average .100 -.275 .480Standard Deviation .124 1.852 1.480
Observations 53 60 53Ave rage .108 .163 .210Standard Deviation .184 .563 .299All excluding ContestedObservations 94 112 94Average .106 .063 ,360Standard Deviation .161 .095 .875
Inverse ofCoverage Ratio Leverage1984 1983 1984 1983
20 17 19 18 20,090 .244 .347 .199 .193
1.135 ,126 .380 .066 .085
29 20 27 20 29.216 .162 1,524 .176 ,156.667 .437 6.743 .099 .108
23 21 23 21 23-,157 .189 .035 .217 .222
.794 ,384 .930 .119 ,140
60 52 59 53 60.336 -.152 ,383 .204 .213
1.494 2.554 .581 ,161 .176
112 93 109 94 112.203 -.008 ,592 .201 .200
1.215 1.936 3.454 ,141 .156
t-statistics for difference between meansContested- Uncontested .08 - 1.29 - 1.25 -.48Contested- Private .31 .87 - .39 .82Contested - Merger .05 - .53 1.66 - ,66Contested-All Other .10 .15 -.10 -.38
.73 -.74 .79 1.27
.55 1.34 -,56 -.79
.63 -.24 -.15 -.47
.53 -.31 -.08 -.19
ARE HOSTILE TAKEOVERS DIFFERENT? 229
ReferencesBrowne, Lynn E. and Eric S. Rosengren. 1987. "Should States Restrict Takeovers?" New
England Economic Review, July/August, pp. 13-36.Center for Research in Security Prices. 1987. CRSP Stock Files. Chicago: University of Chi-
cago Graduate School of Business.Dodd, Peter and Jerold Warner. 1983. "On Corporate Governance." Journal of Financial
Economics, vol. 11, April, pp. 401-438.Jensen, Michael. 1986. "Agency Costs of Free Cash Flow, Corporate Finance, and Take-
overs." American Economic Review, vol. 76, no. 2, pp. 323-29.Johnston, J. 1972. Econometric Methods. New York: McGraw-Hill.Linn, Scott and John McConnell. 1983. "An Empirical Investigation of the hnpact of ’Anti-
takeover’ Amendments on Common Stock Prices." Journal of Financial Economics, vol.11, April, pp. 361-400.
Malatesta, Paul. 1983. "The Wealth Effect of Merger Activity and the Objective Function ofMerging Firms." Journal of Financial Economics, vol. 11, April, pp. 155-182.
Mergerstat Review. Various years. Andre E Rhoades, ed. Chicago: W.T. Grimm & Co.Morck, Randall, Andrei Shleifer, and Robert Vishny. 1987. Characteristics of Hostile and
Friendly Takeover Targets. NBER Working Paper Series, National Bureau of EconomicResearch: Cambridge, MA. June.
1985 Tender Offer Statistics. Ohio: Douglas Austin and Associates, Inc.Patell, James. 1976. "Corporate Forecasts of Earnings Per Share and Stock Price Behavior:
Empirical Tests." Journal of Accounting Research, vol. 14, pp. 246-274.Pound, John. 1985. Are Takeover Targets Undervalued? An Empirical Examination of the Finan-
cial Characteristics of Target Companies. Investor Responsibility Research Center Inc.:Washington, D.C.
Roll, Richard. 1977. "A Critique of the Asset Pricing Theory’s Tests." Journal of FinancialEconomics, vol. 4, March, pp. 129-276.
Scherer, EM. 1980. Industrial Market Structure and Economic Performance. Chicago: RandMcNally.
Standard & Poor’s Compustat Services, Inc. Compustat II. Tapes, various years.Supreme Court of the United States. CTS Corp. v. Dynamics Corporation of America etal.
Appeal from the United States Court of Appeals for the Seventh Circuit, No. 86-71.Argued March 2, 1987--Decided April 21, 1987.
DiscussionJohn C. Coffee, Jr.*
Although the simple disciplinary model of the hostile takeoverviews it as an engine of efficiency that creates value for shareholders,largely by pruning corporate deadwood, the picture that emerges fromthe data gathered by Lynn Browne and Eric Rosengren provides onlypartial corroboration for this theory. Put simply, their findings supportthe first half of this story--that is, that shareholders gain--but tend todisconfirm the second half namely, that takeover targets are inefficient-ly managed. Basically, they find that takeover targets are not statisticallydistinguishable from other firms--either other acquisition targets in"friendly" mergers or other firms within the same industry--at least interms of their financial characteristics. This view of targets of hostiletakeovers as rather ordinary firms, at worst mediocre firms, but rarelythe laggards within their industry, has been corroborated by other recentresearch. John Pound’s work for the Investor Responsibility ResearchCenter, Inc. (1985), a recent paper by Morck, Shleifer and Vishny (1987)for the National Bureau of Economic Research, and earlier works byother scholars--for example, Langetieg (1978), and Harris, Stewart andCarleton (1982)--agree that the targets of takeovers do not appear statis-tically different in their financial characteristics from other acquisitiontargets or from other firms within their own industries. Still, the evi-dence that shareholders gain from takeovers is irrefutable; no one seri-ously challenges it, and the aggregate gains may be as high as $167billion, according to Grundfest and Black (1987).
What explains wealth creation on this scale if there appear to be novillains that deserve the tender offer’s guillotine? Several competing hy-potheses can account for this pattern. At one polar position is MichaelJensen’s "Free Cash Flow" theory, essentially a modified version of the
*Adolf A. Berle Professor of Law, Columbia University Law School.
DISCUSSION 231
disciplinary model, which argues that takeovers discipline a special kindof managerial opportunism, namely the tendency toward cash hoardingand empire-building. If most corporations engage in such behavior, thenwe should not be surprised that takeover targets do not stand apart fromthe herd in terms of their financial characteristics. At the other pole is athesis that asserts that takeovers do not create wealth but only transferit, largeIy as the result of disrupting (or breaching) "implicit contracts"that once bound together the modern corporation as an economic andsocial institution. This view has been most aggressively argued by.Schleifer and Summers (1987), and earlier in a more qualified form byboth Knoeber (1986) and Coffee (1986). Of course, these two rival hy-potheses are not necessarily inconsistent; each could explain a part ofthe puzzle of the source of takeover gains.
By contrasting these two theories, I believe that we can better un-derstand the forces that have produced the recent epidemic of statetakeover legislation. Just since the April 21, 1987 decision of the U.S.Supreme Court in CTS Corp. v. Dynamics Corp. of America, 14 states haveadopted or modified laws designed to restrict takeovers.1 A majority ofthe states have now passed a "second generation" takeover statute, andwith the recent passage by Delaware of its takeover statute, it has beenestimated that 80 percent of business capital in the United States is nowprotected by such a statute.2 Thus, there is a clear and present dangerthat over the next five-year period the rate of corporate takeovers andassociated transactions (such as leveraged buyouts and defensive merg-ers) may sharply decline.
One can, of course, bemoan this trend or even suggest (as Securitiesand Exchange Commission Chairman Ruder has) that state takeoverstatutes should be preempted by new federal legislation, but the pros-pects for preemptive legislation are at best bleak, since none of the majorbills pending before the Congress provides for it. Alternatively, we caninquire (as I will attempt at the end of this comment) whether statetakeover regulation can be neutralized by a policy that seeks to securemanagement’s acquiescence. My premise for this suggestion is that thetakeover gains to target shareholders are large enough to permit them tocompensate other constituencies who are adversely affected; thus, intrue Coasean fashion, the winners can "bribe" the losers and reach an
1 107 S. Ct. 1637 (1987). The 14 ~tates that have enacted antitakeover legislation sincethat case are: Arizona, Delaware, Florida, Louisiana, Massachusetts, Minnesota, Missouri,Nevada, New Jersey, North Carolina; Oregon, Utah, Washington and Wisconsin. See In-vestor Responsibility Research Center (1987).
2 See the article by Doug Bandow, "Curbing Raiders Is Bad for Business," New YorkTimes, February 7, 1988 at F-2. For a recent list of states having antitakeover statutes, seeInvestor Responsibility Research Center (1987).
232 John C. Coffee, Jr.
efficient equilibrium, despite the significant legal barriers now beingerected in the path of takeovers at the state level.
The Alternative H~/potheses: Empire-Building versusImplicit Contracting
Even the strongest proponents of a market for corporate controlhave long conceded that the source of takeover gains remains a mystery(Jensen and Ruback 1983). Recently, the debate over the source of thesegains has become more focused, as increasing evidence suggests thattarget firms sell in the market at significant discounts from their assetliquidation or break-up values. A National Bureau of Economic Researchworking paper finds the one financial characteristic that distinguisheshostile takeovers from friendly transactions (at least among Fortune 500companies) to be the ratio of market value to replacement value of tangi-ble assets. This ratio was lower for the hostile targets (Morck, Shleiferand Vishny 1987).
Elsewhere, I have argued that the characteristic pattern of takeoversbegan to shift in the early 1980s from "synergistic" acquisitions to "bust-up" takeovers (Coffee 1986). The former, which are aggregative and as-sume that the whole has greater value than the sum of the parts, hadbeen the dominant pattern throughout the earlier history of the takeover(and indeed all earlier merger and acquisition peak periods). The bust-up takeover is disaggregative and essentially involves a bidder who isseeking to arbitrage the disparity between the stock value of the targetand its higher asset liquidation value. Historically, it is easy to under-stand that the appearance of the junk bond market in the early 1980smade such arbitrage transactions possible, but the deeper question in-volves how to explain this "negative synergy" that makes many firmsmore valuable broken up than intact. A number of theories have beenoffered, including managerial risk aversion, imperfect information, theredundancy of diversified investors owning diversified conglomerates,and managerial compensation practices under which the firm promisesan "ex post" settling-up, a promise that the bust-up takeover breaches. Ibelieve further research will someday suggest that changes in the worldeconomy have also made the diversified or "M-Form" conglomerate acomparatively less efficient vehicle for organizing economic activity thanalternative contractual arrangements: to reverse Oliver Williamson’swell-known thesis, markets may today be more efficient than hierar-chies, at least over some range of corporations, which are therefore take-over targets.
Although a range of theories can be offered to explain the preva-

DISCUSSION 233
lence of the bust-up takeover, the best-known contemporary theory isprobably Michael Jensen’s "Free Cash Flow" hypothesis (Jensen 1986).Actually, this theory strikes me as largely a reinterpretation--with origi-nal elements, to be sure--of the long tradition of "managerialist" theo-ries, which has featured notable efforts by such writers as Baumol(1959), Marris (1964), Williamson (1963), and more recently, GordonDonaldson (1984). These writers agree that there is an inherent tendencyfor excessive growth, because managers" preferences deviate from thoseof the shareholders. If so, investors should logically discount the firm’sstock value below its "break-up" asset value, because the market wouldanticipate that inefficient investment (that is, diversion of the free cashflow) would continue. In addition, managers may refuse to sell assets ordivisions, even though another purchaser would pay more for the par-ticular division; thus, assets do not flow to their highest and best use (orat least to the most optimistic purchaser) until the firm’s bust-up permitsthis potential asset value t6 be realized. Obviously, the recent findingthat target firms have a low ratio of market value to replacement costseems to corroborate this theory.
An alternative theory has been offered by another group of writers,including this author, who view the modern corporation as a complexinstitutional mechanism designed at least in part to uphold (and thuspermit reliance upon) "implicit contracts’! reached between the share-holders and other "stakeholders" in the corporation--for example, man-agers, creditors, employees, and possibly certain suppliers (Coffee 1986;Knoeber 1986; Shleifer and Summers 1987). The nature of this implicitcontract can be variously defined. Some emphasize risk aversion: that is,because shareholders own many stocks, while managers have but onejob, they strike an arrangement under which shareholders keep the re-sidual returns, while managers receive the assurance of continuing em-ployment and stable income (Coffee 1986). In short, managers trade offhigher returns for lower risk, but are as a result unwilling to commit thefirm to risky financial or investment decisions that shareholders wouldfavor. Alternatively, - one can model the shareholder/manager "implic-it contract" as an attempt to foster investment by managers in "firm-specific" human capital (Williamson 1984). To encourage suchinvestment, managers must be promised a form of quasi-tenure, be-cause such "firm-specific" capital will have limited value to the market.Finally, a third view begins with the recognition that it is difficult toevaluate the senior manager’s value to the firm contemporaneously;thus, optimal compensation requires an ex post settling-up process(Knoeber 1986). That is, because one cannot know until years laterwhether a specific investment decision or marketing strategy will payoff, it is necessary to award deferred compensation on an ex post basis inorder to reward managers on a basis commensurate with their contribu-

234 John C. Coffee, Jr.
tion to the firm’s earnings.For present purposes, the differences among these theories are of
secondary importance, because all recognize the possibility that share-holders could opportunistically breach the implicit contract. As a resultof such conduct, shareholder wealth is increased, but not social wealth.At least in theory, it is possible that the losses to stakeholders could evenexceed the gains to shareholders. On a more abstract level, the implicitcontracting perspective produces an important paradigm shift, becauseit moves the focus of the debate from the law’s usual concern withreducing "agency costs" to the protection of the interests of these "stake-holders" who are exposed to arguably opportunistic behavior byshareholders.
Implications of the Implicit Contracting PerspectiveThe assertion that social and shareholder wealth are not positively
correlated is obviously subject to challenge. Because the opportunitycost to an employee from being terminated is seldom, if ever, the em-ployee’s full wage, it is difficult to believe that employee losses oftenexceed shareholder gains. Still, the real significance of the implicit con-tracting perspective is that it forces us to see the board of directors in avery different light. While the law has traditionally viewed the board ofdirectors as the agent of the shareholders, this alternative perspectivesuggests that the board’s role may be that of a mediator. Because long-term contracting between shareholders and the other constituencies iscostly and numerous contingencies can arise that could not be foreseenin advance, the parties to the implicit contract need a body to serve ineffect as an arbitration panel to preserve the fair expectations of eachside. On an ex ante basis, the parties designate the board to perform thisrole through ex post adjustments (Coffee 1986). This view sounds hereti-cal because, as we all know, only shareholders elect the board of direc-tors, but in practice it is senior management who nominate candidates tofill vacancies on the board, with shareholders only ratifying their selec-tion. Thus, while in theory directors are elected by shareholders, inreality the balance of power over their selection probably tilts in favor ofmanagement.
This view of the board as a mediating body brings us back to thedistinctive character of the hostile takeover. Uniquely, it permits thebidder to outflank the board. In contrast, a merger or sale of assetsgenerally requires board approval before it is submitted to shareholders.Preempting the board’s role has special significance if we view this roleas that of a mediator entrusted by the various stakeholders with the taskof protecting the expectations of all the contracting parties and, argu-
DISCUSSION 235
ably, also with a responsibility for allocating "windfall" gains, such astakeover premiums. This view does not mean that defensive tactics aretherefore justifiable, but it does suggest a role for the board beyond thatof a bargaining agent for the shareholders; in particular, it invites criti-cism of those Delaware decisions, such as Revlon, that see the board’srole (at least once a takeover is inevitable) as only that of a "fair auction-eer" (Coffee 1986, n. 225).
Predictably, some will respond that this view is overly idealized,because there is little evidence to believe that the board has behaved inthe past as the wise, paternal, benign mediator that such a theory seemsto contemplate. But it is a mistake to see this mediation model of theboard’s role as equivalent to benevolent paternalism. Lower-echelon em-ployees contract through other means and institutions (for example,collective bargaining) and are not as exposed to opportunism becausethey do not invest in much "firm-specific" capital or expect an ex post"settling-up." The real contracting parties are chiefly managers andshareholders.
The next step in this analysis explains the appearance of state take-over statutes as the consequence ofthe preemption of the board’s role. Ifthe implicit contract has been breached, a contractual failure has argu-ably occurred, and legal regulation becomes justifiable. In this perspec-tive, state takeover statutes have nothing to do with shareholderprotection, but are instead aimed (albeit covertly) at managerial protec-tion, because the old system of implicit contracting has failed.
To state these arguments is not necessarily to accept them. The firsthypothesis--the Free Cash Flow theory--probably has greater explana-tory power, because the scale of recent takeover gains (roughly $167.billion, according to Grundfest and Black 1987) cannot be explained sim-ply on the basis of cost savings to shareholders from opportunisticbreaches of implicit contracts. This becomes clearer if we consider anindividual case. Today, the average takeover premium is around 40 per-cent. One cannot generally explain a rational bidder paying $1.4 billionfor a target whose prior aggregate stock market value was $1 billion,simply in terms of the cost savings that managerial layoffs are likely toeffect. Indeed, for such a takeover to be rational on this basis (given boththe risks and the notoriously high transaction costs), the bidder wouldhave to expect to realize cost savings considerably greater than this $400million premium in order for it to earn a reasonable profit. There mayhave been some takeovers that fit such a pattern, but even in these casesthe actual loss to the dismissed managers is their opportunity cost,which will generally be only a fraction of their former salary.
Let us assume then that the disparity between stock and asset val-ues of the typical target firm is attributable more to inefficient empire-building and a bias for earnings retention than to shareholder

236 John C. Coffee,
opportunism and the reneging on implicit contracts. Still, this view thatFree Cash Flow theory explains more (or even most) of the discount doesnot refute the possibility that managers are exposed to significant lossesas a result of takeovers. Rather, it leads us to the critical issue, from myperspective: If shareholders have more to gain from takeovers than man-agers have to lose, why haven’t shareholders found ways to "bribe"managers into acquiescence? This is, of course, what Coase’s theoremwould predict. The most obvious means by which to align managerialincentives with those of the shareholders is through management com-pensation formulas. Why then has private ordering not devised newcompensation formulas designed to secure managerial acquiescence intakeovers?
Takeover Resistance as a Problem in ManagementCompensation
Assume the Free Cash Flow formula is correct and managers arebiased toward retaining earnings in investments that have negative pres-ent value once discounted at a rate equal to the corporation’s cost ofcapital. Because such inefficient retention of earnings does not enrichmanagement personally, it can have only a limited utility for them. As-sume that for each dollar of "free cash flow" that is inefficiently invested,management receives a positive utility of 10 cents (because salaries arepositively correlated with size, or because there is greater psychic in-come in managing a larger firm, or for some other reason). Seemingly, acompensation formula could be devised that effectively paid managers20 cents for each dollar of free cash flow not so invested, but instead paidout. Why then hasn’t internal contracting within the firm fashioned sucha formula?
One answer may be that the failure to pay out free cash flow toshareholders may have more to do with implicit contracting within thefirm than has hitherto been recognized. This answer may also explainwhy target firms do not have more distinctive financial characteristics(because the practice is widely prevalent). For example, risk-averse man-agers might prefer the lower, but less risky, positive utility associatedwith empire-building to the highly risky cash substitute that a compen-sation formula offers.
Another answer may be that there are legal barriers that precludethe adoption of more optimal management compensation formulas.This answer has been tentatively put forward by Jensen and Murphy ina recent, very interesting working paper, but it ultimately seems difficultto accept, at least in the form in which they articulate it. They begin witha striking fact: as they compute it, executive compensation is extremely
DISCUSSION 237
insensitive to the stock market performance of the firm employing themanager, changing "less than two cents for every $1,000 change in equi-ty value" (Jensei~ and Murphy 1987). If this is the case, it is little wonderthat managers have let stock market values sink below asset liquidationvalues. Managers are essentially in the position of fixed-interest credi-tors and, as such, should behave in a highly risk-averse fashion. Thisleads to the next question: Why are management compensation prac-tices so indifferent to the firm’s stock value? Here, Jensen and Murphysuggest that fears of legal liability may lead directors to undercompen-sate managers. This seems overstated, because cases imposing such li-ability are notoriously lacking, and only in the case of twelfth-hour"golden parachutes" or gratuitous pensions to the chairman’s widowhave courts intervened to enjoin the transaction.3 In general, the busi-ness judgment rule reigns more supremely in this area than in mostothers.
The problem may instead lie with the difficulty inherent in design-ing the kind of management compensation formula that is needed (andalso with its relative novelty, which might subject it to a greater likeli-hood that courts would enjoin it). Simply keying managers’ salaries tothe firm’s stock price is too crude, because it does not distinguish the"firm-specific" component from the "systematic risk" component of thestock price. Possible formulas that could make such a distinction may beoverly complicated and are not easily implemented, particularly if man-agers are poor risk bearers and need a stable income stream. Also, ifsome managers are risk-neutral, then stock-based compensation cangive rise to a moral hazard problem, as these managers would have anincentive to accept highly risky investments and policies. The resultwould begin to resemble a world in which the managers were selectedexclusively by the firm’s warrant holders. To sum up, one needs to steera fine line between Scylla and Charybdis: the former being the fact thatmanagers make poor risk bearers and the latter the danger of creating amoral hazard problem.
More importantly, the higher we raise managers’ salaries, the morewe motivate them to resist a hostile takeover, by increasing their oppor-tunity cost. Thus, while such a compensation formula might reduce theincentive to retain free cash flow within the firm, it would motivate thetarget’s management to resist a "synergistic" bidder who saw uniquegains from combining the bidder and~ target firms.
Still, other possible compensation formulas have not been ade-quately explored. Consider then a very different form of compensationformula, one patterned after the manner in which the law has historical-
3 See, for example, Adam v. Smith, 153 So. 2d 221 (Ala. 1963). Of special importance isthe fact that shareholder ratification shifts the burden to the plaintiff to prove waste. SeeSaxe v. Brady, 184 A.2d 602 (Del. Ch. 1962). For a review of the case law, see Vagts (1983).

238 John C. Coffee,
ly rewarded the successful plaintiff’s attorney in class or derivative ac-tions: namely, a "percentage of the recovery" formula. This may soundlike a strange precedent to consider, but uniquely it gives the firm’smanagers an incentive both to. accept, and to maximize, the takeovergains. Hypothetically, such a formula could be implemented by a provi-sion in the corporate charter authorizing the board to pay to the firm’ssenior managers a specific percentage (say, 20 percent) of the premiumpaid to shareholders in a merger, acquisition or tender offer; such pay-ment would be made by the target corporation (not the bidder), and abylaw could commit the board to make such a payment, subject perhapsto some limited circumstances where it could be voided in the judgmentof two-thirds of the board or more. This compensation would be inaddition to the salary and stock option compensation the managers wereotherwise paid. (Admittedly, a tendency to reduce regular compensationin light of this contingent bonus might arise.)
What would be the incentive effects of such a system? In a morefocused manner than stock options, such a form of compensationshould encourage target managers not only to acquiesce in a takeover,but to seek out bidders and conduct legitimate value-maximizing auc-tions. To be sure, some managers might still resist, but particularly forthe CEO nearing retirement age, the lure of such a bonus should beconsiderable. Nor is this compensation costly to shareholders of firmsfor which no offer is made (as stock options and bonuses are).
Would there be any perverse incentives? Here, any answer must bequalified. Because such a compensation system gives the manager aninterest in maximizing the margin between the firm’s stock value and itshigher break-up value, there could conceivably be an incentive to mis-manage the firm in order to maximize this spread. This possibility seemssmall. A decline in corporate earnings would likely affect the manager’sordinary compensation (by reducing bonus income or the value of stockoptions) and would expose the manager to the threat of ouster by theboard. In addition, the truly inefficient, mismanaged firm seems to es-cape the hostile takeover (witness the success of International Harvester,Chrysler, Continental Illinois and others in this regard), possibly be-cause the bidder fears that it will be acquiring a "turkey" with moreintractable problems than it realizes from the outside. Corporate cultureis another factor that makes deliberate mismanagement an unlikelyscenario.
A more realistic possibility is that such a compensation formulawould give management an incentive to withhold favorable informationfrom the stock market in order to privately reveal it only to selectedbidders. Again, this conduct would maximize the spread between thestock market and break-up values, but it would not lead to any penaltyin terms of reduced current earnings (because salary tends to be based
DISCUSSION 239
on historical reported earnings, not future discounted cash flows). Ofcourse, to the extent one believes in the efficiency of the stock market,the ability of management to conceal material information from the mar-ket (while revealing it selectively to potential bidders) seems limited.Bidders who learn such information will logically buy the stock in theopen market, and insider trading and normal information leakage mayalso close the gap between the two values. Thus, although there is thepossibility of allocative inefficiency caused by managerial concealment ofmaterial information, the magnitude of this problem seems small.
The real problems with this proposal are, first, that it is open-ended,and, second, that it does not benefit all those who, if we believe thatimplicit contracts have been breached, stand to lose unfairly. The con-cept of a percentage-of-the-recovery fee award, as used in class actions,was always subject to a judicial scrutiny for reasonableness, and feeawards over 40 percent of the recovery have been extremely rare. Thus,although it may be in the shareholders’ interest to allocate on an ex antebasis 10 or even 20 percent of the takeover premium to managers whoare otherwise in a position to block it, a 50 percent allocation seemsunreasonable. How likely is such a result? Much depends on how muchconfidence we place in the charter amendment process, where collectiveaction problems and high information costs may make shareholders ra-tionally apathetic. The more we doubt this process, the more we may belegitimizing extortion by managers of the takeover premium. Yet, corpo-rate control transactions may be the unique context where investors dopay close attention to proposed charter amendments, because the ex-pected gains are large enough to overcome their rational apathy.
Second, if we believe that takeovers invite shareholder opportunismand reneging on implicit contracts, this proposal represents only a par-tial answer, because it does not necessarily benefit middle managementor others. The tension here is obvious: the more senior managementshares that portion of the premium allocated to management with mid-dle levels, the less will be senior management’s expected return and themore it is still likely to oppose a takeover. The difficulty of this trade-offand the arguable need for a ceiling on the maximum amount so allo-cable suggests the need for legislative limits, possibly including non-discrimination rules paralleling the statutory provisions regulating pen-sion plans.
Regardless of these specific and subsidiary questions, the sharing oftakeover gains that I am here suggesting goes well beyond any use thathas yet been made of golden parachutes. Even in the more "liberal" casesupholding such compensation, courts have looked to the predictableloss in compensation over, typically, a three-year period and have adopt-ed a "reasonableness" test.4 Under such a test, a decision by the boardalone to allocate 20 percent of the takeover gains to management seems
240 John C. Coffee, Jr.
unlikely to pass such a test, absent special factors.However, if such a provision were inserted in the corporate charter
by a shareholder vote well in advance of any takeover, its prospect forjudicial approval seems materially enhanced (although still not certain).The case for it now is not that it is "reasonable" in judicial eyes but that itwas approved by a disinterested majority of shareholders (and possiblyratified within some reasonable "sunset" period). Only if the plaintiffscould demonstrate "waste" (a legally vague term approaching sheer irra-tionality) would such a provision be invalid under the Delaware caselaw.
To implement such a provision, changes in the federal tax laws willprobably also be necessary, because "change of control" executive com-pensation is today subject to special and punitive taxation. Hence, feder-al tax reform is a precondition to any policy of securing managerialacquiescence.
ConclusionBecause of the CTS decision and the adoption of antitakeover stat-
utes by a majority of the states, takeovers may yet be sharply curtailed.This prediction has proven false before, but rarely has the coalition offorces opposed to takeovers seemed so organized as today, when theyhave succeeded in a majority of the states in enacting legislation. Thepolitical economy of these statutes is particularly interesting. Despitetheir overt purpose, it takes little analysis to conclude that state takeoverstatutes do not benefit target shareholders. Target corporations couldadopt--and to a considerable extent have adopted--charter provisionsprotecting their shareholders against the coercive features of partial bidsand two-tier tender offers. Even in the absence of shareholder approval,boards of directors can adopt "poison pill" plans that can have a similareffect. There is thus little need for legislative efforts to protect the targetshareholder, who may already be overprotected in most instances, evenwithout governmental regulation.
But the fact that such legislation does not really help its nominalbeneficiaries does not mean that there are not covert beneficiaries. Targetmanagements, local communities, suppliers, existing creditors--all fallinto this latter category. Takeover legislation, particularly at the statelevel, has usually amounted to a form of rent-seeking by such groups,and they have been highly effective because they are a politically cohe-sive and visible local force, while shareholders are dispersed nationally;
4 See Koenings v. Joseph Schlitz Brewing Co., 377 N.W.2d 593 (Wisc. 1985); (issue is thereasonableness of the stipulated damages clause).
DISCUSSION 241
bidders and their allies can also be pejoratively dismissed as "arbitragersand speculators."
Against this backdrop of contending forces engaged in a rent-seeking competition investment bankers on one side and the corporatebusiness community largely on the other--only an incurable optimistwould predict a satisfactory legislative solution. Stalemate and piece-meal compromise seem more likely. From an economic perspective,however, we can witness a familiar story in a new context: instead ofrailroads and cornfields, we here see shareholders and managers lockedin the familiar Coasean attempt to negotiate an efficient outcome. Thegains to the shareholders seem to outweigh the losses to the managers,and thus the possibility of an efficient outcome is discernible if legalbarriers can be relaxed that might prevent a mutually beneficially trans-action. If not, I expect that the takeover boom of recent years will gradu-ally turn into a leveraged buyout boom, as target managements find thisoption to be their exclusive means of protecting their economic position.Most likely, the alternatives for the future are either new systems ofmanagerial compensation that give managers greater incentive to acceptrisk or a higher rate of management buyouts, as managers acquire acontrolling position in order to assure their tenure in office.
ReferencesBaumol, William J. 1959. Business Behavior, Value and Growth. New York: Macmillan.Browne, Lynn E. and Eric Rosengren. 1987. "Are Hostile Takeovers Different?" This
volume.Coffee, John C., Jr. 1986. "Shareholders Versus Managers: The Strain in the Corporate
Web." Michigan Law Review, vol. 85, pp. 1-109.Donaldson, Gordon. 1984. Managing Corporate Wealth: The Operation of a Comprehensive Fi-
nancial Goals System. New York: Praeger.Grundfest, Joseph Ao and Bernard S. Black. 1987. "Stock Market Profits from Takeover
Activity Between 1981 and 1986:$167 Billion Is a Lot of Money." Working paper, U.S.Securities and Exchange Commission.
Harris, Robert S., John E Stewart and Willard T. Carleton. 1982. "Financial Characteristicsof Acquired Firms." In Mergers and Acquisitions: Current Problems in Perspective, MichaelKeenan and Lawrence J. White, eds. Lexington, MA: Lexington Books.
Investor Responsibility Research Center. 1987. "Delaware bar considering takeover lawwith three-year delay." IRRC Corporate Governance Bulletin, vol. IV, November/Decem-ber, p. 186.
Jensen, Michael C. 1986. "Agency Costs of Free Cash Flow, Corporate Finance, and Take-overs." The American Economic Review, vol. 76, p. 323-29.
Jensen, Michael C. and Kevin J. Murphy. 1987. "Are Executive Compensation ContractsStructured Properly?" MERC Working Paper No. 86-14. University of Rochester:Rochester, NY.
Jensen, Michael C. and Richard S. Ruback. 1983. "The Market for Corporate Control: TheScientific Evidence." Journal of Financial Economics, vol. 76, pp. 5-50.

242 John C. Coffee, Jr.
Knoeber, Charles R. 1986. "Golden Parachutes, Shark Repellents and Hostile Tender Of-fers." The American Economic Review, vol. 76, pp. 155-67.
Langetie~g, Terence C. 1978. "An Application of a Three-Factor Performance Index to Mea-sure Stockholder Gains from Merger." Journal of Financial Economics, vol. 6, pp. 365-84.
Marris, Robin. 1964. The Economic Theory of "Managerial" Capitalism. London: Macmillan.Morck, Randall, Andrei Shleifer and Robert W. Vishny. 1987. "Characteristics of Hostile
and Friendly Takeover Targets." National Bureau of Economic Research, WorkingPaper No. 2295.
Pound, John A. 1985. Are Takeover Targets Undervalued? An Empirical Examination of theFinancial Characteristics of Target Companies. Investor Responsibility Research Center,Inc.: Washington, D.C.
Shleifer, Andrei and Lawrence H. Summers. 1987. "Breach of Trust in Hostile Takeovers."National Bureau of Economic Research, Working Paper No. 2342.
Vagts, Detlev. 1983. "Challenges to Executive Compensation: For the Market or theCourts?" Journal of Corporation Law, vol. 8, p. 231.
Williamson, Oliver. 1963. "Managerial Discretion and Business Behavior." The AmericanEconomic Review, vol. 53, p. 1032.
¯1984. "Corporate Governance." Yale Law Journal, vol. 93, p. 1197.