Lyman-alpha intensity mapping during the Epoch of Reionization · Lyman-alpha intensity mapping...
27
Lyman-alpha intensity mapping during the Epoch of Reionization Mário G. Santos CENTRA – IST (Austin, May 15, 2012) Marta Silva, Mario G. Santos, Yan Gong, Asantha Cooray (2012), arXiv:1205.1493
Transcript of Lyman-alpha intensity mapping during the Epoch of Reionization · Lyman-alpha intensity mapping...

Lyman-alpha intensity mapping during the
Epoch of Reionization Mário G. Santos CENTRA – IST
(Austin, May 15, 2012)
Marta Silva, Mario G. Santos, Yan Gong, Asantha Cooray (2012), arXiv:1205.1493

Intensity mapping? � Make 3d maps during EoR
� Not resolving galaxies
� Measure intensity over many small frequency bands and over a large area of the sky (low angular resolution)
� Each band will map into an effective Ly® line redshift/position along line of sight
� If Ly® is only signal we’re done after beating noise…
� Well, need to remove “foregrounds”, e.g. everything else that falls into the band (coming from lower redshifts)
� Then make 3d boxes at “middle” redshift, get 3d power spectrum and you’re done!
Gal
axie
s In
tens
ity

Sources of Ly® emission
� Continuum Ly-® emission from stars
� Scattering of Ly-n photons in the IGM
� Hydrogen Recombinations (galaxies and IGM)
� HI Collisional excitations (galaxies and IGM)
� Gas cooling (gravitational collapse)
Powered by UV emission from stars
X-ray emission from Quasars?

Galaxies / IGM � First assumption - use a two-medium model:
� Galaxies � “Constant” temperature
� “Constant” ionization fraction
� “closed box”
� IGM � Temperature increasing
� Ionization fraction increasing
� Should be ionized around galaxies…
� UV escape fraction from galaxies Reionization
� Ly-® escape fraction (no scattering in IGM)
� HI “glow” around galaxies?

Ly-® from Galaxies: Parameters
� UV escape fraction:
Nion
= Qion
⇥ SFR
• Qion ~ 5.38x1060 UV photons/M¯ • Salpeter IMF
• Ionizing Fluxes from Shaerer 2002
• (POP II, OB stars)
• 20% error?
� Ionizing photon rate from stars - relate to Star Formation Rate:
Razoumov & Sommer-Larsen (2010)
• 20% uncertainty?
fUVesc (M, z) = exp
h�↵(z)M�(z)
i

� Average number of Ly® photons per recombination:
� frec ~ 0.66 (Gould & Weinberg, 1996)
fLy↵esc (z) = Cdust ⇥ 10�3(1 + z)⇠
� Ly® escape fraction (related to dust absorption)
• Cdust ~ 3.34 • » ~ 2.57 • Mass dependence?
Hayes et al. (2011)
+ 2-photon emission
Ly-® from Galaxies: Parameters

Collisions - Heating/excitations:
Ly-® from Galaxies
NLy↵ = fLy↵
esc
⇥AHefrec ⇥ (1� fUV
esc
)⇥ Nion
Hydrogen Recombinations:
hE⌫i ⇠ 21.4eV SED from Maraston (2005) ~ 1% for Ly® through excitations (Gould & Weinberg ‘96)
LGalrec ⇠ 4.04⇥ 108 [1� fUV
esc (M, z)]fLy↵esc (z)
SFR(M, z)
M�yr�1L�
LGal
exc
⇠ 1.05⇥ 108 [1� fUV
esc
(M, z)]fLy↵esc
(z)SFR(M, z)
M�yr�1
L�

Cooling – gas collapse (negligible):
Ly-® from Galaxies
Continuum emission:
Average number of photons – connect to UV emission/Reionization:
QLy↵ ⇠ 0.63 Q
ion
LGal
cont
⇠ 4.63⇥ 108 fLy↵esc
(z)SFR(M, z)
M�yr�1
L�
(SED from OB stars)
LGal
cool
(M) ⇠ 44fLy↵esc
✓1 +
M
108
◆✓1 +
M
2⇥ 1010
◆2.1 ✓
1 +M
3⇥ 1013
◆�3
L�

Galaxies - SFR
• Top right: • Solid lines - our model • Dotted lines - catalogue from Guo et al. (2011)
• Top left: • SFR density using our simulation (red – points
from Bouwens et al. 2011) • Bottom:
• Obtained ionization fraction (xi ~ 0.9 at z=7 and 𝝉~ 0.07)
6 7 8 9 10 11 12 13 14z
!4.5
!4.0
!3.5
!3.0
!2.5
!2.0
!1.5
log10
!
SFRD[M
"yr!
1Mpc!
3]"
6 7 8 9 10 11 12 13 14z
0.0
0.2
0.4
0.6
0.8
1.0
xi

Intensity from Galaxies
• Luminosity functions • Green/blue - with our SFR model • Yellow/black/red - “observations”
with Schechter function fits
• Total Ly® intensity from galaxies • blue - analytical calculation using
our luminosities • yellow - using the empirical
relation from Jiang et al. (2011):
40.0 40.5 41.0 41.5 42.0 42.5 43.0 43.5 44.0log10 [LLy!(erg s!1)]
!6
!5
!4
!3
!2
!1
0
log10
[n(L
>)(Mpc!
3 )]
z = 6
z = 7
Ouchi2008: z = 5.7
Kashikawa2006: z = 5.7
Kashikawa2006: z = 6.67.0 7.5 8.0 8.5 9.0 9.5 10.0 10.5 11.0
z
10!3
10!2
!I ![nW
m!2sr!1]
GAL : teo
GAL : K98
LGalK98 ⇠ 2.9⇥ 108
SFR(M, z)
M�yr�1L�
SFR à H® à Ly®
IGal(z) =
Z Mmax
Mmin
dMdn
dM
LGal(M, z)
4⇡H(z)�Ly↵

More Luminosity constraints…
(from Sobral et al. 2009)

Ly® Power Spectrum from Galaxies
� Assume:
106 107 108 109
LLy! [L!]
10"2
10"1
100
101
LdbLy
!/dL
z = 10
z = 9
z = 8
z = 7
6.0 6.5 7.0 7.5 8.0 8.5 9.0 9.5 10.0z
4.0
4.5
5.0
b Ly!(z)
�IGAL = bLy↵IGAL�m(x) bLy↵(z) =
RMmax
Mmin
dM dndMLGAL b(z,M)
RMmax
Mmin
dM dndMLGAL

� Analytical calculation…
� “Continuum” emission from stars dominates
� At k ~ 1 Mpc-1 (R ~ 9 Mpc), rms ~ 0.03 nWm-2sr-1
Ly® Power Spectrum from Galaxies
10!1 100 101
k[h/Mpc]
10!6
10!5
10!4
10!3
10!2
10!1
k3 P(k)/
2!2[nW
m!2sr
!1]2
z = 7cont
rec
exc
total
K98
10!1 100 101
k[h/Mpc]
10!8
10!7
10!6
10!5
10!4
10!3
10!2
10!1
k3 P(k)/
2!2[nW
m!2sr
!1]2
z = 10cont
rec
exc
total
K98

Ly® IGM intensity
• Processes:
• Recombinations
• Radiative cooling
• Ly-n scattering
• Depends on:
• Ionization fraction
• Gas temperature
• matter density
• Need to connect to UV photons that escape galaxy and SFR
• Need simulations!
10!1 100
xi
10!4
10!3
10!2
!I ![nW
m!2sr!1]
IGM : TK (xi)
IGM : TK = 20000 K
IGM : TK = 50000 K
GAL
GAL : eA(z) = ±0.2A(z)
Analytical calculations
Total
10!2 10!1 100
xi
10!12
10!11
10!10
10!9
10!8
10!7
10!6
10!5
10!4
10!3
10!2
!I ![nW
m!2sr!1]
TK = 20000 K : exc
TK = 20000 K : rec
TK = 50000 K : exc
TK = 50000 K : rec
TK(xi) : exc
TK(xi) : rec
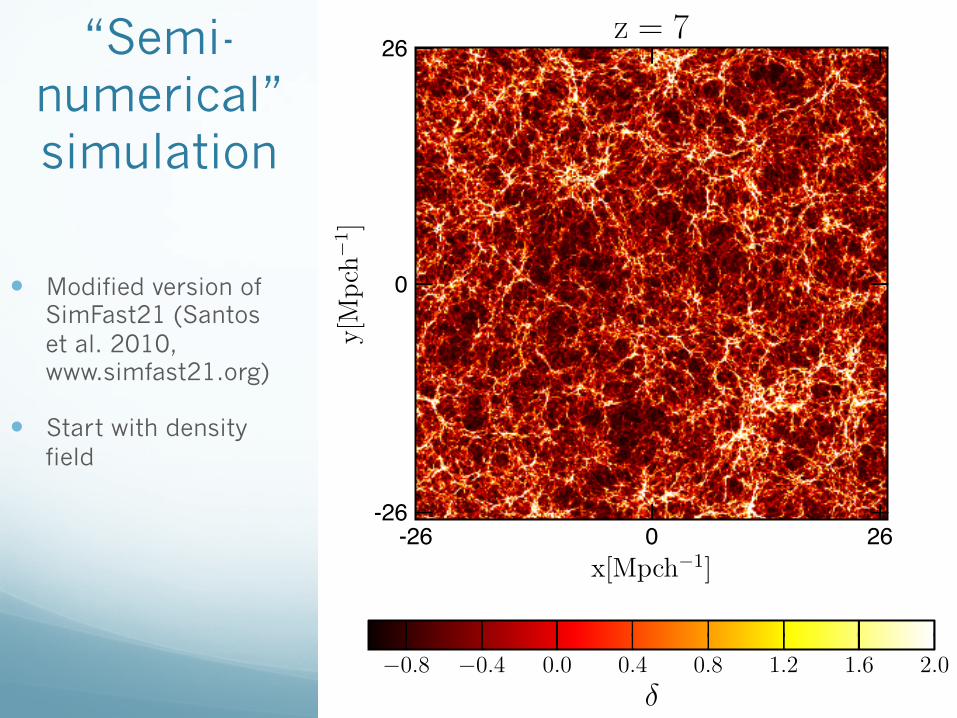
“Semi-numerical” simulation
� Modified version of SimFast21 (Santos et al. 2010, www.simfast21.org)
� Start with density field
-26 0 26x[Mpch!1]
26
0
-26
y[Mpch
!1]
z = 7
!0.8 !0.4 0.0 0.4 0.8 1.2 1.6 2.0
!

� Get halos (Sheth & Tormen)
� Minimum – 108 M¯
� Relate to SFR using previous model
-26 0 26x[Mpch!1]
26
0
-26
y[Mpch
!1]
z = 7
!4.0 !3.6 !3.2 !2.8 !2.4 !2.0 !1.6 !1.2 !0.8 !0.4 0.0
SFR (M"yr!1)Log

� Relate emission for UV, X-ray and Lyn photons to SFR � Assume POP II type stars
� Integrate temperature: � X-ray heating (IGM), see
Santos et al. 2008/2010
� Photoionization heating (HII bubbles)
� Adiabatic cooling (no other cooling sources)
� At same time generate HII bubbles in a given region using condition: � Nion ≥ NHI+NHeI (with
“excursion-set” algorithm”, e.g. Furlanetto et al. 2006)
� Use fesc!
� Take into account Recombinations (using temperature, n_HII)
� Add back recombined HI to bubble
-26 0 26x[Mpch!1]
26
0
-26
y[Mpch
!1]
z = 7
0.0 0.1 0.2 0.3 0.4 0.5 0.6 0.7 0.8 0.9 1.0xi = 0.84

� Use same prescription to relate Ly® emission from Galaxies to SFR
� Calculate IGM Ly® luminosity density from recombinations and excitations/heating (direct excitations negligible)
� Calculate luminosity density from scattering of Lyn photons in the IGM -26 0 26
x[Mpch!1]
26
0
-26
y[Mpch
!1]
z = 7
!4.0 !3.2 !2.4 !1.6 !0.8 0.0 0.8 1.6
log10[!I! (nWm!2sr!1)]

-26 0 26x[Mpch!1]
26
0
-26
y[Mpch
!1]
z = 10
0.0 0.1 0.2 0.3 0.4 0.5 0.6 0.7 0.8 0.9 1.0xi = 0.23
Ly® at z=10
-26 0 26x[Mpch!1]
26
0
-26
y[Mpch
!1]
z = 10
!0.8 !0.4 0.0 0.4 0.8 1.2 1.6 2.0
!
-26 0 26x[Mpch!1]
26
0
-26
y[Mpch
!1]
z = 10
!4.0 !3.6 !3.2 !2.8 !2.4 !2.0 !1.6 !1.2 !0.8 !0.4 0.0
SFR (M"yr!1)
-26 0 26x[Mpch!1]
26
0
-26
y[Mpch
!1]
z = 7
!4.0 !3.2 !2.4 !1.6 !0.8 0.0 0.8 1.6
log10[!I! ]
� Note: Ionized bubbles contribute to IGM because they are not 100% ionized – main contribution in IGM from excitations through heating

10!1 100 101k[h/Mpc]
10!7
10!6
10!5
10!4
10!3
10!2
10!1
100
k3P(
k)/2
!2[nWm
!2 sr!
1 ]2
GALIGM
10!1 100 101
k[h/Mpc]
10!15
10!13
10!11
10!9
10!7
10!5
10!3
10!1
101
103
k3 P(k)/
2!2[nW
m!2sr
!1]2
z = 7exc
cont
cool
rec
total
3d Power Spectrum
� Galaxies
Source of emission in ⌫I⌫(z=7) ⌫I⌫(z=8) ⌫I⌫(z=10)
[nWm
�2sr
�1]
Recombinations 8.0⇥ 10
�45.5⇥ 10
�42.4⇥ 10
�4
Excitations 5.2⇥ 10
�31.9⇥ 10
�32.3⇥ 10
�4
Continuum 1.2⇥ 10
�76.5⇥ 10
�72.1⇥ 10
�6
Total 6.0⇥ 10
�32.5⇥ 10
�34.7⇥ 10
�4
Source of emission in ⌫I⌫(z=7) ⌫I⌫(z=8) ⌫I⌫(z=10)
[nWm
�2sr
�1]
Recombinations 3.9⇥ 10
�32.3⇥ 10
�35.7⇥ 10
�4
Excitations 1.4⇥ 10
�38.0⇥ 10
�42.0⇥ 10
�4
Cooling 5.7⇥ 10
�63.0⇥ 10
�69.5⇥ 10
�7
Continuum 7.3⇥ 10
�35.7⇥ 10
�32.9⇥ 10
�3
Total 1.3⇥ 10
�28.8⇥ 10
�33.7⇥ 10
�3
� IGM
Intensity
Galaxies
IGM
Galaxies – thin IGM – thick lines
rms ~ 0.03 nWm-2sr-1

Experimental issues…
� Observations ~ 1 µm (z ~ 7)
� During the EoR we want to probe
� 3d modes: k ~ 0.05 Mpc-1 to 10 Mpc-1
� Spatial scales: r ~ 0.5 Mpc to 125 Mpc
� Angular scales: µ ~ 10’’ to 1 deg (l ~ 150 to 6.5x10⁴)
� Band: ±¸ ~ 2A to 450A (dz ~ 0.0016 to 0.37 - careful with cosmological
evolution…)
� Note: 450A for “one” redshift observation – want many more!
� But Ly® line width will “wash out”
fluctuations along line of sight, so maybe
no point to go below ±¸ ~ 30A? (k < 0.7
Mpc-1 along line of sight)
Ly\alpha widths (Ando et al. 2006)

Experimental issues…
� Noise dominated by photon count from sky glow (earth
observations) or Zodiacal light (space observations)
� Foregrounds: continuum emission and other lines (H®?) from
low-z galaxies
� Need many continuous slices/bands to fit-out the smooth
foregrounds
� Also correlate with other low-z surveys to check
contamination

Don’t forget other lines!
� 21cm intensity evolution with redshift
� Sensitive to: � IGM Gas density
� IGM temperature
� ionization fraction
� Star formation rate
� Lyman-α flux
See Santos et al. 2008/2010 (simfast21.org)
See also: - CO (Gong et al. 2011) - CII (Gong et al. 2011)
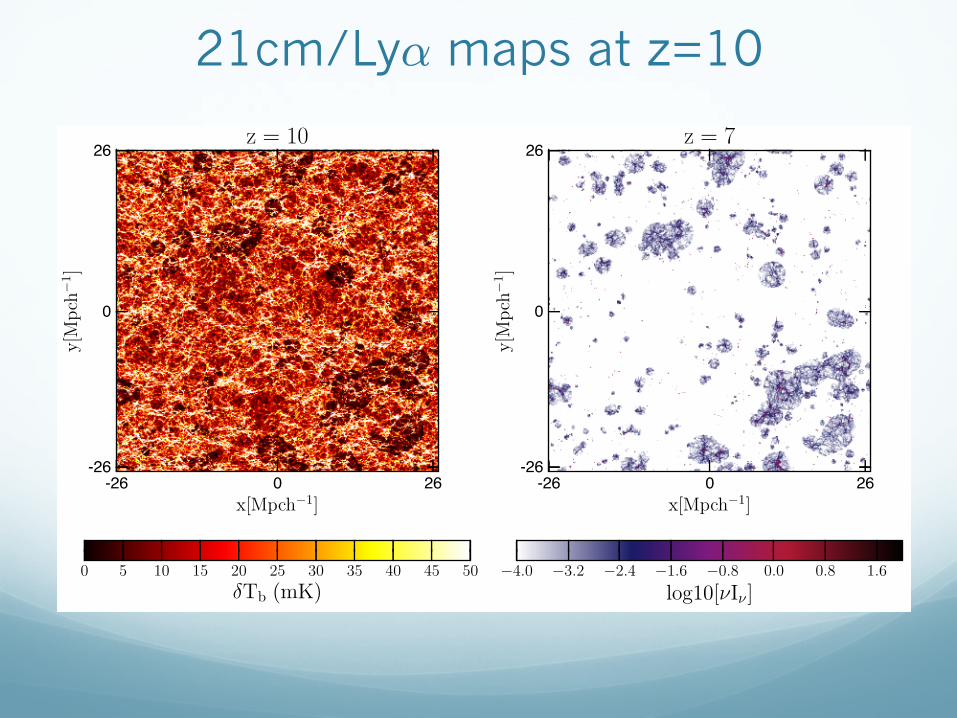
21cm/Ly® maps at z=10
-26 0 26x[Mpch!1]
26
0
-26
y[Mpch
!1]
z = 10
0 5 10 15 20 25 30 35 40 45 50
!Tb (mK)
-26 0 26x[Mpch!1]
26
0
-26
y[Mpch
!1]
z = 7
!4.0 !3.2 !2.4 !1.6 !0.8 0.0 0.8 1.6
log10[!I! ]

21cm/Ly® maps at z=7
-26 0 26x[Mpch!1]
26
0
-26
y[Mpch
!1]
z = 7
0 5 10 15 20 25 30 35 40 45 50
!Tb (mK)
-26 0 26x[Mpch!1]
26
0
-26
y[Mpch
!1]
z = 7
!4.0 !3.2 !2.4 !1.6 !0.8 0.0 0.8 1.6
log10[!I! (nWm!2sr!1)]

21cm/Ly® cross-correlation
� Cross-correlation coefficient (dashed – total, solid – galaxies only)
� Transition from negative to positive related to typical bubble size (increases from z=10 to z=7)
10!1 100 101k[h/Mpc]
!1.0
!0.5
0.0
0.5
1.0
r CII,H
I(k)
z = 7z = 8z = 9z = 10
Galaxies IGM+Galaxies

Conclusions
� We considered emission from both Galaxies and IGM
� Signal from Galaxies dominate over IGM with 1.3x10⁻² nWm-2sr-1 at z=7 and 3.7x10⁻³ nWm-2sr-1 at z=10
� 3d power spectrum – rms ~ 0.03 nWm-2sr-1
� Cross-correlation with 21 cm signal can help with foregrounds and provide information about the ionization process
� Ly® intensity mapping can provide a tomographic picture of the EoR but… probably need to go to space