LVT and AXI Philadelphia Task Force - Center for Study of ... PTRTF Presentation... · Land Value...
33
2009 [LVT AND AXI PHILADELPHIA TASK FORCE] Analysis and recommendations submitted to the Philadelphia Tax Reform Task Force Center for the Study of Economics 413 S. 10 th Street Philadelphia, PA 19147 Office: 215.923.7800 www.urbantools.org
Transcript of LVT and AXI Philadelphia Task Force - Center for Study of ... PTRTF Presentation... · Land Value...

2009
[LVT AND AXI PHILADELPHIA TASK FORCE] Analysis and recommendations submitted to the Philadelphia Tax Reform Task Force
Center for the Study of
Economics
413 S. 10th
Street
Philadelphia, PA 19147
Office: 215.923.7800
www.urbantools.org

Land Value Taxation Presentation for the 2009 Philadelphia Tax Reform Task Force Page 2 Center for the Study of Economics | www.urbantools.org
Table of Contents
Introduction ....................................................................................... 3
City-Wide Values ................................................................................ 4
Land Value Taxation (LVT) .................................................................. 5
LVT Impact by Tax Class ................................................................ 6
LVT Impact by Council District .................................................... 11
Assessed Exemption of Improvements (AXI) ................................... 18
AXI Impact by Tax Class .............................................................. 18
AXI Impact by Council District ..................................................... 22
LVT and AXI by Neighborhood ......................................................... 28
Conclusions and Recommendations ................................................ 32
Supplemental Material .................................................................... 33
Table of Figures
Figure 1: Citywide Real Estate Assessment Totals ............................. 4
Figure 2: Revenue Neutrality Among Options ................................... 5
Figure 3: Overall Impact of LVT vs Current Tax .................................. 6
Figure 5: LVT Count of Increase vs. Decrease by Tax Class ................ 8
Figure 6: LVT Total Dollar Difference by Tax Class ............................. 9
Figure 7: LVT Average Dollar Difference by Tax Class ...................... 10
Figure 8: LVT Average Percent Change by Tax Class ........................ 11
Figure 9: LVT Residential Percentage Increase vs. Decrease by
Council District ................................................................................. 12
Figure 10: LVT Non-residential Percentage Increase vs. Decrease by
Council District ................................................................................. 13
Figure 11: LVT Residential Count of Increase vs. Decrease by Council
District .............................................................................................. 14
Figure 12: LVT Non-residential Count of Increase vs. Decrease by
Council District ................................................................................. 15
Figure 13: LVT Residential Average Dollar Difference by Council
District .............................................................................................. 16
Figure 14: LVT Non-residential Average Dollar Difference by Council
District .............................................................................................. 17
Figure 15: AXI vs Current Tax, Total and Average by Tax Class ........ 19
Figure 16: AXI Percentage Increase vs Decrease by Tax Class ......... 20
Figure 17: AXI Count of Increase vs Decrease by Tax Class ............. 21
Figure 18: AXI Residential Percentage Increase vs Decrease by
Council District ................................................................................. 22
Figure 19: AXI Non-residential Percentage Increase vs Decrease by
Council District ................................................................................. 23
Figure 20: AXI Residential Average Dollar Difference by Council
District .............................................................................................. 24
Figure 21: AXI Non-residential Average Dollar Difference by Council
District .............................................................................................. 25
Figure 22: AXI Residential Total Dollar Difference by Council District
.......................................................................................................... 26
Figure 23: AXI Non-residential Total Dollar Difference by Council
District .............................................................................................. 27
Figure 24: LVT Total Dollar Difference by Neighborhood ................ 28
Figure 25: LVT Average Dollar Difference by Neighborhood ........... 29
Figure 26: AXI Total Dollar Difference by Neighborhood................. 30
Figure 27: AXI Average Dollar Difference by Neighborhood ........... 31

Land Value Taxation Presentation for the 2009 Philadelphia Tax Reform Task Force Page 3 Center for the Study of Economics | www.urbantools.org
Introduction
The Center for the Study of Economics is pleased to speak again before the Mayor’s Task Force. Testimony provided by many others and
ourselves has clearly narrowed the menu of choices to a few basic concepts: Philadelphia’s taxes are not progressive, they are too high, and
they are confusing and repellent to capital and labor. As Paul Levy said in earlier testimony we as a City must find a way to implement taxes
on subjects that are immobile. If that is where the taskforce moves, then we must repeat: land is immobile; buildings as an expression of
capital investment are mobile.
We believe that the facts and the theory point to a gradual shift and implementation of tax policy to one that removes most distortions that
effect personal, commercial and policy choices. To that end, we are happy to present summaries of our research into land value taxation,
and an alternative that relieves lower-end values properties of the burden of taxation, while maintaining revenue flows.
Using our BRT database from April 2009, we believe these simulations will provide a clear picture of how land value taxation and the
assessment exemption for improvement alternative1 will work:
1. By Citywide
2. By Class
3. By council District
4. By Neighborhood
11
Land Value Tax (LVT) is a way of taxing land using a change in tax rates. For example, a drop of 10% in the building tax rate would require that revenue loss be made up by an increase in the tax
rate on land values. The direct effect is to put a greater reliance on publicly created value (land) rather than privately created wealth (buildings, commerce, or wages). A higher tax on land has the
acknowledged effect of removing the distortions on markets that traditional taxes create. Assessment Exemption on Improvements (AXI) is slightly different. Put simply, a blanket permanent
abatement of a certain dollar amount on a building is put into effect. The overall tax rate then rises accordingly, with a greater impact on land value. For example, if a building is worth $50,000 and
the AXI is $50,000, there will be no tax on the building. If the building were worth $500,000 then the owner would pay tax on $450,000. This has the effect of sometimes dramatically reducing tax
burden on lower valued properties, most often residential properties
Land Value Taxation Presentation for the 2009 Philadelphia Tax Reform Task Force Page 4 Center for the Study of Economics | www.urbantools.org
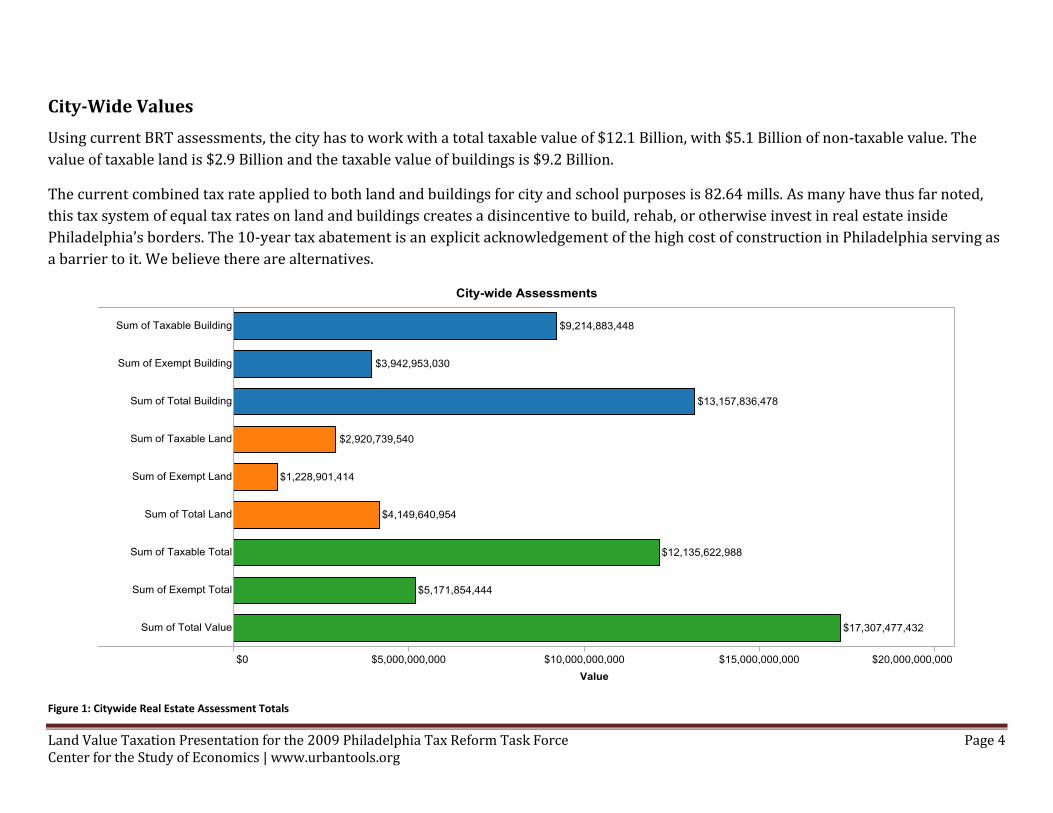
City-Wide Values
Using current BRT assessments, the city has to work with a total taxable value of $12.1 Billion, with $5.1 Billion of non-taxable value. The
value of taxable land is $2.9 Billion and the taxable value of buildings is $9.2 Billion.
The current combined tax rate applied to both land and buildings for city and school purposes is 82.64 mills. As many have thus far noted,
this tax system of equal tax rates on land and buildings creates a disincentive to build, rehab, or otherwise invest in real estate inside
Philadelphia’s borders. The 10-year tax abatement is an explicit acknowledgement of the high cost of construction in Philadelphia serving as
a barrier to it. We believe there are alternatives.
Figure 1: Citywide Real Estate Assessment Totals

Land Value Taxation Presentation for the 2009 Philadelphia Tax Reform Task Force Page 5 Center for the Study of Economics | www.urbantools.org
Land Value Taxation (LVT)
The Center proposes two revenue neutral alternatives in these simulations. The first, land value taxation, (or LVT) employs tax rates of
171.684 mills on land value and 54.417 mills on building values, to provide revenue-neutrality. These rates would garner 50% of revenue
from land, and 50% of the revenue from buildings2. Figure 2 demonstrates revenue-neutrality for both alternatives compared to the current
system.
Figure 2: Revenue Neutrality among Options
2 These revenue split rates are identical to the Controller’s Tax Structure Report (2001) and the Tax Reform Commission Report (2003) simulations of land value taxation

Land Value Taxation Presentation for the 2009 Philadelphia Tax Reform Task Force Page 6 Center for the Study of Economics | www.urbantools.org
LVT Impact by Tax Class Land Value Taxation (LVT) is the option discussed at the previous task force hearing on May 21, 2009. Figure 1 compares LVT to the current total and average tax
impact, both of which come out approximately the same.
Figure 3: Overall Impact of LVT vs. Current Tax
Land Value Taxation Presentation for the 2009 Philadelphia Tax Reform Task Force Page 7 Center for the Study of Economics | www.urbantools.org
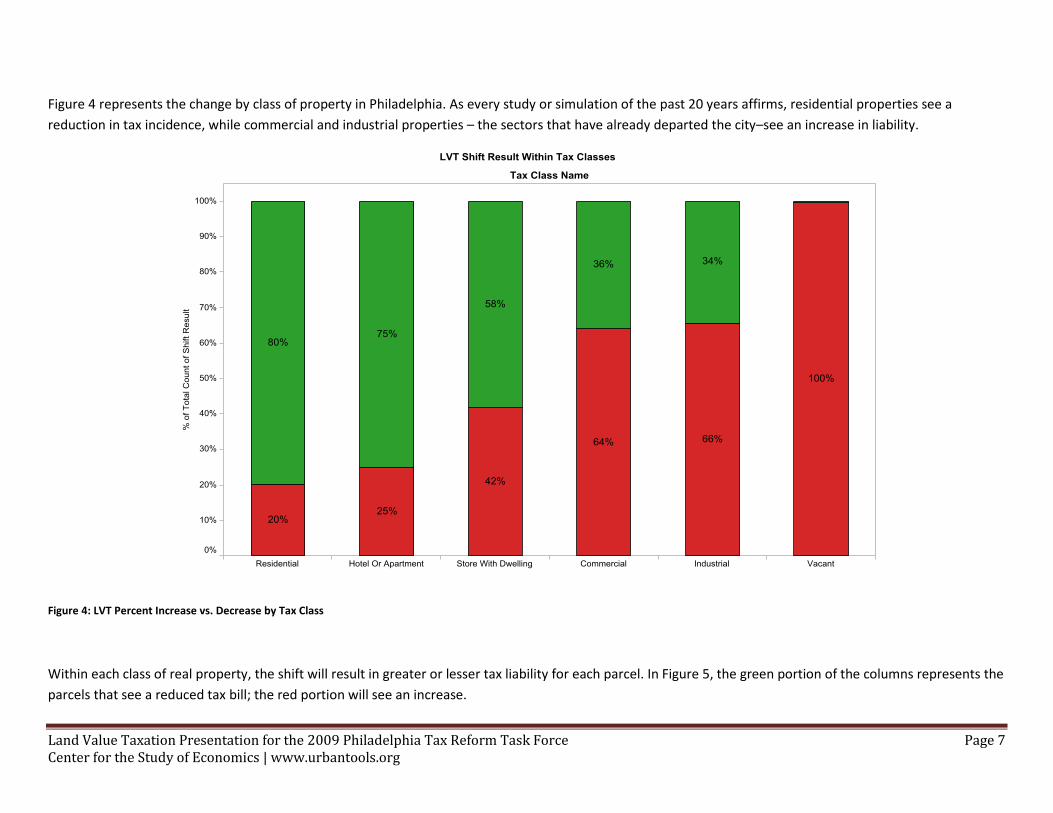
Figure 4 represents the change by class of property in Philadelphia. As every study or simulation of the past 20 years affirms, residential properties see a
reduction in tax incidence, while commercial and industrial properties – the sectors that have already departed the city–see an increase in liability.
Figure 4: LVT Percent Increase vs. Decrease by Tax Class
Within each class of real property, the shift will result in greater or lesser tax liability for each parcel. In Figure 5, the green portion of the columns represents the
parcels that see a reduced tax bill; the red portion will see an increase.

Land Value Taxation Presentation for the 2009 Philadelphia Tax Reform Task Force Page 8 Center for the Study of Economics | www.urbantools.org
Figure 5: LVT Count of Increase vs. Decrease by Tax Class
Within each class, the annual dollar change in tax incidence is presented in Figure 6. As theory would predict, residential property is most capital intensive on the
building side of the equation, and therefore would enjoy a greater reduction. The simulation demonstrates that outcome.

Land Value Taxation Presentation for the 2009 Philadelphia Tax Reform Task Force Page 9 Center for the Study of Economics | www.urbantools.org
Figure 6: LVT Total Dollar Difference by Tax Class
Figure 7 provides the same outcome, but on an annual average basis. Citywide, these changes may appear modest, but the simulation can be changed in policy
to effect greater or lesser impact.

Land Value Taxation Presentation for the 2009 Philadelphia Tax Reform Task Force Page 10 Center for the Study of Economics | www.urbantools.org
Figure 7: LVT Average Dollar Difference by Tax Class
Figure 8 demonstrates the annual percentage class change for each class. Both Class 1 and Class2 (Residential and Hotels/Apartments) show a significant annual
savings.

Land Value Taxation Presentation for the 2009 Philadelphia Tax Reform Task Force Page 11 Center for the Study of Economics | www.urbantools.org
Figure 8: LVT Average Percent Change by Tax Class
LVT Impact by Council District Council districts are an easily recognizable part of the Philadelphia cityscape. As such, the Center has grouped its findings in this manner.

Land Value Taxation Presentation for the 2009 Philadelphia Tax Reform Task Force Page 12 Center for the Study of Economics | www.urbantools.org
Figure 9 is clear that the Residential sector benefits greatly from LVT no matter the district. In general, the lower-valued residential properties in councilmanic
districts (Districts 6, 7 or 9) fare better .
Figure 9: LVT Residential Percentage Increase vs. Decrease by Council District

Land Value Taxation Presentation for the 2009 Philadelphia Tax Reform Task Force Page 13 Center for the Study of Economics | www.urbantools.org
Non-Residential Properties in the 10 (Figure 10) council districts see less of a direct benefit, as many are land intensive and less capital-intensive. Many are
blighted, abandoned or are not put to best use.
Figure 10: LVT Non-residential Percentage Increase vs. Decrease by Council District

Land Value Taxation Presentation for the 2009 Philadelphia Tax Reform Task Force Page 14 Center for the Study of Economics | www.urbantools.org
Broken out by Save or Increase by parcel (Figure 11) , the Council Districts again see benefit with LVT.
Figure 11: LVT Residential Count of Increase vs. Decrease by Council District

Land Value Taxation Presentation for the 2009 Philadelphia Tax Reform Task Force Page 15 Center for the Study of Economics | www.urbantools.org
Non-residential parcels (Figure 12) vary more by council district. Yet, the changes are widely varied in many districts.
Figure 12: LVT Non-residential Count of Increase vs. Decrease by Council District

Land Value Taxation Presentation for the 2009 Philadelphia Tax Reform Task Force Page 16 Center for the Study of Economics | www.urbantools.org
Figure 13 represents the average annual change per parcel in each council district. Established high value or up and coming districts (3, 5 or 8) experience little or
no change in tax liability, here expressed as an average.
Figure 13: LVT Residential Average Dollar Difference by Council District

Land Value Taxation Presentation for the 2009 Philadelphia Tax Reform Task Force Page 17 Center for the Study of Economics | www.urbantools.org
Figure 14 representes the non-residential annual average shift with land value taxation. The reality of business taxation in Philadelphia should show that the
property tax would be preferable to the Business Privilege Tax.
Figure 14: LVT Non-residential Average Dollar Difference by Council District

Land Value Taxation Presentation for the 2009 Philadelphia Tax Reform Task Force Page 18 Center for the Study of Economics | www.urbantools.org
Assessed Exemption of Improvements (AXI)
If Philadelphia were to move to a property tax (or preferably) a land value tax to increase competitiveness, consideration must be given to the large number of
retired homeowners on fixed incomes, owners of lower-valued residential (or commercial) real estate and renters. There are several traditional pathways to
provide ameliorations (See Supplements). Our proposal here illustrates what we call Assessment Exemption on Improvements (AXI). AXI exempts a dollar
amount of the taxable building value of a parcel. For the purposes of creating our simulation, CSE has chosen to exempt $10,460 (which is the median assessed
value of taxable buildings in Philadelphia). By reducing the taxable building assessment, the tax rate would be 124.522 mills (as opposed to 82.64 mills), and thus
the revenue would be the same.
Such a property tax system has been used in the past in other jurisdictions. For example, in Vancouver, British Columbia, land values were assessed at 100% of
market value, while buildings were assessed at only 50% of market value.
Our AXI proposal is simpler to understand, with powerful effects: enacts a permanent, universal abatement on a dollar amount of building value which will
proportionally exempt the greater part of a building from property tax, while a higher-valued parcel (Liberty Place, say) will see a statistically insignificant
building abatment, while seeing some increase on the land portion. The principles of vertical equity and ability-to-pay come into play.
We expect and hope that further research will be authorized by this task force or by city government. Granular examination of the data under AXI and LVT
simulations will demonstrate the feasibility of these programs, both under current assessments and under AVI.
AXI Impact by Tax Class As Figure 15 demonstrates, AXI provides significant tax relief for residential properties while maintaining revenue levels, and suggests a way to shift additional
revenue from mobile labor and capital tax bases onto the property tax without across the board impacts on all classes of property.
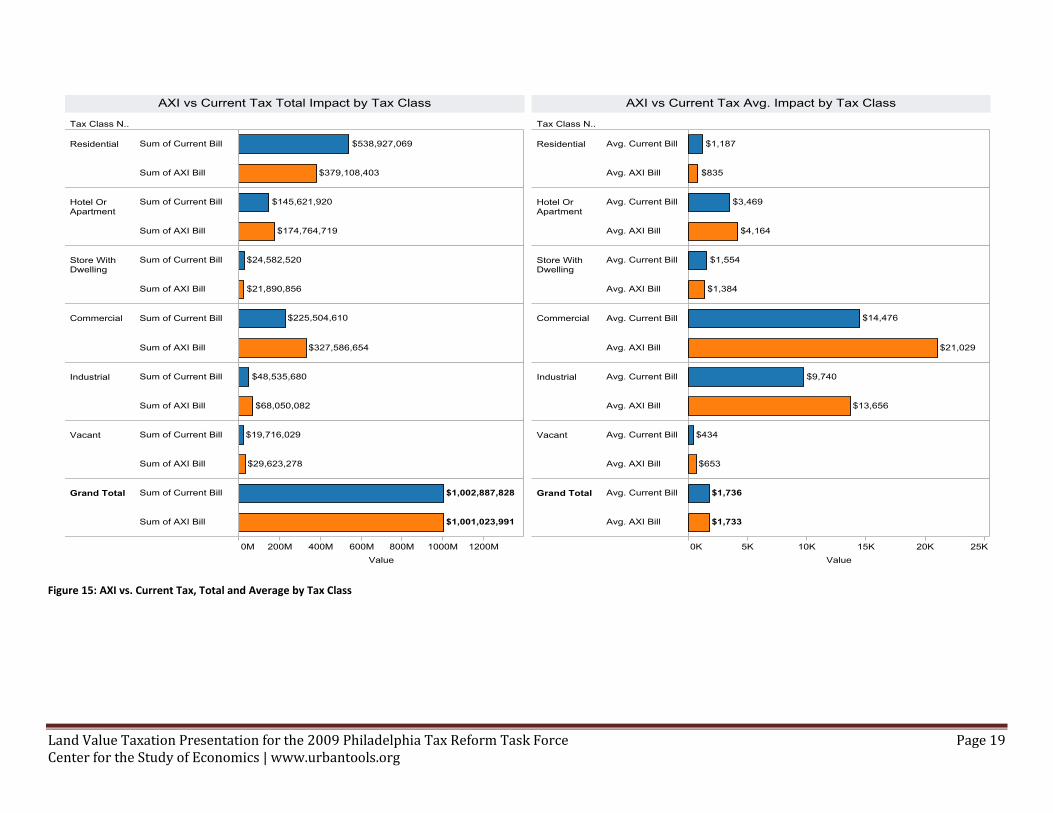
Land Value Taxation Presentation for the 2009 Philadelphia Tax Reform Task Force Page 19 Center for the Study of Economics | www.urbantools.org
Figure 15: AXI vs. Current Tax, Total and Average by Tax Class

Land Value Taxation Presentation for the 2009 Philadelphia Tax Reform Task Force Page 20 Center for the Study of Economics | www.urbantools.org
Figure 16 shows the outcome by class of our AXI proposal. Note that the percentage amount of parcels that save increases fairly substantially. Compared with
Figure 4, the results favor classes 2 and 3, while improving classes 4 and 5. Grey sections represent tax-exempt.
Figure 16: AXI Percentage Increase vs. Decrease by Tax Class

Land Value Taxation Presentation for the 2009 Philadelphia Tax Reform Task Force Page 21 Center for the Study of Economics | www.urbantools.org
Figure 17 Shows the parcel count changes with classes. Classes 1 through 3 see a majority decrease, while 4 through 6 experience an increase.
Figure 17: AXI Count of Increase vs. Decrease by Tax Class

Land Value Taxation Presentation for the 2009 Philadelphia Tax Reform Task Force Page 22 Center for the Study of Economics | www.urbantools.org
AXI Impact by Council District The shift under AXI by council district is more pronounced in favor of residential properties (Figure 18) compared to LVT in Figure 9.
Figure 18: AXI Residential Percentage Increase vs. Decrease by Council District

Land Value Taxation Presentation for the 2009 Philadelphia Tax Reform Task Force Page 23 Center for the Study of Economics | www.urbantools.org
Figure 19 is non-residential shift with AXI by council district. Savings by commercial properties, in generally less-desirable areas, are significant especially
compared with Figure 9, the LVT shift
Figure 19: AXI Non-residential Percentage Increase vs. Decrease by Council District

Land Value Taxation Presentation for the 2009 Philadelphia Tax Reform Task Force Page 24 Center for the Study of Economics | www.urbantools.org
Figure 20 shows the annual average residential change by council district. All districts see savings, with lower valued districts seeing dramatic reductions.
Figure 20: AXI Residential Average Dollar Difference by Council District

Land Value Taxation Presentation for the 2009 Philadelphia Tax Reform Task Force Page 25 Center for the Study of Economics | www.urbantools.org
Figure 21 shows the resulting average shift in burden onto non-residential classes.
Figure 21: AXI Non-residential Average Dollar Difference by Council District

Land Value Taxation Presentation for the 2009 Philadelphia Tax Reform Task Force Page 26 Center for the Study of Economics | www.urbantools.org
Figure 22 indicates the total residential dollar change under the AXI proposal by council district. Economically at-risk districts (such as District 6 and 9) see great
benefit.
Figure 22: AXI Residential Total Dollar Difference by Council District

Land Value Taxation Presentation for the 2009 Philadelphia Tax Reform Task Force Page 27 Center for the Study of Economics | www.urbantools.org
Figure 23 represents the total non-residential change by Council district using the AXI alternative
Figure 23: AXI Non-residential Total Dollar Difference by Council District

Land Value Taxation Presentation for the 2009 Philadelphia Tax Reform Task Force Page 28 Center for the Study of Economics | www.urbantools.org
LVT and AXI by Neighborhood
Oxfo
rd C
ircle
Mayfa
ir
Cente
r C
ity E
ast
Tacony
Girard
Esta
tes
West O
ak L
ane
Ric
hmond
Cente
r C
ity W
est
Oln
ey
Fra
nkf
ord
Som
ert
on
Law
ncre
st
Junia
ta P
ark
Roxb
oro
ugh
Pennypack
Bustle
ton
South
Phila
delp
hia
Elm
wood
Eastw
ick
West Torr
esdale
Holm
esburg
Overb
rook
Whart
on
Byberr
y
Pennsport
Rhaw
nhurs
t
Cedarb
rook
East M
ount A
iry
Fox C
hase
Manayunk
Wynnefield
Kin
gsessin
g
Marc
oni Pla
za
East O
ak L
ane
Bridesburg
Ogontz
Harr
ow
gate
East G
erm
anto
wn
Logan
Tio
ga
Kensin
gto
n
Huntin
g P
ark
Str
aw
berr
y M
ansio
n
Poin
t B
reeze
Gra
ys F
err
y
Riv
erfro
nt
Haddin
gto
n
Alle
gheny W
est
Fairhill
Mill C
reek
Nort
h C
entr
al
Popla
r
Pow
elton
Fis
hto
wn
Univ
ers
ity C
ity
Cobbs C
reek
Germ
anto
wn
Wis
sahic
kon P
ark
Hartra
nft
Pennypack P
ark
West K
ensin
gto
n
Bre
wery
tow
n
East F
alls
West M
ount A
iry
Cedar P
ark
Belm
ont
Schuylk
ill
Chestn
ut H
ill
Fairm
ount
-$3,000K
-$2,000K
-$1,000K
$0K
$1,000K
Sum
of LVT $
Diff
ere
nce
$1,0
46K
$983K
$395K
$156K
$86K
$73K
$55K
$21K
$33K
$10K
$3K
$1K
$10K
$0K
-$22K
-$60K
-$51K
-$79K
-$101K
-$139K
-$127K
-$142K
-$161K
-$207K
-$185K
-$152K
-$180K
-$198K
-$234K
-$213K
-$219K
-$236K
-$253K
-$267K
-$319K
-$320K
-$595K
-$340K
-$440K
-$537K
-$697K
-$695K
-$756K
-$820K
-$813K
-$817K
-$932K
-$879K
-$848K
-$966K
-$953K
-$964K
-$967K
-$1,1
76K
-$978K
-$1,0
44K
-$1,1
45K
-$1,1
97K
-$1,3
31K
-$1,3
06K
-$1,3
46K
-$1,2
36K
-$1,4
78K
-$1,4
88K
-$1,7
07K
-$1,8
70K
-$2,1
99K
-$2,7
60K
-$2,8
35K
-$1,145K
-$697K
-$207K
$0K
LVT Neighborhood Residential Shift Overview: Total $ Difference
-$2,835K $1,046K
Sum of LVT $ Difference
Figure 24: LVT Total Dollar Difference by Neighborhood

Land Value Taxation Presentation for the 2009 Philadelphia Tax Reform Task Force Page 29 Center for the Study of Economics | www.urbantools.org
Figure 25: LVT Average Dollar Difference by Neighborhood
Oxfo
rd C
ircle
Mayfa
ir
Cente
r C
ity E
ast
Tacony
Girard
Esta
tes
West O
ak L
ane
Ric
hm
ond
Cente
r C
ity W
est
Oln
ey
Fra
nkf
ord
Som
ert
on
Law
ncre
st
Junia
ta P
ark
Roxb
oro
ugh
Pennypack
Bustle
ton
South
Phila
delp
hia
Elm
wood
Eastw
ick
West Torr
esdale
Holm
esburg
Overb
rook
Whart
on
Byberr
y
Pennsport
Rhaw
nhurs
t
Cedarb
rook
East M
ount A
iry
Fox C
hase
Manayunk
Wynnefield
Kin
gsessin
g
Marc
oni Pla
za
East O
ak L
ane
Bridesburg
Ogontz
Harr
ow
gate
East G
erm
anto
wn
Logan
Tio
ga
Kensin
gto
n
Huntin
g P
ark
Str
aw
berr
y M
ansio
n
Poin
t B
reeze
Gra
ys F
err
y
Riv
erfro
nt
Haddin
gto
n
Alle
gheny W
est
Fairhill
Mill C
reek
Nort
h C
entr
al
Popla
r
Pow
elton
Fis
hto
wn
Univ
ers
ity C
ity
Cobbs C
reek
Germ
anto
wn
Wis
sahic
kon P
ark
Hartra
nft
Pennypack P
ark
West K
ensin
gto
n
Bre
wery
tow
n
East F
alls
West M
ount A
iry
Cedar P
ark
Belm
ont
Schuylk
ill
Chestn
ut H
ill
Fairm
ount
-$600
-$400
-$200
$0
$200
$400
Avg. LVT $
Diffe
rence
$150
$428
$109
$39
$48
$20
$21
$5$11
$286
$1
$168
$2
$0
-$37
-$10
-$51
-$37
-$17
-$25
-$14
-$21
-$18
-$551
-$46
-$15
-$22
-$30
-$45
-$25
-$37
-$32
-$45
-$57
-$131-$88
-$206
-$31
-$82
-$131
-$131
-$137
-$184-$
114
-$89
-$180-$
107
-$101
-$160
-$106
-$222
-$112
-$119
-$128
-$145
-$113
-$126
-$123
-$166
-$118
-$135
-$149
-$111
-$116
-$183
-$186
-$246
-$246-$
168
-$145-$112
-$37$0
LVT Neighborhood Residential Shift Overview: Avg. $ Difference
-$551 $428
Avg. LVT $ Difference
Land Value Taxation Presentation for the 2009 Philadelphia Tax Reform Task Force Page 30 Center for the Study of Economics | www.urbantools.org
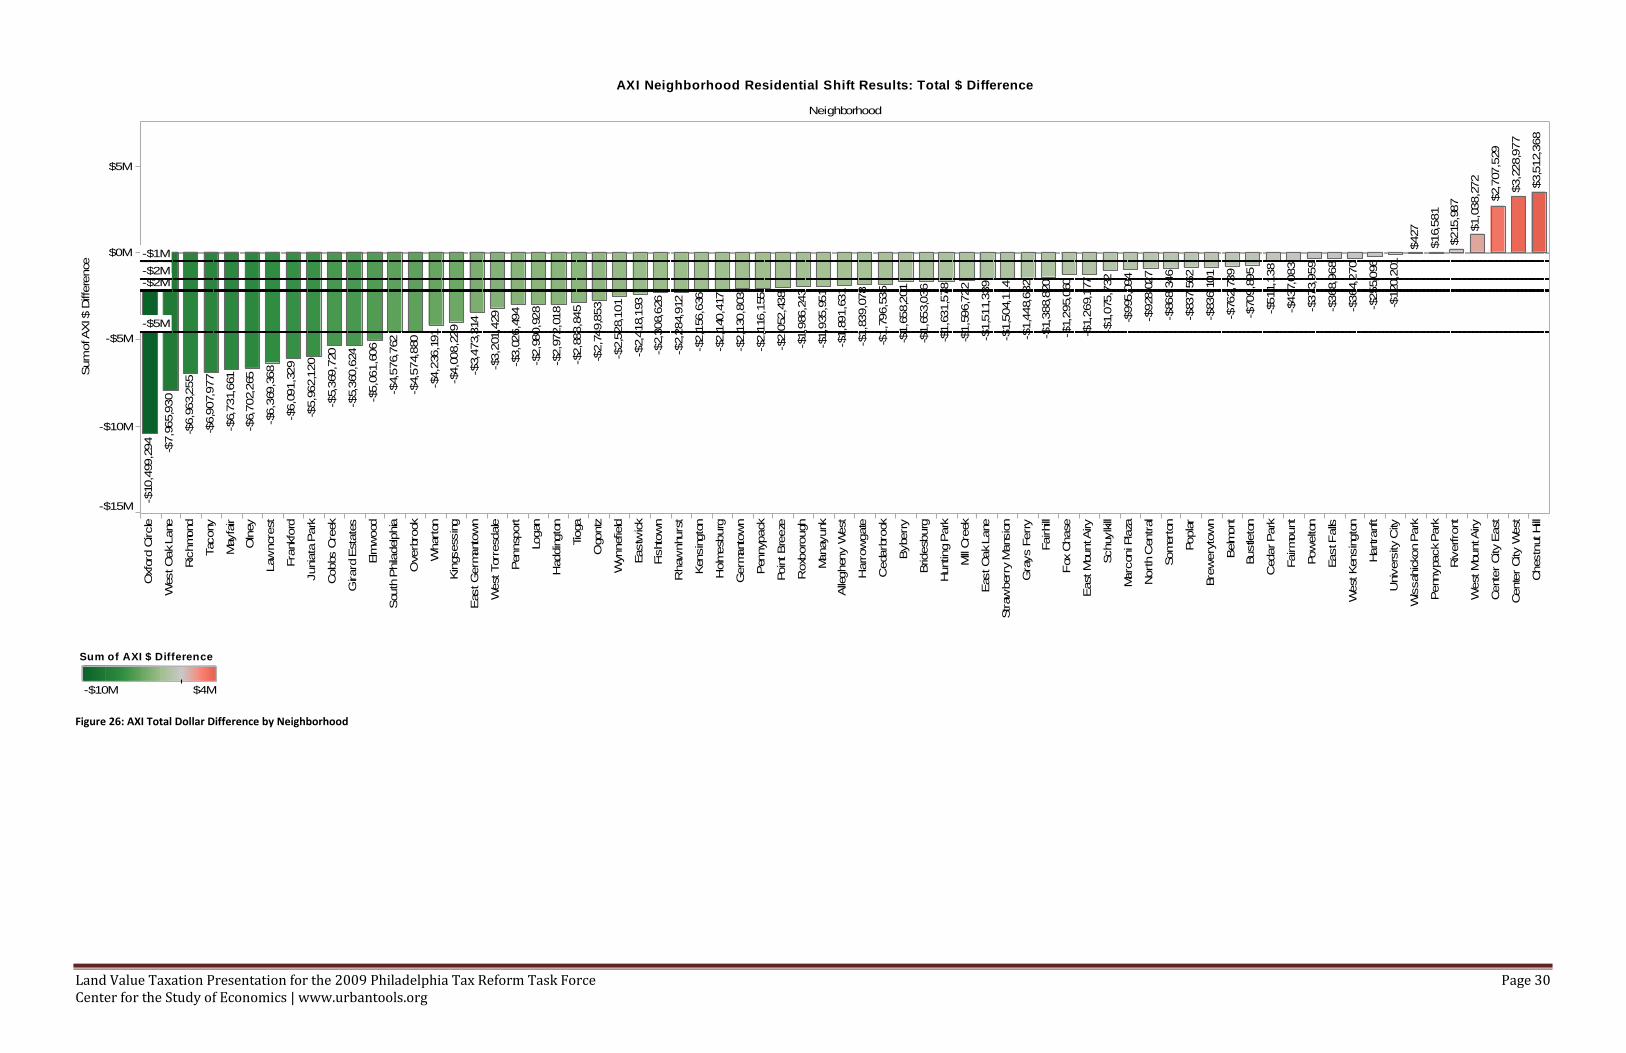
Figure 26: AXI Total Dollar Difference by Neighborhood
Neighborhood
Oxfo
rd C
ircle
West O
ak L
ane
Ric
hm
ond
Tacony
Mayfa
ir
Oln
ey
Law
ncre
st
Fra
nkfo
rd
Junia
ta P
ark
Cobbs C
reek
Girard
Esta
tes
Elm
wood
South
Phila
delp
hia
Overb
rook
Whart
on
Kin
gsessin
g
East G
erm
anto
wn
West Torr
esdale
Pennsport
Logan
Haddin
gto
n
Tio
ga
Ogontz
Wynnefield
Eastw
ick
Fis
hto
wn
Rhaw
nhurs
t
Kensin
gto
n
Holm
esburg
Germ
anto
wn
Pennypack
Poin
t B
reeze
Roxb
oro
ugh
Manayunk
Alle
gheny W
est
Harr
ow
gate
Cedarb
rook
Byberr
y
Bridesburg
Hunting P
ark
Mill C
reek
East O
ak L
ane
Str
aw
berr
y M
ansio
n
Gra
ys F
err
y
Fairhill
Fox C
hase
East M
ount A
iry
Schuylkill
Marc
oni Pla
za
Nort
h C
entr
al
Som
ert
on
Popla
r
Bre
wery
tow
n
Belm
ont
Bustle
ton
Cedar P
ark
Fairm
ount
Pow
elton
East F
alls
West K
ensin
gto
n
Hartra
nft
Univ
ers
ity C
ity
Wis
sahic
kon P
ark
Pennypack P
ark
Riv
erfro
nt
West M
ount A
iry
Cente
r C
ity E
ast
Cente
r C
ity W
est
Chestn
ut H
ill
-$15M
-$10M
-$5M
$0M
$5M
Sum
of A
XI $ D
iffe
rence
$3,5
12,3
68
$3,2
28,9
77
$2,7
07,5
29
$1,0
38,2
72
$215,9
87
$16,5
81
$427
-$120,2
01
-$255,0
96
-$364,2
70
-$368,9
68
-$373,9
59
-$437,0
83
-$511,1
38
-$709,8
95
-$762,7
39
-$836,1
01
-$837,5
62
-$868,3
46
-$928,0
27
-$995,0
94
-$1,0
75,7
32
-$1,2
69,1
77
-$1,2
95,0
60
-$1,3
88,8
20
-$1,4
48,6
32
-$1,5
04,1
14
-$1,5
11,3
39
-$1,5
96,7
22
-$1,6
31,5
78
-$1,6
53,0
36
-$1,6
58,2
01
-$1,7
96,5
35
-$1,8
39,0
78
-$1,8
91,6
31
-$1,9
35,9
51
-$1,9
86,2
43
-$2,0
52,4
38
-$2,1
16,1
55
-$2,1
30,8
03
-$2,1
40,4
17
-$2,1
56,6
36
-$2,2
84,9
12
-$2,3
08,6
26
-$2,4
18,1
93
-$2,5
28,1
01
-$2,7
49,8
53
-$2,8
88,8
45
-$2,9
72,0
18
-$2,9
80,9
28
-$3,0
26,4
94
-$3,2
01,4
29
-$3,4
73,3
14
-$4,0
08,2
29
-$4,2
36,1
91
-$4,5
74,8
80
-$4,5
76,7
62
-$5,0
61,6
06
-$5,3
60,6
24
-$5,3
69,7
20
-$5,9
62,1
20
-$6,0
91,3
29
-$6,3
69,3
68
-$6,7
02,2
65
-$6,7
31,6
61
-$6,9
07,9
77
-$6,9
63,2
55
-$7,9
65,9
30
-$10,4
99,2
94
-$5M
-$2M-$2M
-$1M
AXI Neighborhood Residential Shift Results: Total $ Difference
-$10M $4M
Sum of AXI $ Difference

Land Value Taxation Presentation for the 2009 Philadelphia Tax Reform Task Force Page 31 Center for the Study of Economics | www.urbantools.org
Figure 27: AXI Average Dollar Difference by Neighborhood
Neighborhood
Oxfo
rd C
ircle
West O
ak L
ane
Ric
hm
ond
Tacony
Mayfa
ir
Oln
ey
Law
ncre
st
Fra
nkfo
rd
Junia
ta P
ark
Cobbs C
reek
Girard
Esta
tes
Elm
wood
South
Phila
delp
hia
Overb
rook
Whart
on
Kin
gsessin
g
East G
erm
anto
wn
West Torr
esdale
Pennsport
Logan
Haddin
gto
n
Tio
ga
Ogontz
Wynnefield
Eastw
ick
Fis
hto
wn
Rhaw
nhurs
t
Kensin
gto
n
Holm
esburg
Germ
anto
wn
Pennypack
Poin
t B
reeze
Roxb
oro
ugh
Manayunk
Alle
gheny W
est
Harr
ow
gate
Cedarb
rook
Byberr
y
Bridesburg
Hunting P
ark
Mill C
reek
East O
ak L
ane
Str
aw
berr
y M
ansio
n
Gra
ys F
err
y
Fairhill
Fox C
hase
East M
ount A
iry
Schuylkill
Marc
oni Pla
za
Nort
h C
entr
al
Som
ert
on
Popla
r
Bre
wery
tow
n
Belm
ont
Bustle
ton
Cedar P
ark
Fairm
ount
Pow
elton
East F
alls
West K
ensin
gto
n
Hartra
nft
Univ
ers
ity C
ity
Wis
sahic
kon P
ark
Pennypack P
ark
Riv
erfro
nt
West M
ount A
iry
Cente
r C
ity E
ast
Cente
r C
ity W
est
Chestn
ut H
ill
-$1,000
-$500
$0
$500
$1,000
$1,500
Avg. AX
I $ D
iffere
nce
$1,5
28
$389
$303
$285
$576
$488
$142
-$198-$
73
-$125
-$139
-$370
-$63
-$285
-$78
-$188
-$190
-$393
-$109
-$157
-$345
-$298
-$249
-$244
-$154
-$361-$
181
-$415
-$287
-$251
-$678
-$365
-$438
-$330
-$276
-$473
-$215
-$204
-$315
-$464
-$405
-$414
-$318
-$404
-$563
-$473
-$583
-$334
-$334
-$507-$
333
-$350
-$473
-$371
-$488
-$526
-$564
-$588
-$573-$434
-$656
-$551
-$657
-$674
-$599
-$688-$
521
-$621
-$624
-$551
-$404
-$298
-$154
AXI Neighborhood Residential Shift Results: Avg. $ Difference
-$688 $1,528
Avg. AXI $ Difference

Land Value Taxation Presentation for the 2009 Philadelphia Tax Reform Task Force Page 32 Center for the Study of Economics | www.urbantools.org
Conclusions and Recommendations
1. A healthy city or jurisdiction relies on property tax. It is the last redoubt of tax revenue in a recession. It is the most stable tax. Move the city
towards real property tax. Philadelphia’s current menu of taxes that hurt the city makes the case that taxes on wages and business should be
replaceable by a real property tax. The “three-legged stool “proviso of good tax policy has never been found more wanting than at present.3
2. To make the real property tax responsive to city revenue needs and fulfill the canons of taxation:
a. It should bear as lightly as possible on production -- least impeding the growth of the general fund, from which taxes must be paid and the
community maintained.
b. It should be certain -- offering the least opportunity for abuse and corruption, and the least temptation for evasion.
c. It should bear equally -- giving no one an advantage, nor putting another at a disadvantage.
3. To accomplish that, we recommend that AVI be implemented as soon as possible.
4. Before the AVI comes into effect, the current property tax should be turned into a land value tax (LVT), or an assessment exemption for
improvements (AXI) as soon as possible as a way to improve the distribution of burden of the current property tax. AXI may require city or state
enabling legislation.
5. The Task Force should include the reform of the property tax into its final report, requesting a more intensive study of both alternatives
presented to the task force today.
6. Our alternative programs allow for greater reliance on the property tax without hurting low and fixed income property owners. Our alternative
is an attempt to introduce ability-to-pay and vertical equity into Philadelphia’s chaotic tax system.
Final Definitions:
1. Land Value Tax (LVT) is a shifting of the current flat millage rate into a higher tax rate on assessed taxable land and assessed taxable buildings.
2. Assessment Exemption for Improvements (AXI) is a permanent across the board dollar-amount abatement for all taxable buildings. The effect
on lower valued buildings is of a greater percentage drop in tax liability on the building. The abatement for a much higher valued building
would be correspondingly less. As higher-end construction has enjoyed extant abatements and other tax forgiveness programs, and brings
greater rental and market price returns, it is our position that the AXI program directs tax relief for the most at-risk neighborhoods and citizens.
3 “Tax students, especially at the state level, ply their trade by invoking one metaphor above all others: the three-legged stool. It rests on the claim that a sound and
successful tax regime for any government needs to rely on a three tax bases: income, property and sales. This is repeated so often that it passes today without much examination.”State Tax Notes, Vol.35, No.6, 2 February 2005, pp.377-381 Dr.H. William Batt

Land Value Taxation Presentation for the 2009 Philadelphia Tax Reform Task Force Page 33 Center for the Study of Economics | www.urbantools.org
Supplemental Material
See the following supplements submitted to the task force for more background information:
1. David Brunori: To Preserve Local Government, It's Time to Save the Property Tax, 1998
2. Bill Batt and Joshua Vincent 2007: Use and desirability of standard property tax relief measures. Testimony before Pennsylvania General
Assembly: Tools to Make the Pennsylvania Property Tax More Progressive
3. Wallace Oates and Robert Schwab: The Impact of Urban Land Taxation: The Pittsburgh Experience, 1996 Lincoln Institute of Land Policy
4. Letter from Mayor Stephen Reed, Harrisburg, PA to Mayor James Ruberto of Pittsfield Mass, October, 2006
5. "Final Report: Valuation of Land and Improvements in Philadelphia" By Roger A. McCain, Paul Jensen, and Stephen Meyer, Drexel
University, 2002