
LVis – Digital Library Visualizer - Fashion Technology...
8
Börner, Katy, Andrew Dillon, Margaret Dolinsky. 2000. LVis-Digital Library Visualizer. Proceedings of the IEEE International Conference on Information Visualization, Symposium on Information Visualization in Digital Libraries, London, UK, July 19-21. 77-81. LVis – Digital Library Visualizer Katy Börner & Andrew Dillon Indiana University, SLIS 10th Street & Jordan Avenue Bloomington, IN. 47405 USA E-mail: {katy, dillon}@indiana.edu Margaret Dolinsky School of Fine Arts, Indiana University 1201 East Seventh Street Room 123 Bloomington, IN. 47405 USA E-mail: [email protected] Abstract LVis is a joint project aiming at the 2-D and 3-D visualization of search results derived from user queries of digital library collections. This paper gives an overview of the intent of the project, the data mining techniques applied, the visualization metaphors used, and the usability studies planned and undertaken to date. 1. Introduction The project LVis (Digital Library Visualizer) aims to aid users' navigation and comprehension of large document sets retrieved from Digital Libraries. The first prototype provides an interface to the DIDO Image Data Bank. Figure 1 shows a still image of the 3-D human-computer interface with a typical data crystal in the front and two enlarged images in the back. Figure 1: CAVE Still of Image Crystals The paper starts with an introduction into the DIDO Image Data Bank followed by an overview of the general system architecture. Subsequently, we introduce Latent Semantic Analysis (LSA), which is used to automatically extract semantic relationships between images. The LSA output feeds into a clustering algorithm that groups images into classes of images that share semantically similar descriptors. A modified Boltzman algorithm is used to lay out images in space. The general interface metaphor as well as the user interface is explained and a sample scenario is provided. Finally, we discuss the usability studies undertaken as well as their first results. The paper concludes with a discussion of the approach as well as an outlook. 2. The Dido Image Bank The current prototype of LVis displays search results from the Dido Image Bank, provided by the Department of the History of Art, Indiana University. Dido stores about 9,500 digitized images from the Fine Arts Slide Library collection of over 320,000 images. The Dido database permits convenient access and use of images for teaching and research purposes at Indiana University via a Web interface at http://www.dlib.indiana.edu/collections /dido/. Each image in Dido is stored
Transcript of LVis – Digital Library Visualizer - Fashion Technology...

Börner, Katy, Andrew Dillon, Margaret Dolinsky. 2000. LVis-Digital Library Visualizer.Proceedings of the IEEE International Conference on Information Visualization, Symposium on Information Visualization in Digital
Libraries, London, UK, July 19-21. 77-81.
LVis – Digital Library Visualizer
Katy Börner & Andrew DillonIndiana University, SLIS
10th Street & Jordan AvenueBloomington, IN. 47405 USA
E-mail: {katy, dillon}@indiana.edu
Margaret Dolinsky School of Fine Arts, Indiana University
1201 East Seventh Street Room 123Bloomington, IN. 47405 USA
E-mail: [email protected]
Abstract
LVis is a joint project aiming at the 2-D and 3-D visualization of search results derived from user queries of digital library collections. This paper gives an overview of the intent of the project, the data mining techniques applied, the visualization metaphors used, and the usability studies planned and undertaken to date.
1. Introduction
The project LVis (Digital Library Visualizer) aims to aid users' navigation and comprehension of large document sets retrieved from Digital Libraries. The first prototype provides an interface to the DIDO Image Data Bank. Figure 1 shows a still image of the 3-D human-computer interface with a typical data crystal in the front and two enlarged images in the back.
Figure 1: CAVE Still of Image Crystals
The paper starts with an introduction into the DIDO Image Data Bank followed by an overview of the general system architecture. Subsequently, we introduce Latent Semantic Analysis (LSA), which is used to automatically extract semantic relationships between images. The LSA output feeds into a clustering algorithm that groups
images into classes of images that share semantically similar descriptors. A modified Boltzman algorithm is used to lay out images in space. The general interface metaphor as well as the user interface is explained and a sample scenario is provided. Finally, we discuss the usability studies undertaken as well as their first results. The paper concludes with a discussion of the approach as well as an outlook.
2. The Dido Image Bank
The current prototype of LVis displays search results from the Dido Image Bank, provided by the Department of the History of Art, Indiana University. Dido stores about 9,500 digitized images from the Fine Arts Slide Library collection of over 320,000 images. The Dido database permits convenient access and use of images for teaching and research purposes at Indiana University via a Web interface at http://www.dlib.indiana.edu/collections/dido/. Each image in Dido is stored together with its thumbnail representation as well as a textual description. Figure 2 shows a typical data set.
Bosch.Garden of Earthly Delights.Det.,BOSCH, HIERONYMOUS,Garden of Earthly Delights.Details.Couplein a bubble, after 1500, o/p 220x195 cm,Madrid, Prado.2823, DeTolnay.233.11/3/76,RB.PTG.NTH
Figure 2: DIDO Image Data Representation
For demonstration purposes the search result for three predefined search keys: “Paintings by Bosch”, “African”, and “Chinese Paintings”, containing 11, 17, and 671 images respectively, were selected as test data sets and analyzed for visualization.

3. Overview
The general system architecture is displayed in Figure 3. It can be divided in data analysis done in a preprocessing step and the actual display of a search result at retrieval time.
Figure 3: System Architecture
During the preprocessing stage (Figure 3, left), a larger data set of Dido is analyzed using a computationally expensive mathematical technique called Latent Semantic Analysis. The resulting Document-Document-Similarity matrix reflects the semantic relationships between images and can be used at retrieval time (Figure 3, right) to organize and display a list of matching images using Clustering Techniques and an appropriate spatial layout algorithm. This is explained in detail subsequently.
4. Semantic Organization of Search Results
In order to display search results according to their semantic relationships, the semantic structure has to be extracted, images have to be clustered according to the extracted semantic structure, the best clustering partition has to be selected, and the images need to be laid out spatially, see also (Börner, SPIE 2000).
4.1. Extracting Semantic Structure
Latent Semantic Analysis (LSA) (Landauer et al., 1998) is used to automatically extract salient semantic relationships between images based on their textual representation. LSA allows one to induce and represent aspects of the meaning of words. In order to do this, a representative sample of documents is converted to a term-by-document matrix in which each cell indicates the frequency with which each term (rows) occurs in each document (columns). Note that documents correspond to images and terms refer to the words in the image descriptions.
LSA has demonstrated improved performance over the traditional vector space techniques by modeling word-relationships using a reduced approximation of the term by document matrix for the column and row space
computed by the singular value decomposition. It overcomes the problems of synonymy (variability in human word choice) and polysemy (same word has often different meanings) by automatically organizing documents into a semantic structure more appropriate for information retrieval.
4.2 Clustering of Search Results
At retrieval time, the result of a database query is hierarchically organized, based on the LSA output. A nearest-neighbor-based, agglomerative, hierarchical, unsupervised conceptual clustering algorithm (Arabie, 1996) is applied to create a hierarchy of clusters grouping documents of similar semantic structure. Clustering starts with a set of singleton clusters, each containing a single document (image) di D, i=1, ..., N, where D equals the entire set of documents and N equals the number of all documents. The two most similar clusters over the entire set D are merged to form a new cluster that covers both. This process is repeated for each of the remaining N-1 documents. A complete linkage algorithm is applied to determine the overall similarity of document clusters based on the document similarity matrix.
Merging of document clusters continues until a single, all-inclusive cluster remains. At termination, a uniform, binary hierarchy of document clusters is produced.
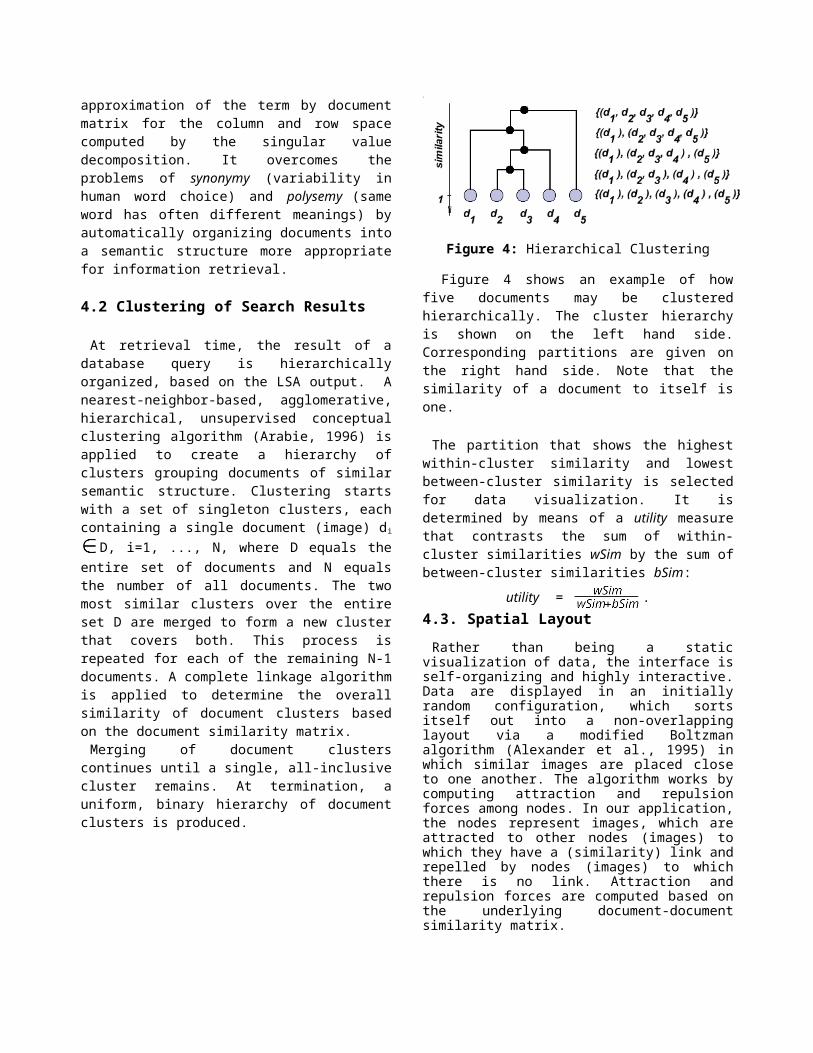
Figure 4: Hierarchical Clustering
Figure 4 shows an example of how five documents may be clustered hierarchically. The cluster hierarchy is shown on the left hand side. Corresponding partitions are given on the right hand side. Note that the similarity of a document to itself is one.
The partition that shows the highest within-cluster similarity and lowest between-cluster similarity is selected for data visualization. It is determined by means of a utility measure that contrasts the sum of within-cluster similarities wSim by the sum of between-cluster similarities bSim:
utility = .4.3. Spatial Layout
Rather than being a static visualization of data, the interface is self-organizing and highly interactive. Data are displayed in an initially random configuration, which sorts itself out into a non-overlapping layout via a modified Boltzman algorithm (Alexander et al., 1995) in which similar images are placed close to one another. The algorithm works by computing attraction and repulsion forces among nodes. In our application, the nodes represent images, which are attracted to other nodes (images) to which they have a (similarity) link and repelled by nodes (images) to which there is no link. Attraction and repulsion forces are computed based on the underlying document-document similarity matrix.
5. Interface
Two interfaces have been implemented for LVis. A 2-D Java applet that can be used on a desktop computer --see (Börner, 2000-DL) for details -- as well as a 3-D immersive environment for the CAVE (Cruz-Neira et al., 1993). Both interfaces give users access to three levels of detail: they provide an overview about document clusters and their relations; they show how images belonging in the same cluster relate to one another; and they give more detailed information about an image such as its description or its full size version. In the following we describe the underlying metaphors (Dolinsky, 1998) and the user interface for the 3-D immersive CAVE environment.
Figure 5: Two Wooden Dance Masks from Gabon
Starting the CAVE application with the above-mentioned three predefined search result sets, participants enter a virtual display theater that stages the digital library as a cyberspace Easter Island. It is composed of a main environment that presents gateways or portals to specific subject categories established by predefined searches.
Figure 6: Portal Representations of Africa and Bosch
The gateways
resemble heads and are seen as sculptural forms (Dolinsky, 1997). The notion of “headings” is extrapolated into the creation of “heads”. These heads, or 3-D icons, represent subject categories. Oftentimes, the heads are inspired by images of the data set such as masks in the “African” data set (see Figure 5). Participants travel through the environment and confront the categorical headings (see Figure 6 or 7 for examples). In order to explore the heading further, participants must “get inside its head.” Once this confrontation occurs and the head is entered, the environment is transformed to a new one displaying the image database for that heading.

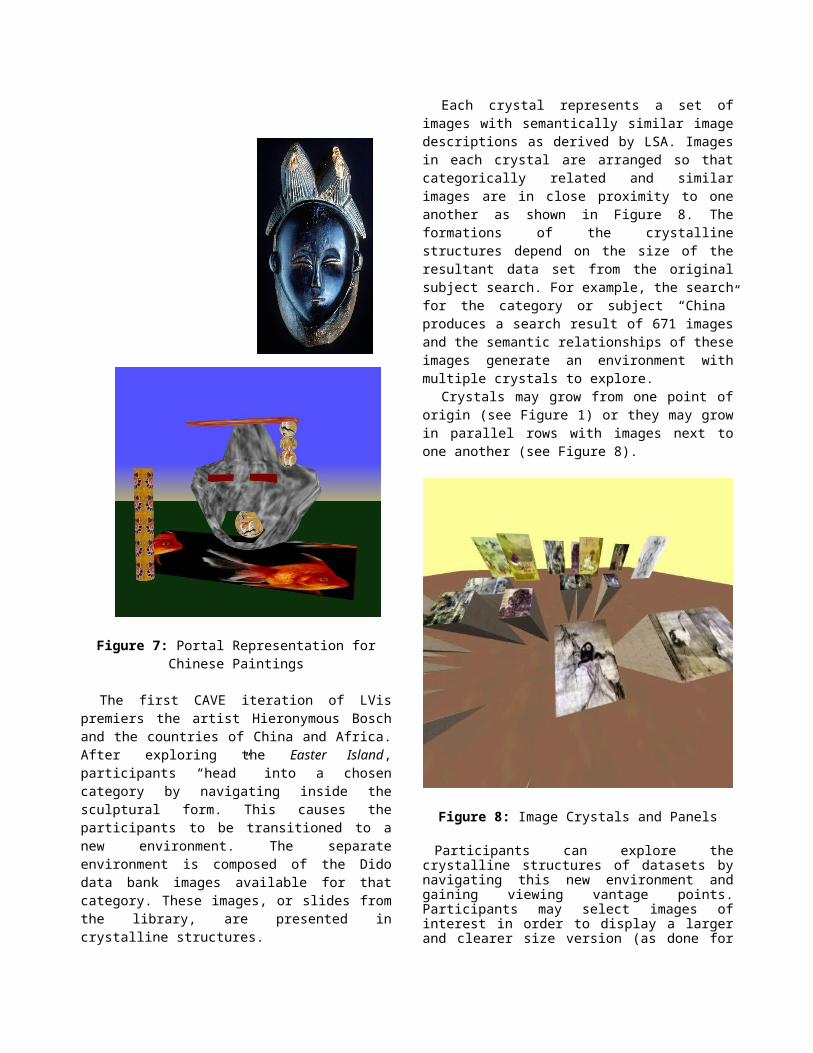
Figure 7: Portal Representation for Chinese Paintings
The first CAVE iteration of LVis premiers the artist Hieronymous Bosch and the countries of China and Africa. After exploring the Easter Island, participants “head” into a chosen category by navigating inside the sculptural form. This causes the participants to be transitioned to a new environment. The separate environment is composed of the Dido data bank images available for that category. These images, or slides from the library, are presented in crystalline structures.
Each crystal represents a set of images with semantically similar image descriptions as derived by LSA. Images in each crystal are arranged so that categorically related and similar images are in close proximity to one another as shown in Figure 8. The formations of the crystalline structures depend on the size of the resultant data set from the original subject search. For example, the search for the category or subject “China” produces a search result of 671 images and the semantic relationships of these images generate an environment with multiple crystals to explore.
Crystals may grow from one point of origin (see Figure 1) or they may grow in parallel rows with images next to one another (see Figure 8).
Figure 8: Image Crystals and Panels
Participants can explore the crystalline structures of datasets by navigating this new environment and gaining viewing vantage points. Participants may select images of interest in order to display a larger and clearer size version (as done for two images in Figure 1). If the larger version is not satisfactory it can be returned to its previous iconic presentation. Those that are of interest may be exhibited in unison and collected as a separate and uniquely chosen grouping.
6. Usability studies
To date, we have examined only the user's development of physical control in the immersive world through a study of object manipulation in physical space and the CAVE. This provided us with baseline data on how easily users could adjust to 3-D information spaces in terms of feeling comfortable selecting and moving objects. This revealed that users in the CAVE environment could be expected to take longer to complete a movement task (see Waite, 2000).
One-way ANOVAs were performed to compare subjects' performance on the task between the two environments. The number of moves to solve the puzzle varied widely (15-113) but only approached significance between the environments on the first trial p < .06 (Real=23.83; VR=35.67).
However, the time to move a ring was significantly different between two environments across all four trials, with performance in the CAVE being significantly slower (see Table 1), as expected.
ANOVA: SS DF MS F PTrial 1: 22.411 1 22.411 26.557 0.000
Error 8.439 10 0.844Trial 2: 15.402 1 15.402 16.057 0.002
Error 9.592 10 0.959Trial 3: 3.873 1 3.873 15.072 0.003
Error 2.569 10 0.257Trial 4: 9.668 1 9.668 10.684 0.008
Error 9.049 10 0.905
Table 1: ANOVA scores comparing time by trial in each environment to move an object
Current plans are to concentrate on comparing user performance and satisfaction with each interface. We have completed a user and task analysis of typical Dido users and discussed usage scenarios with a domain expert. From this, we have developed a task taxonomy that we will apply to the 2-D desktop and the 3-D immersive CAVE interface. This taxonomy includes tasks such as:
Find and save 5 examples of Chinese Bronze work Find and save 5 images of African musical
instruments Find and save 5 images that contain examples of
masks
The rationale is to provide tasks that demand more than a simple input of a query (e.g. find all paintings by Monet). In this way we are hoping to encourage wider exploration of the information space by the users.
Our measures will include the standard usability indexes of effectiveness (completed searches), efficiency (time taken, path length) and satisfaction (user ratings of interfaces on a survey tool designed for this experiment). From these measures we will also compare user performance over time to see if there is any performance improvement over the trial, which we expect will occur in the CAVE but may not occur in the other environment. Within the 3-D space we will pay particular attention to the navigation paths taken by users so that we can gain some insight into what cues they are exploiting to guide their behavior.
A comparison of free sorting results for image data by human subjects with the spatial organization of images as derived via the mathematical clustering techniques applied during data analysis is reported in (Börner, IV2000).
7. Outlook
It has been suggested to us that searches for images would be helpful if the participant is able to actually see the iconic image enlarge to a true to life size relationship. This dynamic is something that cannot happen in a real life slide library. The manipulation and display of information with multiple size relationships is possible in the CAVE. In addition to this, images can be mapped on a virtual map of the world revealing their place of origin. The connection of LVis to complementary online resources such as image catalogs, music libraries, or even other educational CAVE projects would enhance the course material used in art history classes as well.
8. Acknowledgements
We would like to thank all the students involved in this project: Andrew J. Clune, Ryan Schnizlein, Ho Sang Cheon, Kevin Kowalew, Sumayya A. Ansari, and Tyler Waite. We are grateful to Eileen Fry from Indiana University for her insightful comments on this research as well as ongoing discussions concerning the Dido Image Bank. Dave Pape of the Electronic Visualization Laboratory, UIC is the software architect for XP, the underlying CAVE framework. The SVDPACK by M. Berry was used for computing the singular value decomposition. The research is supported by a High Performance Network Applications grant of Indiana University, Bloomington.
Colored, full-size versions of Figures 1, 6, 7, and 8 are accessible at http://ella.slis.indiana.edu/~katy/IV-LVis .
9. References
Alexander, Garcia, and Alder (1995) Simulation of the Consistent Boltzman Equation for Hard Spheres and Its Extension to Dense Gases, Lecture Notes in Physics, Springer Verlag.
Arabie, P, Hubert L. J. and De Soete G. (Editors) (1996) Clustering and Classification. World Scientific Pub Co.
Börner, K. (2000) Visible Threads: A smart VR interface to digital libraries. Proceedings of IST/SPIE's 12th Annual International Symposium: Electronic Imaging 2000, Visual Data Exploration and Analysis, San Jose, CA., pp 228-237, http://ella.slis.indiana.edu/~katy/SPIE00/
Börner, K. (in press) Extracting and visualizing semantic structures in retrieval results for browsing. ACM Digital Libraries, San Antonio, Texas, June 2-7, 2000. http://ella.slis.indiana.edu/~katy/DL00/

Börner, K. (in press) Searching for the perfect match: A comparison of sorting results for images by human subjects and by Latent Semantic Analysis techniques. Information Visualization (IV2000). London, UK, July 19-21, 2000.
Berry, M. et al. SVDPACKC (Version 1.0) User's Guide, University of Tennessee Tech. Report CS-93-194, 1993 (Revised October 1996). See also http://www.netlib.org/svdpack/index.html.
Cruz-Neira, C., Sandin, D. J. and DeFanti, T. A. (1993) Surround-screen projection-based virtual reality: The design and implementation of the CAVE, in J. T. Kajiya (ed.), Computer Graphics (Proceedings of SIGGRAPH 93), Vol. 27, Springer Verlag, pp. 135-142.
Dolinsky, M. (1998) Virtual Environment as Rebus. Consciousness Reframed 19-23 July 1998. Newport, University of Wales College Center for the Advanced
Inquiry in the Interactive Arts. Consciousness Reframed, second annual International CAiiA Research Conference.
Dolinsky, M. (1997) Creating Art through Virtual Environments. Computer Graphics 31(4): p.34-35, 82 New York: ACM Press.
The Indiana University Department of the History of Art Dido Image Bank, http://www.dlib.indiana.edu/ collections/dido/
Landauer, T. K., Foltz, P. W., & Laham, D. (1998) Introduction to Latent Semantic Analysis. Discourse Processes, 25, 259-284.
Waite, T. (2000) VEHanoi: Performance Differences in Virtual vs Real Environments. MAICS 2000 - MidWest Artificial Intelligence and Cognitive Science Conference, pp. 13-20


![On the WaytoNew Possible Na-IonConductors:The Voronoi ...ivmooc2018.cns.iu.edu/docs/2.pdf · DirichletApproach,Data Mining and Symmetry Considerations in TernaryNaOxides Falk Meutzner,*[a]](https://static.fdocuments.in/doc/165x107/5faeffb61dd86178d74fd43f/on-the-waytonew-possible-na-ionconductorsthe-voronoi-dirichletapproachdata.jpg)