LUZ_ET_AL._2015
17
Techno-economic analysis of municipal solid waste gasification for electricity generation in Brazil Fábio Codignole Luz a , Mateus Henrique Rocha b,⇑ , Electo Eduardo Silva Lora b , Osvaldo José Venturini b , Rubenildo Vieira Andrade b , Marcio Montagnana Vicente Leme b , Oscar Almazán del Olmo c a Department of Industrial Engineering, University of Rome Tor Vergata, Via Del Politécnico 1, 00133 Rome, Italy b NEST – Excellence Group in Thermal Power and Distributed Generation, Institute of Mechanical Engineering, Federal University of Itajubá, Av. BPS 1303, Itajubá, Minas Gerais State CEP: 37500-903, Brazil c ICIDCA – Instituto Cubano de Investigaciones de los Derivados de la Caña de Azúcar, Via Blanca y Carretera Central 804, San Miguel Del Padrón, A.P. 4036, La Habana, Cuba article info Article history: Received 27 February 2015 Accepted 25 June 2015 Keywords: Municipal solid waste Gasification Synthesis gas Techno-economic analysis Waste-to-energy Renewable energy abstract The key objective of this paper is to analyze the techno-economic feasibility of this alternative for the Brazilian municipalities, classified according to population subgroups, using this parameter as a basis for the calculation of the municipal solid waste generated, the project costs and revenues. Different expenses were taken into consideration, like equipments and installation costs, operation and mainte- nance costs and the interest rate of the investment. In relation to revenues, they come from of the sale of electricity, the incomes of the recyclable materials, the fees paid by the Brazilian municipalities for the disposal of municipal solid waste in sanitary landfills and incomes by the carbon credits. An analysis of each population subgroup, combining three different economical scenarios was done, with an annual rate of interests of 10.58% for Scenario 1, 7.5% for Scenario 2 and 15% for Scenario 3. The economic fea- sibility was evaluated using as economic indicators the net present value and the internal rate of return. The net present value was positive for the municipalities with more than 60,714 inhabitants for the Scenario 1, 34,203 for Scenario 2 and 259,845 for Scenario 3. A hypothetic gasification plant is capable to generate 905 kW/ton municipal solid waste for a population of 60,714 inhabitants (Scenario 1), 794 kW/ton municipal solid waste for a population of 34,203 inhabitants (Scenario 2) and 1065 kW/ton municipal solid waste for a population of 259,845 inhabitants (Scenario 3). It is concluded that the economic feasibility increases with the installation of bigger units, showing a positive scale up gains, therefore as higher the capacity of the installation lower the specific costs and higher are the benefits. Ó 2015 Elsevier Ltd. All rights reserved. 1. Introduction Growing problems of the treatment and disposal of agricultural wastes, industrial wastes and Municipal Solid Wastes (MSW), cres- cent concerns for human and environmental well-being and dwin- dling reserves of fossil fuels, have led to research into the potential of utilizing appropriate technologies to recover energy and useful by-products from domestic and industrial solid wastes [1]. However, to determine the optimum route of biofuels and electric- ity production [2] and wastes conversion into energy should be carried out an analysis of the environmental impact assessment [3,4]. MSW landfills represent the dominant option for waste disposal in many parts of the world. In general, the comparatively high costs of treatment and disposal alternatives are a major reason for the reliance on MSW landfills [5]. Nevertheless, even some highly industrialized countries largely depend on landfilling. It has been pointed out the spectacular increase of the amount of MSW that must be treated and disposed, that currently, it is becoming the main issue of MSW management. In the future the quantity of MSW will be much higher than today [6]. Brazil is the 7th world economy and the biggest country in Latin America, its population (204 million inhabitants) generates more than 208,000 tons MSW/day. About 70% of the municipalities have less than 20 thousand inhabitants, in contrast to the 15 largest metropolitan regions that have 37% of the population, correspond- ing to 72 million inhabitants. The average MSW per capita genera- tion was 1.15 kg MSW/person/day. The collection of MSW from http://dx.doi.org/10.1016/j.enconman.2015.06.074 0196-8904/Ó 2015 Elsevier Ltd. All rights reserved. ⇑ Corresponding author. E-mail addresses: [email protected] (F.C. Luz), [email protected] (M.H. Rocha), [email protected] (E.E.S. Lora). Energy Conversion and Management 103 (2015) 321–337 Contents lists available at ScienceDirect Energy Conversion and Management journal homepage: www.elsevier.com/locate/enconman
-
Upload
ruben-nggohele -
Category
Documents
-
view
2 -
download
0
description
b
Transcript of LUZ_ET_AL._2015

Energy Conversion and Management 103 (2015) 321–337
Contents lists available at ScienceDirect
Energy Conversion and Management
journal homepage: www.elsevier .com/ locate /enconman
Techno-economic analysis of municipal solid waste gasificationfor electricity generation in Brazil
http://dx.doi.org/10.1016/j.enconman.2015.06.0740196-8904/� 2015 Elsevier Ltd. All rights reserved.
⇑ Corresponding author.E-mail addresses: [email protected] (F.C. Luz), [email protected]
(M.H. Rocha), [email protected] (E.E.S. Lora).
Fábio Codignole Luz a, Mateus Henrique Rocha b,⇑, Electo Eduardo Silva Lora b, Osvaldo José Venturini b,Rubenildo Vieira Andrade b, Marcio Montagnana Vicente Leme b, Oscar Almazán del Olmo c
a Department of Industrial Engineering, University of Rome Tor Vergata, Via Del Politécnico 1, 00133 Rome, Italyb NEST – Excellence Group in Thermal Power and Distributed Generation, Institute of Mechanical Engineering, Federal University of Itajubá, Av. BPS 1303, Itajubá,Minas Gerais State CEP: 37500-903, Brazilc ICIDCA – Instituto Cubano de Investigaciones de los Derivados de la Caña de Azúcar, Via Blanca y Carretera Central 804, San Miguel Del Padrón, A.P. 4036, La Habana, Cuba
a r t i c l e i n f o a b s t r a c t
Article history:Received 27 February 2015Accepted 25 June 2015
Keywords:Municipal solid wasteGasificationSynthesis gasTechno-economic analysisWaste-to-energyRenewable energy
The key objective of this paper is to analyze the techno-economic feasibility of this alternative for theBrazilian municipalities, classified according to population subgroups, using this parameter as a basisfor the calculation of the municipal solid waste generated, the project costs and revenues. Differentexpenses were taken into consideration, like equipments and installation costs, operation and mainte-nance costs and the interest rate of the investment. In relation to revenues, they come from of the saleof electricity, the incomes of the recyclable materials, the fees paid by the Brazilian municipalities forthe disposal of municipal solid waste in sanitary landfills and incomes by the carbon credits. An analysisof each population subgroup, combining three different economical scenarios was done, with an annualrate of interests of 10.58% for Scenario 1, 7.5% for Scenario 2 and 15% for Scenario 3. The economic fea-sibility was evaluated using as economic indicators the net present value and the internal rate of return.The net present value was positive for the municipalities with more than 60,714 inhabitants for theScenario 1, 34,203 for Scenario 2 and 259,845 for Scenario 3. A hypothetic gasification plant is capableto generate 905 kW/ton municipal solid waste for a population of 60,714 inhabitants (Scenario 1),794 kW/ton municipal solid waste for a population of 34,203 inhabitants (Scenario 2) and1065 kW/ton municipal solid waste for a population of 259,845 inhabitants (Scenario 3). It is concludedthat the economic feasibility increases with the installation of bigger units, showing a positive scale upgains, therefore as higher the capacity of the installation lower the specific costs and higher are thebenefits.
� 2015 Elsevier Ltd. All rights reserved.
1. Introduction
Growing problems of the treatment and disposal of agriculturalwastes, industrial wastes and Municipal Solid Wastes (MSW), cres-cent concerns for human and environmental well-being and dwin-dling reserves of fossil fuels, have led to research into the potentialof utilizing appropriate technologies to recover energy and usefulby-products from domestic and industrial solid wastes [1].However, to determine the optimum route of biofuels and electric-ity production [2] and wastes conversion into energy should becarried out an analysis of the environmental impact assessment[3,4].
MSW landfills represent the dominant option for waste disposalin many parts of the world. In general, the comparatively highcosts of treatment and disposal alternatives are a major reasonfor the reliance on MSW landfills [5]. Nevertheless, even somehighly industrialized countries largely depend on landfilling. Ithas been pointed out the spectacular increase of the amount ofMSW that must be treated and disposed, that currently, it isbecoming the main issue of MSW management. In the future thequantity of MSW will be much higher than today [6].
Brazil is the 7th world economy and the biggest country in LatinAmerica, its population (204 million inhabitants) generates morethan 208,000 tons MSW/day. About 70% of the municipalities haveless than 20 thousand inhabitants, in contrast to the 15 largestmetropolitan regions that have 37% of the population, correspond-ing to 72 million inhabitants. The average MSW per capita genera-tion was 1.15 kg MSW/person/day. The collection of MSW from
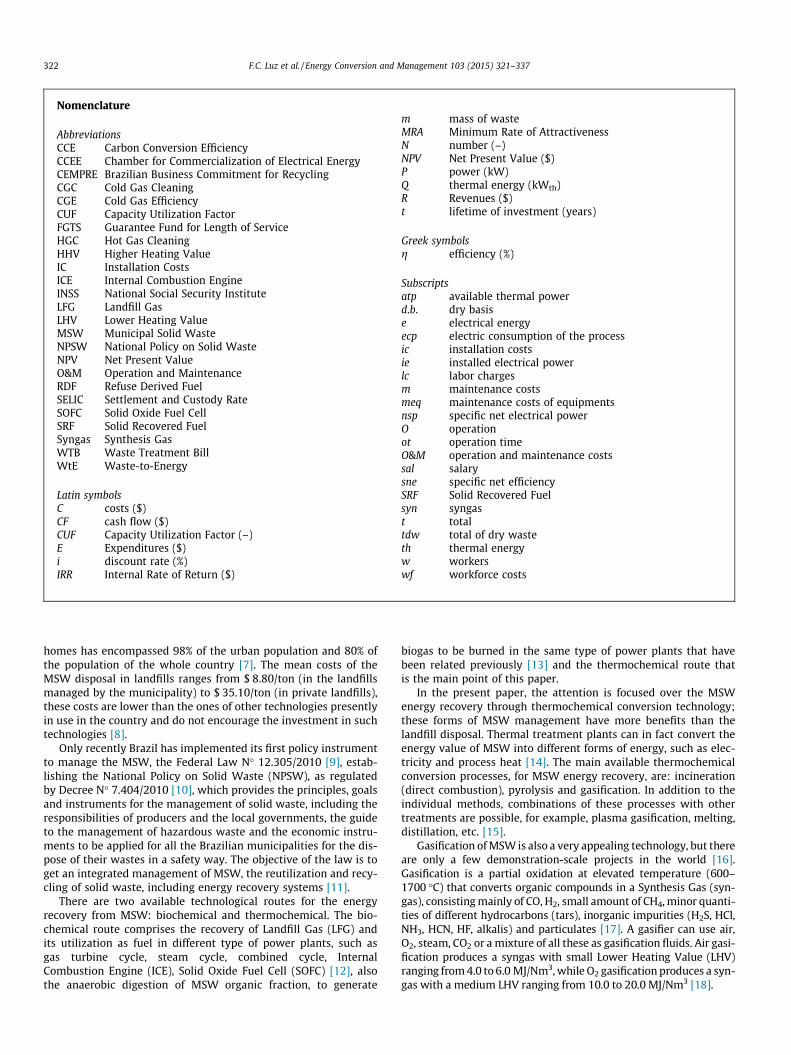
Nomenclature
AbbreviationsCCE Carbon Conversion EfficiencyCCEE Chamber for Commercialization of Electrical EnergyCEMPRE Brazilian Business Commitment for RecyclingCGC Cold Gas CleaningCGE Cold Gas EfficiencyCUF Capacity Utilization FactorFGTS Guarantee Fund for Length of ServiceHGC Hot Gas CleaningHHV Higher Heating ValueIC Installation CostsICE Internal Combustion EngineINSS National Social Security InstituteLFG Landfill GasLHV Lower Heating ValueMSW Municipal Solid WasteNPSW National Policy on Solid WasteNPV Net Present ValueO&M Operation and MaintenanceRDF Refuse Derived FuelSELIC Settlement and Custody RateSOFC Solid Oxide Fuel CellSRF Solid Recovered FuelSyngas Synthesis GasWTB Waste Treatment BillWtE Waste-to-Energy
Latin symbolsC costs ($)CF cash flow ($)CUF Capacity Utilization Factor (–)E Expenditures ($)i discount rate (%)IRR Internal Rate of Return ($)
m mass of wasteMRA Minimum Rate of AttractivenessN number (–)NPV Net Present Value ($)P power (kW)Q thermal energy (kWth)R Revenues ($)t lifetime of investment (years)
Greek symbolsg efficiency (%)
Subscriptsatp available thermal powerd.b. dry basise electrical energyecp electric consumption of the processic installation costsie installed electrical powerlc labor chargesm maintenance costsmeq maintenance costs of equipmentsnsp specific net electrical powerO operationot operation timeO&M operation and maintenance costssal salarysne specific net efficiencySRF Solid Recovered Fuelsyn syngast totaltdw total of dry wasteth thermal energyw workerswf workforce costs
322 F.C. Luz et al. / Energy Conversion and Management 103 (2015) 321–337
homes has encompassed 98% of the urban population and 80% ofthe population of the whole country [7]. The mean costs of theMSW disposal in landfills ranges from $ 8.80/ton (in the landfillsmanaged by the municipality) to $ 35.10/ton (in private landfills),these costs are lower than the ones of other technologies presentlyin use in the country and do not encourage the investment in suchtechnologies [8].
Only recently Brazil has implemented its first policy instrumentto manage the MSW, the Federal Law N� 12.305/2010 [9], estab-lishing the National Policy on Solid Waste (NPSW), as regulatedby Decree N� 7.404/2010 [10], which provides the principles, goalsand instruments for the management of solid waste, including theresponsibilities of producers and the local governments, the guideto the management of hazardous waste and the economic instru-ments to be applied for all the Brazilian municipalities for the dis-pose of their wastes in a safety way. The objective of the law is toget an integrated management of MSW, the reutilization and recy-cling of solid waste, including energy recovery systems [11].
There are two available technological routes for the energyrecovery from MSW: biochemical and thermochemical. The bio-chemical route comprises the recovery of Landfill Gas (LFG) andits utilization as fuel in different type of power plants, such asgas turbine cycle, steam cycle, combined cycle, InternalCombustion Engine (ICE), Solid Oxide Fuel Cell (SOFC) [12], alsothe anaerobic digestion of MSW organic fraction, to generate
biogas to be burned in the same type of power plants that havebeen related previously [13] and the thermochemical route thatis the main point of this paper.
In the present paper, the attention is focused over the MSWenergy recovery through thermochemical conversion technology;these forms of MSW management have more benefits than thelandfill disposal. Thermal treatment plants can in fact convert theenergy value of MSW into different forms of energy, such as elec-tricity and process heat [14]. The main available thermochemicalconversion processes, for MSW energy recovery, are: incineration(direct combustion), pyrolysis and gasification. In addition to theindividual methods, combinations of these processes with othertreatments are possible, for example, plasma gasification, melting,distillation, etc. [15].
Gasification of MSW is also a very appealing technology, but thereare only a few demonstration-scale projects in the world [16].Gasification is a partial oxidation at elevated temperature (600–1700 �C) that converts organic compounds in a Synthesis Gas (syn-gas), consisting mainly of CO, H2, small amount of CH4, minor quanti-ties of different hydrocarbons (tars), inorganic impurities (H2S, HCl,NH3, HCN, HF, alkalis) and particulates [17]. A gasifier can use air,O2, steam, CO2 or a mixture of all these as gasification fluids. Air gasi-fication produces a syngas with small Lower Heating Value (LHV)ranging from 4.0 to 6.0 MJ/Nm3, while O2 gasification produces a syn-gas with a medium LHV ranging from 10.0 to 20.0 MJ/Nm3 [18].

Table 1Number of the Brazilian municipalities, the population range of the subgroup, the average population of the band and daily average MSW generation (adapted from [24,25]).
Subgroup Subgroup population range (people) Average population (people) Number of municipalities (cities) Average MSW generation (ton MSW/day)
A 805–5000 3362 1301 4.10B 5001–10,000 7048 1212 8.60C 10,001–20,000 14,093 1401 17.19D 20,001–30,000 24,110 581 29.41E 30,001–40,000 34,203 311 41.73F 40,001–50,000 44,371 151 54.13G 50,001–75,000 60,714 220 74.07H 75,001–100,000 85,306 105 104.07I 100,001–150,000 117,515 106 143.37J 150,001–200,000 173,231 44 211.34K 200,001–350,000 259,845 70 317.01L 350,001–500,000 411,891 25 502.51M 500,001–750,000 597,139 15 728.51N 750,001–1,000,000 844,251 8 1029.90O Over 1,000,000 2,677,360 15 3266.40
Table 2Typical average gravimetric composition of the MSW in Brazil without any type ofpretreatment (adapted from [5,7,8]).
Components Typical average percentage (% drybasis)
Food waste 52.6Paper and cardboard 15.0Plastics 13.5Metals and others 2.9Glass 2.4Wood and yard waste 4.3Textiles 2.7Rubber, foam and leather 2.8Construction and demolition
wastes3.8
F.C. Luz et al. / Energy Conversion and Management 103 (2015) 321–337 323
The syngas could be combusted as a fuel gas in a conventionalburner, to generated heat (20–40% efficiency) or can be used forelectricity generation, in a conventional Rankine Cycle (17–28%),in a gas turbine (24–33%), in an ICE (25–37%), in a SOFC (41–60%) [19]. It is evident that the syngas is easier to handle (and toburn) than a solid waste, which makes the gasification a mostpromising candidate to emerge as the advanced thermal treatmentin the near future, for both, the unsorted residual dry fraction andthat produced from the sorted fraction, after mechanical treat-ment, namely Refuse Derived Fuel (RDF) [20].
The main advantages of MSW gasification are: application tosmall/medium scales; sharp reduction of the emissions of somepollutants as dioxins, furans and NOx and the possibility of the uti-lization of the syngas in high efficiency thermal devices (ICE andgas turbines or for biofuels synthesis) [21].
The application of MSW gasification thought thermal plasma isa new technology for waste treatment and management. The highenergy densities and temperature that characterizes plasma pro-cesses allows to achieve high heat and reactant transfer rates,reduces the size of the installation for a given waste throughputand to melt residual materials, which increases the overall wastevolume reduction [22]. However, a major drawback of the thermalplasma gasification of MSW is related with the lower efficiency ofthe process and the huge electricity consumption, that could beproduced from the waste to be treated [23].
The key objective of this work is to perform the economic anal-ysis of energy recovery, through gasification of MSW in Brazil,without proposing substantial modifications to MSW collection.In the present paper an assessment of the economic feasibility ofthe MSW gasification facilities installation for electricity genera-tion using the produced syngas in a spark ignition reciprocating
ICE is carried out. The study focuses in providing an economicassessment, with sensitivity analysis of the value of fees paid bythe Brazilian municipalities to the disposal of MSW in sanitarylandfills in three different economic scenarios in Brazil.
2. Methodology
2.1. Description of the scenarios
Of the 191 million people who lived in Brazil in 2010, themajority (105 million or 54.75%) lived in municipalities of morethan 100,000 inhabitants [24]. The total population of Brazil is pro-jected to be 239 million inhabitants in 2030, with 210 million liv-ing in urban areas (87.8%) [24]. In respect to sanitation, 5540 ofthe 5570 Brazilian municipalities, regularly collected MSW in2010. However, 4584 municipalities disposed the MSW in the soil(a fraction which include any form of inadequate disposal) andonly 936 municipalities treated the MSW, also it must be stressedthat only 16.8% of the municipalities treat and dispose the MSWproperly with recycling and energy recovery [25].
The population of the Brazilian municipalities varies from 805inhabitants in the smallest ones, to more than 11 millions in thebiggest. Considering that it is impossible to project and evaluatethe economic feasibility of the installation of gasification facilities,in each one of the 5570 Brazilian municipalities sized to gasify thetotal MSW produced daily, in this paper it was convenient to estab-lish population subgroups or bands. To simplify the analysis, thetotal population was divided and clustered into fifteen subgroups(from A to O) for the economic assessment analysis, as shown inTable 1.
In each subgroup, the study was conducted over hypotheticalcases, according to the number of inhabitants served by the systemand with a corresponding MSW production rate. Around 80% of theBrazilian municipalities have less than 30,000 inhabitants (sub-groups A–D); but only 24.5% of the Brazilians live in these munic-ipalities; 75.5% of the Brazilians live in 20% of the remainingmunicipalities (subgroups E–O). The most populated Brazilianmunicipalities, 20% of the total (subgroups E–O) and produce 75%of the total Brazilian MSW.
2.2. Physical composition, chemical properties and energy content ofMSW
The MSW composition fraction is divided into two main cate-gories: organics (food residue, wood waste, paper, textiles, rubberand plastic) and inorganics (ash, tiles, glass, metals and other inertmaterials). Inorganics can be regarded as inert materials that do

Fig. 1. Process flow sheet of the energy recovery from MSW.
Table 3Typical average proximate and ultimate analysis of the SRF after mechanicaltreatment (Adapted from [31,35]).
Parameter Symbol/unit Average (% as received)
Proximate analysisFixed carbon FC 5.08Volatiles V 74.07Moisture W 6.52Ashes A 14.33
Ultimate analysisCarbon C 49.7Hydrogen H 7.2Nitrogen N 0.8Sulfur S 0.4Chlorine Cl 0.3Oxygen O 41.6
Calorific valueLHV MJ/kg 19.63HHV MJ/kg 23.18
324 F.C. Luz et al. / Energy Conversion and Management 103 (2015) 321–337
not impact on thermochemical reactions [26]. The typical averagephysical composition of the MSW generated in Brazil without anytype of pretreatment is shown in Table 2. The mean availability ofMSW (without the recyclables) varies from 3 to 30 tons/day. In thisstudy the possible differences in the composition of the MSW ofbig cities and small towns are not considered, but, in some cases,it occurs.
In this paper it was considered that all the plastics, glasses andmetals have been previously separated from the MSW, it is that13.5% of plastics, 2.4% of glasses and 2.9% of metals were separatedfrom the MSW before the treatment for recycling, in accordancewith the NPSW [27]. It was considered that all the paper and card-board in MSW (15%) is contaminated and it will be used togetherwith the organic matter for the production of the SolidRecovered Fuel (SRF).
Treatment of MSW output fractions, intended as secondaryfuels, fall into the category of waste derived fuel, also referred toas solid waste fuels, secondary fuels, substitute fuels, or alternativefuels. In the absence of a legal definition or universally acceptedterm, the two most established terms relevant to thermally recov-erable waste fractions are RDF and SRF. Conventionally, RDF refersto a combustible, of high calorific value waste fraction produced bythe mechanical treatment of MSW [28].
RDF is the fuel produced from MSW that has undergone pro-cessing, i.e., separation of recyclables and non-combustible materi-als, shredding, size reduction and briquetting and has aninput-driven specification. However, RDF could be contaminatedwith heavy metals and chlorine. The non-homogeneous distribu-tion of elements like chlorine, cadmium and mercury in wastecomponents, leads to varying fuel qualities in RDF. As chloridesalts, they have significant influence on the corrosiveness of depos-its on the superheater tubes [29].
SRF is a recently introduced term, that denotes a waste derivedfuel prepared for a quality specification. SRF is derived fromnon-hazardous mixed waste streams, such as MSW, commercialor bulky waste and it consists of biogenic components (40–80 wt%) like paper, cardboard, textiles and wood. From an emissionperspective, SRF’s can be considered clean fuels, because their con-tent of heavy metals is below the limit levels. SRF is consideredmore homogeneous and less contaminated, is market-driven dueto tighter quality specifications [30]. Determining the chemicalcomposition of MSW by proximate and ultimate analysis, is a keyfactor for the detailed design of the MSW gasification facility andallows to confirm the accuracy of material and energy balancesof the MSW gasification process [31].
After estimating the chemical composition of the solid waste,the energy content of the SRF can be determined; some equationscan be used to predict the heating value of SRF, from proximateand ultimate analysis. The LHV is determined by subtracting the

Table 4Main characteristics of the downdraft gasifiers, main operational parameters and thesyngas composition of the SRF gasification process (adapted from [31,36–40]).
Gasifiers characteristics and operationalparameters
Unit Value
Type of gasifier Downdraft fixed bed(autothermal)
Gasification agent AirGasification pressure kPa 101.325Gasification temperature �C 800Equivalence Ratio (ER) – 0.30Specific volumetric air flow consumption Nm3/kgSRF 2.30Specific air mass flow rate consumption kg/kgSRF 1.69Maximum size of SRF mm 100.0Maximum moisture content allowed in SRF % 20.0Ashes meting point �C 1200Specific mass flow rate of ashes generated kg/kgSRF 0.30Specific thermal power kW/m2 1200Maximum range of the reactor scale-up MWth 15.0Specific energy consumption of the process kW h/kgSRF 3.5Heat losses % input
SRFLHV
5.0
Carbon Conversion Efficiency (CCE) % 85.0Cold Gas Efficiency (CGE) % 75.0
Characteristics and composition of producer syngas (downstream of gasifier)Syngas exit temperature �C 670Syngas exit pressure kPa 101.325Specific producer syngas flow rate yield Nm3/kgSRF 3.20Syngas density kg/Nm3 1.45H2 % vold.b. 7.92CO % vold.b. 11.57CH4 % vold.b. 3.90CO2 % vold.b. 14.90N2 % vold.b. 60.53C2H4 % vold.b. 0.80C2H6 % vold.b. 0.05C2H2 % vold.b. 0.08C6H6 % vold.b. 0.25H2S g/Nm3 0.45HCl g/Nm3 1.04NH3 g/Nm3 2.00Syngas tars g/Nm3 2.00Ashes and particulates in the syngas g/kgsyn 27.6Syngas LHV MJ/Nm3 4.60Syngas LHV MJ/kgsyn 3.17
Table 5Syngas quality requirements to be used as fuel in spark ignition reciprocating ICE forelectricity generation [43,44].
Type of contaminant Unit Value
Tars mg/Nm3 100Acid compounds mg/Nm3 50Particles (dust) mg/Nm3 50Particle size lm 10H2S ppm (bv) 20Alkali metals ppm (wb) 0.1Heavy metals ppm (wb) 0.1
F.C. Luz et al. / Energy Conversion and Management 103 (2015) 321–337 325
heat of water vaporization from the Higher Heating Value (HHV),which is the thermodynamic heat of combustion. The LHV of theSRF was calculated based on the Mendeliev equation (Eq. (1)) [32]:
LHVSRF ¼ 339:13 � C þ 1029:95 � H � 108:85 � O� Sð Þ� 25:12W ð1Þ
Fig. 2. Electric efficiency of couple ICE–electric generator [45].
2.3. Process description, technological assessment and operationalparameters
A gasification process designed for a narrow range of specificinputs can usually be operated and performed, to a larger extent,
than those that receive wastes with greater variability; thereforeit must perform the separation of plastics, glasses and metalsbefore the treatment for recycling, leaving only organic matterand paper/cardboard that will constitute the SRF [33].
The designed configurations for energy recovery of MSW bymeans of gasification–based industrial facilities, can be sketchedas a combination of four sections: primary separation, mechanicaltreatment, thermochemical conversion coupled with gas cleaningsection and power generation island, as shown in Fig. 1.
2.3.1. Primary separationAccording to the flowsheet in Fig. 1, the primary separation is
the most important stage of the pretreatment process, because itis where the recyclables are separated, mainly the metals, thatcan damage the equipments in the next stages.
After collection, the MSW is transported to the facility and dis-charged into a receiving hopper. The MSW is transported to theprimary separation, in which workers separate manually all poten-tial recyclable materials, which are constituted by plastics, glassesand non-ferrous metals, that could be commercialized. In the sameprimary separation process, all the non-recyclable tailings are sep-arated and taken to the sanitary landfill. After the primary separa-tion, the ferromagnetic materials (iron and steel) are separated byelectromagnet equipment and the remaining organic material andpaper are sent to the next section (mechanical treatment)[15,16,27].
The separated recyclables represent 18.8% of the input,non-recyclables tailings represent 3.8% and the remaining 77.4%was used for the calculation of the available energy, which is thebase to size the gasification section and the size of the generators,making possible to calculate the installed power of the proposedfacilities.
2.3.2. Mechanical treatmentThe mechanical treatment process of converting SRF consists of
sorting, screening, drying, size reduction (shredding, grinding, andchipping), briquetting and storage in order to improve the handlingcharacteristics and homogeneity of the material. The main benefitsof SRF improved briquettes are a more homogeneous physical andchemical compositions, lower moisture content, higher calorificvalues (LHV 15.0–25.0 MJ/kg), lower pollutant emissions, lowerash content and easier and more economically storage, handlingand transportation [18,34]. The typical average proximate and ulti-mate analysis of the SRF after mechanical treatment is shown inTable 3.
2.3.3. Thermochemical conversion and syngas cleaningThe MSW gasification and the syngas production can be carried
out in the following types of gasification reactors: fixed bed gasi-fiers (updraft and downdraft), fluidized bed gasifiers (bubblingand circulating), entrained flow gasifiers (dry and slurry), rotarykiln, moving grate or plasma gasifiers [15,18,36]. Nevertheless,fixed bed gasifiers are less efficient and fewer commonly deployedfor power applications, due to limitations in their operating flexi-bility, it was considered in this study that all the gasification plants

Table 6Throughput capacity and installed electrical power of the sections (elaborated by theauthors with data from the consulted manufactures/suppliers).
Sections/equipments Throughput capacity(ton/h)
Electric powerconsumption (kW)
Primary separation 0.4 25.752.1 44.154.2 51.5010.0 132.4016.7 176.60
Mechanical treatment(briquettes production)
0.5 44.150.8 55.201.0 66.201.5 80.902.0 99.30
Sections/equipments Thermal energygeneration (kWth/h)
Electric powerconsumption (kW)
Gasification and gascleaning
500 3.901000 5.25
Sections/equipments Electric powergeneration (KVA//h)
Electric powerconsumption (kW)
ICE–electric generator 120 0250 0330 0
Table 7Purchase costs of the sections/equipments considered in this study (elaborated by theauthors with data from the consulted manufactures/suppliers).
Sections/equipments Throughput capacity(ton/h)
Installationcosts ($)
Primary separation 0.4 92,1872.1 311,1114.2 386,66710.0 969,77816.7 1,568,889
Mechanical treatment(briquettes production)
0.5 102,9780.8 144,3561.0 159,0221.5 184,6222.0 216,933
Sections/equipments Thermal energygeneration (kWth/h)
Installationcosts ($)
Gasification and gas cleaning 500 111,1111000 191,111
Sections/equipments Electric powergeneration (KVA//h)
Installationcosts ($)
ICE–electric generator 120 64,814250 132,756330 153,680
Table 8Percentage of increase for the cost estimation (adapted from [47]).
Activity Percentage of increase (%)
Equipments installation 25.0Instrumentation and control 15.0Utilities installation 8.0Electrical installation 25.0Civil construction 18.0Land area for the site 6.0Project engineering 9.2Others services 1.2
326 F.C. Luz et al. / Energy Conversion and Management 103 (2015) 321–337
will be the type of autothermal, fixed bed reactors (downdraft gasi-fiers), because the calculations presented here are for theworst-case scenario.
The SRF, after mechanical treatment, is fed in batch into thegasification and combustion zone, at the bottom of the primarychamber, via load chamber at the top of the gasifier; thereafter,both products, gas and solids (char and ash) move down in thedowndraft gasifier, a fraction of pyrolysis gas could burn abovethe gasification zone. The thermal energy required for drying,pyrolysis and gasification (autothermal gasification) is suppliedby the combustion of a fraction of the biomass char. The gasifica-tion rate is controlled by the injection of primary air and the corre-sponding temperature of the bed, that is kept at 700–950 �C, inorder to ensure that the bottom ash remains as solid and doesnot melt [36,37].
The downdraft fixed bed reactors (co-current), work well with aspark ignition reciprocating ICE, as it produces a cleaner gas. Adowndraft gasifier requires a shorter time (20–30 min) to igniteand bring the plant up to the working temperature, significantlyshorter compared to the time required by an updraft gasifier. Thedowndraft gasifiers have the highest Carbon ConversionEfficiency (CCE) of the biomass, generating small amounts of ashesand producing a syngas with low tar content (<2.0 g/Nm3 for bio-mass). The Cold Gas Efficiency (CGE) of the downdraft gasifiers getsnear 75% with wood derived biomass [37,38].
For these reasons, the downdraft gasifiers were chosen as thethermochemical conversion equipments in this work. In this studyit was considered that the downdraft gasifiers have a CGE of 75%and CCE of 85%. The downdraft reactors considered in this workwill operate at atmospheric pressure, to gasify the SRF and air isused as the gasification agent. The average reported values in theliterature of the main downdraft gasifiers characteristics, the oper-ational parameters and the syngas composition of the SRF gasifica-tion process are summarized in Table 4.
The gasification process produces raw syngas, containing sev-eral impurities that can cause problems during its utilization. Theproduced gas cannot be used in any downstream applications,due to equipment manufactures restriction and emission regula-tion. Therefore, it is compulsory to clean up the producer gasbefore being fed into the downstream application. However, the
extent of cleaning depends on the selected application of the syn-gas [41].
Syngas must be purified from impurities, that generally includeparticulate matter (particles), condensable hydrocarbons (tars),sulfur compounds (H2S, COS, CS2, SO2, SO3, etc.), nitrogen com-pounds (HCN, NH3, HNO3, NO, NO2, etc.), alkali compounds (CaO,K2O, P2O5, MgO, Na2O, etc.), halides compounds (HCl, NaCl, HF,etc.) and trace contaminants. Generally, cleaning procedures canbe categorized as Hot Gas Cleaning (HGC) and Cold Gas Cleaning(CGC) [42].
The HGC consists of the gas filtration at temperatures above260 �C and it can be conducted either by removing the impuritiesby physical filtration under hot conditions or by converting theimpurities, especially tars to gas, at high temperatures. HGC couldincludes many technologies, such as cyclones, granular filters, sandbed filters, ceramic filters, electrostatic precipitators, fabric filters,thermal cracking, catalytic cracking, activated carbon based absor-bers, etc.; however, this technology is still under development[41,42].
The cleaning train employs physical and mechanical methods,which can be divided into two categories, namely dry and wetgas cleaning. The dry gas cleaning system does not involve waterutilization and the equipment consists of cyclone, fabric filters,sand bed filters, thermal cracking of tars, etc. In contrast, wet gascleaning system, requires water and the equipment involved arewet electrostatic precipitators, wet scrubbers and wet cyclones.Water scrubbing simultaneously cools the gas and captures thesolid particles, tars and other contaminants. The contaminant
F.C. Luz et al. / Energy Conversion and Management 103 (2015) 321–337 327
gases such as NH3, HCl, H2S and SO2 are highly soluble in water andthey can be readily dissolved when the gas mixturecounter-currently flows through the scrubber [42,43]. Table 5shows the syngas quality required to be used as fuel in spark igni-tion reciprocating ICE for electricity generation.
Due to the uncertainty in commercial readiness for HGC (cera-mic filter and catalytic tar cracking), CGC was chosen as cleaningsystem. The cleaning system chosen in this paper is a combinationof dry and wet cleaning processes, comprising a cyclone, fabric fil-ter, thermal cracking and removal of tars in a wet scrubber. Indirect quench (water scrubbers) syngas cooling occurs, which alsoremoves fly ash and tars, in the form of sludge. Finally afloating-drum gas storage recipient, absorbs variations in the pro-ducer gas flow, when supplied to a reciprocating ICE. The syngascomposition is constantly monitored to provide guidance on theadjustment of process parameters, to achieve consistent high qual-ity syngas, which is subsequently used for power generation.
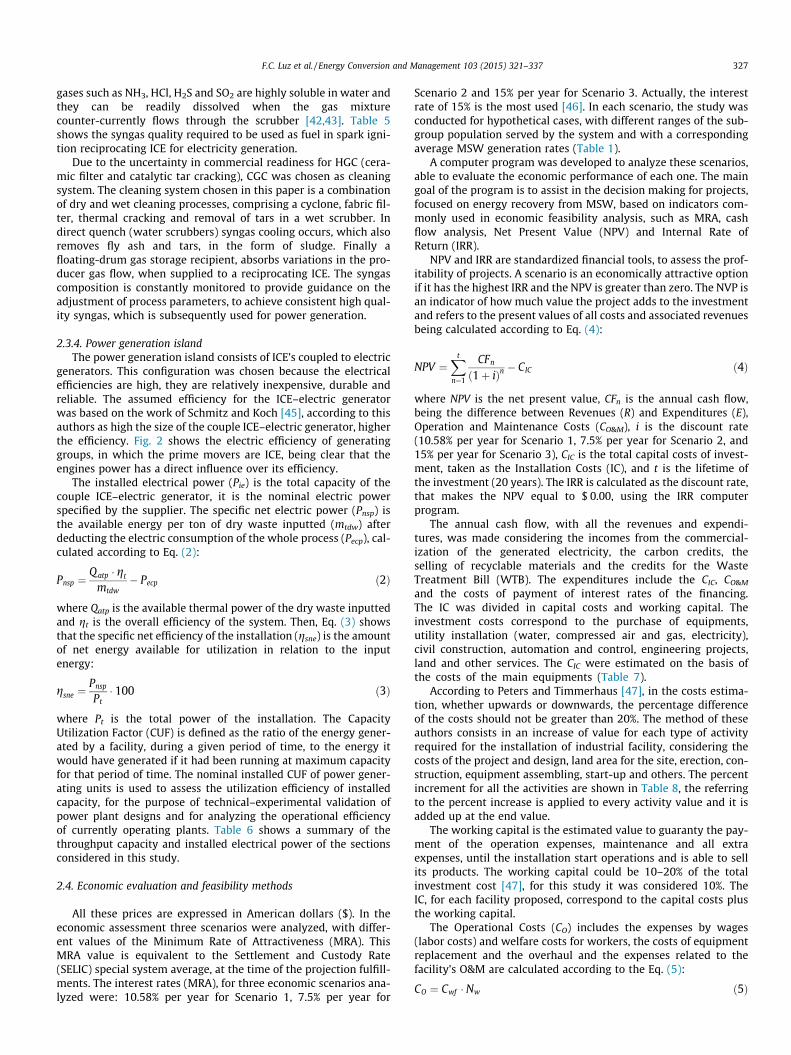
2.3.4. Power generation islandThe power generation island consists of ICE’s coupled to electric
generators. This configuration was chosen because the electricalefficiencies are high, they are relatively inexpensive, durable andreliable. The assumed efficiency for the ICE–electric generatorwas based on the work of Schmitz and Koch [45], according to thisauthors as high the size of the couple ICE–electric generator, higherthe efficiency. Fig. 2 shows the electric efficiency of generatinggroups, in which the prime movers are ICE, being clear that theengines power has a direct influence over its efficiency.
The installed electrical power (Pie) is the total capacity of thecouple ICE–electric generator, it is the nominal electric powerspecified by the supplier. The specific net electric power (Pnsp) isthe available energy per ton of dry waste inputted (mtdw) afterdeducting the electric consumption of the whole process (Pecp), cal-culated according to Eq. (2):
Pnsp ¼Q atp � gt
mtdw� Pecp ð2Þ
where Qatp is the available thermal power of the dry waste inputtedand gt is the overall efficiency of the system. Then, Eq. (3) showsthat the specific net efficiency of the installation (gsne) is the amountof net energy available for utilization in relation to the inputenergy:
gsne ¼Pnsp
Pt� 100 ð3Þ
where Pt is the total power of the installation. The CapacityUtilization Factor (CUF) is defined as the ratio of the energy gener-ated by a facility, during a given period of time, to the energy itwould have generated if it had been running at maximum capacityfor that period of time. The nominal installed CUF of power gener-ating units is used to assess the utilization efficiency of installedcapacity, for the purpose of technical–experimental validation ofpower plant designs and for analyzing the operational efficiencyof currently operating plants. Table 6 shows a summary of thethroughput capacity and installed electrical power of the sectionsconsidered in this study.
2.4. Economic evaluation and feasibility methods
All these prices are expressed in American dollars ($). In theeconomic assessment three scenarios were analyzed, with differ-ent values of the Minimum Rate of Attractiveness (MRA). ThisMRA value is equivalent to the Settlement and Custody Rate(SELIC) special system average, at the time of the projection fulfill-ments. The interest rates (MRA), for three economic scenarios ana-lyzed were: 10.58% per year for Scenario 1, 7.5% per year for
Scenario 2 and 15% per year for Scenario 3. Actually, the interestrate of 15% is the most used [46]. In each scenario, the study wasconducted for hypothetical cases, with different ranges of the sub-group population served by the system and with a correspondingaverage MSW generation rates (Table 1).
A computer program was developed to analyze these scenarios,able to evaluate the economic performance of each one. The maingoal of the program is to assist in the decision making for projects,focused on energy recovery from MSW, based on indicators com-monly used in economic feasibility analysis, such as MRA, cashflow analysis, Net Present Value (NPV) and Internal Rate ofReturn (IRR).
NPV and IRR are standardized financial tools, to assess the prof-itability of projects. A scenario is an economically attractive optionif it has the highest IRR and the NPV is greater than zero. The NVP isan indicator of how much value the project adds to the investmentand refers to the present values of all costs and associated revenuesbeing calculated according to Eq. (4):
NPV ¼Xt
n¼1
CFn
1þ ið Þn� CIC ð4Þ
where NPV is the net present value, CFn is the annual cash flow,being the difference between Revenues (R) and Expenditures (E),Operation and Maintenance Costs (CO&M), i is the discount rate(10.58% per year for Scenario 1, 7.5% per year for Scenario 2, and15% per year for Scenario 3), CIC is the total capital costs of invest-ment, taken as the Installation Costs (IC), and t is the lifetime ofthe investment (20 years). The IRR is calculated as the discount rate,that makes the NPV equal to $ 0.00, using the IRR computerprogram.
The annual cash flow, with all the revenues and expendi-tures, was made considering the incomes from the commercial-ization of the generated electricity, the carbon credits, theselling of recyclable materials and the credits for the WasteTreatment Bill (WTB). The expenditures include the CIC, CO&M
and the costs of payment of interest rates of the financing.The IC was divided in capital costs and working capital. Theinvestment costs correspond to the purchase of equipments,utility installation (water, compressed air and gas, electricity),civil construction, automation and control, engineering projects,land and other services. The CIC were estimated on the basis ofthe costs of the main equipments (Table 7).
According to Peters and Timmerhaus [47], in the costs estima-tion, whether upwards or downwards, the percentage differenceof the costs should not be greater than 20%. The method of theseauthors consists in an increase of value for each type of activityrequired for the installation of industrial facility, considering thecosts of the project and design, land area for the site, erection, con-struction, equipment assembling, start-up and others. The percentincrement for all the activities are shown in Table 8, the referringto the percent increase is applied to every activity value and it isadded up at the end value.
The working capital is the estimated value to guaranty the pay-ment of the operation expenses, maintenance and all extraexpenses, until the installation start operations and is able to sellits products. The working capital could be 10–20% of the totalinvestment cost [47], for this study it was considered 10%. TheIC, for each facility proposed, correspond to the capital costs plusthe working capital.
The Operational Costs (CO) includes the expenses by wages(labor costs) and welfare costs for workers, the costs of equipmentreplacement and the overhaul and the expenses related to thefacility’s O&M are calculated according to the Eq. (5):
CO ¼ Cwf � Nw ð5Þ

Fig. 3. Average availability of MSW and installed power of subgroups.
Fig. 4. Installed power and CUF of subgroups.
Fig. 5. Relation between CUF and overall efficiency of subgroups.
328 F.C. Luz et al. / Energy Conversion and Management 103 (2015) 321–337

Fig. 7. Population served in each evaluated subgroup by the electricity generated from gasification of MSW.
Fig. 6. Specific electrical power net generated from MSW according to the respective installed power.
F.C. Luz et al. / Energy Conversion and Management 103 (2015) 321–337 329
where Cwf is the cost associated with labor force (workforce) and Nw
is the number of workers; it was considered that each employee isable to carry out the processing of 1.0 ton of waste received in thefacility. The costs of labor force (Cwf) were calculated accordingthe Eq. (6):
Cwf ¼ Csal þ Clc ð6Þ
For the calculations of the costs of the wages, it was consideredthat the minimum salary (Csal) in Brazil in 2012 was around$ 276.50; for the calculations it was considered the obligationsand labor charges (Clc) of the National Social Security Institute(INSS), adding to the thirteenth salary (13� salary) that is paid toemployees according to the Federal Law N� 4090/1962 and the8.0% related to Guarantee Fund for Length of Service (FGTS) wereincluded, amounting 71.5% of the whole salary.
The Maintenance Costs of Equipments (Cmeq) were given by thesuppliers, having a range of variation from $ 2044.50 to$ 5653.50 per day of operation. Therefore, the Cm was calculated
by Eq. (7) considering a yearly operation time (Not) of 7500 h,defined for each facility, being equivalent of 313 days per year.The analysis considers the installation of the facilities using equip-ments available in Brazil. The costs and budgets were obtainedfrom quotations with the machinery manufacturers/suppliers foreach equipment.
Cm ¼ Cmeq � Not ð7Þ
In relation to revenues, the selling price of the electricity wasconsidered at $ 66.70/MW [48]. The regulated contracts of the pur-chase and sale of electricity, are managed by the Chamber forCommercialization of Electrical Energy (CCEE), which is in chargeof auction procedures. It is important to point out that the CCEEis not a single buyer but only a manager of bilateral contractsbetween generators and suppliers. According to the auctions ofthe energy reserve by the CCEE, the price of the electricity wentfrom $ 57.80/MW to $ 71.20/MW in the year 2012 [48], this pricevariation was considered for the calculation of the NPV.

Fig. 8. Installation costs and equipments costs on the basis of the installed power.
Fig. 9. Installation costs, equipments costs, and yearly O&M costs for generation plants corresponding to each population subgroup.
330 F.C. Luz et al. / Energy Conversion and Management 103 (2015) 321–337
To calculate the revenues earned from the sale of recyclablematerials to the recyclers, the income values used were taken fromthe Brazilian Business Commitment for Recycling (CEMPRE), being$ 622.30/ton for plastics, $ 106.70/ton for glass and $ 84.50/ton formetals [49]. The Brazilian municipalities have to pay a fee (WTB)by weight, to the private companies, for the collection and disposalthe MSW in sanitary landfills. The WTB for the disposition of theMSW in sanitary landfills varies from $ 17.80/ton to $ 35.60/ton[25]. In this work it was used a mean value of $ 26.70/ton ofMSW. The cost and yield values were standardized for all the yearsand an equivalence of the future values of the currency, in relationto the value today was established.
It has been pointed out that the values will have a possible vari-ation from $ 57.80/MW to $ 71.20/MW, for the selling price of the
electricity, from 6750 h/year to 8760 h/year, and from $ 26.70/tonto $ 35.60/ton, for the fee paid (WTB) by the municipalities forMSW treatment. By means of the software Crystal Ball™ the anal-ysis of the probability to reach an economic feasibility, consideringthe possible variations of the selling price of the electricity, theyearly operation time and WTB for the MSW disposition in landfillsfor the three different scenarios studied was carried out. The NPVand IRR for the three different studied scenarios were the mainoutput obtained in the calculations.
Crystal Ball™ is simple and practical risk analysis and evalua-tion software. Crystal Ball™ software is the easiest way to performMonte Carlo simulations, within given spreadsheets. Crystal Ball™can also perform sensitivity analysis to determine the importantfactors that contribute to the result [50].

Fig. 10. Specific cost of implantation of a new facility for the MSW gasification to electricity generation.
Table 9Revenues per year obtained from the sale of the products and by-products and the amount of MSW treated.
Subgroup Income with sale of electricity(Million $/year)
Income with sale of recyclables(Million $/year)
Income with WTB(Million $/year)
Income with carbon credits(Million $/year)
Total income(Million $/year)
A 8146 27,957 27,807 750 64,660B 17,072 58,592 58,277 1547 135,488C 46,284 117,158 116,529 3933 283,904D 95,881 200,432 199,355 7883 503,551E 136,018 284,337 282,809 11,183 714,347F 218,173 368,866 366,884 17,393 971,316G 340,253 504,728 502,016 26,683 1,373,680H 478,072 709,167 705,356 37,491 1,930,086I 761,249 976,927 971,678 58,748 2,768,602J 1,122,171 1,440,106 1,432,368 86,601 4,081,246K 1,713,867 2,160,146 2,148,539 132,018 6,154,570L 3,026,535 3,424,137 3,405,738 230,694 10,087,104M 4,441,827 4,964,143 4,937,469 338,190 14,681,629N 6,438,729 7,018,437 6,980,725 489,122 20,927,013O 20,311,897 22,257,459 22,137,863 1,543,734 66,250,953
F.C. Luz et al. / Energy Conversion and Management 103 (2015) 321–337 331
3. Results and discussion
3.1. Technical performance of the system
The calculations carried out in this paper show that it is techni-cally and energetically possible to produce net electrical powerfrom the air-blown downdraft fixed bed gasification of MSW cou-ple with spark ignition reciprocating ICE’s. Whether this technol-ogy can be successfully applied for the purpose of distributedgeneration in small municipalities geographically isolated dependson economic considerations. For a gasification plant to be econom-ically feasible, the savings from generated electricity and reducedMSW disposal costs must offset the annualized IC and O&M costsincurred by the plant.
Fig. 3 shows the average availability of MSW (without recy-clables) and the installed power in the gasification plants. Theinstalled power ranges from 96 kW (subgroup A) with 3.35 tonsof MSW/day to 35,000 kW (subgroup O) with 2665 tons ofMSW/day. Fig. 3 shows the relation between the amount of avail-able MSW for treatment and the installed power, it is clear that theinstalled power does not increase in the same proportion that theaverage waste, due to the CUF used in this work.
Analyzing the subgroups A and B in Fig. 3 it is possible to con-clude that both have the same installed power (96 kW), however
with different CUF, as shown Fig. 4; the same happens for the sub-groups C and D (180 kW), G and H (1000 kW), I and J (2000 kW), Mand N (10,000 kW). The CUF varies because of the lack of adequatecommercial equipment capacities, compatible with the needs ofeach project, which drives to the use, in some cases, of oversizedequipments.
Therefore, in some cases, the installed electric supply capacities,gasification reactors, syngas cleaning devices and mechanicaltreatment equipment capacities of the factories, were oversized.If one or more of these components is oversized, the performanceof another component in the system may be compromised. On theother hand, the required investments of the capital costs and O&Mcosts are dependent upon the size of the components.
The CUF is an important performance parameter for any powerplant, and it depends on factors such as continuous availability ofreliable quality fuel supply and plant availability. The CUF is theratio of actual output produced by the system, over a period, tothe potential output which could be produced if the system hadrun with full capacity, over the same period. It depends on bothresources, availability and connected demand characteristics.Higher CUF ensures maximum utilization of investments and itreduces the idleness of resources.
Considering the availability of MSW and its quality variationacross the seasons, the CUF ranges from 0.38 (subgroup A) to 1.0

Fig. 11. Costs with the interest on capital for the implantation of the facilities.
Fig. 12. Economic assessment of the Scenario 1.
332 F.C. Luz et al. / Energy Conversion and Management 103 (2015) 321–337
(subgroup O) over the useful lifetime of the project. If the CUF isless than 100%, it indicates that the plant will have no operatingperiods (idleness), that could be used to perform preventing main-tenance, to ensure an optimum performing and larger useful lifefor the plant. In general, it has been estimated that the best eco-nomics for plant life extension, result from larger plants that havehigh CUF and low variable costs.
The project and design always considers 1260 h (52 days) peryear for maintenance and unforeseen interruptions. The subgroupsF, H, J, L, N and O have a high CUF and present better exploitation ofthe equipments. The subgroups A, B, C, D, E, G, I, K, and M have lowCUF, without losing efficiency, according to Fig. 5. The CUF is thebasis for the selection of the most adequate equipments to satisfythe demands; on the other hand, the subgroups with a CUFbetween 0.6 and 0.9 have capacity for a future expansion.
The net electrical power produced ranges from 391 kW he/tondry waste (subgroups A and B) to 1232 kW he/ton dry waste
(subgroup N) as shown in Fig. 6. The electric energy produced fromthe MSW is a guaranteed firm energy, without seasonal interrup-tions, like the one generated from sugarcane bagasse in sugarand alcohol mills and does not depend on the weather conditions,as the hydroelectricity, wind and solar power generation that areintermittent. Thus, electricity generation from MSW is invariable,steady and reliable and nowadays it is increasing, considering thelarge amount of waste generated, which are not efficientlymanaged.
The electricity generated is supplied to the grid by an integra-tion panel, that makes an automatic synchronization with the localgrid. Fig. 7 shows that it is possible to satisfy the electrical con-sumption needs of 753 inhabitants (subgroup A) and 599,707inhabitants (subgroup O), that represent more than 22% of theaverage population of each subgroup. Currently, 80% of the elec-tricity in use in Brazil (approximately 80 GW) comes from hydro-power plants.

Fig. 13. Economic assessment of the Scenario 2.
Fig. 14. Economic assessment of the Scenario 3.
F.C. Luz et al. / Energy Conversion and Management 103 (2015) 321–337 333
The remaining 20% comes from thermal power plants, includingnuclear generation. Brazil has a population of 204 million and theinstalled electricity capacity per inhabitant is approximately0.5 kW. The total of the electricity generated from gasification ofMSW could contribute up to 3% of the whole electrical generationbased on the biomass energy matrix of Brazil.
3.2. Economic performance of the system
3.2.1. Costs and revenuesIn the financial approach, the loan is part of the entire project, it
is that the entire plant will be financed. In this study, the loan pay-back was considered as constant annuities and the annual cost wascalculated by considering the loan duration, interest rate and theexpected lifetime of the systems. The capital and IC of the genera-tion plant, for each population subgroup, are presented togetherwith the corresponding installed power in Fig. 8. All costs are pre-sented before it increases, due to the interest of the loans. The costof installation varies from less than $ 720,906 (subgroup A) tomore than $ 30,817,393 (subgroup O). The subgroups E and Hinclude small variations in their costs, presenting costs that range
between $ 5.0–8.0 million and powers of 264 kW (subgroup E),500 kW (subgroup F) and 1000 kW (subgroups G and H).
The costs presented in Fig. 9 are the capital costs of the instal-lation of new facilities, based on gasification of MSW and alsothe equipment costs and O&M costs, during the period of analysis.All the subgroups show IC higher than the cost of the equipments.The IC of the equipments is inversely proportional to the treatmentcapacity of the plant. On the other hand, the O&M costs are inver-sely proportional to the IC; it means that at low IC, higher thespecific O&M costs are. For example, for subgroup A the IC is$ 373,313 (50.2% of total), the equipment cost is $ 347,592 (46.7%of total), the yearly operating cost is $ 19,051 (2.6% of total) andthe yearly maintenance cost is $ 3979 (0.5% of total). This percent-age trend is kept up to the subgroup O.
Fig. 10 shows the specific cost for the implantation of new facil-ities of MSW gasification, to generate electricity per ton of wastetreated. It has been pointed out that the specific cost of implanta-tion per ton of MSW is inversely proportional to the installedcapacity. If a comparison is done of Figs. 3 and 10, it is possibleto conclude that at higher installed capacity lower the specificcosts. Fig. 10 also shows the specific costs per inhabitant of the

Fig. 15. Minimum fee (WTB) for treatment of MSW to get a NPV over zero (NPV > 0).
334 F.C. Luz et al. / Energy Conversion and Management 103 (2015) 321–337
municipality, indicating that for lower population the higher thecost per inhabitant, with subgroups A and E having the higher costsof implantation.
If decision makers want to select and integrate this renewableenergy technology in Brazilian cities, a viable solution for the sub-groups A–E could be to make associations between neighbourmunicipalities, to reduce the specific costs, by making commonsinvestments for bigger gasification facilities, where the MSW oftwo or three municipalities could be gasified together. The sub-groups F–O have the most attractive IC and fortunately correspondto the places where the major part of the Brazilian population lives.
In relation to revenues, they were obtained by the commercial-ization of the recyclable materials, the WTB fee for the treatmentand disposition of MSW, the income by the commercializationthe generated electricity by the gasification of MSW and theincome due to of the carbon credits. Table 9 shows the revenuesof the sale of the products and by-products (electricity, recyclables,the WTB fee and carbon credits) for each population subgroup. Therevenues have a direct relation with the amount of MSW generatedand treated per year, because when higher the input higher theresults. The amount of treated MSW per year varies from1248 ton/year (subgroup A) to 1,022,376 ton/year (subgroup O).
The selling of the recyclables varies from $ 27,957 for subgroupA to $ 22,257,459 for subgroup O. The gains due to that WTB fees,for the treatment of the MSW, range from $ 27,807 (subgroup A) to$ 22,137,863 (subgroup O), also the sale of the electricity goes from$ 8146 (subgroup A) to $ 20,311,897 (subgroup O) and the carboncredits range from $ 750 (subgroup A) to $ 1,543,734 (subgroup O).It should be noted that from the subgroup A to subgroup I theincomes obtained with the selling of the recyclables and with thetaxes of the MSW treatment (WTB) are equivalent to more than70% of all the gains of the facility.
From subgroup J on the sales of the recyclables, the WTB andthe electricity sales are equivalent to more than 95% of all theincomes. The electricity incomes ranges from 12% for subgroup Ato 31% for subgroup O, the recyclables incomes varies from 43%to 33% for subgroup O, the WTB incomes ranges from 43% to 33%for subgroup O and the carbon credits incomes varies from 2%for subgroup A to 3% for subgroup O.
3.2.2. Economic assessment of the three analyzed scenariosThe total costs considering the interest rates for each Scenario
(1, 2 or 3) are shown in Fig. 11; the interests on the capital werecalculated for each subgroup and utilized only for the financialanalysis, according to each scenario. The total costs, with the inter-est on capital of 10.58% per year for Scenario 1 range of $ 764,904(subgroup A) to $ 32,698,226 (subgroup O), the costs with interestof 7.5% per year for Scenario 2 range of $ 1,249,903 (subgroup A) to$ 53,431,025 (subgroup O) and for the costs with interest of 15% forScenario 3 range of $ 2,195,561 (subgroup A) to $ 93,856,148 (sub-group O).
An interest rate of 10.58% per year was the basis for the calcu-lation of the economic feasibility of Scenario 1. An economic anal-ysis, based on the indexes of NPV an IRR, is shown in Fig. 12, beingpossible to highlight that the IRR and NPV are positive in 67% of thesubgroups (F–O) and negative in the remaining 23% (A–E). ForScenario 1 it is viable to install a facility for the treatment ofMSW in 67% of the subgroups, if it were applied to 67% of the sub-groups it means that 14% of the Brazilian municipalities could haveits MSW treated correctly and it corresponds to 70% of all the MSWin Brazil. The subgroup I presents a discrepancy, because the avail-able amount of MSW for treatment, demands an installed capacityhigher than that required, the reason is the lack of compatibleequipments in the Brazilian market and low CUF (Fig. 4), the samebehavior is also valid for the other scenarios.
The interest rate of 7.5% per year was the basis of the viability ofthe economic Scenario 2. The Fig. 13 shows the NPV and IRR of theScenario 2, pointing out that these parameters are positive in 73%of the subgroups (E–O) and negative for the others subgroups. ForScenario 2 the viability of installing a MSW treatment plant, reach73% of the subgroups, if it were applied to 73% of the subgroups, itmeans that 20% of the Brazilian municipalities will have their MSWproperly treated, which corresponds to 75% of all Brazilian MSW.
A rate of interest of 15% per year is the basis of the economicviability in the Scenario 3. The economic analysis of the NPV andIRR presented in Fig. 14 shows that these parameters are positivein 47% of the subgroups (H–O) and negative the others ones (A–G and I). For Scenario 3, the installation of a plant for the treatmentis viable for 47% of the subgroups, it means that treating 47% of the

Fig. 16. Minimum treatment fee for MSW to ensure a IRR higher than 12%.
F.C. Luz et al. / Energy Conversion and Management 103 (2015) 321–337 335
MSW of the subgroups, only result in the 5% of the Brazilian munic-ipalities having their MSW properly treated, which correspond to53% of the whole Brazilian MSW.
The subgroups that cannot get an economic feasibility for thisscenario, could test the strategy of merging in municipal consor-tiums, looking after the possibility of a higher amount of MSWand in this way, making viable to install a treatment facility. Theconsortium seems to be an appealing alternative for small munic-ipalities, giving the possibility to reduce the costs and increasingthe yields. MSW transport costs increase must be considered.Another way is to establish a minimum value for the fee of MSWtreatment.
Therefore, it was carried out a sensitivity analysis, trying to findthe minimum value of the MSW treatment, to make viable theinstallation of a hypothetical MSW gasification plant, independentof its size. The sensitivity analysis is an important tool for research-ing over the properties of complex systems; it represents an essen-tial part of inverse analysis procedures, response surface modelingor uncertainty analysis. The sensitivity analysis provides informa-tion about the contributions of individual system parametersinputs to the system outputs.
To evaluate the relative importance of input parameters overthe project’s economic results, a simple sensitivity analysis wasperformed, over the main economic parameter of the model, likethe fee paid (WTB) by the Brazilian municipalities for disposalthe MSW in sanitary landfills. The economic viability of each pro-ject depends on the MSW treatment fee, to ensure a viable devel-opment to establish the implantation of a MSW facility for eachpopulation subgroup (Fig. 15).
In Fig. 15 it is determined the minimum WTB fee for the MSWtreatment, looking to ensure its viability. The minimum treatmenttax varies from $ 213.35 (subgroup A) to $ 4.50 (subgroup K) in
Scenario 1, of $ 152.00 to $ 3.10 (subgroup I) for Scenario 2 and$ 343.55 (subgroup A) to $ 7.58 (subgroup M) in Scenario 3.
Fig. 16 presents the minimum WTB fee value that could becharged by the hypothetical MSW gasification plant for the correcttreatment of the MSW, to obtain a value of the IRR higher than 12%,which is the acceptable figure. The minimum index of treatmentranges from $ 711.15 (subgroup A) to $ 3.60 (subgroup N) inScenario 1, of $ 515.60 (subgroup A) to $ 3.15 (subgroup M) forScenario 2, of $ 1044.50 (subgroup A) to 20.00 (subgroup N) inScenario 3.
4. Conclusions
In this paper it has been analyzed and assessed a configurationfor MSW gasification for electricity generation, from the technicaland economical perspectives. All the MSW gasification facilitiesanalyzed were of the type of autothermal fixed bed reactors(downdraft gasifiers). The syngas cleaning system selected in thisstudy was a combination of dry and wet cleaning processes com-posed of a cyclone, fabric filter, thermal cracking and removal oftars in a wet scrubber. The electricity generation was performedby an ICE coupled to electric generator.
The technical assessment focused primarily on the operatingprinciples: installed power, CUF, specific electrical power genera-tion and efficiencies. The economic analysis was carried out basedon the economic indicators: NPV and IRR, bringing together threedifferent economical scenarios, with an annual rate of interests of10.58% for Scenario 1, 7.5% for Scenario 2 and 15% for Scenario 3.The sensitivity analysis was also conducted, to investigate theeffects of key assumptions on the fee paid by the Brazilian munic-ipalities for disposal the MSW, in sanitary landfills.

336 F.C. Luz et al. / Energy Conversion and Management 103 (2015) 321–337
The 5570 Brazilian municipalities (204 million of inhabitants)were divided and clustered into fifteen subgroups (A–O) for theeconomic assessment. In each subgroup, the study was conductedto hypothetical cases, with a number of inhabitants, served by thesystem and with a corresponding MSW production rate. The costsof equipments installation and for operation and maintenancewere taken into account, as well as the interest rate of the invest-ment. In relation to revenues, they come from of the electricity andthe recyclable materials sales, the fee paid of the Brazilian munic-ipalities for the disposal of MSW in sanitary landfills and theincomes from the carbon credits.
The NPV was positive for municipalities with more than 61,000inhabitants (Scenario 1), 35,000 inhabitants (Scenario 2) and260,000 inhabitants (Scenario 3). A hypothetic gasification plantwith the capability to generate 905 kW/ton MSW was set for a pop-ulation of 61,000 inhabitants (Scenario 1), with 794 kW/ton MSWfor a population of 35,000 inhabitants (Scenario 2) and with1065 kW/ton MSW for a population of 260,000 inhabitants(Scenario 3). The results show that the economic performance ofa MSW gasification facility is largely depending on its size; whenlarger the plant in capacity, higher is the installed power, theCUF, the electrical efficiency and the overall economicperformance.
The economic feasibility is possible for all the population sub-groups (A–O), because the WTB fee paid by the Brazilian munici-palities for the disposal of the MSW in sanitary landfills and thequantity of the available MSW can be adjusted, varying the taxesand through the association of the municipalities in consortiumsto reach the convenient amounts of MSW. Municipalities with apopulation lower than 60,000 inhabitants could be clustered inconsortiums for collecting and treating the MSW, the ones withmore than 60,000 could try to install its own MSW treatmentinstallation.
If the MSW is treated and disposed correctly, in only one-fifth ofthe Brazilian municipalities, including the most populated ones,Brazil could reach three-fourth of the whole amount of MSW gen-erated treated in a responsible way, with the use of the energy ofthe refuses and the marketing of the recyclables. The electricenergy produced from the MSW could cover more than 20% ofthe needs of each subgroup that was studied. The electric energythat is possible to generate from the MSW could represent 3% ofthe whole electric energy produced in the Brazilian energeticmatrix.
However, with no incentives from governments, it is unlikelythat such plants can be actually built. Even having a positive NPVit is not enough to ensure the convenience of the investment.Beside the NPV value, also the IRR must be considered, along withthe required threshold profitability from the investors. In theresearch done in this paper, the economic indicators were calcu-lated for 20 years of the project lifetime, for of the small and med-ium plant sizes. Expensive solutions, with a long payback time,regularly require another parameters of analysis like a profit factor.Profit factor relates the net profit, accounting for the risk of invest-ment, to the total cost of the plant. It is calculated as a percentageof the ratio between NPV and total investment costs.
In addition, further works are required to clarify the effect ofMSW variability on SRF quality and gasifier operation parameters.It would be useful to determine the economics for new options forelectricity generation from renewable energy sources, in a sustain-able manner, this includes the MSW gasification for syngas produc-tion and its burning in an ICE coupled electric generators. MSW is apotentially valuable, partially renewable feedstock, that has beenunder utilized. Some of the technologies associated with MSWgasification are still being developed for electricity generation.Further technological improvements such as integration of othertechnologies, as well as strategies to raise both energy conversion
efficiency and plant size, may increase the plant profitability. Thispaper indicates the potential in the research for processimprovement.
Acknowledgements
The authors are very grateful to the financial support providedby the Electrical Company of Minas Gerais (CEMIG) through theResearch and Development project (R&D) ANEEL/CEMIG GT N�418, ‘‘Gasification of Municipal Solid Wastes (MSW) forElectricity Generation in Brazil’’, whose support is gratefullyacknowledged. We wish to thank the Brazilian National Researchand Development Council (CNPq). The Research SupportFoundation of the Minas Gerais State (FAPEMIG) and theCoordinating Body for the Improvement of Postgraduate Studiesin Higher Education (CAPES) for the funding of R&D projects.Also the support of graduate students and the production grants,that allowed to accomplish the research projects whose resultsare included in this paper.
References
[1] Sharma VK, Fortuna F, Mincarini M, Berillo M, Cornacchia G. Disposal of wastetyres for energy recovery and safe environment. Appl Energy 2000;65(1–4):381–94.
[2] Rocha MH, Capaz RS, Lora EES, Nogueira LAH, Leme MMV, Renó MLG, et al. Lifecycle assessment (LCA) for biofuels in Brazilian conditions: a meta-analysis.Renew Sustain Energy Rev 2014;37:435–59.
[3] Rocha MH, Lora EES, Venturini OJ, Escobar JCP, Santos JJCS, Moura AG. Use ofthe life cycle assessment (LCA) for comparison of the environmentalperformance of four alternatives for the treatment and disposal ofbioethanol stillage. Int Sugar J 2010;112(1343):611–22.
[4] Rocha MH, Lora EES, Venturini OJ. Life Cycle Analysis of different alternativesfor the treatment and disposal of ethanol vinasse. Zuckerind (Sugar Ind)2008;133(2):88–93.
[5] Leme MMV, Rocha MH, Lora EES, Venturini OJ, Lopes BM, Ferreira CH. Techno-economic analysis and environmental impact assessment of energy recoveryfrom Municipal Solid Waste (MSW) in Brazil. Resour Conserv Recycl2014;87:8–20.
[6] Laner D, Crest M, Scharff H, Morris JWF, Barlaz MA. A review of approaches forthe long-term management of municipal solid waste landfills. Waste Manage2012;32(3):498–512.
[7] Campos HKT. Recycling in Brazil: challenges and prospects. Resour ConservRecycl 2014;85:130–8.
[8] FEAM. Environmental Agency of Minas Gerais State. 2012, Energy recoveryfrom municipal solid waste: guidelines for municipal governments of MinasGerais State. FEAM/DEPED/GEMUC. Belo Horizonte: FEAM; 2012. 163 pp [inPortuguese].
[9] Brazil. Law n� 12.305, August 2, 2010a. Establishes the national policy of solidwaste; amends the Law n� 9.605 of February 12, 1998; and provides othermeasures. Federal Official Newspaper, Brasília, Brazil, August 3; 2010.<http://www.planalto.gov.br/ccivil_03/_ato2007-2010/2010/lei/l12305.htm>[accessed 13.08.14 (in Portuguese)].
[10] Brazil. Decree n� 7.404, December 23, 2010b. Establishes the national policy ofsolid waste, creates the interministry committee of the national policy of solidwaste and the guidance committee for the implementation of reverse logisticssystems, and provides other measures. Federal Official Newspaper, Brasília,Brazil, December 23; 2010. <http://www.planalto.gov.br/ccivil_03/_ato2007-2010/2010/Decreto/D7404.htm> [accessed 13.08.14 (in Portuguese)].
[11] Maier S, Oliveira LB. Economic feasibility of energy recovery from solid wastein the light of Brazil’s waste policy: the case of Rio de Janeiro. Renew SustainEnergy Rev 2014;35:484–98.
[12] Salomon KR, Lora EES. Estimate of the electric energy generating potential fordifferent sources of biogas in Brazil. Biomass Bioenergy 2009;33(9):1101–7.
[13] Rajendran K, Aslanzadeh S, Johansson F, Taherzadeh MJ. Experimental andeconomical evaluation of a novel biogas digester. Energy Convers Manage2013;74:183–91.
[14] Di Gregorio F, Zacariello L. Fluidized bed gasification of a packaging derivedfuel: energetic, environmental and economic performances comparison forwaste-to-energy plants. Energy 2012;42(1):331–41.
[15] Arena U. Process and technological aspects of municipal solid wastegasification: a review. Waste Manage 2012;32(4):625–39.
[16] Arafat HA, Jijakli K. Modeling and comparative assessment of municipal solidwaste gasification for energy production. Waste Manage 2013;33(8):1704–13.
[17] Ofori-Bateng C, Lee KT, Mensah M. The prospects of electricity generation frommunicipal solid waste (MSW) in Ghana: a better waste management option.Fuel Process Technol 2013;110:94–102.
[18] Leckner B. Process aspects in combustion and gasification Waste-to-Energy(WtE) units. Waste Manage 2015;37:13–25.

F.C. Luz et al. / Energy Conversion and Management 103 (2015) 321–337 337
[19] Lee U, Chung JN, Ingley HA. High-temperature steam gasification of municipalsolid waste, rubber, plastic and wood. Energy Fuels 2014;28(7):4573–87.
[20] Choy KKH, Porter JF, Hui C-W, McKay G. Process design and feasibility studyfor small scale MSW gasification. Chem Eng J 2004;105(1–2):31–41.
[21] Wilson B, Williams N, Liss B, Wilson B. A comparative assessment ofcommercial technologies for conversion of solid waste to energy. Preparedfor enviropower renewable, Inc.; October 2013. 41 pp. <http://www.itigroup.co/uploads/files/59_Comparative_WTE-Technologies-Mar-_2014.pdf>[accessed 20.02.15].
[22] Zhang L, Xu C, Champagne P. Overview of recent advances in thermo-chemicalconversion of biomass. Energy Convers Manage 2010;51(5):969–82.
[23] Janajreh I, Raza SS, Valmundsson AS. Plasma gasification process: modeling,simulation and comparison with conventional air gasification. Energy ConversManage 2013;65:801–9.
[24] IBGE. Brazilian Institute of Geography and Statistics. Census 2010: Populationand Household Characteristics and Results of the Universe. DemographicCensus 2010, IBGE: Brasília; 2010. <http://www.ibge.gov.br/english/estatistica/populacao/censo2010/default.shtm> [accessed 19.08.14 (inPortuguese)].
[25] ABRELPE. Brazilian Association of Public Cleaning and Special WastesCompanies. Overview of Solid Waste in Brazil, ABRELPE: São Paulo; 2010.<http://www.abrelpe.org.br/Panorama/panorama2010.pdf> [accessed 19.08.14(in Portuguese)].
[26] Zhou H, Meng A, Long Y, Li Q, Zhang Y. An overview of characteristics ofmunicipal solid fuel in China: physical, chemical composition and heatingvalue. Renew Sustain Energy Rev 2014;36:107–22.
[27] Agostinho F, Almeida CMVB, Bonilla SH, Sacomano JB, Giannetti BF. Urbansolid waste plant treatment in Brazil: is there a net emergy yield on therecovered materials? Resour Conserv Recycl 2013;73:143–55.
[28] Hilber T, Maier J, Scheffknecht G, Agraniotis M, Grammelis P, Kakaras E, et al.Advantages and possibilities of solid recovered fuel combustion in theEuropean energy sector. J Air Waste Manage Assoc 2007;57(10):1178–89.
[29] Velis CA, Longhurst PJ, Drew GH, Smith R, Pollard SJT. Production and qualityassurance of solid recovered fuels using mechanical–biological treatment(MBT) of waste: a comprehensive assessment. Crit Rev Environ Sci Technol2010;40(12):979–1105.
[30] Nasrullah M, Vainikka P, Hannula J, Hurme M. Elemental balance of SRFproduction process: solid recovered fuel produced from commercial andindustrial waste. Fuel 2015;145:1–11.
[31] Archer E, Baddeley A, Klein A, Schwager J, Whiting K. Mechanical–biological–treatment: a guide for decision makers processes, policies & markets. AnnexeC: An Assessment of the Viability of Markets for MTB Outputs. JuniperConsultancy Services Ltd.; 2005. 77 pp. <http://folloren.no/kf/Vedlegg%201%20C%20Annexe%20C_Final_Revised.pdf> [accessed 22.08.14].
[32] Magrinho A, Semiao V. Estimation of residual MSW heating value as a functionof waste component recycling. Waste Manage 2008;28(12):2675–83.
[33] Bosmans A, Vanderreydt I, Geysen D, Helsen L. The crucial role of Waste-to-Energy technologies in enhanced landfill mining: a technology review. JCleaner Prod 2013;55:10–23.
[34] Ionescu G, Rada EC, Ragazzi M, Marculescu C, Badea A, Apostol T. Integratedmunicipal solid waste scenario model using advanced pretreatment and wasteto energy processes. Energy Convers Manage 2013;76:1083–92.
[35] Chen Q, Swithenbank J, Sharifi VN. EPSRC thermal management of industrialprocesses. Case Study: sheffield district heating. Sheffield UniversityWaste Incineration Centre; 2010. 36 pp. <http://research.ncl.ac.uk/pro-tem/components/pdfs/EPSRC_Thermal_Management_Sheffield_Case_Study_Sheffield_District_Heating_system_2011.pdf> [accessed 22.08.14].
[36] Arena U, Di Gregorio F, Amorese C, Mastellone ML. A techno-economiccomparison of fluidized bed gasification of two mixed plastic wastes. WasteManage 2011;31(7):1494–504.
[37] Basu P. Biomass gasification, pyrolysis and torrefaction: practical design andtheory. 2nd ed. London, UK: Elsevier Inc.; 2013. 530 pp..
[38] Martínez JD, Lora EES, Andrade RV, Jaén RL. Experimental study on biomassgasification in a double air stage downdraft reactor. Biomass Bioenergy2011;35(8):3465–80.
[39] Arena U, Di Gregorio F, Santonastasi M. A techno-economic comparisonbetween two design configurations for a small scale, biomass–to–energygasification based system. Chem Eng J 2010;162(2):580–90.
[40] Dinh Le C. Gasification of a biomass: an investigation of key challenges toadvance acceptance of the technology. PhD thesis. Department of ChemicalEngineering. University of Bath; 2012. 324 pp.
[41] Asadullah M. Biomass gasification gas cleaning for downstream application: acomparative critical review. Renew Sustain Energy Rev 2014;40:118–32.
[42] Woolcock PJ, Brown RC. A review of cleaning technologies for biomass-derivedsyngas. Biomass Bioenergy 2013;52:54–84.
[43] Martínez JD, Mahkamov K, Andrade RV, Lora EES. Syngas production indowndraft biomass gasifiers and its application using internal combustionengines. Renewable Energy 2012;38(1):1–9.
[44] Hasler P, Nussbaumer Th. Gas cleaning for IC engine applications from fixedbed biomass gasification. Biomass Bioenergy 1999;16(6):385–95.
[45] Schmitz KW, Koch G. Kraft–Wärme–Kopplung: Anlagenauswahl-Dimensionierung Wirtschaftlichkeit-Emissionsbilanz (VDI–Buch). 1sted. Düsseldorf: Springer–Verlag; 1996. 323 pp.
[46] Salomon KR, Lora EES, Rocha MH, Almazán OO. Cost calculations for biogasfrom vinasse biodigestion and its energy utilization. Zuckerind (Sugar Ind)2011;136(4):217–23.
[47] Peters M, Timmerhaus K, West R. Plant design and economics for chemicalengineers. New York: McGraw-Hill; 2003.
[48] CCEE. Chamber for Commercialization of Electrical Energy (CCEE).Commercialization Rules of Energy and management of bilateral contractsbetween generators and suppliers; 2013. <http://www.ccee.org.br> [accessed05.09.14 (in Portuguese)].
[49] CEMPRE. Brazilian Business Commitment for Recycling (CEMPRE). CiclosoftResearch 2012: Taking a Radiographic of the Selective Collection in Brazil.CEMPRE: São Paulo, Brazil; 2013. <http://www.cempre.org.br/Ciclosoft2012.pdf> [accessed 05.09.14 (in Portuguese)].
[50] Deng J-j, Wen X-f, Zhao Y-m. Evaluating the treatment of E–waste – a casestudy of discarded refrigerators. J China Univ Min Technol 2008;18(3):454–8.