Lux Global Partners BF1024
70
No subscription can be received on the basis of this financial report. Subscriptions are only valid if made on the basis of the current issue prospectus, accompanied by the simplified prospectus and by the subscription form supplemented by the latest annual report and the most recent semi-annual report, if published thereafter. Global Partners Investment Company with Variable Capital (SICAV) with multiple Sub-Funds Luxembourg R.C.S. Luxembourg B 129759 Unaudited semi-annual report as at 30th September 2009
Transcript of Lux Global Partners BF1024

No subscription can be received on the basis of this financial report. Subscriptions are only valid if made on the basis of the current issue prospectus, accompanied by the simplified prospectus and by the subscription form supplemented by the latest annual report and the most recent semi-annual report, if published thereafter.
Global Partners
Investment Company with Variable Capital (SICAV)
with multiple Sub-Funds
Luxembourg
R.C.S. Luxembourg B 129759
Unaudited semi-annual report
as at 30th September 2009

Global Partners
1
CONTENTS
ORGANISATION................................................................................................................................................. 3
GENERAL INFORMATION .............................................................................................................................. 5
FINANCIAL CLIMATE...................................................................................................................................... 6
STATEMENT OF NET ASSETS ...................................................................................................................... 10
STATISTICAL INFORMATION ..................................................................................................................... 20
Global Partners CSOB World Growth Plus EUR 2......................................................................................... 29 STATEMENT OF INVESTMENTS AND OTHER NET ASSETS ................................................................ 29
Global Partners CSOB Variable Click Plus 1 .................................................................................................. 30 STATEMENT OF INVESTMENTS AND OTHER NET ASSETS ................................................................ 30
Global Partners CSOB Bull & Bear 2............................................................................................................... 31 STATEMENT OF INVESTMENTS AND OTHER NET ASSETS ................................................................ 31
Global Partners CSOB Asian Click Plus 1 ....................................................................................................... 32 STATEMENT OF INVESTMENTS AND OTHER NET ASSETS ................................................................ 32
Global Partners CSOB Click SKK 1 ................................................................................................................. 33 STATEMENT OF INVESTMENTS AND OTHER NET ASSETS ................................................................ 33
Global Partners CSOB Variable Growth 1 ...................................................................................................... 34 STATEMENT OF INVESTMENTS AND OTHER NET ASSETS ................................................................ 34
Global Partners CSOB Rastovy SKK 5 ............................................................................................................ 35 STATEMENT OF INVESTMENTS AND OTHER NET ASSETS ................................................................ 35
Global Partners CSOB Click SKK 6 ................................................................................................................. 36 STATEMENT OF INVESTMENTS AND OTHER NET ASSETS ................................................................ 36
Global Partners CSOB World Click Plus 25 .................................................................................................... 37 STATEMENT OF INVESTMENTS AND OTHER NET ASSETS ................................................................ 37
Global Partners KBC Rastovy SKK 1............................................................................................................... 38 STATEMENT OF INVESTMENTS AND OTHER NET ASSETS ................................................................ 38
Global Partners KBC Click SKK 2 ................................................................................................................... 39 STATEMENT OF INVESTMENTS AND OTHER NET ASSETS ................................................................ 39
Global Partners CSOB World Growth Plus 20................................................................................................ 40 STATEMENT OF INVESTMENTS AND OTHER NET ASSETS ................................................................ 40
Global Partners KBC Kuponovy SKK 1........................................................................................................... 41 STATEMENT OF INVESTMENTS AND OTHER NET ASSETS ................................................................ 41
Global Partners Kredyt Bank Fix Upside Click 1............................................................................................ 42 STATEMENT OF INVESTMENTS AND OTHER NET ASSETS ................................................................ 42
Global Partners KBC Rastovy Plus SKK 1 ...................................................................................................... 43 STATEMENT OF INVESTMENTS AND OTHER NET ASSETS ................................................................ 43
Global Partners CSOB Fixovany Click 1.......................................................................................................... 44 STATEMENT OF INVESTMENTS AND OTHER NET ASSETS ................................................................ 44
Global Partners CSOB World Growth Plus 21................................................................................................ 45 STATEMENT OF INVESTMENTS AND OTHER NET ASSETS ................................................................ 45
Global Partners PS Fixovany Click 1 ................................................................................................................ 46 STATEMENT OF INVESTMENTS AND OTHER NET ASSETS ................................................................ 46

Global Partners
CONTENTS (continued)
2
Global Partners KBC Rastovy SKK 2............................................................................................................... 47 STATEMENT OF INVESTMENTS AND OTHER NET ASSETS ................................................................ 47
Global Partners CSOB Fixovany Click 2.......................................................................................................... 48 STATEMENT OF INVESTMENTS AND OTHER NET ASSETS ................................................................ 48
Global Partners Kredyt Bank Super Fix Upside Click 1................................................................................. 49 STATEMENT OF INVESTMENTS AND OTHER NET ASSETS ................................................................ 49
Global Partners CSOB World Tree 14 ............................................................................................................. 50 STATEMENT OF INVESTMENTS AND OTHER NET ASSETS ................................................................ 50
Global Partners CSOB World Growth Plus 22................................................................................................ 51 STATEMENT OF INVESTMENTS AND OTHER NET ASSETS ................................................................ 51
Global Partners KBC Kuponovy 3.................................................................................................................... 52 STATEMENT OF INVESTMENTS AND OTHER NET ASSETS ................................................................ 52
Global Partners CSOB Fixovany Click 3.......................................................................................................... 53 STATEMENT OF INVESTMENTS AND OTHER NET ASSETS ................................................................ 53
Global Partners CSOB Fixovany Click 4.......................................................................................................... 54 STATEMENT OF INVESTMENTS AND OTHER NET ASSETS ................................................................ 54
Global Partners KBC Kuponovy 2.................................................................................................................... 55 STATEMENT OF INVESTMENTS AND OTHER NET ASSETS ................................................................ 55
Global Partners KBC Fixny Click 1.................................................................................................................. 56 STATEMENT OF INVESTMENTS AND OTHER NET ASSETS ................................................................ 56
Global Partners CSOB Fixovany Click 5.......................................................................................................... 57 STATEMENT OF INVESTMENTS AND OTHER NET ASSETS ................................................................ 57
Global Partners CSOB Fixovany Click 6.......................................................................................................... 58 STATEMENT OF INVESTMENTS AND OTHER NET ASSETS ................................................................ 58
Global Partners KBC Reverzny 3 ..................................................................................................................... 59 STATEMENT OF INVESTMENTS AND OTHER NET ASSETS ................................................................ 59
Global Partners CSOB Fixovany Click 7.......................................................................................................... 60 STATEMENT OF INVESTMENTS AND OTHER NET ASSETS ................................................................ 60
Global Partners CSOB Variable Growth 2 ...................................................................................................... 61 STATEMENT OF INVESTMENTS AND OTHER NET ASSETS ................................................................ 61
Global Partners KBC Reverzny 4 ..................................................................................................................... 62 STATEMENT OF INVESTMENTS AND OTHER NET ASSETS ................................................................ 62
Global Partners CSOB Svetoveho Rustu Plus 23............................................................................................. 63 STATEMENT OF INVESTMENTS AND OTHER NET ASSETS ................................................................ 63
Global Partners CSOB Fixovany Click 8.......................................................................................................... 64 STATEMENT OF INVESTMENTS AND OTHER NET ASSETS ................................................................ 64
NOTES TO THE FINANCIAL STATEMENTS ............................................................................................. 65

Global Partners
3
ORGANISATION
REGISTERED OFFICE 11, rue Aldringen, L-1118 Luxembourg BOARD OF DIRECTORS President: Mr Werner VAN STEEN Director Merchant Banking, KBC Bank, N.V.
Havenlaan, 2, B-1080 Brussels Directors: Mr Wim ALLEGAERT Global Head International Development, KBC Asset Management, S.A. Havenlaan, 2, B-1080 Brussels Mr Edwin DE BOECK Managing Director, KBC Asset Management, S.A.
Havenlaan, 2, B-1080 Brussels Mr Erwin SCHOETERS General Manager, KBC Group, S.A.
Havenlaan, 2, B-1080 Brussels
MANAGEMENT COMPANY AND CENTRAL ADMINISTRATION KBC ASSET MANAGEMENT, S.A., 5, place de la Gare, L-1616 Luxembourg BOARD OF DIRECTORS OF THE MANAGEMENT COMPANY President: Mr Chris DEFRANCQ Chief Operating Officer, KBC Group, S.A. Havenlaan, 2, B-1080 Brussels Managing Directors: Mr Edwin DE BOECK Managing Director, KBC Asset Management, S.A.
Havenlaan, 2, B-1080 Brussels Mr Antoon TERMOTE Chief Executive Officer, KBC Asset Management, S.A. Havenlaan, 2, B-1080 Brussels Mr Ignace VAN OORTEGEM Managing Director, KBC Asset Management, S.A.
Havenlaan, 2, B-1080 Brussels Mr Werner VAN STEEN Managing Director, KBC Asset Management, S.A.
Havenlaan, 2, B-1080 Brussels (until 1st September 2009)
Mr Marc STEVENS General Manager, Vitislife, S.A. 7, boulevard Royal, B.P. 803, L-2018 Luxembourg

Global Partners
ORGANISATION (continued)
4
EXECUTIVE OFFICERS OF THE MANAGEMENT COMPANY Mr Edwin DE BOECK Mr Karel DE CUYER Mr Antoon TERMOTE DELEGATED CENTRAL ADMINISTRATION KREDIETRUST LUXEMBOURG S.A., 11, rue Aldringen, L-2960 Luxembourg CUSTODIAN AND PRINCIPAL PAYING AGENT KBL European Private Bankers S.A., 43, boulevard Royal, L-2955 Luxembourg INDEPENDENT AUDITOR Deloitte S.A., 560, rue de Neudorf, L-2220 Luxembourg LEGAL REPRESENTATIVE AND PAYING AGENT in Czechia: Československá obchodní banka, A.S. Praha 5, Radlická 333/150 CZ-15057 PRAGUE 5 LEGAL REPRESENTATIVE in Slovakia: CSOB Asset Management, sprav. Spol, A.S. Kolarska 6 SK-81563 BRATISLAVA

Global Partners
5
GENERAL INFORMATION
Global Partners (the “SICAV”) is an open-ended investment company incorporated on 13th July 2007 under Luxembourg law subject to Part I of the amended Law of 20th December 2002 on undertakings for collective investment. The SICAV’s shares are divided up into different categories, each corresponding to a separate pool of assets (the sub-funds). The sub-funds may offer capitalisation shares (Category CAP) or distribution shares (Category DIV). At the date of the report only capitalisation shares are issued, except for the sub-funds Global Partners KBC Kuponovy 3 and Global Partners KBC Kuponovy 2, for which distribution shares are issued. As at 30th September 2009, the SICAV offers the following sub-funds: - Global Partners CSOB World Growth Plus EUR 2 in EUR - Global Partners CSOB Variable Click Plus 1 in CZK - Global Partners CSOB Bull & Bear 2 in CZK - Global Partners CSOB Asian Click Plus 1 in CZK - Global Partners CSOB Click SKK 1 in EUR - Global Partners CSOB Variable Growth 1 in CZK - Global Partners CSOB Rastovy SKK 5 in EUR - Global Partners CSOB Click SKK 6 in EUR - Global Partners CSOB World Click Plus 25 in CZK - Global Partners KBC Rastovy SKK 1 in EUR - Global Partners KBC Click SKK 2 in EUR - Global Partners CSOB World Growth Plus 20 in CZK - Global Partners KBC Kuponovy SKK 1 in EUR - Global Partners Kredyt Bank Fix Upside Click 1 in PLN - Global Partners KBC Rastovy Plus SKK 1 in EUR - Global Partners CSOB Fixovany Click 1 in CZK - Global Partners CSOB World Growth Plus 21 in CZK - Global Partners PS Fixovany Click 1 in CZK - Global Partners KBC Rastovy SKK 2 in EUR - Global Partners CSOB Fixovany Click 2 in CZK - Global Partners Kredyt Bank Super Fix Upside Click 1 in PLN - Global Partners CSOB World Tree 14 in CZK - Global Partners CSOB World Growth Plus 22 in CZK - Global Partners KBC Kuponovy 3 in EUR - Global Partners CSOB Fixovany Click 3 in CZK - Global Partners CSOB Fixovany Click 4 in CZK - Global Partners KBC Kuponovy 2 in EUR - Global Partners KBC Fixny Click 1 in EUR (launched at 31st March 2009) - Global Partners CSOB Fixovany Click 5 in CZK (launched at 27th March 2009) - Global Partners CSOB Fixovany Click 6 in CZK (launched at 30th April 2009) - Global Partners KBC Reverzny 3 in CZK (launched at 30th April 2009) - Global Partners CSOB Fixovany Click 7 in CZK (launched at 30th June 2009) - Global Partners CSOB Variable Growth 2 in CZK (launched at 30th June 2009) - Global Partners KBC Reverzny 4 in CZK (launched at 26th June 2009) - Global Partners CSOB Svetoveho Rustu Plus 23 in CZK (launched at 5th August 2009) - Global Partners CSOB Fixovany Click 8 in CZK (launched at 31st August 2009) The latest annual and semi-annual reports, the prospectus, the simplified prospectus and the Articles of Incorporation are available for inspection from the SICAV’s registered office as well as at the paying banks in the countries where the distribution of the shares is authorised.
Global Partners
6
FINANCIAL CLIMATE
The world emerged from the severe recession during the summer. Rarely has the economic slump been so deep, affecting every country, all the major sectors and all operators at the same time. Producer, consumer and investor confidence fell to an almost paralleled low. The period under review has been marked by one record after another – generally dismal ones. This does not detract from the fact that the big guns have been brought out in order to combat the crisis. In the last few months a raft of convincing macroeconomic indicators confirmed that these efforts have had an impact. The economic slump has come to a halt and there have even been clear signs of a recovery. The brightening of the economic skies since March has resulted in a spectacular improvement in the financial market climate. Out of the trough The fourth quarter of 2008 saw a severe contraction throughout the world. Real GDP shrank by an annualised 5.4% in the US, 7% in the EMU and as much as 13.1% in Japan. China, on the other hand, narrowly avoided negative growth figures. The free fall continued unabated in the early part of this year. Real GDP contracted by 6.4% in the US, 9.5% in the EMU and 11.7% in Japan (all in annualised terms). On this basis, this recession is undoubtedly the deepest of the last 60 years. The crisis resulted from the unbridled expansion of consumer credit (primarily in the United States) from the 1990s to 2007 and growing imbalances within the capital position of families (once again, chiefly in the US). So long as the value of real estate (house prices) and personal property (share prices) continued to rise, it seemed ‘reasonable’ to take on more debt. Falling house and share prices upset this balance, which can only be restored by saving more (by paying off debts and/or acquiring more assets). The reversal was very sudden. Officially, the recession in the US began in December 2007. In the initial period up until September 2008, the economy deteriorated slowly but surely. The credit and banking crisis exacerbated the recession (but did not cause it). With the Lehman Brothers debacle (15 September 2008), everyone (banks, companies and households) became much more cautious, held on to their cash and put off spending. World trade collapsed, causing serious damage for exporting countries such as Germany and Japan. The first (hesitant) signs of improvement appeared as early as the spring, and the stream of positive indicators has gathered pace from almost all corners of the globe over the last six months. The Q2 GDP statistics gave a clear indication of the turnaround in the global economy. The rate of the decline in economic activity in both the US and Europe slowed considerably. Germany, France and most Asian economies actually recorded positive growth figures in spring. The combination of the turnaround in the stock cycle and government measures such as scrappage incentives resulted in a robust recovery in global industrial activity. Countries with a strong industrial base were the main beneficiaries. In the summer, the indicators also showed that the US and the entire euro area have meanwhile returned to positive growth figures. The recession is over and the initial stage of the recovery is very strong, driven particularly by some temporary growth factors. The global economy is now in the initial stage of recovery, which is not about to end yet. Upward pressure on bond rates, despite the aggressive easing Companies had been the greatest beneficiaries of the economic boom between 2002 and 2007. Productivity gains were more than adequate, and earnings growth phenomenal. This trend of widening profit margins and earnings increases was initially sustained during the economic slowdown, at least as far as non-financial companies are concerned. On average, the earnings per share of non-financial companies in the S&P 500 rose by an annualised 14.5% in the third quarter of 2008. Including the results of financial institutions, which were particularly hard hit by enormous loan losses and write-downs on loan portfolios, total earnings were 24% lower than a year earlier. This changed dramatically in the fourth quarter, when the slowdown turned into a deep slump. That resulted in an initial, steep fall (-45.6%) in earnings for the S&P 500 (excluding the financial sector). Financials saw further large-scale write-downs on credit instruments. This led to a first quarterly loss for the stock market index as a

Global Partners
FINANCIAL CLIMATE (continued)
7
whole in more than 30 years. This trend of rapidly falling earnings continued in the first six months of 2009. Excluding the financial sector, earnings per share were 43.2% down on a year earlier in Q1 and 26.5% down in Q2. Including the financial sector, which suffered less than previously from extraordinary write-downs, earnings were down by 39.3% and 18.4% respectively. Although there were still clear signs of a contraction in earnings, the market had expected much worse in the second quarter. Shares: up from the floor Since early March 2007, the stock markets have reacted turbulently to the rapid succession of events in the financial crisis. The economic situation also began to cause concern as from September 2008. No one was left in any doubt that the global economy was in very dire straits. Indicators everywhere were gloomy enough to dispel any remaining doubts. The only question was just how deeply the credit crisis, negative wealth effects, uncertain employment prospects and ailing confidence would bite and whether these would usher in a protracted period of deflation. The rate cuts and successive budgetary stimuli came too late to ward off a severe economic downturn. The collapse of Lehman Brothers on 15 September 2008 marked a turning point. It placed a question market over the Fed's role as crisis manager. The last shred of confidence was lost. The rush to cash smothered economic activity and prompted a fresh sell-off of the most liquid financial assets (i.e. shares). Share prices plummeted between 15 September 2008 and early March 2009. Stock markets hit their floor in early March 2009. On 9 March, the S&P 500 was 55% lower than its previous peak, as far back as 9 October 2007. There has since been a spectacular rally, on the back of improved macroeconomic data and, since July, corporate results that were not as negative as originally feared. Ultimately, at the end of September the S&P 500 was already 17.0% up on the level at the end of 2008. In euro terms, that represents a gain of 11.6%. On account of their high beta, the European stock exchanges significantly outperformed the US markets during the rallies of the past few years. During the corrections they often suffered more, as well, even though the underlying factors related more to the US than to Europe. In any event, this illustrates that European equity prices are driven by global trends and that the market has remained pretty much immune to the weak local economy. What is more, the trend for European corporate earnings was very similar to that in the US: steep increases, interrupted in the third quarter of 2008. The Belgian stock market (BEL 20: +30.2% since the end of 2008) performed in line with, or even slightly better than, the other European stock markets. That in itself is a change, because the Belgian market had a very hard time during the stock-exchange volatility of 2007/08, partly because of the predominant weighting of financial shares. Japan tracked the international trends, albeit with something of a lag. Japanese banks have been less hard hit by the credit crisis, but doubts about the economic situation, the constant threat of deflation and the lack of direction in monetary policy are affecting the market. The emerging-country stock markets suffered initially (up to the beginning of March) because of high risk aversion, but subsequently rallied considerably. Asia has long been a region that shows an exaggerated reaction to changing market expectations concerning the economic cycle. In recent months, the realisation that the region is recovering from the recession more quickly than Western countries has added to the upward movement. Latin American markets have benefited from rising commodity prices. The Central European markets have for some time been affected by the crisis in the Baltic States and the danger of contamination. Style factors had lost their differentiating value for some time. That changed in the course of 2009. Since the beginning of the year, small caps have outperformed blue chips by an average of 10%. The growth factor beat the value factor by around 2.5%. Sectors that have suffered least as a result of the 2007/08 crisis – such as Food Manufacturers, Retailing, Health Care, Telecommunication Services and Utilities – lagged behind in 2009, in some cases significantly. Energy
Global Partners
FINANCIAL CLIMATE (continued)
8
and Industrials performed in line with the market average. The cyclical sectors (including Materials and Consumer Discretionary), Technology and Financials were the outperformers. These have rallied strongly since March, but there is still a long way to go before they return to the previous price levels. Mining reacted strongly to positive economic signals from China and the stock-piling of copper. Moreover, China appears to be using the crisis to tighten its grip on the sector. In the boom period from 2003 to 2007, this took the form of sizeable direct investment in Africa. Now it is in the form of a (sometimes) aggressive takeover policy on the stock market, which is not always successful. For instance, Rio Tinto exaggerated the deal with Chinalco. Manufacturers of capital goods had to contend with a rapid drop in orders in virtually all segments (cars, electrical equipment, aviation, etc.) and a halving of profit margins. The stock markets anticipated this to a large extent in 2008, and in 2009 it was realised that the sector had successfully weathered the crisis and surplus capacity was rapidly reduced. Car manufacturers have had a hard time. The death throes of Chrysler and GM proved how difficult it is to reduce overcapacity in this sector. Event the artificial boost to car sales – incentives were used to encourage consumers to bring forward their car purchase – brought little solace. One side effect of the relentless stream of negative news on car manufacturers was that US consumers were not prepared to buy cars. There were several factors responsible for the poor performance by Food and Beverage manufacturers: falling prices, a tail-off in sales volumes, slower growth in the emerging markets, the loss of market share to own brands and stock reduction among distributors. The discussions on reforms to health care in the US were a central factor in the Pharmaceuticals sector. It gradually became clear that savings will mostly be in this sector, and it is still unclear how the savings will be achieved. Stock markets do not like uncertainty and the heightened emotions in the political arena are making it difficult to determine the direction the reform process will take. This overshadowed the positive rumours about a number of large takeovers. In the Telecommunication Services sector, earnings trends have been very divergent in the last six months or so. There is some pressure on sales of mobile phones. Some operators are trying to make up for this by cutting operating costs or reducing capital expenditure. Uncertainty about future developments in electricity prices - and, more particularly, the prices of CO2 rights - was the main reason behind the poor performance by Utilities. Real estate has staged a recovery. The impressive performance up until April 2007 in virtually all regions sometimes meant that property shares were trading at substantial premiums to their net asset value. This overvaluation had made the sector very vulnerable. A series of scandals made the market ripe for correction, which has been dragging on for a full two years. The financial crisis, which originated from the residential property sector, exacerbated the crisis in this sector, which is traditionally funded by loans. The fact that many of these loans were packaged in structured investment products, repackaged and sold on in the market adversely affected the creditworthiness of many operators in this sector. That limited their room for manoeuvre considerably. The steep fall in prices has seen the premium at which many property shares were quoted in relation to their net asset value switch to a – in many cases attractive – discount. That appears to have laid an adequate foundation for the sector when the stock markets rallied as from March. Outlook This scenario of modest recovery does not prejudice the earnings forecasts. On the contrary, if anything is displaying a V-shaped recovery, it’s corporate earnings. Analysts expect the S&P 500 to gain 17% in the next 12 months and the MSCI Europe 11%. That is very modest for the first year of a recovery, and certainly considering the very weak starting point, following the steep dip in corporate earnings. On the face of it, we might expect weak economic growth to go hand in hand with only modest earnings growth. That interpretation focuses unduly, however, on turnover trends (which will indeed be lacklustre), while ignoring the leverage effect of wider margins. A combination of cyclical productivity gains and pay moderation will deliver a nominal decline in employment costs (per unit of product). At the macroeconomic level, that is reflected in an increased risk of deflation. The flip-side at company level is a strong and probably underestimated leverage effect on earnings. Hence our belief that the equity markets have not been overly enthusiastic in recent months in anticipating the economic upturn. The recovery has barely impacted equity valuations. Shares remain cheap. The S&P 500 is

Global Partners
FINANCIAL CLIMATE (continued)
9
quoted at 18.7 times the realised earnings of the past 12 months, which is more than 10% cheaper than the average price/earnings ratio (PER) for the past 15 years. The cyclical effect could be adjusted by basing the valuation on the average for the past five years, say, rather than the recent, decimated level of earnings. Even then, the PER of 12.8 is considerably lower than the average of 21.9 set over the past 20 years. Based on forecast earnings (which we consider to be underestimated) for the next 12 months, the PER for the S&P 500 is 15.8 and that for the MSCI Europe is 12.8. That too is low. Luxembourg, 2nd October 2009 The Board of Directors Note: The information in this report represents historical data and is not an indication of future results.
Global Partners
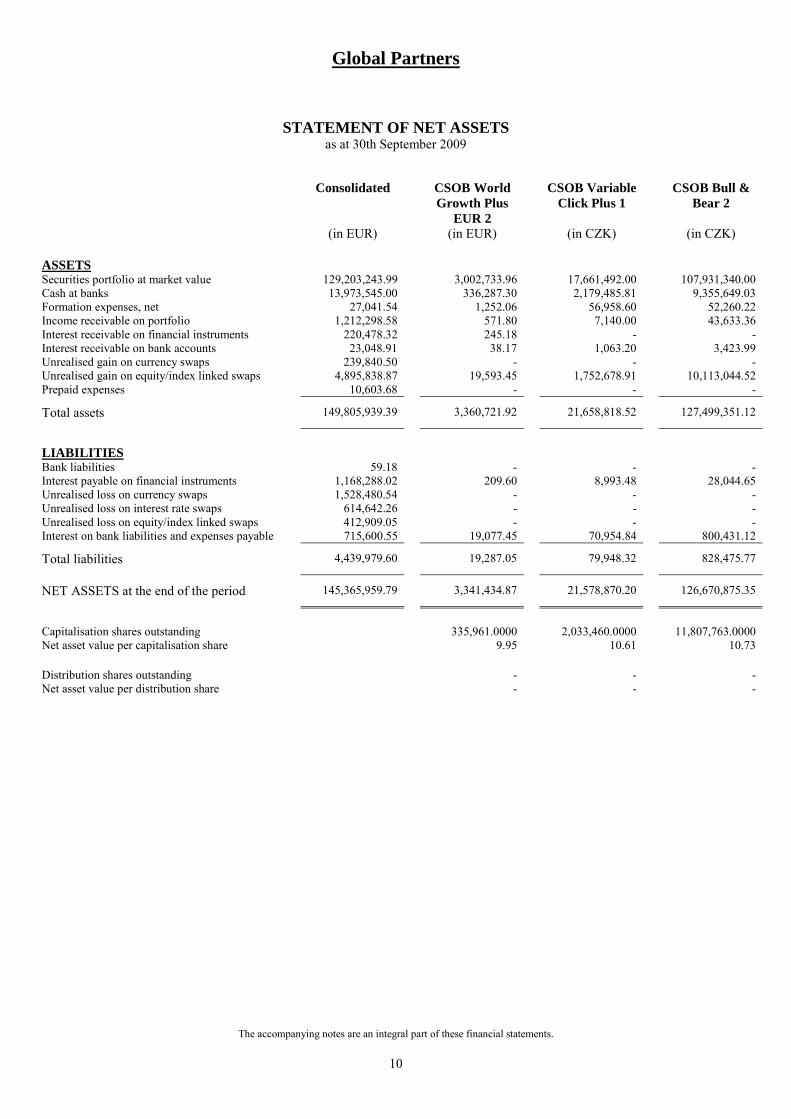
STATEMENT OF NET ASSETS as at 30th September 2009
The accompanying notes are an integral part of these financial statements.
10
Consolidated CSOB World Growth Plus
EUR 2
CSOB Variable Click Plus 1
CSOB Bull & Bear 2
(in EUR) (in EUR) (in CZK) (in CZK)
ASSETS Securities portfolio at market value 129,203,243.99 3,002,733.96 17,661,492.00 107,931,340.00 Cash at banks 13,973,545.00 336,287.30 2,179,485.81 9,355,649.03 Formation expenses, net 27,041.54 1,252.06 56,958.60 52,260.22 Income receivable on portfolio 1,212,298.58 571.80 7,140.00 43,633.36 Interest receivable on financial instruments 220,478.32 245.18 - - Interest receivable on bank accounts 23,048.91 38.17 1,063.20 3,423.99 Unrealised gain on currency swaps 239,840.50 - - - Unrealised gain on equity/index linked swaps 4,895,838.87 19,593.45 1,752,678.91 10,113,044.52 Prepaid expenses 10,603.68 - - -
Total assets 149,805,939.39 3,360,721.92 21,658,818.52 127,499,351.12
LIABILITIES Bank liabilities 59.18 - - - Interest payable on financial instruments 1,168,288.02 209.60 8,993.48 28,044.65 Unrealised loss on currency swaps 1,528,480.54 - - - Unrealised loss on interest rate swaps 614,642.26 - - - Unrealised loss on equity/index linked swaps 412,909.05 - - - Interest on bank liabilities and expenses payable 715,600.55 19,077.45 70,954.84 800,431.12
Total liabilities 4,439,979.60 19,287.05 79,948.32 828,475.77
NET ASSETS at the end of the period 145,365,959.79 3,341,434.87 21,578,870.20 126,670,875.35
Capitalisation shares outstanding 335,961.0000 2,033,460.0000 11,807,763.0000
Net asset value per capitalisation share 9.95 10.61 10.73
Distribution shares outstanding - - - Net asset value per distribution share - - -

Global Partners
STATEMENT OF NET ASSETS (continued) as at 30th September 2009
The accompanying notes are an integral part of these financial statements.
11
CSOB Asian
Click Plus 1 CSOB Click
SKK 1 CSOB Variable
Growth 1 CSOB Rastovy
SKK 5 (in CZK) (in EUR) (in CZK) (in EUR)
ASSETS Securities portfolio at market value 245,298,500.00 3,163,347.88 84,382,684.00 4,440,476.00 Cash at banks 24,281,619.99 126,650.51 9,597,221.93 208,641.80 Formation expenses, net 21,614.28 1,322.95 37,005.74 682.92 Income receivable on portfolio 99,166.64 8,647.36 34,113.36 12,138.44 Interest receivable on financial instruments - 3,240.36 - 3,137.00 Interest receivable on bank accounts 7,975.69 10.30 3,196.12 17.06 Unrealised gain on currency swaps - - - - Unrealised gain on equity/index linked swaps 12,738,928.10 210,403.79 - 201,232.30 Prepaid expenses - - - -
Total assets 282,447,804.70 3,513,623.15 94,054,221.15 4,866,325.52
LIABILITIES Bank liabilities - - - - Interest payable on financial instruments 66,411.65 - 23,485.46 - Unrealised loss on currency swaps - - - - Unrealised loss on interest rate swaps - - - - Unrealised loss on equity/index linked swaps - - 3,283,650.04 - Interest on bank liabilities and expenses payable 1,907,626.88 23,927.23 648,633.26 32,852.62
Total liabilities 1,974,038.53 23,927.23 3,955,768.76 32,852.62
NET ASSETS at the end of the period 280,473,766.17 3,489,695.92 90,098,452.39 4,833,472.90
Capitalisation shares outstanding 27,162,392.0000 10,020,249.0000 9,482,067.0000 14,150,267.0000
Net asset value per capitalisation share 10.33 0.348264 9.50 0.341582
Distribution shares outstanding - - - - Net asset value per distribution share - - - -

Global Partners
STATEMENT OF NET ASSETS (continued) as at 30th September 2009
The accompanying notes are an integral part of these financial statements.
12
CSOB Click
SKK 6 CSOB World
Click Plus 25 KBC Rastovy
SKK 1 KBC Click
SKK 2 (in EUR) (in CZK) (in EUR) (in EUR)
ASSETS Securities portfolio at market value 2,004,108.64 37,285,372.00 2,121,997.40 1,709,386.80 Cash at banks 55,187.06 2,868,876.14 207,305.14 86,705.14 Formation expenses, net 898.30 11,074.13 430.37 430.37 Income receivable on portfolio 5,478.40 15,073.36 5,800.64 4,672.80 Interest receivable on financial instruments 943.34 - 1,819.26 - Interest receivable on bank accounts 3.27 1,716.47 260.63 6.96 Unrealised gain on currency swaps - - - - Unrealised gain on equity/index linked swaps 103,314.67 1,205,935.68 7,010.10 120,707.79 Prepaid expenses - - - -
Total assets 2,169,933.68 41,388,047.78 2,344,623.54 1,921,909.86
LIABILITIES Bank liabilities - - - - Interest payable on financial instruments - 10,109.64 - 78.15 Unrealised loss on currency swaps - - - - Unrealised loss on interest rate swaps - - - - Unrealised loss on equity/index linked swaps - - - - Interest on bank liabilities and expenses payable 9,143.06 247,889.46 17,030.42 7,982.45
Total liabilities 9,143.06 257,999.10 17,030.42 8,060.60
NET ASSETS at the end of the period 2,160,790.62 41,130,048.68 2,327,593.12 1,913,849.26
Capitalisation shares outstanding 6,246,581.0000 4,035,079.0000 7,088,659.0000 5,478,778.0000
Net asset value per capitalisation share 0.345916 10.19 0.328355 0.34932
Distribution shares outstanding - - - - Net asset value per distribution share - - - -

Global Partners
STATEMENT OF NET ASSETS (continued) as at 30th September 2009
The accompanying notes are an integral part of these financial statements.
13
CSOB World
Growth Plus 20 KBC Kuponovy
SKK 1 Kredyt Bank
Fix Upside Click 1
KBC Rastovy Plus SKK 1
(in CZK) (in EUR) (in PLN) (in EUR)
ASSETS Securities portfolio at market value 124,739,946.16 5,187,104.80 33,100,736.56 1,491,554.16 Cash at banks 14,525,687.77 199,947.32 980,289.25 173,301.20 Formation expenses, net 24,805.19 941.41 3,583.56 958.51 Income receivable on portfolio 1,287,638.84 14,179.40 336,981.24 284.00 Interest receivable on financial instruments - 6,583.27 - 158.23 Interest receivable on bank accounts 70,411.39 16.61 1,087.35 18.81 Unrealised gain on currency swaps - - - - Unrealised gain on equity/index linked swaps - 206,464.02 2,801,914.05 253,250.20 Prepaid expenses - - - -
Total assets 140,648,489.35 5,615,236.83 37,224,592.01 1,919,525.11
LIABILITIES Bank liabilities - - - - Interest payable on financial instruments 829,569.09 - 233,871.84 78.95 Unrealised loss on currency swaps - - - - Unrealised loss on interest rate swaps - - - - Unrealised loss on equity/index linked swaps 978,430.82 - - - Interest on bank liabilities and expenses payable 774,123.84 38,390.18 215,227.77 7,728.24
Total liabilities 2,582,123.75 38,390.18 449,099.61 7,807.19
NET ASSETS at the end of the period 138,066,365.60 5,576,846.65 36,775,492.40 1,911,717.92
Capitalisation shares outstanding 14,094,811.0000 - 339,973.0000 5,052,977.0000
Net asset value per capitalisation share 9.80 - 108.17 0.378335
Distribution shares outstanding - 16,332,287.0000 - - Net asset value per distribution share - 0.341461 - -

Global Partners
STATEMENT OF NET ASSETS (continued) as at 30th September 2009
The accompanying notes are an integral part of these financial statements.
14
CSOB Fixovany
Click 1 CSOB World
Growth Plus 21 PS Fixovany
Click 1 KBC Rastovy
SKK 2 (in CZK) (in CZK) (in CZK) (in EUR)
ASSETS Securities portfolio at market value 137,489,590.00 71,691,000.44 136,507,521.44 1,375,368.64 Cash at banks 9,070,318.81 6,285,186.12 6,353,570.48 195,233.96 Formation expenses, net 22,817.17 24,413.51 18,444.64 720.83 Income receivable on portfolio 698,366.64 364,148.36 693,378.36 3,759.76 Interest receivable on financial instruments - - - 1,151.65 Interest receivable on bank accounts 17,039.27 17,057.65 3,648.62 259.71 Unrealised gain on currency swaps - - - - Unrealised gain on equity/index linked swaps 5,117,192.76 4,594,621.01 4,199,505.96 311,681.43 Prepaid expenses - - - -
Total assets 152,415,324.65 82,976,427.09 147,776,069.50 1,888,175.98
LIABILITIES Bank liabilities - - - - Interest payable on financial instruments 385,295.81 146,974.61 430,983.69 - Unrealised loss on currency swaps - - - - Unrealised loss on interest rate swaps - - - - Unrealised loss on equity/index linked swaps - - - - Interest on bank liabilities and expenses payable 591,521.85 535,724.58 348,031.33 6,939.42
Total liabilities 976,817.66 682,699.19 779,015.02 6,939.42
NET ASSETS at the end of the period 151,438,506.99 82,293,727.90 146,997,054.48 1,881,236.56
Capitalisation shares outstanding 14,634,171.0000 7,605,893.0000 13,832,485.0000 4,577,080.0000
Net asset value per capitalisation share 10.35 10.82 10.63 0.411012
Distribution shares outstanding - - - - Net asset value per distribution share - - - -

Global Partners
STATEMENT OF NET ASSETS (continued) as at 30th September 2009
The accompanying notes are an integral part of these financial statements.
15
CSOB Fixovany
Click 2 Kredyt Bank
Super Fix Upside Click 1
CSOB World Tree 14
CSOB World Growth Plus 22
(in CZK) (in PLN) (in CZK) (in CZK)
ASSETS Securities portfolio at market value 189,539,220.44 7,981,580.81 52,902,962.65 47,144,907.76 Cash at banks 13,173,920.57 905,217.06 8,359,998.86 9,657,384.43 Formation expenses, net 25,946.80 4,509.78 27,525.17 18,844.67 Income receivable on portfolio 962,748.36 144,446.53 927,224.52 1,018,147.58 Interest receivable on financial instruments - 71,753.75 687,121.01 333,755.25 Interest receivable on bank accounts 22,063.73 4,274.11 34,817.48 33,639.04 Unrealised gain on currency swaps - - 871,644.21 - Unrealised gain on equity/index linked swaps 5,512,924.92 360,596.47 - 4,192,735.44 Prepaid expenses - 44,977.67 - -
Total assets 209,236,824.82 9,517,356.18 63,811,293.90 62,399,414.17
LIABILITIES Bank liabilities - - - - Interest payable on financial instruments 675,022.84 201,866.98 1,391,401.48 1,165,907.53 Unrealised loss on currency swaps - 421,179.06 - 159,964.23 Unrealised loss on interest rate swaps - - - - Unrealised loss on equity/index linked swaps - - 1,215,221.36 - Interest on bank liabilities and expenses payable 754,211.88 46,755.70 306,420.44 328,869.48
Total liabilities 1,429,234.72 669,801.74 2,913,043.28 1,654,741.24
NET ASSETS at the end of the period 207,807,590.10 8,847,554.44 60,898,250.62 60,744,672.93
Capitalisation shares outstanding 19,813,764.0000 85,186.0000 6,253,037.0000 5,584,480.0000
Net asset value per capitalisation share 10.49 103.86 9.74 10.88
Distribution shares outstanding - - - - Net asset value per distribution share - - - -

Global Partners
STATEMENT OF NET ASSETS (continued) as at 30th September 2009
The accompanying notes are an integral part of these financial statements.
16
KBC
Kuponovy 3 CSOB Fixovany
Click 3 CSOB Fixovany
Click 4 KBC
Kuponovy 2 (in EUR) (in CZK) (in CZK) (in EUR)
ASSETS Securities portfolio at market value 4,695,901.72 101,590,010.91 102,901,701.35 2,296,119.46 Cash at banks 347,352.58 19,880,897.93 16,398,926.11 311,811.35 Formation expenses, net 735.20 26,919.04 27,923.68 1,098.10 Income receivable on portfolio 12,836.64 2,006,762.99 318,325.52 19,921.92 Interest receivable on financial instruments - 58,607.80 59,731.88 20,846.66 Interest receivable on bank accounts 272.37 5,975.23 4,947.10 1,242.96 Unrealised gain on currency swaps - 312,374.01 4,557,843.49 - Unrealised gain on equity/index linked swaps 341,266.00 2,068,283.33 1,498,345.51 119,243.34 Prepaid expenses - - - -
Total assets 5,398,364.51 125,949,831.24 125,767,744.64 2,770,283.79
LIABILITIES Bank liabilities - - 1,498.36 - Interest payable on financial instruments 3,837.31 2,050,046.32 352,861.00 24,386.92 Unrealised loss on currency swaps - - - - Unrealised loss on interest rate swaps - - - 111,075.82 Unrealised loss on equity/index linked swaps - - - - Interest on bank liabilities and expenses payable 18,899.10 599,278.85 974,101.67 18,771.91
Total liabilities 22,736.41 2,649,325.17 1,328,461.03 154,234.65
NET ASSETS at the end of the period 5,375,628.10 123,300,506.07 124,439,283.61 2,616,049.14
Capitalisation shares outstanding - 11,967,274.0000 12,087,853.0000 -
Net asset value per capitalisation share - 10.30 10.29 -
Distribution shares outstanding 14,730,711.0000 - - 246,508.0000 Net asset value per distribution share 0.364927 - - 10.61

Global Partners
STATEMENT OF NET ASSETS (continued) as at 30th September 2009
The accompanying notes are an integral part of these financial statements.
17
KBC Fixny
Click 1 CSOB Fixovany
Click 5 CSOB Fixovany
Click 6 KBC Reverzny
3 (in EUR) (in CZK) (in CZK) (in EUR)
ASSETS Securities portfolio at market value 1,405,319.35 46,228,235.54 108,110,123.12 5,091,298.32 Cash at banks 208,290.19 9,917,565.14 15,429,741.92 879,435.77 Formation expenses, net - - - - Income receivable on portfolio 32,737.95 790,055.95 1,746,515.15 123,204.66 Interest receivable on financial instruments 12,745.55 608,214.91 1,268,842.20 927.26 Interest receivable on bank accounts 1,123.05 57,737.34 75,287.14 126.56 Unrealised gain on currency swaps - 330,575.02 - - Unrealised gain on equity/index linked swaps 31,059.09 1,853,837.47 - 28,768.46 Prepaid expenses - - - -
Total assets 1,691,275.18 59,786,221.37 126,630,509.53 6,123,761.03
LIABILITIES Bank liabilities - - - - Interest payable on financial instruments 34,606.74 1,038,618.79 2,395,124.95 123,725.13 Unrealised loss on currency swaps - - 1,861,276.87 - Unrealised loss on interest rate swaps 85,331.07 - - 338,083.87 Unrealised loss on equity/index linked swaps - - 671,713.34 - Interest on bank liabilities and expenses payable 12,221.41 472,538.51 704,181.23 13,630.96
Total liabilities 132,159.22 1,511,157.30 5,632,296.39 475,439.96
NET ASSETS at the end of the period 1,559,115.96 58,275,064.07 120,998,213.14 5,648,321.07
Capitalisation shares outstanding 150,838.0000 5,648,987.0000 12,157,697 566,264
Net asset value per capitalisation share 10.34 10.32 9.95 9.97
Distribution shares outstanding - - - - Net asset value per distribution share - - - -

Global Partners
STATEMENT OF NET ASSETS (continued) as at 30th September 2009
The accompanying notes are an integral part of these financial statements.
18
CSOB Fixovany
Click 7 CSOB Variable
Growth 2 KBC Reverzny
4 CSOB
Svetoveho Rustu Plus 23
(in CZK) (in CZK) (in EUR) (in CZK)
ASSETS Securities portfolio at market value 68,241,905.19 46,875,380.14 2,565,574.00 51,439,773.00 Cash at banks 11,775,251.27 7,888,760.99 450,835.51 7,774,926.21 Formation expenses, net - - - - Income receivable on portfolio 1,523,679.67 680,318.86 36,209.59 710,838.21 Interest receivable on financial instruments 375,788.71 258,957.57 563.98 99,074.19 Interest receivable on bank accounts 37,266.38 22,266.90 31.27 9,189.63 Unrealised gain on currency swaps - - - - Unrealised gain on equity/index linked swaps 758,512.31 - - - Prepaid expenses - - - -
Total assets 82,712,403.53 55,725,684.46 3,053,214.35 60,033,801.24
LIABILITIES Bank liabilities - - - - Interest payable on financial instruments 1,724,825.46 862,472.28 39,841.52 787,103.53 Unrealised loss on currency swaps 3,496,720.18 2,345,357.09 - 3,525,708.10 Unrealised loss on interest rate swaps - - 80,151.50 - Unrealised loss on equity/index linked swaps - 1,167,186.40 15,300.64 1,052,724.76 Interest on bank liabilities and expenses payable 216,922.99 92,369.09 7,347.79 65,341.35
Total liabilities 5,438,468.63 4,467,384.86 142,641.45 5,430,877.74
NET ASSETS at the end of the period 77,273,934.90 51,258,299.60 2,910,572.90 54,602,923.50
Capitalisation shares outstanding 7,790,084 5,323,311 294,680 5,650,000
Net asset value per capitalisation share 9.92 9.63 9.88 9.66
Distribution shares outstanding - - - - Net asset value per distribution share - - - -

Global Partners
STATEMENT OF NET ASSETS (continued) as at 30th September 2009
The accompanying notes are an integral part of these financial statements.
19
CSOB Fixovany
Click 8
(in CZK)
ASSETS Securities portfolio at market value 221,391,483.52 Cash at banks 41,880,371.10 Formation expenses, net - Income receivable on portfolio 6,792,403.11 Interest receivable on financial instruments 78,093.75 Interest receivable on bank accounts 36,056.92 Unrealised gain on currency swaps - Unrealised gain on equity/index linked swaps - Prepaid expenses -
Total assets 270,178,408.40
LIABILITIES Bank liabilities - Interest payable on financial instruments 6,863,936.76 Unrealised loss on currency swaps 24,796,021.34 Unrealised loss on interest rate swaps - Unrealised loss on equity/index linked swaps 1,697,980.33 Interest on bank liabilities and expenses payable 191,989.12
Total liabilities 33,549,927.55
NET ASSETS at the end of the period 236,628,480.85
Capitalisation shares outstanding 24,581,498
Net asset value per capitalisation share 9.63
Distribution shares outstanding - Net asset value per distribution share -

Global Partners
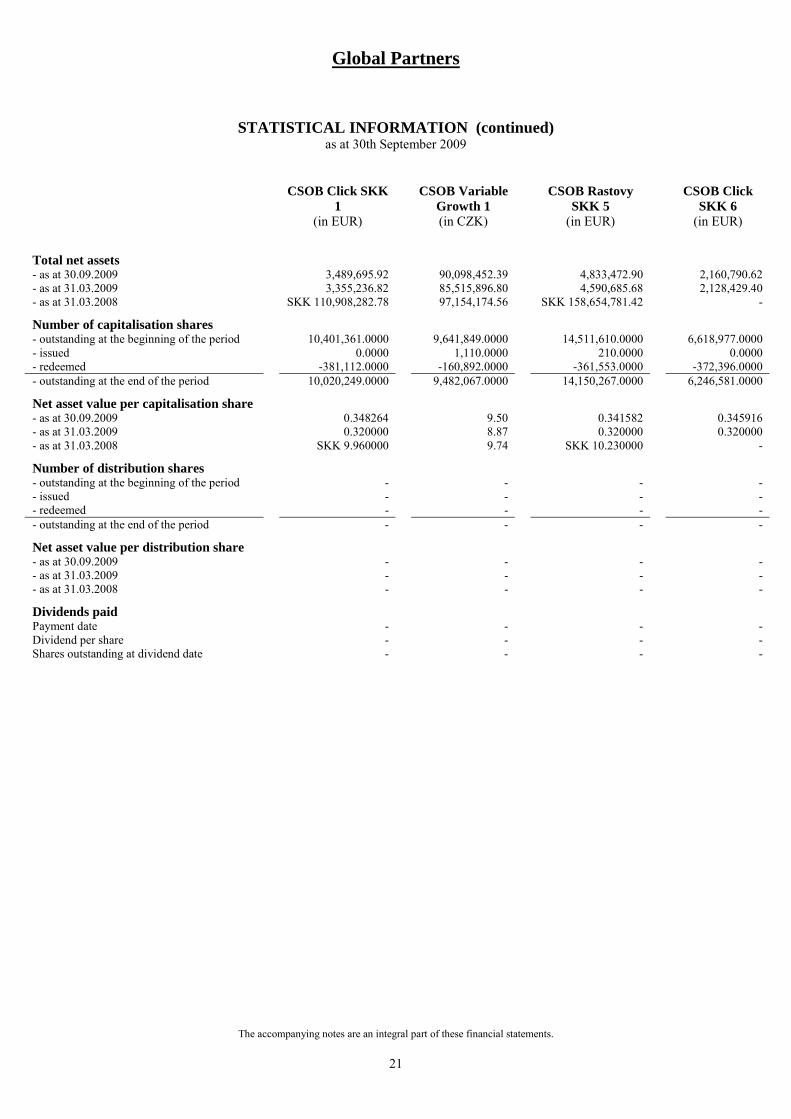
STATISTICAL INFORMATION as at 30th September 2009
The accompanying notes are an integral part of these financial statements.
20
CSOB World Growth Plus
EUR 2
CSOB Variable Click Plus 1
CSOB Bull & Bear 2
CSOB Asian Click Plus 1
(in EUR) (in CZK) (in CZK) (in CZK)
Total net assets - as at 30.09.2009 3,341,434.87 21,578,870.20 126,670,875.35 280,473,766.17 - as at 31.03.2009 3,122,731.81 19,502,796.60 127,587,164.37 263,413,186.24 - as at 31.03.2008 3,251,106.76 20,770,802.43 130,852,529.44 274,786,883.71
Number of capitalisation shares - outstanding at the beginning of the period 333,015.0000 2,053,460.0000 12,159,982.0000 27,538,830.0000 - issued 2,946.0000 0.0000 0.0000 0.0000 - redeemed 0.0000 -20,000.0000 -352,219.0000 -376,438.0000 - outstanding at the end of the period 335,961.0000 2,033,460.0000 11,807,763.0000 27,162,392.0000
Net asset value per capitalisation share - as at 30.09.2009 9.95 10.61 10.73 10.33 - as at 31.03.2009 9.38 9.50 10.49 9.57 - as at 31.03.2008 9.75 9.46 10.11 9.80
Number of distribution shares - outstanding at the beginning of the period - - - - - issued - - - - - redeemed - - - - - outstanding at the end of the period - - - -
Net asset value per distribution share - as at 30.09.2009 - - - - - as at 31.03.2009 - - - - - as at 31.03.2008 - - - -
Dividends paid Payment date - - - - Dividend per share - - - - Shares outstanding at dividend date - - - -
Global Partners
STATISTICAL INFORMATION (continued) as at 30th September 2009
The accompanying notes are an integral part of these financial statements.
21
CSOB Click SKK
1 CSOB Variable
Growth 1 CSOB Rastovy
SKK 5 CSOB Click
SKK 6 (in EUR) (in CZK) (in EUR) (in EUR)
Total net assets - as at 30.09.2009 3,489,695.92 90,098,452.39 4,833,472.90 2,160,790.62 - as at 31.03.2009 3,355,236.82 85,515,896.80 4,590,685.68 2,128,429.40 - as at 31.03.2008 SKK 110,908,282.78 97,154,174.56 SKK 158,654,781.42 -
Number of capitalisation shares - outstanding at the beginning of the period 10,401,361.0000 9,641,849.0000 14,511,610.0000 6,618,977.0000 - issued 0.0000 1,110.0000 210.0000 0.0000 - redeemed -381,112.0000 -160,892.0000 -361,553.0000 -372,396.0000 - outstanding at the end of the period 10,020,249.0000 9,482,067.0000 14,150,267.0000 6,246,581.0000
Net asset value per capitalisation share - as at 30.09.2009 0.348264 9.50 0.341582 0.345916 - as at 31.03.2009 0.320000 8.87 0.320000 0.320000 - as at 31.03.2008 SKK 9.960000 9.74 SKK 10.230000 -
Number of distribution shares - outstanding at the beginning of the period - - - - - issued - - - - - redeemed - - - - - outstanding at the end of the period - - - -
Net asset value per distribution share - as at 30.09.2009 - - - - - as at 31.03.2009 - - - - - as at 31.03.2008 - - - -
Dividends paid Payment date - - - - Dividend per share - - - - Shares outstanding at dividend date - - - -

Global Partners
STATISTICAL INFORMATION (continued) as at 30th September 2009
The accompanying notes are an integral part of these financial statements.
22
CSOB World
Click Plus 25 KBC Rastovy
SKK 1 KBC Click
SKK 2 CSOB World
Growth Plus 20 (in CZK) (in EUR) (in EUR) (in CZK)
Total net assets - as at 30.09.2009 41,130,048.68 2,327,593.12 1,913,849.26 138,066,365.60 - as at 31.03.2009 38,781,472.45 2,208,040.56 1,839,906.66 131,224,932.37 - as at 31.03.2008 - - - -
Number of capitalisation shares - outstanding at the beginning of the period 4,081,039.0000 7,213,434.0000 5,633,938.0000 14,264,421.0000 - issued 0.0000 2,000.0000 0.0000 0.0000 - redeemed -45,960.0000 -126,775.0000 -155,160.0000 -169,610.0000 - outstanding at the end of the period 4,035,079.0000 7,088,659.0000 5,478,778.0000 14,094,811.0000
Net asset value per capitalisation share - as at 30.09.2009 10.19 0.328355 0.34932 9.80 - as at 31.03.2009 9.50 0.310000 0.33000 9.20 - as at 31.03.2008 - - - -
Number of distribution shares - outstanding at the beginning of the period - - - - - issued - - - - - redeemed - - - - - outstanding at the end of the period - - - -
Net asset value per distribution share - as at 30.09.2009 - - - - - as at 31.03.2009 - - - - - as at 31.03.2008 - - - -
Dividends paid Payment date - - - - Dividend per share - - - - Shares outstanding at dividend date - - - -

Global Partners
STATISTICAL INFORMATION (continued) as at 30th September 2009
The accompanying notes are an integral part of these financial statements.
23
KBC
Kuponovy SKK 1
Kredyt Bank Fix Upside
Click 1
KBC Rastovy Plus SKK 1
CSOB Fixovany Click 1
(in EUR) (in PLN) (in EUR) (in CZK)
Total net assets - as at 30.09.2009 5,576,846.65 36,775,492.40 1,911,717.92 151,438,506.99 - as at 31.03.2009 5,732,301.14 34,201,017.36 1,712,794.85 140,160,305.98 - as at 31.03.2008 - - - -
Number of capitalisation shares - outstanding at the beginning of the period - 353,666.0000 5,378,942.0000 14,638,105.0000 - issued - 0.0000 0.0000 230,250.0000 - redeemed - -13,693.0000 -325,965.0000 -234,184.0000 - outstanding at the end of the period - 339,973.0000 5,052,977.0000 14,634,171.0000
Net asset value per capitalisation share - as at 30.09.2009 - 108.17 0.378335 10.35 - as at 31.03.2009 - 96.70 0.320000 9.58 - as at 31.03.2008 - - - -
Number of distribution shares - outstanding at the beginning of the period 17,128,180.0000 - - - - issued 0.0000 - - - - redeemed -795,893.0000 - - - - outstanding at the end of the period 16,332,287.0000 - - -
Net asset value per distribution share - as at 30.09.2009 0.341461 - - - - as at 31.03.2009 0.330000 - - - - as at 31.03.2008 - - - -
Dividends paid Payment date 31.08.2009 - - - Dividend per share 0.01494 - - - Shares outstanding at dividend date 16,574,080.0000 - - -

Global Partners
STATISTICAL INFORMATION (continued) as at 30th September 2009
The accompanying notes are an integral part of these financial statements.
24
CSOB World
Growth Plus 21 PS Fixovany
Click 1 KBC Rastovy
SKK 2 CSOB Fixovany
Click 2 (in CZK) (in CZK) (in EUR) (in CZK)
Total net assets - as at 30.09.2009 82,293,727.90 146,997,054.48 1,881,236.56 207,807,590.10 - as at 31.03.2009 72,907,280.65 138,874,998.19 1,514,152.68 194,836,494.69 - as at 31.03.2008 - - - -
Number of capitalisation shares - outstanding at the beginning of the period 7,813,460.0000 14,099,769.0000 4,580,475.0000 19,900,000.0000 - issued 0.0000 0.0000 0.0000 0.0000 - redeemed -207,567.0000 -267,284.0000 -3,395.0000 -86,236.0000 - outstanding at the end of the period 7,605,893.0000 13,832,485.0000 4,577,080.0000 19,813,764.0000
Net asset value per capitalisation share - as at 30.09.2009 10.82 10.63 0.411012 10.49 - as at 31.03.2009 9.33 9.85 0.330000 9.79 - as at 31.03.2008 - - - -
Number of distribution shares - outstanding at the beginning of the period - - - - - issued - - - - - redeemed - - - - - outstanding at the end of the period - - - -
Net asset value per distribution share - as at 30.09.2009 - - - - - as at 31.03.2009 - - - - - as at 31.03.2008 - - - -
Dividends paid Payment date - - - - Dividend per share - - - - Shares outstanding at dividend date - - - -

Global Partners
STATISTICAL INFORMATION (continued) as at 30th September 2009
The accompanying notes are an integral part of these financial statements.
25
Kredyt Bank
Super Fix Upside Click 1
CSOB World Tree 14
CSOB World Growth Plus 22
KBC Kuponovy 3
(in PLN) (in CZK) (in CZK) (in EUR)
Total net assets - as at 30.09.2009 8,847,554.44 60,898,250.62 60,744,672.93 5,375,628.10 - as at 31.03.2009 8,814,080.92 57,432,313.75 54,170,195.44 4,945,332.32 - as at 31.03.2008 - - - -
Number of capitalisation shares - outstanding at the beginning of the period 87,339.0000 6,310,000.0000 5,712,923.0000 - - issued 0.0000 0.0000 0.0000 - - redeemed -2,153.0000 -56,963.0000 -128,443.0000 - - outstanding at the end of the period 85,186.0000 6,253,037.0000 5,584,480.0000 -
Net asset value per capitalisation share - as at 30.09.2009 103.86 9.74 10.88 - - as at 31.03.2009 100.92 9.10 9.48 - - as at 31.03.2008 - - - -
Number of distribution shares - outstanding at the beginning of the period - - - 14,825,664.0000 - issued - - - 0.0000 - redeemed - - - -94,953.0000 - outstanding at the end of the period - - - 14,730,711.0000
Net asset value per distribution share - as at 30.09.2009 - - - 0.364927 - as at 31.03.2009 - - - 0.330000 - as at 31.03.2008 - - - -
Dividends paid Payment date - - - - Dividend per share - - - - Shares outstanding at dividend date - - - -

Global Partners
STATISTICAL INFORMATION (continued) as at 30th September 2009
The accompanying notes are an integral part of these financial statements.
26
CSOB Fixovany
Click 3 CSOB Fixovany
Click 4 KBC Kuponovy 2 KBC Fixny Click
1 (in CZK) (in CZK) (in EUR) (in EUR)
Total net assets - as at 30.09.2009 123,300,506.07 124,439,283.61 2,616,049.14 1,559,115.96 - as at 31.03.2009 115,737,177.65 119,050,429.55 2,530,851.78 1,536,242.45 - as at 31.03.2008 - - - -
Number of capitalisation shares - outstanding at the beginning of the period 11,967,274.0000 12,349,980.0000 - 153,686.0000 - issued 0.0000 0.0000 - 0.0000 - redeemed 0.0000 -262,127.0000 - -2,848.0000 - outstanding at the end of the period 11,967,274.0000 12,087,853.0000 - 150,838.0000
Net asset value per capitalisation share - as at 30.09.2009 10.30 10.29 - 10.34 - as at 31.03.2009 9.67 9.64 - 10.00 - as at 31.03.2008 - - - -
Number of distribution shares - outstanding at the beginning of the period - - 250,369.0000 - - issued - - 0.0000 - - redeemed - - -3,861.0000 - - outstanding at the end of the period - - 246,508.0000 -
Net asset value per distribution share - as at 30.09.2009 - - 10.61 - - as at 31.03.2009 - - 10.11 - - as at 31.03.2008 - - - -
Dividends paid Payment date - - - - Dividend per share - - - - Shares outstanding at dividend date - - - -

Global Partners
STATISTICAL INFORMATION (continued) as at 30th September 2009
The accompanying notes are an integral part of these financial statements.
27
CSOB Fixovany
Click 5 CSOB Fixovany
Click 6 KBC Reverzny 3 CSOB Fixovany
Click 7 (in CZK) (in CZK) (in EUR) (in CZK)
Total net assets - as at 30.09.2009 58,275,064.07 120,998,213.14 5,648,321.07 77,273,934.90 - as at 31.03.2009 55,053,870.00 - - - - as at 31.03.2008 - - - -
Number of capitalisation shares - outstanding at the beginning of the period 5,505,387.0000 0.0000 0.0000 0.0000 - issued 147,590.0000 12,281,244.0000 576,621.0000 7,806,556.0000 - redeemed -3,990.0000 -123,547.0000 -10,357.0000 -16,472.0000 - outstanding at the end of the period 5,648,987.0000 12,157,697.0000 566,264.0000 7,790,084.0000
Net asset value per capitalisation share - as at 30.09.2009 10.32 9.95 9.97 9.92 - as at 31.03.2009 10.00 - - - - as at 31.03.2008 - - - -
Number of distribution shares - outstanding at the beginning of the period - - - - - issued - - - - - redeemed - - - - - outstanding at the end of the period - - - -
Net asset value per distribution share - as at 30.09.2009 - - - - - as at 31.03.2009 - - - - - as at 31.03.2008 - - - -
Dividends paid Payment date - - - - Dividend per share - - - - Shares outstanding at dividend date - - - -

Global Partners
STATISTICAL INFORMATION (continued) as at 30th September 2009
The accompanying notes are an integral part of these financial statements.
28
CSOB Variable
Growth 2 KBC Reverzny
4 CSOB
Svetoveho Rustu Plus 23
CSOB Fixovany Click 8
(in CZK) (in EUR) (in CZK) (in CZK)
Total net assets - as at 30.09.2009 51,258,299.60 2,910,572.90 54,602,923.50 236,628,480.85 - as at 31.03.2009 - - - - - as at 31.03.2008 - - - -
Number of capitalisation shares - outstanding at the beginning of the period 0.0000 0.0000 0.0000 0.0000 - issued 5,323,311.0000 296,156.0000 5,650,000.0000 24,581,498.0000 - redeemed 0.0000 -1,476.0000 0.0000 0.0000 - outstanding at the end of the period 5,323,311.0000 294,680.0000 5,650,000.0000 24,581,498.0000
Net asset value per capitalisation share - as at 30.09.2009 9.63 9.88 9.66 9.63 - as at 31.03.2009 - - - - - as at 31.03.2008 - - - -
Number of distribution shares - outstanding at the beginning of the period - - - - - issued - - - - - redeemed - - - - - outstanding at the end of the period - - - -
Net asset value per distribution share - as at 30.09.2009 - - - - - as at 31.03.2009 - - - - - as at 31.03.2008 - - - -
Dividends paid Payment date - - - - Dividend per share - - - - Shares outstanding at dividend date - - - -

Global Partners
CSOB World Growth Plus EUR 2
STATEMENT OF INVESTMENTS AND OTHER NET ASSETS as at 30th September 2009
(in EUR)
The accompanying notes are an integral part of these financial statements.
29
Currency
Number / nominal value
Description Cost Market value % of total net assets
INVESTMENTS IN SECURITIES
TRANSFERABLE SECURITIES ADMITTED TO AN OFFICIAL STOCK EXCHANGE LISTING
Bonds
EUR 306,000 Amethyst Structured Fin Plc FRN Ser 2006-1 Tr 1 06/23.09.14 305,013.21 300,273.39 8.99 EUR 306,000 Beechwood Structured Fin Plc FRN Ser 2006-1 Tr 1 06/23.09.14 305,013.21 300,273.39 8.99 EUR 306,000 Brookfields Capital Plc FRN EMTN Ser 2006-1 Tr 1 06/23.09.14 305,013.21 300,273.39 8.99 EUR 306,000 Eperon Finance Plc FRN EMTN Ser 2006-1 Tr 1 06/23.09.14 305,013.21 300,273.39 8.99 EUR 153,000 Espaccio Securities Plc FRN EMTN Ser 2006-1 Tr 1 06/23.09.14 152,506.60 150,136.70 4.49 EUR 153,000 Greenstreet Struc Fin Prod Plc FRN EMTN Sen 06/23.09.14 152,506.60 150,136.70 4.49 EUR 153,000 Nimrod Capital Plc FRN EMTN Ser 2006-1 Tr 1 06/23.09.14 152,506.60 150,136.70 4.50 EUR 153,000 Opal Financial Products Plc FRN Ser 2006-1 06/23.09.14 152,506.60 150,136.70 4.49 EUR 153,000 Profile Finance Plc FRN EMTN Ser 2006-1 Tr 1 06/23.09.14 152,506.60 150,136.70 4.49 EUR 153,000 Recolte Securities Plc FRN Ser 2006-1 Tr 2 07/23.09.14 152,506.60 150,136.70 4.49 EUR 153,000 Silverstate Fin Inv Plc FRN Ser 2006-1 Tr 2 07/23.09.14 152,506.60 150,136.70 4.49 EUR 153,000 Vespucci Strut Fin Prod Plc FRN Ser 2006-1Tr 2 07/23.09.14 152,506.60 150,136.70 4.49 EUR 153,000 Vigado Capital Plc FRN Ser 2006-1 Tr 2 07/23.09.14 152,506.60 150,136.70 4.49 EUR 153,000 Voyce Investments Plc FRN EMTN 07/23.09.14 152,506.60 150,136.70 4.49 EUR 153,000 Waterford Cap Investments Plc FRN Ser 2006-1 07/23.09.14 152,506.60 150,136.70 4.50 EUR 153,000 Waves Fin Inv Plc FRN Ser 2006-1 Tr 2 07/23.09.14 152,506.60 150,136.70 4.49
TOTAL INVESTMENTS IN SECURITIES 3,050,132.04 3,002,733.96 89.86
CASH AT BANKS 336,287.30 10.06
OTHER NET ASSETS/(LIABILITIES) 2,413.61 0.08
TOTAL 3,341,434.87 100.00

Global Partners
CSOB Variable Click Plus 1
STATEMENT OF INVESTMENTS AND OTHER NET ASSETS as at 30th September 2009
(in CZK)
The accompanying notes are an integral part of these financial statements.
30
Currency Number /
nominal value Description Cost Market value % of total
net assets
INVESTMENTS IN SECURITIES
TRANSFERABLE SECURITIES ADMITTED TO AN OFFICIAL STOCK EXCHANGE LISTING
Bonds
CZK 1,800,000 Amethyst Structured Fin Plc FRN Ser 2007-8 Tr 1 07/23.03.15 1,798,717.71 1,766,149.20 8.19 CZK 1,800,000 Beechwood Structured Fin Plc FRN Ser 2007-8 Tr 1 07/23.03.15 1,798,717.71 1,766,149.20 8.19 CZK 1,800,000 Brookfields Capital Plc FRN Ser 2007-8 Tr 1 07/23.03.15 1,798,717.71 1,766,149.20 8.19 CZK 1,800,000 Eperon Finance Plc FRN Ser 2007-8 Tr 1 07/23.03.15 1,798,717.71 1,766,149.20 8.19 CZK 900,000 Espaccio Securities Plc FRN Ser 2007-8 Tr 1 07/23.03.15 899,358.85 883,074.60 4.09 CZK 900,000 Greenstreet Struc Fin Prod Plc FRN Ser 2007-8 07/23.03.15 899,358.85 883,074.60 4.09 CZK 900,000 Nimrod Capital Plc FRN Ser 2007-8 Tr 1 07/23.03.15 899,358.85 883,074.60 4.09 CZK 900,000 Opal Financial Products Plc FRN Ser 2007-8 Tr 1 07/23.03.15 899,358.85 883,074.60 4.09 CZK 900,000 Profile Finance Plc FRN Ser 2007-8 Tr 1 07/23.03.15 899,358.85 883,074.60 4.10 CZK 900,000 Recolte Securities Plc FRN Ser 2007-8 Tr 1 07/23.03.15 899,358.85 883,074.60 4.09 CZK 900,000 Silverstate Fin Inv Plc FRN Ser 2007-8 07/23.03.15 899,358.85 883,074.60 4.09 CZK 900,000 Vespucci Strut Fin Prod Plc FRN Ser 2007-8 Tr 1 07/23.03.15 899,358.85 883,074.60 4.09 CZK 900,000 Vigado Capital Plc FRN Ser 2007-8 Tr 1 07/23.03.15 899,358.85 883,074.60 4.09 CZK 900,000 Voyce Investments Plc FRN Ser 2007-8 Tr 1 07/23.03.15 899,358.85 883,074.60 4.09 CZK 900,000 Waterford Cap Investments Plc FRN Ser 07-8 Tr 1 07/23.03.15 899,358.85 883,074.60 4.09 CZK 900,000 Waves Fin Inv Plc FRN Ser 2007-8 Tr 1 07/23.03.15 899,358.85 883,074.60 4.09
TOTAL INVESTMENTS IN SECURITIES 17,987,177.04 17,661,492.00 81.85
CASH AT BANKS 2,179,485.81 10.10
OTHER NET ASSETS/(LIABILITIES) 1,737,892.39 8.05
TOTAL 21,578,870.20 100.00

Global Partners
CSOB Bull & Bear 2
STATEMENT OF INVESTMENTS AND OTHER NET ASSETS as at 30th September 2009
(in CZK)
The accompanying notes are an integral part of these financial statements.
31
Currency Number /
nominal value Description Cost Market value % of total
net assets
INVESTMENTS IN SECURITIES
TRANSFERABLE SECURITIES ADMITTED TO AN OFFICIAL STOCK EXCHANGE LISTING
Bonds
CZK 11,000,000 Amethyst Structured Fin Plc FRN Ser 2007-8 Tr 1 07/23.03.15 10,990,773.15 10,793,134.00 8.52 CZK 11,000,000 Beechwood Structured Fin Plc FRN Ser 2007-8 Tr 1 07/23.03.15 10,990,773.15 10,793,134.00 8.52 CZK 11,000,000 Brookfields Capital Plc FRN Ser 2007-8 Tr 1 07/23.03.15 10,990,773.15 10,793,134.00 8.53 CZK 11,000,000 Eperon Finance Plc FRN Ser 2007-8 Tr 1 07/23.03.15 10,990,773.15 10,793,134.00 8.52 CZK 5,500,000 Espaccio Securities Plc FRN Ser 2007-8 Tr 1 07/23.03.15 5,495,386.57 5,396,567.00 4.26 CZK 5,500,000 Greenstreet Struc Fin Prod Plc FRN Ser 2007-8 07/23.03.15 5,495,386.57 5,396,567.00 4.26 CZK 5,500,000 Nimrod Capital Plc FRN Ser 2007-8 Tr 1 07/23.03.15 5,495,386.57 5,396,567.00 4.26 CZK 5,500,000 Opal Financial Products Plc FRN Ser 2007-8 Tr 1 07/23.03.15 5,495,386.57 5,396,567.00 4.26 CZK 5,500,000 Profile Finance Plc FRN Ser 2007-8 Tr 1 07/23.03.15 5,495,386.57 5,396,567.00 4.26 CZK 5,500,000 Recolte Securities Plc FRN Ser 2007-8 Tr 1 07/23.03.15 5,495,386.57 5,396,567.00 4.26 CZK 5,500,000 Silverstate Fin Inv Plc FRN Ser 2007-8 07/23.03.15 5,495,386.57 5,396,567.00 4.26 CZK 5,500,000 Vespucci Strut Fin Prod Plc FRN Ser 2007-8 Tr 1 07/23.03.15 5,495,386.57 5,396,567.00 4.26 CZK 5,500,000 Vigado Capital Plc FRN Ser 2007-8 Tr 1 07/23.03.15 5,495,386.57 5,396,567.00 4.26 CZK 5,500,000 Voyce Investments Plc FRN Ser 2007-8 Tr 1 07/23.03.15 5,495,386.57 5,396,567.00 4.26 CZK 5,500,000 Waterford Cap Investments Plc FRN Ser 07-8 Tr 1 07/23.03.15 5,495,386.57 5,396,567.00 4.26 CZK 5,500,000 Waves Fin Inv Plc FRN Ser 2007-8 Tr 1 07/23.03.15 5,495,386.57 5,396,567.00 4.26
TOTAL INVESTMENTS IN SECURITIES 109,907,731.44 107,931,340.00 85.21
CASH AT BANKS 9,355,649.03 7.39
OTHER NET ASSETS/(LIABILITIES) 9,383,886.32 7.40
TOTAL 126,670,875.35 100.00

Global Partners
CSOB Asian Click Plus 1
STATEMENT OF INVESTMENTS AND OTHER NET ASSETS as at 30th September 2009
(in CZK)
The accompanying notes are an integral part of these financial statements.
32
Currency Number /
nominal value Description Cost Market value % of total
net assets
INVESTMENTS IN SECURITIES
TRANSFERABLE SECURITIES ADMITTED TO AN OFFICIAL STOCK EXCHANGE LISTING
Bonds
CZK 25,000,000 Amethyst Structured Fin Plc FRN Ser 2007-8 Tr 1 07/23.03.15 24,941,100.47 24,529,850.00 8.75 CZK 25,000,000 Beechwood Structured Fin Plc FRN Ser 2007-8 Tr 1 07/23.03.15 24,941,100.47 24,529,850.00 8.75 CZK 25,000,000 Brookfields Capital Plc FRN Ser 2007-8 Tr 1 07/23.03.15 24,941,120.30 24,529,850.00 8.75 CZK 25,000,000 Eperon Finance Plc FRN Ser 2007-8 Tr 1 07/23.03.15 24,941,100.47 24,529,850.00 8.75 CZK 12,500,000 Espaccio Securities Plc FRN Ser 2007-8 Tr 1 07/23.03.15 12,470,550.23 12,264,925.00 4.37 CZK 12,500,000 Greenstreet Struc Fin Prod Plc FRN Ser 2007-8 07/23.03.15 12,470,560.15 12,264,925.00 4.37 CZK 12,500,000 Nimrod Capital Plc FRN Ser 2007-8 Tr 1 07/23.03.15 12,470,550.23 12,264,925.00 4.37 CZK 12,500,000 Opal Financial Products Plc FRN Ser 2007-8 Tr 1 07/23.03.15 12,470,550.23 12,264,925.00 4.37 CZK 12,500,000 Profile Finance Plc FRN Ser 2007-8 Tr 1 07/23.03.15 12,470,550.23 12,264,925.00 4.38 CZK 12,500,000 Recolte Securities Plc FRN Ser 2007-8 Tr 1 07/23.03.15 12,470,550.23 12,264,925.00 4.37 CZK 12,500,000 Silverstate Fin Inv Plc FRN Ser 2007-8 07/23.03.15 12,470,550.23 12,264,925.00 4.37 CZK 12,500,000 Vespucci Strut Fin Prod Plc FRN Ser 2007-8 Tr 1 07/23.03.15 12,470,560.15 12,264,925.00 4.37 CZK 12,500,000 Vigado Capital Plc FRN Ser 2007-8 Tr 1 07/23.03.15 12,470,550.23 12,264,925.00 4.37 CZK 12,500,000 Voyce Investments Plc FRN Ser 2007-8 Tr 1 07/23.03.15 12,470,550.23 12,264,925.00 4.37 CZK 12,500,000 Waterford Cap Investments Plc FRN Ser 07-8 Tr 1 07/23.03.15 12,470,550.23 12,264,925.00 4.38 CZK 12,500,000 Waves Fin Inv Plc FRN Ser 2007-8 Tr 1 07/23.03.15 12,470,550.23 12,264,925.00 4.37
TOTAL INVESTMENTS IN SECURITIES 249,411,044.31 245,298,500.00 87.46
CASH AT BANKS 24,281,619.99 8.66
OTHER NET ASSETS/(LIABILITIES) 10,893,646.18 3.88
TOTAL 280,473,766.17 100.00

Global Partners
CSOB Click SKK 1
STATEMENT OF INVESTMENTS AND OTHER NET ASSETS as at 30th September 2009
(in EUR)
The accompanying notes are an integral part of these financial statements.
33
Currency Number /
nominal value Description Cost Market value % of total
net assets
INVESTMENTS IN SECURITIES
TRANSFERABLE SECURITIES ADMITTED TO AN OFFICIAL STOCK EXCHANGE LISTING
Bonds
EUR 322,000 Amethyst Structured Fin Plc FRN Ser 2007-6 Tr 2 07/10.01.15 306,927.63 316,334.80 9.07 EUR 322,000 Beechwood Structured Fin Plc FRN Sen 2007-6 Tr 2 07/10.01.15 306,927.63 316,334.80 9.07 EUR 322,000 Brookfields Capital Plc FRN EMTN Ser 2007-6 Tr 2 07/10.01.15 306,927.63 316,334.80 9.07 EUR 322,000 Eperon Finance Plc FRN EMTN Ser 2007-6 Tr 2 07/10.01.15 306,927.63 316,334.80 9.07 EUR 161,000 Espaccio Securities Plc FRN EMTN Ser 2007-6 Tr 2 07/10.01.15 153,463.81 158,167.39 4.53 EUR 161,000 Greenstreet Struc Fin Prod Plc FRN EMTN Sen 07/10.01.15 153,463.81 158,167.39 4.53 EUR 161,000 Nimrod Capital Plc FRN EMTN Ser 2007-6 Tr 2 07/10.01.15 153,463.81 158,167.39 4.53 EUR 161,000 Opal Financial Prod Plc FRN EMTN Ser 2007-6 Tr 2 07/10.01.15 153,463.81 158,167.39 4.53 EUR 161,000 Profile Finance Plc FRN EMTN Ser 2007-6 Tr 2 07/10.01.15 153,463.81 158,167.39 4.54 EUR 161,000 Recolte Securities Plc FRN EMTN Ser 2007-6 Tr 2 07/10.01.15 153,463.81 158,167.39 4.53 EUR 161,000 Silverstate Fin Inv Plc FRN EMTN Ser 2007-6 Tr 2 07/10.01.15 153,463.81 158,167.39 4.53 EUR 161,000 Vespucci Strut Fin Prod Plc FRN Ser 2007-6 Tr 2 07/10.01.15 153,463.81 158,167.39 4.53 EUR 161,000 Vigado Capital Plc FRN EMTN Ser 2007-6 Tr 2 07/10.01.15 153,463.81 158,167.39 4.53 EUR 161,000 Voyce Investments Plc FRN EMTN Ser 2007-6 Tr 2 07/10.01.15 153,463.81 158,167.39 4.53 EUR 161,000 Waterford Cap Investments Plc FRN Ser 2007-6 07/10.01.15 153,463.81 158,167.39 4.53 EUR 161,000 Waves Fin Inv Plc FRN Ser 2007-6 Tr 2 07/10.01.15 153,463.81 158,167.39 4.53
TOTAL INVESTMENTS IN SECURITIES 3,069,276.24 3,163,347.88 90.65
CASH AT BANKS 126,650.51 3.63
OTHER NET ASSETS/(LIABILITIES) 199,697.53 5.72
TOTAL 3,489,695.92 100.00

Global Partners
CSOB Variable Growth 1
STATEMENT OF INVESTMENTS AND OTHER NET ASSETS as at 30th September 2009
(in CZK)
The accompanying notes are an integral part of these financial statements.
34
Currency Number /
nominal value Description Cost Market value % of total
net assets
INVESTMENTS IN SECURITIES
TRANSFERABLE SECURITIES ADMITTED TO AN OFFICIAL STOCK EXCHANGE LISTING
Bonds
CZK 8,600,000 Amethyst Structured Fin Plc FRN Ser 2007-8 Tr 1 07/23.03.15 8,598,985.20 8,438,268.40 9.37 CZK 8,600,000 Beechwood Structured Fin Plc FRN Ser 2007-8 Tr 1 07/23.03.15 8,598,985.20 8,438,268.40 9.37 CZK 8,600,000 Brookfields Capital Plc FRN Ser 2007-8 Tr 1 07/23.03.15 8,598,985.20 8,438,268.40 9.37 CZK 8,600,000 Eperon Finance Plc FRN Ser 2007-8 Tr 1 07/23.03.15 8,598,985.20 8,438,268.40 9.37 CZK 4,300,000 Espaccio Securities Plc FRN Ser 2007-8 Tr 1 07/23.03.15 4,299,492.60 4,219,134.20 4.68 CZK 4,300,000 Greenstreet Struc Fin Prod Plc FRN Ser 2007-8 07/23.03.15 4,299,492.60 4,219,134.20 4.68 CZK 4,300,000 Nimrod Capital Plc FRN Ser 2007-8 Tr 1 07/23.03.15 4,299,492.60 4,219,134.20 4.68 CZK 4,300,000 Opal Financial Products Plc FRN Ser 2007-8 Tr 1 07/23.03.15 4,299,492.60 4,219,134.20 4.69 CZK 4,300,000 Profile Finance Plc FRN Ser 2007-8 Tr 1 07/23.03.15 4,299,492.60 4,219,134.20 4.68 CZK 4,300,000 Recolte Securities Plc FRN Ser 2007-8 Tr 1 07/23.03.15 4,299,492.60 4,219,134.20 4.68 CZK 4,300,000 Silverstate Fin Inv Plc FRN Ser 2007-8 07/23.03.15 4,299,492.60 4,219,134.20 4.68 CZK 4,300,000 Vespucci Strut Fin Prod Plc FRN Ser 2007-8 Tr 1 07/23.03.15 4,299,492.60 4,219,134.20 4.68 CZK 4,300,000 Vigado Capital Plc FRN Ser 2007-8 Tr 1 07/23.03.15 4,299,492.60 4,219,134.20 4.68 CZK 4,300,000 Voyce Investments Plc FRN Ser 2007-8 Tr 1 07/23.03.15 4,299,492.60 4,219,134.20 4.69 CZK 4,300,000 Waterford Cap Investments Plc FRN Ser 07-8 Tr 1 07/23.03.15 4,299,492.60 4,219,134.20 4.68 CZK 4,300,000 Waves Fin Inv Plc FRN Ser 2007-8 Tr 1 07/23.03.15 4,299,492.60 4,219,134.20 4.68
TOTAL INVESTMENTS IN SECURITIES 85,989,852.00 84,382,684.00 93.66
CASH AT BANKS 9,597,221.93 10.65
OTHER NET ASSETS/(LIABILITIES) -3,881,453.54 -4.31
TOTAL 90,098,452.39 100.00

Global Partners
CSOB Rastovy SKK 5
STATEMENT OF INVESTMENTS AND OTHER NET ASSETS as at 30th September 2009
(in EUR)
The accompanying notes are an integral part of these financial statements.
35
Currency Number /
nominal value Description Cost Market value % of total
net assets
INVESTMENTS IN SECURITIES
TRANSFERABLE SECURITIES ADMITTED TO AN OFFICIAL STOCK EXCHANGE LISTING
Bonds
EUR 452,000 Amethyst Structured Fin Plc FRN Ser 2007-6 Tr 2 07/10.01.15 430,810.01 444,047.60 9.19 EUR 452,000 Beechwood Structured Fin Plc FRN Sen 2007-6 Tr 2 07/10.01.15 430,810.01 444,047.60 9.19 EUR 452,000 Brookfields Capital Plc FRN EMTN Ser 2007-6 Tr 2 07/10.01.15 430,810.01 444,047.60 9.19 EUR 452,000 Eperon Finance Plc FRN EMTN Ser 2007-6 Tr 2 07/10.01.15 430,810.01 444,047.60 9.19 EUR 226,000 Espaccio Securities Plc FRN EMTN Ser 2007-6 Tr 2 07/10.01.15 215,405.00 222,023.80 4.59 EUR 226,000 Greenstreet Struc Fin Prod Plc FRN EMTN Sen 07/10.01.15 215,405.00 222,023.80 4.59 EUR 226,000 Nimrod Capital Plc FRN EMTN Ser 2007-6 Tr 2 07/10.01.15 215,405.00 222,023.80 4.59 EUR 226,000 Opal Financial Prod Plc FRN EMTN Ser 2007-6 Tr 2 07/10.01.15 215,405.00 222,023.80 4.60 EUR 226,000 Profile Finance Plc FRN EMTN Ser 2007-6 Tr 2 07/10.01.15 215,405.00 222,023.80 4.59 EUR 226,000 Recolte Securities Plc FRN EMTN Ser 2007-6 Tr 2 07/10.01.15 215,405.00 222,023.80 4.59 EUR 226,000 Silverstate Fin Inv Plc FRN EMTN Ser 2007-6 Tr 2 07/10.01.15 215,405.00 222,023.80 4.59 EUR 226,000 Vespucci Strut Fin Prod Plc FRN Ser 2007-6 Tr 2 07/10.01.15 215,405.00 222,023.80 4.59 EUR 226,000 Vigado Capital Plc FRN EMTN Ser 2007-6 Tr 2 07/10.01.15 215,405.00 222,023.80 4.59 EUR 226,000 Voyce Investments Plc FRN EMTN Ser 2007-6 Tr 2 07/10.01.15 215,405.00 222,023.80 4.60 EUR 226,000 Waterford Cap Investments Plc FRN Ser 2007-6 07/10.01.15 215,405.00 222,023.80 4.60 EUR 226,000 Waves Fin Inv Plc FRN Ser 2007-6 Tr 2 07/10.01.15 215,405.00 222,023.80 4.59
TOTAL INVESTMENTS IN SECURITIES 4,308,100.04 4,440,476.00 91.87
CASH AT BANKS 208,641.80 4.32
OTHER NET ASSETS/(LIABILITIES) 184,355.10 3.81
TOTAL 4,833,472.90 100.00

Global Partners
CSOB Click SKK 6
STATEMENT OF INVESTMENTS AND OTHER NET ASSETS as at 30th September 2009
(in EUR)
The accompanying notes are an integral part of these financial statements.
36
Currency Number /
nominal value Description Cost Market value % of total
net assets
INVESTMENTS IN SECURITIES
TRANSFERABLE SECURITIES ADMITTED TO AN OFFICIAL STOCK EXCHANGE LISTING
Bonds
EUR 204,000 Amethyst Structured Fin Plc FRN Ser 2007-6 Tr 2 07/10.01.15 194,437.25 200,410.87 9.27 EUR 204,000 Beechwood Structured Fin Plc FRN Sen 2007-6 Tr 2 07/10.01.15 194,437.25 200,410.87 9.27 EUR 204,000 Brookfields Capital Plc FRN EMTN Ser 2007-6 Tr 2 07/10.01.15 194,437.25 200,410.87 9.27 EUR 204,000 Eperon Finance Plc FRN EMTN Ser 2007-6 Tr 2 07/10.01.15 194,437.25 200,410.87 9.27 EUR 102,000 Espaccio Securities Plc FRN EMTN Ser 2007-6 Tr 2 07/10.01.15 97,218.62 100,205.43 4.64 EUR 102,000 Greenstreet Struc Fin Prod Plc FRN EMTN Sen 07/10.01.15 97,218.62 100,205.43 4.64 EUR 102,000 Nimrod Capital Plc FRN EMTN Ser 2007-6 Tr 2 07/10.01.15 97,218.62 100,205.43 4.64 EUR 102,000 Opal Financial Prod Plc FRN EMTN Ser 2007-6 Tr 2 07/10.01.15 97,218.62 100,205.43 4.63 EUR 102,000 Profile Finance Plc FRN EMTN Ser 2007-6 Tr 2 07/10.01.15 97,218.62 100,205.43 4.64 EUR 102,000 Recolte Securities Plc FRN EMTN Ser 2007-6 Tr 2 07/10.01.15 97,218.62 100,205.43 4.64 EUR 102,000 Silverstate Fin Inv Plc FRN EMTN Ser 2007-6 Tr 2 07/10.01.15 97,218.62 100,205.43 4.64 EUR 102,000 Vespucci Strut Fin Prod Plc FRN Ser 2007-6 Tr 2 07/10.01.15 97,218.62 100,205.43 4.64 EUR 102,000 Vigado Capital Plc FRN EMTN Ser 2007-6 Tr 2 07/10.01.15 97,218.62 100,205.43 4.64 EUR 102,000 Voyce Investments Plc FRN EMTN Ser 2007-6 Tr 2 07/10.01.15 97,218.62 100,205.43 4.64 EUR 102,000 Waterford Cap Investments Plc FRN Ser 2007-6 07/10.01.15 97,218.62 100,205.43 4.64 EUR 102,000 Waves Fin Inv Plc FRN Ser 2007-6 Tr 2 07/10.01.15 97,218.62 100,205.43 4.64
TOTAL INVESTMENTS IN SECURITIES 1,944,372.44 2,004,108.64 92.75
CASH AT BANKS 55,187.06 2.55
OTHER NET ASSETS/(LIABILITIES) 101,494.92 4.70
TOTAL 2,160,790.62 100.00
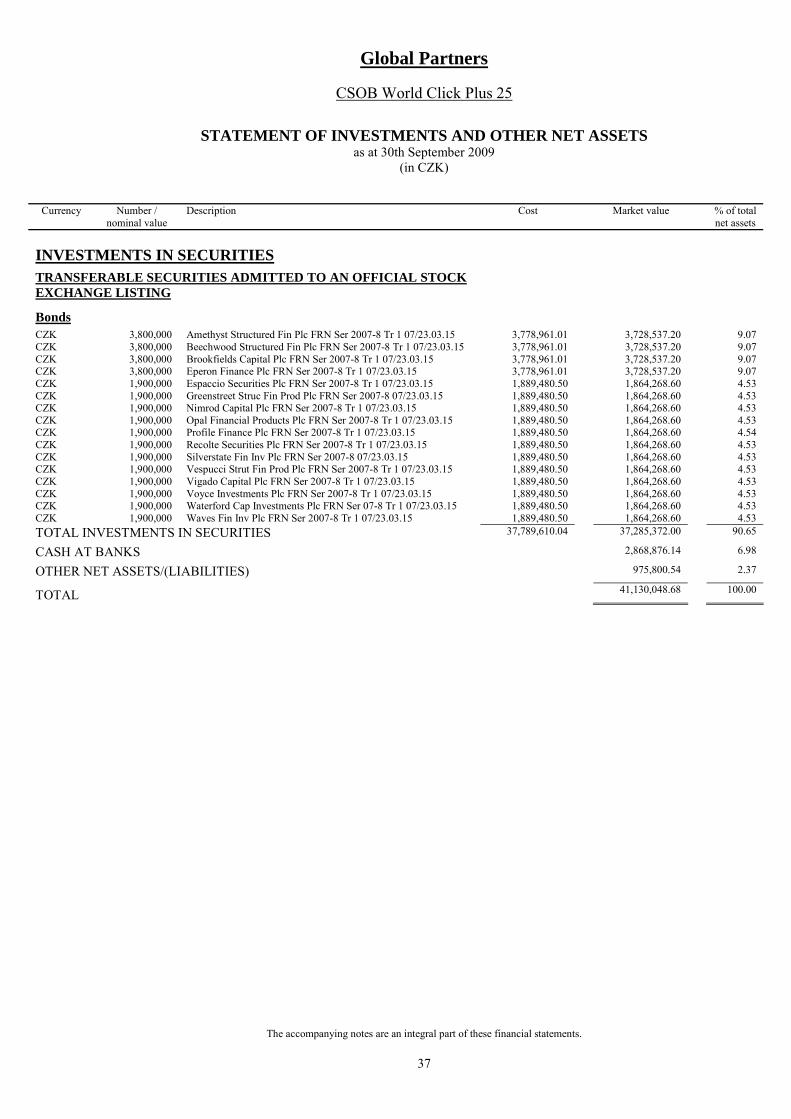
Global Partners
CSOB World Click Plus 25
STATEMENT OF INVESTMENTS AND OTHER NET ASSETS as at 30th September 2009
(in CZK)
The accompanying notes are an integral part of these financial statements.
37
Currency Number /
nominal value Description Cost Market value % of total
net assets
INVESTMENTS IN SECURITIES
TRANSFERABLE SECURITIES ADMITTED TO AN OFFICIAL STOCK EXCHANGE LISTING
Bonds
CZK 3,800,000 Amethyst Structured Fin Plc FRN Ser 2007-8 Tr 1 07/23.03.15 3,778,961.01 3,728,537.20 9.07 CZK 3,800,000 Beechwood Structured Fin Plc FRN Ser 2007-8 Tr 1 07/23.03.15 3,778,961.01 3,728,537.20 9.07 CZK 3,800,000 Brookfields Capital Plc FRN Ser 2007-8 Tr 1 07/23.03.15 3,778,961.01 3,728,537.20 9.07 CZK 3,800,000 Eperon Finance Plc FRN Ser 2007-8 Tr 1 07/23.03.15 3,778,961.01 3,728,537.20 9.07 CZK 1,900,000 Espaccio Securities Plc FRN Ser 2007-8 Tr 1 07/23.03.15 1,889,480.50 1,864,268.60 4.53 CZK 1,900,000 Greenstreet Struc Fin Prod Plc FRN Ser 2007-8 07/23.03.15 1,889,480.50 1,864,268.60 4.53 CZK 1,900,000 Nimrod Capital Plc FRN Ser 2007-8 Tr 1 07/23.03.15 1,889,480.50 1,864,268.60 4.53 CZK 1,900,000 Opal Financial Products Plc FRN Ser 2007-8 Tr 1 07/23.03.15 1,889,480.50 1,864,268.60 4.53 CZK 1,900,000 Profile Finance Plc FRN Ser 2007-8 Tr 1 07/23.03.15 1,889,480.50 1,864,268.60 4.54 CZK 1,900,000 Recolte Securities Plc FRN Ser 2007-8 Tr 1 07/23.03.15 1,889,480.50 1,864,268.60 4.53 CZK 1,900,000 Silverstate Fin Inv Plc FRN Ser 2007-8 07/23.03.15 1,889,480.50 1,864,268.60 4.53 CZK 1,900,000 Vespucci Strut Fin Prod Plc FRN Ser 2007-8 Tr 1 07/23.03.15 1,889,480.50 1,864,268.60 4.53 CZK 1,900,000 Vigado Capital Plc FRN Ser 2007-8 Tr 1 07/23.03.15 1,889,480.50 1,864,268.60 4.53 CZK 1,900,000 Voyce Investments Plc FRN Ser 2007-8 Tr 1 07/23.03.15 1,889,480.50 1,864,268.60 4.53 CZK 1,900,000 Waterford Cap Investments Plc FRN Ser 07-8 Tr 1 07/23.03.15 1,889,480.50 1,864,268.60 4.53 CZK 1,900,000 Waves Fin Inv Plc FRN Ser 2007-8 Tr 1 07/23.03.15 1,889,480.50 1,864,268.60 4.53
TOTAL INVESTMENTS IN SECURITIES 37,789,610.04 37,285,372.00 90.65
CASH AT BANKS 2,868,876.14 6.98
OTHER NET ASSETS/(LIABILITIES) 975,800.54 2.37
TOTAL 41,130,048.68 100.00

Global Partners
KBC Rastovy SKK 1
STATEMENT OF INVESTMENTS AND OTHER NET ASSETS as at 30th September 2009
(in EUR)
The accompanying notes are an integral part of these financial statements.
38
Currency Number /
nominal value Description Cost Market value % of total
net assets
INVESTMENTS IN SECURITIES
TRANSFERABLE SECURITIES ADMITTED TO AN OFFICIAL STOCK EXCHANGE LISTING
Bonds
EUR 216,000 Amethyst Structured Fin Plc FRN Ser 2007-6 Tr 2 07/10.01.15 205,865.21 212,199.74 9.11 EUR 216,000 Beechwood Structured Fin Plc FRN Sen 2007-6 Tr 2 07/10.01.15 205,865.21 212,199.74 9.11 EUR 216,000 Brookfields Capital Plc FRN EMTN Ser 2007-6 Tr 2 07/10.01.15 205,865.21 212,199.74 9.11 EUR 216,000 Eperon Finance Plc FRN EMTN Ser 2007-6 Tr 2 07/10.01.15 205,865.21 212,199.74 9.12 EUR 108,000 Espaccio Securities Plc FRN EMTN Ser 2007-6 Tr 2 07/10.01.15 102,932.61 106,099.87 4.56 EUR 108,000 Greenstreet Struc Fin Prod Plc FRN EMTN Sen 07/10.01.15 102,932.61 106,099.87 4.56 EUR 108,000 Nimrod Capital Plc FRN EMTN Ser 2007-6 Tr 2 07/10.01.15 102,932.61 106,099.87 4.56 EUR 108,000 Opal Financial Prod Plc FRN EMTN Ser 2007-6 Tr 2 07/10.01.15 102,932.61 106,099.87 4.56 EUR 108,000 Profile Finance Plc FRN EMTN Ser 2007-6 Tr 2 07/10.01.15 102,932.61 106,099.87 4.56 EUR 108,000 Recolte Securities Plc FRN EMTN Ser 2007-6 Tr 2 07/10.01.15 102,932.61 106,099.87 4.56 EUR 108,000 Silverstate Fin Inv Plc FRN EMTN Ser 2007-6 Tr 2 07/10.01.15 102,932.61 106,099.87 4.56 EUR 108,000 Vespucci Strut Fin Prod Plc FRN Ser 2007-6 Tr 2 07/10.01.15 102,932.61 106,099.87 4.56 EUR 108,000 Vigado Capital Plc FRN EMTN Ser 2007-6 Tr 2 07/10.01.15 102,932.61 106,099.87 4.56 EUR 108,000 Voyce Investments Plc FRN EMTN Ser 2007-6 Tr 2 07/10.01.15 102,932.61 106,099.87 4.56 EUR 108,000 Waterford Cap Investments Plc FRN Ser 2007-6 07/10.01.15 102,932.61 106,099.87 4.56 EUR 108,000 Waves Fin Inv Plc FRN Ser 2007-6 Tr 2 07/10.01.15 102,932.61 106,099.87 4.56
TOTAL INVESTMENTS IN SECURITIES 2,058,652.16 2,121,997.40 91.17
CASH AT BANKS 207,305.14 8.91
OTHER NET ASSETS/(LIABILITIES) -1,709.42 -0.08
TOTAL 2,327,593.12 100.00

Global Partners
KBC Click SKK 2
STATEMENT OF INVESTMENTS AND OTHER NET ASSETS as at 30th September 2009
(in EUR)
The accompanying notes are an integral part of these financial statements.
39
Currency Number /
nominal value Description Cost Market value % of total
net assets
INVESTMENTS IN SECURITIES
TRANSFERABLE SECURITIES ADMITTED TO AN OFFICIAL STOCK EXCHANGE LISTING
Bonds
EUR 174,000 Amethyst Structured Fin Plc FRN Ser 2007-6 Tr 2 07/10.01.15 165,844.86 170,938.68 8.93 EUR 174,000 Beechwood Structured Fin Plc FRN Sen 2007-6 Tr 2 07/10.01.15 165,844.86 170,938.68 8.93 EUR 174,000 Brookfields Capital Plc FRN EMTN Ser 2007-6 Tr 2 07/10.01.15 165,844.86 170,938.68 8.93 EUR 174,000 Eperon Finance Plc FRN EMTN Ser 2007-6 Tr 2 07/10.01.15 165,844.86 170,938.68 8.93 EUR 87,000 Espaccio Securities Plc FRN EMTN Ser 2007-6 Tr 2 07/10.01.15 82,922.42 85,469.34 4.47 EUR 87,000 Greenstreet Struc Fin Prod Plc FRN EMTN Sen 07/10.01.15 82,922.42 85,469.34 4.47 EUR 87,000 Nimrod Capital Plc FRN EMTN Ser 2007-6 Tr 2 07/10.01.15 82,922.42 85,469.34 4.47 EUR 87,000 Opal Financial Prod Plc FRN EMTN Ser 2007-6 Tr 2 07/10.01.15 82,922.42 85,469.34 4.46 EUR 87,000 Profile Finance Plc FRN EMTN Ser 2007-6 Tr 2 07/10.01.15 82,922.42 85,469.34 4.47 EUR 87,000 Recolte Securities Plc FRN EMTN Ser 2007-6 Tr 2 07/10.01.15 82,922.42 85,469.34 4.47 EUR 87,000 Silverstate Fin Inv Plc FRN EMTN Ser 2007-6 Tr 2 07/10.01.15 82,922.42 85,469.34 4.47 EUR 87,000 Vespucci Strut Fin Prod Plc FRN Ser 2007-6 Tr 2 07/10.01.15 82,922.42 85,469.34 4.47 EUR 87,000 Vigado Capital Plc FRN EMTN Ser 2007-6 Tr 2 07/10.01.15 82,922.42 85,469.34 4.46 EUR 87,000 Voyce Investments Plc FRN EMTN Ser 2007-6 Tr 2 07/10.01.15 82,922.42 85,469.34 4.46 EUR 87,000 Waterford Cap Investments Plc FRN Ser 2007-6 07/10.01.15 82,922.42 85,469.34 4.46 EUR 87,000 Waves Fin Inv Plc FRN Ser 2007-6 Tr 2 07/10.01.15 82,922.42 85,469.34 4.47
TOTAL INVESTMENTS IN SECURITIES 1,658,448.48 1,709,386.80 89.32
CASH AT BANKS 86,705.14 4.53
OTHER NET ASSETS/(LIABILITIES) 117,757.32 6.15
TOTAL 1,913,849.26 100.00

Global Partners
CSOB World Growth Plus 20
STATEMENT OF INVESTMENTS AND OTHER NET ASSETS as at 30th September 2009
(in CZK)
The accompanying notes are an integral part of these financial statements.
40
Currency Number /
nominal value Description Cost Market value % of total
net assets
INVESTMENTS IN SECURITIES
TRANSFERABLE SECURITIES ADMITTED TO AN OFFICIAL STOCK EXCHANGE LISTING
Bonds
CZK 12,700,000 Amethyst Structured Fin Plc FRN Ser 2007-14 Tr 1 07/10.05.15 12,691,505.21 12,473,994.61 9.03 CZK 12,700,000 Beechwood Structured Fin Plc FRN Ser 2007-1 Tr 1 07/10.05.15 12,691,505.21 12,473,994.61 9.03 CZK 12,700,000 Brookfields Capital Plc FRN Ser 2007-14 Tr 1 07/10.05.15 12,691,505.21 12,473,994.61 9.03 CZK 12,700,000 Eperon Finance Plc FRN Ser 2007-14 Tr 1 07/10.05.15 12,691,505.21 12,473,994.61 9.03 CZK 6,350,000 Espaccio Securities Plc FRN Ser 2007-14 Tr 1 07/10.05.15 6,345,752.60 6,236,997.31 4.52 CZK 6,350,000 Greenstreet Struc Fin Prod Plc FRN Ser 2007-14 07/10.05.15 6,345,752.60 6,236,997.31 4.52 CZK 6,350,000 Nimrod Capital Plc FRN Ser 2007-14 Tr 1 07/10.05.15 6,345,752.60 6,236,997.31 4.52 CZK 6,350,000 Opal Financial Products Plc FRN Ser 2007-14 Tr 1 07/10.05.15 6,345,752.60 6,236,997.31 4.51 CZK 6,350,000 Profile Finance Plc FRN Ser 2007-14 Tr 1 07/10.05.15 6,345,752.60 6,236,997.31 4.52 CZK 6,350,000 Recolte Securities Plc FRN Ser 2007-14 Tr 1 07/10.05.15 6,345,752.60 6,236,997.31 4.52 CZK 6,350,000 Silverstate Fin Inv Plc FRN Ser 2007-14 Tr 1 07/10.05.15 6,345,752.60 6,236,997.31 4.52 CZK 6,350,000 Vespucci Strut Fin Prod Plc FRN Ser 2007-14 Tr 1 07/10.05.15 6,345,752.60 6,236,997.31 4.52 CZK 6,350,000 Vigado Capital Plc FRN Ser 2007-14 Tr 1 07/10.05.15 6,345,752.60 6,236,997.31 4.52 CZK 6,350,000 Voyce Investments Plc FRN Ser 2007-14 Tr 1 07/10.05.15 6,345,752.60 6,236,997.31 4.52 CZK 6,350,000 Waterford Cap Investments FRN Ser 2007-14 Tr 1 07/10.05.15 6,345,752.60 6,236,997.31 4.52 CZK 6,350,000 Waves Fin Inv Plc FRN Ser 2007-14 Tr 1 07/10.05.15 6,345,752.60 6,236,997.31 4.52
TOTAL INVESTMENTS IN SECURITIES 126,915,052.04 124,739,946.16 90.35
CASH AT BANKS 14,525,687.77 10.52
OTHER NET ASSETS/(LIABILITIES) -1,199,268.33 -0.87
TOTAL 138,066,365.60 100.00

Global Partners
KBC Kuponovy SKK 1
STATEMENT OF INVESTMENTS AND OTHER NET ASSETS as at 30th September 2009
(in EUR)
The accompanying notes are an integral part of these financial statements.
41
Currency Number /
nominal value Description Cost Market value % of total
net assets
INVESTMENTS IN SECURITIES
TRANSFERABLE SECURITIES ADMITTED TO AN OFFICIAL STOCK EXCHANGE LISTING
Bonds
EUR 528,000 Amethyst Structured Fin Plc FRN Ser 2007-6 Tr 2 07/10.01.15 503,280.02 518,710.48 9.30 EUR 528,000 Beechwood Structured Fin Plc FRN Sen 2007-6 Tr 2 07/10.01.15 503,280.02 518,710.48 9.30 EUR 528,000 Brookfields Capital Plc FRN EMTN Ser 2007-6 Tr 2 07/10.01.15 503,280.02 518,710.48 9.31 EUR 528,000 Eperon Finance Plc FRN EMTN Ser 2007-6 Tr 2 07/10.01.15 503,280.02 518,710.48 9.30 EUR 264,000 Espaccio Securities Plc FRN EMTN Ser 2007-6 Tr 2 07/10.01.15 251,640.01 259,355.24 4.65 EUR 264,000 Greenstreet Struc Fin Prod Plc FRN EMTN Sen 07/10.01.15 251,640.01 259,355.24 4.65 EUR 264,000 Nimrod Capital Plc FRN EMTN Ser 2007-6 Tr 2 07/10.01.15 251,640.01 259,355.24 4.65 EUR 264,000 Opal Financial Prod Plc FRN EMTN Ser 2007-6 Tr 2 07/10.01.15 251,640.01 259,355.24 4.65 EUR 264,000 Profile Finance Plc FRN EMTN Ser 2007-6 Tr 2 07/10.01.15 251,640.01 259,355.24 4.65 EUR 264,000 Recolte Securities Plc FRN EMTN Ser 2007-6 Tr 2 07/10.01.15 251,640.01 259,355.24 4.65 EUR 264,000 Silverstate Fin Inv Plc FRN EMTN Ser 2007-6 Tr 2 07/10.01.15 251,640.01 259,355.24 4.65 EUR 264,000 Vespucci Strut Fin Prod Plc FRN Ser 2007-6 Tr 2 07/10.01.15 251,640.01 259,355.24 4.65 EUR 264,000 Vigado Capital Plc FRN EMTN Ser 2007-6 Tr 2 07/10.01.15 251,640.01 259,355.24 4.65 EUR 264,000 Voyce Investments Plc FRN EMTN Ser 2007-6 Tr 2 07/10.01.15 251,640.01 259,355.24 4.65 EUR 264,000 Waterford Cap Investments Plc FRN Ser 2007-6 07/10.01.15 251,640.01 259,355.24 4.65 EUR 264,000 Waves Fin Inv Plc FRN Ser 2007-6 Tr 2 07/10.01.15 251,640.01 259,355.24 4.65
TOTAL INVESTMENTS IN SECURITIES 5,032,800.20 5,187,104.80 93.01
CASH AT BANKS 199,947.32 3.59
OTHER NET ASSETS/(LIABILITIES) 189,794.53 3.40
TOTAL 5,576,846.65 100.00

Global Partners
Kredyt Bank Fix Upside Click 1
STATEMENT OF INVESTMENTS AND OTHER NET ASSETS as at 30th September 2009
(in PLN)
The accompanying notes are an integral part of these financial statements.
42
Currency Number /
nominal value Description Cost Market value % of total
net assets
INVESTMENTS IN SECURITIES
TRANSFERABLE SECURITIES ADMITTED TO AN OFFICIAL STOCK EXCHANGE LISTING
Bonds
PLN 3,370,000 Amethyst Structured Fin Plc FRN Ser 2007-16 Tr 1 07/10.07.15 3,319,312.10 3,310,073.65 9.00 PLN 3,370,000 Beechwood Structured Fin Plc FRN Ser 2007-16 07/10.07.15 3,319,312.10 3,310,073.65 9.00 PLN 3,370,000 Brookfields Capital Plc FRN Ser 2007-16 Tr 1 07/10.07.15 3,319,312.10 3,310,073.65 9.01 PLN 3,370,000 Eperon Finance Plc FRN Ser 2007-16 Tr 1 07/10.07.15 3,319,312.10 3,310,073.65 9.00 PLN 1,685,000 Espaccio Securities Plc FRN Ser 2007-16 Tr 1 07/10.07.15 1,659,656.04 1,655,036.83 4.50 PLN 1,685,000 Greenstreet Struc Fin Prod Plc FRN Ser 2007-16 07/10.07.15 1,659,656.04 1,655,036.83 4.50 PLN 1,685,000 Nimrod Capital Plc FRN Ser 2007-16 Tr 1 07/10.07.15 1,659,656.04 1,655,036.83 4.50 PLN 1,685,000 Opal Financial Products Plc FRN Ser 2007-16 Tr 1 07/10.07.15 1,659,656.04 1,655,036.83 4.50 PLN 1,685,000 Profile Finance Plc FRN Ser 2007-16 Tr 1 07/10.07.15 1,659,656.04 1,655,036.83 4.50 PLN 1,685,000 Recolte Securities Plc FRN Ser 2007-16 Tr 1 07/10.07.15 1,659,656.04 1,655,036.83 4.50 PLN 1,685,000 Silverstate Fin Inv Plc FRN Ser 2007-16 Tr 1 07/10.07.15 1,659,656.04 1,655,036.83 4.50 PLN 1,685,000 Vespucci Strut Fin Prod Plc FRN Ser 2007-16 07/10.07.15 1,659,656.04 1,655,036.83 4.50 PLN 1,685,000 Vigado Capital Plc FRN Ser 2007-16 Tr 1 07/10.07.15 1,659,656.04 1,655,036.83 4.50 PLN 1,685,000 Voyce Investments Plc FRN Ser 2007-16 Tr 1 07/10.07.15 1,659,656.04 1,655,036.83 4.50 PLN 1,685,000 Waterford Cap Investments Plc FRN Ser 2007-16 07/10.07.15 1,659,656.04 1,655,036.83 4.50 PLN 1,685,000 Waves Fin Investments Plc FRN Ser 2007-16 Tr 1 07/10.07.15 1,659,656.04 1,655,036.83 4.50
TOTAL INVESTMENTS IN SECURITIES 33,193,120.88 33,100,736.56 90.01
CASH AT BANKS 980,289.25 2.67
OTHER NET ASSETS/(LIABILITIES) 2,694,466.59 7.32
TOTAL 36,775,492.40 100.00

Global Partners
KBC Rastovy Plus SKK 1
STATEMENT OF INVESTMENTS AND OTHER NET ASSETS as at 30th September 2009
(in EUR)
The accompanying notes are an integral part of these financial statements.
43
Currency Number /
nominal value Description Cost Market value % of total
net assets
INVESTMENTS IN SECURITIES
TRANSFERABLE SECURITIES ADMITTED TO AN OFFICIAL STOCK EXCHANGE LISTING
Bonds
EUR 152,000 Amethyst Structured Fin Plc FRN Ser 2006-1 Tr 1 06/23.09.14 145,554.27 149,155.41 7.80 EUR 152,000 Beechwood Structured Fin Plc FRN Ser 2006-1 Tr 1 06/23.09.14 145,554.27 149,155.41 7.80 EUR 152,000 Brookfields Capital Plc FRN EMTN Ser 2006-1 Tr 1 06/23.09.14 145,554.27 149,155.41 7.81 EUR 152,000 Eperon Finance Plc FRN EMTN Ser 2006-1 Tr 1 06/23.09.14 145,554.27 149,155.41 7.81 EUR 76,000 Espaccio Securities Plc FRN EMTN Ser 2006-1 Tr 1 06/23.09.14 72,777.13 74,577.71 3.90 EUR 76,000 Greenstreet Struc Fin Prod Plc FRN EMTN Sen 06/23.09.14 72,777.13 74,577.71 3.90 EUR 76,000 Nimrod Capital Plc FRN EMTN Ser 2006-1 Tr 1 06/23.09.14 72,777.13 74,577.71 3.90 EUR 76,000 Opal Financial Products Plc FRN Ser 2006-1 06/23.09.14 72,777.13 74,577.71 3.90 EUR 76,000 Profile Finance Plc FRN EMTN Ser 2006-1 Tr 1 06/23.09.14 72,777.13 74,577.71 3.90 EUR 76,000 Recolte Securities Plc FRN Ser 2006-1 Tr 2 07/23.09.14 72,777.13 74,577.71 3.90 EUR 76,000 Silverstate Fin Inv Plc FRN Ser 2006-1 Tr 2 07/23.09.14 72,777.13 74,577.71 3.90 EUR 76,000 Vespucci Strut Fin Prod Plc FRN Ser 2006-1Tr 2 07/23.09.14 72,777.13 74,577.71 3.90 EUR 76,000 Vigado Capital Plc FRN Ser 2006-1 Tr 2 07/23.09.14 72,777.13 74,577.71 3.90 EUR 76,000 Voyce Investments Plc FRN EMTN 07/23.09.14 72,777.13 74,577.71 3.90 EUR 76,000 Waterford Cap Investments Plc FRN Ser 2006-1 07/23.09.14 72,777.13 74,577.71 3.90 EUR 76,000 Waves Fin Inv Plc FRN Ser 2006-1 Tr 2 07/23.09.14 72,777.13 74,577.71 3.90
TOTAL INVESTMENTS IN SECURITIES 1,455,542.64 1,491,554.16 78.02
CASH AT BANKS 173,301.20 9.07
OTHER NET ASSETS/(LIABILITIES) 246,862.56 12.91
TOTAL 1,911,717.92 100.00

Global Partners
CSOB Fixovany Click 1
STATEMENT OF INVESTMENTS AND OTHER NET ASSETS as at 30th September 2009
(in CZK)
The accompanying notes are an integral part of these financial statements.
44
Currency Number /
nominal value Description Cost Market value % of total
net assets
INVESTMENTS IN SECURITIES
TRANSFERABLE SECURITIES ADMITTED TO AN OFFICIAL STOCK EXCHANGE LISTING
Bonds
CZK 14,000,000 Amethyst Structured Fin Plc FRN Ser 2007-15 Tr 1 07/10.07.15 13,791,392.13 13,748,959.00 9.08 CZK 14,000,000 Beechwood Structured Fin Plc FRN Ser 2007-15 07/10.07.15 13,791,392.13 13,748,959.00 9.08 CZK 14,000,000 Brookfields Capital Plc FRN Ser 2007-15 Tr 1 07/10.07.15 13,791,392.13 13,748,959.00 9.07 CZK 14,000,000 Eperon Finance Plc FRN Ser 2007-15 Tr 1 07/10.07.15 13,791,392.13 13,748,959.00 9.08 CZK 7,000,000 Espaccio Securities Plc FRN Ser 2007-15 Tr 1 07/10.07.15 6,895,696.06 6,874,479.50 4.54 CZK 7,000,000 Greenstreet Struc Fin Prod Plc FRN Ser 2007-15 07/10.07.15 6,895,696.06 6,874,479.50 4.54 CZK 7,000,000 Nimrod Capital Plc FRN Ser 2007-15 Tr 1 07/10.07.15 6,895,696.06 6,874,479.50 4.54 CZK 7,000,000 Opal Financial Products Plc FRN Ser 2007-15 Tr 1 07/10.07.15 6,895,696.06 6,874,479.50 4.54 CZK 7,000,000 Profile Finance Plc FRN Ser 2007-15 Tr 1 07/10.07.15 6,895,696.06 6,874,479.50 4.54 CZK 7,000,000 Recolte Securities Plc FRN Ser 2007-15 Tr 1 07/10.07.15 6,895,696.06 6,874,479.50 4.54 CZK 7,000,000 Silverstate Fin Inv Plc FRN Ser 2007-15 Tr 1 07/10.07.15 6,895,696.06 6,874,479.50 4.54 CZK 7,000,000 Vespucci Strut Fin Prod Plc FRN Ser 2007-15 Tr 1 07/10.07.15 6,895,696.06 6,874,479.50 4.54 CZK 7,000,000 Vigado Capital Plc FRN Ser 2007-15 Tr 1 07/10.07.15 6,895,696.06 6,874,479.50 4.54 CZK 7,000,000 Voyce Investments Plc FRN Ser 2007-15 Tr 1 07/10.07.15 6,895,696.06 6,874,479.50 4.54 CZK 7,000,000 Waterford Cap Investments Plc FRN Ser 2007-15 07/10.07.15 6,895,696.06 6,874,479.50 4.54 CZK 7,000,000 Waves Fin Inv Plc FRN Ser 2007-15 Tr 1 07/10.07.15 6,895,696.06 6,874,479.50 4.54
TOTAL INVESTMENTS IN SECURITIES 137,913,921.24 137,489,590.00 90.79
CASH AT BANKS 9,070,318.81 5.99
OTHER NET ASSETS/(LIABILITIES) 4,878,598.18 3.22
TOTAL 151,438,506.99 100.00

Global Partners
CSOB World Growth Plus 21
STATEMENT OF INVESTMENTS AND OTHER NET ASSETS as at 30th September 2009
(in CZK)
The accompanying notes are an integral part of these financial statements.
45
Currency Number /
nominal value Description Cost Market value % of total
net assets
INVESTMENTS IN SECURITIES
TRANSFERABLE SECURITIES ADMITTED TO AN OFFICIAL STOCK EXCHANGE LISTING
Bonds
CZK 7,300,000 Amethyst Structured Fin Plc FRN Ser 2007-15 Tr 1 07/10.07.15 7,023,826.54 7,169,100.05 8.71 CZK 7,300,000 Beechwood Structured Fin Plc FRN Ser 2007-15 07/10.07.15 7,023,826.54 7,169,100.05 8.71 CZK 7,300,000 Brookfields Capital Plc FRN Ser 2007-15 Tr 1 07/10.07.15 7,023,826.54 7,169,100.05 8.71 CZK 7,300,000 Eperon Finance Plc FRN Ser 2007-15 Tr 1 07/10.07.15 7,023,826.54 7,169,100.05 8.71 CZK 3,650,000 Espaccio Securities Plc FRN Ser 2007-15 Tr 1 07/10.07.15 3,511,913.27 3,584,550.02 4.36 CZK 3,650,000 Greenstreet Struc Fin Prod Plc FRN Ser 2007-15 07/10.07.15 3,511,913.27 3,584,550.02 4.36 CZK 3,650,000 Nimrod Capital Plc FRN Ser 2007-15 Tr 1 07/10.07.15 3,511,913.27 3,584,550.02 4.36 CZK 3,650,000 Opal Financial Products Plc FRN Ser 2007-15 Tr 1 07/10.07.15 3,511,913.27 3,584,550.02 4.35 CZK 3,650,000 Profile Finance Plc FRN Ser 2007-15 Tr 1 07/10.07.15 3,511,913.27 3,584,550.02 4.36 CZK 3,650,000 Recolte Securities Plc FRN Ser 2007-15 Tr 1 07/10.07.15 3,511,913.27 3,584,550.02 4.36 CZK 3,650,000 Silverstate Fin Inv Plc FRN Ser 2007-15 Tr 1 07/10.07.15 3,511,913.27 3,584,550.02 4.36 CZK 3,650,000 Vespucci Strut Fin Prod Plc FRN Ser 2007-15 Tr 1 07/10.07.15 3,511,913.27 3,584,550.02 4.36 CZK 3,650,000 Vigado Capital Plc FRN Ser 2007-15 Tr 1 07/10.07.15 3,511,913.27 3,584,550.02 4.35 CZK 3,650,000 Voyce Investments Plc FRN Ser 2007-15 Tr 1 07/10.07.15 3,511,913.27 3,584,550.02 4.35 CZK 3,650,000 Waterford Cap Investments Plc FRN Ser 2007-15 07/10.07.15 3,511,913.27 3,584,550.02 4.35 CZK 3,650,000 Waves Fin Inv Plc FRN Ser 2007-15 Tr 1 07/10.07.15 3,511,913.27 3,584,550.02 4.36
TOTAL INVESTMENTS IN SECURITIES 70,238,265.40 71,691,000.44 87.12
CASH AT BANKS 6,285,186.12 7.64
OTHER NET ASSETS/(LIABILITIES) 4,317,541.34 5.24
TOTAL 82,293,727.90 100.00

Global Partners
PS Fixovany Click 1
STATEMENT OF INVESTMENTS AND OTHER NET ASSETS as at 30th September 2009
(in CZK)
The accompanying notes are an integral part of these financial statements.
46
Currency Number /
nominal value Description Cost Market value % of total
net assets
INVESTMENTS IN SECURITIES
TRANSFERABLE SECURITIES ADMITTED TO AN OFFICIAL STOCK EXCHANGE LISTING
Bonds
CZK 13,900,000 Amethyst Structured Fin Plc FRN Ser 2007-15 Tr 1 07/10.07.15 13,220,904.41 13,650,752.15 9.29 CZK 13,900,000 Beechwood Structured Fin Plc FRN Ser 2007-15 07/10.07.15 13,220,904.41 13,650,752.15 9.29 CZK 13,900,000 Brookfields Capital Plc FRN Ser 2007-15 Tr 1 07/10.07.15 13,220,904.41 13,650,752.15 9.29 CZK 13,900,000 Eperon Finance Plc FRN Ser 2007-15 Tr 1 07/10.07.15 13,220,904.41 13,650,752.15 9.29 CZK 6,950,000 Espaccio Securities Plc FRN Ser 2007-15 Tr 1 07/10.07.15 6,610,452.20 6,825,376.07 4.64 CZK 6,950,000 Greenstreet Struc Fin Prod Plc FRN Ser 2007-15 07/10.07.15 6,610,452.20 6,825,376.07 4.64 CZK 6,950,000 Nimrod Capital Plc FRN Ser 2007-15 Tr 1 07/10.07.15 6,610,452.20 6,825,376.07 4.64 CZK 6,950,000 Opal Financial Products Plc FRN Ser 2007-15 Tr 1 07/10.07.15 6,610,452.20 6,825,376.07 4.65 CZK 6,950,000 Profile Finance Plc FRN Ser 2007-15 Tr 1 07/10.07.15 6,610,452.20 6,825,376.07 4.64 CZK 6,950,000 Recolte Securities Plc FRN Ser 2007-15 Tr 1 07/10.07.15 6,610,452.20 6,825,376.07 4.64 CZK 6,950,000 Silverstate Fin Inv Plc FRN Ser 2007-15 Tr 1 07/10.07.15 6,610,452.20 6,825,376.07 4.64 CZK 6,950,000 Vespucci Strut Fin Prod Plc FRN Ser 2007-15 Tr 1 07/10.07.15 6,610,452.20 6,825,376.07 4.64 CZK 6,950,000 Vigado Capital Plc FRN Ser 2007-15 Tr 1 07/10.07.15 6,610,452.20 6,825,376.07 4.64 CZK 6,950,000 Voyce Investments Plc FRN Ser 2007-15 Tr 1 07/10.07.15 6,610,452.20 6,825,376.07 4.64 CZK 6,950,000 Waterford Cap Investments Plc FRN Ser 2007-15 07/10.07.15 6,610,452.20 6,825,376.07 4.65 CZK 6,950,000 Waves Fin Inv Plc FRN Ser 2007-15 Tr 1 07/10.07.15 6,610,452.20 6,825,376.07 4.64
TOTAL INVESTMENTS IN SECURITIES 132,209,044.04 136,507,521.44 92.86
CASH AT BANKS 6,353,570.48 4.32
OTHER NET ASSETS/(LIABILITIES) 4,135,962.56 2.82
TOTAL 146,997,054.48 100.00

Global Partners
KBC Rastovy SKK 2
STATEMENT OF INVESTMENTS AND OTHER NET ASSETS as at 30th September 2009
(in EUR)
The accompanying notes are an integral part of these financial statements.
47
Currency Number /
nominal value Description Cost Market value % of total
net assets
INVESTMENTS IN SECURITIES
TRANSFERABLE SECURITIES ADMITTED TO AN OFFICIAL STOCK EXCHANGE LISTING
Bonds
EUR 140,000 Amethyst Structured Fin Plc FRN Ser 2007-6 Tr 2 07/10.01.15 133,431.16 137,536.87 7.31 EUR 140,000 Beechwood Structured Fin Plc FRN Sen 2007-6 Tr 2 07/10.01.15 133,431.16 137,536.87 7.31 EUR 140,000 Brookfields Capital Plc FRN EMTN Ser 2007-6 Tr 2 07/10.01.15 133,431.16 137,536.87 7.31 EUR 140,000 Eperon Finance Plc FRN EMTN Ser 2007-6 Tr 2 07/10.01.15 133,431.16 137,536.87 7.31 EUR 70,000 Espaccio Securities Plc FRN EMTN Ser 2007-6 Tr 2 07/10.01.15 66,715.58 68,768.43 3.65 EUR 70,000 Greenstreet Struc Fin Prod Plc FRN EMTN Sen 07/10.01.15 66,715.58 68,768.43 3.66 EUR 70,000 Nimrod Capital Plc FRN EMTN Ser 2007-6 Tr 2 07/10.01.15 66,715.58 68,768.43 3.66 EUR 70,000 Opal Financial Prod Plc FRN EMTN Ser 2007-6 Tr 2 07/10.01.15 66,715.58 68,768.43 3.65 EUR 70,000 Profile Finance Plc FRN EMTN Ser 2007-6 Tr 2 07/10.01.15 66,715.58 68,768.43 3.66 EUR 70,000 Recolte Securities Plc FRN EMTN Ser 2007-6 Tr 2 07/10.01.15 66,715.58 68,768.43 3.66 EUR 70,000 Silverstate Fin Inv Plc FRN EMTN Ser 2007-6 Tr 2 07/10.01.15 66,715.58 68,768.43 3.66 EUR 70,000 Vespucci Strut Fin Prod Plc FRN Ser 2007-6 Tr 2 07/10.01.15 66,715.58 68,768.43 3.66 EUR 70,000 Vigado Capital Plc FRN EMTN Ser 2007-6 Tr 2 07/10.01.15 66,715.58 68,768.43 3.65 EUR 70,000 Voyce Investments Plc FRN EMTN Ser 2007-6 Tr 2 07/10.01.15 66,715.58 68,768.43 3.65 EUR 70,000 Waterford Cap Investments Plc FRN Ser 2007-6 07/10.01.15 66,715.58 68,768.43 3.65 EUR 70,000 Waves Fin Inv Plc FRN Ser 2007-6 Tr 2 07/10.01.15 66,715.58 68,768.43 3.66
TOTAL INVESTMENTS IN SECURITIES 1,334,311.60 1,375,368.64 73.11
CASH AT BANKS 195,233.96 10.38
OTHER NET ASSETS/(LIABILITIES) 310,633.96 16.51
TOTAL 1,881,236.56 100.00

Global Partners
CSOB Fixovany Click 2
STATEMENT OF INVESTMENTS AND OTHER NET ASSETS as at 30th September 2009
(in CZK)
The accompanying notes are an integral part of these financial statements.
48
Currency Number /
nominal value Description Cost Market value % of total
net assets
INVESTMENTS IN SECURITIES
TRANSFERABLE SECURITIES ADMITTED TO AN OFFICIAL STOCK EXCHANGE LISTING
Bonds
CZK 19,300,000 Amethyst Structured Fin Plc FRN Ser 2007-15 Tr 1 07/10.07.15 18,558,659.76 18,953,922.05 9.12 CZK 19,300,000 Beechwood Structured Fin Plc FRN Ser 2007-15 07/10.07.15 18,558,659.76 18,953,922.05 9.12 CZK 19,300,000 Brookfields Capital Plc FRN Ser 2007-15 Tr 1 07/10.07.15 18,558,659.76 18,953,922.05 9.13 CZK 19,300,000 Eperon Finance Plc FRN Ser 2007-15 Tr 1 07/10.07.15 18,558,659.76 18,953,922.05 9.12 CZK 9,650,000 Espaccio Securities Plc FRN Ser 2007-15 Tr 1 07/10.07.15 9,279,329.87 9,476,961.02 4.56 CZK 9,650,000 Greenstreet Struc Fin Prod Plc FRN Ser 2007-15 07/10.07.15 9,279,329.87 9,476,961.02 4.56 CZK 9,650,000 Nimrod Capital Plc FRN Ser 2007-15 Tr 1 07/10.07.15 9,279,329.87 9,476,961.02 4.56 CZK 9,650,000 Opal Financial Products Plc FRN Ser 2007-15 Tr 1 07/10.07.15 9,279,329.87 9,476,961.02 4.56 CZK 9,650,000 Profile Finance Plc FRN Ser 2007-15 Tr 1 07/10.07.15 9,279,329.87 9,476,961.02 4.56 CZK 9,650,000 Recolte Securities Plc FRN Ser 2007-15 Tr 1 07/10.07.15 9,279,329.87 9,476,961.02 4.56 CZK 9,650,000 Silverstate Fin Inv Plc FRN Ser 2007-15 Tr 1 07/10.07.15 9,279,329.87 9,476,961.02 4.56 CZK 9,650,000 Vespucci Strut Fin Prod Plc FRN Ser 2007-15 Tr 1 07/10.07.15 9,279,329.87 9,476,961.02 4.56 CZK 9,650,000 Vigado Capital Plc FRN Ser 2007-15 Tr 1 07/10.07.15 9,279,329.87 9,476,961.02 4.56 CZK 9,650,000 Voyce Investments Plc FRN Ser 2007-15 Tr 1 07/10.07.15 9,279,329.87 9,476,961.02 4.56 CZK 9,650,000 Waterford Cap Investments Plc FRN Ser 2007-15 07/10.07.15 9,279,329.87 9,476,961.02 4.56 CZK 9,650,000 Waves Fin Inv Plc FRN Ser 2007-15 Tr 1 07/10.07.15 9,279,329.87 9,476,961.02 4.56
TOTAL INVESTMENTS IN SECURITIES 185,586,597.48 189,539,220.44 91.21
CASH AT BANKS 13,173,920.57 6.34
OTHER NET ASSETS/(LIABILITIES) 5,094,449.09 2.45
TOTAL 207,807,590.10 100.00

Global Partners
Kredyt Bank Super Fix Upside Click 1
STATEMENT OF INVESTMENTS AND OTHER NET ASSETS as at 30th September 2009
(in PLN)
The accompanying notes are an integral part of these financial statements.
49
Currency Number / nominal
value Description Cost Market value % of total
net assets
INVESTMENTS IN SECURITIES
TRANSFERABLE SECURITIES ADMITTED TO AN OFFICIAL STOCK EXCHANGE LISTING
Bonds
EUR 450,000 Greece 3.9% Ser 5YR 06/20.08.11 1,863,436.75 1,988,035.60 22.47 EUR 450,000 Ireland 4% T-Bonds 08/11.11.11 1,965,639.53 1,998,860.05 22.59 EUR 450,000 Italia 3.75% BTP 06/15.09.11 1,878,038.03 1,990,194.25 22.49 EUR 450,000 Poland 5.5% 01/14.02.11 1,862,067.71 2,004,490.91 22.66
TOTAL INVESTMENTS IN SECURITIES 7,569,182.02 7,981,580.81 90.21
CASH AT BANKS 905,217.06 10.23
OTHER NET ASSETS/(LIABILITIES) -39,243.43 -0.44
TOTAL 8,847,554.44 100.00

Global Partners
CSOB World Tree 14
STATEMENT OF INVESTMENTS AND OTHER NET ASSETS as at 30th September 2009
(in CZK)
The accompanying notes are an integral part of these financial statements.
50
Currency Number / nominal
value Description Cost Market value % of total
net assets
INVESTMENTS IN SECURITIES
TRANSFERABLE SECURITIES ADMITTED TO AN OFFICIAL STOCK EXCHANGE LISTING
Bonds
EUR 450,000 Greece 5.5% 09/20.08.14 12,397,171.20 12,457,936.83 20.46 EUR 500,000 Italia 4.25% BTP 04/01.08.14 13,766,124.57 13,468,307.03 22.11 EUR 500,000 Portugal 4.375% Ser Jun 03/16.06.14 13,764,908.85 13,544,161.69 22.24
Total bonds 39,928,204.62 39,470,405.55 64.81
TRANSFERABLE SECURITIES DEALT IN ON ANOTHER REGULATED MARKET
Bonds
EUR 500,000 Belgium 4% OLO Ser 54 08/28.03.14 13,769,042.32 13,432,557.10 22.06
Total bonds 13,769,042.32 13,432,557.10 22.06
TOTAL INVESTMENTS IN SECURITIES 53,697,246.94 52,902,962.65 86.87
CASH AT BANKS 8,359,998.86 13.73
OTHER NET ASSETS/(LIABILITIES) -364,710.89 -0.60
TOTAL 60,898,250.62 100.00

Global Partners
CSOB World Growth Plus 22
STATEMENT OF INVESTMENTS AND OTHER NET ASSETS as at 30th September 2009
(in CZK)
The accompanying notes are an integral part of these financial statements.
51
Currency Number / nominal
value Description Cost Market value % of total
net assets
INVESTMENTS IN SECURITIES
TRANSFERABLE SECURITIES ADMITTED TO AN OFFICIAL STOCK EXCHANGE LISTING
Bonds
EUR 450,000 Greece 5.25% 02/18.05.12 12,025,563.16 12,266,376.46 20.19 EUR 400,000 Ireland 3.9% T-Bond 09/05.03.12 10,421,222.17 10,574,079.41 17.41 EUR 450,000 Italia 4.25% BTP 07/15.10.12 12,024,442.75 12,085,040.26 19.89 EUR 450,000 Poland 5.5% 02/12.03.12 12,021,342.11 12,219,411.63 20.12
TOTAL INVESTMENTS IN SECURITIES 46,492,570.19 47,144,907.76 77.61
CASH AT BANKS 9,657,384.43 15.90
OTHER NET ASSETS/(LIABILITIES) 3,942,380.74 6.49
TOTAL 60,744,672.93 100.00

Global Partners
KBC Kuponovy 3
STATEMENT OF INVESTMENTS AND OTHER NET ASSETS as at 30th September 2009
(in EUR)
The accompanying notes are an integral part of these financial statements.
52
Currency Number /
nominal value Description Cost Market value % of total
net assets
INVESTMENTS IN SECURITIES
TRANSFERABLE SECURITIES ADMITTED TO AN OFFICIAL STOCK EXCHANGE LISTING
Bonds
EUR 478,000 Amethyst Structured Fin Plc FRN Ser 2007-6 Tr 2 07/10.01.15 455,644.02 469,590.16 8.73 EUR 478,000 Beechwood Structured Fin Plc FRN Sen 2007-6 Tr 2 07/10.01.15 455,644.02 469,590.16 8.73 EUR 478,000 Brookfields Capital Plc FRN EMTN Ser 2007-6 Tr 2 07/10.01.15 455,644.02 469,590.16 8.73 EUR 478,000 Eperon Finance Plc FRN EMTN Ser 2007-6 Tr 2 07/10.01.15 455,644.02 469,590.16 8.73 EUR 239,000 Espaccio Securities Plc FRN EMTN Ser 2007-6 Tr 2 07/10.01.15 227,822.01 234,795.09 4.37 EUR 239,000 Greenstreet Struc Fin Prod Plc FRN EMTN Sen 07/10.01.15 227,822.01 234,795.09 4.37 EUR 239,000 Nimrod Capital Plc FRN EMTN Ser 2007-6 Tr 2 07/10.01.15 227,822.01 234,795.09 4.37 EUR 239,000 Opal Financial Prod Plc FRN EMTN Ser 2007-6 Tr 2 07/10.01.15 227,822.01 234,795.09 4.37 EUR 239,000 Profile Finance Plc FRN EMTN Ser 2007-6 Tr 2 07/10.01.15 227,822.01 234,795.09 4.37 EUR 239,000 Recolte Securities Plc FRN EMTN Ser 2007-6 Tr 2 07/10.01.15 227,822.01 234,795.09 4.37 EUR 239,000 Silverstate Fin Inv Plc FRN EMTN Ser 2007-6 Tr 2 07/10.01.15 227,822.01 234,795.09 4.37 EUR 239,000 Vespucci Strut Fin Prod Plc FRN Ser 2007-6 Tr 2 07/10.01.15 227,822.01 234,795.09 4.37 EUR 239,000 Vigado Capital Plc FRN EMTN Ser 2007-6 Tr 2 07/10.01.15 227,822.01 234,795.09 4.37 EUR 239,000 Voyce Investments Plc FRN EMTN Ser 2007-6 Tr 2 07/10.01.15 227,822.01 234,795.09 4.37 EUR 239,000 Waterford Cap Investments Plc FRN Ser 2007-6 07/10.01.15 227,822.01 234,795.09 4.37 EUR 239,000 Waves Fin Inv Plc FRN Ser 2007-6 Tr 2 07/10.01.15 227,822.01 234,795.09 4.37
TOTAL INVESTMENTS IN SECURITIES 4,556,440.20 4,695,901.72 87.36
CASH AT BANKS 347,352.58 6.46
OTHER NET ASSETS/(LIABILITIES) 332,373.80 6.18
TOTAL 5,375,628.10 100.00

Global Partners
CSOB Fixovany Click 3
STATEMENT OF INVESTMENTS AND OTHER NET ASSETS as at 30th September 2009
(in CZK)
The accompanying notes are an integral part of these financial statements.
53
Currency Number / nominal
value Description Cost Market value % of total
net assets
INVESTMENTS IN SECURITIES
TRANSFERABLE SECURITIES ADMITTED TO AN OFFICIAL STOCK EXCHANGE LISTING
Bonds
EUR 1,000,000 Greece 5.25% 02/18.05.12 26,723,473.68 27,258,614.07 22.11 EUR 1,000,000 Italia 4% 07/15.04.12 26,723,415.79 26,656,129.03 21.62 EUR 1,000,000 Poland 5.5% 02/12.03.12 26,714,093.55 27,154,248.07 22.02 EUR 750,000 Portugal 5% Sen 02/15.06.12 20,298,182.28 20,521,019.74 16.64
TOTAL INVESTMENTS IN SECURITIES 100,459,165.30 101,590,010.91 82.39
CASH AT BANKS 19,880,897.93 16.12
OTHER NET ASSETS/(LIABILITIES) 1,829,597.23 1.49
TOTAL 123,300,506.07 100.00

Global Partners
CSOB Fixovany Click 4
STATEMENT OF INVESTMENTS AND OTHER NET ASSETS as at 30th September 2009
(in CZK)
The accompanying notes are an integral part of these financial statements.
54
Currency Number / nominal
value Description Cost Market value % of total
net assets
INVESTMENTS IN SECURITIES
TRANSFERABLE SECURITIES ADMITTED TO AN OFFICIAL STOCK EXCHANGE LISTING
Bonds
EUR 900,000 Belgium 4.25% OLO Ser 41 03/28.09.13 25,157,636.39 24,425,584.14 19.63 EUR 1,000,000 Greece 4% Ser 5Y 08/20.08.13 27,939,011.19 26,241,062.73 21.09 EUR 1,000,000 Italia 4.25% BTP 03/01.08.13 27,950,082.43 26,946,635.17 21.65 EUR 900,000 Portugal 5.45% Ser Sept 98/23.09.13 25,161,864.00 25,288,419.31 20.32
TOTAL INVESTMENTS IN SECURITIES 106,208,594.01 102,901,701.35 82.69
CASH AT BANKS 16,398,926.11 13.18
BANK LIABILITIES -1,498.36 0.00
OTHER NET ASSETS/(LIABILITIES) 5,140,154.51 4.13
TOTAL 124,439,283.61 100.00

Global Partners
KBC Kuponovy 2
STATEMENT OF INVESTMENTS AND OTHER NET ASSETS as at 30th September 2009
(in EUR)
The accompanying notes are an integral part of these financial statements.
55
Currency Number / nominal
value Description Cost Market value % of total
net assets
INVESTMENTS IN SECURITIES
TRANSFERABLE SECURITIES ADMITTED TO AN OFFICIAL STOCK EXCHANGE LISTING
Bonds
EUR 600,000 Belgium 5% OLO Ser 38 02/28.09.12 600,000.00 653,246.16 24.97 EUR 500,000 Greece 4.1% Ser 5Y 07/20.08.12 500,000.00 523,478.90 20.01 EUR 550,000 Italia 4% 07/15.04.12 550,000.00 579,054.30 22.13 EUR 500,000 Portugal 5% Sen 02/15.06.12 500,000.00 540,340.10 20.66
TOTAL INVESTMENTS IN SECURITIES 2,150,000.00 2,296,119.46 87.77
CASH AT BANKS 311,811.35 11.92
OTHER NET ASSETS/(LIABILITIES) 8,118.33 0.31
TOTAL 2,616,049.14 100.00

Global Partners
KBC Fixny Click 1
STATEMENT OF INVESTMENTS AND OTHER NET ASSETS as at 30th September 2009
(in EUR)
The accompanying notes are an integral part of these financial statements.
56
Currency Number / nominal
value Description Cost Market value % of total
net assets
INVESTMENTS IN SECURITIES
TRANSFERABLE SECURITIES ADMITTED TO AN OFFICIAL STOCK EXCHANGE LISTING
Bonds
EUR 350,000 Belgium 4% Ser 50 07/28.03.13 350,000.00 371,004.58 23.80 EUR 300,000 Espana 6.15% Bon del T 97/31.01.13 300,000.00 338,291.97 21.70 EUR 250,000 France 4% OAT 03/25.04.13 250,000.00 266,095.00 17.07 EUR 400,000 Ireland 5% 02/18.04.13 400,000.00 429,927.80 27.57
TOTAL INVESTMENTS IN SECURITIES 1,300,000.00 1,405,319.35 90.14
CASH AT BANKS 208,290.19 13.36
OTHER NET ASSETS/(LIABILITIES) -54,493.58 -3.50
TOTAL 1,559,115.96 100.00

Global Partners
CSOB Fixovany Click 5
STATEMENT OF INVESTMENTS AND OTHER NET ASSETS as at 30th September 2009
(in CZK)
The accompanying notes are an integral part of these financial statements.
57
Currency Number / nominal
value Description Cost Market value % of total
net assets
INVESTMENTS IN SECURITIES
TRANSFERABLE SECURITIES ADMITTED TO AN OFFICIAL STOCK EXCHANGE LISTING
Bonds
EUR 450,000 Belgium 4.25% OLO Ser 43 04/28.09.14 11,949,694.10 12,225,381.77 20.98 EUR 400,000 Flemmish Community 3.75% 09/31.03.14 10,625,735.89 10,445,359.41 17.92 EUR 450,000 Ireland 4% T-Bonds 09/15.01.14 11,955,355.17 11,786,412.65 20.23
Total bonds 34,530,785.16 34,457,153.83 59.13
TRANSFERABLE SECURITIES DEALT IN ON ANOTHER REGULATED MARKET
Bonds
EUR 450,000 Oesterreich 3.4% 09/20.10.14 11,954,264.50 11,771,081.71 20.20
Total bonds 11,954,264.50 11,771,081.71 20.20
TOTAL INVESTMENTS IN SECURITIES 46,485,049.66 46,228,235.54 79.33
CASH AT BANKS 9,917,565.14 17.02
OTHER NET ASSETS/(LIABILITIES) 2,129,263.39 3.65
TOTAL 58,275,064.07 100.00

Global Partners
CSOB Fixovany Click 6
STATEMENT OF INVESTMENTS AND OTHER NET ASSETS as at 30th September 2009
(in CZK)
The accompanying notes are an integral part of these financial statements.
58
Currency Number / nominal
value Description Cost Market value % of total
net assets
INVESTMENTS IN SECURITIES
TRANSFERABLE SECURITIES ADMITTED TO AN OFFICIAL STOCK EXCHANGE LISTING
Bonds
EUR 1,000,000 Belgium 4.25% OLO Ser 41 03/28.09.13 26,631,223.71 27,139,537.93 22.43 EUR 800,000 Espana 4.2% 03/30.07.13 21,178,080.88 21,640,555.85 17.88 EUR 1,200,000 Ireland 5% 02/18.04.13 31,776,552.87 32,655,569.61 26.99 EUR 1,000,000 Oesterreich 3.8% EMTN 03/20.10.13 26,480,844.12 26,674,459.73 22.05
TOTAL INVESTMENTS IN SECURITIES 106,066,701.58 108,110,123.12 89.35
CASH AT BANKS 15,429,741.92 12.75
OTHER NET ASSETS/(LIABILITIES) -2,541,651.90 -2.10
TOTAL 120,998,213.14 100.00

Global Partners
KBC Reverzny 3
STATEMENT OF INVESTMENTS AND OTHER NET ASSETS as at 30th September 2009
(in EUR)
The accompanying notes are an integral part of these financial statements.
59
Currency Number / nominal
value Description Cost Market value % of total
net assets
INVESTMENTS IN SECURITIES
TRANSFERABLE SECURITIES ADMITTED TO AN OFFICIAL STOCK EXCHANGE LISTING
Bonds
EUR 1,200,000 Belgium 5% OLO Ser 36 01/28.09.11 1,200,000.00 1,284,212.04 22.74 EUR 1,300,000 Espana 5.35% 01/31.10.11 1,300,000.00 1,403,838.28 24.85 EUR 1,500,000 Ireland 4% T-Bonds 08/11.11.11 1,500,000.00 1,570,800.00 27.81
Total bonds 4,000,000.00 4,258,850.32 75.40
TRANSFERABLE SECURITIES DEALT IN ON ANOTHER REGULATED MARKET
Bonds
EUR 800,000 France 3.5% BTAN 06/12.07.11 800,000.00 832,448.00 14.74
Total bonds 800,000.00 832,448.00 14.74
TOTAL INVESTMENTS IN SECURITIES 4,800,000.00 5,091,298.32 90.14
CASH AT BANKS 879,435.77 15.57
OTHER NET ASSETS/(LIABILITIES) -322,413.02 -5.71
TOTAL 5,648,321.07 100.00

Global Partners
CSOB Fixovany Click 7
STATEMENT OF INVESTMENTS AND OTHER NET ASSETS as at 30th September 2009
(in CZK)
The accompanying notes are an integral part of these financial statements.
60
Currency Number / nominal
value Description Cost Market value % of total
net assets
INVESTMENTS IN SECURITIES
TRANSFERABLE SECURITIES ADMITTED TO AN OFFICIAL STOCK EXCHANGE LISTING
Bonds
EUR 600,000 Belgium 4.25% OLO Ser 41 03/28.09.13 15,537,210.23 16,283,722.77 21.07 EUR 650,000 Espana 4.25% 08/31.01.14 16,831,977.74 17,594,965.33 22.77 EUR 650,000 Ireland 4% T-Bonds 09/15.01.14 16,831,977.75 17,024,818.27 22.03 EUR 650,000 Oesterreich 3.8% EMTN 03/20.10.13 16,831,977.75 17,338,398.82 22.44
TOTAL INVESTMENTS IN SECURITIES 66,033,143.47 68,241,905.19 88.31
CASH AT BANKS 11,775,251.27 15.24
OTHER NET ASSETS/(LIABILITIES) -2,743,221.56 -3.55
TOTAL 77,273,934.90 100.00

Global Partners
CSOB Variable Growth 2
STATEMENT OF INVESTMENTS AND OTHER NET ASSETS as at 30th September 2009
(in CZK)
The accompanying notes are an integral part of these financial statements.
61
Currency Number / nominal
value Description Cost Market value % of total
net assets
INVESTMENTS IN SECURITIES
TRANSFERABLE SECURITIES ADMITTED TO AN OFFICIAL STOCK EXCHANGE LISTING
Bonds
EUR 450,000 Belgium 4.25% OLO Ser 43 04/28.09.14 11,635,887.63 12,225,381.77 23.85 EUR 400,000 Espana 4.75% 98/30.07.14 10,343,011.22 11,092,504.01 21.64 EUR 450,000 Ireland 4% T-Bonds 09/15.01.14 11,635,887.63 11,786,412.65 22.99
Total bonds 33,614,786.48 35,104,298.43 68.48
TRANSFERABLE SECURITIES DEALT IN ON ANOTHER REGULATED MARKET
Bonds
EUR 450,000 Oesterreich 3.4% 09/20.10.14 11,635,887.64 11,771,081.71 22.97
Total bonds 11,635,887.64 11,771,081.71 22.97
TOTAL INVESTMENTS IN SECURITIES 45,250,674.12 46,875,380.14 91.45
CASH AT BANKS 7,888,760.99 15.39
OTHER NET ASSETS/(LIABILITIES) -3,505,841.53 -6.84
TOTAL 51,258,299.60 100.00

Global Partners
KBC Reverzny 4
STATEMENT OF INVESTMENTS AND OTHER NET ASSETS as at 30th September 2009
(in EUR)
The accompanying notes are an integral part of these financial statements.
62
Currency Number / nominal
value Description Cost Market value % of total
net assets
INVESTMENTS IN SECURITIES
TRANSFERABLE SECURITIES ADMITTED TO AN OFFICIAL STOCK EXCHANGE LISTING
Bonds
EUR 600,000 Espana 2.75% Ser 3Y 09/30.04.12 600,000.00 616,176.00 21.17 EUR 700,000 Ireland 3.9% T-Bond 09/05.03.12 700,000.00 730,870.00 25.11 EUR 600,000 Netherlands 2.5% 09/15.01.12 600,000.00 613,488.00 21.08
Total bonds 1,900,000.00 1,960,534.00 67.36
TRANSFERABLE SECURITIES DEALT IN ON ANOTHER REGULATED MARKET
Bonds
EUR 600,000 Belgium 2 % OLO Ser 57 09/28.03.12 600,000.00 605,040.00 20.79
Total bonds 600,000.00 605,040.00 20.79
TOTAL INVESTMENTS IN SECURITIES 2,500,000.00 2,565,574.00 88.15
CASH AT BANKS 450,835.51 15.49
OTHER NET ASSETS/(LIABILITIES) -105,836.61 -3.64
TOTAL 2,910,572.90 100.00

Global Partners
CSOB Svetoveho Rustu Plus 23
STATEMENT OF INVESTMENTS AND OTHER NET ASSETS as at 30th September 2009
(in CZK)
The accompanying notes are an integral part of these financial statements.
63
Currency Number / nominal
value Description Cost Market value % of total
net assets
INVESTMENTS IN SECURITIES
TRANSFERABLE SECURITIES ADMITTED TO AN OFFICIAL STOCK EXCHANGE LISTING
Bonds
EUR 450,000 Belgium 4% Ser 50 07/28.03.13 11,537,198.21 12,077,143.63 22.12 EUR 500,000 Espana 4.2% 03/30.07.13 12,859,184.45 13,525,347.40 24.77 EUR 500,000 Ireland 5% 02/18.04.13 12,859,491.60 13,606,487.33 24.92 EUR 450,000 Netherlands 4.25% 03/15.07.13 11,573,553.49 12,230,794.64 22.40
TOTAL INVESTMENTS IN SECURITIES 48,829,427.75 51,439,773.00 94.21
CASH AT BANKS 7,774,926.21 14.24
OTHER NET ASSETS/(LIABILITIES) -4,611,775.71 -8.45
TOTAL 54,602,923.50 100.00

Global Partners
CSOB Fixovany Click 8
STATEMENT OF INVESTMENTS AND OTHER NET ASSETS as at 30th September 2009
(in CZK)
The accompanying notes are an integral part of these financial statements.
64
Currency Number / nominal
value Description Cost Market value % of total
net assets
INVESTMENTS IN SECURITIES
TRANSFERABLE SECURITIES ADMITTED TO AN OFFICIAL STOCK EXCHANGE LISTING
Bonds
EUR 2,000,000 Belgium 8% OLO Ser 12 92/24.12.12 51,139,009.32 59,833,364.02 25.29 EUR 2,000,000 Espana 6.15% Bon del T 97/31.01.13 51,131,776.21 57,100,631.38 24.13 EUR 2,000,000 Flemmish Community 2.625% EMTN 09/20.01.13 50,970,704.26 51,022,135.87 21.56 EUR 2,000,000 France 3.75% BTAN Ser 5YR 08/12.01.13 51,122,153.83 53,435,352.25 22.58
TOTAL INVESTMENTS IN SECURITIES 204,363,643.62 221,391,483.52 93.56
CASH AT BANKS 41,880,371.10 17.70
OTHER NET ASSETS/(LIABILITIES) -26,643,373.77 -11.26
TOTAL 236,628,480.85 100.00

Global Partners
NOTES TO THE FINANCIAL STATEMENTS as at 30th September 2009
65
Note 1 - Accounting Policies a) Presentation of the financial statements The financial statements of the SICAV are established in accordance with the Luxembourg legal and regulatory requirements concerning undertakings for collective investment. b) Valuation of the assets The value of the assets is determined as follows: The value of the cash in hand or on deposit, of bills and demand notes payable and accounts receivable, pre-paid expenses, dividends and interest declared or accrued but not yet received, are the nominal amount thereof. If, however, it is unlikely that the full amount of these assets will be received, they are valued by applying a discount the SICAV considers appropriate to reflect their true value. The value of all securities that are traded or quoted on a stock exchange or on another regulated exchange are based on the latest available price unless this price is not representative of their true value. If securities held in the portfolio are not traded or quoted on a stock exchange or other regulated market or if the price of securities quoted or traded on such an exchange or regulated market determined in accordance with the terms above is not representative of their true value, these securities are valued on the basis of their foreseeable realisation value, which is estimated prudently and in good faith. In the context of the sub-funds structured with equity/index linked swaps, bonds are valued by calculating the current value of the expected payments on the basis of the risk-free-curve. Impairment of these bonds would result if any interest or principal payments are reduced, forgiven or delayed. The Board of Directors may then decide to lower the valuation as described before or to adopt a full mark-to-market valuation. Since the 8th June 2009, the depreciation policy as mentioned above has been abandoned by a decision of the Committee 'Pricing & Valuation ' of KBC Asset Management S.A.. Since this date, the notes are valued at fair value, based upon the mark-to-market or mark-to-model prices of the assets in the underlying portfolios. c) Net realised profit or loss on investments The realised profits or losses on the sales of securities are calculated on the basis of the average cost. d) Acquisition cost of securities in the portfolio The acquisition cost of the securities held by each sub-fund that are denominated in a currency other than that of the sub-fund is converted to the sub-fund’s currency at the average exchange rates prevailing on the date of purchase. e) Conversion of foreign currencies The value of all the assets and liabilities not expressed in the reference currency of the sub-fund are converted into the reference currency of the sub-fund at the last known exchange rates. If these rates are not available, the exchange rate is determined prudently and in good faith by and in accordance with the procedures laid down by the Board of Directors. f) Consolidation The consolidated financial statements of the SICAV are presented in EUR and correspond to the sum of the financial statements of all sub-funds. Assets and liabilities and income and expenses which are expressed in currencies other than the EUR are converted into EUR at the exchange rates available at the date of the report:

Global Partners
NOTES TO THE FINANCIAL STATEMENTS (continued) as at 30th September 2009
66
1 EUR = 25.3186462 CZK Czech Krona 4.2417028 PLN Polish zloty g) Formation expenses The formation expenses are amortised over five years, or the remaining period until the maturity of the sub-fund if less than five years, from the first day following the end of the initial subscription period. h) Swap contracts Interest rate and inflation interest rate swap contracts are assessed as follows: These contracts are valued using the discounted cash flows method. A discount factor curve is derived from short term interest rates and from swap rates. Future cash flows are computed by projection of the forward rates from the implied yield curve linearly interpolated from annual rates. Cash flows streams are then discounted to present to assess the value of the contract. For inflation swaps, the valuation of the inflation-linked legs of the contracts requires a forward Inflation Curve, which is a list of expected future values of the index on a series of future dates. Equity/index linked swap contracts are assessed as follows: In the framework of these swap contracts, the SICAV will receive one or several payment(s) from the Counter-party (optional leg) and will make payments to the Counter-party (floating leg). The two legs are assessed and the total value of the swap contract is equal to the value of the optional leg less the value of the floating leg. The SICAV will receive a payment from the Counter-parties on the settlement date (and in some cases after several sub-periods). The amount of the payment will depend on the evolution/performance of the underlying (share basket, index basket, exchange rate) and will only be known with certainty after the settlement date (or, where relevant, after the sub-period under consideration). The optional leg is assessed using the modified Black & Scholes model, via a Monte Carlo simulation which requires the following valuation elements: the volatilities of the underlying assets, the correlations between the underlying assets, the prices of the underlying assets with estimate of their future dividends if applicable, the level of the exchange rates with their respective volatilities, the correlations between the exchange rate and the underlying assets, the various observations and references already made in the framework of the instrument’s calculation conditions, the interest rates curve (swap curve) on the date of valuation, and the time-to-maturity. The SICAV periodically makes payments to the Counter-parties which are tied to a benchmark interest rate. This floating leg is assessed according to the discounted cash flows method. i) Investment income Interest income is recorded on an accrual basis. Note 2 - Management fee, distribution and risk management fee The Board of Directors of the SICAV is responsible for the management of the SICAV, as well as for determining the investment policy for each sub-fund. The SICAV has designed KBC ASSET MANAGEMENT S.A. as Management Company according to the provisions of Chapter 13 of the amended Law of 20th December 2002. As remuneration for its services rendered regarding management, distribution and risk management, the sub-funds pay the Management Company at the end of each semester a remuneration consisting of a half-yearly fee per share in circulation at the start of that semester increased by a fee on an annual basis of maximum 0.1%.

Global Partners
NOTES TO THE FINANCIAL STATEMENTS (continued) as at 30th September 2009
67
As at 30th September 2009, the effective fees per share are:
Currency
Effective fee per share
Risk management fee in %
CSOB World Growth Plus EUR 2 EUR 0.048 0.025 CSOB Variable Click Plus 1 CZK 0.014 - CSOB Bull & Bear 2 CZK 0.058 0.025 CSOB Asian Click Plus 1 CZK 0.063 0.025 CSOB Click SKK 1 EUR 0.002 0.025 CSOB Variable Growth 1 CZK 0.059 0.025 CSOB Rastovy SKK 5 EUR 0.002 0.025 CSOB Click SKK 6 EUR 0.001 0.025 CSOB World Click Plus 25 CZK 0.047 0.025 KBC Rastovy SKK 1 EUR 0.002 0.025 KBC Click SKK 2 EUR 0.001 0.025 CSOB World Growth Plus 20 CZK 0.047 0.025 KBC Kuponovy SKK 1 EUR 0.002 0.025 Kredyt Bank Fix Upside Click 1 PLN 0.546 0.025 KBC Rastovy Plus SKK 1 EUR 0.001 0.025 CSOB Fixovany Click 1 CZK 0.033 0.025 CSOB World Growth Plus 21 CZK 0.059 0.025 PS Fixovany Click 1 CZK 0.017 0.025 KBC Rastovy SKK 2 EUR 0.001 0.025 CSOB Fixovany Click 2 CZK 0.031 0.025 Kredyt Bank Super Fix Upside Click 1 PLN 0.415 0.025 CSOB World Tree 14 CZK 0.038 0.025 CSOB World Growth Plus 22 CZK 0.046 0.025 KBC Kuponovy 3 EUR 0.001 0.025 CSOB Fixovany Click 3 CZK 0.042 0.025 CSOB Fixovany Click 4 CZK 0.071 0.025 KBC Kuponovy 2 EUR 0.064 0.025 KBC Fixny Click 1 EUR 0.065 0.025 CSOB Fixovany Click 5 CZK 0.074 0.025 CSOB Fixovany Click 6 EUR 0.06 0.025 KBC Reverzny 3 EUR 0.02 0.025 CSOB Fixovany Click 7 EUR 0.042 0.025 CSOB Variable Growth 2 EUR 0.02 0.025 KBC Reverzny 4 EUR 0.036 0.025 CSOB Svetoveho Rustu Plus 23 CZK 0.02 0.025 CSOB Fixovany Click 8 CZK 0.033 0.025
Note 3 - Subscription Duty ("taxe d'abonnement") Under Luxembourg law currently in force and according to common practice, the SICAV is not subject to any Luxembourg tax on income. However, a subscription tax is payable in Luxembourg by the SICAV. It amounts to 0.05% per annum on the net assets. It is payable each quarter and calculated on the basis of the net assets of the SICAV at the end of the quarter. Note 4 - Commitments linked to swap contracts The sub-funds are structured with equity/index linked swaps, interest rate swaps or currency swaps whose unrealised result is recorded in the statement of net assets.

Global Partners
NOTES TO THE FINANCIAL STATEMENTS (continued) as at 30th September 2009
68
For each sub-fund, under the heading “Permitted derivatives transactions”, the prospectus stipulates that swap contracts are entered into to achieve the investment objectives. For each sub-fund, under the heading “Selected strategy”, the prospectus describes these investment objectives. Note 5 - Changes in the composition of the securities portfolio A copy of the changes in the composition of the securities portfolio for the period referring to the report can be obtained free of charge from the SICAV’s registered office or from the institutions responsible for providing financial services. Note 6 - Asset Allocation In order to achieve the investment objectives, the sub-funds of the SICAV may invest in securities (including bonds and other debt instruments), money market instruments, units in undertakings for collective investment, deposits, financial derivatives, cash and any other instruments permitted under the amended law of 20th December 2002. As at 30th September 2009, the SICAV invested in notes issued by 16 Special Purpose Vehicles (SPVs) incorporated under Irish law, listed on the Irish stock exchange and managed by KBC Asset Management, S.A. (Belgium):
Amethyst Structured Finance plc Beechwood Structured Finance plc Brookfields Capital plc Eperon Finance plc Espaccio Securities plc Greenstreet Structured Financial Products plc Nimrod Capital plc Opal Financial Products plc Profile Finance plc Recolte Securities plc Silverstate Financial Investments plc Vespucci Structured Finance Products plc Vigado Capital plc Voyce Investments plc Waterford Capital Investments plc Waves Financial Investments plc
As at 30th September 2009, the underlying assets of the 16 SPVs are notes issued by Fairport Capital Investments plc, not listed on any stock exchange. Fairport Capital Investments plc is also an SPV incorporated under Irish law and managed by KBC Asset Management, S.A. (Belgium). As at 30th September 2009, Fairport Capital Investments plc invests in a diversified portfolio of deposits issued by financial institutions, bonds and other securities. These investments include:
Ring fenced notes issued by Arcade Finance plc and D-Star Finance plc, which are also SPVs incorporated under Irish law and managed by KBC Asset Management, S.A. (Belgium);
Notes issued by the 4 following SPVs incorporated under Irish law and set up in collaboration with Goldman Sachs International:
Infinity Finance plc Sierra Finance plc Venice Finance plc

Global Partners
NOTES TO THE FINANCIAL STATEMENTS (continued) as at 30th September 2009
69
Zulma Finance plc
These 4 SPVs are all managed by KBC Asset Management, S.A. (Belgium) or a subsidiary.
As at 30th September 2009, the underlying assets of these 4 SPVs are (1) a diversified portfolio of deposits held by financial institutions, bonds and other securities and (2) securities acquired according to the terms and conditions of a Total Return Swap concluded with Goldman Sachs International. These investments include ring fenced notes issued by Arcade Finance plc and D-Star Finance plc.
As at 30th September 2009, Fairport Capital Investments plc, Infinity Finance plc, Sierra Finance plc, Venice Finance plc and Zulma Finance plc invest in the following ring fenced notes:
Arcade Finance Plc R1, ring fenced notes issued by Arcade Finance Plc of which the underlying assets are subject to the terms and conditions of a Total Return Swap concluded with Merrill Lynch International.
Arcade Finance Plc R9, ring fenced notes issued by Arcade Finance Plc of which the underlying
assets are subject to the terms and conditions of a Total Return Swap concluded with Deutsche Bank AG, London Branch.
D-Star Finance Plc R4, ring fenced notes issued by D-Star Finance Plc of which the underlying assets
are (1) a diversified portfolio of deposits held with financial institutions, bonds and other securities and (2) securities acquired according to the terms and conditions of a Total Return Swap concluded with Goldman Sachs International.
Arcade Finance Plc R17, ring fenced notes issued Arcade Finance and D-Star Finance Plc R5, ring
fenced notes issued by D-Star Finance Plc with the following classes:
o Class A AprOct Senior Secured Floating Rate Notes due 2013 o Class B JanJul Senior Secured Floating Rate Notes due 2013 o Class C MarSep Senior Secured Floating Rate Notes due 2013 o Class D Falcon Mezzanine Secured Floating Rate Notes due 2013 o Class E Falcon Subordinated Variable Coupon Notes due 2013
These notes are not listed and are categorised into different classes: a subordinated tranche to which the first losses in the portfolio are booked (Class E above), followed by a mezzanine tranche (Class D) and finally 3 senior tranches (Class A, B & C).
As at 30th September 2009 Arcade Finance Plc R17 and D-Star Finance Plc R5 invest in shares of N-Vest Fund- 1, a Luxembourg Specialized Investment Fund. As at 30th September 2009, N-Vest Fund – 1 invests in a portfolio of deposits held with financial institutions, bonds and derivatives. These investments include a Tier 1 loan issued by KBC Bank NV (KBC 8% 29/05/2049) and ring fenced notes issued by Arcade Finance Plc R1, Arcade Finance Plc R9 and D-Star Finance Plc R4. The N-Vest Fund - 1 portfolio is valued on a held to maturity basis in accordance with the provisions of the prospectus