LUTFI ERDEN Hacettepe University - United...
28
10.1177/1091142105277627 PUBLIC FINANCE REVIEW Erden, Holcombe / THE EFFECTS OF PUBLIC INVESTMENT THE EFFECTS OF PUBLIC INVESTMENT ON PRIVATE INVESTMENT IN DEVELOPING ECONOMIES LUTFI ERDEN Hacettepe University RANDALL G. HOLCOMBE Florida State University The literature on the impact of public investment in developing economies gives inconsis- tent results on whether it complements or crowds out private investment. Applying sev- eral pooled specifications of a standard investment model to a panel of developing econo- mies for 1980 to 1997, this study finds that public investment complements private investment, and that, on average, a 10 percent increase in public investment is associated with a 2 percent increase in private investment. The results also indicate that private in- vestment is constrained by the availability of bank credit in developing economies. The same empirical models are run on a panel of developed economies. In contrast to devel- oping economies, public investment crowds out private investment in developed econo- mies. The results show that in a number of important ways, private investment in devel- oped economies is influenced by different factors than private investment in developing economies. Keywords: developing economies; investment; capital markets; credit; public expen- diture 1. INTRODUCTION Private investment is necessary for economic progress, and an im- portant but unsettled question is how public policy affects private in- vestment. Public investment in infrastructure is widely believed to ex- ert a positive impact on private investment. If this is the case, public AUTHORS’ NOTE: The authors gratefully acknowledge helpful comments from Charles Barrilleaux, David Rasmussen, and especially Stefan Norrbin. The article was also improved by especially detailed comments from an anonymous reviewer of this Review. PUBLIC FINANCE REVIEW, Vol. 33 No. 5, September 2005 575-602 DOI: 10.1177/1091142105277627 © 2005 Sage Publications 575
Transcript of LUTFI ERDEN Hacettepe University - United...
10.1177/1091142105277627PUBLIC FINANCE REVIEWErden, Holcombe / THE EFFECTS OF PUBLIC INVESTMENT
THE EFFECTS OF PUBLIC INVESTMENT
ON PRIVATE INVESTMENT IN
DEVELOPING ECONOMIES
LUTFI ERDENHacettepe University
RANDALL G. HOLCOMBEFlorida State University
The literature on the impact of public investment in developing economies gives inconsis-tent results on whether it complements or crowds out private investment. Applying sev-eral pooled specifications of a standard investment model to a panel of developing econo-mies for 1980 to 1997, this study finds that public investment complements privateinvestment, and that, on average, a 10 percent increase in public investment is associatedwith a 2 percent increase in private investment. The results also indicate that private in-vestment is constrained by the availability of bank credit in developing economies. Thesame empirical models are run on a panel of developed economies. In contrast to devel-oping economies, public investment crowds out private investment in developed econo-mies. The results show that in a number of important ways, private investment in devel-oped economies is influenced by different factors than private investment in developingeconomies.
Keywords: developing economies; investment; capital markets; credit; public expen-
diture
1. INTRODUCTION
Private investment is necessary for economic progress, and an im-portant but unsettled question is how public policy affects private in-vestment. Public investment in infrastructure is widely believed to ex-ert a positive impact on private investment. If this is the case, public
AUTHORS’ NOTE: The authors gratefully acknowledge helpful comments from CharlesBarrilleaux, David Rasmussen, and especially Stefan Norrbin. The article was also improved byespecially detailed comments from an anonymous reviewer of this Review.
PUBLIC FINANCE REVIEW, Vol. 33 No. 5, September 2005 575-602DOI: 10.1177/1091142105277627© 2005 Sage Publications
575

investment may not only spur economic growth directly but also indi-rectly by promoting private investment. However, some literature sug-gests that public investment crowds out private investment, whichwould lead to substantially different policy conclusions with regard topublic investment. This is an important and unsettled policy issue,which motivates this empirical examination of the effects of publicinvestment on private investment in developing countries.
The literature on the impact of public investment in developingeconomies gives inconsistent results on whether it complements orcrowds out private investment. Applying several pooled specifica-tions of a standard investment model to a panel of developing econo-mies for 1980 to 1997, this study finds that public investment comple-ments private investment, and that on average a 10 percent increase inpublic investment is associated with a 2 percent increase in private in-vestment. The results also indicate that private investment is con-strained by the availability of bank credit in developing economies.The same empirical models are run on a panel of developed econo-mies. In contrast to developing economies, public investment crowdsout private investment in developed economies. The results show thatin a number of important ways, private investment in developedeconomies is influenced by different factors than private investment indeveloping economies.
2. FACTORS THAT INFLUENCE PRIVATE INVESTMENT
A glance at the literature reveals that there are two major ap-proaches to analyzing the effect of public investment on economicgrowth. The first is based on the neoclassical production function inwhich public capital enters as a separate input and on the productivitymeasures derived from the production function. The results ofAschauer (1989a, 1989b) and Munnell (1990) from the U.S. annualand state-level data respectively indicate that public nonmilitary in-vestment spending, particularly on core infrastructure, has a substan-tial influence on output and the productivity of private capital. Fur-thermore, the analyses by Aschauer (1990) from data on industrialcountries and Cashin (1995) from cross-country data provide some
576 PUBLIC FINANCE REVIEW

support in favor of the earlier results. However, studies followingthose initial articles, such as Tatom (1991), Holtz-Eakin (1994), andEvans and Karras (1994) have found that public investment has a neg-ligible impact on productivity. Khan and Reinhart (1990) and Khanand Kumar (1997) found that for developing countries, although pub-lic investment contributes to the productive performance of the econo-mies, private investment has more influence on economic growth.Overall, the empirical studies using the “growth accounting” ap-proach, while somewhat mixed, indicate that public capital invest-ments contribute to economic productivity although they are not themajor source of the economy-wide variations in productivity.
The second approach uses a model of private investment that incor-porates public investment to capture the direct effect of public invest-ment on private investment and also its indirect effect on economicgrowth through its effect on private investment. Studies by Greene andVillanueva (1991) for a panel of developing countries, Ramirez(1994) for Mexico, Odedokun (1997) for forty-eight developingcountries, and Ramirez (2000) for a panel of Latin American coun-tries found that public investment stimulates private investment.Blejer and Khan (1984) for a panel of developing countries andOshikoya (1994) for a panel of African countries presented evidencethat public infrastructure (represented by the expected public invest-ment) has a positive impact on private investment, while noninfra-structure investment (the unexpected component) has a negative im-pact on private sector investment. Meanwhile, Wai and Wong (1982)for five developing countries and Nazmi and Ramirez (1997) for Mex-ico found that public investment crowds out private investment. Theempirical literature suggests that public investment does affect privateinvestment in developing economies; however, the question ofwhether public investment stimulates or crowds out private invest-ment remains ambiguous.
Several competing mechanisms through which public capital in-vestment may influence private sector investment have been identifiedin the literature, for example, by Barth and Cordes (1980), Blejer andKhan (1984), Aschauer (1989a, 1989b), and Ramirez (1994). Poten-tially the most significant mechanism—and the most compelling ar-gument supporting public investment—is that public infrastructure
Erden, Holcombe / THE EFFECTS OF PUBLIC INVESTMENT 577

investment may have substantial spillover benefits for private invest-ment. If public infrastructure investment is complementary to privateinvestment, the rate of return to private sector investments will in-crease, leading private sector investors to undertake more capital in-vestment. However, public investment may crowd out private invest-ment if they compete for the same resources, and the crowding outmay be more significant if public investments are made in state enter-prises that produce output that is in direct competition with the goodsand services provided by private sector. Sound theoretical argumentspoint in both directions, so whether public investment actually helpsor hinders private investment is an empirical question.
Another key factor influencing private investment is uncertainty.The literature has dealt extensively with the impact of uncertainty andirreversibility on investment decisions (Abel 1983; Pindyck 1991;Caballero 1991; Dixit and Pindyck 1994; Abel and Eberly 1995). As-suming risk neutrality and competitive firms with constant returns toscale technology, earlier studies such as Hartman (1972) and Abel(1983) showed that a rise in uncertainty brings about an increase in theexpected value of the marginal revenue products of capital, increasinginvestment. This is based on the assumption that firms can instanta-neously and costlessly adjust their labor, with capital being the onlyfixed factor. When the irreversible nature of the investment decision istaken into account, this conclusion changes (see, for example,Bernanke 1983; Caballero 1991; Pindyck 1991; Dixit and Pindyck1994). The effect of uncertainty on investment is ambiguous on theo-retical grounds and depends on the assumptions used. The importantimplication from an empirical standpoint is that uncertainty mighthave a significant impact on both the long-run and the short-run dy-namics of investment behavior and so should be incorporated into anempirical analysis of the impact of public investment on privateinvestment.
Public investment may also play a countercyclical role in the econ-omy, reducing the volatility of output demand and prices, giving riseto private sector investment. There are a number of reasons why un-certainty should be captured in a model of private investment in devel-oping economies. Empirical studies add a proxy for uncertainty to astandard investment model, showing that increased uncertainty has an
578 PUBLIC FINANCE REVIEW

adverse impact on the aggregate investment (Goldberg 1993; Price1996; Aizenman and Marion 1996; Serven 1998).
Institutions may also have important effects on private investment,and institutions that protect and foster market exchange, such as theprotection of property rights, low barriers to international trade, lowtaxes, and minimal regulatory barriers, are likely to encourage privateinvestment. De Haan and Siermann (1998) compared various indicesof economic freedom constructed by Scully and Slottje (1991) andGwartney, Lawson, and Holcombe (1999) and found that the mea-sured effect of these institutions on economic growth depends on themeasure used. Dawson (1998), using the economic freedom index byGwartney, Lawson, and Holcombe (1999), found that market institu-tions have a positive impact on economic growth, and encourage ag-gregate investment. Similarly, Vamvakidis (1998) undertook an anal-ysis for eight African countries using the Gwartney, Lawson, andHolcombe index and showed that various components as well as thesummary measure of economic freedom are positively related to theshare of aggregate investment in GDP. Most previous studies have fo-cused on the effect of economic freedom on economic growth, butsome examine the possibility the impact may also be felt indirectly,through the impact of institutions on investment (Besley 1995;Dawson 1998; De Haan and Siermann 1998). This analysis uses themeasure of economic freedom computed by Gwartney, Lawson, andSamida (2000) to try to capture these institutional factors that couldaffect private investment. Economic freedom, as defined byGwartney, Lawson, and Samida means that property rights are pro-tected, that people have freedom of exchange, that the governmentprovides a stable currency, and that government intrudes minimallyon the economy through taxation and regulation.
The availability of credit to the private sector is thought to be an-other key variable determining private investment activities especiallyin developing countries (Blejer and Khan 1984; Ramirez 1994).Credit constraints may be more binding in developing economies thanthe interest rate if credit is explicitly rationed or its availability is lim-ited in other ways. However, investment may also be sensitive to thecost of capital after the structural adjustment reforms implemented inmost developing nations in the late 1970s because such reforms led to
Erden, Holcombe / THE EFFECTS OF PUBLIC INVESTMENT 579

increases in real interest rates (Greene and Villanueva 1991;Guncavdi, Bleaney, and McKay 1998). Thus, the cost of funding in-vestment projects as well as the availability of credit can be expectedto play inhibiting roles on private investment in developing countries.There are arguments for including both the availability of credit andits cost in the model. The empirical analysis that follows accounts forinstitutions, using the Gwartney, Lawson, and Samida (2000) eco-nomic freedom index, uncertainty, credit, and costs of financing toinvestigate the impact of public investment on private investment indeveloping economies.
The central objective of this article is to investigate the determi-nants of private investment in developing and developed countrieswith a primary focus on the role of public investment. To this end, thestudy constructs an empirical framework for developing countriescentered on the flexible accelerator model of private investment. Thearticle then applies the same empirical framework to the sample of de-veloped countries to analyze whether there are differences in invest-ment behavior across developing and developed economies. The re-sults obtained by comparing the impact of public investment onprivate investment in developing versus developed economies pro-vides interesting insights for policy makers by showing that the im-pact of public investment on private investment varies depending onthe stage of development. Public investment does have a positiveimpact on private investment in developing economies but not indeveloped economies.
3. THE EMPIRICAL MODEL OF PRIVATE INVESTMENT
The empirical model is based on a flexible accelerator investmentmodel, which begins by assuming that the desired capital stock is pro-portional to the level of expected output (Blejer and Kahn 1984;Ramirez 1994):
K*pt = αYet, (1)
where K*pt is the desired capital stock by the private sector in period t.Ye
t is the expected level of output in time t that can be thought of as fu-
580 PUBLIC FINANCE REVIEW

ture aggregate demand. This assumption rules out the role of factorprices, which may be rationalized if the underlying production func-tion is of the fixed-proportions form, or if relative factor prices remainrelatively constant. The actual stock of private capital may not adjustcompletely to reach the desired level due to technical constraints andthe time it takes to plan, decide, build, and install new capital. Such adynamic structure in private capital behavior can be introducedthrough a one-period quadratic adjustment cost function (Salmon1982),
β(Kpt – K*pt)2 + (1 – β)(Kpt – Kp,t–1)
2, (2)
where Kpt is the actual private capital stock. The first term indicates thecost of disequilibrium, and the second term the cost of adjusting to-ward equilibrium. Minimizing the cost of adjustment with respect toKpt yields a partial adjustment mechanism like the following:
Kpt – Kpt–1 = β(K*pt – Kpt–1) 0 ≤ β ≤ 1, (3)
where β is the coefficient of adjustment. In this formulation, actualprivate capital adjusts to the difference between desired private capitalin time t and actual private capital in the previous period. Because thedata on capital stock are not available for most of the developing coun-tries, we can make use of the gross private investment definition,which is expressed as
PIt = (Kpt – Kpt–1) + δKpt–1, (4)
where δ is the depreciation rate of the private capital stock and PIt isgross private investment. Rearranging, we get
PIt = [1 – (1 – δ)L]Kpt. (4a)
Also, for empirical purposes, the partial adjustment mechanism canbe specified in terms of PI as
PIt – PIt–1 = β(PI*t – PIt–1). (5)
Erden, Holcombe / THE EFFECTS OF PUBLIC INVESTMENT 581

To add more dynamics to the specification, we assume that govern-ment investment and the other relevant variables affect the speed ofadjustment at which the gap between the desired and actual gross pri-vate investment closes up in each short-run period (see Blejer andKhan 1984; Price 1996). Hence, a linear representation of β can bedefined as the following:
β = ao + [1/(PI*t – PIt–1)](γ1GIt + γ2Xt), (6)
where ao is the intercept, GI is gross public investment, and Xt is a vec-tor of other relevant variables. An implicit assumption underlyingequation (6) is that the lagged effects of these variables on private in-vestment are also captured by the coefficient of adjustment. If publicinvestment is complementary to private investment, it speeds up theadjustment of desired private investment to its actual level, and viceversa. Plugging (6) into (5) and rearranging, we get
PIt – PIt–1 = ao(PI*t – PIt–1) + γ1GIt + γ2Xt. (7)
Note that equation (4a) in the steady state is given by
PI*t = [1 – (1 – δ)L]K*pt. (8)
Inserting (1) into (8) and the resulting equation into (7), and rearrang-ing, we obtain the following dynamic reduced-form equation forgross private investment that embodies public investment, as well as aset of other relevant variables.
PIi,t = αao[1 – (1 – δ)L]Yei,t + γ1GIi,t + γ2Xi,t + (1 – ao)PIi,t–1 + ui,t, (9)
where the subscripts i = 1, . . . , N and t = 1, . . . , T represent the cross-section and time-series dimension of the panel data, and ui,t is a ran-dom disturbance.
In this form, the model is quite flexible because it allows private in-vestment to be specified not only as a function of the expected level ofreal output but also of several relevant variables. The coefficient of Ye
captures the accelerator effect and is expected to be positive. As dis-cussed earlier, the coefficient of GI can be negative or positive de-pending on which effect (substitution or complementary) is greater.
582 PUBLIC FINANCE REVIEW

Also, the impact of uncertainty is ambiguous on theoretical grounds.While the cost of capital is expected to deter private investment, avail-ability of credits to the private sector is expected to be positively influ-ence private investment activities. Last, a favorable economic envi-ronment provided by the institutions is expected to have a positiveimpact on private investment.
Equation (9), however, is not in a readily estimatable form as it con-tains unobservable variables as well as qualitative factors that need tobe measured. To proxy for expected output, Ye, in equation (9), whichis unobservable, a common practice is to fit an autoregressive process,from which the predicted values are taken to represent expected out-put (Blejer and Khan 1984; Ramirez 1994). However, this method re-quires a large set of time series data. Therefore, in this study, a first-order autoregressive model, AR(1), of the logarithm of real GDP isestimated for each country in the sample.
Finally, the rate of depreciation is unavailable for most countries toestimate equation (7). As discussed before, although the model can beestimated by nonlinear least squares (NLLS) to obtain estimates of thedepreciation rate, the use of NLLS with panel data raises several is-sues. For example, in the case of nonlinear panel data models withfixed effects, there is a possibility that a solution to the problem cannotbe reached (Hsiao et al. 2000, 1). Thus, the arbitrarily chosen value of5 percent depreciation rate was used, following the studies by Blejerand Khan (1984), Ramirez (1994), and the references cited therein.Then, a sensitivity analysis was carried out using 0 and 5 depreciationrates, which revealed that the results do not differ significantly. There-fore, in the empirical model that follows, the depreciation rate is setequal to 0 percent.
3.1. PROXY FOR UNCERTAINTY
Several methods for the measurement of uncertainty have beenproposed in the literature. However, as Serven (1998) and Dehn(2000) argued, the uncertainty measures obtained from either thesample variation (variance or standard deviation of a variable in ques-tion) or the estimation of a univariate autoregressive specificationhave their shortcomings. The former approach does not allow unpre-
Erden, Holcombe / THE EFFECTS OF PUBLIC INVESTMENT 583
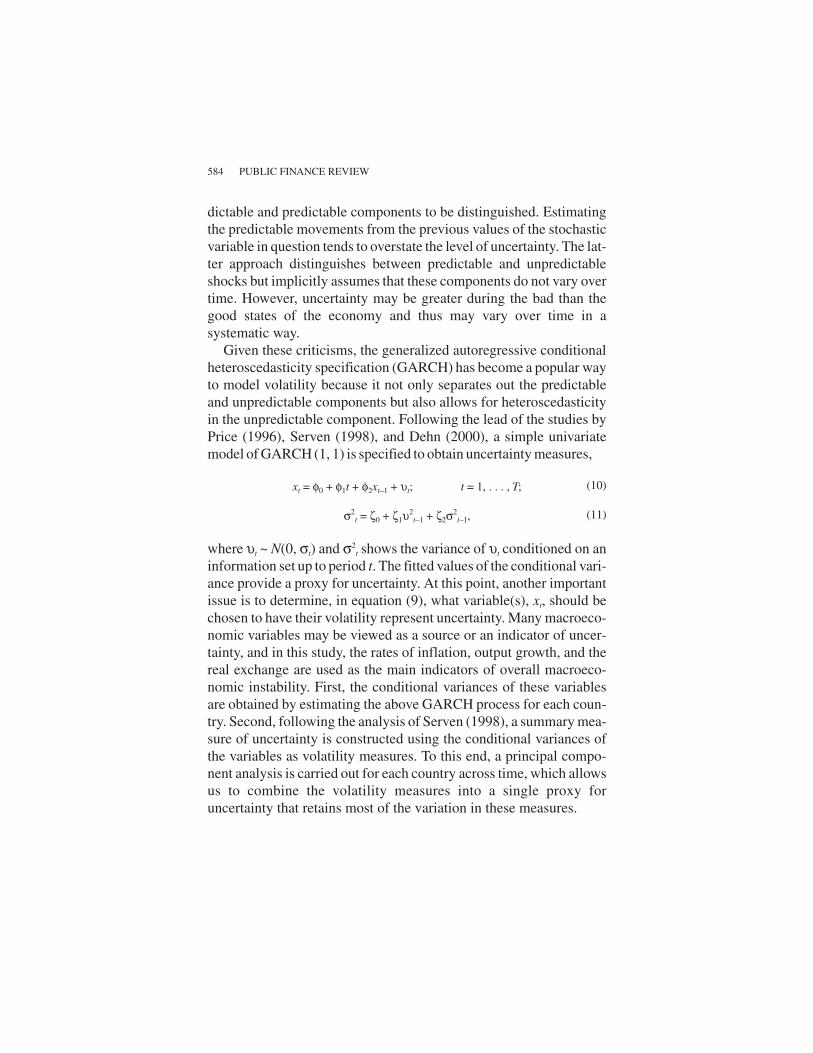
dictable and predictable components to be distinguished. Estimatingthe predictable movements from the previous values of the stochasticvariable in question tends to overstate the level of uncertainty. The lat-ter approach distinguishes between predictable and unpredictableshocks but implicitly assumes that these components do not vary overtime. However, uncertainty may be greater during the bad than thegood states of the economy and thus may vary over time in asystematic way.
Given these criticisms, the generalized autoregressive conditionalheteroscedasticity specification (GARCH) has become a popular wayto model volatility because it not only separates out the predictableand unpredictable components but also allows for heteroscedasticityin the unpredictable component. Following the lead of the studies byPrice (1996), Serven (1998), and Dehn (2000), a simple univariatemodel of GARCH (1, 1) is specified to obtain uncertainty measures,
xt = φ0 + φ1t + φ2xt–1 + υt; t = 1, . . . , T; (10)
σ2t = ζ0 + ζ1υ
2t–1 + ζ2σ
2t–1, (11)
where υt ~ N(0, σt) and σ2t shows the variance of υt conditioned on an
information set up to period t. The fitted values of the conditional vari-ance provide a proxy for uncertainty. At this point, another importantissue is to determine, in equation (9), what variable(s), xt, should bechosen to have their volatility represent uncertainty. Many macroeco-nomic variables may be viewed as a source or an indicator of uncer-tainty, and in this study, the rates of inflation, output growth, and thereal exchange are used as the main indicators of overall macroeco-nomic instability. First, the conditional variances of these variablesare obtained by estimating the above GARCH process for each coun-try. Second, following the analysis of Serven (1998), a summary mea-sure of uncertainty is constructed using the conditional variances ofthe variables as volatility measures. To this end, a principal compo-nent analysis is carried out for each country across time, which allowsus to combine the volatility measures into a single proxy foruncertainty that retains most of the variation in these measures.
584 PUBLIC FINANCE REVIEW

4. THE PANEL DATA
4.1. THE SAMPLE OF DEVELOPING COUNTRIES
The data for developing countries are from Bouton and Sumlinski(2000) of the International Finance Corporation of the World Bank(IFC); the International Monetary Fund’s International FinancialStatistics Yearbook, 1999 and 2000 issues (IFS); and the EconomicFreedom of the World: 2000 Report by Gwartney, Lawson, andSamida (2000).
Bouton and Sumlinski (2000) compiled the ratios of public and pri-vate investment to GDP for fifty developing countries spanning from1970 to 1998. In this study, the panel is chosen to be balanced, whichrequires complete data from each country for the entire time span. Abalanced panel is used because we obtain the conditional variances ofseveral indicators over time for each country to construct a proxy foruncertainty. This is important because if a set of countries in the sam-ple is subject to the same shocks in a specific time period, then the con-ditional variances are likely to be influenced and different dependingon the availability or unavailability of data during that specific period.In this case, the proxy of uncertainty would be affected with respect tothe time period used across each country in the sample if an unbal-anced panel were employed. Therefore, to eliminate the effects of thespecific time period chosen and to capture only the volatility in therates of growth, exchange rates, and inflation in construction of an un-certainty measure, the same time span is chosen across all countries inthe panel.
Only twenty-one of the fifty have the complete data for the 1970 to1998 periods. However, because of the data limitations on the other re-maining variables compiled from IFS, only six countries have com-plete data for the 1970 to 1998 periods. As a result, we restrict the timespan to the years 1980 to 1997, for which complete data for nineteendeveloping countries are available (Bangladesh, Belize, Chile, CostaRica, Ecuador, Guatemala, India, Kenya, Korea, Malaysia, Malawi,Mauritius, Mexico, Pakistan, Philippines, Thailand, Tunisia, Turkey,
Erden, Holcombe / THE EFFECTS OF PUBLIC INVESTMENT 585

and Uruguay). Because of the diversity of countries in the sample(four from Africa, seven from the Western Hemisphere, and eightfrom Asia, including Turkey), the country set appears to be fairlyrepresentative of developing countries around the world.
Institutional differences are proxied by the economic freedom in-dex computed by Gwartney, Lawson, and Samida (2000). In their con-struction of the index, they used as the components the size of govern-ment (consumption, transfers, and subsidies), the structure of theeconomy and the use of markets, monetary policy and price stability,freedom to use alternative currencies, legal structure and propertyrights, freedom to trade with foreigners, and freedom of exchange incapital and financial markets. From these components, a summarymeasure of economic freedom was constructed, using principal com-ponent analysis. The measure was indexed from 1 to 10, with 10 beingthe most favorable environment of economic freedom. The index isavailable in five-year intervals (1980, 1985, 1990, 1995, and 1997).The empirical model transforms the index into the annual observa-tions by interpolating the five-year intervals. The full description ofthe variables is reported in the appendix.
4.2. THE SAMPLE OF INDUSTRIAL COUNTRIES
There are three main sources of data for industrial countries: theIFS; the International Monetary Fund’s Government Finance Statis-tics, 1999, 1994, 1989, and 1985 issues (GFS); and the EconomicFreedom of the World: 2000 Report by Gwartney, Lawson, andSamida (2000).
According to the classification of the International Monetary Fund,there are twenty-three industrial countries. There are seventeen coun-tries that have complete and reliable data on gross public investment;however, due to the lack of the data on other relevant variables takenfrom IFS, only twelve developed countries have complete data for theentire period from 1980 to 1996 (Austria, Belgium, Finland, France,Germany, Greece, Ireland, Netherlands, Portugal, Spain, Sweden, andthe United Kingdom).
586 PUBLIC FINANCE REVIEW

5. EMPIRICAL RESULTS
5.1. MEASURING UNCERTAINTY
Uncertainty is modeled as unpredictable changes in the inflationrate, real exchange rate, and GDP growth rate. To distinguish predict-able and unpredictable components in these variables, equations (10)and (11) are estimated for each variable and country in the sample, us-ing data for industrial countries from 1981 to 1996 and for developingcountries from 1981 to 1997. After obtaining the fitted values of theconditional variances of these variables, a summary proxy for uncer-tainty is constructed to represent overall macroeconomic instabilityby performing a principal component analysis to weight the condi-tional variances of these variables for each country across time. Forthe majority of countries, the first principal component has positiveloadings on the unpredictable component of each variable. The largestweights correspond respectively to the inflation, the real exchangerate, and growth rate uncertainty measures. The first principal compo-nent accounts for around 60 percent of the variation in the individualuncertainty measures for developing countries and roughly 50 percentof the variation for industrial countries. Because the first principalcomponent accounts for a high percentage of the variation in the con-ditional variances and has positive loadings for a majority of thecountries, the first principal component is used as a summary measureof uncertainty.
5.2. RESULTS FROM THE SAMPLE OF DEVELOPING COUNTRIES
In panel data applications, how one treats country-specific effectsis an important issue because cross-sectional specific effects are a po-tential source of bias and inconsistency in estimates. In particular, thepresence of the lagged dependent variable in the flexible acceleratormodel raises concerns over the consistency and unbiasedness of theestimated coefficients. Therefore, four empirical specifications—pooled–ordinary least squares (OLS), fixed effect, random effect
Erden, Holcombe / THE EFFECTS OF PUBLIC INVESTMENT 587

(GLS), and system two-stage least squares—are estimated to seewhether the results are robust to different estimation methods. Using apanel of nineteen developing nations over the 1982 to 1997 period,equation (9) is estimated by all four pooled estimation methods, andthe results are presented in Table 1. For interpretation purposes, first,several diagnostic tests are performed to identify which pooled speci-fication(s) are preferred. Then, the results are interpreted with the em-phasis on the preferred specification, but are contrasted with theresults from the other pooled specifications.
The first column of Table 1 reports OLS estimates that do not con-trol for country-specific effects and thus assume that all parametersare constant across cross-sectional units. The second column presentsfixed-effect (FE) estimates, which account for country-specific ef-fects, allowing for the constant term to differ across countries system-atically. Both specifications include fixed time effects. The joint testof the time effects reveals that the time effects are significant; how-ever, ignoring the time effects has no significant effect on the esti-mates. The estimated coefficient of the lagged dependent variable ismuch smaller than the pooled-OLS estimate, a result that accords withthe theoretical prediction. The bias in the coefficient of the lagged de-pendent variable goes in opposite direction in these specifications(Nerlove 2000). While pooled-OLS yields an upward-biased estimateof the lagged dependent variable, the FE estimate is downward-bi-ased. That is, these estimators define lower and upper bounds for theunbiased coefficient of the lagged dependent variable. The estimatesrange from between 0.35 and 0.79, so the unbiased estimate should liein between these limits. As seen from the table, the results from thepooled-OLS and the FE regressions appear to be considerably differ-ent. An F test is performed to test whether the differences in constantterms capture the differences across countries. The calculated F ratiowith 18 and 278 degrees of freedom is 7.11, while the critical F valuesare 2.07 and 1.67 at 1 and 5 percent levels, respectively, which sug-gests that the hypothesis of a common constant term across countriesshould be rejected. The F test shows that the panel is not sufficientlyhomogeneous across countries to use the pooled-OLS estimator. Ac-cordingly, the FE is preferred to the pooled-OLS when comparingonly these two estimators. Also it is worth noting that the Lagrange
588 PUBLIC FINANCE REVIEW

589
TAB
LE
1:
Det
erm
inan
ts o
f P
riva
te In
vest
men
t in
Dev
elo
pin
g C
ou
ntr
ies
Bal
ance
d S
ampl
e:19
82-1
997;
Num
ber
of C
ount
ries:
19
Dep
ende
nt V
aria
ble:
Rea
l Priv
ate
Inve
stm
enta
Poo
led-
OLS
Fix
ed E
ffect
Ran
dom
Effe
ctS
YS
-2S
LS
b
Con
stan
t–0
.399
(0.
174)
**—
–0.0
58 (
0.03
7)—
∆ex
pect
ed r
eal G
DP
a,c
1.27
1 (0
.591
)**
1.20
9 (0
.327
)***
1.29
7 (0
.199
)***
1.76
4 (0
.441
)***
Rea
l pub
lic in
vest
men
ta0.
115
(0.0
62)*
0.23
1 (0
.094
)**
0.00
7 (0
.014
)0.
204
(0.0
7)**
*R
eal i
nter
est r
ate
–0.1
67 (
0.21
5)–0
.024
(0.
179)
–0.0
83 (
0.12
8)–0
.188
(0.
308)
Rea
l cre
dita
0.11
5 (0
.045
)**
0.30
(0.
091)
***
0.01
5 (0
.012
)0.
291
(0.0
61)*
**E
cono
mic
free
dom
0.02
0 (0
.021
)–0
.082
(0.
053)
–0.0
001
(0.0
06)
–0.0
22 (
0.03
4)U
ncer
tain
tyd
–0.0
31 (
0.01
8)*
–0.0
24 (
0.01
1)**
–0.0
32 (
0.01
1)**
*–0
.036
(0.
015)
**La
gged
priv
ate
inve
stm
enta
0.78
5 (0
.085
)***
0.34
8 (0
.084
)***
0.98
2 (0
.013
)***
0.54
9 (0
.054
)***
Tota
l pan
el o
bser
vatio
ns30
430
430
430
4A
djus
ted
R2
.996
.997
0.99
5N
AW
ald
p-va
lue
all r
egre
ssor
s—
——
.000
S.C
.1 L
M (
chi-s
quar
ed)e
0.47
1.85
—1.
17S
.C.2
LM
(ch
i-squ
ared
)e3.
754.
09—
4.11
Poo
ling
F-s
tatis
tic7.
11**
*—
——
(con
tinu
ed)
590
Hau
sman
(W
ald
stat
istic
)—
87.5
8***
——
Sar
gan
test
(p-
valu
e)—
——
.324
Tim
e ef
fect
(F
-sta
tistic
)2.
10**
*4.
41**
*—
—
NO
TE
:OLS
=or
dina
ryle
asts
quar
es.S
YS
-2S
LS=
syst
emtw
o-st
age
leas
tsqu
ares
.Fig
ures
inpa
rent
hese
sar
ehe
tero
sced
astic
ityco
nsis
tent
stan
-da
rd e
rror
s ex
cept
for
the
SY
S-2
SLS
.The
bol
d co
lum
n sh
ows
the
pref
erre
d sp
ecifi
catio
ns.
a.E
xpre
ssed
in lo
garit
hms.
b.In
stru
men
ts a
re th
e tw
ice-
lagg
ed v
alue
s of
all
regr
esso
rs.
c.∆
expe
cted
GD
P=
[ Ye t–
(1–
0.00
)Ye t–
1)w
here
depr
ecia
tion
rate
sar
ech
osen
tobe
0pe
rcen
tand
Ye
isth
epr
edic
ted
valu
esob
tain
edfr
omes
ti-m
atin
ga
univ
aria
tefir
st-o
rder
auto
regr
essi
ve(A
R[1
])pr
oces
sfo
rrea
lGD
Pfo
reac
hco
untr
y,w
hich
are
take
nto
repr
esen
tthe
expe
cted
real
GD
P.T
he d
efin
ition
of t
his
varia
bles
is th
e sa
me
in a
ll ta
bles
.d.
Firs
tprin
cipa
lcom
pone
ntof
the
cond
ition
alva
rianc
esof
the
log
ofre
alex
chan
gera
te,i
nfla
tion
rate
,and
grow
thra
teob
tain
edfr
oma
univ
aria
tege
nera
lized
auto
regr
essi
veco
nditi
onal
hete
rosc
edas
ticity
spec
ifica
tion
(GA
RC
H)(
1,1)
proc
ess
for
each
coun
try
isus
edas
asu
mm
ary
prox
yfo
run
cert
aint
y.T
he d
efin
ition
of t
he u
ncer
tain
ty is
the
sam
e in
all
tabl
es.
e.S
.C.1
LM
and
S.C
.2 L
M s
how
the
Lagr
ange
mul
tiplie
r (L
M)
test
sta
tistic
s fo
r th
e fir
st-
and
seco
nd-o
rder
ser
ial c
orre
latio
n, r
espe
ctiv
ely.
*10
perc
ent s
igni
fican
ce le
vel.
**5
perc
ent s
igni
fican
ce le
vel.
***1
per
cent
sig
nific
ance
leve
l.
TAB
LE
1 (
con
tinu
ed)
Bal
ance
d S
ampl
e:19
82-1
997;
Num
ber
of C
ount
ries:
19
Dep
ende
nt V
aria
ble:
Rea
l Priv
ate
Inve
stm
enta
Poo
led-
OLS
Fix
ed E
ffect
Ran
dom
Effe
ctS
YS
-2S
LS
b

multiplier (LM) tests are performed for first- and second-order serialcorrelation, which reveals the absence of these problems in the datasample.
Another approach to the specification of the country-specific ef-fects is to assume that they are random and thus contribute to the over-all variance of the error term. The third column reports the random ef-fect estimates (RA). The signs and magnitudes of the RA estimates areconsiderably different from those of the FE and pooled-OLS. How-ever, as noted earlier, if the country-specific effects are correlated withthe regressors, the RA estimator is inefficient and inconsistent whilethe FE estimator is consistent. To test the efficiency of the RA esti-mates, Hausman and Taylor (1981) suggested a comparison of the RAand FE estimates. If the differences in the coefficients are random,then the country-specific effects are uncorrelated with the regressors,and hence the RA estimates are consistent and efficient. The Wald ra-tio (with 7 degrees of freedom) is 87.6, so the hypothesis that countryspecific effects are uncorrelated with the regressors is rejected at anyconventional level of significance. As a consequence, the RA esti-mates are unreliable. In this case, the country-specific effects need tobe treated as fixed. However, in panels with a finite time horizon, theFE model yields inconsistent estimates due to the use of the lagged de-pendent variable as a regressor (called Nickell bias; see Nickell 1981).Similarly, although efficient, the pooled-OLS estimates are inconsis-tent and potentially biased because they ignore the country-specificeffects that may be correlated with the right-hand-side variables.Therefore, the next step is to address the source of bias andinconsistency by performing an instrumental variables procedure.
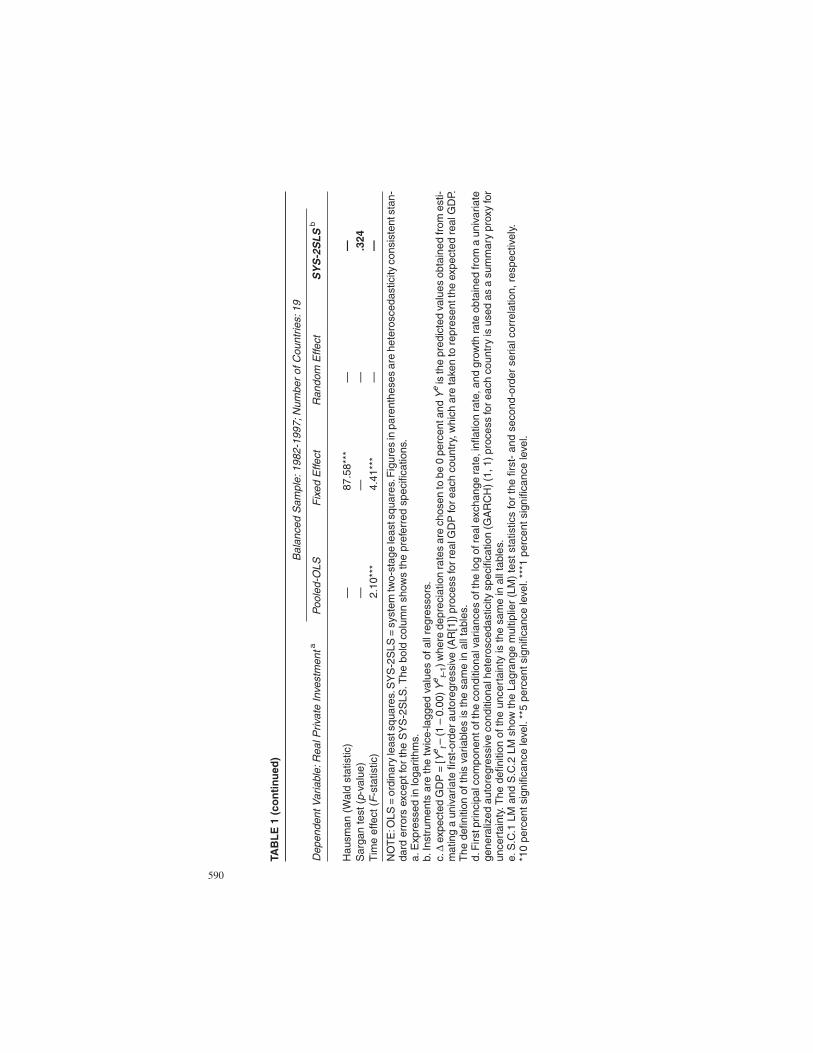
The fourth column of Table 1 reports system two-stage leastsquares estimates (SYS-2SLS) which relaxes the assumption that theexplanatory variables are exogenous and thus attempts to correct forboth the simultaneity bias (endogeneity problem) and the bias comingfrom the correlation between the country-specific effects and theregressors. The SYS-2SLS regression assumes that all right-hand-side variables are endogenous and instruments for them by theirtwice-lagged values. As seen from the fourth column, the estimatedcoefficient of the lagged dependent variable is 0.55, which lies be-tween bounds estimated by the FE and pooled-OLS. However, in the
Erden, Holcombe / THE EFFECTS OF PUBLIC INVESTMENT 591

presence of second-order serial correlation in the errors across thetime dimension of the panel, the twice-lagged values cannot be usedas instruments. Thus, an LM test is performed, which indicates the ab-sence of second-order autocorrelation. Also the Sargan test that evalu-ates the orthogonality between the instruments and residuals is carriedout for the validity of the instruments employed. The test involves thenull of optimal instruments against the alternative of nonoptimal in-struments. The test statistics and the related p-values of these tests arepresented at the bottom panel of Table 1. According to the LM andSargan tests, we fail to reject the nulls of both no second-order serialcorrelation and optimal instruments. Thus, these results provide sup-port for the validity of the instruments. It is also worth noting that theuse of instruments despite their validity results in inefficient esti-mates; however, because the instrumental variable technique yieldsunbiased and consistent estimates, the SYS-2SLS is chosen as the pre-ferred specification (the bold column of Table 1). Therefore, theresults will be interpreted by focusing on the SYS-2SLS estimates,but comparing these results to the other pooled specifications.
As seen from the fourth column, the signs of the coefficients on theconventional determinants are consistent with the theoretical expecta-tions. The estimated coefficient of expected GDP is quite large andsignificant, indicating the presence of a strong accelerator effect in thedeveloping economies. This result is found in virtually all previousstudies. Recall that expected GDP represents the first term in the mod-ified accelerator model, which is [Ye
i,t – (1 – 0) Yei,t–1], where the depre-
ciation rates, δi, are chosen to be zero and expected GDP is the pre-dicted values obtained from fitting an AR(1) process of the logarithmof real GDP separately for each country. However, using real GDP in-stead of expected GDP or a 5 percent depreciation rate instead of 0 haslittle effect on the estimates. Furthermore, while the coefficient on realcredit available to the private sector is significantly positive, the coef-ficient on the real interest rate has the correct sign but is insignificant,which reinforces the findings of earlier studies that the availability ofcredit rather than the cost of financing investment projects is morebinding in developing countries.
Regardless of the econometric specification employed, the resultsalso indicate that the impact of public investment on private invest-
592 PUBLIC FINANCE REVIEW

ment is positive and significant, implying that public investment stim-ulates private investment in developing countries. Interpreting the co-efficient from the SYS-2SLS specification, holding everything elseconstant, a 10 percent increase in public investment increases privateinvestment by a 2.04 percent. Overall, there is strong evidence in favorof a complementary relationship between public capital formationand private investment, which is in agreement with the finding ofGreene and Villaneuva (1991), Ramirez (1994), and Oshikoya(1994).
The coefficient on lagged private investment shows the speed of ad-justment, implying that the gap between the actual and desired levelsof private investment closes by 45 percent within a year. The resultsregarding the summary measure of uncertainty are quite robust acrossdifferent pooled specifications. This measure of macroeconomic un-certainty has a negative impact, and the magnitude of this effect is ap-proximately the same (–0.03) in all pooled specifications. The impactof institutional differences, as measured by the economic freedomvariable, is insignificant in all specifications. This may result from thepresence of the other regressors such as expected GDP, the availabilityof credit to the private sector, and government investment that may behighly correlated with the economic freedom index, obscuring anyeffect that the economic freedom measure might have on the privateinvestment.
The results consistently indicate that public investment has a posi-tive and significant impact on private investment in developing coun-tries. The signs of the significant variables all go in the expected direc-tion and show that in all specifications, macroeconomic uncertaintyhas a negative impact on private investment. The interest rate is notsignificant, but credit availability to the private sector is, suggestingthat credit availability exerts a binding constraint on private invest-ment that makes the cost of financing less important in explainingcross-country differences. This result may also indicate that the realinterest rate might be a poor proxy for the user cost of capital in viewof severe controls over nominal interest rates often imposed by gov-ernments in developing countries, in which case real interest ratesreflect merely the changes in inflation rates.
Erden, Holcombe / THE EFFECTS OF PUBLIC INVESTMENT 593

5.3. RESULTS FROM THE SAMPLE OF INDUSTRIAL COUNTRIES
The same empirical model is applied to the panel of industrialcountries to see whether private investment in developing and indus-trial countries responds differently to the same variables. There is onedifference in the specification. Because of the structure of the finan-cial sector in developing economies, the empirical model for develop-ing countries includes the availability of private sector credit as one ofthe standard determinants. The rationale behind the inclusion of creditavailability is that the quantity of external funds is more binding thanthe cost of funds, because of the absence of well-functioning financialmarkets in most developing countries. However, these same quantityconstraints are unlikely to be present in developed economies, so thecost of capital plays the rationing role in developed economies. There-fore, credit availability is not included in the model applied to thesample of industrial countries.
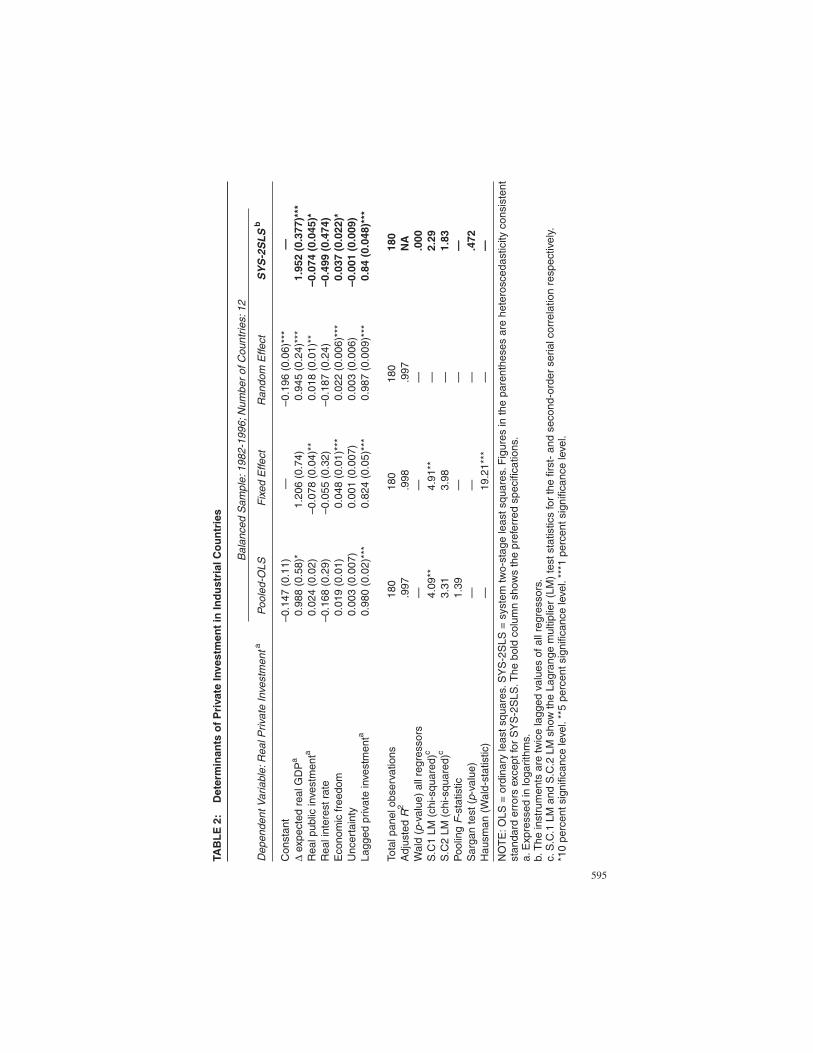
Various pooled specifications of the model are estimated using apanel of twelve industrial countries over the periods 1982 to 1996. Ta-ble 2 reports the results. Once again, the Hausman-Taylor test revealsthat the country-specific effects are correlated with the right-hand-side variables. Thus, both the pooled-OLS and random effect specifi-cations are inconsistent. Furthermore, the fixed effect estimates arealso inconsistent and potentially biased because of the presence of thelagged dependent variable as a regressor. The LM tests indicate thepresence of the first order serial correlation problem in both pooled-OLS and FE specifications. Given this and the problems mentionedbefore, we once again turn the focus on the SYS-2SLS estimator. In aneffort to correct for the correlation between country effects and theregressors, and for the endogeneity problem, the SYS-2SLS regres-sion instruments for all regressors by their twice-lagged values. TheLM test indicates the absence of either first- or second-order serialcorrelation, and the Sargan test reveals that instrumentation is opti-mal, supporting the validity of the instruments. The results of thesetests are reported at the bottom panel of Table 2. Overall, even thoughthe FE and SYS-2SLS estimates are fairly similar, the SYS-2SLS isthe preferred specification because it yields consistent and unbiasedestimates, and is free of the first- or second-order serial correlationproblems.
594 PUBLIC FINANCE REVIEW
595
TAB
LE
2:
Det
erm
inan
ts o
f P
riva
te In
vest
men
t in
Ind
ust
rial
Co
un
trie
s
Bal
ance
d S
ampl
e:19
82-1
996;
Num
ber
of C
ount
ries:
12
Dep
ende
nt V
aria
ble:
Rea
l Priv
ate
Inve
stm
enta
Poo
led-
OLS
Fix
ed E
ffect
Ran
dom
Effe
ctS
YS
-2S
LS
b
Con
stan
t–0
.147
(0.
11)
—–0
.196
(0.
06)*
**—
∆ex
pect
ed r
eal G
DP
a0.
988
(0.5
8)*
1.20
6 (0
.74)
0.94
5 (0
.24)
***
1.95
2 (0
.377
)***
Rea
l pub
lic in
vest
men
ta0.
024
(0.0
2)–0
.078
(0.
04)*
*0.
018
(0.0
1)**
–0.0
74 (
0.04
5)*
Rea
l int
eres
t rat
e–0
.168
(0.
29)
–0.0
55 (
0.32
)–0
.187
(0.
24)
–0.4
99 (
0.47
4)E
cono
mic
free
dom
0.01
9 (0
.01)
0.04
8 (0
.01)
***
0.02
2 (0
.006
)***
0.03
7 (0
.022
)*U
ncer
tain
ty0.
003
(0.0
07)
0.00
1 (0
.007
)0.
003
(0.0
06)
–0.0
01 (
0.00
9)La
gged
priv
ate
inve
stm
enta
0.98
0 (0
.02)
***
0.82
4 (0
.05)
***
0.98
7 (0
.009
)***
0.84
(0.
048)
***
Tota
l pan
el o
bser
vatio
ns18
018
018
018
0A
djus
ted
R2
.997
.998
.997
NA
Wal
d (p
-val
ue)
all r
egre
ssor
s—
——
.000
S.C
1 LM
(ch
i-squ
ared
)c4.
09**
4.91
**—
2.29
S.C
2 LM
(ch
i-squ
ared
)c3.
313.
98—
1.83
Poo
ling
F-s
tatis
tic1.
39—
——
Sar
gan
test
(p-
valu
e)—
——
.472
Hau
sman
(W
ald-
stat
istic
)—
19.2
1***
——
NO
TE
:OLS
=or
dina
ryle
asts
quar
es.S
YS
-2S
LS=
syst
emtw
o-st
age
leas
tsqu
ares
.Fig
ures
inth
epa
rent
hese
sar
ehe
tero
sced
astic
ityco
nsis
tent
stan
dard
err
ors
exce
pt fo
r S
YS
-2S
LS.T
he b
old
colu
mn
show
s th
e pr
efer
red
spec
ifica
tions
.a.
Exp
ress
ed in
loga
rithm
s.b.
The
inst
rum
ents
are
twic
e la
gged
val
ues
of a
ll re
gres
sors
.c.
S.C
.1 L
M a
nd S
.C.2
LM
sho
w th
e La
gran
ge m
ultip
lier
(LM
) te
st s
tatis
tics
for
the
first
- an
d se
cond
-ord
er s
eria
l cor
rela
tion
resp
ectiv
ely.
*10
perc
ent s
igni
fican
ce le
vel.
**5
perc
ent s
igni
fican
ce le
vel.
***1
per
cent
sig
nific
ance
leve
l.

As seen from the last column (SYS-2SLS), the signs of the standardvariables are as expected. The results indicate that while there is astrong accelerator effect on real output, the real interest rate is nega-tive, but insignificant. Public investment has a significant and negativeeffect on private investment. The magnitude of the coefficient is –0.074,implying that a 10 percent increase in public investment leads to a 0.7percent decrease in private investment in industrial countries. This re-sult appears to be consistent with the findings of Erenburg and Wohar(1995) for the U.S. case. They found that, using the securities valua-tion (or Tobin’s q) model of private investment, public investmentspending has a negative effect, although using the accelerator modeland the neoclassical model, there is no effect of public investment onprivate investment.
The results also show that the effect of economic freedom is signifi-cantly positive, and that a 1-index-point increase in economic free-dom affects private investment by approximately 0.04 percent, lead-ing to the conclusion that economic freedom plays a significant role indetermining private investment activities in industrial countries. Thesummary measure of uncertainty is found insignificant in all specifi-cations. Finally, the estimated coefficient of the lagged dependentvariable is 0.84, which suggests that actual private investment adjuststo its desired level by 16 percent within a year. The estimated speed ofadjustment is rather lower than the one found in developing countries.This means that private investment in developing countries adjustsmore rapidly to its long-run level than in industrial countries.
The reason for running the same empirical models for developingand developed economies was to see if the determinants of private in-vestment were similar regardless of the stage of development, and thecomparison has uncovered some interesting differences. Economicfreedom has a statistically significant effect in developed nations, butnot in developing nations. In addition, uncertainty has a negative im-pact in developing economies, but not in developed economies. Mostimportant for present purposes, public investment has a positive im-pact on private investment in developing economies, but a negativeimpact on private investment in developed economies. Thus, theredoes appear to be empirically relevant differences in the determinantsof private investment depending upon the level of development.
596 PUBLIC FINANCE REVIEW

6. CONCLUSION
The existing literature offers inconsistent conclusions on the im-pact of public investment on private investment in developing econo-mies, with some studies suggesting that public investment stimulatesprivate investment (Greene and Villanueva 1991; Ramirez 1994;Odedokun 1997; Ramirez 2000; Blejer and Khan 1984; Oshikoya1994) and others suggesting that public investment crowds out privateinvestment (Wai and Wong 1982; Nazmi and Ramirez 1997). This ar-ticle examines that question using a sample of nineteen developingeconomies from various parts of the world and compares that sampleof developing economies with a group of twelve developed econo-mies to look for similarities and differences in the impact of public in-vestment on private investment. The empirical results suggest thatpublic investment has a positive impact on private investment in de-veloping economies. The results for the sample of developing coun-tries indicate that a 10 percent increase in public investment wouldincrease private investment by about 2 percent.
The comparison of developed economies with developing econo-mies in the same empirical framework offers some interesting insightsinto the nature of private investment in developing economies. In de-veloping economies, where there are often constraints to obtainingcapital in addition to just the cost of capital, the interest rate was not astatistically significant determinant of private investment, whereas theavailability of credit showed a consistently positive effect on invest-ment. In developing economies, because of credit controls and otherimperfections in the credit market, private investment appears to beconstrained by a lack of funds available to be borrowed. Quantity con-straints may be why the interest rate does not show up as a statisticallysignificant determinant of investment, but government-controlled in-terest rates, or high and uncertain inflation rates, may also contributein some countries. The constraining impact of real credit availabilityin developing economies shows that there are significant differencesin capital markets in developed and developing economies. For devel-oping economies to enjoy the same level of prosperity as developedeconomies, not only is more investment required, but capital marketsmust be developed to allow the market allocation of private investment.
Erden, Holcombe / THE EFFECTS OF PUBLIC INVESTMENT 597

Whereas the developing economies showed a consistently positiveimpact of public investment on private investment, public investmenthad a negative impact on private investment in developed economies.Again, this shows important structural differences between developedand developing economies. In developed economies, public invest-ment may be competing with private investment, but more likely, thenegative impact is due to the effect of a larger public sector, whichtends to lower private sector productivity (Gwartney, Lawson, andHolcombe 1999; Gwartney, Lawson, and Samida 2000). Private in-vestment in developing economies, in contrast, is positively corre-lated with the level of public investment. This may be because publicinvestment provides infrastructure that is complementary to privateinvestment, that public investment provides a stabilizing influence onthe economy, or even that it provides information on investment pro-ductivity for private investors. The aggregated investment data used inthis article do not allow a more detailed examination of the reasonswhy developed economies differ from developing economies in thisregard, but it is significant to note that public investment has theopposite effect on private investment depending on the level ofdevelopment.
These results show that in a number of important ways, private in-vestment in developed economies is influenced by different factorsthan private investment in developing economies. Because of thesedifferences, one cannot expect that policies that succeed at stimulatingcapital formation in developed economies will translate well to devel-oping economies. Capital markets in particular appear to have differ-ent characteristics, so that would be a key area to focus on when con-sidering policies that might stimulate private investment indeveloping nations.
598 PUBLIC FINANCE REVIEW

599
AP
PE
ND
IXD
escr
ipti
on o
f V
aria
bles
and
Dat
a So
urce
s
Con
stru
ctio
n of
Var
iabl
esD
ata
Sou
rces
Sam
ple
ofS
ampl
e of
Sam
ple
ofS
ampl
e of
Var
iabl
eD
evel
opin
g C
ount
ries
Indu
stria
l Cou
ntrie
sD
evel
opin
g C
ount
ries
Indu
stria
l Cou
ntrie
s
Y(r
eal G
DP
)aN
omin
al G
DP
/GD
P d
efla
tor
Inte
rnat
iona
l Fin
anci
al S
tatis
tics
(IF
S),
line
s 99
b, 9
9bi
GI(
real
gro
ssR
atio
of g
ross
Gov
ernm
ent c
apita
lIn
tern
atio
nal F
inan
ceG
over
nmen
t Fin
ance
Sta
tistic
spu
blic
inve
stm
ent)
publ
ic in
vest
men
t to
expe
nditu
res
Cor
pora
tion
(IF
C)
(GF
S),
Tab
le C
line
IVG
DP
* r
eal G
DP
PI(
real
gro
ss p
rivat
eR
atio
of g
ross
Tota
l gro
ss fi
xed
IFC
IFS
, lin
e 93
e;an
d G
FS
inve
stm
ent)
priv
ate
inve
stm
ent t
oca
pita
l for
mat
ion
GD
P *
rea
l GD
Pm
inus
GI
Ban
k cr
edit
Nom
inal
ban
k cr
edit/
GD
P d
efla
tor
IFS
, lin
e 32
dU
ncer
tain
tyT
he fi
rst p
rinci
pal c
ompo
nent
s of
the
cond
ition
alm
easu
reva
rianc
es o
f the
rat
es o
f inf
latio
n, r
eal G
DP,
rea
lex
chan
geIn
flatio
n ra
teb
The
ann
ual d
iffer
ence
in th
e lo
gs o
f the
cou
ntry
’sC
PIs
from
IFS
, lin
e 64
CP
IR
eal G
DP
gro
wth
The
ann
ual d
iffer
ence
in th
e lo
g of
rea
l GD
Pra
teR
eal e
xcha
nge
rate
Log
(exc
hang
e ra
te *
[CP
I US/C
PI])
Exc
hang
e ra
tes
from
IFS
, lin
e ae
Cos
t of c
apita
l (re
alLo
g [(
1 +
nom
inal
inte
rest
)/(1
+ in
flatio
n)]
Nom
inal
inte
rest
rat
es fr
om IF
S, l
ines
60b
,60l
, 60
inte
rest
rat
e)c
Inst
itutio
ns (
Eco
nom
icF
ive-
year
seq
uenc
es a
re tr
ansf
orm
ed in
toA
nnua
l Rep
ort o
f Eco
nom
ic F
reed
om o
f the
Wor
ldFr
eedo
m In
dex)
annu
al o
bser
vatio
ns b
y in
terp
olat
ing
a.F
or T
urke
y on
ly, t
he d
ata
on n
omin
al G
DP
and
GD
P d
efla
tor
are
take
n fr
om th
e na
tiona
l dat
a so
urce
s (S
tate
Pla
nnin
g O
rgan
izat
ion
1997
).b.
Due
toth
eun
avai
labi
lity
ofco
mpl
ete
data
onC
PIf
orB
angl
ades
han
dTu
nisi
a,G
DP
defla
tora
ndP
rodu
cerP
rice
Inde
x(P
PI)
are
used
resp
ectiv
ely
for
thos
e co
untr
ies.
c.T
hede
finiti
ons
ofin
tere
stra
tes
are
diffe
rent
acro
ssco
untr
ies
due
toth
ela
ckof
avai
labl
eda
ta.T
heem
piric
alm
odel
uses
the
mon
eym
arke
t(co
m-
mer
cial
bank
)rat
efo
rInd
ia,M
alay
sia,
Mau
ritiu
s,P
akis
tan,
Tha
iland
,and
Sou
thA
fric
a;de
posi
trat
esfo
rBan
glad
esh,
Bel
ize,
Chi
le,G
uate
mal
a,K
o-re
a,M
alaw
i,M
exic
o,P
hilip
pine
s,Tu
rkey
,Uru
guay
,Aus
tria
,Bel
gium
,Ger
man
y,Ir
elan
d,N
ethe
rland
s,S
pain
,Sw
eden
,and
the
Uni
ted
Kin
gdom
;dis
-co
unt r
ates
for
Col
ombi
a, C
osta
Ric
a, E
cuad
or, K
enya
, and
Tun
isia
;and
dep
osit
rate
s fo
r F
inla
nd, F
ranc
e, G
reec
e, a
nd P
ortu
gal.
REFERENCES
Abel, Andrew B. 1983. Optimal investment under uncertainty. American Economic Review73:228-33.
bel, Andrew B., and Janice C. Eberly. 1995. The effect of irreversibility and uncertainty on capi-tal accumulation. NBER Working Paper Series no. 5363. Cambridge, MA: National Bureauof Economic Research.
Aizenman, Joshua, and Nancy Marion. 1996. Volatility and the investment response. NBERWorking Paper Series no. 5841. Cambridge, MA: National Bureau of Economic Research.
Aschauer, David A. 1989a. Is public expenditure productive? Journal of Monetary Economics23:177-200.
. 1989b. Public investment and productivity growth in the Group of Seven. Economic Per-spectives 13:17-25.
. 1990. Why is infrastructure important? In Is there a shortfall in public capital invest-ment? ed. Alicia Munnell. Boston: Conference Series of Federal Reserve Bank of Boston.
Barth, James R., and Joseph J. Cordes. 1980. Substitutability, complementarity, and the impactof government spending on economic activity. Journal of Economics and Business 32 (3):235-42.
Bernanke, Ben S. 1983. Irreversibility, uncertainty and cyclical investment. Quarterly Journal ofEconomics 98:85-106.
Besley, Timothy J. 1995. Property rights and investment incentives: Theory and evidence fromGhana. Journal of Political Economy 103 (5): 903-37.
Blejer, Mario, and Mohsin Khan. 1984. Government policy and private investment in developingcountries. IMF Staff Papers 31:379-403.
Bouton, Lawrence, and Marisurz A. Sumlinski. 2000. Trends in private investment in developingcountries: Statistics for 1970-1998. International Finance Corporation Discussion Paper no.41. Washington, DC: World Bank.
Caballero, Ricardo J. 1991. On the sign of the investment-uncertainty relationship. AmericanEconomic Review 81:279-88.
Cashin, Paul. 1995. Government spending, taxes, economic growth. IMF Staff Papers 42 (2):237-69.
Dawson, John W. 1998. Institutions, investment and growth: New cross-country and panel dataevidence. Economic Inquiry 36 (4): 603-19.
De Haan, Jakop, and Clemens L. Siermann. 1998. Further evidence on the relationship betweeneconomic freedom and economic growth. Public Choice 95:363-80.
Dehn, Jan. 2000. Private investment in developing countries: The effects of commodity shocksand uncertainty. University of Oxford Working Paper Series no. 11. Oxford: OxfordUniversity Press.
Dixit, Avinash, and Robert S. Pindyck. 1994. Investment under uncertainty. Princeton, NJ:Princeton University Press.
Erenburg, Sharon J., and Mark E. Wohar. 1995. Public and private investment: Are there casuallinkages? Journal of Macroeconomics 17 (1): 1-30.
Evans, Paul, and Gregorios Karras. 1994. Are government activities productive? Evidence froma panel of U.S. states. Review of Economics and Statistics 76 (1): 1-11.
Goldberg, Linda S. 1993. Exchange rates and investment in United States industry. Review ofEconomics and Statistics 75:575-89.
Greene, Joshua, and Delano Villanueva. 1991. Private investment in developing countries: Anempirical analysis IMF Staff Paper 38 (1): 33-58.
600 PUBLIC FINANCE REVIEW

Guncavdi, Oner, Michael Bleaney, and Andrew McKay. 1998. Financial liberalization and pri-vate investment: Evidence from Turkey. Journal of Development Economics 57:443-55.
Gwartney, James D., Robert A. Lawson, and Randall G. Holcombe. 1999. Economic freedomand environment for economic growth. Journal of Institutional and Theoretical Economics155:643-63.
Gwartney, James D., Robert A. Lawson, and Dexter Samida. 2000. Economic freedom of theworld: 2000 report. Vancouver, Canada: Fraser Institute.
Hartman, Richard. 1972. The effects of price and cost uncertainty on investment. Journal of Eco-nomic Theory 5:258-66.
Hausman, Jerry, and William Taylor. 1981. Panel data and unobservable individual effects.Econometrica 49:1377-98.
Holtz-Eakin, Douglas. 1994. Public-sector capital and productivity puzzle. Review of Economicsand Statistics 76 (1): 12-21.
Hsiao, Cheng, Kajal Lahiri, Lung-fei Lee, and M. Hashem Pesaran. 2000. Analysis of panels andlimited variable models. Cambridge: Cambridge University Press.
International Monetary Fund. 1985, 1989, 1994, 1999. Government finance statistics yearbook.Washington, DC: International Monetary Fund.
. 1999, 2000. International financial statistics yearbook. Washington, DC: InternationalMonetary Fund.
Khan, Mohsin, and Manmohan S. Kumar. 1997. Public and private investment and the growthprocess in developing countries. Oxford Bulletin of Economics and Statistics 59:69-88.
Khan, Mohsin, and Carmen M. Reinhart. 1990. Private investment and economic growth in de-veloping countries. World Development 18 (1): 19-27.
Munnell, Alicia H. 1990. Why has productivity growth declined? Productivity and public invest-ment. New England Economic Review, January/February, pp. 3-22.
Nazmi, Nader, and Miguel D. Ramirez. 1997. Public and private investment and economicgrowth in Mexico. Contemporary Economic Policy 15 (1): 65-75.
Nerlove, Marc. 2000. Properties of alternative estimators of dynamic panel models: An empiri-cal analysis of cross-country data for the study of economic growth. In Analysis of panels andlimited variable models, ed. Cheng Hsiao, Kajal Lahiri, Lung-fei Lee, and Hashem M.Pesaran. Cambridge: Cambridge University Press.
Nickell, Stephen J. 1981. Biases in dynamic models with fixed effects. Econometrica 49:1417-26.
Odedokun, Matthew O. 1997. Relative effects of public versus private investment spending oneconomic efficiency and growth in developing countries. Applied Economics 29:1325-36.
Oshikoya, Temitope W. 1994. Macroeconomic determinants of domestic private investment inAfrica: An empirical analysis. Economic Development and Cultural Change 42:573-96.
Pindyck, Robert S. 1991. Irreversibility, uncertainty and investment. Journal of Economic Liter-ature 29 (3): 1110-48.
Price, Simon. 1996. Aggregate uncertainty, investment and asymmetric adjustment in the UKmanufacturing sector. Applied Economics 28:1369-79.
Ramirez, Miguel D. 1994. Public and private investment in Mexico, 1950-90: An empirical anal-ysis. Southern Economic Journal 61 (1): 1-17.
. 2000. The impact of public investment on private investment spending in Latin Amer-ica: 1980-95. Atlantic Economic Journal 28 (2): 210-25.
Salmon, Mark. 1982. Error correction mechanisms. Economic Journal 92:615-29.Scully, Gerald W., and David J. Slottje. 1991. Ranking economic liberty across countries. Public
Choice 69 (2): 121-52.
Erden, Holcombe / THE EFFECTS OF PUBLIC INVESTMENT 601
Serven, Luis. 1998. Macroeconomic uncertainty and private investment in LDCs: An empiricalinvestigation. Mimeograph, World Bank, Washington, DC.
State Planning Organization. 1997. Economic and social indicators: 1950-1997. Ankara, Tur-key: State Planning Organization.
Tatom, John. A. 1991. Public capital and private sector performance. Federal Reserve Bank of St.Louis Review 73 (3): 3-15.
Vamvakidis, Athanasios. 1998. Explaining investment in the WAEMU. IMF Working Paper no99. Washington, DC: International Monetary Fund.
Wai, U. Tun, and Chorng-huey Wong. 1982. Determinants of private investment in developingcountries. Journal of Development Studies 19:19-36.
Lutfi Erden received his Ph.D. in economics from Florida State University in 2002. Heworks as an instructor in the Department of Economics at Hacettepe University in An-kara, Turkey. His primary research interests are applied econometrics, public finance,and international trade and finance.
Randall G. Holcombe is DeVoe Moore Professor of Economics at Florida State Univer-sity. He received his Ph.D. in economics from Virginia Tech and was on the economicsfaculties at Texas A&M University and Auburn University before taking his present posi-tion in 1988. He is the author of ten books and more than one hundred articles in aca-demic journals. His main areas of research interest are public finance and public choice.
602 PUBLIC FINANCE REVIEW

![Chapter 6a Revision of Mechanics Basics Dr. Lutfi … › › archived › site › ...2012/07/06 · Attributed to: [Dr. Lutfi R. Al-Sharif] Page 3 of 16 Throughout this course we](https://static.fdocuments.in/doc/165x107/5f12cd0f8abddc55476a702a/chapter-6a-revision-of-mechanics-basics-dr-lutfi-a-a-archived-a-site-a.jpg)