LUPIN LIMITED Lupin –Awards and Accolades • Forbes Global 2000, FY 2017 • Lupin ranked No.1 in...
16
LUPIN LIMITED Q3 FY18 Investor Presentation February 06, 2018
Transcript of LUPIN LIMITED Lupin –Awards and Accolades • Forbes Global 2000, FY 2017 • Lupin ranked No.1 in...

LUPIN LIMITEDQ3 FY18 Investor Presentation
February 06, 2018
Materials and information provided during this presentation may contain ‘forward-lookingstatements’. These statements are based on current expectations, forecasts and assumptions that aresubject to risks and uncertainties which could cause actual outcomes and results to differ materiallyfrom these statements.
Risks and uncertainties include general industry and market conditions, and general domestic andinternational economic conditions such as interest rate and currency exchange fluctuations. Risks anduncertainties particularly apply with respect to product-related forward-looking statements. Productrisks and uncertainties include, but are not limited to, technological advances and patents obtainedby competitors. Challenges inherent in new product development, including completion of clinicaltrials; claims and concerns about product safety and efficacy; obtaining regulatory approvals;domestic and foreign healthcare reforms; trends toward managed care and healthcare costcontainment; and governmental laws and regulations affecting domestic and foreign operations.
Also, for products that are approved, there are manufacturing and marketing risks and uncertainties,which include, but are not limited to, inability to build production capacity to meet demand,unavailability of raw materials, and failure to gain market acceptance.
You are cautioned not to place undue reliance on these forward-looking statements, which reflectour opinions only as of the date of this presentation.
The Company disclaims any intention or obligation to update or revise any forward-lookingstatements whether as a result of new information, future events, or otherwise.
Safe Harbor Statement
2
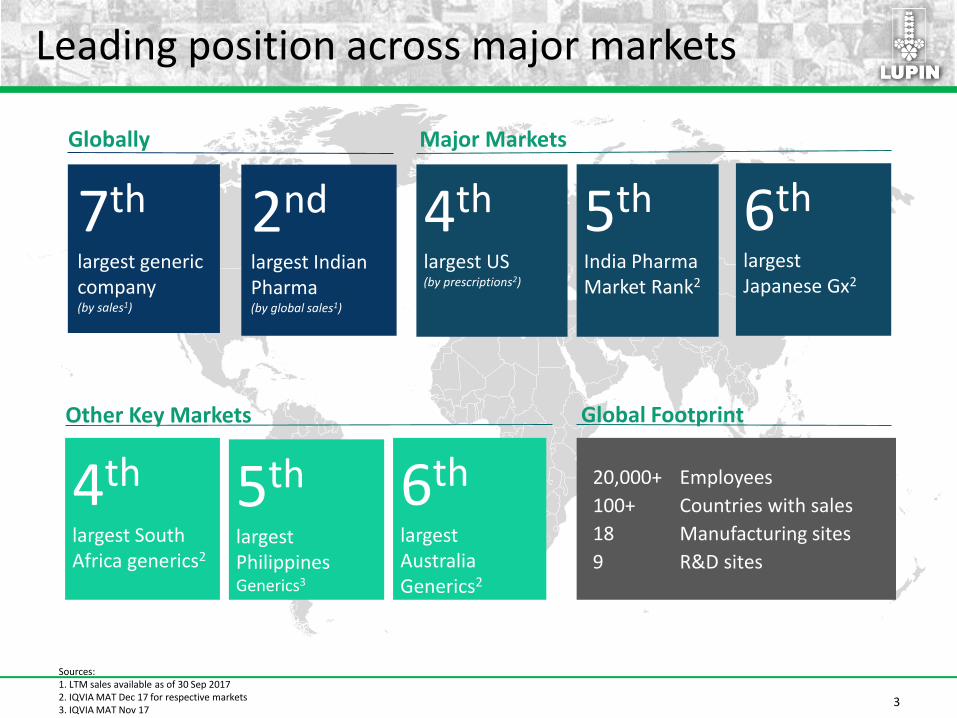
Leading position across major markets
2nd
largest Indian Pharma (by global sales1)
7th
largest generic company(by sales1)
Globally
4th
largest South Africa generics2
Other Key Markets
4th
largest US(by prescriptions2)
5th
India Pharma Market Rank2
Major Markets
6th
largest Japanese Gx2
5th
largest Philippines Generics3
6th
largest Australia Generics2
Sources:1. LTM sales available as of 30 Sep 20172. IQVIA MAT Dec 17 for respective markets3. IQVIA MAT Nov 17
20,000+ Employees
100+ Countries with sales
18 Manufacturing sites
9 R&D sites
Global Footprint
3
4
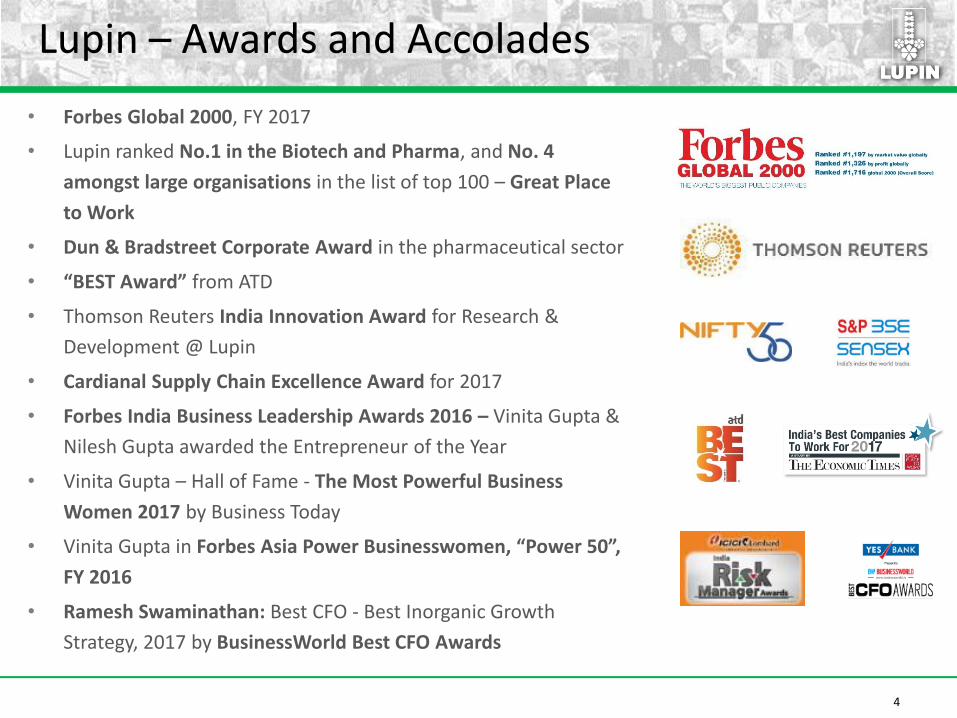
Lupin – Awards and Accolades
• Forbes Global 2000, FY 2017
• Lupin ranked No.1 in the Biotech and Pharma, and No. 4
amongst large organisations in the list of top 100 – Great Place
to Work
• Dun & Bradstreet Corporate Award in the pharmaceutical sector
• “BEST Award” from ATD
• Thomson Reuters India Innovation Award for Research &
Development @ Lupin
• Cardianal Supply Chain Excellence Award for 2017
• Forbes India Business Leadership Awards 2016 – Vinita Gupta &
Nilesh Gupta awarded the Entrepreneur of the Year
• Vinita Gupta – Hall of Fame - The Most Powerful Business
Women 2017 by Business Today
• Vinita Gupta in Forbes Asia Power Businesswomen, “Power 50”,
FY 2016
• Ramesh Swaminathan: Best CFO - Best Inorganic Growth
Strategy, 2017 by BusinessWorld Best CFO Awards

Our Strategic Direction
2016
• Primarily a Generic / Branded Generic Business
• 3 strong geographies
2017-2020
• Leading generics player with a larger complex generics mix
• Building Specialty business
• Stronger geographic spread
2020+
• Leading generics player with a significant complex generics mix
• Material Specialty business
• Leading Global player
5

P&L Highlights – Q3 FY18
Particulars (INR mn) Q3 FY18 % of sales Q3 FY17 % of salesYoY
growth Q2 FY18 % of sales
QoQ growth
Net sales 39,004 100.0% 44,049 100.0% (11.5%) 38,742 100.0% 0.7%
Other operating income 753 779 778
Total revenue 39,757 44,828 (11.3%) 39,520 0.6%
Gross margin(excl. other operating income)
25,077 64.3% 31,033 70.5% (19.2%) 25,877 66.8% (3.1%)
EBITDA 7,168 18.4% 13,219 30.0% (45.8%) 9,271 23.9% (22.7%)
EBIT 4,364 11.2% 10,910 24.8% (60.0%) 6,549 16.9% (33.4%)
Net profit 2,217 5.7% 6,331 14.4% (65.0%) 4,550 11.7% (51.3%)
6

P&L Highlights – 9M FY18
Particulars (INR mn) 9M FY18 % of net sales 9M FY17 % of net sales YoY growth
Net sales 115,814 100.0% 129,579 100.0% (10.6%)
Other operating income 2,156 2,831
Total revenue 117,970 132,410 (10.9%)
Gross margin(excl. other operating income)
76,695 66.2% 91,416 70.5% (16.1%)
EBITDA 24,442 21.1% 37,729 29.1% (35.2%)
EBIT 16,312 14.1% 31,281 24.1% (47.9%)
Net profit 10,348 8.9% 21,772 16.8% (52.5%)
7

North America
• US business registered sales of $213 mn
- Brands grew by 16% y-o-y to $25 mn
• 6 product approvals during Q3 FY18 (18
approvals in 9M FY18)
• 3 product launches in Q3 FY18 (12 product
launches in 9M FY18)
• US Market Share: No. 1 in 50 & top 3 in
107 products1
• 151 pending ANDAs
Note:1 IMS MAT Dec-17
21,755
14,321
Q3 FY2017 Q3 FY2018
(IN
R m
n)
13,611 14,321
Q2 FY2018 Q3 FY2018
(IN
R M
n)
63,620
43,950
9M FY17 9M FY18
(IN
R m
n)
8
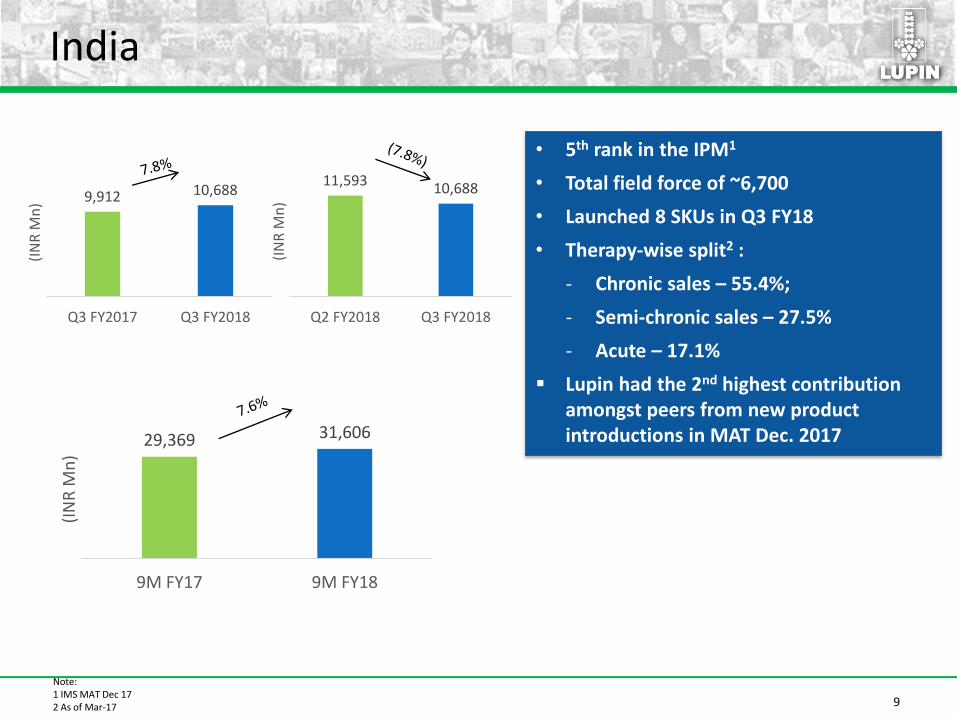
India
Note:1 IMS MAT Dec 172 As of Mar-17
• 5th rank in the IPM1
• Total field force of ~6,700
• Launched 8 SKUs in Q3 FY18
• Therapy-wise split2 :
- Chronic sales – 55.4%;
- Semi-chronic sales – 27.5%
- Acute – 17.1%
Lupin had the 2nd highest contribution amongst peers from new product introductions in MAT Dec. 2017
11,593 10,688
Q2 FY2018 Q3 FY2018
(IN
R M
n)9,912 10,688
Q3 FY2017 Q3 FY2018
(IN
R M
n)
29,369 31,606
9M FY17 9M FY18
(IN
R M
n)
9

APAC
Japan
• Japan sales grew by 34.1% y-o-y to JPY 9,711 mn during Q3 FY18
• Strengthened CNS positioning with
- Shionogi brands
- In-licensing agreement to market Quetiapine Fumarate ER tablets
• 6th largest1 generic company
• Tottori site commissioned
• Strategic partnership with a national distributor
• Philippines sales were PHP 456 mn in Q3 FY18
• Ranked 5th branded Gx player2
• Growth of 9.4%2 against industry growth of 8.1%2
Note:1 IMS Data Japan (Dec 2017) at NHI price 2 Philippines IMS MAT Nov 17
Philippines
Japan
6,357 6,742
Q2 FY2018 Q3 FY2018
(IN
R M
n)
5,6016,742
Q3 FY2017 Q3 FY2018
(IN
R M
n)
16,53719,088
9M FY17 9M FY18
(IN
R M
n)
10

EMEA
Note:1 SA IMS MAT Dec 17
• South Africa sales were ZAR 257 mn
in Q3 FY18
• 4th largest generic company1 & #1
CVS player1
South Africa
• Focus on Germany: Sales were €8.7
mn in Q3 FY18
• EU 5 markets: Focus on neuro
specialty products (viz. Temmler)
• Expanding EU Partnered Business
Europe
2,758 2,721
Q2 FY2018 Q3 FY2018
(IN
R M
n)
2,5552,721
Q3 FY2017 Q3 FY2018
(IN
R M
n)
7,103 7,738
9M FY17 9M FY18
(IN
R M
n)
11

LATAM
Note:1 Mexico IMS Knobloch Nov-17 MAT2 Brazil IMS MAT Dec-17
• Mexico business grew by 10% y-o-y to
MXN 173 mn during Q3 FY18
• IMS growth of 14.4%1
• Brazil business grew by 26% y-o-y to
BRL 37 mn during Q3 FY18
• IMS growth of 26% vs market growth
of 8%2
Brazil
Mexico
1,395 1,481
Q2 FY2018 Q3 FY2018
(IN
R M
n)1,175
1,481
Q3 FY2017 Q3 FY2018
(IN
R M
n)
3,250
4,145
9M FY17 9M FY18
(IN
R M
n)
12

API
• Enhanced focus on pipeline of complex
and first-to-file APIs
• Significant new product portfolio
expansion to cater to US/EU/Japan
markets
• Foray into Oncology APIs
• Cumulative DMF filings stands at 190
(Dec-2017)
2,650 2,680
Q2 FY2018 Q3 FY2018
(IN
R M
n)
2,684 2,680
Q3 FY2017 Q3 FY2018
(IN
R M
n)
8,568 8,123
9M FY17 9M FY18
(IN
R M
n)
13
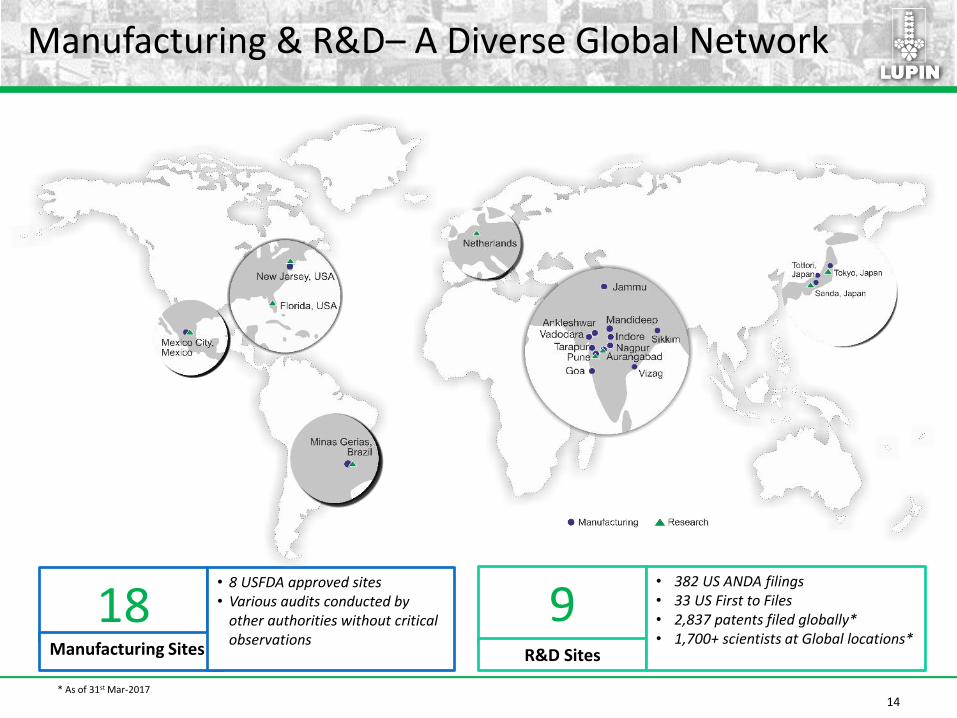
Manufacturing & R&D– A Diverse Global Network
18Manufacturing Sites
• 8 USFDA approved sites• Various audits conducted by
other authorities without critical observations
9R&D Sites
• 382 US ANDA filings• 33 US First to Files• 2,837 patents filed globally*• 1,700+ scientists at Global locations*
* As of 31st Mar-201714

Our Investments for the Future
151 ANDA pending filings with 5 filings and 6 approvals in Q3 FY18 (16 filings and 18 approvals in 9M FY18)
Enhanced investment on inhalation, biosimilars and injectables
15
5,716 5,682
6,709
4,999 4,739 4,75713.6% 12.9%
16.1%
13.1%12.2% 12.2%
0.0%
4.0%
8.0%
12.0%
16.0%
20.0%
0
2,000
4,000
6,000
8,000
Q2FY17 Q3FY17 Q4FY17 Q1FY18 Q2FY18 Q3FY18
(IN
R M
n)
R&D Spend
R&D expense % of sales

1616
Thank You