
Lunar X-ray fluorescence observations by the...
14
Lunar X-ray fluorescence observations by the Chandrayaan-1 X-ray Spectrometer (C1XS): Results from the nearside southern highlands S. Narendranath a,l,⇑ , P.S. Athiray a , P. Sreekumar a , B.J. Kellett b , L. Alha c , C.J. Howe b , K.H. Joy d,k , M. Grande e , J. Huovelin c , I.A. Crawford f , U. Unnikrishnan a,l , S. Lalita a , S. Subramaniam a , S.Z. Weider f,b , L.R. Nittler g , O. Gasnault h , D. Rothery i , V.A. Fernandes j , N. Bhandari m , J.N. Goswami m , M.A. Wieczorek n , the C1XS team a Space Astronomy Group, ISRO Satellite Centre, Vimanapura P.O., Bangalore 560 017, India b STFC, The Rutherford Appleton Laboratory, Didcot, Oxon OX11 0QX, UK c Division of Geophysics and Astronomy, Department of Physics, P.O. Box 48, FI-00014, 22 University of Helsinki, Finland d Center for Lunar Science and Exploration, The Lunar and Planetary Institute, USRA, 3600, Bay Area Blvd., Houston, TX 77058, USA e Institute of Mathematical and Physical Sciences, University of Wales, Aberystwyth, Ceredigion SY23 3BZ, UK f Department of Earth and Planetary Sciences, Birkbeck College, Malet Street, London WC1E 7HX, UK g Carnegie Institution of Washington, Department of Terrestrial Magnetism, 5241 Broad Branch Road NW, Washington DC 20015CIW, USA h Centre dEtude Spatiale des Rayonnements, Universit de Toulouse, Centre National de la Recherche Scientifique, Toulouse, France i Department of Earth and Environmental Sciences, Open University, Milton Keynes MK7 6AA, UK j Institute of Physics, University of Bern, Sidlerstrasse 5, CH-3012 Berne, Switzerland k Centre for Planetary Science at UCL/Birkbeck, Department of Earth Sciences, Gower Street, London WC1E 6BT, UK l Department of physics, University of Calicut, Thenjippalam, Kerala, India m Physical Research Laboratory, Navrangapura, Ahmedabad 380 009, Gujarat, India n Equipe Gophysique Spatiale et Plantaire, Institut de Physique du Globe de Paris, 4 Avenue de Neptune, 94100 Saint Maur des Fosss, FranceInstitut de Physique du Globe de Paris, Sorbonne Paris Cit, France article info Article history: Received 23 November 2010 Revised 8 April 2011 Accepted 11 April 2011 Available online xxxx Keywords: Moon, Surface Spectroscopy abstract The Chandrayaan-1 X-ray Spectrometer (C1XS) flown on-board the first Indian lunar mission Chan- drayaan-1, measured X-ray fluorescence spectra during several episodes of solar flares during its opera- tional period of 9 months. The accompanying X-ray Solar Monitor (XSM) provided simultaneous spectra of solar X-rays incident on the Moon which are essential to derive elemental chemistry. In this paper, we present the surface abundances of Mg, Al, Si, Ca and Fe, derived from C1XS data for a highland region on the southern nearside of the Moon. Analysis techniques are described in detail including absolute X-ray line flux derivation and conversion into elemental abundance. The results are consistent with a compo- sition rich in plagioclase with a slight mafic mineral enhancement and a Ca/Al ratio that is significantly lower than measured in lunar returned samples. We suggest various possible scenarios to explain the deviations. Ó 2011 Elsevier Inc. All rights reserved. 1. Introduction The chemical composition of Solar System bodies is one of the major clues to determining the history of the Solar System origin and evolution, therefore almost every planetary mission carries an experiment to map surface chemistry. The chemical composition of the lunar surface has been largely deciphered by means of returned samples from Apollo and Luna missions and orbital remote sensing measurements in the near-IR, visible, X-ray and gamma-ray wavelengths. Spectral reflectance mea- surements in the visible and near-IR have mapped the relative abundance of Fe and Ti on the lunar surface (through the near-IR absorption band of FeO, and the visible spectral slope which is sensitive to TiO 2 abundance; e.g. Lucey, 1998). The nat- ural gamma-ray emission from K, U, and Th was used to map the lunar abundances of these elements (Lawrence et al., 1998; Prettyman et al., 2006). In addition, nuclear reactions caused by galactic cosmic rays, excite nuclei of major rock-forming ele- ments such as O, Mg, Al, Si, Ca, Ti and Fe, which then de-excite, producing characteristic gamma-rays (Metzger, 1993). X-ray re- mote sensing can also measure signatures from these elements 0019-1035/$ - see front matter Ó 2011 Elsevier Inc. All rights reserved. doi:10.1016/j.icarus.2011.04.010 ⇑ Corresponding author at: Space Astronomy Group, ISRO Satellite Centre, Vimanapura P.O., Bangalore 560 017, India. E-mail address: [email protected] (S. Narendranath). Icarus xxx (2011) xxx–xxx Contents lists available at ScienceDirect Icarus journal homepage: www.elsevier.com/locate/icarus Please cite this article in press as: Narendranath, S., et al. Lunar X-ray fluorescence observations by the Chandrayaan-1 X-ray Spectrometer (C1XS): Results from the nearside southern highlands. Icarus (2011), doi:10.1016/j.icarus.2011.04.010
Transcript of Lunar X-ray fluorescence observations by the...

Icarus xxx (2011) xxx–xxx
Contents lists available at ScienceDirect
Icarus
journal homepage: www.elsevier .com/locate / icarus
Lunar X-ray fluorescence observations by the Chandrayaan-1 X-raySpectrometer (C1XS): Results from the nearside southern highlands
S. Narendranath a,l,⇑, P.S. Athiray a, P. Sreekumar a, B.J. Kellett b, L. Alha c, C.J. Howe b, K.H. Joy d,k, M. Grande e,J. Huovelin c, I.A. Crawford f, U. Unnikrishnan a,l, S. Lalita a, S. Subramaniam a, S.Z. Weider f,b, L.R. Nittler g,O. Gasnault h, D. Rothery i, V.A. Fernandes j, N. Bhandari m, J.N. Goswami m, M.A. Wieczorek n, the C1XS teama Space Astronomy Group, ISRO Satellite Centre, Vimanapura P.O., Bangalore 560 017, Indiab STFC, The Rutherford Appleton Laboratory, Didcot, Oxon OX11 0QX, UKc Division of Geophysics and Astronomy, Department of Physics, P.O. Box 48, FI-00014, 22 University of Helsinki, Finlandd Center for Lunar Science and Exploration, The Lunar and Planetary Institute, USRA, 3600, Bay Area Blvd., Houston, TX 77058, USAe Institute of Mathematical and Physical Sciences, University of Wales, Aberystwyth, Ceredigion SY23 3BZ, UKf Department of Earth and Planetary Sciences, Birkbeck College, Malet Street, London WC1E 7HX, UKg Carnegie Institution of Washington, Department of Terrestrial Magnetism, 5241 Broad Branch Road NW, Washington DC 20015CIW, USAh Centre dEtude Spatiale des Rayonnements, Universit de Toulouse, Centre National de la Recherche Scientifique, Toulouse, Francei Department of Earth and Environmental Sciences, Open University, Milton Keynes MK7 6AA, UKj Institute of Physics, University of Bern, Sidlerstrasse 5, CH-3012 Berne, Switzerlandk Centre for Planetary Science at UCL/Birkbeck, Department of Earth Sciences, Gower Street, London WC1E 6BT, UKl Department of physics, University of Calicut, Thenjippalam, Kerala, Indiam Physical Research Laboratory, Navrangapura, Ahmedabad 380 009, Gujarat, Indian Equipe Gophysique Spatiale et Plantaire, Institut de Physique du Globe de Paris, 4 Avenue de Neptune, 94100 Saint Maur des Fosss, FranceInstitut de Physique du Globe de Paris,Sorbonne Paris Cit, France
a r t i c l e i n f o a b s t r a c t
Article history:Received 23 November 2010Revised 8 April 2011Accepted 11 April 2011Available online xxxx
Keywords:Moon, SurfaceSpectroscopy
0019-1035/$ - see front matter � 2011 Elsevier Inc. Adoi:10.1016/j.icarus.2011.04.010
⇑ Corresponding author at: Space Astronomy GVimanapura P.O., Bangalore 560 017, India.
E-mail address: [email protected] (S. Narendr
Please cite this article in press as: Narendranathfrom the nearside southern highlands. Icarus (2
The Chandrayaan-1 X-ray Spectrometer (C1XS) flown on-board the first Indian lunar mission Chan-drayaan-1, measured X-ray fluorescence spectra during several episodes of solar flares during its opera-tional period of �9 months. The accompanying X-ray Solar Monitor (XSM) provided simultaneous spectraof solar X-rays incident on the Moon which are essential to derive elemental chemistry. In this paper, wepresent the surface abundances of Mg, Al, Si, Ca and Fe, derived from C1XS data for a highland region onthe southern nearside of the Moon. Analysis techniques are described in detail including absolute X-rayline flux derivation and conversion into elemental abundance. The results are consistent with a compo-sition rich in plagioclase with a slight mafic mineral enhancement and a Ca/Al ratio that is significantlylower than measured in lunar returned samples. We suggest various possible scenarios to explain thedeviations.
� 2011 Elsevier Inc. All rights reserved.
1. Introduction
The chemical composition of Solar System bodies is one ofthe major clues to determining the history of the Solar Systemorigin and evolution, therefore almost every planetary missioncarries an experiment to map surface chemistry. The chemicalcomposition of the lunar surface has been largely decipheredby means of returned samples from Apollo and Luna missions
ll rights reserved.
roup, ISRO Satellite Centre,
anath).
, S., et al. Lunar X-ray fluorescen011), doi:10.1016/j.icarus.2011
and orbital remote sensing measurements in the near-IR, visible,X-ray and gamma-ray wavelengths. Spectral reflectance mea-surements in the visible and near-IR have mapped the relativeabundance of Fe and Ti on the lunar surface (through thenear-IR absorption band of FeO, and the visible spectral slopewhich is sensitive to TiO2 abundance; e.g. Lucey, 1998). The nat-ural gamma-ray emission from K, U, and Th was used to mapthe lunar abundances of these elements (Lawrence et al., 1998;Prettyman et al., 2006). In addition, nuclear reactions causedby galactic cosmic rays, excite nuclei of major rock-forming ele-ments such as O, Mg, Al, Si, Ca, Ti and Fe, which then de-excite,producing characteristic gamma-rays (Metzger, 1993). X-ray re-mote sensing can also measure signatures from these elements
ce observations by the Chandrayaan-1 X-ray Spectrometer (C1XS): Results.04.010

2 S. Narendranath et al. / Icarus xxx (2011) xxx–xxx
as the lunar surface emits X-rays characteristic of elements pres-ent when X-rays from the Sun (Yin et al., 1993.) excite themthrough the process of X-ray fluorescence. Many experimentsin the past have employed these three techniques to reveal lunarsurface geochemistry. However, a consistent data set on globalelemental maps still does not exist.
While spectral reflectance measurements in visible and infra-red are primarily sensitive to the major elements Fe and Ti (onlyrelative abundance), the difficulty in gamma-ray measurementshas been primarily due to the high and uncertain background. Inaddition, there are complexities involved in modeling variousphysics processes that generate the observed signatures. In thiscontext, X-ray remote sensing provides a platform for unambigu-ous and unique identification of signals from the major elementsand estimation of abundance and provides independent measure-ments to compare to abundances derived from gamma-ray andspectral reflectance techniques.
Past XRF experiments have established the technique and pro-vided estimates of relative abundances of Mg and Al. The Apollo15 and 16 XRF experiments (Adler and Gerard, 1972; Adleret al., 1973a,b) estimated Al/Si and Mg/Si ratios over an area cov-ering �10% (Clark, 1979) of the equatorial region on the nearsideof the Moon. The D-CIXS instrument on SMART-1 detected majorelements up to Fe (Grande et al., 2007; Swinyard et al., 2009) dur-ing bright solar flares but the detectors suffered extensive radia-tion damage en-route (SMART-1 spent approximately 19 monthstraveling to the Moon) preventing accurate quantitative analysis.Thus no measures of absolute elemental abundances were de-rived from any of these measurements. The X-ray Spectrometeron the Japanese spacecraft Kaguya also suffered radiation damagethat resulted in degraded spectral capability (Okada et al., 2009).The Chandrayaan-1 X-ray Spectrometer (C1XS) (Grande et al.,2009; Crawford et al., 2009) flown on-board the Indian lunarmission Chandrayaan-1 (Bhandari et al., 2004; Goswami andAnnadurai, 2009) provided the best opportunity to date for gener-ating accurate global maps of most of the major elements in thelunar regolith. The X-ray Solar Monitor (XSM) alongside C1XSprovided a simultaneous measure of the incident solar spectrum.C1XS measurements could not produce a global map becausesolar flares powerful enough to stimulate detectable surfacefluorescence were few during this unusually prolonged solar min-imum. Our current analysis indicates no distinct lines duringquiet-Sun observations for single pixels. A new analysis has beeninitiated to address elemental signatures from cumulative datafrom multiple observations. Though thus limited, C1XS data ob-tained has still provided the best spectral and spatial resolutionlunar XRF spectra to date.
Estimation of elemental abundance requires a thorough under-standing of the instrument response, a good measure of the rapidlychanging excitation spectrum and knowledge of various parame-ters that affect the X-ray fluorescence intensity from a sample.The C1XS instrument underwent a detailed pre-launch character-ization from which we are able to model the lunar XRF spectrumwell. Using laboratory experiments with known sample composi-tions, the methodology for the conversion of X-ray line flux to ele-mental abundance has been validated.
In this paper, we describe in detail, the C1XS data analysis pro-cedure. We then apply this to the XRF spectra obtained during thebrightest flare observed during the Chandrayaan-1 mission. The X-ray line intensities derived from spectral fits to the data are thenconverted to elemental weight % using a software based on thefundamental parameter approach (Criss and Birks, 1968; Tertianand Claisse, 1982; Rousseau and Boivin, 1998). Finally we suggestpossible scenarios to interpret the differences between our resultsand known lunar sample compositions.
Please cite this article in press as: Narendranath, S., et al. Lunar X-ray fluorescenfrom the nearside southern highlands. Icarus (2011), doi:10.1016/j.icarus.2011
2. Chandrayaan-1 X-ray Spectrometer (C1XS) payload
2.1. C1XS detectors for lunar observations
C1XS is described in detail in Howe et al. (2009). Briefly, theinstrument consisted of an array of Swept Charge Devices (SCD)(Lowe et al., 2001) operating in the 0.8–20 keV energy range. SCDsdeveloped by e2v Technologies Ltd. can be thought of as one-dimensional X-ray CCDs with faster read out, larger area and goodspectral resolution within a benign operating temperature range of�20 to 0 �C (143 eV at 5.9 keV at �15 �C).
There were 24 SCDs arranged as three planar modules witheight SCDs in each module. Together they provided a geometricarea of 24 cm2. The detection efficiency was 42% at 1.48 keV (AlKa) (Narendranath et al., 2010). Gold-coated copper collimatorsplaced above each SCD defined an opening angle of ±14.3� whichresulted in an instantaneous ground pixel of 25 km � 25 km (FullWidth at Half Maximum, FWHM) on the lunar surface (for the100 km altitude orbit of Chandrayaan-1). In the later part of themission when the spacecraft orbit was raised to 200 km,the ground pixel size increased to 50 km � 50 km (FWHM). Twoaluminum filters each of 0.2 lm thickness was employed to blockvisible light from flooding the SCDs. An aluminum door protectedthe detectors from energetic protons and electrons during the pas-sage through the terrestrial radiation belts en-route to the Moon.The door also housed 24 55Fe radioactive sources with a titaniumfoil, which illuminated all detectors when the door was closed.The calibration source yielded four X-ray lines at energies4.5 keV, 4.9 keV, 5.9 keV and 6.4 keV (Ti Ka, Ti Kb, Mn Ka, MnKb) and enabled routine monitoring of changes in spectral resolu-tion and gain on-board. The SCDs were passively cooled by meansof heat pipes connected to a radiator facing cold space.
2.2. X-ray Solar Monitor (XSM)
An independent X-ray Solar Monitor (XSM) used a Si-PIN detec-tor with a 13 lm Be window for simultaneously measuring the so-lar X-ray spectrum. XSM was mounted on the upper deck of thespacecraft such as to maximize exposure to the Sun in its wide fieldof view of 105�. The full disk solar spectrum in the range 1.8–20 keV was measured over an integration time of 16 s.
3. Instrument calibration
3.1. C1XS
Lunar XRF spectra are typically weak signals under the low solaractivity condition that existed during the nine months of C1XSoperation (28 November 2008 to 29 August 2009). Hence, in orderto derive the maximum detection efficiency which provides themost accurate absolute X-ray line flux from lunar XRF spectra, itis necessary to model the energy-dependent spectral re-distribu-tion function (SRF which is the mathematical characterization ofthe observed response of the detector to a mono-chromatic beamof photons). C1XS underwent extensive calibration measurementsat the RESIK X-ray beam facility at Rutherford Appleton laboratory(RAL), UK. A Si-PIN detector calibrated at the electron storage ringat PTB/BESSY II was used as a transfer standard. The SRF and itsdependence on energy and temperature were studied and thedetection efficiency of the instrument with respect to the transferstandard was derived. The instrument response thus generatedwas implemented in the form of a response matrix compatible withthe X-ray spectral analysis package XSPEC (Arnaud, 1996). C1XScalibration is described in detail in Narendranath et al. (2010).
ce observations by the Chandrayaan-1 X-ray Spectrometer (C1XS): Results.04.010
S. Narendranath et al. / Icarus xxx (2011) xxx–xxx 3
Post launch calibration using the in-built 55Fe sources were car-ried out four times during the mission. The FWHM of the SCDs in-creased from 153 eV before launch to 163 eV at 5.9 keV at �8 �Cafter being placed in the lunar orbit. This degradation is attributedto the proton irradiation received en-route during the �16 dayjourney to the Moon. We assume that the temperature dependenceof the energy resolution follows that obtained on ground and thusre-derive the response matrix for various temperature ranges. Fi-nally, the data obtained during solar flares provide a gain calibra-tion at low energies from the Mg, Al and Si XRF lines.
3.2. XSM
The XSM shutter housed an 55Fe source covered by a thin Ti foilwhich generated four lines (4.5 keV, 4.9 keV, 5.9 keV and 6.4 keV)for calibration at the start of every observation (switch on beforeentering the sunlit side of the orbit). Every data set begins with400 s of calibration spectra from which gain and energy resolutionat these four lines can be determined. The effective area of thedetector is derived from the calculated detection efficiency curveconvolved with the collimator response (measured on ground).The calibration of XSM and its in-flight performance is describedin Alha et al. (2009).
5.3
5.4
5.5
in e
V/ch
anne
l
4. Observations and data analysis4.1. C1XS
There were two phases of observations during the mission lifeof Chandrayaan-1. During the first phase from November 2008 toApril 2009, the spacecraft was at an altitude of 100 km above thelunar surface with an orbital period of 118 min. During the secondphase from May to August 2009, the spacecraft was moved to a200 km altitude orbit. This increased the orbital period to�130 min and the instantaneous ground pixel of C1XS to50 km � 50 km (FWHM); defined by its collimator. When addingspectra across multiple ground pixels, lunar X-ray fluorescence sig-nals were observed during solar flares as weak as A1 class at a spa-tial resolution of �500 km.
C1XS was in operation nearly continuously for a period of9 months during which the instrument typically collected dataonly during the sunlit portion of the orbit. The operating tempera-ture range for the instrument was required to be below �5 �Cbased to optimize observation time. Whenever the temperatureexceeded this limit, C1XS detectors were automatically switchedoff allowing detectors to cool. When the temperature fell below apre-set limit of �9 �C the system switched back to standard oper-ating mode.
C1XS on-board data processing results in three types of datapackets: 10, 11 and 12 as described in Table 1. Since the solar activ-ity was low, all data were acquired in type 10 or type 11 mode. Thetime-tagged events in type 10 and 11 packets were binned into4096 ADC channel spectra with an integration time of 16 or 32 s(corresponding to the time required to cover a 25 km or 50 km
Table 1Data types in C1XS.
Datatype
Mode Count ratelimits
ADCchannels
Remarks
10 Time tagged <320 events/s 4096 Binned into spectraon ground
11 Time tagged <800 events/s 4096 Binned into spectraon ground
12 Spectral >800 events/s 512 Spectra on board
Please cite this article in press as: Narendranath, S., et al. Lunar X-ray fluorescenfrom the nearside southern highlands. Icarus (2011), doi:10.1016/j.icarus.2011
ground pixel), on ground. The channels were converted to energyspace using the relation
Energy ðiÞ ¼ channel ðiÞ � gainþ offset
where offset is made equal to zero by shifting the spectrum acrosschannels.
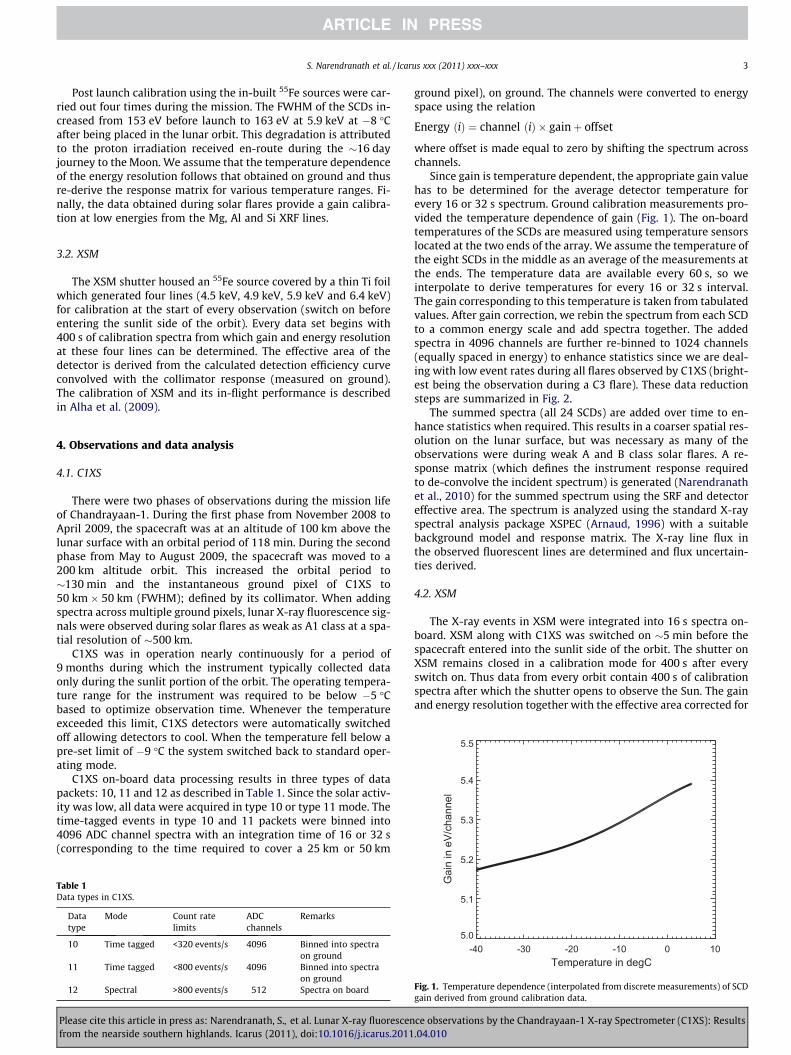
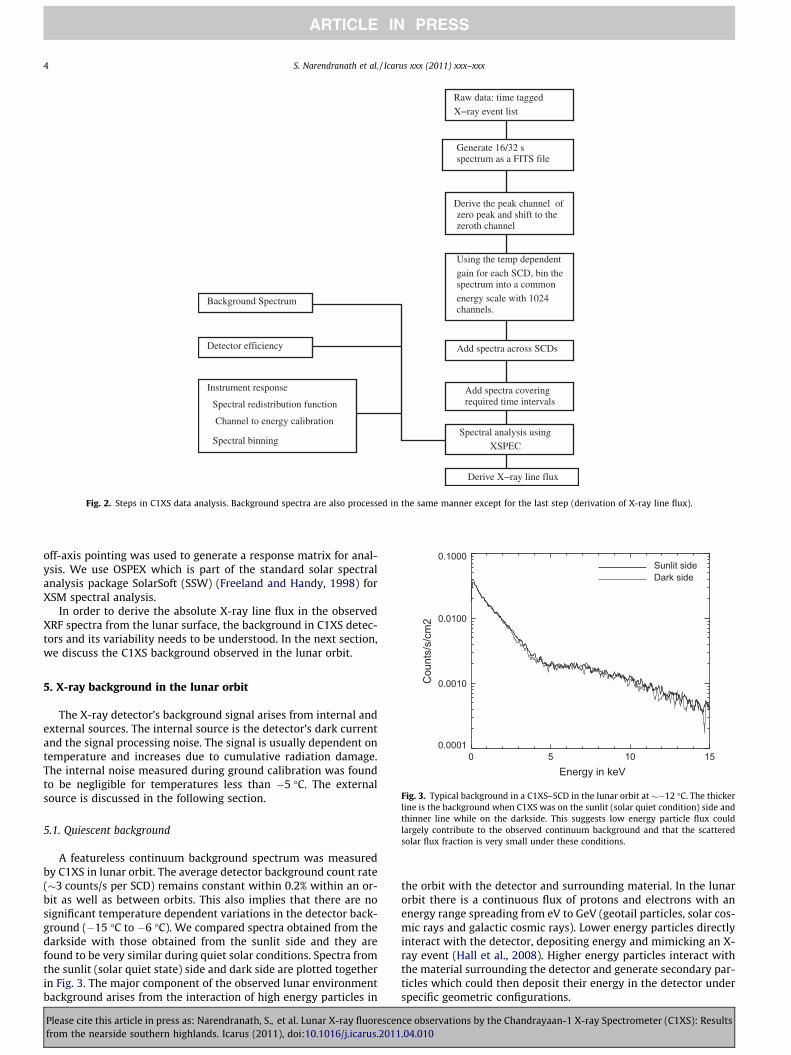
Since gain is temperature dependent, the appropriate gain valuehas to be determined for the average detector temperature forevery 16 or 32 s spectrum. Ground calibration measurements pro-vided the temperature dependence of gain (Fig. 1). The on-boardtemperatures of the SCDs are measured using temperature sensorslocated at the two ends of the array. We assume the temperature ofthe eight SCDs in the middle as an average of the measurements atthe ends. The temperature data are available every 60 s, so weinterpolate to derive temperatures for every 16 or 32 s interval.The gain corresponding to this temperature is taken from tabulatedvalues. After gain correction, we rebin the spectrum from each SCDto a common energy scale and add spectra together. The addedspectra in 4096 channels are further re-binned to 1024 channels(equally spaced in energy) to enhance statistics since we are deal-ing with low event rates during all flares observed by C1XS (bright-est being the observation during a C3 flare). These data reductionsteps are summarized in Fig. 2.
The summed spectra (all 24 SCDs) are added over time to en-hance statistics when required. This results in a coarser spatial res-olution on the lunar surface, but was necessary as many of theobservations were during weak A and B class solar flares. A re-sponse matrix (which defines the instrument response requiredto de-convolve the incident spectrum) is generated (Narendranathet al., 2010) for the summed spectrum using the SRF and detectoreffective area. The spectrum is analyzed using the standard X-rayspectral analysis package XSPEC (Arnaud, 1996) with a suitablebackground model and response matrix. The X-ray line flux inthe observed fluorescent lines are determined and flux uncertain-ties derived.
4.2. XSM
The X-ray events in XSM were integrated into 16 s spectra on-board. XSM along with C1XS was switched on �5 min before thespacecraft entered into the sunlit side of the orbit. The shutter onXSM remains closed in a calibration mode for 400 s after everyswitch on. Thus data from every orbit contain 400 s of calibrationspectra after which the shutter opens to observe the Sun. The gainand energy resolution together with the effective area corrected for
-40 -30 -20 -10 0 10Temperature in degC
5.0
5.1
5.2
Gai
n
Fig. 1. Temperature dependence (interpolated from discrete measurements) of SCDgain derived from ground calibration data.
ce observations by the Chandrayaan-1 X-ray Spectrometer (C1XS): Results.04.010
Background Spectrum
Detector efficiency
Instrument response
Spectral redistribution function
Channel to energy calibration
Spectral binning
Generate 16/32 sspectrum as a FITS file
Derive the peak channel of
Using the temp dependent
channels.
Add spectra across SCDs
Add spectra coveringrequired time intervals
Spectral analysis using
Raw data: time tagged
X−ray event list
zero peak and shift to thezeroth channel
gain for each SCD, bin the spectrum into a common
energy scale with 1024
Derive X−ray line flux
XSPEC
Fig. 2. Steps in C1XS data analysis. Background spectra are also processed in the same manner except for the last step (derivation of X-ray line flux).
0.0100
0.1000
nts/
s/cm
2
Dark sideSunlit side
4 S. Narendranath et al. / Icarus xxx (2011) xxx–xxx
off-axis pointing was used to generate a response matrix for anal-ysis. We use OSPEX which is part of the standard solar spectralanalysis package SolarSoft (SSW) (Freeland and Handy, 1998) forXSM spectral analysis.
In order to derive the absolute X-ray line flux in the observedXRF spectra from the lunar surface, the background in C1XS detec-tors and its variability needs to be understood. In the next section,we discuss the C1XS background observed in the lunar orbit.
0 5 10 15Energy in keV
0.0001
0.0010Cou
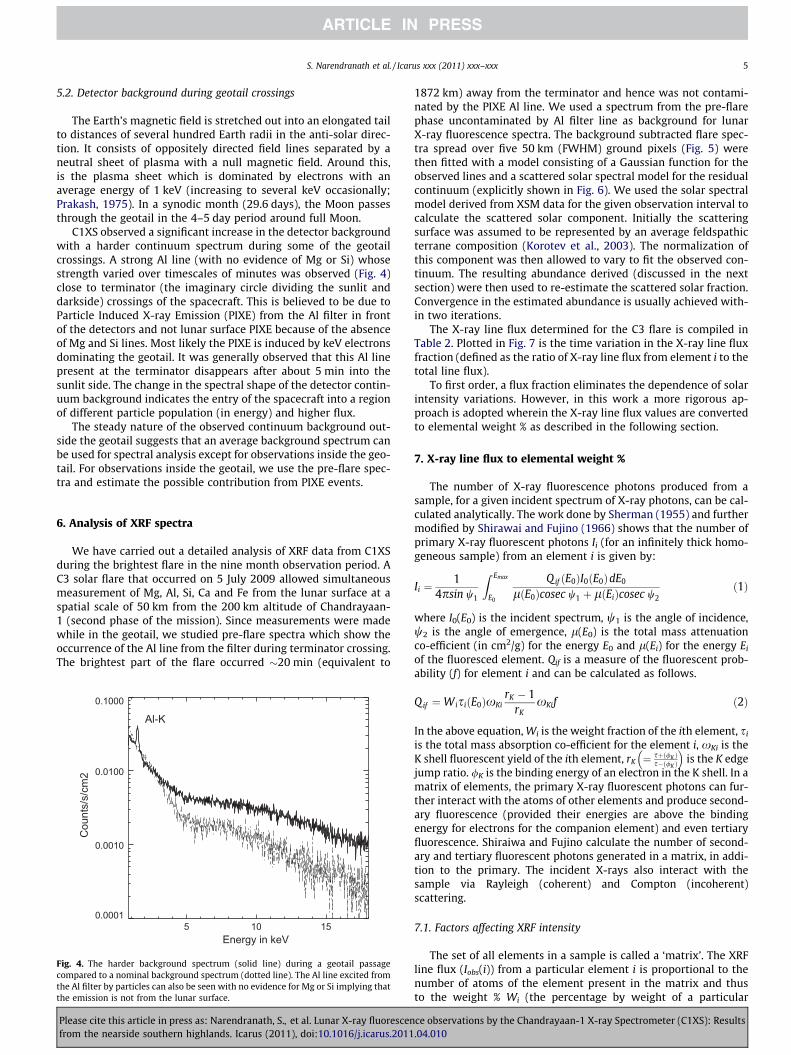
Fig. 3. Typical background in a C1XS–SCD in the lunar orbit at ��12 �C. The thickerline is the background when C1XS was on the sunlit (solar quiet condition) side andthinner line while on the darkside. This suggests low energy particle flux couldlargely contribute to the observed continuum background and that the scatteredsolar flux fraction is very small under these conditions.
5. X-ray background in the lunar orbit
The X-ray detector’s background signal arises from internal andexternal sources. The internal source is the detector’s dark currentand the signal processing noise. The signal is usually dependent ontemperature and increases due to cumulative radiation damage.The internal noise measured during ground calibration was foundto be negligible for temperatures less than �5 �C. The externalsource is discussed in the following section.
5.1. Quiescent background
A featureless continuum background spectrum was measuredby C1XS in lunar orbit. The average detector background count rate(�3 counts/s per SCD) remains constant within 0.2% within an or-bit as well as between orbits. This also implies that there are nosignificant temperature dependent variations in the detector back-ground (�15 �C to �6 �C). We compared spectra obtained from thedarkside with those obtained from the sunlit side and they arefound to be very similar during quiet solar conditions. Spectra fromthe sunlit (solar quiet state) side and dark side are plotted togetherin Fig. 3. The major component of the observed lunar environmentbackground arises from the interaction of high energy particles in
Please cite this article in press as: Narendranath, S., et al. Lunar X-ray fluorescenfrom the nearside southern highlands. Icarus (2011), doi:10.1016/j.icarus.2011
the orbit with the detector and surrounding material. In the lunarorbit there is a continuous flux of protons and electrons with anenergy range spreading from eV to GeV (geotail particles, solar cos-mic rays and galactic cosmic rays). Lower energy particles directlyinteract with the detector, depositing energy and mimicking an X-ray event (Hall et al., 2008). Higher energy particles interact withthe material surrounding the detector and generate secondary par-ticles which could then deposit their energy in the detector underspecific geometric configurations.
ce observations by the Chandrayaan-1 X-ray Spectrometer (C1XS): Results.04.010
S. Narendranath et al. / Icarus xxx (2011) xxx–xxx 5
5.2. Detector background during geotail crossings
The Earth’s magnetic field is stretched out into an elongated tailto distances of several hundred Earth radii in the anti-solar direc-tion. It consists of oppositely directed field lines separated by aneutral sheet of plasma with a null magnetic field. Around this,is the plasma sheet which is dominated by electrons with anaverage energy of 1 keV (increasing to several keV occasionally;Prakash, 1975). In a synodic month (29.6 days), the Moon passesthrough the geotail in the 4–5 day period around full Moon.
C1XS observed a significant increase in the detector backgroundwith a harder continuum spectrum during some of the geotailcrossings. A strong Al line (with no evidence of Mg or Si) whosestrength varied over timescales of minutes was observed (Fig. 4)close to terminator (the imaginary circle dividing the sunlit anddarkside) crossings of the spacecraft. This is believed to be due toParticle Induced X-ray Emission (PIXE) from the Al filter in frontof the detectors and not lunar surface PIXE because of the absenceof Mg and Si lines. Most likely the PIXE is induced by keV electronsdominating the geotail. It was generally observed that this Al linepresent at the terminator disappears after about 5 min into thesunlit side. The change in the spectral shape of the detector contin-uum background indicates the entry of the spacecraft into a regionof different particle population (in energy) and higher flux.
The steady nature of the observed continuum background out-side the geotail suggests that an average background spectrum canbe used for spectral analysis except for observations inside the geo-tail. For observations inside the geotail, we use the pre-flare spec-tra and estimate the possible contribution from PIXE events.
6. Analysis of XRF spectra
We have carried out a detailed analysis of XRF data from C1XSduring the brightest flare in the nine month observation period. AC3 solar flare that occurred on 5 July 2009 allowed simultaneousmeasurement of Mg, Al, Si, Ca and Fe from the lunar surface at aspatial scale of 50 km from the 200 km altitude of Chandrayaan-1 (second phase of the mission). Since measurements were madewhile in the geotail, we studied pre-flare spectra which show theoccurrence of the Al line from the filter during terminator crossing.The brightest part of the flare occurred �20 min (equivalent to
5 10 15Energy in keV
0.0001
0.0010
0.0100
0.1000
Cou
nts/
s/cm
2
Al-K
Fig. 4. The harder background spectrum (solid line) during a geotail passagecompared to a nominal background spectrum (dotted line). The Al line excited fromthe Al filter by particles can also be seen with no evidence for Mg or Si implying thatthe emission is not from the lunar surface.
Please cite this article in press as: Narendranath, S., et al. Lunar X-ray fluorescenfrom the nearside southern highlands. Icarus (2011), doi:10.1016/j.icarus.2011
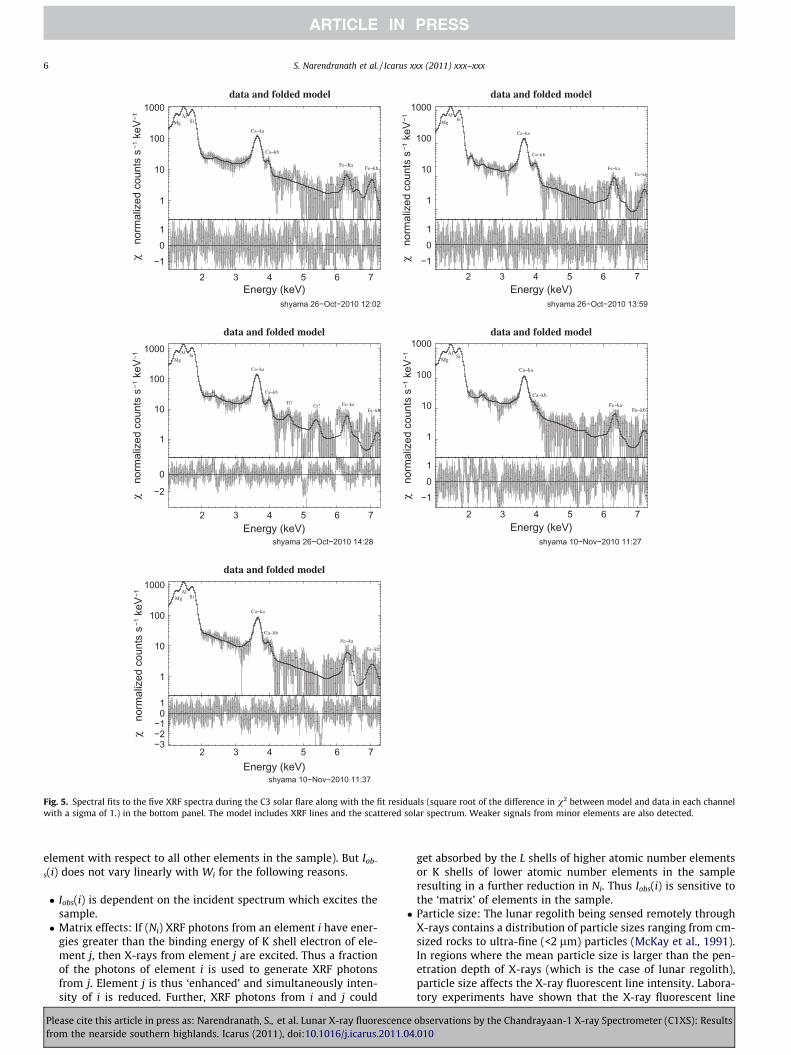
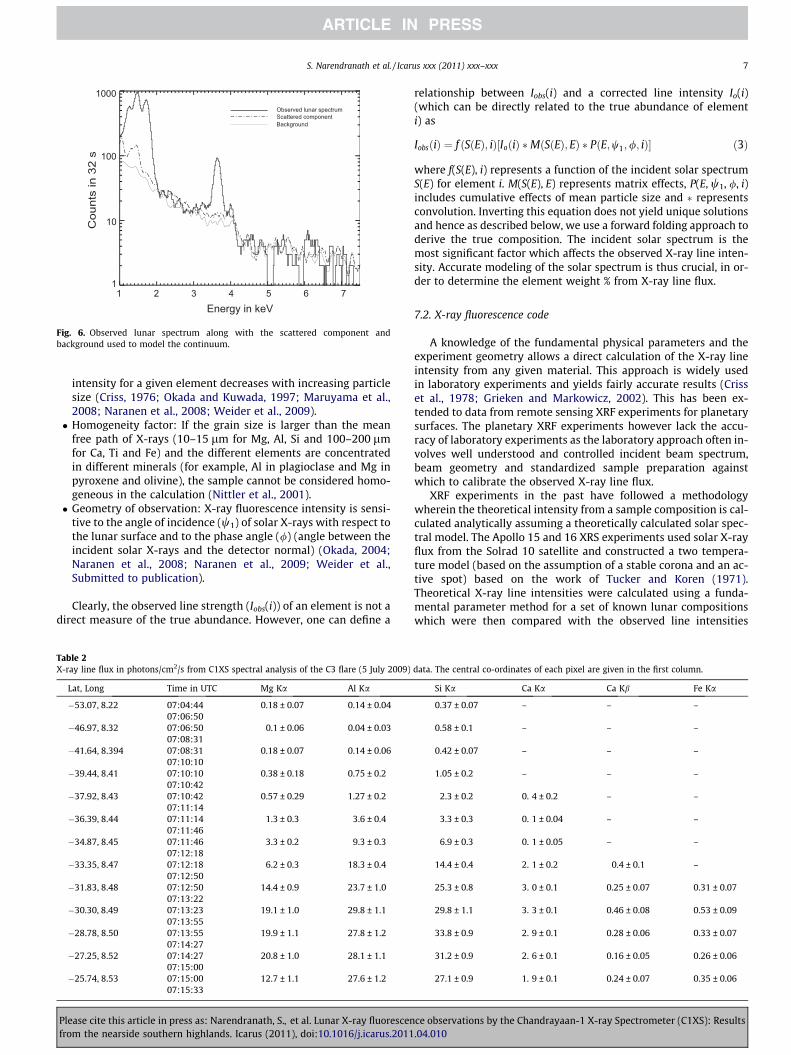
1872 km) away from the terminator and hence was not contami-nated by the PIXE Al line. We used a spectrum from the pre-flarephase uncontaminated by Al filter line as background for lunarX-ray fluorescence spectra. The background subtracted flare spec-tra spread over five 50 km (FWHM) ground pixels (Fig. 5) werethen fitted with a model consisting of a Gaussian function for theobserved lines and a scattered solar spectral model for the residualcontinuum (explicitly shown in Fig. 6). We used the solar spectralmodel derived from XSM data for the given observation interval tocalculate the scattered solar component. Initially the scatteringsurface was assumed to be represented by an average feldspathicterrane composition (Korotev et al., 2003). The normalization ofthis component was then allowed to vary to fit the observed con-tinuum. The resulting abundance derived (discussed in the nextsection) were then used to re-estimate the scattered solar fraction.Convergence in the estimated abundance is usually achieved with-in two iterations.
The X-ray line flux determined for the C3 flare is compiled inTable 2. Plotted in Fig. 7 is the time variation in the X-ray line fluxfraction (defined as the ratio of X-ray line flux from element i to thetotal line flux).
To first order, a flux fraction eliminates the dependence of solarintensity variations. However, in this work a more rigorous ap-proach is adopted wherein the X-ray line flux values are convertedto elemental weight % as described in the following section.
7. X-ray line flux to elemental weight %
The number of X-ray fluorescence photons produced from asample, for a given incident spectrum of X-ray photons, can be cal-culated analytically. The work done by Sherman (1955) and furthermodified by Shirawai and Fujino (1966) shows that the number ofprimary X-ray fluorescent photons Ii (for an infinitely thick homo-geneous sample) from an element i is given by:
Ii ¼1
4psin w1
Z Emax
E0
Q if ðE0ÞI0ðE0ÞdE0
lðE0Þcosec w1 þ lðEiÞcosec w2ð1Þ
where I0(E0) is the incident spectrum, w1 is the angle of incidence,w2 is the angle of emergence, l(E0) is the total mass attenuationco-efficient (in cm2/g) for the energy E0 and l(Ei) for the energy Ei
of the fluoresced element. Qif is a measure of the fluorescent prob-ability (f) for element i and can be calculated as follows.
Qif ¼WisiðE0ÞxKirK � 1
rKxKif ð2Þ
In the above equation, Wi is the weight fraction of the ith element, si
is the total mass absorption co-efficient for the element i, xKi is theK shell fluorescent yield of the ith element, rK ¼ sþð/K Þ
s�ð/K Þ
� �is the K edge
jump ratio. /K is the binding energy of an electron in the K shell. In amatrix of elements, the primary X-ray fluorescent photons can fur-ther interact with the atoms of other elements and produce second-ary fluorescence (provided their energies are above the bindingenergy for electrons for the companion element) and even tertiaryfluorescence. Shiraiwa and Fujino calculate the number of second-ary and tertiary fluorescent photons generated in a matrix, in addi-tion to the primary. The incident X-rays also interact with thesample via Rayleigh (coherent) and Compton (incoherent)scattering.
7.1. Factors affecting XRF intensity
The set of all elements in a sample is called a ‘matrix’. The XRFline flux (Iobs(i)) from a particular element i is proportional to thenumber of atoms of the element present in the matrix and thusto the weight % Wi (the percentage by weight of a particular
ce observations by the Chandrayaan-1 X-ray Spectrometer (C1XS): Results.04.010
data and folded model
2 3 4 5 6 7 2 3 4 5 6 7
2 3 4 5 6 72 3 4 5 6 7
2 3 4 5 6 7
Energy (keV) Energy (keV)
Energy (keV)Energy (keV)
Energy (keV)
shyama 26−Oct−2010 12:02
data and folded model
shyama 26−Oct−2010 13:59
Mg
AlSi
Ca−ka
Ca−kb
Fe−kaFe−kb
1
10
100
1000
data and folded model
−2
0
shyama 26−Oct−2010 14:28
Mg
AlSi
Ca−ka
Ca−kb
Ti?Cr? Fe−ka
Fe−kb
shyama 10−Nov−2010 11:27
1
10
100
1000
−1
0
1
data and folded model
MgAl
Si
Ca−ka
Ca−kb
Fe−kaFe−kb
1
10
100
1000data and folded model
−3−2−1
01
shyama 10−Nov−2010 11:37
MgAl
Si
Ca−ka
Ca−kb
Fe−ka
Fe−kb
1
10
100
1000
−1
0
1
MgAl
Si
Ca−ka
Ca−kb
Fe−KaFe−kb
1
10
100
1000
−1
0
1
norm
aliz
ed c
ount
s s−1
keV
−1χ
norm
aliz
ed c
ount
s s−1
keV
−1χ
norm
aliz
ed c
ount
s s−1
keV
−1χ
norm
aliz
ed c
ount
s s−1
keV
−1χ
norm
aliz
ed c
ount
s s−1
keV
−1χ
Fig. 5. Spectral fits to the five XRF spectra during the C3 solar flare along with the fit residuals (square root of the difference in v2 between model and data in each channelwith a sigma of 1.) in the bottom panel. The model includes XRF lines and the scattered solar spectrum. Weaker signals from minor elements are also detected.
6 S. Narendranath et al. / Icarus xxx (2011) xxx–xxx
element with respect to all other elements in the sample). But Iob-
s(i) does not vary linearly with Wi for the following reasons.
� Iobs(i) is dependent on the incident spectrum which excites thesample.� Matrix effects: If (Ni) XRF photons from an element i have ener-
gies greater than the binding energy of K shell electron of ele-ment j, then X-rays from element j are excited. Thus a fractionof the photons of element i is used to generate XRF photonsfrom j. Element j is thus ‘enhanced’ and simultaneously inten-sity of i is reduced. Further, XRF photons from i and j could
Please cite this article in press as: Narendranath, S., et al. Lunar X-ray fluorescenfrom the nearside southern highlands. Icarus (2011), doi:10.1016/j.icarus.2011
get absorbed by the L shells of higher atomic number elementsor K shells of lower atomic number elements in the sampleresulting in a further reduction in Ni. Thus Iobs(i) is sensitive tothe ‘matrix’ of elements in the sample.� Particle size: The lunar regolith being sensed remotely through
X-rays contains a distribution of particle sizes ranging from cm-sized rocks to ultra-fine (<2 lm) particles (McKay et al., 1991).In regions where the mean particle size is larger than the pen-etration depth of X-rays (which is the case of lunar regolith),particle size affects the X-ray fluorescent line intensity. Labora-tory experiments have shown that the X-ray fluorescent line
ce observations by the Chandrayaan-1 X-ray Spectrometer (C1XS): Results.04.010
1 2 3 4 5 6 7Energy in keV
1
10
100
1000C
ount
s in
32
sObserved lunar spectrum Scattered component Background
Fig. 6. Observed lunar spectrum along with the scattered component andbackground used to model the continuum.
S. Narendranath et al. / Icarus xxx (2011) xxx–xxx 7
intensity for a given element decreases with increasing particlesize (Criss, 1976; Okada and Kuwada, 1997; Maruyama et al.,2008; Naranen et al., 2008; Weider et al., 2009).� Homogeneity factor: If the grain size is larger than the mean
free path of X-rays (10–15 lm for Mg, Al, Si and 100–200 lmfor Ca, Ti and Fe) and the different elements are concentratedin different minerals (for example, Al in plagioclase and Mg inpyroxene and olivine), the sample cannot be considered homo-geneous in the calculation (Nittler et al., 2001).� Geometry of observation: X-ray fluorescence intensity is sensi-
tive to the angle of incidence (w1) of solar X-rays with respect tothe lunar surface and to the phase angle (/) (angle between theincident solar X-rays and the detector normal) (Okada, 2004;Naranen et al., 2008; Naranen et al., 2009; Weider et al.,Submitted to publication).
Clearly, the observed line strength (Iobs(i)) of an element is not adirect measure of the true abundance. However, one can define a
Table 2X-ray line flux in photons/cm2/s from C1XS spectral analysis of the C3 flare (5 July 2009)
Lat, Long Time in UTC Mg Ka Al Ka
�53.07, 8.22 07:04:44 0.18 ± 0.07 0.14 ± 0.0407:06:50
�46.97, 8.32 07:06:50 0.1 ± 0.06 0.04 ± 0.0307:08:31
�41.64, 8.394 07:08:31 0.18 ± 0.07 0.14 ± 0.0607:10:10
�39.44, 8.41 07:10:10 0.38 ± 0.18 0.75 ± 0.207:10:42
�37.92, 8.43 07:10:42 0.57 ± 0.29 1.27 ± 0.207:11:14
�36.39, 8.44 07:11:14 1.3 ± 0.3 3.6 ± 0.407:11:46
�34.87, 8.45 07:11:46 3.3 ± 0.2 9.3 ± 0.307:12:18
�33.35, 8.47 07:12:18 6.2 ± 0.3 18.3 ± 0.407:12:50
�31.83, 8.48 07:12:50 14.4 ± 0.9 23.7 ± 1.007:13:22
�30.30, 8.49 07:13:23 19.1 ± 1.0 29.8 ± 1.107:13:55
�28.78, 8.50 07:13:55 19.9 ± 1.1 27.8 ± 1.207:14:27
�27.25, 8.52 07:14:27 20.8 ± 1.0 28.1 ± 1.107:15:00
�25.74, 8.53 07:15:00 12.7 ± 1.1 27.6 ± 1.207:15:33
Please cite this article in press as: Narendranath, S., et al. Lunar X-ray fluorescenfrom the nearside southern highlands. Icarus (2011), doi:10.1016/j.icarus.2011
relationship between Iobs(i) and a corrected line intensity Io(i)(which can be directly related to the true abundance of elementi) as
IobsðiÞ ¼ f ðSðEÞ; iÞ½IoðiÞ �MðSðEÞ; EÞ � PðE;w1;/; iÞ� ð3Þ
where f(S(E), i) represents a function of the incident solar spectrumS(E) for element i. M(S(E), E) represents matrix effects, P(E, w1, /, i)includes cumulative effects of mean particle size and � representsconvolution. Inverting this equation does not yield unique solutionsand hence as described below, we use a forward folding approach toderive the true composition. The incident solar spectrum is themost significant factor which affects the observed X-ray line inten-sity. Accurate modeling of the solar spectrum is thus crucial, in or-der to determine the element weight % from X-ray line flux.
7.2. X-ray fluorescence code
A knowledge of the fundamental physical parameters and theexperiment geometry allows a direct calculation of the X-ray lineintensity from any given material. This approach is widely usedin laboratory experiments and yields fairly accurate results (Crisset al., 1978; Grieken and Markowicz, 2002). This has been ex-tended to data from remote sensing XRF experiments for planetarysurfaces. The planetary XRF experiments however lack the accu-racy of laboratory experiments as the laboratory approach often in-volves well understood and controlled incident beam spectrum,beam geometry and standardized sample preparation againstwhich to calibrate the observed X-ray line flux.
XRF experiments in the past have followed a methodologywherein the theoretical intensity from a sample composition is cal-culated analytically assuming a theoretically calculated solar spec-tral model. The Apollo 15 and 16 XRS experiments used solar X-rayflux from the Solrad 10 satellite and constructed a two tempera-ture model (based on the assumption of a stable corona and an ac-tive spot) based on the work of Tucker and Koren (1971).Theoretical X-ray line intensities were calculated using a funda-mental parameter method for a set of known lunar compositionswhich were then compared with the observed line intensities
data. The central co-ordinates of each pixel are given in the first column.
Si Ka Ca Ka Ca Kb Fe Ka
0.37 ± 0.07 – – –
0.58 ± 0.1 – – –
0.42 ± 0.07 – – –
1.05 ± 0.2 – – –
2.3 ± 0.2 0. 4 ± 0.2 – –
3.3 ± 0.3 0. 1 ± 0.04 – –
6.9 ± 0.3 0. 1 ± 0.05 – –
14.4 ± 0.4 2. 1 ± 0.2 0.4 ± 0.1 –
25.3 ± 0.8 3. 0 ± 0.1 0.25 ± 0.07 0.31 ± 0.07
29.8 ± 1.1 3. 3 ± 0.1 0.46 ± 0.08 0.53 ± 0.09
33.8 ± 0.9 2. 9 ± 0.1 0.28 ± 0.06 0.33 ± 0.07
31.2 ± 0.9 2. 6 ± 0.1 0.16 ± 0.05 0.26 ± 0.06
27.1 ± 0.9 1. 9 ± 0.1 0.24 ± 0.07 0.35 ± 0.06
ce observations by the Chandrayaan-1 X-ray Spectrometer (C1XS): Results.04.010

0 200 400 600
Time in seconds since 07:05:24 UT
0
2
4
6
8
10
12
T
otal
cou
nts
(s
umm
ed S
CD
spe
ctra
) x 1
000
0 200 400 600Time in seconds since 07:05:24 UT
0.2
0.4
0.6
0.8
1.0
Line
flux
/tota
l lin
e flu
x MgAlSiCa
Pre−flare
Rising
Peak
Fig. 7. Variation in X-ray line flux across lunar ground pixels (bottom panel) duringthe C3 flare. Line flux with large error bars are during the pre-flare times when linesignatures are weak. The total counts in C1XS for the same time period is plotted inthe top panel. Pixel to pixel variations suggest evidence for lunar chemistryvariations at spatial scales of 50 km.
Table 3C3 solar flare parameters, emission measure (EM) and plasma temperature (T)derived from XSM spectral analysis.
Time in UTC EM � 1049/cm3 T (keV) T (MK)
07:12:49–07:13:21 0.17 ± 0.005 1.15 ± 0.02 13.33 ± 0.2307:13:21–07:13:53 0.22 ± 0.002 1.12 ± 0.01 12.98 ± 0.1207:13:53–07:14:25 0.20 ± 0.002 1.10 ± 0.01 12.75 ± 0.1207:14:25–07:14:57 0.18 ± 0.005 1.01 ± 0.01 11.71 ± 0.1207:14:57–07:15:29 0.15 ± 0.002 0.95 ± 0.01 11.02 ± 0.12
8 S. Narendranath et al. / Icarus xxx (2011) xxx–xxx
and the best match determined. A correction factor that is a func-tion of the solar flux hardness ratio (a measure of the spectral var-iation) was derived, which relates the observed and calculated lineratios. Using this method, the Apollo experiments mapped about10% of the equatorial region on the near side of the Moon (Adleret al., 1973a,b; Maxwell et al., 1977; Clark and Hawke, 1981,1982, 1987, 1991).
The XRF experiment on Near Earth Asteroid Rendezvous (NEAR)used data from their solar monitor and accurately modeled the so-lar spectrum based on CHIANTI5.2 (Dere et al., 1997; Landi et al.,2006). This two temperature model was then used as input to theirXRF code and elemental ratios derived based on the determinationof the relationships between fluorescence ratios and elemental ra-tios from meteorite data (Trombka et al., 2000; Nittler et al., 2001;Lim and Nittler, 2009). Hayabusa XRF experiment used a standardsample plate to monitor the changes in the solar spectrum and de-rived surface elemental ratios for asteroid Itokawa (Okada et al.,2006).
The basic difficulty in all the earlier experiments has been thenon-availability of a simultaneous solar spectrum with energy res-olution good enough to accurately model the emission lines in thesolar spectrum. The XSM on C1XS had the unique capability tomeasure the 1.8–20 keV solar continuum spectrum as well as to re-solve some of the groups of emission lines superposed on the ther-mal continuum. The XSM can thus be used to generate a moreaccurate model of the solar spectrum.
We have implemented the fundamental parameter algorithmbased on the X-ray fluorescence equation as given by Shirawaiand Fujino (1966) including Rayleigh scattering. The differencewith earlier approaches is that we calculate analytically the ex-pected X-ray line flux for a set of matrices of elemental concentra-
Please cite this article in press as: Narendranath, S., et al. Lunar X-ray fluorescenfrom the nearside southern highlands. Icarus (2011), doi:10.1016/j.icarus.2011
tions covering a reasonably wide range, compare the calculated X-ray line flux fraction (line flux/sum of the flux in all lines) with theobserved and then derive the best set of weight % using the methodof least squares. Unlike other approaches where consistency withknown elemental weight % is addressed, this approach derivesthe best combination of weight % that matches the observed X-ray line flux and known solar spectrum incident on the lunar sur-face. This means that we do not start with any presumed lunarcompositions but arrive at the best values of weight % based onthe observed X-ray line flux. A larger parameter space is searchedin order to eliminate other local minima and to establish a smoothconvergence. Further details of the XRF code and its validationagainst laboratory samples are given in Athiray et al. (inpreparation).
8. Results
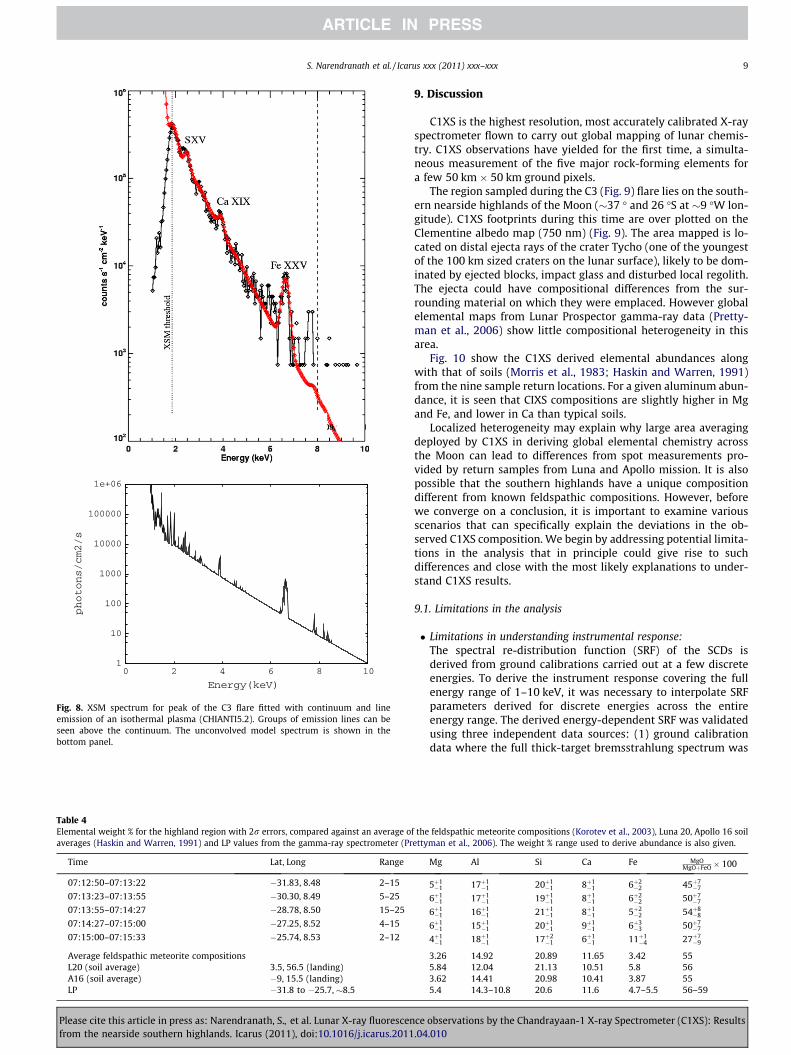
As stated earlier, to derive the elemental abundance from the X-ray line flux, it is necessary to accurately model the incident solarspectrum. XSM measured the incident solar spectrum simulta-neously with C1XS XRF observations of the lunar surface. Thegroups of emission lines from highly ionized atoms of S(�2.4 keV), Ca (�3.8 keV) and Fe (�6.7 keV) are observed. ThusXSM has the capability to determine changes in coronal abundanceduring the flare from the line intensity variations. A single temper-ature model seems to be sufficient to model the 1–8 keV solarspectra for this flare and hence we did not include a harder spectralcomponent that is present in many solar flares. XSM spectra (forthe time corresponding to C1XS observations) were fitted with asingle temperature (vthabund in OSPEX which is a model basedon CHIANTI5.2 (Landi et al., 2006)), varying the coronal abundanceto obtain a best fit for the intensity of emission lines in the spec-trum. Table 3 gives the solar spectral parameters derived for thepeak phase of the C3 flare measured by XSM. Fig. 8 shows one ofthe spectral fits to the XSM spectrum.
We have determined the elemental weight % over the fivebright ground pixels observed during the C3 flare (Table 4) withthe best fit solar model derived from XSM for each pixel. As we lacka measurement of the oxygen and titanium line flux, we have keptthe oxygen weight % fixed at 43.87% and Ti at 0.13% (based on anaverage feldspathic terrane composition from Korotev et al.(2003) for all the pixels). For other elements the range used duringthe final iteration is given in Table 4. The angle of incidence andphase angle during the observations are known and have beenused in the calculation. These values are compared with the aver-age composition of soils from Luna 20, Apollo 16 mission (Haskinand Warren, 1991) and that of an average feldspathic highland ter-rane (Korotev et al., 2003). Abundances derived from Lunar Pros-pector gamma-ray spectrometer though at coarser resolution(Mg, Al, Si, Ca and Ti at 152 km and Fe at 80 km FWHM, Prettymanet al., 2006) are also included for comparison.
In order to add confidence, the results from this code were ver-ified with an independent analysis with a similar XRF (Nittler et al.,2001) code developed for NEAR-XRS. For a given geometry, inci-dent solar spectrum and composition, the fluorescent flux fractionsfrom both codes agreed within 10%.
ce observations by the Chandrayaan-1 X-ray Spectrometer (C1XS): Results.04.010
1
10
100
1000
10000
100000
1e+06
0 2 4 6 8 10
photons/cm2/s
Energy(keV)
Fig. 8. XSM spectrum for peak of the C3 flare fitted with continuum and lineemission of an isothermal plasma (CHIANTI5.2). Groups of emission lines can beseen above the continuum. The unconvolved model spectrum is shown in thebottom panel.
Table 4Elemental weight % for the highland region with 2r errors, compared against an average oaverages (Haskin and Warren, 1991) and LP values from the gamma-ray spectrometer (Pr
Time Lat, Long Range
07:12:50–07:13:22 �31.83, 8.48 2–15
07:13:23–07:13:55 �30.30, 8.49 5–25
07:13:55–07:14:27 �28.78, 8.50 15–25
07:14:27–07:15:00 �27.25, 8.52 4–15
07:15:00–07:15:33 �25.74, 8.53 2–12
Average feldspathic meteorite compositionsL20 (soil average) 3.5, 56.5 (landing)A16 (soil average) �9, 15.5 (landing)LP �31.8 to �25.7, �8.5
S. Narendranath et al. / Icarus xxx (2011) xxx–xxx 9
Please cite this article in press as: Narendranath, S., et al. Lunar X-ray fluorescenfrom the nearside southern highlands. Icarus (2011), doi:10.1016/j.icarus.2011
9. Discussion
C1XS is the highest resolution, most accurately calibrated X-rayspectrometer flown to carry out global mapping of lunar chemis-try. C1XS observations have yielded for the first time, a simulta-neous measurement of the five major rock-forming elements fora few 50 km � 50 km ground pixels.
The region sampled during the C3 (Fig. 9) flare lies on the south-ern nearside highlands of the Moon (�37 � and 26 �S at �9 �W lon-gitude). C1XS footprints during this time are over plotted on theClementine albedo map (750 nm) (Fig. 9). The area mapped is lo-cated on distal ejecta rays of the crater Tycho (one of the youngestof the 100 km sized craters on the lunar surface), likely to be dom-inated by ejected blocks, impact glass and disturbed local regolith.The ejecta could have compositional differences from the sur-rounding material on which they were emplaced. However globalelemental maps from Lunar Prospector gamma-ray data (Pretty-man et al., 2006) show little compositional heterogeneity in thisarea.
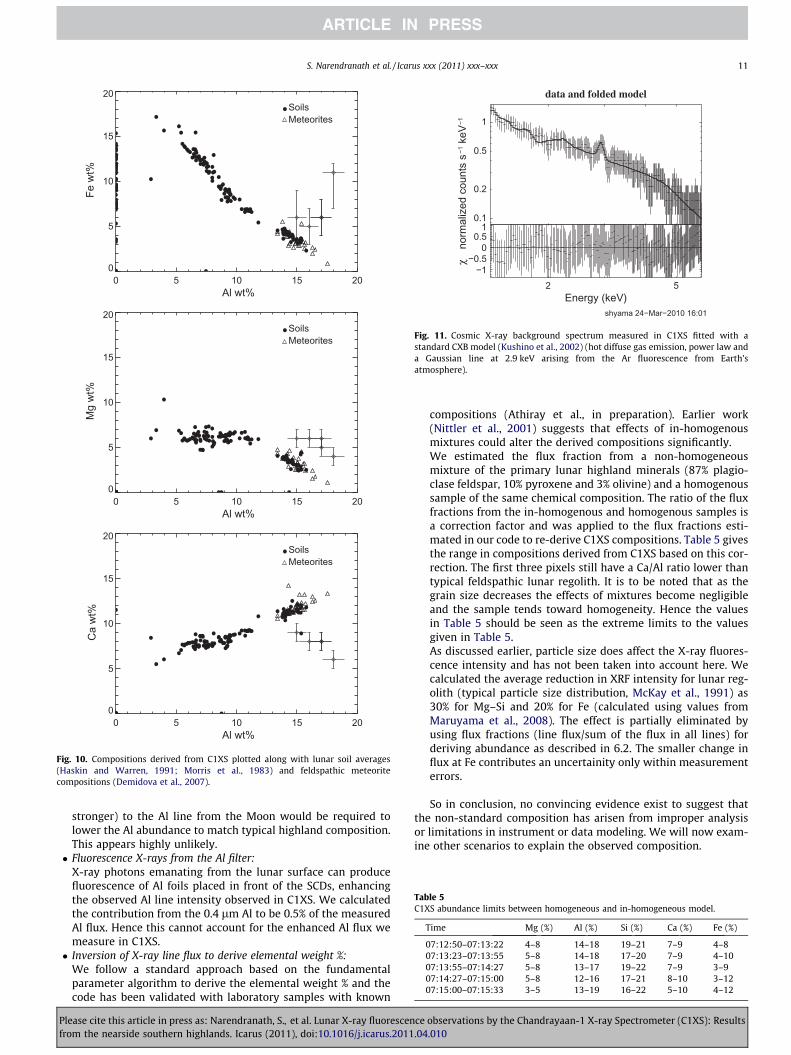
Fig. 10 show the C1XS derived elemental abundances alongwith that of soils (Morris et al., 1983; Haskin and Warren, 1991)from the nine sample return locations. For a given aluminum abun-dance, it is seen that CIXS compositions are slightly higher in Mgand Fe, and lower in Ca than typical soils.
Localized heterogeneity may explain why large area averagingdeployed by C1XS in deriving global elemental chemistry acrossthe Moon can lead to differences from spot measurements pro-vided by return samples from Luna and Apollo mission. It is alsopossible that the southern highlands have a unique compositiondifferent from known feldspathic compositions. However, beforewe converge on a conclusion, it is important to examine variousscenarios that can specifically explain the deviations in the ob-served C1XS composition. We begin by addressing potential limita-tions in the analysis that in principle could give rise to suchdifferences and close with the most likely explanations to under-stand C1XS results.
9.1. Limitations in the analysis
� Limitations in understanding instrumental response:The spectral re-distribution function (SRF) of the SCDs isderived from ground calibrations carried out at a few discreteenergies. To derive the instrument response covering the fullenergy range of 1–10 keV, it was necessary to interpolate SRFparameters derived for discrete energies across the entireenergy range. The derived energy-dependent SRF was validatedusing three independent data sources: (1) ground calibrationdata where the full thick-target bremsstrahlung spectrum was
f the feldspathic meteorite compositions (Korotev et al., 2003), Luna 20, Apollo 16 soilettyman et al., 2006). The weight % range used to derive abundance is also given.
Mg Al Si Ca Fe MgOMgOþFeO� 100
5þ1�1 17þ1
�1 20þ1�1 8þ1
�1 6þ2�2 45þ7
�7
6þ1�1 17þ1
�1 19þ1�1 8þ1
�1 6þ2�2 50þ7
�7
6þ1�1 16þ1
�1 21þ1�1 8þ1
�1 5þ2�2 54þ8
�8
6þ1�1 15þ1
�1 20þ1�1 9þ1
�1 6þ3�3 50þ7
�7
4þ1�1 18þ1
�1 17þ2�1 6þ1
�1 11þ1�4 27þ7
�9
3.26 14.92 20.89 11.65 3.42 555.84 12.04 21.13 10.51 5.8 563.62 14.41 20.98 10.41 3.87 555.4 14.3–10.8 20.6 11.6 4.7–5.5 56–59
ce observations by the Chandrayaan-1 X-ray Spectrometer (C1XS): Results.04.010
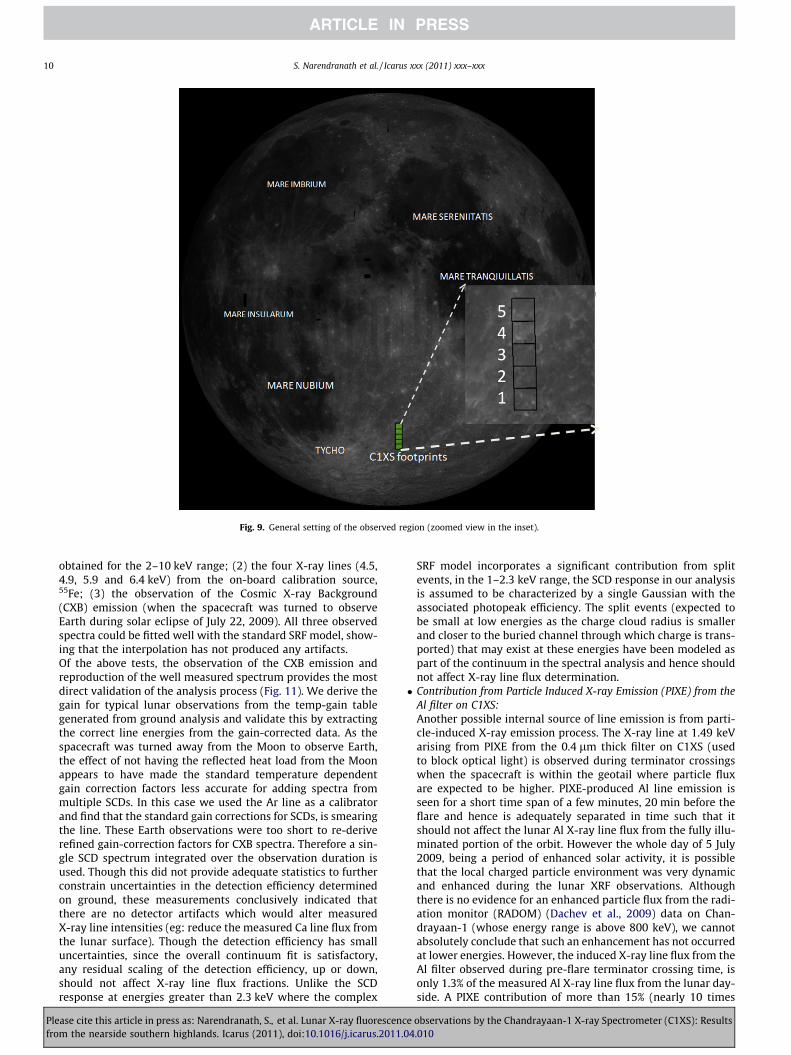
Fig. 9. General setting of the observed region (zoomed view in the inset).
10 S. Narendranath et al. / Icarus xxx (2011) xxx–xxx
obtained for the 2–10 keV range; (2) the four X-ray lines (4.5,4.9, 5.9 and 6.4 keV) from the on-board calibration source,55Fe; (3) the observation of the Cosmic X-ray Background(CXB) emission (when the spacecraft was turned to observeEarth during solar eclipse of July 22, 2009). All three observedspectra could be fitted well with the standard SRF model, show-ing that the interpolation has not produced any artifacts.Of the above tests, the observation of the CXB emission andreproduction of the well measured spectrum provides the mostdirect validation of the analysis process (Fig. 11). We derive thegain for typical lunar observations from the temp-gain tablegenerated from ground analysis and validate this by extractingthe correct line energies from the gain-corrected data. As thespacecraft was turned away from the Moon to observe Earth,the effect of not having the reflected heat load from the Moonappears to have made the standard temperature dependentgain correction factors less accurate for adding spectra frommultiple SCDs. In this case we used the Ar line as a calibratorand find that the standard gain corrections for SCDs, is smearingthe line. These Earth observations were too short to re-deriverefined gain-correction factors for CXB spectra. Therefore a sin-gle SCD spectrum integrated over the observation duration isused. Though this did not provide adequate statistics to furtherconstrain uncertainties in the detection efficiency determinedon ground, these measurements conclusively indicated thatthere are no detector artifacts which would alter measuredX-ray line intensities (eg: reduce the measured Ca line flux fromthe lunar surface). Though the detection efficiency has smalluncertainties, since the overall continuum fit is satisfactory,any residual scaling of the detection efficiency, up or down,should not affect X-ray line flux fractions. Unlike the SCDresponse at energies greater than 2.3 keV where the complex
Please cite this article in press as: Narendranath, S., et al. Lunar X-ray fluorescenfrom the nearside southern highlands. Icarus (2011), doi:10.1016/j.icarus.2011
SRF model incorporates a significant contribution from splitevents, in the 1–2.3 keV range, the SCD response in our analysisis assumed to be characterized by a single Gaussian with theassociated photopeak efficiency. The split events (expected tobe small at low energies as the charge cloud radius is smallerand closer to the buried channel through which charge is trans-ported) that may exist at these energies have been modeled aspart of the continuum in the spectral analysis and hence shouldnot affect X-ray line flux determination.� Contribution from Particle Induced X-ray Emission (PIXE) from the
Al filter on C1XS:Another possible internal source of line emission is from parti-cle-induced X-ray emission process. The X-ray line at 1.49 keVarising from PIXE from the 0.4 lm thick filter on C1XS (usedto block optical light) is observed during terminator crossingswhen the spacecraft is within the geotail where particle fluxare expected to be higher. PIXE-produced Al line emission isseen for a short time span of a few minutes, 20 min before theflare and hence is adequately separated in time such that itshould not affect the lunar Al X-ray line flux from the fully illu-minated portion of the orbit. However the whole day of 5 July2009, being a period of enhanced solar activity, it is possiblethat the local charged particle environment was very dynamicand enhanced during the lunar XRF observations. Althoughthere is no evidence for an enhanced particle flux from the radi-ation monitor (RADOM) (Dachev et al., 2009) data on Chan-drayaan-1 (whose energy range is above 800 keV), we cannotabsolutely conclude that such an enhancement has not occurredat lower energies. However, the induced X-ray line flux from theAl filter observed during pre-flare terminator crossing time, isonly 1.3% of the measured Al X-ray line flux from the lunar day-side. A PIXE contribution of more than 15% (nearly 10 times
ce observations by the Chandrayaan-1 X-ray Spectrometer (C1XS): Results.04.010
0 5 10 15 20Al wt%
0
5
10
15
20Fe
wt%
Soils Meteorites
0 5 10 15 20Al wt%
0
5
10
15
20
Mg
wt%
Soils Meteorites
0 5 10 15 20Al wt%
0
5
10
15
20
Ca
wt%
Soils Meteorites
Fig. 10. Compositions derived from C1XS plotted along with lunar soil averages(Haskin and Warren, 1991; Morris et al., 1983) and feldspathic meteoritecompositions (Demidova et al., 2007).
data and folded model
52Energy (keV)
shyama 24−Mar−2010 16:01
0.1
1
0.2
0.5
−1−0.5
00.5
1
norm
aliz
ed c
ount
s s−1
keV
−1χ
Fig. 11. Cosmic X-ray background spectrum measured in C1XS fitted with astandard CXB model (Kushino et al., 2002) (hot diffuse gas emission, power law anda Gaussian line at 2.9 keV arising from the Ar fluorescence from Earth’satmosphere).
Table 5C1XS abundance limits between homogeneous and in-homogeneous model.
Time Mg (%) Al (%) Si (%) Ca (%) Fe (%)
07:12:50–07:13:22 4–8 14–18 19–21 7–9 4–807:13:23–07:13:55 5–8 14–18 17–20 7–9 4–1007:13:55–07:14:27 5–8 13–17 19–22 7–9 3–907:14:27–07:15:00 5–8 12–16 17–21 8–10 3–1207:15:00–07:15:33 3–5 13–19 16–22 5–10 4–12
S. Narendranath et al. / Icarus xxx (2011) xxx–xxx 11
stronger) to the Al line from the Moon would be required tolower the Al abundance to match typical highland composition.This appears highly unlikely.� Fluorescence X-rays from the Al filter:
X-ray photons emanating from the lunar surface can producefluorescence of Al foils placed in front of the SCDs, enhancingthe observed Al line intensity observed in C1XS. We calculatedthe contribution from the 0.4 lm Al to be 0.5% of the measuredAl flux. Hence this cannot account for the enhanced Al flux wemeasure in C1XS.� Inversion of X-ray line flux to derive elemental weight %:
We follow a standard approach based on the fundamentalparameter algorithm to derive the elemental weight % and thecode has been validated with laboratory samples with known
Please cite this article in press as: Narendranath, S., et al. Lunar X-ray fluorescenfrom the nearside southern highlands. Icarus (2011), doi:10.1016/j.icarus.2011
compositions (Athiray et al., in preparation). Earlier work(Nittler et al., 2001) suggests that effects of in-homogenousmixtures could alter the derived compositions significantly.We estimated the flux fraction from a non-homogeneousmixture of the primary lunar highland minerals (87% plagio-clase feldspar, 10% pyroxene and 3% olivine) and a homogenoussample of the same chemical composition. The ratio of the fluxfractions from the in-homogenous and homogenous samples isa correction factor and was applied to the flux fractions esti-mated in our code to re-derive C1XS compositions. Table 5 givesthe range in compositions derived from C1XS based on this cor-rection. The first three pixels still have a Ca/Al ratio lower thantypical feldspathic lunar regolith. It is to be noted that as thegrain size decreases the effects of mixtures become negligibleand the sample tends toward homogeneity. Hence the valuesin Table 5 should be seen as the extreme limits to the valuesgiven in Table 5.As discussed earlier, particle size does affect the X-ray fluores-cence intensity and has not been taken into account here. Wecalculated the average reduction in XRF intensity for lunar reg-olith (typical particle size distribution, McKay et al., 1991) as30% for Mg–Si and 20% for Fe (calculated using values fromMaruyama et al., 2008). The effect is partially eliminated byusing flux fractions (line flux/sum of the flux in all lines) forderiving abundance as described in 6.2. The smaller change influx at Fe contributes an uncertainity only within measurementerrors.
So in conclusion, no convincing evidence exist to suggest thatthe non-standard composition has arisen from improper analysisor limitations in instrument or data modeling. We will now exam-ine other scenarios to explain the observed composition.
ce observations by the Chandrayaan-1 X-ray Spectrometer (C1XS): Results.04.010
12 S. Narendranath et al. / Icarus xxx (2011) xxx–xxx
9.2. Compositional differences inherent to the Moon
It is generally believed that lunar highlands are mainly com-posed of plagioclase feldspar with lower amounts of mafic miner-als. However none of the returned samples are from a purelyfeldspathic highland region and hence we cannot expect C1XS de-rived values to exactly match these. The higher Mg and Fe contentderived here would arise from addition of mafic components re-distributed by impacts. The major deviation in the C1XS derivedvalues is Ca/Al ratio which for pure anorthite is 0.73. Addition ofmafic components would raise this value whereas the Ca/Al ratioderived here is less than 0.7. We discuss below the possible expla-nations for this deviation.
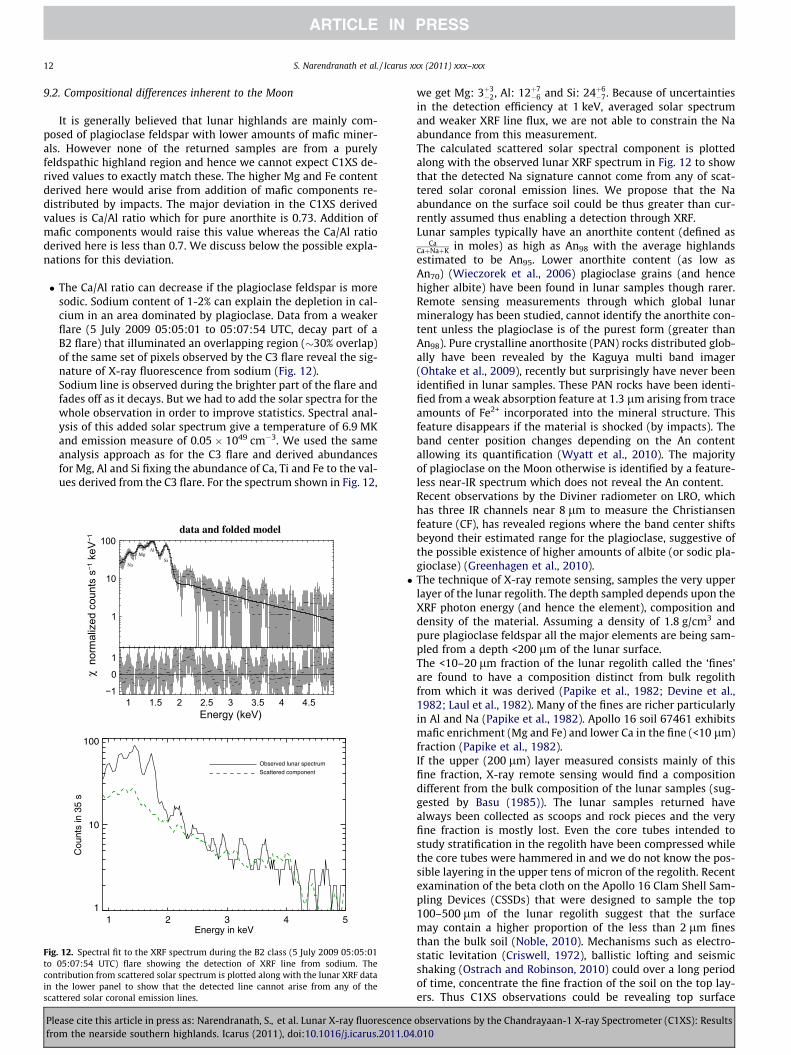
� The Ca/Al ratio can decrease if the plagioclase feldspar is moresodic. Sodium content of 1-2% can explain the depletion in cal-cium in an area dominated by plagioclase. Data from a weakerflare (5 July 2009 05:05:01 to 05:07:54 UTC, decay part of aB2 flare) that illuminated an overlapping region (�30% overlap)of the same set of pixels observed by the C3 flare reveal the sig-nature of X-ray fluorescence from sodium (Fig. 12).Sodium line is observed during the brighter part of the flare andfades off as it decays. But we had to add the solar spectra for thewhole observation in order to improve statistics. Spectral anal-ysis of this added solar spectrum give a temperature of 6.9 MKand emission measure of 0.05 � 1049 cm�3. We used the sameanalysis approach as for the C3 flare and derived abundancesfor Mg, Al and Si fixing the abundance of Ca, Ti and Fe to the val-ues derived from the C3 flare. For the spectrum shown in Fig. 12,
1
10
100
norm
aliz
ed c
ount
s s−1
keV
−1
data and folded model
1 1.5 2 2.5 3 3.5 4 4.5−1
0
1
χ
Energy (keV)
Si
AlMg
Na
1 2 3 4 5Energy in keV
1
10
100
Cou
nts
in 3
5 s
Observed lunar spectrum
Scattered component
Fig. 12. Spectral fit to the XRF spectrum during the B2 class (5 July 2009 05:05:01to 05:07:54 UTC) flare showing the detection of XRF line from sodium. Thecontribution from scattered solar spectrum is plotted along with the lunar XRF datain the lower panel to show that the detected line cannot arise from any of thescattered solar coronal emission lines.
Please cite this article in press as: Narendranath, S., et al. Lunar X-ray fluorescenfrom the nearside southern highlands. Icarus (2011), doi:10.1016/j.icarus.2011
we get Mg: 3þ3�2, Al: 12þ7
�6 and Si: 24þ6�7. Because of uncertainties
in the detection efficiency at 1 keV, averaged solar spectrumand weaker XRF line flux, we are not able to constrain the Naabundance from this measurement.The calculated scattered solar spectral component is plottedalong with the observed lunar XRF spectrum in Fig. 12 to showthat the detected Na signature cannot come from any of scat-tered solar coronal emission lines. We propose that the Naabundance on the surface soil could be thus greater than cur-rently assumed thus enabling a detection through XRF.Lunar samples typically have an anorthite content (defined as
CaCaþNaþK in moles) as high as An98 with the average highlandsestimated to be An95. Lower anorthite content (as low asAn70) (Wieczorek et al., 2006) plagioclase grains (and hencehigher albite) have been found in lunar samples though rarer.Remote sensing measurements through which global lunarmineralogy has been studied, cannot identify the anorthite con-tent unless the plagioclase is of the purest form (greater thanAn98). Pure crystalline anorthosite (PAN) rocks distributed glob-ally have been revealed by the Kaguya multi band imager(Ohtake et al., 2009), recently but surprisingly have never beenidentified in lunar samples. These PAN rocks have been identi-fied from a weak absorption feature at 1.3 lm arising from traceamounts of Fe2+ incorporated into the mineral structure. Thisfeature disappears if the material is shocked (by impacts). Theband center position changes depending on the An contentallowing its quantification (Wyatt et al., 2010). The majorityof plagioclase on the Moon otherwise is identified by a feature-less near-IR spectrum which does not reveal the An content.Recent observations by the Diviner radiometer on LRO, whichhas three IR channels near 8 lm to measure the Christiansenfeature (CF), has revealed regions where the band center shiftsbeyond their estimated range for the plagioclase, suggestive ofthe possible existence of higher amounts of albite (or sodic pla-gioclase) (Greenhagen et al., 2010).� The technique of X-ray remote sensing, samples the very upper
layer of the lunar regolith. The depth sampled depends upon theXRF photon energy (and hence the element), composition anddensity of the material. Assuming a density of 1.8 g/cm3 andpure plagioclase feldspar all the major elements are being sam-pled from a depth <200 lm of the lunar surface.The <10–20 lm fraction of the lunar regolith called the ‘fines’are found to have a composition distinct from bulk regolithfrom which it was derived (Papike et al., 1982; Devine et al.,1982; Laul et al., 1982). Many of the fines are richer particularlyin Al and Na (Papike et al., 1982). Apollo 16 soil 67461 exhibitsmafic enrichment (Mg and Fe) and lower Ca in the fine (<10 lm)fraction (Papike et al., 1982).If the upper (200 lm) layer measured consists mainly of thisfine fraction, X-ray remote sensing would find a compositiondifferent from the bulk composition of the lunar samples (sug-gested by Basu (1985)). The lunar samples returned havealways been collected as scoops and rock pieces and the veryfine fraction is mostly lost. Even the core tubes intended tostudy stratification in the regolith have been compressed whilethe core tubes were hammered in and we do not know the pos-sible layering in the upper tens of micron of the regolith. Recentexamination of the beta cloth on the Apollo 16 Clam Shell Sam-pling Devices (CSSDs) that were designed to sample the top100–500 lm of the lunar regolith suggest that the surfacemay contain a higher proportion of the less than 2 lm finesthan the bulk soil (Noble, 2010). Mechanisms such as electro-static levitation (Criswell, 1972), ballistic lofting and seismicshaking (Ostrach and Robinson, 2010) could over a long periodof time, concentrate the fine fraction of the soil on the top lay-ers. Thus C1XS observations could be revealing top surface
ce observations by the Chandrayaan-1 X-ray Spectrometer (C1XS): Results.04.010
S. Narendranath et al. / Icarus xxx (2011) xxx–xxx 13
chemistry which would be deviant from the bulk. The data onfines especially on highland soil fines are sparse and hence weare not able to provide supporting evidences for this possibility.
The composition derived with C1XS data is thus not an ‘exper-imental/analysis artifact’ and requires more detailed modeling toprovide conclusive evidences for the suggestions provided here.
10. Summary
In this paper we have described the methodology for X-rayspectral analysis of data from Chandrayaan-1 X-ray Spectrometerand presented the composition derived from for a region on thesouthern nearside highlands. This is the first direct simultaneousderivation of the abundance of five major elements (Mg, Al, Si, Caand Fe) at a scale of 50 km. The compositions derived are distinctfrom lunar compositions found in returned samples. The high Alabundance is suggestive of a highland terrain with a mafic compo-nent, but the corresponding Ca is much lower than in the returnedhighland soils. We discussed the possible scenarios under which,such a deviation could occur. We showed that the analysis meth-ods and instrument response modeling would not lead to thisand suggest that this could be revealing regions of higher sodic pla-gioclase or indicating a different chemistry of the fines in theuppermost layer of the regolith. Continued analysis of C1XS datacovering a larger region in the southern highlands would be moreconclusive of the above results and provide a greater understand-ing of the processes involved.
11. The C1XS team
M. Grande, A. Cook, J.A. Carter (University of Wales, Aber-ystwyth, UK), B.J. Maddison, B.J. Kellett, C.J. Howe, B.M. Swinyard(STFC, RAL, UK), P. Sreekumar, A. Shrivastava, S. Narendranath(ISRO, India), J. Huovelin L. Alha (Helsinki Univ, Finland), I.A. Craw-ford, S.Z. Weider (Birkbeck College London, UK), K.H. Joy (LPI, USA)C.L. Duston, O. Gasnaut, S. Maurice (CESR, Toulouse, France), D.Smith (Brunel Univ., UK), D. Rothery, M. Anand, A. Holland, J.Gow (Open University, UK), S.S. Russell (Natural History Museum,UK), J.N. Goswami (PRL, India), N. Bhandari (PRL, India), D. Law-rence (Los Alamos National Lab, USA), V. Fernandes (Universidadede Lisboa, Portugal), T. Okada (ISAS, Japan), C. Erd (ESTEC, ESA), D.Koschny (ESTEC), C. Pieters (Brown University), M. Wieczorek (IPGParis, France).
Acknowledgments
We thank Vaishali Sharan and D.A. Daniel at ISRO Satellite Cen-tre for programming support and Jason Gow at OU for useful com-ments. IAC and KHJ thank the Leverhulme Trust for financialsupport. We would also like to thank R. Korotev for discussion.OG participation to C1XS embarked on Chandrayaan-1 was sup-ported by the Centre National dEtudes Spatiales (CNES). This isLPI contribution number 1615. We thank the anonymous refereeand Dr.Lucy Lim (NASA/GSFC) for their useful comments whichhas greatly improved the manuscript.
References
Adler, I., Gerard, J., 1972. The Apollo 15 X-ray fluorescence experiment. Geochim.Cosmochim. Acta 3, 2157–2178.
Adler, I. et al., 1973a. Results of the Apollo 15 and 16 X-ray experiment. Geochim.Cosmochim. Acta 3, 2783–2801.
Adler, I. et al., 1973b. Apollo 15 and 16 results of the integrated geochemicalexperiment. The Moon 7, 487–504.
Alha, L. et al., 2009. Ground calibration of the Chandrayaan-1 X-ray Solar Monitor(XSM). Nucl. Instr. Meth. A 607, 544–553.
Please cite this article in press as: Narendranath, S., et al. Lunar X-ray fluorescenfrom the nearside southern highlands. Icarus (2011), doi:10.1016/j.icarus.2011
Arnaud, K.A., 1996. XSPEC: The first ten years. ASP Conf. Ser. 101, 17–20.Basu, A., 1985. Size compositional relationships in planetary regoliths and its role in
interpreting remote sensing data. Meteoritics 20, 605–606.Bhandari, N., Adimurthy, V., Banerjee, D., Srivastava, N., Dhingra, D., 2004.
Chandrayaan-1 lunar polar orbiter: Science goals and payloads. Proc. Int.Lunar Conf. 108, 33–42.
Clark, P.E., 1979. Correction, Correlation and Theoretical Intensity Consideration ofLunar X-ray Fluorescence Intensity Ratios. PhD thesis. University of Maryland,Maryland, USA.
Clark, P.E., Hawke, B.R., 1981. Compositional variation in the Hadley ApenineRegion. Proc. Lunar Planet. Sci. Conf. 12, 727–749.
Clark, P.E., Hawke, B.R., 1982. Geochemical classification of lunar highlands. Eos.Trans. AGU 63, 364.
Clark, P.E., Hawke, B.R., 1987. The relationship between geology and geochemistryin the Undarum/Spumans/Balmer region of the Moon. Earth, Moon Planets 38,97–112.
Clark, P.E., Hawke, B.R., 1991. The lunar farside: The nature of highlands east ofmare smythii. Earth, Moon Planets 53, 93–107.
Crawford, I.A. et al., 2009. The scientific rationale for the C1XS X-ray Spectrometeron India’s Chandrayaan-1 mission to the Moon. Planet. Space Sci. 57, 725–734.
Criss, J.W., 1976. Particle size and composition effects in X-ray fluorescence analysisof pollution samples. Anal. Chem. 48, 179–186.
Criss, J.W., Birks, L.S., 1968. Calculation methods for fluorescent X-ray Spectrometery:Empirical coefficients vs fundamental parameters. Anal. Chem. 40, 1080–1088.
Criss, J.W., Birks, L.S., Gilfrich, J.V., 1978. Versatile X-ray analysis programcombining fundamental parameters and empirical co-efficients. Anal. Chem.50, 33–37.
Criswell, D.R., 1972. Lunar dust motion. Geochim. Cosmochim. Acta 3, 2671–2680.Dachev, T., Tomov, B., Dimitrov, P., Matviichuk, Y., 2009. Monitoring the lunar
radiation environment: RADOM instrument on Chandrayaan-1. Curr. Sci. 96,544–546.
Demidova, S.I., Nazarov, M.A., Lorenz, C.A., Kurat, G., Brandsttter, F., Ntaflos, Th.,2007. Chemical composition of lunar meteorites and the lunar crust. Petrology15, 386–407.
Dere, K.P., Landi, E., Mason, H.E., Monsignori Fossi, B.C., Young, P.R., 1997. CHIANTI –An atomic database for emission lines. Astron. Astrophys. 129, 149–173.
Devine, J.M., McKay, D.S., Papike, J.J., 1982. Lunar regolith: Petrology of the <10 lmfraction. J. Geophys. Res. 87, 260–268.
Freeland, S.L., Handy, B.N., 1998. Data analysis with the solar soft system. Sol. Phys.182, 497–500.
Goswami, J.N., Annadurai, M., 2009. Chandrayaan-1. Curr. Sci. 96, 486–491.Grande, M. et al., 2007. The D-CIXS X-ray Spectrometer on the SMART-1 mission to
the Moon first results. Planet. Space Sci. 55, 494–502.Grande, M. et al., 2009. The C1XS X-ray Spectrometer on Chandrayaan-1. Planet.
Space Sci. 57, 717–724.Greenhagen, B.T. et al., 2010. Global silicate mineralogy of the Moon from the
diviner lunar radiometer. Science 329, 1507–1509.Grieken, R.V., Markowicz, A., 2002. Handbook of X-ray Spectrometry. Marcel
Dekker.Hall, D., Holland, A., Turner, M., 2008. Simulating and reproducing instrument
background for X-ray CCD spectrometers in space. Proc. SPIE 7021, 58–69.Haskin, L., Warren, P., 1991. Lunar Source Book: A User’s Guide to the Moon.
Cambridge Univ. Press, Cambridge, England, pp. 357–474.Howe, C.J. et al., 2009. Chandrayaan-1 X-ray Spectrometer (C1XS) instrument
design & technical details. Planet. Space Sci. 57, 735–743.Korotev, R.L., Joliff, B.L., Zeigler, R.A., Gillis, J.J., Haskin, L.A., 2003. Feldspathic lunar
meteorites and their implications for compositional remote sensing of the lunarsurface and the composition of the lunar crust. Geochim. Cosmochim. Acta 667,4895–4923.
Kushino, A., Ishisaki, Y., Morita, Y., Yamasaki, N.Y., Ishida, M., Ohashi, T., Ueda, Y.,2002. Study of the X-Ray background spectrum and its large-scale fluctuationwith ASCA. Publ. Astron. Soc. Jpn. 54, 327–352.
Landi, E., Del Zanna, G., Young, P.R., Dere, K.P., Mason, H.E., Landini, 2006. CHIANTI –An atomic database for emission lines VII: New data for X-rays and otherimprovements. Astrophys. J. 162, 261–280.
Laul, J.C., Papike, J.J., Simon, S.B., 1982. The lunar regolith: Comparative studies ofApollo and Luna sites. Chemistry of soils from Apollo 17, Luna 16, 20 and 24.Proc. Lunar. Planet. Sci. Conf. 12, 389–407.
Lawrence, D.J., Feldman, W.C., Barraclough, B.L., Binder, A.B., Elphic, R.C., Maurice, S.,Thomsen, D.R., 1998. Global elemental maps of the Moon: The Lunar Prospectorgamma-ray spectrometer. Science 281, 1484–1489.
Lim, L.F., Nittler, L., 2009. Elemental composition of 433 Eros: New calibration of theNEAR Shoemaker XRS data. Icarus 200, 129–146.
Lowe, B.G., Holland, A.D., Hutchinson, I.B., Burt, D.J., Pool, P.J., 2001. The sweptcharge device, a novel CCD-based EDX detector: First results. Nucl. Instr. Meth.A 458, 568–579.
Lucey, P.G., 1998. Model near-infrared optical constants of olivine and pyroxene as afunction of iron content. J. Geophys. Res. 103, 1703–1713.
Maruyama, Y., Ogawa, K., Okada, T., Kato, M., 2008. Laboratory experiments ofparticle size effects on X-ray fluorescence and implications to remote X-raySpectrometry of lunar regolith surface. Earth, Planets Space. 60, 293–297.
Maxwell, T.A., Strain, P.L., El-Baz, F., 1977. Mare crisium: Compositional Inferencesfrom low altitude X-ray fluorescence data. Proc. Lunar. Sci. Conf. 8, 933–944.
McKay, D.S., Heiken, G., Basu, A., Blandford, G., Simon, S., Reedy, R., French, B.M.,Papike, J., 1991. Lunar Source Book: A User’s Guide to the Moon. CambridgeUniv. Press, Cambridge, England, pp. 285–356.
ce observations by the Chandrayaan-1 X-ray Spectrometer (C1XS): Results.04.010
14 S. Narendranath et al. / Icarus xxx (2011) xxx–xxx
Metzger, A.E., 1993. Composition of the Moon as Determined from Orbit byGamma-ray Spectroscopy. Remote Geochemical Analysis: Elemental andMineralogical Composition. Cambridge Univ. Press, Cambridge, England, pp.341–364.
Morris, R.V., Score, R., Dardano, C., Heiken, G., 1983. Handbook of Lunar Soils. JSCPubl. No. 19069. Planetary Materials Branch Publ. 67. NASA Johnson SpaceCenter, Houston. p. 914.
Naranen, J., Parviainen, H., Muinonen, K., Carpenter, J., Nygard, K., Peura, M., 2008.Laboratory studies into the effect of regolith on planetary X-ray fluorescencespectroscopy. Icarus 198, 408–419.
Naranen, J., Carpenter, J., Parviainen, H., Muinonen, K., Fraser, G., Peura, M.,Kallonen, A., 2009. Regolith effects in planetary X-ray fluorescencespectroscopy: Laboratory studies at 1.7–6.4 keV. Adv. Space Sci. 44, 313–322.
Narendranath, S., Sreekumar, P., Maddison, B.J., Kellett, B.J., Howe, C.J., Erd, C.,Wallner, M., Weider, S.Z., 2010. Calibration of the C1XS Instrument onChandrayaan-1. Nucl. Instr. Meth. A 621, 344–353.
Nittler, L.R. et al., 2001. X-ray fluorescence measurements of the surface elementalcomposition of asteroid 433 Eros. Met. Plan. Sci. 36, 1673–1695.
Noble, S.K., 2010. Examining the uppermost surface of the lunar regolith. Proc.Lunar Planet. Sci. Conf. 41, 1505.
Ohtake, M. et al., 2009. The global distribution of pure anorthosite on the Moon.Nature 461, 236–240.
Okada, T., 2004. Particle size effect in X-ray fluorescence at a large phase angle:Importance on elemental analysis of asteroid Eros (433). Proc. Lunar Planet. Sci.Conf. 35, 1927.
Okada, T., Kuwada, Y., 1997. Effect of surface roughness on X-ray fluorescenceemission from planetary surfaces. Proc. Lunar Planet. Sci. Conf. 28, 1708.
Okada, T., Shirai, K., Yamamoto, Y., Arai, T., Ogawa, K., Hosono, K., Koto, M., 2006. X-ray fluorescence spectrometry of Asteroid Itokawa by Hayabusa. Science 312,1338–1341.
Okada, T., Shiraishi, H., Shirai, K., Yamamoto, Y., Arai, T., Ogawa, K., Kato, M., Grande,M., and the Selene XRS team, 2009. X-ray fluorescence spectrometer (XRS) onkaguya: Current status and results. Proc. Lunar Planet. Sci. Conf. 40, 1897.
Ostrach, L.R., Robinson, M.S., 2010. Effects of seismic shaking on grain size anddensity sorting with implications for constraining lunar regolith bulkcomposition. Proc. Lunar Planet. Sci. Conf. 41, 2521.
Papike, J.J., Simon, S.B., White, C., Laul, J.C., 1982. The relationship of the lunarregolith <10 lm fraction and agglutinates. Proc. Lunar. Planet. Sci. Conf. 12,409.
Please cite this article in press as: Narendranath, S., et al. Lunar X-ray fluorescenfrom the nearside southern highlands. Icarus (2011), doi:10.1016/j.icarus.2011
Prakash, A., 1975. Magnetospheric protons and electrons encountered by the Moonin the plasma sheet. The Moon 14, 71–78.
Prettyman, T.H., Jagerty, J.J., Elphic, R.C., Feldman, W.C., Lawrence, D.J., Mckinney,G.W., Vaniman, D.T., 2006. Elemental composition of the lunar surface: Analysisof gamma ray spectroscopy data from Lunar Prospector. J. Geophys. Res. 111,12007–12048.
Rousseau, R., Boivin, J., 1998. The fundamental algorithm: A natural extension ofSherman equation. The Rigaku J. 15, 13–28.
Sherman, J., 1955. The theoretical derivation of fluorescence X-ray intensities frommixtures. Spectrochim. Acta 7, 283–306.
Shirawai, T., Fujino, N., 1966. Theoretical calculation of fluorescent X-ray Intensitiesin fluorescent X-ray spectrochemical analysis. Jpn. J. Appl. Phys. 5, 886–899.
Swinyard, B.M. et al., 2009. X-ray fluorescence observations of the Moon by SMART-1/D-CIXS and the first detection of Ti-Ka from the lunar surface. Planet. SpaceSci. 57, 744–750.
Tertian, R., Claisse, F., 1982. Principles of Quantitative X-ray Fluorescence Analysis.Wiley.
Trombka, J.I. et al., 2000. The elemental composition of Asteroid 433 Eros: Results ofthe NEAR-Shoemaker X-ray Spectrometer. Science 289, 2101–2105.
Tucker, W., Koren, M., 1971. Radiation from a high temperature plasma: The X-rayspectrum of the solar corona. Astrophys. J. 168, 283–312.
Weider, S., Swinyard, B.M., Kellett, B.J., Howe, C.J., Joy, K.H., Crawford, I.A., Gow, J.,Smith, D.R. Planetary X-ray fluorescence analogue laboratory experiments andan elemental abundance algorithm for C1XS. Planet. Space. Sci. Submitted topublication.
Weider, S.Z., Kellett, B.J., Howe, C.J., Joy, K.H., Crawford, I.A., Swinyard, B., 2009. C1XSsurface roughness and phase angle experiments. In: Proc. X-ray FluorescenceSpectroscopy in Planetary Remote Sensing Workshop. Noordwijk, TheNetherlands. SP-687-691.
Wieczorek, M.A. et al., 2006. The Constitution and Structure of the Lunar Interior.Rev. Min. and Geochem. 60, 221–364.
Wyatt, M.B., Donaldson Hanna, K.L., Paige, D.A., Greenhagen, B.T., Helbert, J.,Maturilli, A., 2010. Diviner observations of pure plagioclase regions as identifiedby selene and the Moon mineralogy mapper. Proc. Lunar Planet. Sci. Conf. 41,2498.
Yin, L., Trombka, J.I., Adler, I., Bielefeld, M., 1993. X-ray Remote Sensing Techniquesfor Geochemical Analysis of Planetary Surfaces. Remote Geochemical Analysis:Elemental and Mineralogical Composition. Cambridge Univ. Press, Cambridge,England, p. 341.
ce observations by the Chandrayaan-1 X-ray Spectrometer (C1XS): Results.04.010


![38-40 Case Study Mark Nittler v3 docs...when enterprise resource planning (ERP) first rose to prominence 30 years ago. Then [German software company] SAP con-nected those dots and](https://static.fdocuments.in/doc/165x107/5f3187463d016e3693774fcd/38-40-case-study-mark-nittler-v3-docs-when-enterprise-resource-planning-erp.jpg)


