Luminescent Solar Concentrator Development - NREL · Gillette, for his numerous contributions to...
204
SERI/STR-211-3149 DE87001172 April 1987 Luminescent Solar Concentrator Development Final Subcontract Report 1 June 1982 - 31 December 1984 P. S. Friedman C. R. Parent for Owens/Illino is, Inc. Toledo , Ohio Prepared under Subcontract No. XE-2-02145-01
Transcript of Luminescent Solar Concentrator Development - NREL · Gillette, for his numerous contributions to...

SERI/STR-211-3149DE87001172
April 1987
Luminescent SolarConcentratorDevelopment
Final Subcontract Report1 June 1982 - 31 December 1984
P. S. FriedmanC. R. ParentforOwens/Illino is , Inc.Toledo, Ohio
Prepared under Subcontract No. XE-2-02145-01

SERI/STR-211-3149UC Category: 63DE87001172
Luminescent SolarConcentratorDevelopment
Final Subcontract Report1 June 1982 - 31 December 1984
P. S. FriedmanC. R. ParentforOwens/Illinois, Inc.Toledo, Ohio
April 1987
SERI Technical Monitor:J . Benner
Prepared under Subcontract No. XE-2-02145-01
Solar Energy Research InstituteA Division of Midwest Research Institute
1617 Cole BoulevardGolden, Colorado 80401-3393
Prepared for the
U.S. Department of EnergyContract No. DE-AC02-83CH10093
l
NOTICE
This report was prepared as an account of work sponsored by the United States Government. Neither theUnited States nor the United States Department of Energy. nor any of their employees. nor any of theircontractors. subcontractors, or their employees. makes any warranty. expressed or implied. or assumes anylegal liability or responsibility for the accuracy. completeness or usefulness of any information, apparatus.product or process disclosed, or represents that its use would not infringe privately owned rights.
Printed in the United States of AmericaAvailable from:
National Technical Information ServiceU.S. Department of Commerce
5285 Port Royal RoadSpringfield. VA 22161
Price: Microfiche A01Printed Copy A10
Codes are used for pricing all publications. The code is determined by the number of pages in the publication.Information pertaining to the pricing codes can be found in the current issue of the following publications.which are generally available in most libraries: Energy Research Abstracts. (ERA); Government ReportsAnnouncements and Index (GRA and I); Scientific and Technical Abstract Reports (STAR); and publication.NTIS-PR-360 available from NTIS at the above address.
ABSTRACT
The investigation of Luminescent Solar Concentrators (LSCs)
was initiated by the United States Department of Energy (DOE) at
Owens-Illinois, Inc. in 1978. The experimental and theoretical
results developed over the past six years have been summarized.
An assessment of the LSC technology has been compiled so as to
provide a concise description to guide future research in this
field. It is gratifying to note that since 1978, tremendous
progress has been made in the development of this device as a
practical non-imaging concentrator for achieving solar concen
tration ratios on the order of 10X. Perhaps the two most
important technical achievements, however, have been, first,
the understanding that dye self-absorption of radiated energy is
not as serious a problem as originally thought; and second, the
demonstration that organic dyes in polymeric hosts are capable
of surviving outdoors in bright sunlight for years without
ser ious degrada tion. System efficiencies approaching 4% have
been achieved for photovoltaic conversion and theoretical
efficiencies on the order of 9% appear feasible for large area
devices. Finally, the numerous accomplishments of the LSC
program have been achieved at a total DOE cost of only about
0.1 % of the research and development money spent on photo
voltaics.
-.{.-
ACKNOWLEDGEMENTS
This is the fourth and last Final Report on the
Luminescent Solar Concentrator (LSC) Development Program at
Owens-Illinois under the sponsorship of the United States
Department of Energy. Due to a corporate reorganization at
Owens-Illinois in early 1984, the LSC Group was disbanded,
thereby making completion of this report a much more difficult
task. In this regard, I am especially indebted to the patience
and understanding of John Benner at the Solar Energy Research
Institute. I would also like to formally thank my colleague
and friend, Bob Parent, who is now a senior physicist at
Gillette, for his numerous contributions to all aspects of the
LSC Program. Finally, my thanks to the many fine and talented
people whom I have had the pleasure of working wi th at Owens
Illinois over the past six years.
Pete~ S. Friedman
Vice-President
Research and Development
Photonics Technology, Inc.
-il-
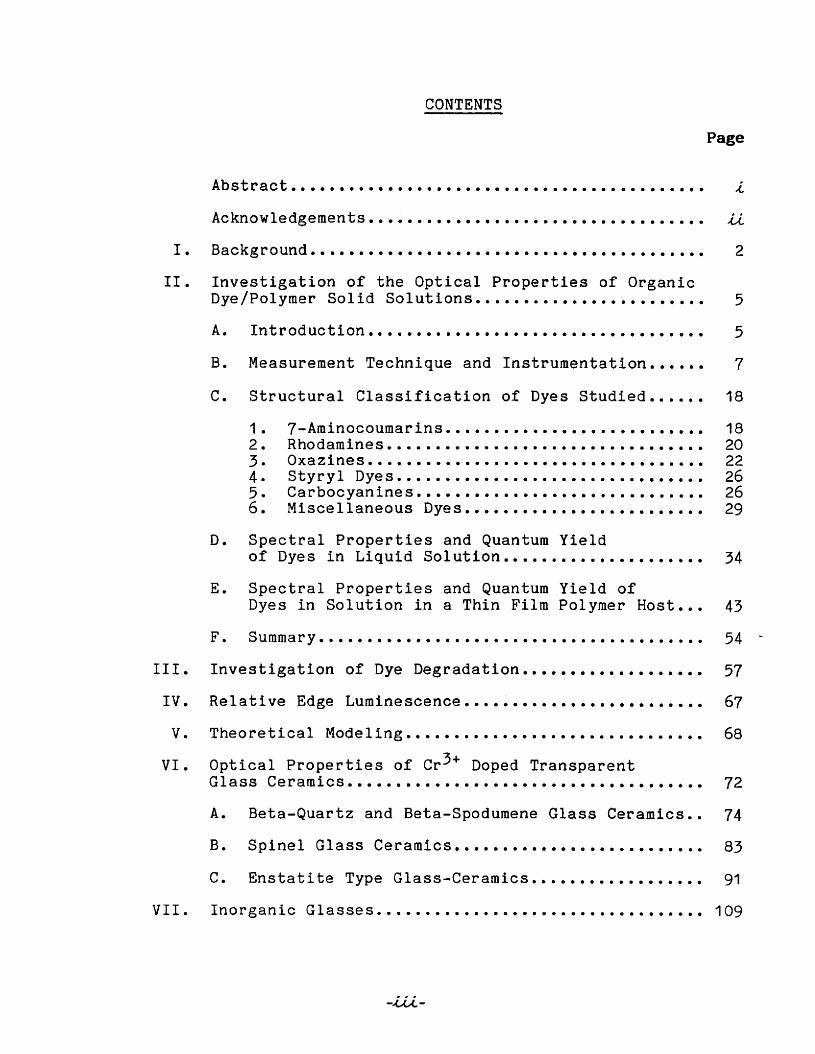
CONTENTS
Page
Abstract. • • • • • • • • • • • • • • • • • • • • • • • • • • . • • • • • • • • • • • • • • • i
Acknowledgements. • • • • • . • • • • • • • • • • • • • • • • • • . • • • • • . • • • U
I • Ba ckg r 0 und • • • • • • • • • • • • • • • • • • • • • • • • • • • • • • • • • • • • • • • • • 2
II. Investigation of the Optical Properties of OrganicDye/Polymer Solid Solutions........................ 5
A. Introduction................................... 5
B. Measurement Technique and Instrumentation...... 7
C. Structural Classification of Dyes Studied •.•.•• 18
1. 7-Aminocoumarins ••.•••.•••.•••••.•••••••••• 182. Rhodamines ••....•••..•.••..•••••••.••••••.. 203. OxazLne s , . . • • • . • • • . • • . . • • • • • • • . • • . • • • • . . • • • 224. Styryl Dyes •...•••••••..•••.•••.•••.••••••• 265. Carbocyanines .••••.•••••••••••••••.•.•••••. 266. Miscellaneous Dyes......................... 29
D. Spectral Properties and Quantum Yieldof Dyes in Liquid Solution ••.••••••.•.•••••••.• 34
E. Spectral Properties and Quantum Yield ofDyes in Solution in a Thin Film Polymer Host ••• 43
F. Summary........................................ 54
III. Investigation of Dye Degradation ••••••••••••••••••• 57
IV. Relative Edge Luminescence ••••••••••••••••••••••••• 67
v. Theoretical Modeling ••.••.....•••••••••••.••••••••• 68
VI. Optical Properties of Cr3+ Doped TransparentGlass Ceramics ••••••••••••••••••••••••••••••••••••• 72
A. Beta-Quartz and Beta-Spodumene Glass Ceramics •. 74
B. Spinel Glass Ceramics.......................... 83
c. Enstatite Type Glass-Ceramics ••.••••..•••••..•. 91
VII. Inorganic Glasses •..•..••••.•.•••.••••••••••.•••••• 109
-ui-

Page
VIII. Total Power Output of LSCs Compared toPhotovoltaic Cells ••••••••••••••••••••••••••••.•••• 117
IX. Applications of Luminescent Solar Concentrators •••• 122
X. Concluding Thoughts on the Future of LSCTechnology. . . . . . . . . . . . . . . . . . . . . . . . . . . . . . . . . . . . . . . .. 125
REFERENCES. • • • • • . • • • • • • • • • • • • • • • • • • • • • • • • • • • . • • • • • • • • • • • •• 127
APPENDIX 1. Dye Stability and Device StabilityData Tables •.....•...•........•...•.......... 131
APPENDIX 2. Relative Edge Luminescence Values forLSC Test Plates .•••••••••••••.•.•••••••••.••• 161
-.{.v-

TABLES
TABLE TITLE PAGE
1 • Contents of LSC Development, Final Report ToSandia, 1979 •••••••••••••• · . . 3
· . .2. Contents of LSC Development-I: Inorganic Glasses,Final Report t o. SERI, 1981 • • • • • • • • • 3
3. Contents of LSC Development-II, Final Report toSERI, 1983 •••••••••••••••• 4
Molecular Structure of Miscellaneous Dyes.
Molecular Structure of 7-Aminocoumarins. •
Molecular Structure of Carbocyanines •
Fluorescence Quantum Yields of Dyes Reported inthe Literature •••••••••••••••••
21
35
23
24
27
30
31
· . .
· . .
· . . . . . . . . .· .
Molecular Structure of Rhodamines.
Molecular Structure of Styryl Dyes •
Molecular Structure of Oxazines. •
4.
5.
6.
7.
8.
9.
10.
11 • Fluorescence Quantum Yields From LeastSquares Analysis . • • • • • • • . • • 37
12. Experimental Fluorescence Quantum Yield Data Usedin the Least Squares Analysis ••••••••••• 38
13. Fluorescence Quantum Yields of Dyes inLiquid Solution•••••••••••• · . . . . 41
Fluorescence Quantum Yields of Dyes in SolidSolution in Thin Films . . . . . . · · . · · · 44
Variation of Dye Quantum Efficiency with Host. 54
Protocol for LSC Degradation Studies . . · . · · · 58
Host Polymer Systems Evaluated . . · · . . . · . · · · 59
14.
15.
16.
17.
18. Dye/Solv2nt Stability for Brilliant Yellow after50 kWh/m Exposure • . • . • • • • . • • . • • . 60
19. Host Polymer Systems Selected for Dye ScreeningTe s t s • • • • • • • • • • • • • • • • • • • • • • 61
-v-
TABLES
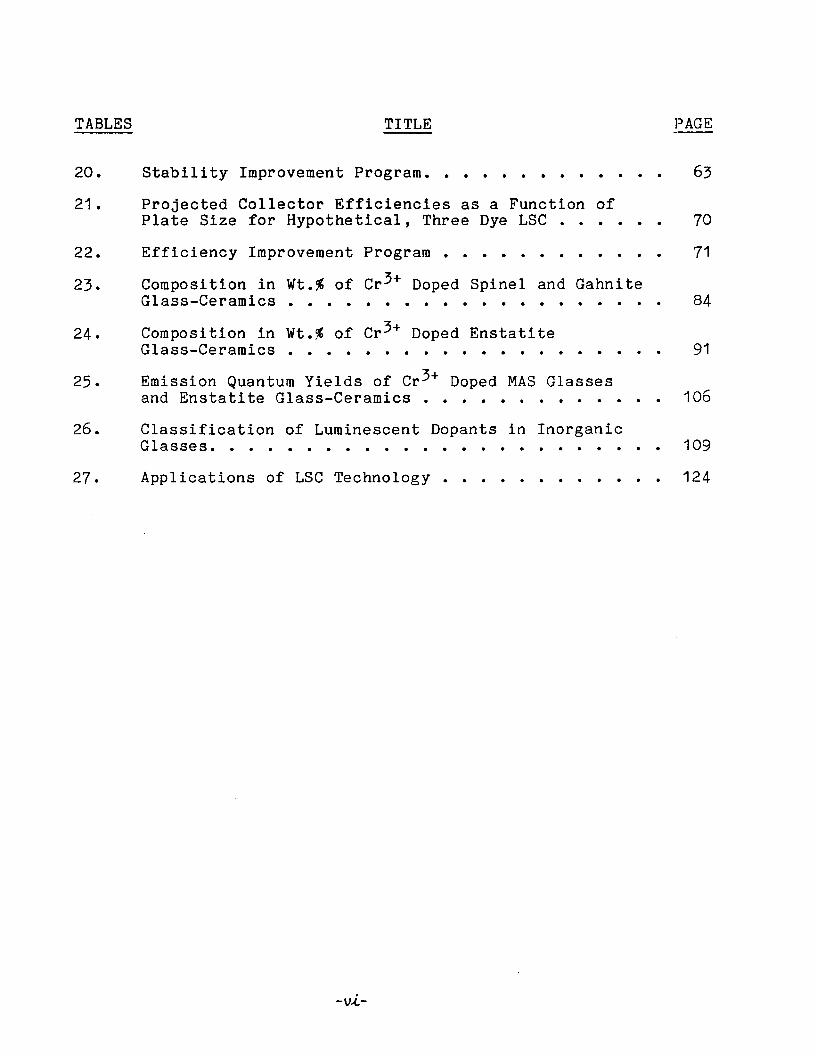
20.
21 •
22.
23.
24.
TITLE
Stability Improvement Program.
Projected Collector Efficiencies as a Function ofPlate Size for Hypothetical, Three Dye LSC
Efficiency Improvement Program • • • • • •
Composition in Wt.% of Cr3+ Doped Spinel and GahniteGlass-Ceramics • • • • • • • • • . . •• •••••
Composition in Wt.% of Cr3+ Doped EnstatiteGlass-Ceramics • • • • • • • . • • • • • • •
PAGE
63
70
71
84
91
25. Emission Quantum Yields of Cr3+ Doped MAS Glassesand Enstatite Glass-Ceramics. • • • • . • • • • • 106
26. Classification of Luminescent Dopants in InorganicGlasses. . . . . . . . . . . . . . . . . . . . . . .. 109
27. Applications of LSC Technology • • • • • • 124
-V..{.-

FIGURE
1 •
2.
ILLUSTRATIONS
TITLE
Organization of Owens-Illinois LSC DevelopmentProgram 1978-1984••••••••••••••••
Diagram of the Spectrofluorometer Front SurfaceEmission Sample Chamber ••••••••••••• · . .
PAGE
2
10
Excitation and Emission Spectra of LD 688 in aCAP 504.20 Thin Film · · · · · · · . . · · · · · · 50
Excitation and Emission Spectra of LOS 730 in aCAP 504.20 Thin Film · · • · · · · · · · · · · 52
Excitation and Emission Spectra of LOS 750 in aCAP 504.20 Thin Film · · · · · · · · · · · · · 53
Absorption and Emission Spectra of LOS 820 in aCAP Thin Film. . . . · · · · · · · · · · · · · 56
Stability of Day - Glo Brilliant Yellow inCellulose Acetate Crosslinked Melamine · · · • • · 64
Diagram of the Relative Geometries of the Sampleand the Excitation and Detected Emission Beams •
3.
4.
5.
6.
7.
8.
9.
10.
11 •
7-Aminocoumarin.
Rhodamine 110.
Oxazine 118. •
· . . . . . . . . . . .
. . .
13
19
20
22
12. Stability of Mobay LISA Amber 59-YR inPolycarbonate ••••••••••••• . . . . · . . . 65
13.
14.
Radiative Transport Efficiencies Calculated as aFunction of Logarithm of Transverse Absorbance ••••
Excitation Spectrum of Cr3+ : e-SpodumeneGlass-Ceramic•••••••••••••••••••••
69
77
15.
16.
17.
Emission Spectrum of Cr3+ : ~-SpodumeneGlass-Ceramic•.•••••••••
Energy Diagram of d3 Configuration in OctahedralCoordination •••••••••• J • • • • • •
R Line Emission of Cr3+ : S-Spodumene GlassCeramic at 0.25nm Resolution ••••••••
-vu-
· . . 78
79
80

FIGURE
18.
19.
TITLE
Excitation and Emission Spectra of Cr3+ :Aluminosilicate Glass (SC04) ••••••
Excitation and Emission Spectra of Cr3+ :Gahni te Glass-Ceramic (SC04) • • • • • • . . . .
PAGE
86
87
20.
21 •
22.
23.
24.
25.
26.
27.
28.
Absorption Spectra of Cr3+ Doped AluminosilicateGlass and Gahni te Glass-Ceramic.. •••••..•
EX§itation and Emission Spectra of the OpaqueCr +: MAS Glass-Ceramic SC12 •••••.•••
Composition Diagra~ of ~he 10% Ti02 Plane of theSystem MgO-A1 203-S102-Tl02 (Wt%) ••••••.•
Appearance of Samples SC13-SC18 Following ThermalGradient - Isothermal Two Step Heat TreatmentSchedule • • • • • . • . . . . . . . . • . . . .
Appearance of Samples SC20-SC22, SC24-SC26Following Thermal Gradient - Isothermal Two StepHeat Treatment Schedule •..•.....•...
Absorption Spectra of Cr3+ : MAS Composition SC22Before and After Heat Treatment .•...
Excitation and Emission Spectra of Cr3+ : MASGlass SC21 .•..•........
Excitation and Emission Spectra of Cr3+ : EnstatiteGlass-Ceramic SC21 . • • • . • . . . . . • . . . .
Excitation and Emission Spectra of Ce3+ Glass.
90
92
94
96
99
102
104
105
116
29. Variable Temperature Simulator with LSC Plate-to-CellCoupling Scheme. .•............... 118
30. Plate Efficiency as a Function of Temperature. . • . . 119
31. Total Power Output of LSCs Compared to PhotovoltaicCells 120
-vLU..-

I. BACKGROUND
This is the fourth and last Luminescent Solar Concentrator
Development Report, covering work performed at Owens-Illinoisfrom 1982 through, 1984. The Owens-Ill inois program, which
commenced-in 1978 was organized, as shown in Figure 1, into sixmajor tasks: inorganic glasses, organic systems, dye-polymer
stabil i ty, theoretical modeling, efficiency optimization, and
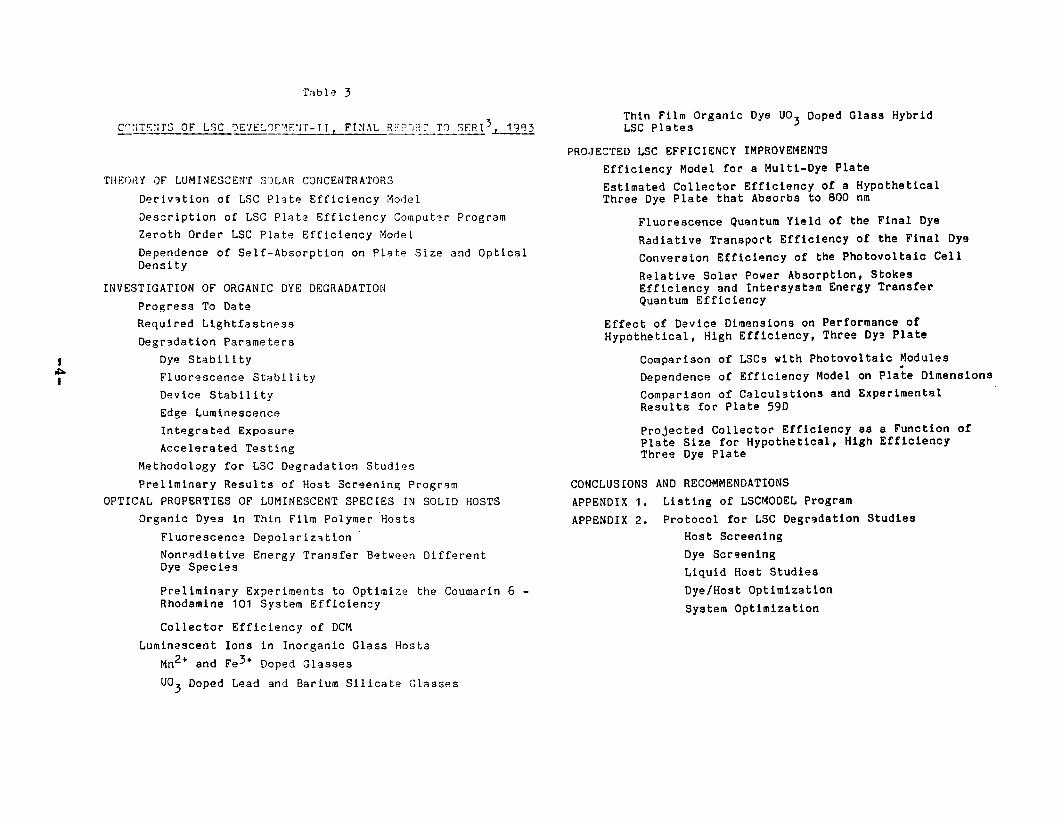
cost optimization. Most of the work on the various tasks hasbeen documented in earlier Reports 1 , 2 , 3 . In general, each of
these reports has dealt with a specific set of topics, many of
which have not been repeated in later reports. For thisreason, we include here, for the sake of complet~ness, the
Table of Contents 'of these previous reports.
LSCINORGANIC ORGANIC
DEVELOPMENTGLASSES SYSTEMS
PROGRAM
DYE/POLYMER
STABILITY
COST THEORETICAL EFFICIENCY
OPTIMIZATION MODELING OPTIMIZATION
Figure 1. Organization of Owens-Illinois LSC Development
Program 1978-1984
-2-
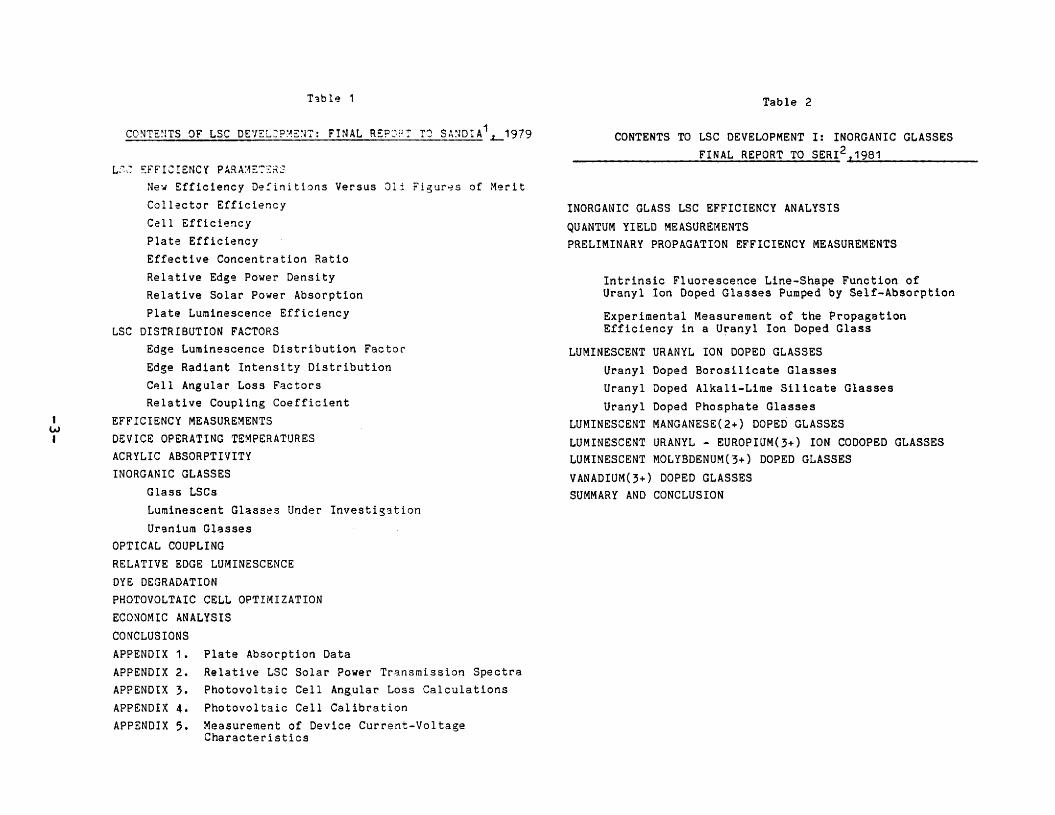
Plate Absorption DataRelative LSC Solar Power Transmission SpectraPhotovoltaic Cell Angular Loss CalculationsPhotovoltaic Cell CalibrationMeasurement of Device Current-VoltageCharacteristics
IwI
L:~ ~FFrCrENCY PARA~2~~~2
Ne~ Efficiency D~~initions Versus Oli Fi5ur~s of MeritCollector EfficiencyCell EfficiencyPlate EfficiencyEffective Concentration RatioRelative Edge Power DensityRelative Solar Power AbsorptionPlate Luminescence Efficiency
LSC DISTRIBUTION FACTORSEdge Luminescence Distribution FactorEdge Radiant Intensity DistributionCp.Il Angular Loss FactorsRelative Coupling Coefficient
EFFICIENCY MEASUREMENTSDEVICE OPERATING TEMPERATURESACRYLIC ABSORPTIVITYINORGANIC GLASSES
Glass LSCsLuminescent Glasses Under Investigation
Uranium GlassesOPTICAL COUPLINGRELATIVE EDGE LUMINESCENCEDYE DEGRADATIONPHOTOVOLTAIC CELL OPTIMIZATIONECONOMIC ANALYSISCONCLUSIONSAPPENDIX 1.APPENDIX 2.APPENDIX 3.APPENDIX 4.APPENDIX 5.
Table 2
CONTENTS TO LSC DEVELOPMENT I: INORGANIC GLASSESFINAL REPORT TO SERI2.,~19~8~1 ___
INORGANIC GLASS LSC EFFICIENCY ANALYSIS
QUANTUM YIELD MEASUREMENTSPRELIMINARY PROPAGATION EFFICIENCY MEASUREMENTS
Intrinsic Fluorescence Line-Shape Function ofUranyl Ion Doped Glasses Pumped by Self-Absorption
Experimental Measurement of the PropagationEfficiency in a Uranyl Ion Doped Glass
LUMINESCENT URANYL ION DOPED GLASSESUranyl Doped Borosilicate GlassesUranyl Doped Alkali-Lime Silicate Glasses
Uranyl Doped Phosphate GlassesLUMINESCENT MANGANESE(2+} DOPED GLASSES
LUMINESCENT URANYL - EUROPIUM(3+} ION CODOPED GLASSESLUMINESCENT MOLYBDENUM(3+} DOPED GLASSES
VANADIUM(3+) DOPED GLASSESSUMMARY AND CONCLUSION
T;jbli.! 3
C'l~IE:1TS OF' LSC ')EVEL')p"1ETr- I r, FINAL R'~?~J:1 r TO SER r 3 , 19'13Thin Film Organic Dye U0 3 Doped Glass HybridLSC Plates
PROJECTED LSC EFFICIENCY IMPROVEMENTSEfficiency Model for a Multi-Dye PlateEstimated Collector Efficiency of a HypotheticalThree Dye Plate that Absorbs to 800 nm
Fluorescence Quantum Yield of the Final Dye
Radiative Transport Efficiency of the Final DyeConversion Efficiency of the Photovoltaic Cell
Relative Solar Power Absorption, StokesEfficiency and Intersystem Energy TransferQuantum Efficiency
Effect of Device Dimensions on Performance ofHypothetical, High Efficiency, Three Dye Plate
Comparison of LSCs with Photovoltaic ~odules
Dependence of Efficiency Model on Plate DimensionsComparison of Calculations and ExperimentalResults for Plate 590
Projected Collector Efficiency as a Function ofPlate Size for Hypothetical, High EfficiencyThree Dye Plate
I.c:..I
TflErJH'{ ,)F LUM I NESCENT SJ LAR CONCENTRATORS
D~riv3tion of LSC P18t~ Effici~ncy ~orlel
Description of LSC PI~ta Efficiency Comput~r ProgramZeroth Order LSC Plate Efficiency ModelDependence of Self-Absorption on Plate Size and OpticalDensity
INVESTIGATION OF ORGANIC DYE DEGRADATION
Progress To DateRequired Lightfastness
Degradation ParametersDye StabilityFluorescence StabilityDevice StabilityEdge LuminescenceIntegrated ExposureAccelerated Testing
Methodology for LSC Degradation Studies
Preliminary Results of Host Screening ProgramOPTICAL PROPERTIES OF LUMINESCENT SPECIES IN SOLID HOSTS
Organic Dyes in Thin Film Polymer Hosts
Fluorescence DepolarizationNonradiative Energy Transfer Between DifferentDye Species
Preliminary Experiments to Optimize the Coumarin 6 Rhodamine 101 System Efficiency
Collector Efficiency of DCM
Luminescent Ions in Inorganic Glass HostsMn 2+ and Fe3+ Doped Glasses
U0 3 Doped Lead and Barium Silicate Glasses
CONCLUSIONS
APPENDIX 1.APPENDIX 2.
AND RECOMMENDATIONSListing of LSCMODEL ProgramProtocol for LSC Degradation Studies
Host ScreeningDye ScreeningLiquid Host Studies
Dye/Host Optimization
System Optimization

II. INVESTIGATION OF THE OPTICAL PROPERTIES OF
ORGANIC DYE/POLYMER SOLID SOLUTIONS
II.A. Introduction
Calculations have demonstrated the feasibility of
constructing a 10% device efficiency, multi-dye doped polymer
LSC. 3 Realization of this goal, however, requires the identi
fication of a set of dyes that simultaneously satisfy a number
of optical and stability criteria: 3 i) The set of dyes should
absorb roughly 85% or more of the solar power spectrum up to
wavelengths of 800 nm. Li ) Radiative or nonradiative energy
transfer from one dye species to another dye species (inter
system energy transfer) should approach 90% quantum efficiency.
iii) The fluorescence quantum yield of all dyes in the set
should be near unity. iv) The Stoke's shift of the ultimate
dye (longest wavelength emitting dye) should be large (3pproxi
rna te 1 y 3000 cm-1 or greate r ) . And v) the photodegrada t ion
lifetime of the dyes should be on the order of 10 years.
This section describes studies designed to identify dye/
polymer systems that satisfy the optical property criteria I )
through iv). The work was performed simul taneously wi th the
dye degradation studies described in Section III, and the
results from one series of investigations was used where
appropriate to limit the scope of the other series. The
optical properties of dyes with demonstrated poor stability
were not comprehensively studied, and conversely the photo
stabil i ties of dyes wi th demonstrated poor optical properties
were generally not measured.
-5-
The number of commercially available, luminescent dye/
polymer systems is too large for a comprehensive survey within
the scope of this contract; therefore, attention was primarily,
though not exclusively, focused on red to near-IR emitting
dyes. This strategy was recommended by three considerations.First, the efficiency of a multi-dye LSC depends more
cri tically on the optical properties of the ultimate dye than
on those of the shorter wavelength emitting dyes. Second, it
is anticipated that it is generally more difficult to achieve
high fluorescence quantum efficiency and photostability in long
wavelength emitting dyes. And, finally, the optical properties
of long wavelength emitting dyes are least well documented in
the literature. Shorter wavelength emitting dyes with adequateoptical properties have already been identified. Further
optical studies in the shorter wavelength regions were done
when dyes with particularly favorable stabilities wereidentified.
The optical properties of a particular dye/polymer system
measured were the absorption spectrum, the corrected emission
spectrum, and the fluorescence quantum yield. Quantum yields
were determined by a relative front surface emission intensity
technique.
Relative fluorescence intensities were first measuredamong a series of dyes in liquid solution whose absorbance
maximum ranged roughly between 350 and 750 nm. This series of
dye sol utions incl uded the small number of systems for which
reliable absolute quantum yields have been measured and
reported in the li terature. An intercomparison of the liquid
sol ution relative quantum yield measurements, therefore,
provided a check of the agreement of our measurements wi th
published values and established the quantum efficiency of a
series of solutions that would serve as fluorescence quantum
yield secondary standards.
-6-

The quantum efficiency of a dye of interest was then
measured in a number of thin film polymer host matrices
relative to a secondary fluorescence standard with similar
absorption and emission spectral distributions. Generally,
host polymers were chosen to incl ude polymers in which dyes
demonstrated good photostabili ty and chosen to span a reason
able variation in matrix polarity.
II.B. Measurement Technique and Instrumentation
The absorbance spectra of dyes were recorded wi th a Cary
17D UV-visible-near IR absorption spectrophotometer. Generally
analog recordings were obtained. However, the spectrophoto
meter has been interfaced to a PDP-11-03 minicomputer, and
digi tized spectra of promising dye systems were obtained and
stored on floppy disk for LSC computer simulation and relative
solar absorption calculations.
Emission spectra and fluorescence quantum yields were
determined with an SLM 8000 spectrofluorometer modified with an
in-house constructed front-surface emission sample holder.
Liquid samples were measured in 1 mm path length quartz
cuvettes, and thin fi 1m samples were measured wi th the thin
film facing the excitation optics. The excitation source was a
450W Xe arc lamp and emission was detected with an EMI 9658RA
extended red response 8-20 cooled photomul tipl ier tube.Emission intensity errors due to fluctuations or drift in
exci tation power were minimized by recording the ratio of the
emission signal to the output of a quantum counter which
monitored the intensity of the reflected component of the
exci tation beam passing through a quartz beam spli tter. The
excitation and emission monochromators were scanned with a
microprocessor ba se d controller, and digi tal electronics were
-7-

used for data acquisi tion, reduction, and storage. Corrected
emission spectra (in units proportional to photons per second
per unit wavelength interval) were obtained by multiplying
technical emission spectra by an emission spectra correction
function. The correction function itself was stored in non
volatile memory in the data acquisition microprocessor and was
generated by SLM personnel by calibrating the responsivi ty of
the emission monochromator /PMT wi th an NBS traceable standard
quartz halogen lamp.
In order to minimize fluorescence self-absorption, weakly
absorbing samples and a front surface emission configuration
were used for all emission spectra and quantum yie Id measure
ments. All relative quantum efficiencies reported here were
obtained from samples with a peak absorbance of less than 0.2.
It is estimated that errors from fluorescence self-absorption
effects in the integrated front surface emission intensi ty of
0.2 peak absorbance samples are less than 5%.
The use of weakly absorbing samples also minimized errors
in the recorded absorption spectra of the samples. The mono
chromator in the Cary 170 is between the light source and the
sample chamber; therefore, the detector responds to both the
transmitted component of the sample beam and fluorescent
radiation. In strongly absorbing samples, fluorescence emitted
into the ~olid angle that can strike the detector can approach
the intensi ty of the transmitted beam. However, for absor
bances less than 0.2, no absorbance errors associated with
fl uorescence were observed (monitored by moving the sample
from the left side to the right side of the sample chamber and
looking for changes in absorbance - the sample chamber width is
roughly the same as the distance from the chamber to the
detector).
-8-
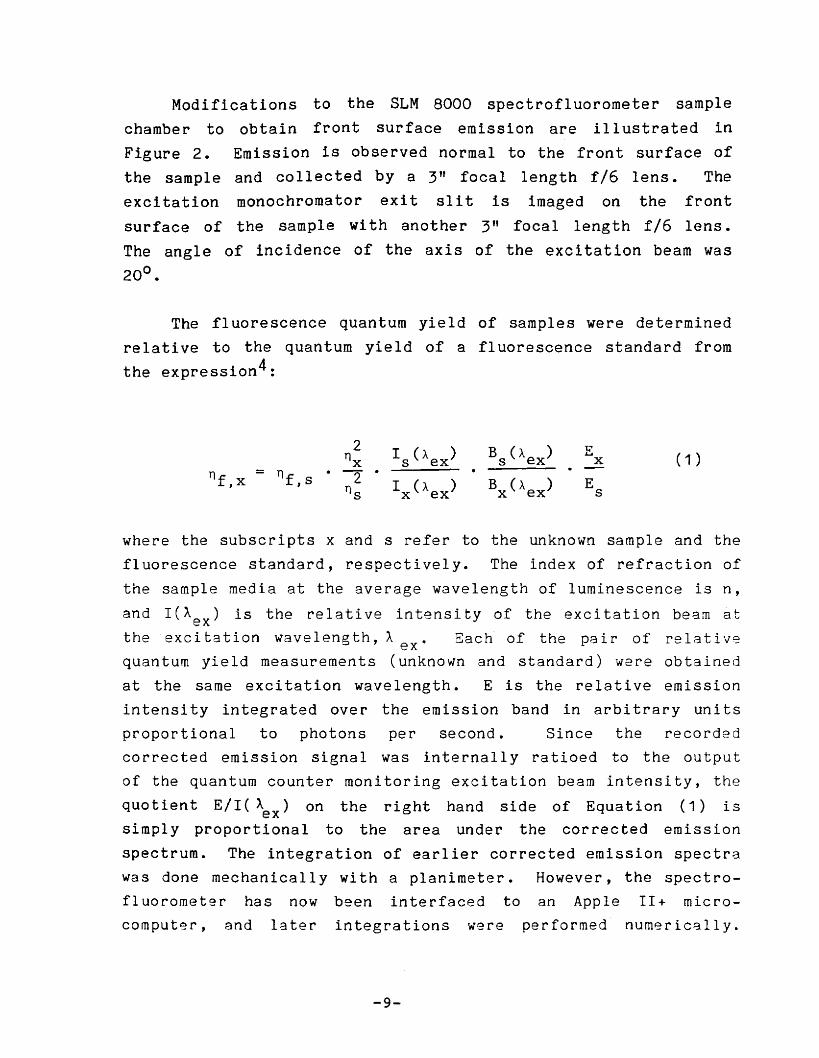
Modifications to the SLM 8000 spectrofl uorometer sample
chamber to obtain front surface emission are ill ustrated in
Figure 2. Emission is observed normal to the front surface of
the sample and collected by a 3" focal length f/6 lens. The
excitation monochromator exit slit is imaged on the front
surface of the sample wi th another 3" focal length f/6 lens.
The angle of incidence of the axis of the excitation beam was
20°.
The fluorescence quantum yield of samples were determined
relative to the quantum yield of a fluorescence standard from
the expression4 :
2 I (A )nx S ex
= n • - •f,s 2 I (A )ns x ex
Ex
Es
( 1 )
where the subscripts x and s refer to the unknown sample and the
fluorescence standard, respectively. The index of refraction of
the sample media at the average wavelength of luminescence is n,
and I(A ex ) is the relative intensity of the excitation beam at
the excitation wavelength, A ex. Each of the pair of relativequantum yield measurements (unknown and standard) were obtained
at the same excitation wavelength. E is the relative emission
intensity integrated over the emission band in arbitrary units
proportional to photons per second. Since the recorded
corrected emission signal was internally ratioed to the output
of the quantum counter monitoring excitation beam intensity, the
quotient Ell ( \x) on the right hand side of Equation (1) issimply proportional to the area under the corrected emission
spectrum. The integration of earlier corrected emission spectra
was done mechanically with a planimeter. However, the spectro
fluorometer has now been interfaced to an Apple 11+ micro
comput~r, and later integrations were performed numerically.
-9-


The remaining term on the right hand side of Equation (1) is
B(A ), the fraction of excitation power absorbed by the sample,exwhich was determined from:
(2)
the sample absorbance at the excitationnormal to the front surface and Q is the
rof the axis of the excitation beam within
where A(A ) isexwavelength measured
angle of refraction
the sample.
Precautions were taken to minimize two potential sources
of error associated with the measurement of B(A ) • Theexthickness of thin films varied typically on the order of 10%
over the face of a plate; therefore, care was taken to measure
A(Aex) and E at the same location on a plate. Furthermore, it
was often necessary to choose an excitation wavelength at
values where the variation of A(A) with A was large. To avoid
errors that may have arisen because of 8. relative miscalibra
tion of the wavelength scales of the Cary 170 monochromator and
the SLM 8000 excitation monochromator, the first was calibrated
wi th respect to the second by measur ing the absorption and
excitation spectra of a Eu3+ doped soda-lime silicate glass.
Eu3+ has a number of sharp absorption lines (line width at half
maximum of approximately 2 nm) between 350 and 600 nm that are
also readily observed in the excitation spectrum.
A third, less obvious source of error in the measurement
of the quantum yield of samples relative to that of a
fluorescence standard, particularly when the absorbance at
-11-

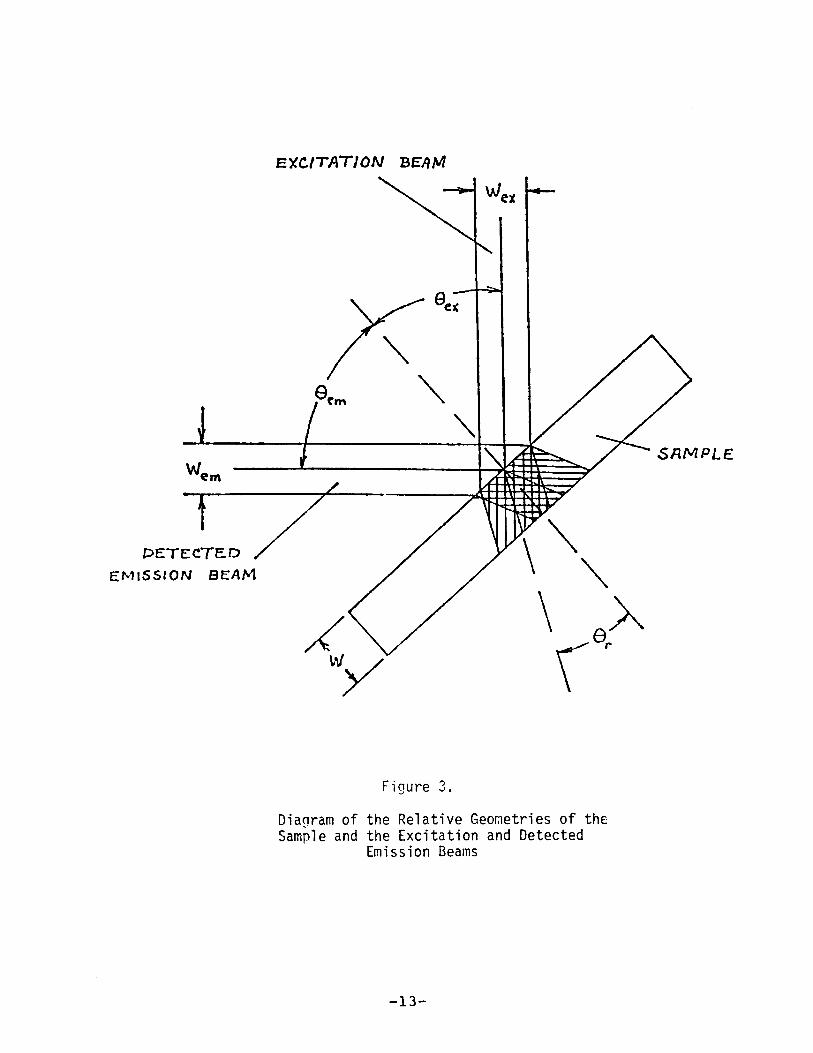
Aex or the thickness of unknown and standard differ significantly, is the dependence of measured emission intensity on the
relative geometry of the sample and the emission and excitation
optics. This potential problem will be discussed with the aid
of Figure 3. If We x is the width of the excitation beam at thesample (equal to the excitation monochromator slit width times
the magnification of the excitation optics), then the volume of
the sample excited to luminescence is represented by the
vertically ruled area in Figure 3. The excitation beam (and
the detected emission beam) is not actually collimated at the
sample as illustrated in Figure 3; however, in order to
simplify the discussion wi thout greatly sacrificing accuracy,
collimation will be assumed.
If each photon emitted from the exci tat ion vol ume at an
angle gem were collected by the emission optics, the emissionintensity would be proportional to the relative excitation
power absorbed , given by Equation (2). However, the emission
optics only collects photons emitted from a volume whose width
is We'Tl' the width of the emission monochromator en trance sl itimaged on the sample. Therefore, the sample volume whose
2mission can be detected (collection volume) is represented by
the horizontally ruled area in Figure 3.
It is clear by inspecting Figure 3 that unless the thick
ness and absorbance at Ae x of the unknown sample and referencestandard are the same, the quantum yield of the unknown
r9lative to the standard will not generally be given by
Equations 1 and 2. In only two cases do additional complex
geomefrical factors disappear, and one can be confident that
relative quantum yields are given by Equations (1) and (2).
Case a) occurs when the luminescent volume is completely
included within the collection volume. In terms of excitation
and emission monochromator bandwidths, t::, \x and t::, \m' it can be
shown that this requires that:
-12-
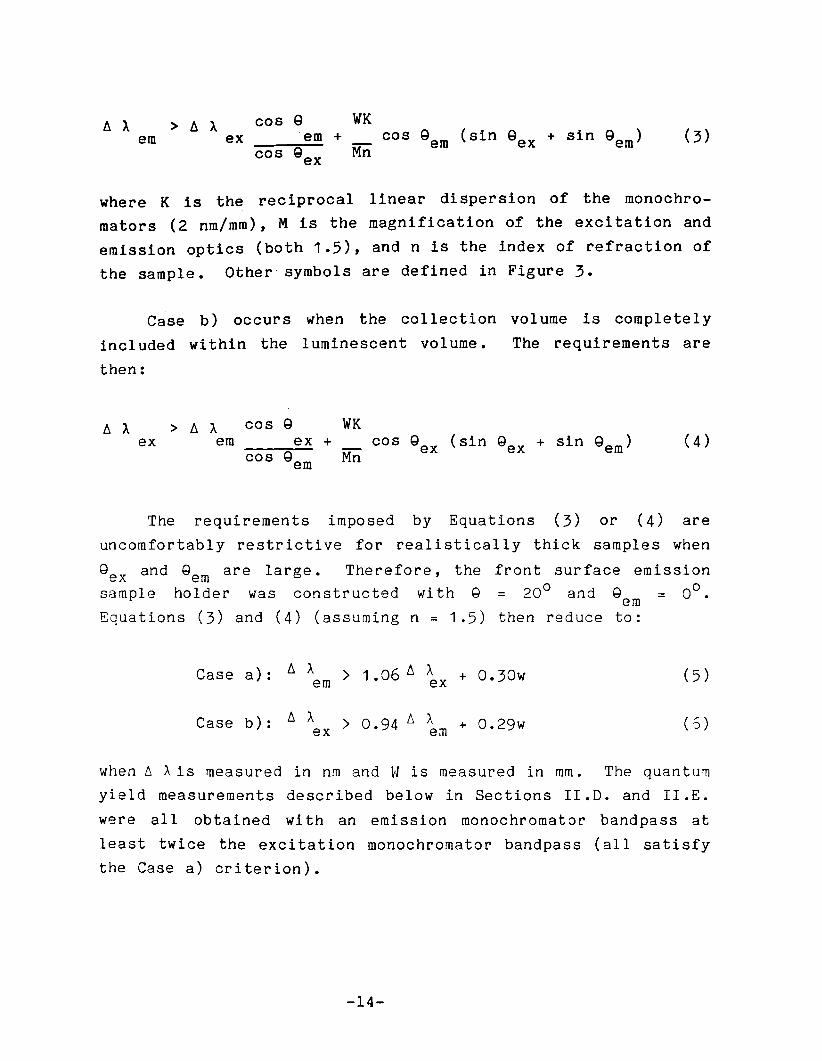
em> /). A
excos Q
em +cos Qe x
WK
where K is the reciprocal linear dispersion of the monochromators (2 nm/mm), M is the magnification of the excitation and
emission optics (both 1.5), and n is the index of refraction of
the sample. Other symbols are defined in Figure 3.
Case b) occurs when the collection volume is completely
incl uded wi thin the 1uminescent vol ume , The requirements are
then:
ex> /). A
emcos Q
ex +cos Qem
WK
The requirements imposed by Equations (3) or (4) are
uncomfortably restrictive for realistically thick samples when
Qe x and Qem are large. Therefore, the front surface emissionsample holder was constructed wi th Q = 20 0 and Q = 00
•emEquations (3) and (4) (assuming n = 1.5) then reduce to:
Case a): /). A > 1.06 /). A + 0.30wem ex
Case b): /). A > 0.94 6 A + o. 29wex em ( :;)
when 6 Ais measured in nm and W is measured in mm. The quantumyield measurements described below in Sections 11.0. and II.E.
were all obtained wi th an emission monochromator bandpass at
least twice the excitation monochromator bandpass (all satisfythe Case a) criterion).
-14-

A final concern in the measurement of relative quantum
efficiencies, particularly for dyes in a thin film host, is the
influence of fluorescence anisotropy. Earlier measurements of
the fluorescence polarization anisotropy of coumarine-6 in a
CAB thin film showed that depolarization is near complete
(anisotropy parameter r - 0) in heavi ly doped fi lms (coumarin-6
concentration :: 10-2 mol/L) and incomplete (r:: 0.3) in more
lightly doped films (concentration ~ 10-3 mol/L) .3 The
depolarization mechanism in heavily doped films was assigned to
rapid nonradiative energy transfer. The polarization aniso
tropy of dyes in low viscosity solvents is near zero because of
rapid rotational depolarization. The thin film samples used
for quantum yield measurements were lightly doped to minimize
fluorescence self-absorption; therefore, it was anticipated
that fluorescence intensity and polarization would be
anisotropic.
Fluorescence anisotropy effects were determined by the
formalism of Cehelnik, Mielenz, and Velapoldi. 5 One defines
the three parameters F, G, and D as follows: F is the ratio of
vertically to horizontally polarized excitation photon flux
density at the peak excitation wavelength; G is the ratio ofsensitivities of the emission monochromator/detection system to
vertically divided by horizontally polarized components at the
peak emission wavelength; and D is a quanti ty related to the
anisotropy parameter by:
1 + 2ro =
1 - r
These three parameters may be evaluated from experimental
measurements via the set of coupled equations:
-15-

vRy ( a )
= DGv
RH ( a )
v ( a )RH= F/GH ( a )Ry
H( a )RH
{COS2 a (l/D) sin2 a } /FG= +
RY
(a )y
(8a)
(8b)
(8c)
where R3 (a) is the spectrofluorometer response with polarizersin the excitation and emission beam paths, i and j denoting the
orientation of excitation and emission polarizers, respectively
(V = vertical, H = horizontal), and a is the internal angle
between excitation and detected emission beams.
Cehelnik et ale have shown that the ratio of fluorescence--intensity measured at a, I(a ), to the intensity averaged over
all angles, 10
, both measured without polarizers in excitationor emission beam paths is given by
I ( a)
10
'lFG(l + 2r) + G(l - r) + F(l - r) + { (l - r) + 3rcos'" o l
=-------------------------(l + F)(l + G)
(9)
Emission spectra reported here were all recorded without a
polarizer in the excitation path and with a vertical component
transmitting Glan-Thompson polarizer in the emission beam path.
-16-
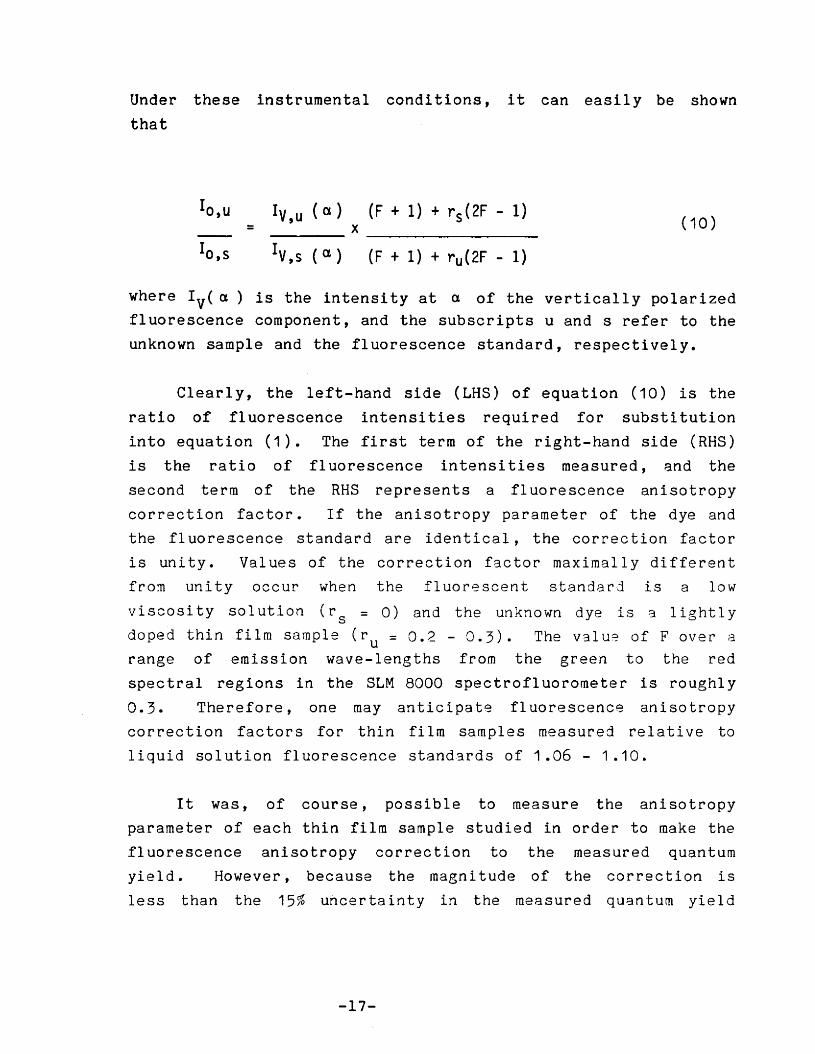
Under these instrumental condi tions, it can easily be shown
that
lo,u IV,u (a) (F + 1) + r s(2F - 1)
la,s= x ---------
(F + 1) + ru(2F - 1)
(10)
where IVC a ) is the intensi ty at a of the vertically polarizedfluorescence component, and the subscripts u and s refer to the
unknown sample and the fluorescence standard, respectively.
Clearly, the left-hand side (LHS) of equation (10) is the
ratio of fluorescence intensities required for substitution
into equation (1). The first term of the right-hand side (RHS)
is the ratio of fluorescence intensities measured, and the
second term of the RHS represents a fluorescence anisotropy
correction factor. If the anisotropy parameter of the dye and
the fluorescence standard are identical, the correction factor
is uni t y , Val ues of the correction factor maximally different
from unity occur when the fluorescent standard is a low
viscosity solution (r s = 0) and the unknown dye is ::1 lightly
doped thin film sample (r u = 0.2 - 0.3). The v31u2 of F over arange of emission wave-lengths from the green to the red
spectral regions in the SLM 8000 spectrofluorometer is roughly
0.3. Therefore, one may anticipate fluorescence anisotropy
correction factors for thin film samples measured relative to
liquid solution fluorescence standards of 1.06 - 1.10.
It was, of course, possible to measure the anisotropy
parameter of each thin film sample studied in order to make the
fluorescence anisotropy correction to the measured quantum
yield. However, because the magni tude of the correction is
1essthan the 15% unc e r t a in t yin the measure d qua ntum y i e 1d
-17-

that arises from other factors, the fl uorescence anisotropy
correction factor was ignored.
II.C. Structural Classification of Dyes Studied
Central to chemistry is the belief that physical and
chemical properties can be understood and ultimately predicted
on the basis of molecular structure. Unfortunately, the
present state of understanding of the optical and energy
transfer properties of organic dyes does not allow one to makemore than general qualitative statements about the relationship
between dye structure and those optical properties that are
crucial to the development of a high efficiency LSC.
The principal purpose of this section is to catalog the
molecular structure of the large number of dyes that have been
investigated for this report, and to classify the dyes
according to molecular structure. Where previous studies
reported in the literature have illuminated structure-property
relationships that are pertinent to the present investigation,
these will be reviewed.
The majori ty of the dyes studied here are commercially
available laser dyes. A lesser number of luminescent dyes that
have been commer icall y deve loped pr inc i pall y for di sp 1ay or
decorative applications have also been studied. Because they
are examples of a large number of structural types, they have
been grouped below under miscellaneous dyes. Also included in
this group are a number of proprietary dyes for which struc
tural information has not been released.
II.C. 1. 7-Aminocoumarins
Derivatives of 7-aminocoumarin are the most important
-18-
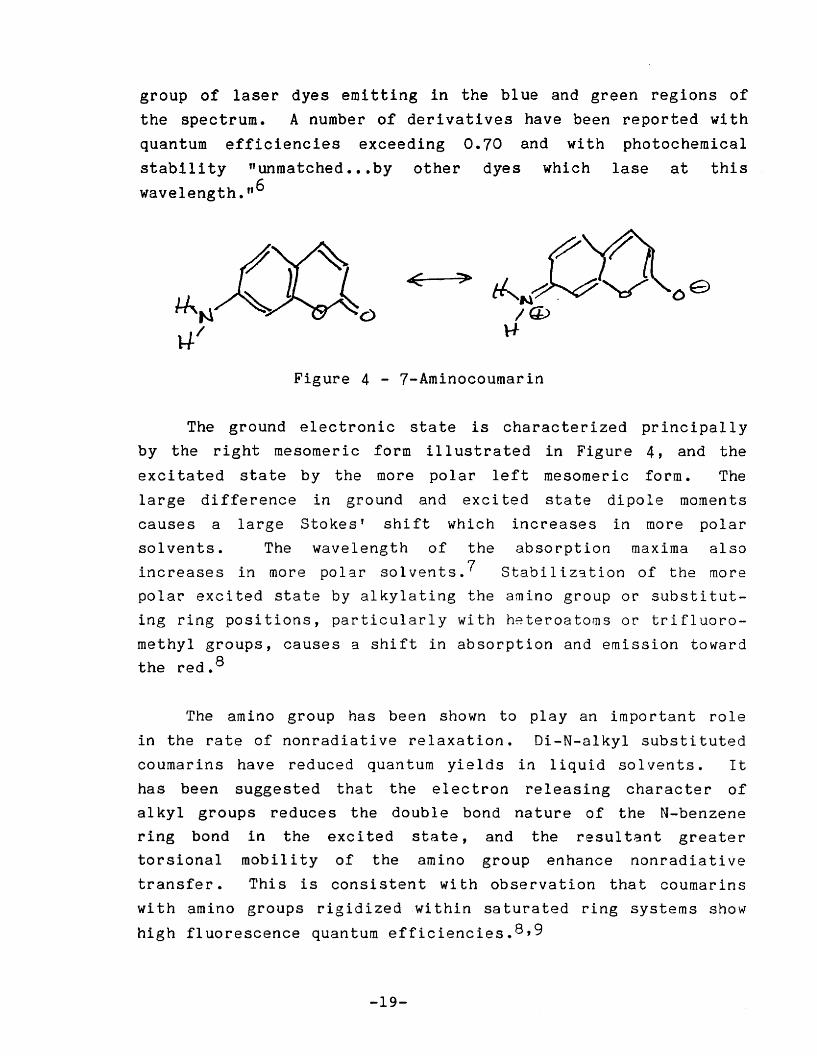
group of laser dyes emitting in the blue and green regions of
the spectrum. A number of derivatives have been reported with
quantum efficiencies exceeding 0.70 and with photochemical
stability "unmatched ••• by other dyes which lase at this
wavelength. ,,6
Figure 4 - 7-Aminocoumarin
The ground electronic state is characterized principally
by the right mesomeric form ill ustrated in Figure 4, and the
exei tated state by the more polar left mesomeric form. The
large difference in ground and exei ted state dipo l e moments
causes a large Stokes' shift which increases in more polar
solvents. The wavelength of the absorption maxima also
increases in more polar solvents. 7 Stab i l Lza t i on of the more
polar excited state by alkylating the amino group or substitut
ing ring positions, particularly with heteroatoms or trifluoro
methyl groups, causes a shift in absorption and emission toward
the red. 8
The amino group has been shown to play an important role
in the rate of nonradiative relaxation. Di-N-alkyl substituted
coumarins have reduced quantum yields in liquid solvents. It
has been suggested that the electron releasing character of
al kyl groups reduces the double bond nature of the N-benzene
ring bond in the excited state, and the resultant greater
torsional mobility of the amino group enhance nonradiative
transfer. This is consistent wi th observation that coumarins
with amino groups rigidized within saturated ring systems show
high fluorescence quantum efficiencies. 8 , g
-19-
The structure of the 7-aminocoumarins investigated for
this report are presented in Table 4.
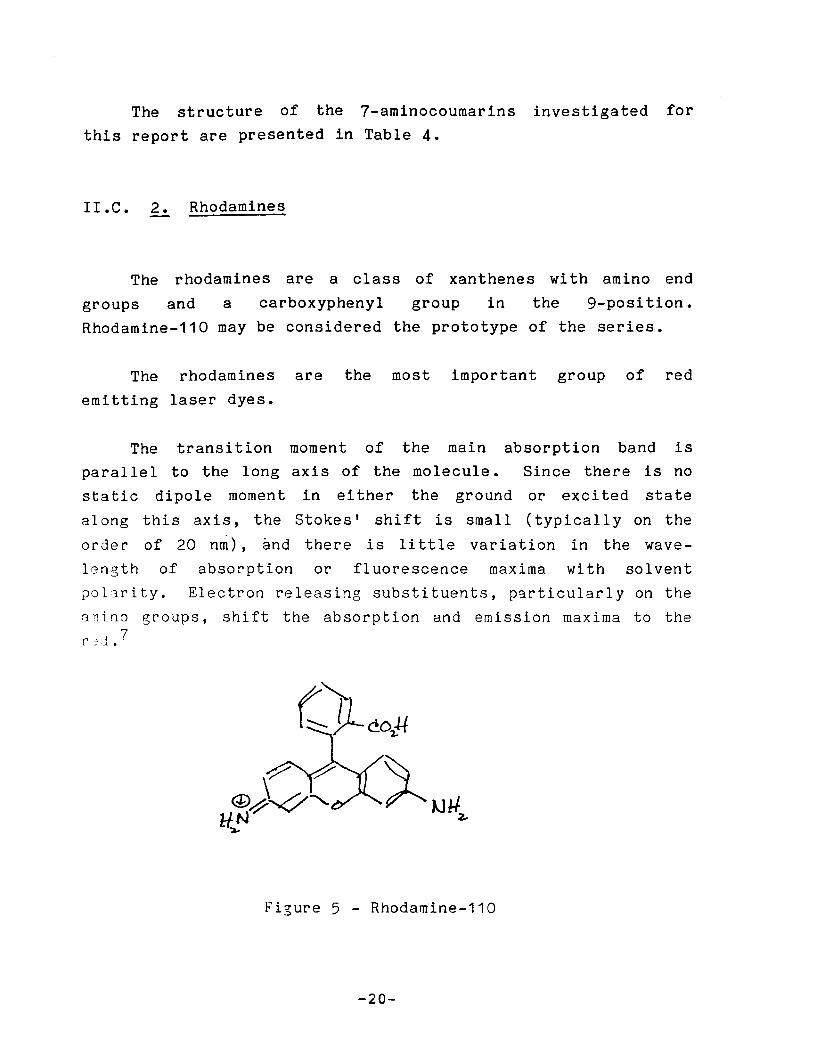
II.C. 2. Rhodamines
The rhodamines are a class of xanthenes with amino end
groups and a carboxyphenyl group in the 9-position.
Rhodamine-110 may be considered the prototype of the series.
The rhodamines are the most important group of red
emitting laser dyes.
The transition moment of the main absorption band is
paralle 1 to the long axis of the molecule. Since there is no
static dipole moment in ei ther the ground or exci ted state
along this axis, the Stokes' shift is small (typically on the
order of 20 nm) , and there is Ii ttle variation in the wave
lGngth of absorption or fluorescence maxima with solvent
polarity. Electron releasing substituents, particularly on the
an i no groups, shift the absorption and emission maxima to the7re.I ..
Figure 5 - Rhodamine-110
-20-

Table 4
Molecular Structure of 7-Aminocoumarins
EastmanName
ExcitonName Structure
Coumarin-1 Coumarin-460
Coumarin-6 Coumarin-540
Coumarin-153
-21-
Coumarin-540A
Substi tuents on the amino group affect the nonradiati ve
transi tion rate in a manner, and apparently by a mechanism,
that is similar to ,that operating in 7-aminocoumarins.
Rhodamines with two alkyl substi tuents on each ni trogen have
fluorescence quantum efficiencies that vary strongly withsolvent and temperature. Rhodamines wi th amino groups
rigidized within rings have temperature insensitive, near unity
quantum efficiencies. 7 , 10
The structure of rhodamines studied here can be found in
Table 3.
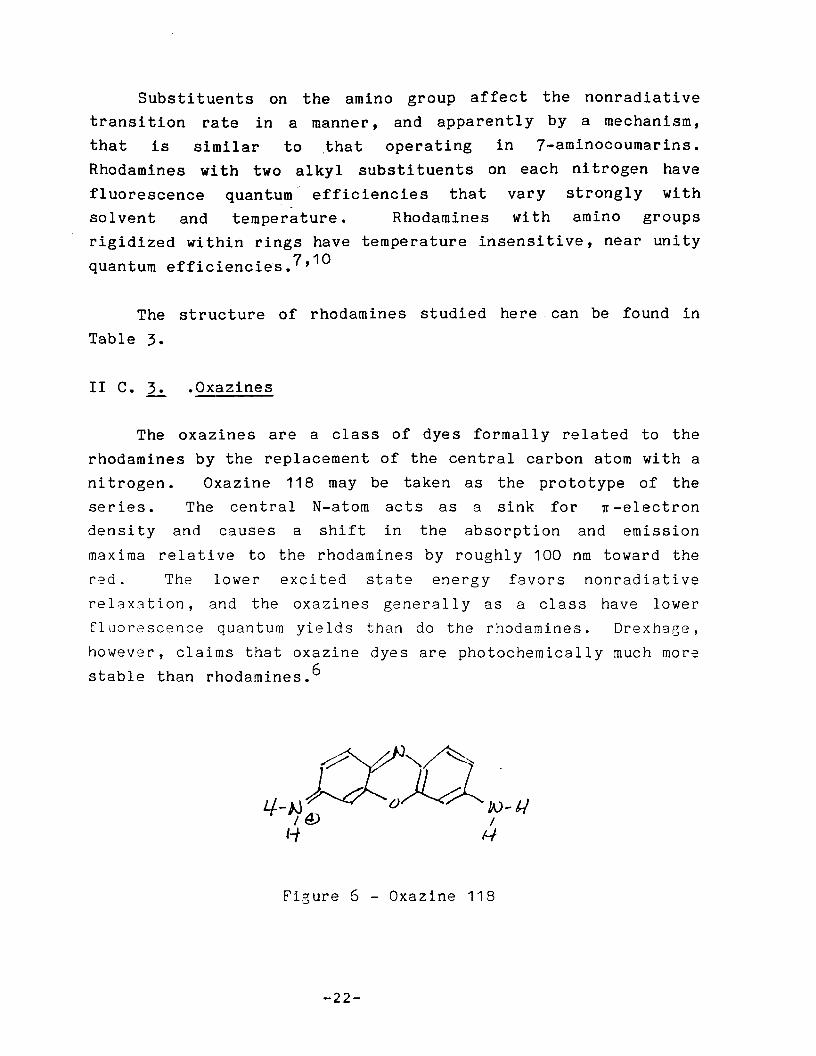
II c. 3. .Oxazines
The oxazines are a class of dyes formally related to the
rhodamines by the replacement of the central carbon atom with a
ni trogen • Oxazine 118 may be taken as the prototype of the
series. The central N-atom acts as a sink for 1T -electron
density and causes a shift in the absorption and emission
maxima relative to the rhodamines by roughly 100 nm toward the
r e d . The
relaxation,
lower excited state energy favors nonradiative
and the oxazines generally as a class have lower
fluorescence quantum yields than do the rhodamines. Drexhage,
however, claims that oxazine dyes are photochemically much more
stable than rhodamines. 6
Figure 5 - Oxazine 118
-22-
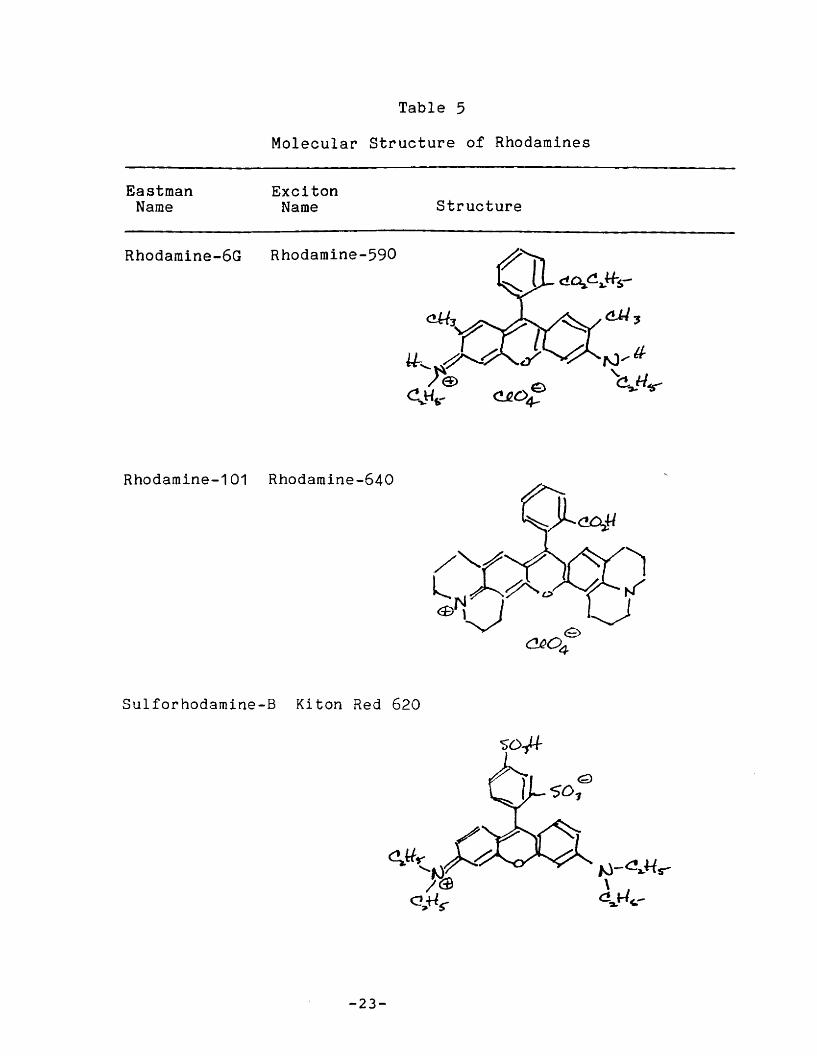
Table 5
Molecula~ structure of Rhodamines
EastmanName
ExcitonName structure
Rhodamine-6G Rhodamine-590
Rhodamine-101 Rhodamine-640
Sulforhodamine-B Kiton Red 620
-23-

The transition moment is again parallel to the long axis
of the molecules, and there is no static dipole moment along
this axis in either the ground or excited state. Therefore,
the Stokes' shift is small (typically about 30 nm).
Internal rotation of the terminal amino groups affect
quantum yields in a way that is again very similar to the
effect observed in 7-aminocoumarins and rhodamines. If one or
both amino groups is fully alkylated, the quantum yields are
low in low viscosity solvents (ethanol) and somewhat higher,
but sti 11 low, in high viscosi ty so 1vents (ethylene gl yco 1) •
If, however, each amino group carries at least one H, a
multi-phonon process involving N-H vibrations seems to be the
principal nonradiative relaxation mechanism. Oxazines of this
structural type have quantum efficiencies in methanol or
ethanol in the range 0.5-0.7. In deuterated alcohol solution,
H-D exchange results in quantum efficiencies increased to the
range 0.8-0.9. 11
The molecular structure of oxazines that have been
investigated here are presented in Table 6.
Table 6
Molecular Structure of Oxazines
EastmanName
ExcitonName Structure
Oxazine 1 Oxazine 725
-24-

Oxazine 4
Oxazine 170 Oxazine 720
C~esyl
VioletCresylViolet 670
Nile Blue Nile Blue690
OX3zine 750 Proprietary Structure
-25-
II. C. ~ Styryl Dyes
The group of arylidene laser dyes loosely classfied under
this heading are all formally derivatives ofp-dimethylaminostyrene. The structure of the dyes investigated
here are given in Table 7.
OCM was the first member of the group commercially
available. It is characterized by broad absorption and
emission bands (emission is in the red region of the spectrum)
separated by a large Stokes' shift (160 nm in OMSO). A quantum
efficiency of 0.71 in OMSO has been reported. 12 The Stokes'
shift is considerably diminished when OCM is cast in PMMA. 13
The spectral properties of other members of the group are
broadly similar, with absorption and emission shifted farther
to the red. Quantum yields of roughly 0.7 in ethylene glycol
have been reported for LDS 730, LOS 750, and LDS 820. 14
The most distinctive structural feature of the styryl dyes
is the dissimularity of the two aromatic ring systems that are
linked by the polymethine chain. This suggests that the dipole
moment in the ground and excited states are considerably
different, and may account for the large Stokes' shift observed
in polar liquid solution and the reduced Stokes' shift observed
in a rigid medium. 15
II.C. 5. Carbocyanines
Members of this group are among the few dyes known that
"ire relatively stable and fluoresce well in the near-infrared
re~ion of the spectrum. Structurally, the majority of the dyes
are composed of two identical heteronuclear aromatic rings
-26-
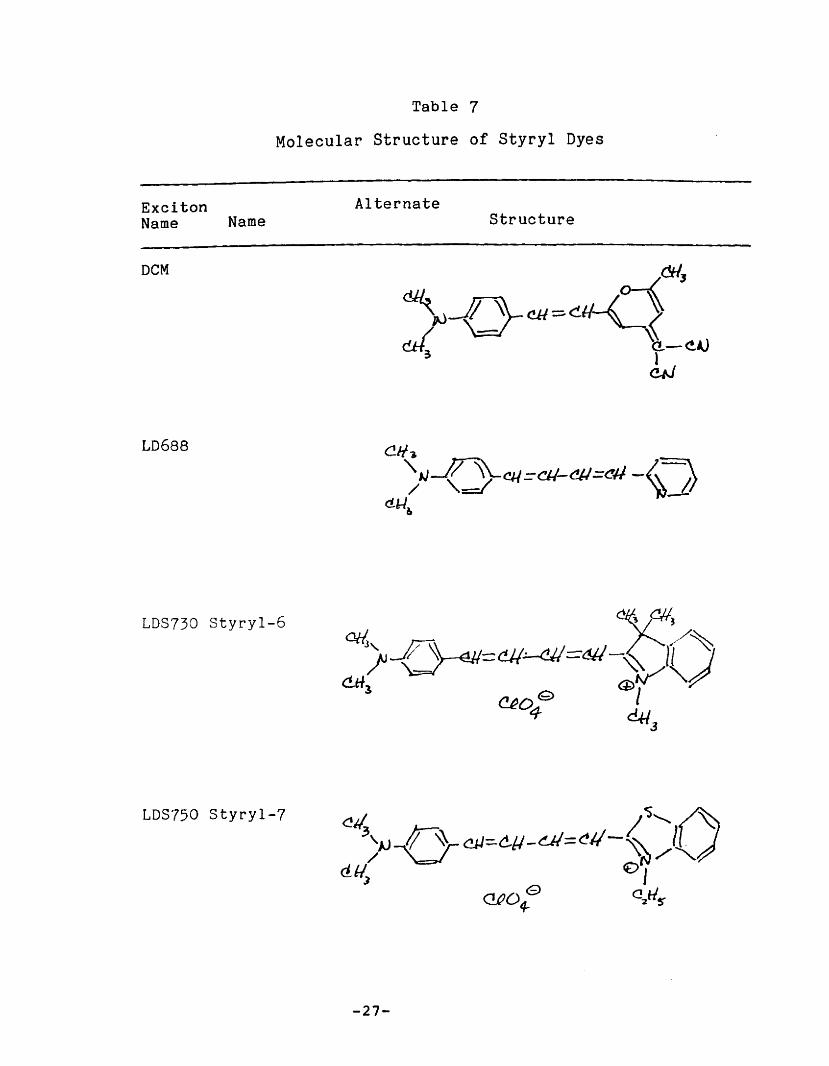
Table 7
Molecular Structure of Styryl Dyes
ExcitonName Name
oeM
LD688
LDS730 styryl-6
LDS750 Styryl-7
AlternateStructure
-27-

LDS751 Styryl-8
LDS820 Styryl-9
LDS798 Styryl-11 Structure unknown
-28-

symmetrically linked by a polymethine chain with an odd number
of C-atoms. If A represents an aromatic nucleus, the group may
be represented by A=CH( -CH=CH)n-A• The earliest synthesizedmembers of the group were derivatives of quinoline; therefore,
dyes in which A is a quinoline nucleus and n = 1, are called incommon nomenclature carbocyanines. The dicarbocyanines,
tricarbocyanines, etc. are higher vinylene homologs with n = 2,
3, ••. etc. Numerous carbocyanine dyes have since been prepared
with bases other than quinoline. If A represents
benzothiazole, benzoxazole, or indole, the dyes are named,
respectively, thiacarbocyanines, oxacarbocyanines, and
indocarbocyanines. 16
Of the large number of red to near-IR emi tting carbocya
nine dyes commercially available, to date we have only investi
gated four. Their structures may be found in Table 8.
The carbocyanines make an interesting comparison with the
styryl dyes. Both groups are members of the larger class of
polymethine dyes. However, the carbocyanines, unlike the
styryl dyes, are symmetric along their long axis and (like the
rhodamines and oxazines) have small Stokes' shifts.
II.C. 6. Miscellaneous Dyes
The molecular structure (where known) of those dyes that
have been studied and which do not fall conveniently into one
of the previous classes are presented in Table 9. Also
presented (where known) are the Color Index name and the Color
Index number of each dye. The dyes are listed in order of
increasing wavelength of maximum emission.
It should be noted that BASF Thermoplast Fluorescent
-29-
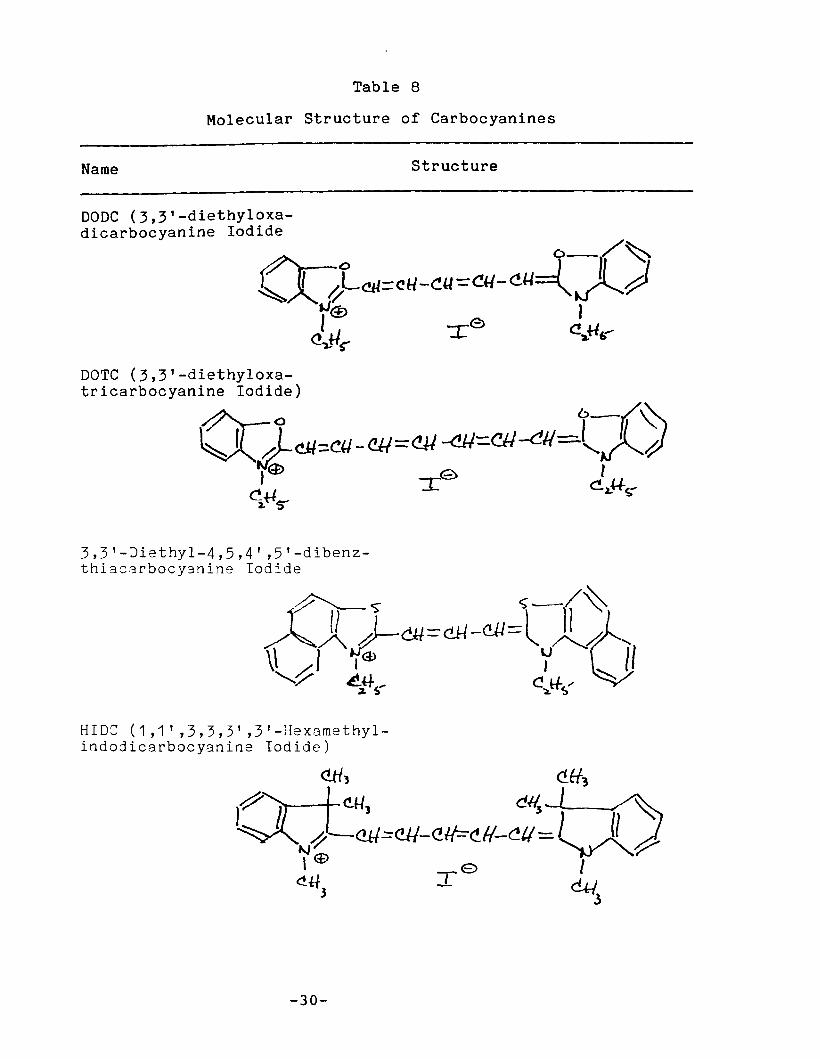
Table 8
Molecular Structure of Carbocyanines
Name Structure
DODC (3,3'-diethyloxadicarbocyanine Iodide
~ o-/~~)(.}-Cll=(,H-~«-=:CU-<'-U=()lJ
JJ(£> JI e
Q.JJ~ :r: C!,.H~
DOTC (3,3'-diethyloxatricarbocyanine Iodide)
3,3'-Jiethyl-4,5,4' ,5'-dibenzthia8arbocyanine Iodide
HIDe (1,1' ,3,3,3' ,3'-Hexamethylindodicarbocyanine Iodide)
-30-

Table 9
Molecular Structure of Miscellaneous Dyes
Name(C.l. Name - C.l. Number)
Quinine Sulfate
Mobay MacrolexFluorescent Yellow 10GN(Solvent Yellow 160)
Acridine Yellow
Hoechst Hostasol Yellow8G (Solvent Yellow 126)
BASF Fluorol Green Gold084 (Solvent Green 5·C. I. No. 59075)
-31-
Structure
A coumarin of unknown structure
A xanthene of unknown structure

BASF F1uoro1 Yellow 088(Solvent Green 4 - C.l.No. 45550)
Hoechst Hostaso1 Yellow3G (Solvent Yellow 98)
Day-G10 Brilliant Yellow
Exciton F1uoro1 555
Day-Clo Brilliant Orange
Acridine Red
BASF Thermoplast Fluorescent Orange 274 (SolventOrange 90)
-32-
A xanthene of unknown structure
Unknown structure
Unknown structure
Absorption and emission spectrasuggests that the dye is aderivative of 3,4,9,10pery1enebis (dicarboximide)

Hoechst Hostasol Red GG(Solvent Orange 63)
A thioxanthenestructure
of unknown
Hoechst Hostasol Red 58 orMobay Macrolex FluorescentRed 58 (Vat Red 41 - C.I.No. 73300)
-33-
Orange 274 is apparently a commercially available member of a
series of experimental perylene dyes that have been recently
reported and which have near unity quantum efficiency and high
photostability.
II. D. Spectral Properties and Quantum Yield
of Dyes in Liquid Solution
Quantum yields of dyes in liquid solution were measured inorder to check the accuracy of our measurement technique and to
provide a set of secondary fluorescence standards with emission
maxima extending from the blue to the far red.
Relati ve quantum yields (the ratio of the quantum effi
ciency of a sample dye to that of a standard dye) were
determined by the relative fluorescence intensity method
described in Section II.B. Emission intensi ties were measured
from solutions in 1 mm thick quartz cuvettes at concentrations
such that the peak dye absorbance/mm was 0.2. Typically, this
required dye concentrations of 5 x 10⁻⁶ - 3 x 10⁻⁵ mol/L. 4
pair of solutions involved in any individual relative quan t un
yield measurement could be selected whenever the two absorption
spectra sufficiently overlapped to allow exci tat ion of bothsolutions at the same wavelength. A single 1 mm thick uranyl
glass sample was also involved in the measurements.
The fi r s t se r ie s of measurements were designed pr imar i 1Y
to assess the accuracy of our experimental technique. The
quantum yield of a number of dyes in liquid solution that
absorb and fl uoresce in spectral regions of interest to our
program have been reported in the literature. Literatureval ues determined by techniques that should yield an accuracy
of +10% or less are aum'n a r Lz ed in Table 10. Relative quantum
yields involving all of the dy2s in Table 10 were then measured
-34-
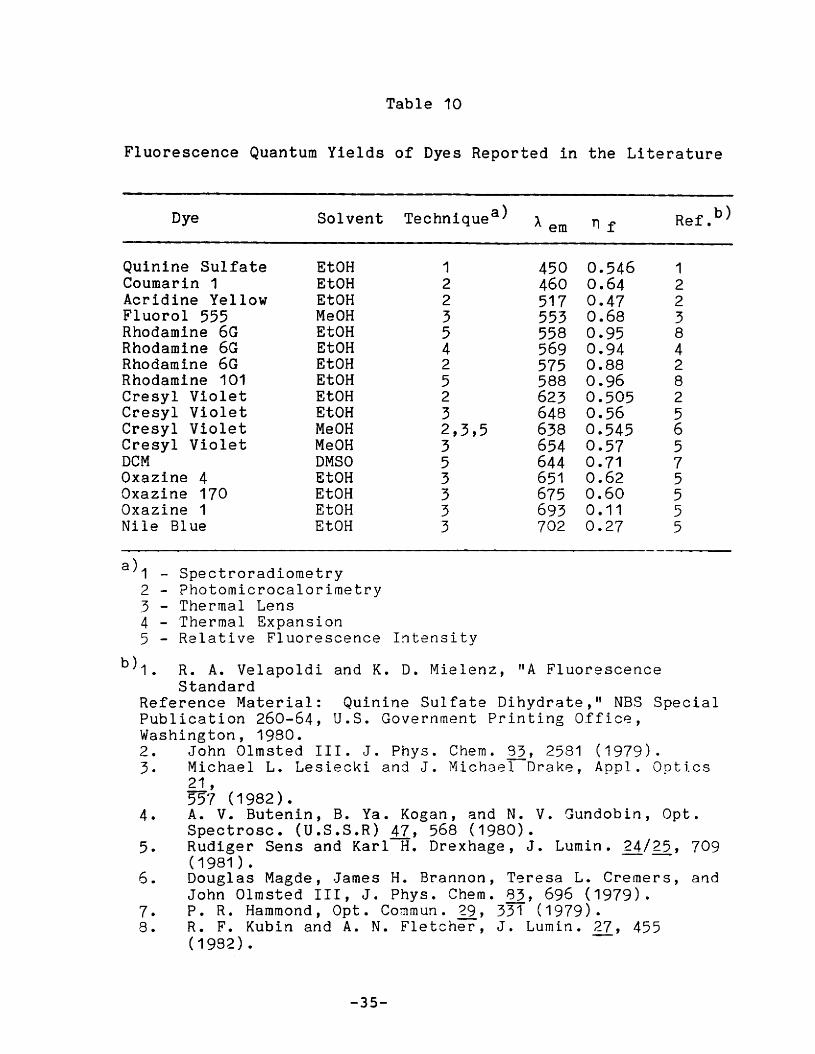
Table 10
Fluorescence Quantum Yields of Dyes Reported in the Literature
Dye Solvent Technique a)A em n f Ref. b )
Quinine Sulfate EtOH 1 450 0.546 1Coumarin 1 EtOH 2 460 0.64 2Acridine Yellow EtOH 2 517 0.47 2Fluorol 555 MeOH 3 553 0.68 3Rhodamine 6G EtOH 5 558 0.95 8Rhodamine 6G EtOH 4 569 0.94 4Rhodamine 6G EtOH 2 575 0.88 2Rhodamine 101 EtOH 5 588 0.96 8Cresyl Violet EtOH 2 623 0.505 2Cresyl Violet EtOH 3 648 0.56 5Cresyl Violet MeOH 2,3,5 638 0.545 6Cresyl Violet MeOH 3 654 0.57 5DCM DMSO 5 644 0.71 7Oxazine 4 EtOH 3 651 0.62 5Oxazine 170 EtOH 3 675 0.60 5Oxazine 1 EtOH 3 693 0.11 5Nile Blue EtOH 3 702 0.27 5
a)1 - Spectroradiometry2 - Photomicrocalorimetry3 - Thermal Lens4 - Thermal Expansion5 - Relative Fluorescence Intensity
b)1. R. A. Velapoldi and K. D. Mielenz, "A FluorescenceStandard
Reference Material: Quinine Sulfate Dihydrate," NBS SpecialPublication 260-64, u.s. Government Printing Office,Washington, 1980.2 • John 0 1ms ted I I I. J. PhYs , Che rn , 9 3, 2581 (1 979) .3. Michael L. Lesiecki and J. Michaer-Orake, Appl. Optics
21 ,557 (1982).
4. A. V. Butenin, B. Va. Kogan, and N. V. Gundobin, Opt.Spectrosc. (U.S.S.R) 47, 568 (1980).
5. Rudiger Sens and Karl~. Drexhage, J. Lumin. 24/25, 709(1981). --
6. Douglas Magde, James H. Brannon, Teresa L. Cremers, andJohn Olmsted III, J. Phys. Chern. 83, 696 (1979).
7. P. R. Hammond, Opt. Commun. ~9, 331 (1979).8. R. F. Kubin and A. N. Fletcher, J. Lumin. 27, 455
(1982). -
-35-
here, and the reliability of both our values and the literature
values were assessed by the consistency of the two sets.
It was observed that our measurements were in poor
agreement with the quantum yields in the literature for Fluorol
555 (MeOH), OCM (OMSO), and nile blue (EtOH). The quantum
yield of Nile Blue in ethanol (0.27) was determined by Sens and
Orexhage by the thermal blooming method 11 • The technique is
essentially a calorimetric method and liable to large percen
tage errors when applied to low luminescence efficiency dyes17•
Therefore, it is felt that the quantum yield of nile blue
reported by Sens and Orexhage may have an uncertainty on the
order of ~50%. For the same reason the reported quantum yield
of oxazine 1 (0.11 ) was considered unre 1iable , al though
agreement with our measurements was very good. The quantum
yield of purified OCM, in OMSO (0.71) was determined by Hammond
by the relative fluorescence intensity method 12• Hammond
claimed that OCM from a commercial source showed an inferior
dye laser performance due to the presence of an impurity. Our
measurements were performed on OCM as received from the vendor
(Exc i ton), and impur i tie s in our sample s may account for the
lower quantum efficiencies reported here. The quantum
efficiency of Fluorol 555 in methanol (J.63) was measured by
Lesiecki and Drake by the thermal blooming method 18. We both
used samples as received (Exci ton) and the· source of the poor
agreement between our two sets of measurements is unknown.
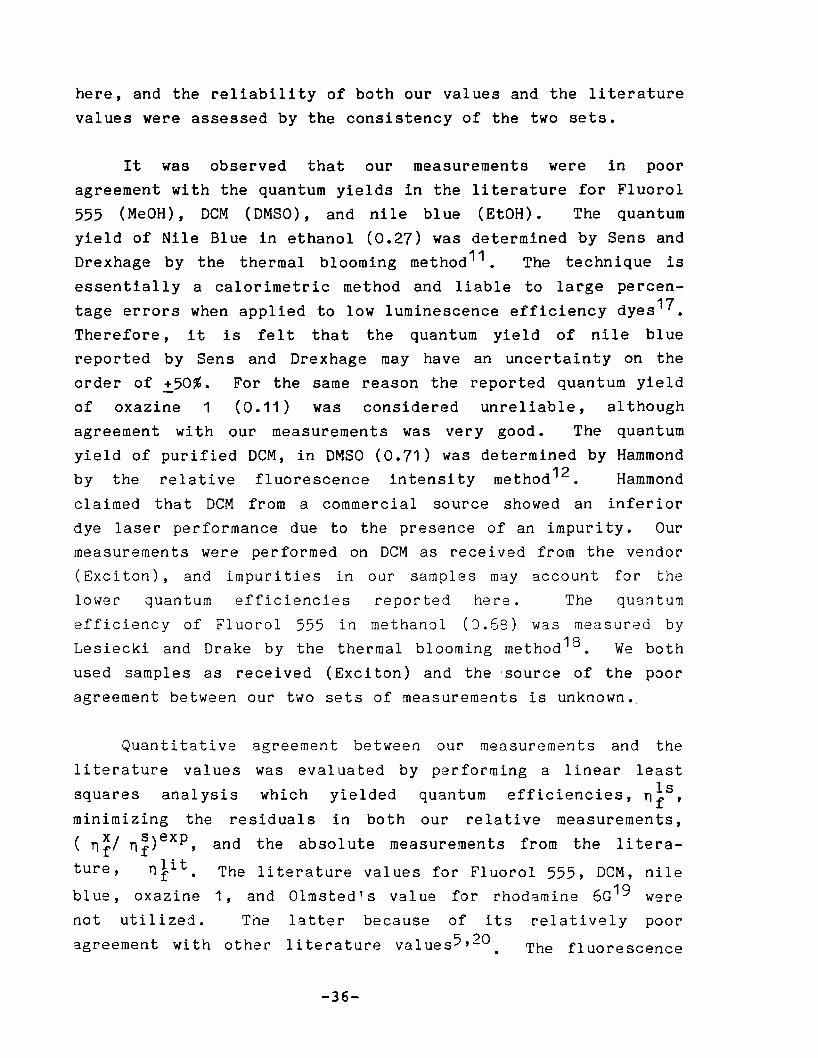
Quantitative agreement between our measurements and the
literature values was evaluated by performing a linear least
squares analysis which yielded quantum efficiencies, n}S,
minimizing the residual s in both our re lati ve measurements,
( n~/ n~)exp, and the absolute measurements from the litera-
ture, nli t• The literature values for Fluorol 555, DCM, nile
bl ue, oxazine 1, and Olmsted's va 1ue for rhodamine 6G19 were
not utilized. The latter because of its relatively poor
agreement with other literature values5,20 The fluorescence
-36-

quantum yields from the least squares analysis are presented in
Table 11, and the experimental measurements used in the analy
sis together with their residuals are presented in Table 12.
Table 11
Fluorescence Quantum Yields from Least Squares Analysis
Dye Name (Solvent) Abrev a) maxA em
I
b)11 f
II III
Coumarin 1 (EtOH) C-1 449Quinine Sulfate QS 453
(Perchloric Acid)Acridine Yellow (EtOH) AY 496Coumarin 6 (EtOH) C-6 505Brilliant Yellow (EtOH) BY 523Coumarin 153 (EtOH) C-153 532Fluorol 555 (EtOH) F-555 534Fluorol 555 (MeOH) F-555(M) 542Rhodamine 6G (EtOH) R-6G 555Acridine Red (EtOH) AR 568Sulforhodamine B (EtOH) SR-B 576Rhodamine 101 (EtOH) R-101 591DODC Iodide (EtOH) DODC 606DC~ (EtOH) DCM 622OCM (DMSO) DCM(D) 650Oxazine 4 (EtOH) OX-4 636Cresyl Violet (EtOH) CV 626Cresyl Violet (MeOH) CV(M) 626Oxazine 170 (EtOH) OX-170 645LD 688 (EtOH) Lo688 663Nile Blue (EtOH) NB 666Oxazine 1 (EtOH) OX-1 668LD 700 (EtOH) LD700 679Oxazine 750 (EtOH) OX-750 6840.11 Mol% UO Doped UG 536
Borosilicate Glass
0.6810.622
0.5090.7960.6840.5210.5550.4470.9370.6800.6530.9360.4140.4290.5340.5670.5370.5160.5850.1900.1260.1190.3200.1960.611
0.6060.551
0.4840.7400.6220.4460.5040.431
0.3630.432
0.556
0.9690.7030.6650.952J.4218.4430.5850.5790.5550.5240.5950.1970.1300.1230.3310.203
a)Abbreviation of dye name used in Table 12.b)I, II, and III are results of fit to data of all dyes, of
blue-yellow emitting dyes, and of red emitting dyes,respectively.
-37-
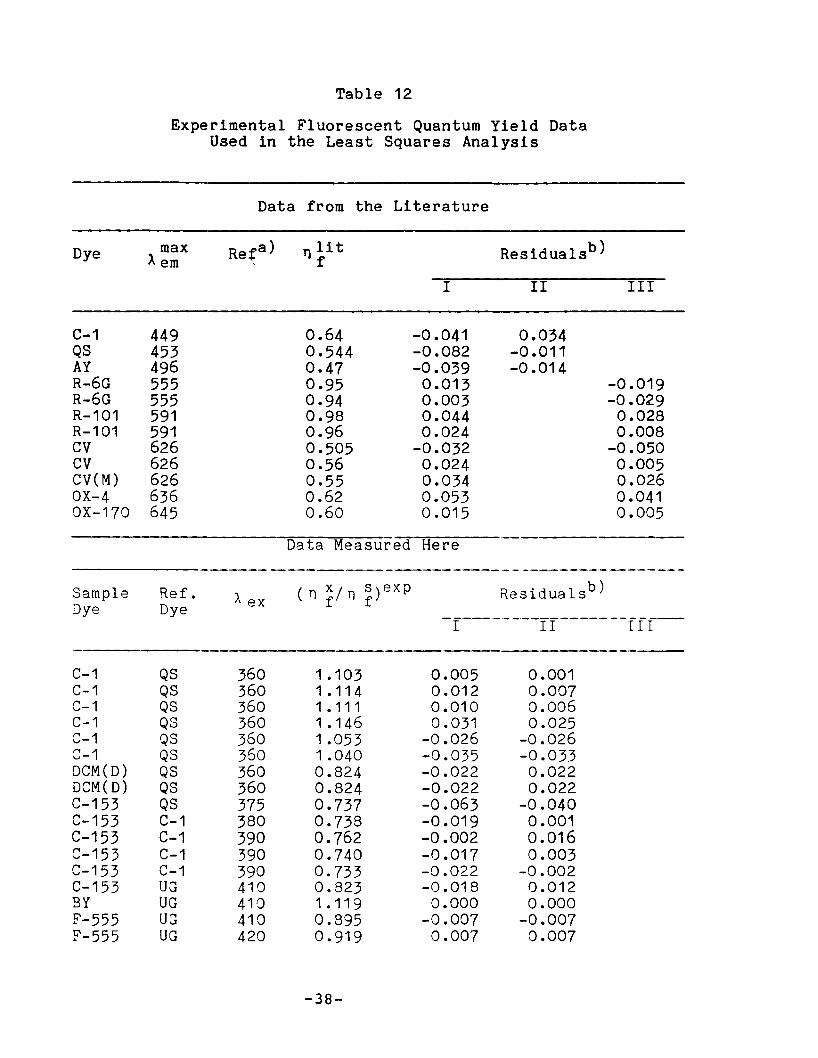
Table 12
Experimental Fluorescent Quantum Yield DataUsed in the Least Squares Analysis
Data from the Literature
Dye max Reta) T} li t Residualsb)~ em f
I II III
C-1 449 0.64 -0.041 0.034QS 453 0.544 -0.082 -0.011AY 496 0.47 -0.039 -0.014R-6G 555 0.95 0.013 -0.019R-6G 555 0.94 0.003 -0.029R-101 591 0.98 0.044 0.028R-101 591 0.96 0.024 0.008CV 626 0.505 -0.032 -0.050CV 626 0.56 0.024 0.005CV(M) 626 0.55 0.034 0.026OX-4 636 0.62 0.053 0.041OX-170 645 0.60 0.015 0.005
Data Measured Here_._------------------- - - ------_.------ ---
Sample Ref. A ex(n x/ n s)exp Residualsb)
Dye Dye f f-f-------ff-------ffr--
C-1 QS 360 1 .103 0.005 0.001C-1 QS 360 1 .114 0.012 0.007C-1 QS 360 1 .111 0.010 0.006C-1 QS 360 1 .146 0.031 0.025C-1 QS 360 1.053 -0.026 -0.026C-1 QS 360 1 .040 -0.035 -0.033DCM(D) QS 360 0.824 -0.022 0.022DCM(D) QS 360 0.824 -0.022 0.022C-153 QS 375 0.737 -0.063 -0.040C-153 C-1 380 0.738 -0.019 0.001C-153 C-1 390 0.762 -0.002 0.016C-153 C-1 390 0.740 -0.017 0.003C-153 C-1 390 0.733 -0.022 -0.002C-153 UJ 410 0.823 -0.018 0.012BY UG 410 1 .119 0.000 0.000F-555 U3 410 0.895 -0.007 -0.007F-555 UG 420 0.919 0.007 0.007
-38-
Table 12 Continued
Sample Ref. Aex( nX/ns)exp Residualsb)
Dye Dye f f
I II III
F-555(M) UG 420 0.755 0.014 -0.011C-6 UG 410 1.330 0.017 -0.001DCM UG 420 0.653 -0.029 -0.000C-6 AY 445 1.530 -0.017 0.001F-555(M) AY 445 0.851 -0.014 -0.018DeM{O) C-153 440 0.984 -0.021 0.007DCM{O) C-153 440 0.981 -0.023 0.005DeM(D) C-153 440 0.916 -0.057 -0.024DCM(O) C-153 450 0.930 -0.050 -0.032DCM(O) OCM 470 1.188 -0.025 -0.000oeM R-6G 500 0.457 -0.001 0.000DCM(O) R-6G 500 0.610 0.037 0.006DCM(D) R-6G 500 0.579 0.008 -0.024DCM(O) R-6G 500 0.591 0.019 -0.012DCM(D) R-6G 510 0.598 0.026 -0.006OCM(D) R-6G 520 0.617 0.044 0.013AR R-6G 500 0.726 0.000 0.000LD689 R-6G 500 0.203 0.000 0.000R-6G R-101 510 1.033 0.030 0.015R-6G R-101 510 1.039 0.036 0.020SR-B R-101 520 0.698 0.000 0.000DC;\1( D) CV 540 1.079 0.045 0.014Dcr'~(D) CV 540 1 .072 0.041 0.011DODe CV(M) 540 0.803 0.000 o , oO·Jcv(:~) CV 570 0.898 -Q.034 -0.026NB CV 580 0.235 0.000 0.000OX-170 CV 580 1 .063 -0.015 -0.005OX-1 CV 580 0.222 0.000 0.000OX-750 CV 580 0.366 0.000 0.000OX-4 CV 580 1 .013 -0.024 -0.017OX-4 CV 580 1 .002 -0.030 -0.023LD700 CV 590 0.596 0.000 0.000
--------------a)Residual = n ~x - n }5
b)Re5idual ( n ~/ n ~) ex . ( 5)1s ( x)1s= n f - n f .
-39-

A concurrent fit of the data from all the dyes studied wasobtained and the results are presented under the column labeled
I in Tables 11 and 12. Al though agreement with n ii t is
generally within the +10% uncertainty limits anticipated in our
measurements , it was -observed that n is for the. bl ue - yellow
emitting dyes was consistently greater than ni1t, and consistently less for the red emitting dyes (see entries in first 12
rows of Table 12). The systematic error suggested by this
observation is thought to be due to an error of 10-15% in the
emission spectra correction function in the red region relative
to that in the green region. The quantum efficiency of dyes
emitting in the two regions were linked by measurements of the
quantum yield of OCM (which emits in the red and has appreciable absorption out to the UV) r e lative to a set of green
emitting dyes and a set of red emitting dyes. The accuracy ofthe first set of relative measurements are, therefore, very
sensitive to the accuracy of the emission correction function.
The systematic errors were largely eliminated by
separately fitting the data from the blue - yellow emitting
dyes (results under the columns labeled II in Tables 11 and 12)
and from the red emitting dyes (results under the columns
labeled III in Tables 11 and 12). Agreement was very satis
factory. The root mean square (rms) percentage deviation
between the three literature values for the blue yellow
emitting dyes utilized in the calculation and the corresponding
least squares values was 3.7%. The rms percentage deviation of
the nine literature values for the red emitting dyes was 4.6%.Although the literature values for Fluorol 555, OCM, and nile
blue were not included in the analyses because of the poor fits
obtained, it is to be emphasized that successful fi ts were
obtained for all dyes whose quantum yields have been reported
and found in agreement from more than one laboratory (quinine
sulfate, rhodamine 6G, rhodamine 101, and cresyl violet). It
is fe 1t, therefore, tha t the quantum yie Ids reported he r e are
accurate roughly to =-10%. However, larger deviations from
-40-
intrinsic quantum efficiencies are possible where unknown
impuri ty quenching or rapid temperature quenching effects areencountered.
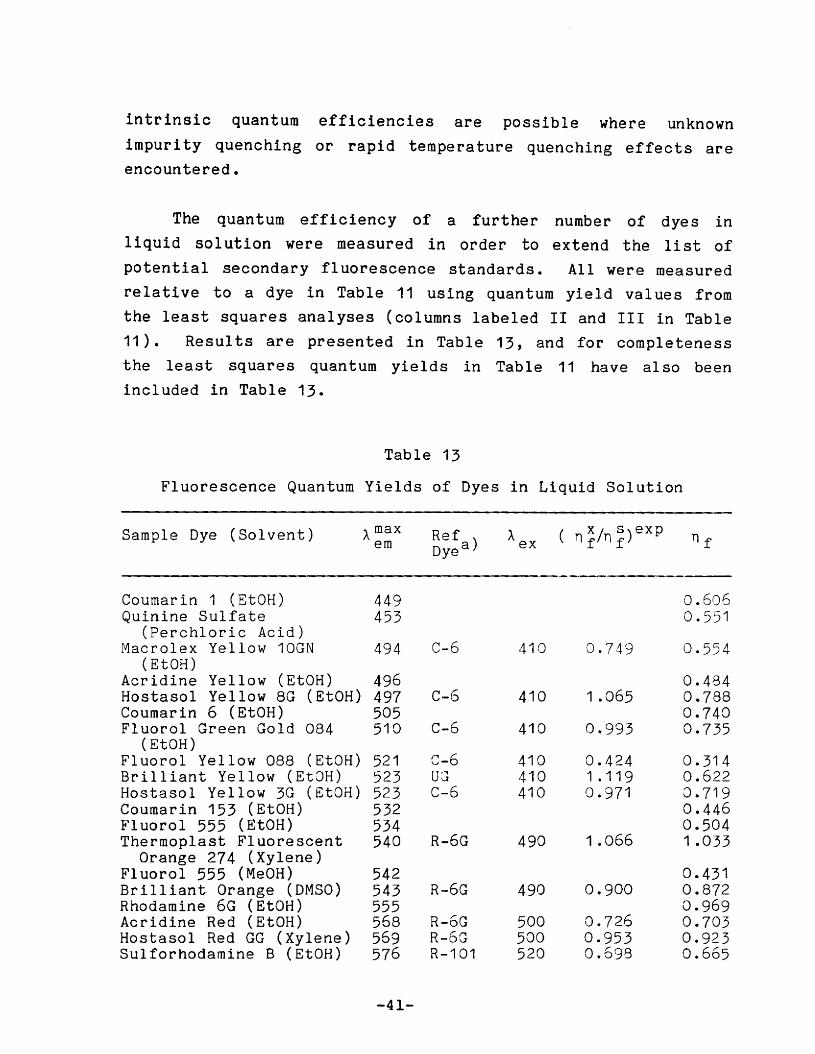
The quantum efficiency of a further number of dyes in
liquid sol ution were measured in order to extend the list of
potential secondary fluorescence standards. All were measured
relative to a dye in Table 11 using quantum yield values from
the least squares analyses (columns labeled II and III in Table
11). Resul ts are presented in Table 13, and for completeness
the least squares quantum yields in Table 11 have al so beenincluded in Table 13.
Table 13
Fluorescence Quantum Yields of Dyes in LiqUid Solution
Sample Dye (Solvent) Amax Ref A XI s)expnfem Dyea) ex n f n f
Coumarin 1 (EtOH) 449 0.606Quinine Sulfate 453 0.551
(Perchloric Acid)Macrolex Yellow 10GN 494 C-6 410 0.749 0.554
(EtOH)Acridine Yellow (EtOH) 496 0.484Hostasol Yellow 8G (EtOH) 497 C-6 410 1 .065 0.788Coumarin 6 (EtOH) 505 0.740Fluorol Green Gold 084 510 C-6 410 0.993 0.735
(EtOH)Fluorol Yellow 088 (EtOH) 521 c-6 410 0.424 0.314Brilliant Yellow (EtOH) 523 UJ 410 1 .119 0.622Hostasol Yellow 3G (EtOH) 523 C-6 410 0.971 0.719Coumarin 153 (EtOH) 532 0.446Fluorol 555 (EtOH) 534 0.504Thermoplast Fluorescent 540 R-6G 490 1 .066 1.033
Orange 274 (Xylene)Fluorol 555 (MeOH) 542 0.431Brilliant Orange (DMSO) 543 R-6G 490 0.900 0.872Rhodamine 6G (EtOH) 555 0.969Acridine Red (EtOH) 568 R-oG 500 0.726 0.703Hostasol Red GG (Xylene) 569 R-6G 500 0.953 0.923Sulforhodamine B (EtOH) 576 R-101 520 0.698 0.665
-41-

Table 13 Continued
Sample Dye (Solvent) ). max Ref x ( n xI Tl s)exp Tl fem Dyea) ex f f
Rhodamine 101 (EtOH) 591 0.952Hostasol Red 5B (Xylene) 600 R-6G 500 0.377 0.365Macrolex Fluorescent Red 601 R-6G 500 0.383 0.371
5B (Xylene)DODC (EtOH) 606 CV(M) 540 0.803 0.421Brilliant Yellow (DMSO) 527 BY(EtOH) 440 0.946 0.588DODC (EtOH) 606 CV 570 0.726 0.4033,3'-Diethyl-4,5,4' ,5'- 619 CV 570 0.175 0.097
dibenzthiacarbocyanine (EtOH)DCM (EtOH) 622 0.443Cresyl Violet (EtOH) 626 0.555Cresyl Violet (MeOH) 626 0.524Oxazine 4 (EtOH) 636 0.579Oxazine 170 (EtOH) 645 0.595DCM (DMSO 650 0.585LD 688 (EtOH) 663 R-6G 500 0.202 0.197Nile Blue (EtOH) 666 0.130Oxazine 1 (EtOH) 668 0.123LD 700 (EtOH) 679 ev 590 0.596 0.331Oxazine 750 (EtOH) 684 ev 580 0.366 0.203LOS 750 (EtOH) 718 ev 575 0.154 0.085LDS 751 (EtOH) 732 ev 575 0.112 0.062HIDe (DMSO) ev 578 0.709 0.393
- -_.~-----_.__._--a) The quantum yield of dyes without an entry in this column
were taken from Table 11.
-42-
II. E. Spectral Properties and Quantum Yield of Dyes in
Solution in a Thin Film Polymer Host
The fluorescence quantum efficiency and peak emission
wavelength of dyes in solid solution in a thin film are
presented in Table 14. The quantum yields were measured by the
relative emission intensity technique described in Section lIB.
In most instances the fluorescence standard used in an indivi
dual relative fluorescence intensity measurement was a liquid
solution (usually ethanol) of the same dye present in the thinfilm. The pr incipal exception being the measurement of the
deep red emitting styryl dyes where cresyl violet was used as a
fluorescence standard because of the low fluorescence
efficiency of the styryl dyes in ethanol solution. Theestimated uncertainty in the quantum yield of fluorescent thin
films is 15%.
Among dyes emi tting in the green spectral region, here
rather arbitrarily expanded to include peak emission
wavelengths between 450 and 550 nm, only modest attention was
given to the coumarins because tests had indicated relatively
poor photostability. Fluorescence of the most s t ab l e of the
coumarins, coumarin 6, was studied in PMMA and CAP polymers.
The quantum efficiency was roughly 0.75, almost identical tothat of the ethanol sol ution. This was contrary to expecta
tions that freezing the torsional motion of the di-N-ethylaminogroup in solid solution would increase the quantum efficiency.
Greatest attention in the green region was gi ven to dyes
commercially developed for fluorescent display applications.
Within this group Hoechst Hostasol Yellow 8G in a CAP polymer
showed a quantum yield of essentially unity, while Mobay
Macrolex Fluorescent Yellow 10GN in CAP, Fluorol 555 in both
CAP and PMMA, and BASF FI uo r oI Green Gold 084 in PMMA hadquantum efficiencies above 0.75. Unfortunately, Day-GIo
-43-

Table 14
Fluorescence Quantum Yields of Dyes in SolidSolution in Thin Film
Sample Dye(Ref Dye - Solvent)
Polymer Matrix
Macrolex F Yellow 10GN Elvacite 2010(Macrolex F Yellow 10GN - EtOH)
Macrolex F Yellow 10GN CAP 504.20(Macrolex F Yellow 10GN - EtOH)
Coumarin 6 5Elvacite 2010(Coumarin 6 - 2 x 10- M EtOH)
Coumarin 6 5CAP 504.20(Coumarin 6 - 2 x 10- M EtOH)
Hostasol Yellow 8G CAP 504.20(Hostasol Yellow 8G - EtOH)
Hostasol Yellow 8G Elvacite 2010(Hostasol Yellow 8G - EtOH)
Acridine Yellow CAP 504.20(Acridine Yellow - 2.7 x 10⁻⁵ M EtOH)
Acridine Yellow Elvaci~e 2010(Acridine Yellow - 2.7 x 10- M EtOH)
Fluorol 555 EI~acite 2010(Fluorol 555 - 3.2 x 10- M EtOH)
Fluorol 555 CAS 504.20(Fluorol 555 - 3.2 x 10- M EtOH)
Hostasol Yellow 3G Elvacite 2010(Hostasol Yellow 3G - EtOH)
Hostasol Yellow 3G CAP 504.20(Hostasol Yellow 3G - EtOH)
Fluorol Green Gold 084 Elvacite 2010(Fluorol Green Gold 084 - EtOH)
Fluorol Green Gold 084 CAP 504.20(Fluorol Green Gold 084 - EtOH)
Brilliant Yellow Elvacite 2010(Brilliant Yellow - 1.2mg!100ml DMSO)
-44-
440
440
410
410
440
440
440
440
430
430
460
460
435
435
440
489
494
493
502
493
496
496
498
500
513
508
512
508
510
510
0.71
0.87
0.77
0.75
0.99
0.65
0.53
0.17
0.35
0.79
0.60
0.31
0.78
0.74
0.58

Table II (Continued)
Brilliant Yellow CAP 482-0-20 440 514 0.45(Brilliant Yellow - DMSO)
Brilliant Yellow CAB 553.40 440 516 0.32(Brilliant Yellow - DMSO)
Brilliant Yellow CAP 504.20 440 522 0.28(Brilliant Yellow - 1.2mg/100ml DMSO)
Fluorol Yellow 088 Elvacite 2010 450 517 0.54(Fluorol Yellow 088 - EtOH)
Fluorol Yellow 088 CAP 504.20 450 521 0.45(Fluorol Yellow 088 - EtOH)
Brilliant Orange Elvacite 2010 490 567 0.59(Brilliant Orange - 0.70mg/50ml DMSO)
Brilliant Orange CAP 504.20 490 571 0.78(Brilliant Orange - 0.70mg/50ml DMSO)
Sulforhodamine-B Elvacits 2010 520 576 0.76(Sulforhodamine-B - 2.0 x 10- M EtOH)
Sulforhodamine-B CAP 504 20 520 582 0.88(Sulforhedamine-B - 2.0 x 10⁻⁵ M EtOH)
Hostasel Red GG Elvacite 2010 500 577 0.65(Hostasel Red GG - EtOH)
Hostasol Red GG CAP 504.20 500 593 0.68(Hostasel Red GG - Xylene)
Acridine Red C~P 504.20 490 579 1 .12(Acridine Red - 4 x 10- M EtOH)
Acridine Red E~vacite 2010 490 580 1 .07(Acridine Red - 4 x 10- M EtOH)
Hostasol Red 58 Elvacite 2010 535 586 0.37(Hostasol Red 58 - Xylene)
Hostasel Red 58 CAP 504.20 535 597 0.23(Hostasol Red 5B - Xylene)
Rhodamine 101 CAP ~04.20 530 598 1 .07(Rhodamine 101 - 1.5 x 10- M EtOH)
Rhodamine 101 Elva§ite 2010 530 600 1 .01(Rhodamine 101 - 1.6 x 10- M EtOH)
-45-

Table 1! (Continued)
LO 688 CAB 553.40 490 600 0.66(LO 688 - CAP 504.20)
LO 688 5 Elvacite 2010 490 607 0.89(LO 688 - 1 x 10- M EtOH)
LO 688 CAP 504.20 & Cymel 303 490 607 0.67(LO 688 - CAP 504.20)
LO 688 CAP 504.20 530 609 0.65(Rhodamine 101 - 2.0 x 10- M EtOH)
LO 688x 10-5
CAP 504.20 490 611 0.89(LO 688 - 1 M EtOH)
Oxazine 4 ~lvacite 2010 575 633 0·38(Oxazine 4 - 1.8 x 10- M EtOH)
Oxazine 4 5AP 504.20 575 636 0.53(Oxazine 4 ··1.8 x 10- M EtOH)
Oxazine 170 El~acite 2010 590 644 0.49(Oxazine170 - 2.1 x 10- M EtOH)
Oxazine 170 CAS 504.20 590 652 0.56(Oxazine 170 - 2.1 x 10- M EtOH)
Nile Blue ~lvacite 2010 600 662 0.24(Nile Blue .. 2.4 x 10- M EtOH)
Ni Ie Bl ue ~AP 504.20 600 668 0.22( Nil e Blue .. 2.4 x 10- M EtOH)
Oxazine 1 ~lvacite 2010 610 663 0.48(Oxazine 1 ··1.4 x 10- M EtOH)
Oxazine 1 ~AP 482-0-20 610 670 0.29(Oxazine 1 .- 1.6 x 10- M EtOH)
Oxazine 1 ~AP 504.20 610 673 0.26(Oxazine 1 .- 1.6 x 10- M EtOH)
Oxazine 1 ~AB 553.40 610 673 0.25(Oxazine 1 ··1.6 x 10- M EtOH)
Oxazine 750 E15acite 2010 620 682 0.27(Oxazine 750 - 1.9 x 10- M EtOH)
Oxazine 750 CAS 504.20 620 688 0.26(Oxazine 750 - 1.9 x 10- M EtOH)
-46-

Table 1! (Continued)
LDS 730 CAP 504.2g & Cymel 303 540 695 0.51(Cresyl Violet - 2.8 x 10- M EtOH)
LOS 730 5AP 504.20 & Cymel 303 540 695 0.51(OOTC - 7.9 x 10- M EtOH)
LOS 730 CAP 504.20 & Cymel 303 570 695 0.51(LDS 730 - CAP 504.20)
LOS 730 CAB 553.40 570 696 0.46(LDS 730 - CAP 504.20)
LDS 730 CAP 304.20 570 698 0.46(Cresyl Violet - 2.4 x 10- M EtOH)
LDS 751 CAP ~04.20 570 696 0.30(Cresyl Violet - 2.4 x 10- M EtOH)
LDS 750 CAP 504.20 & Cymel 303 560 698 0.34(LOS 750 - CAP 504.20)
LDS 750 CAB 553.40 560 699 0.46(LDS 750 - CAP 504.20)
LDS 750 CAP ~04.20 570 700 0.49(Cresyl Violet - 2.4 x 10- M EtOH)
LDS 798 CAB 553.40 570 722 0.43(LOS 798 - CAP 504.2)
LDS 798 CAP 504.20 & Cymel 303 570 726 0.41(LDS 798 - CAP 504.20)
LDS 798 CAP ~04.20 570 736 0.42(Cresyl Violet - 2.4 x 10- M EtOH)
LOS 820 CAP ~04.2 570 770 0.23(Cresyl Violet - 2.4 x 10- M EtOH)
-47-
Brilliant Yellow, whichstability, is a rather
quantum yield was 0.58 in
0.5 in CAP or CAB.
has demonstrated superior photoindifferent emitter. The maximumPMMA, and efficiencies are less than
Again somewhat arbitrarily, the red spectral region is
defined as spanning wavelengths between 550 and 620 nm , Therhodamines, the most important laser dyes emitting in this
region, were not studied extensively because of the poor
stability of most members of the group. Sulforhodamine-B, themost stable member, was studied in PMMA and CAP and showed
quantum efficiencies of 0.76 and 0.88, respectively. Inethanol the quantum yield of sulforhodamine-B is 0.67, the
improvement in fluorescence efficiency in solid solution
apparently due to the restriction of the di-N-ethylamino
torsion. For rhodamine 101, in which the amino end groups areridgidized within ring systems, the quantum efficiency isessentially unity in ethanol and PMMA or CAP.
A related red-emi tting molecule, acridine red, shows aparticularly large improvement in quantum yield when in solid
sol ution. Acridine red is a pyronin with N-methylamino endgroups (the pyronins differ from the rhodamines only by the
absence of the 9-carboxyphenyl group). The 0.70 quantum yield
of acridine red in ethanol becomes essentially unity in PMMA or
CAP solid sol ution, suggesting that internal rotation of theterminal amino groups is also the principal nonradiativerelaxation path in this molecule.
Among the red emitting dyes studied that were commercially
developed for fluorescent display applications only Day-Glo
Brill iant Orange in CAP with a quantum effic iency of 0.78 has
an efficiency above 0.75. One of the more int~resting display
dyes, Thermoplast Fluorescent Orange 2'74, could not be intro
duced into a thin film because of limited solubility.
-48-
A final dye of some interest in the red emi tting group is
the styryl dye, LD 688. Like the other styryl dyes, LD 688 is
characterized by broad absorption and emission bands and a
large Stokes' shift. It has been reported that the wavelength
of peak emission of the styryl dye DeM is considerably shiftedtoward the blue when cast in PMMA. 13 This effect is
particularly noted in LD 688 with the peak emission wavelength
in ethanol of 663 nm moving to 600-611 nm in a variety of
polymers. The quantum efficiency of LD 688 in a number of thin
film hosts is apparently near 0.65. Two yields of approximately 0.9 were measured, but are suspect because they both
were obtained relative to a weakly emitting (qf = 0.20) LD 688
ethanol solution. The excitation and emission spectra of LD
688 in a CAP thin film is illustrated in Figure 7.
The spectral region that has received the most attentionis the far red region, the region with wavelengths longer than
620 nm. This is the most critical region because dyes emitting
here have relatively low lying first excited states and,therefore, it is anticipated that greatest difficulty will befound in identifying dyes with adequate fluorescence efficiencyand stability.
The principal dye groups which emit in the far red regionare the oxazines, carbocyanines, and styryl dyes. Thecarbocyanine dyes, were found to be unstable in thin film
hosts, frequently bleaching during preparation of the plates.Therefore, no quantum yield measurements of carbocyanines were
performed. There are no far red dyes that have been developedfor display applications because the greater portion of the far
red region lies beyond the long wavelength sensitivity limit of
the human eye. Commercial aetivi ty in this region has been
almost exclusively devoted to dye laser applications.
The quantum efficiency of the oxazines that havedemonstrated the best stability have been reasonably tho~oughly
-49-

studied. Those oxazines in which one or both te rminal amino
groups are fUlly alkylated, oxazine 1 and nile blue, show large
increases in quantum efficiency when in sol id sol ution 1n athin film. Overall f1 uorescence efficiency, however, remains
disappointing. The most striking case is oxazine 1, whose
quantum yield increases from 0.12 in ethanol to a .48 in PMMA.
Those oxazines in which both terminal amino groups are
partially alkylated, oxazine 4 and oxazine 170, show quantum
yields in thin films that are essentially the same or somewhat
reduced from the ethanol solution values. The largestefficiencies measured in this group are 0.56 and 0.53 fromoxazine 170 and oxazine 4, respectively, both in CAP.
The most interesting molecules emi tting in the far redregion are the styryl dyes. A member of the group, LD 688, hasbeen discussed above. The group is interesting because of
broad absorption bands, a large Stokes' shift, and particularly
because the peak emission of the longer wavelength emi ttingmembers occur we 11 to the red of any of the oxazines. Thequantum efficiency of the styryl dyes in ethanol is low. Largeefficiency improvements in solid solution in thin films wereobserved; however, quantum yields sUbstantially above 0.5 werenot achieved. Quantum yields between 0.51 and 0.45 were
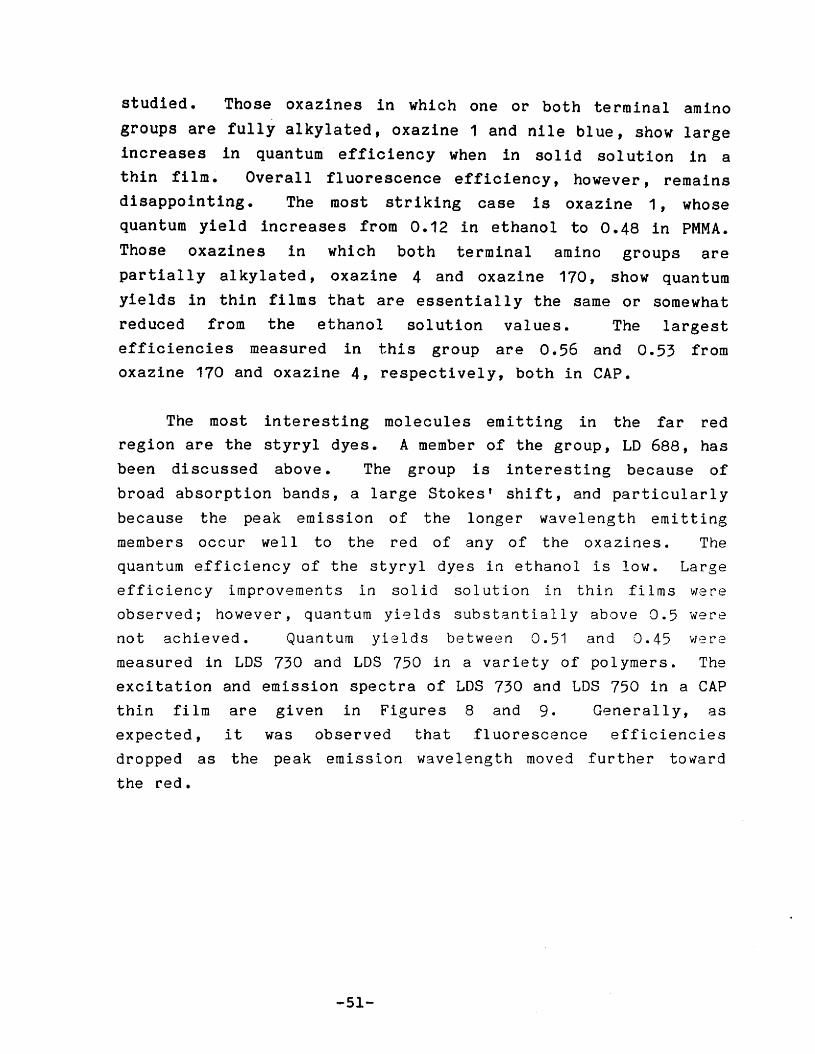
measured in LDS 730 and LDS 750 in a variety of polymers. Theexcitation and emission spectra of LOS 730 and LDS 750 in a CAPthin film are given in Figures 8 and 9. Generally, asexpected, it was observed that fluorescence efficienciesdropped as the peak emission wavelength moved further t.owa r d
the red.
--51-


II. F. Summary
The quantum efficiency and a.bsorption and emissionspectral distribution of roughly 200 luminescent organic dye/polymer matrix combinations have been measured. Frequently,particularly fClr red-near IR emitting dyes, quantum efficiencies are larger in solid solution than in liquid solution,presumably because a more rigid matri.x disfavors nonradiativerelaxation. Hovever , this is not always the case as can beseen in Table 15 for the dyes Hostasol Yel1ow-3G and Oxazine-4.In various solid matrices the quantum efficiency has beenobserved to vary by as much as a factor of two, as is th~ casefor Hostasol Yellow-3G in Table 15.
Table 15
Variation of Dye Quantum Efficiency with Host
Quantum EfficiencyDye (EtOH) (PMMA) ( CAP)
Hostasol Yellow - 3G* .81 .68 .35
Oxazine - 4** .51 .33 .46
LD-688** .19 .84 .84
Fluor'ol-555** .56 .95 .87
*Hoechst**Exciton
NOTE: EtOHPMMACAP
= ethyl alcohol= polymethyl methacrylate= cellulose acetate pr'opionate
A sizable number' of gr-een -t-ed emitting dye/polymers have
-54-

been identified wi th quantum efficiencies greater than 0.9.
The choice among these for use in an optimized LSC will depend
largely on Stokes shift and stabil i ty cr i be r La , Considerable
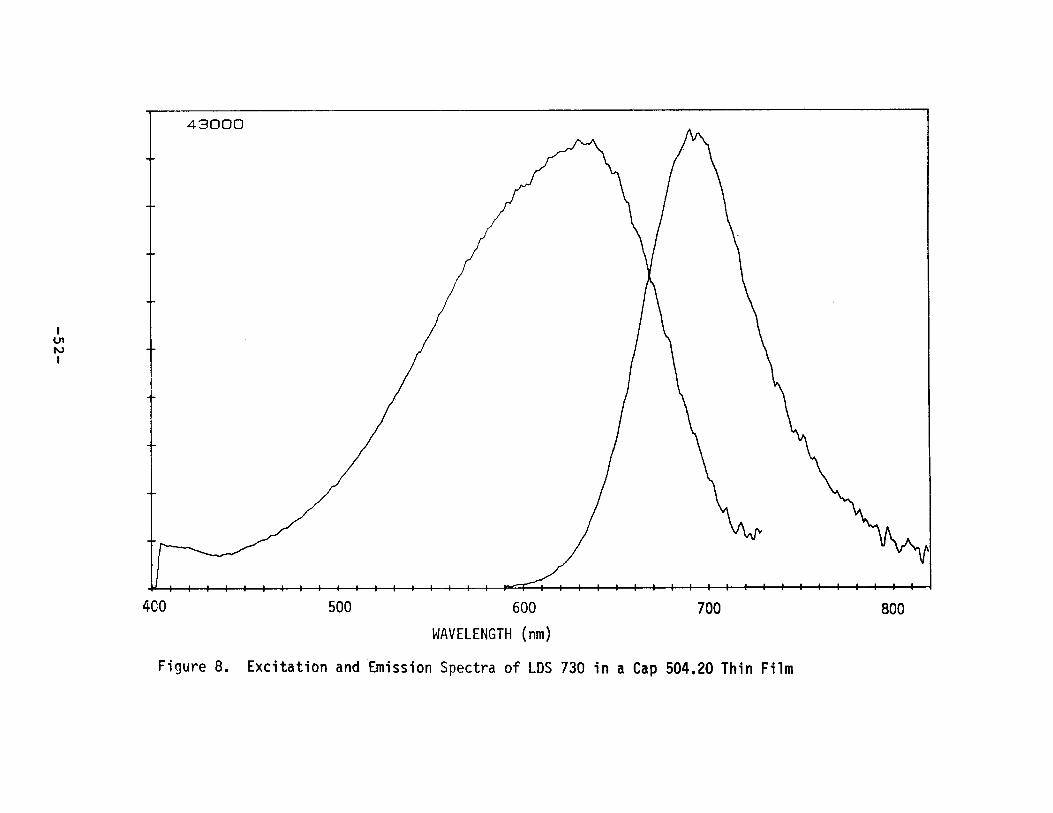
work remains to be done in the far red-near IR spectral region.
Dyes emitting in this region have been identified with
excellent Stokes shifts (see Figure 10); however, dye/polymer
combinations wi th quantum efficiencies in excess of 0.5 have
not yet been identified.
One final note, the Edge Emission Spectrofluorometer
previously used for measuring edge emission lineshape from a
single emi tter3 has been used to measure the integrated plate
edge emission spectrum in various two dye plates. It is
observed that for a "typical n high efficiency two dye plate,
such as 59D3, approximately 99% of the emission from the first
dye will be reabsorbed by the second dye before reaching the
plate edge. This experimentally measured value was determined
by integrating and subse quen t Ly comparing the edge emission
spectrum recorded over the entire spectral range encomposing
both dyes. It is believed that the 1% emission by the first
dye that is apparently not absorbed by the second dye, probably
represents emission from the first dye in the i~mediate
vicinity of the plate edge.
-55-
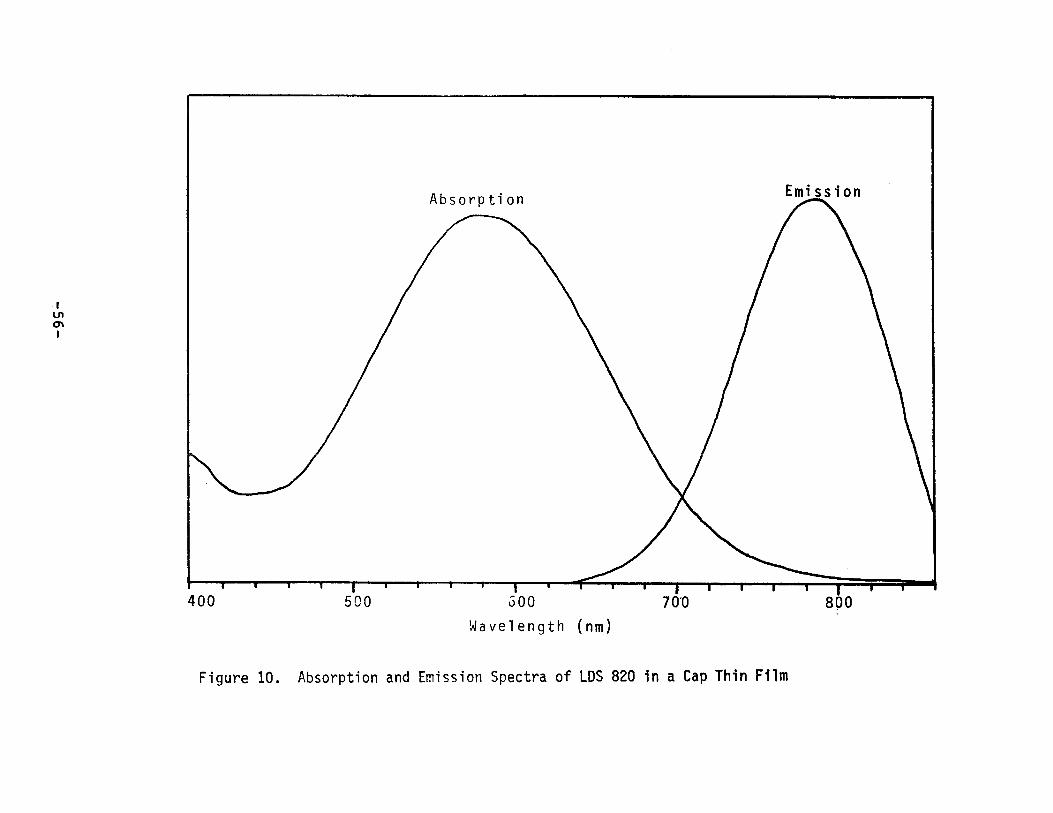

III. INVESTIGATION OF DYE DEGRADATION
Tremendous progress has been made over the course of this
investigation in a number of key areas affecting organic dyedegradation. The methodology for the LSC degradation studies
has been revised with the program organized Into fl ve phases
(Table 16). The first phase, which is the host polymer screen
ing, has been completed with 17 different host systems
~dentified from 61 host systems tested (Table 17) that show for
at least one (1) dye, no visual sign of degradation after 50
kWh/m2 (i.e., approximately 14 days) of outdoor exposure.
These results and those described below for the solvent studies
confirm preliminary data reported previously that dye photo
stability is very strongly dependent on host composition.
The second phase of the degradation study is the solventscreening program. This phase has also been completed, and of
19 di ffe rent so 1ven ts studied, eight of the rno s t stable have
been selected for use as preferred dye/polymer solvents. These
solvents, as can be seen in Table 18 for Brilliant Yellow, show
dye stabilities gr ea t e r than 0.9 after 50 kHh/m2 of outdoor
exposure when used as a host for a number of different dyes.
In the third phase of the stability program, quantitative
screening of 46 different commercially available dyes in up to
eleven (11) different hosts (Table 19) has been completed.
Measurement of both the dye and device stabilities (Appendix I)
has been carried out to 1000 kWh/m2 (i. e., al most 300 days).
Dramatic progress is now evident from this first group of
measurements. The dye stabilities of our best dyes are now on
the order of years; in 1978 our best stabil i ty was approxi
mately one day.
The above reported stabilities (with the exception of the
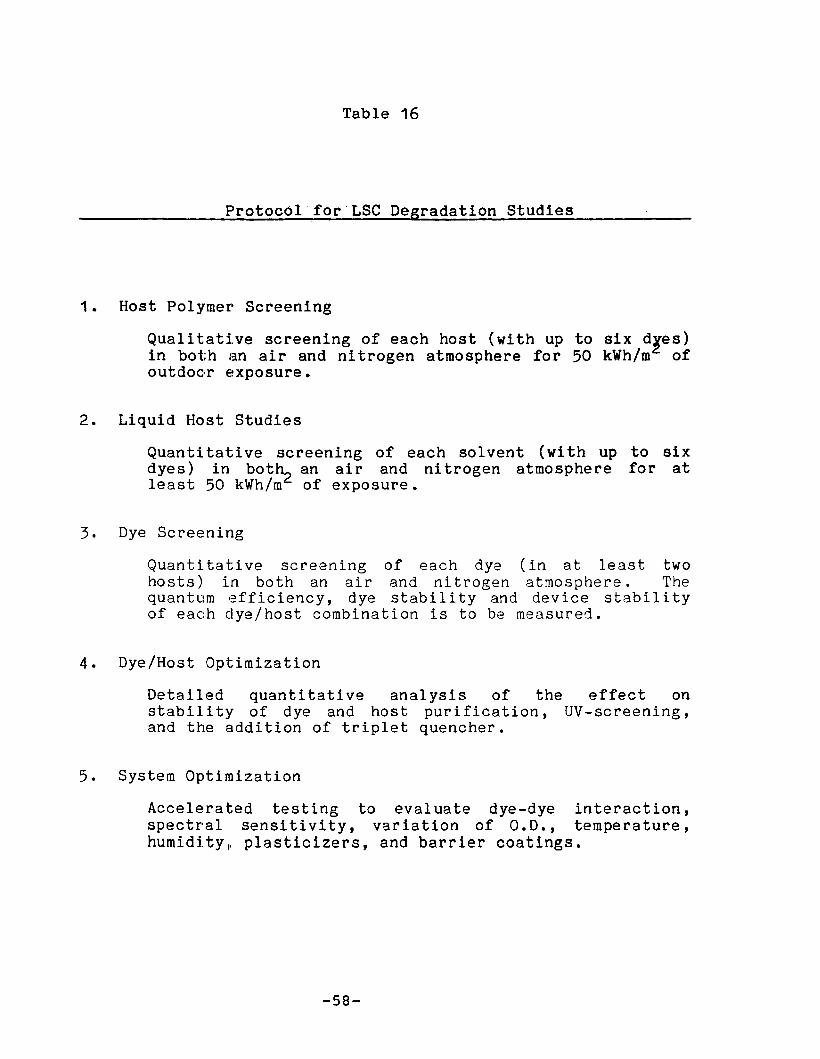
Table 16
ProtocolforLSC Degradation Studies
1. Host Polymer Screening
Quali tati.ve screening of each host (with up to six dles)in both an air and nitrogen atmosphere for 50 kWh/m ofoutdoor exposure.
2. Liquid Host Studies
Quanti tati ve screening of· each solvent (with up to sixdyes) in both
2an air and ni trogen atmosphere for at
least 50 kWh/m of exposure.
3. Dye Screening
Quantitative screening of each dye (in at least twohosts) in both an air and nitrogen atmosphere. Thequantum efficiency, dye stability and device stabilityof each dye/host combination is to be measured.
4. Dye/Host Optimization
Detailed quanti tati ve anal ysis of the effect onstabili ty of dye and host purification, UV-screening,and the addition of triplet quencher.
5. System Optimization
Accelerated testing to evaluate dye-dye interaction,spectral sensi ti vi ty, var 1ation of o. D. , tempe r a ture ,humidityp plasticizers, and barrier coatings.
-58-
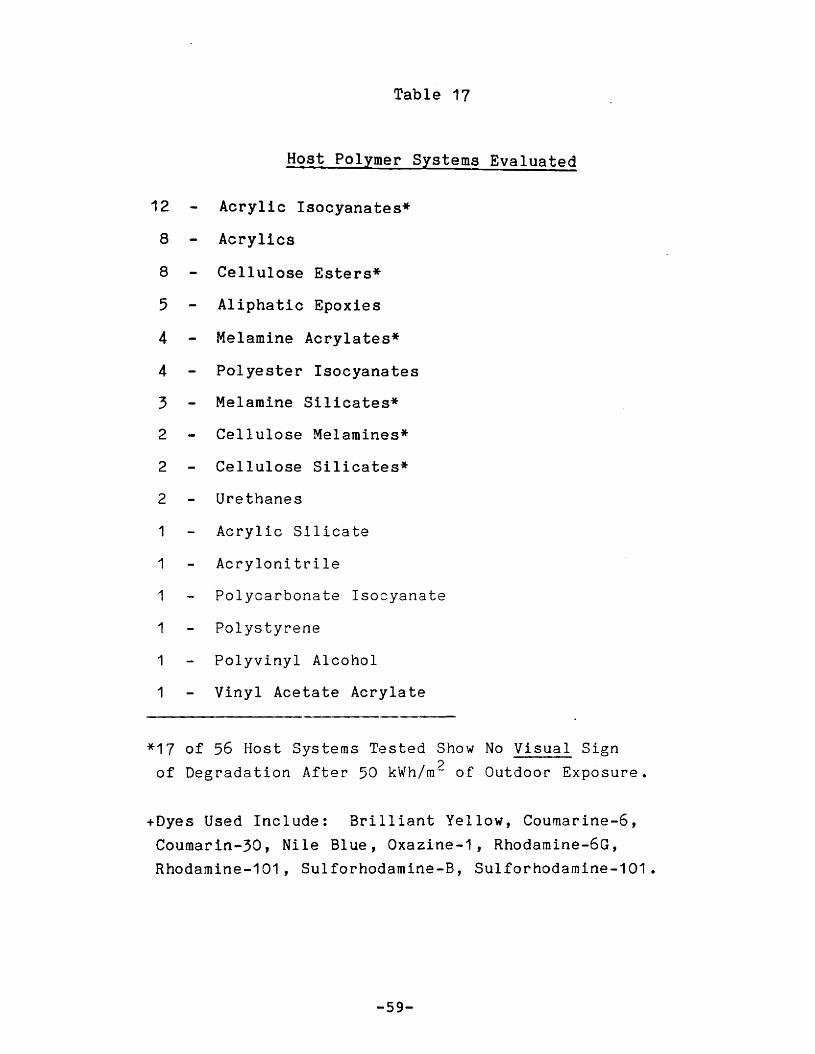
Table 17
Host Polymer Systems Evaluated
12 Acrylic Isocyanates*
8 Acrylics
8 Cellulose Esters*
5 Aliphatic Epoxies
4 Melamine Acrylates*
4 Polyester Isocyanates
3 Melamine Silicates*
2 Cellulose Melamines*
2 Cellulose Silicates*
2 Urethanes
1 Acrylic Silicate
1 Acrylonitrile
1 Polycarbonate Isocyanate
1 Polystyrene
1 Polyvinyl Alcohol
1 Vinyl Acetate Acrylate
*17 of 56 Host Systems Tested Show No Visual Signof Degradation After 50 kWh/m 2 of Outdoor Exposure.
+Dyes Used Include: Brilliant Yellow, Coumarine-6,
Coumarin-30, Nile Blue, Oxazine-1, Rhodamine-6G,Rhodamine-101, Sulforhodamine-B, Sulforhodamine-101.
-59-
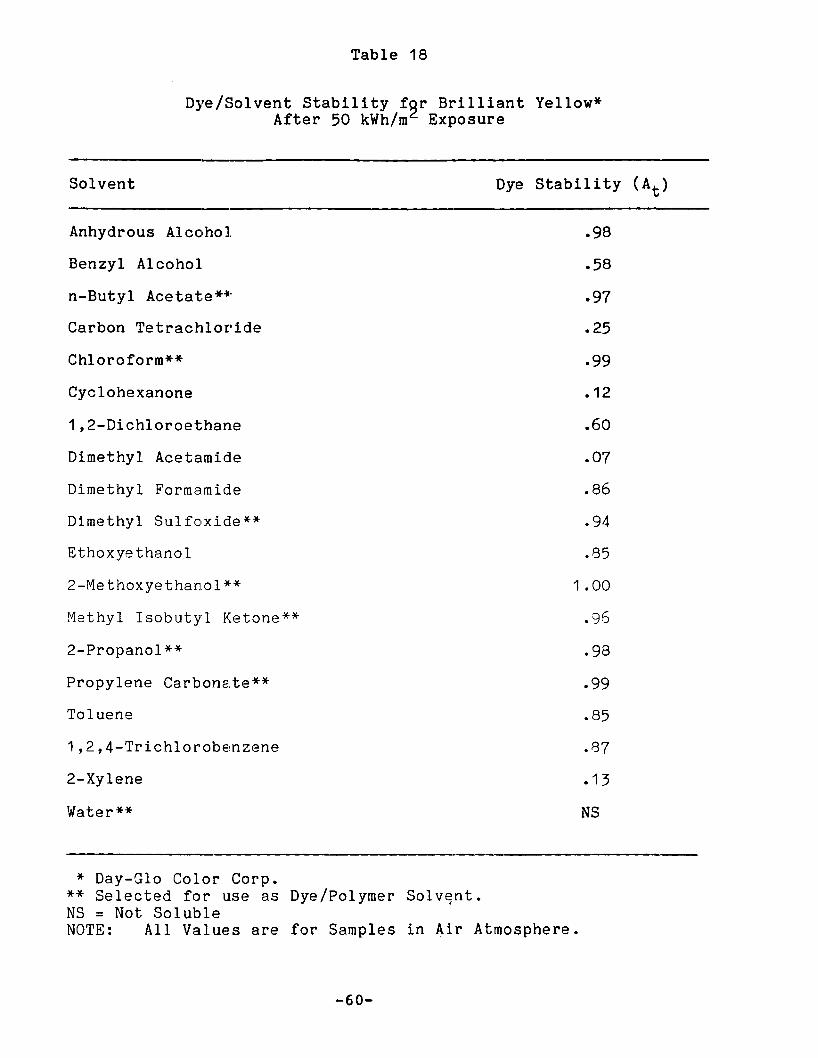
Table 18
Dye/Solvent Stability f~r Brilliant Yellow*After 50 kWh/m Exposure
Solvent
Anhydrous Alcohol
Benzyl Alcohol
n-Butyl Acetate**
Carbon Tetrachloride
Chloroform**
Cyclohexanone
1,2-Dichloroethane
Dimethyl Acetamide
Dimethyl Formamide
Dimethyl Sulfoxide**
Ethoxyethanol
2-Methoxyethanol**
Methyl Isobutyl Ketone**
2-Propanol**
Propylene Carbonate**
Toluene
1,2,4-Trichlorobenzene
2-Xylene
Water**
Dye Stability (At)
.98
.58
.97
.25
.99
.12
.60
.07
.86
.94
.85
1 .00
.96
.98
.99
.85
.87
.13
NS
* Day-Glo Color Corp.** Selected for use as Dye/Polymer Solv~nt.
NS = Not SolubleNOTE: All Values are for Samples in Air Atmosphere.
-60-

Table 19
Host Polymer Systems Selected for Dye S~ening Tests
Host Code
AC-H
AC-I
AI-E
AI-I
CE-A
CE-B
CE-D
CE-E
CM-A
CS-A
MA-C
~ost Polymer System3
Acrylate (Elvacite 2010, which is PMMA)
Acrylate (Elvacite 2041)
Acrylic Crosslinked Isocyanate (Polytex 975/Desmqdur KL5-2444)
Acrylic Crosslinked Isocyanate (AcryloidAT-400/0esmodur 2-4370)
Cellulose Ester (Cellulose AcetateButyrate 553-0.4)
Cellulose Ester (Cellulose AcetatePropionate 482-20)
Cellulose Ester (Cellulose AcetatePropionate 504-0.2)
Cellulose Ester (Cellulose AcetateButyrate 381-0.1)
Cellulose Crosslinked Melamine (CelluloseAcetate Propionate 504-0.2/Cymel 303)
Cellulose Crosslinked Silicat~ (CelluloseAcetate Propionate 504-0.2/HydrolyzedEthyl Silicate)
Melamine Crosslinked Acrylate (Cymel 3031Polytex 910)
-61-

Mobay LISA dyes) have been achieved without purification of
either the dye or host polymer beyond the level supplied by the
vendor. In addition, no life-time enhancing compounds, such as
"tr iplet quenchers," have been added to the dye /host system,
nor has use been made of protective gaseous barrier films. In
fact, little of what could be done to improve stability (see
Table 20) ha s been done. We have only made a preliminary
attempt to optimize the dye/host/ solvent chemistry. However,
the results to date leave ample room for optimism that the
required lifetimes for a practical device can and perhap~ have
already been achieved.
Our expe r Lmenta I results for both the dye stabi I i ty (At)
and device stability (St) appear in Appendix I. The eleven
different hosts used in these tests are listed in Table 19.
The dye stability and device stability have previously been
defined3 as follows:
Af plate absorbance after exposure
At = = ------- -._----A. plate absorbance before exposure
1
LtSt = =
Lo
corrected edge luminescence after exposure
corrected edge luminescence before exposure
As can be seen from the data in Figure 11 for Day - Glo
Bri 11 iant Yellow,. the dye stabi 1 i ty which is a measure of dye
bleaching, generally tends to decrease with time. For the moststable systems, however, such as Mobay (Baeyer) LISA Amber 59YR
(Figure 12), t he dye stability sometimes appears to remain
nearly constant with time. In contrast, the device stability,
which measure s the device edge power output, initially often
-62-

Table 20
Stability Improvement Progra~
A. Host Screening
B. Dye Screening
C. Solvent Screening
D. Dye/Host/Solvent Optimization
E. Host Copolymer Optimization
F. Materials Ultrapurification
G. Addition of Triplet Quencher to Host Matrix
H. UV Protection/Fluorescent Glass Substrates
I. Optimization of Dye Salt Co-Ionic Species andMatrix pH
J. Use of Barrier Film to Reduce Gaseous Exchangeof Oxygen, H20, and Pollution
K. Initiate Degradation Mechanistic Studies
L. Dye Synthesis/Molecular Engineering
M. Reduction of Excited State Lifetime of HighEnergy Dyes by Nonradiative Transfer intoLow Energy Acceptor
-63-

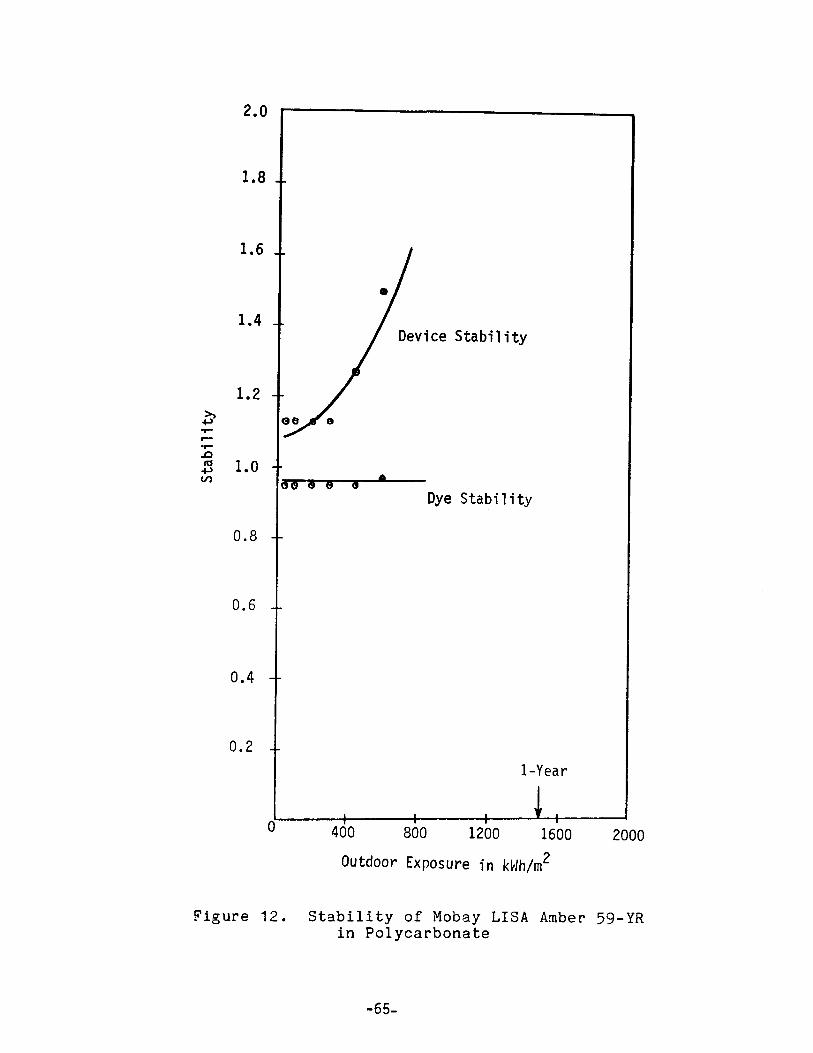

tends to improve with time, especially for high optical density
plates (Figures 11 and 12). The reason for this is that for
plates with high optical density, a given amount of bleaching
has less effect on the solar absorption of the plate than for
plates with low -optical density. For example, if a plate with
an optical density of 3.0 is 33% bleached, the peak solar
absorption is reduced from 99.9% to 99%. However, for the same
dye bleached 33% in a plate with an initial optical density of
0.5, the peak solar absorption will be reduced from 68% to 54%.
Thus, in the first case of a high optical density plate, 33%
bleaching results in reducing the peak solar power absorbed by
less than 1%, while in the second case for a low optical
density plate, the same 33% bleaching results in reducing the
peak solar power absorbed by 20%. Moderate bleaching,
therefore, has very little effect on the amount of ~olar power
absorbed for high optical density plates. However, high
optical density plates have a higher degree of self-absorption
of emitted radiation. 3 Therefore, solar bleaching of the plate
will significantly reduce the amount of self-absorption of
emitted luminescence. The net effect is that for high optical
densi ty plates, moderate amounts of bleaching (i.e., mo de r a t s
reduction of dye stability) has little effect on the amount of
solar power absorbed, but has a larger effect on r sduc t ng the
degree of self-absorption of emi tted radiation, thus in many
cases the amount of luminescent power actually reaching the
plate edge increases.
-66-

IV. RELATIVE EDGE LUMINESCENCE
The Relative Edge Luminescence (Lr) is defined as the LSCshort-circuit current output in milliamps per centimeter of LSC
plate edge, from an air-coupled photovol talc cell located at
the center of the plate edge, under uniform simulated AM-1.5global insolation, assuming an incident power density from
300-2500nm of 100 mW/cm2• The actual apparatus and procedureused for measuring the edge luminescence (L) has been
previously described3 and will not be repeated here.
= =
where: Lo = corrected edge luminescence before exposure
L. = edge luminescence befor'e exposure1
Lbi = initial detector background signal
l c = length in centimeter's of the edge coupledphotovoltaic cell
Ii initial density in mW/cm 2 incident= powerss upon the LSC plate from the solar simulator
The relative edge luminescence values for all of the LSC
plates tested are listed in the extensive set of tables consti
tuting Appendix II. In addi tion, edge luminescence measure
ments as a function of outdoor exposure have been made on allof the LSC plates listed in Appendix I for the calculation of
device stability.
-67-
v. THEORETICAL MODELING
It has long been recognized that one of the major factors
limiting the efficiency of an LSC is the loss due to self
absorption. Self-absorption losses (of luminescence) from the
final emitting dye depend in a complex fashion on the substrate
refractive index, plate dimensions, dye concentration,
luminescence quantum yield, absorption spectrum, and emission
spectral distribution. The infl uence of these factors on LSC
device efficiency was computed with a finite dimensional
element LSC computer modeling program. 3 The program can model
up to five successive self-absorption events and utilizes
digitized absorbance and front surface emission spectra.
Calculations have shown that the radiative transport efficiency
(1 - self-absorption loss) falls approximately linearly with
the logarithm of plate width or peak optical density, and that
the negative slope increases with decreasing Stokes shift (see
Figure 13). The radiative transport efficiency of a 1 m
square, 3 mm thick coumarin-153 plate (3000 cm-1 Stokes shift)
wi th a peak optical densi ty of roughly 1 (transv,=rse
absorbance 3 is 333), is 0.75 (see Figure 13). A similar
sulforhodamine-B plate (900 cm- 1 stokes shift) has a r a d l a t Lv e
transport efficiency of 0.45 (see Figure 13).
Self-absorption losses have been experimentally determined
by measuring the dependence of plate efficiency on plate size.
Experimental and computed results are consistent, and indicate
that a 3.5 mm thick plate doped with a coumarin type of dye at
a concentration such that the peak optical density is 3,
suffers only a 10% loss in collector efficiency when the
surface area is increased from 200 cm2 to 2000 cm2 (Table 21).3
We have used the theoretical modeling results to guide the
experimental program for developing a higher efficiency LSC.
Our most recent calculations3 indicate that collector efficien-
-68-
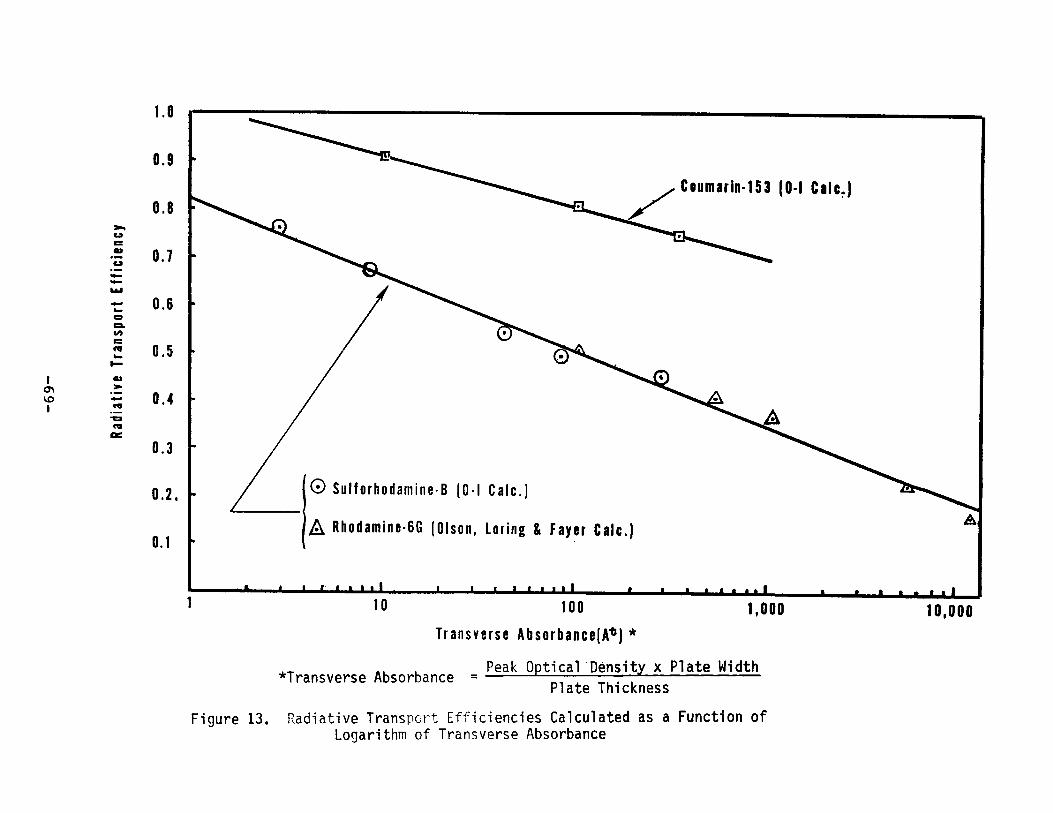

Table 21
Projected Collector Efficiencies* As a Functignof Plate Size For Hypothetical, Three Dye LSC
Size(cm2)Sensitive Plate Size
Parameters 10 200 2000
Transverse Abs. 27 120 380
Edge Emission Peak (nm) 785 800 801
Matrix Eff. .99 .97 .90
Rad. Transport Eff. .87 .80 .75
Plate Eff. .29 .26 .23
Eff. Cone. Ratio 1 .2 4.8 13.5
Si Cell Eff. .32 .33 .34
Collector Eff. 9.4% 8.7% 7.8%
*Projection based on ratioed improvement of plate 630
which had a measured collector efficiency of 3.2% and
a transverse absorbance of 120 (area of 200 cm 2). Note
that the annualized collector efficiencies will be
considerably higher than the peak efficiencies calculated
here (see Section VIII).
-70-

cies of approximately 9% are realistic for a 3-dye LSC (Table
21 ). This calculation assumes that the third dye absorbs 85%of the solar photons between 650 and 800 nm, has a quantum
efficiency of 0.9, a Stokes shift of approximately 2500 cm-1,
and a peak edge emisslon wavelength of about aoo nm , The
experimental efficiency improvement program is outlined in
Table 22. It is noted that since the total daily output
energy-to-peak power ratio of an LSC is at least 20% greater
than that of a crystalline silicon photovoltaic array (see
Section VIII) , a 9% LSC collector efficiency would be
equivalent to an 11% efficient crystalline silicon photovoltaic
array. We thus expect annualized collector efficiencies in
excess of 10% to be reasonable for a single pl a te LSC coupled
to a silicon photovoltaic cell. In addition, higher efficien
cies for more sophisticated LSC configurations would be
anticipated.
Table 22
Efficiency Improvement Program
A. Expand Solar Absorption RegionB. Optimize Host for Maximum Dye Quantum Efficiency
C. Optimize Dye-Dye Energy Transfer
D. Optimize Multilayer Film Structure
E. Minimize Self-AbsorptionF. Cell OptimizationG. Optimize Thin Film and Substrate for Maximum
Internal Reflectivity and Minimum BulkAttenuation Loss
-71-

VI. OPTICAL PROPERTIES OF CReIII) DOPED TRANSPARENT
GLASS-CERAMICS
The work to be described in thi:s section was performedover the period October 16, 1980 to March 5, 1982, underinternal Owens-Illinois, Corporate Glass and Ceramic Technology
funding. Because the work is relevant to the Luminescent Solar
Concentrator program, it has been decided to release the
information in this report.
A study of Cr3+ doped transparent glass-ceramics was
undertaken to address the poor efficiency of inorganic glasses
in converting solar energy into luminescence. Six-foldcoordinated Cr 3+ ions, becaus~ of two broad spin-allowed
absorption bands in the visible spectral region, are efficient
absorbers of solar radiation. The ion is also known to
1uminesce with high efficiency in a large number of crystalline systems. However, the luminescence quantum efficiency of
Cr 3+ doped glasses are generally poor. 21 Cost, of course,
precl udes t he use of Cr3+ doped single crystals in an LSC.Therefore, the idea was developed that high optical efficiency
and 'ow cost forming technology may be combined by doping an
otherwise transparent glass-ceramic with Cr3+ .
The same considerations have led Lempicki and co-workers
to a similar investigation. At the October 25, 1980 SERr
Luminescent Solar Concentrator review meeting, Andrews and
Lempicki reported that fluorescence from Cr3+ in a boro
al umino phosphate glass was shifted to longer wavelength and
that the fluorescence lifetime was lengthened after
crystallizing the glass through heat treatment. 22 At the March
26, 1982 SERr Luminescent Solar Concen t r a t or review meeting,
Lempicki and co-workers presented spectral and lifetime
measurements of Cr3+ doped a-quartz, gahnite, and mullite
-72-

glass-ceramics. 23 The first two of these systems had also been
studied here and our results are in substantial agreement.
Glass-ceramics are mul ti-phase materials produced by the
·controlled crystallization of certain glass compositions. 24
Typically, a nucleant is added to the glass batch compos! tion
and a homogeneous (usually) glass is first preparE~d by a normal
glass melting and annealing process. The glass-ceramic
transformation is achieved by subjecting the glass to a
carefully controlled heat-treatment schedule which resul ts in
the nucleation and growth of crystal phases within the glass.
The first step in the heat-treatment schedule is usually
to hold the glass for a controlled time at a temperature
(somewhat above the annealing temperature of the glass) at
which a large volume number of crystalline nuclei form within
the amorphous glass. The nucleated glass is then heated to and
held at a higher temperature for a controlled time during which
crystal growth occurs. The nucleation and growth crystal
phases are generally different, and depending on initial glass
composition and heat-treatment schedule more than one crystal
phase may form during the growth period. In some sys terns,
heating to and holding the material at a third temperature
causes a transformation of the major crystall ine phase formed
during the first growth period into a different crystal phase.
The crystallization process can be taken almost to completion
in many cases, but more usually a significant proportion of
residual glass phase remains.
Glass-ceramics are usually opaque; however, a number of
fine-grained transparent material s have been described in the
Ii terature. Beall and Duke in 1969 described the condi tions
required for visible transparency: either the crystallites of
all species in the glass-ceramic must be much smaller than the
wavelength of visible light or the birefringence of the
crystals and the difference in the refractive index between
-73-
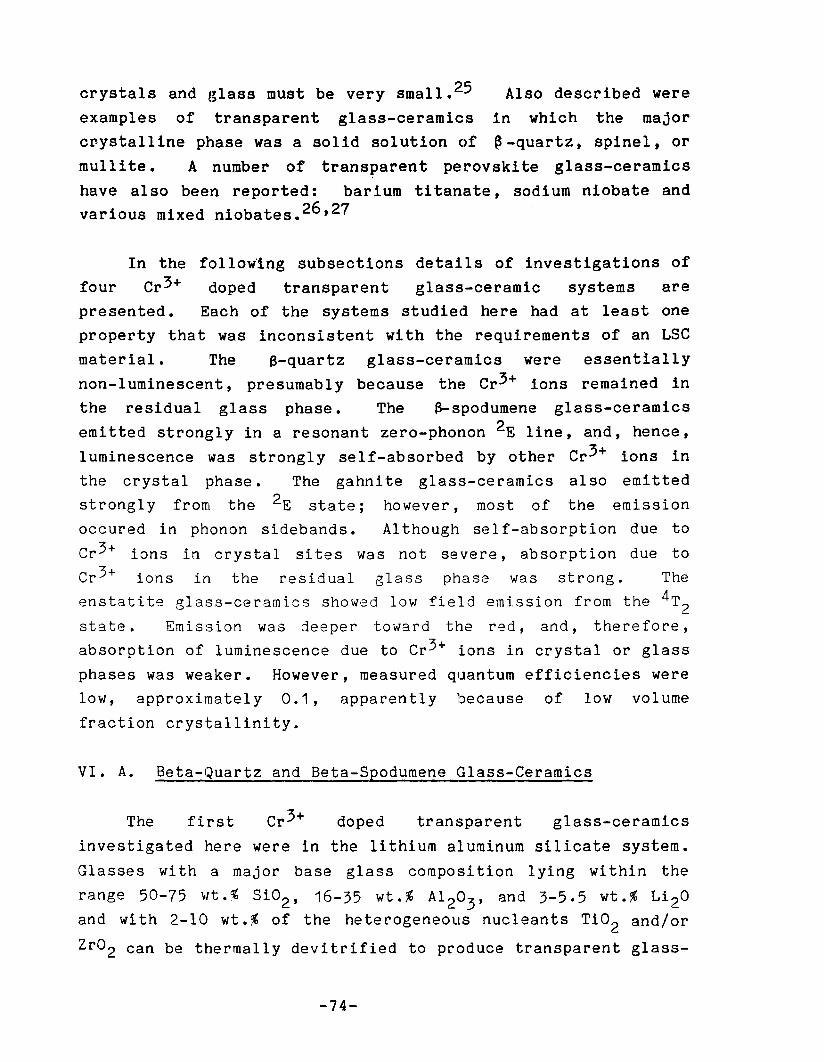
crystals and glass must be very small. 25 Also described were
examples of transparent glass-ceramics in which the major
c~ystalline phase was a solid solution of ~-quartz, spinel, or
mulli te. A number of transparent perovski te glass-ceramics
have also been reported: barium titanate, sodium niobate andvarious mixed niobates. 26,27
In the follo~ing subsections details of investigations of
four Cr3+ doped transparent glass-ceramic systems arepresented. Each of the systems studied here had at least oneproperty that was inconsistent with the requirements of an LSC
material. The a-quartz glass-ceramics were essentiallynon-luminescent, presumably because the Cr 3+ ions remained inthe residual glass phase. The a-spodumene glass-ceramics
emitted strongly in a resonant zero-phonon 2E line, and, hence,
luminescence 'was strongly self-absorbed by other Cr 3+ ions in
the crystal phase. The gahni te glass-ceramics al so emittedstrongly from the 2E state; however, most of the emissionoccured in phonon sidebands. Although se 1f-absorption due to
Cr3+ ions in crystal si tes was not severe, absorption due toCr 3+ ions in the residual glass phase was strong. Theenstatite glass-ceramics showed low field emission from the 4T2state. Emission was deeper toward the red, and, therefore,absorption of luminescence due to Cr3+ ions in crystal or glass
phases was weaker. However, measured quantum efficiencies werelow, approximately 0.1, apparently because of low volume
fraction crystallinity.
VI. A. Beta-Quartz and Beta-Spodumene Glass-Ceramics
The first Cr 3+ doped transparent glass-ceramics
investigated here were in the lithium aluminum silicate system.
Glasses wi th a major base glass composi tion lying wi thin the
range 50-75 vt . % Si02, 16-35 wt. % A1 203, and 3-5.5 wt. % Li 20and with 2-10 wt.% of the heterogeneous nucleants Ti02 and/or
Zr0 2 can be thermally devitrified to produce transparent glass-
-74-

ceramics. A heat treatment schedule of: 1300-1350oF (2-5
hrs.), 1450-16000F (1-2 hrs.) produces a material whose majorcrystalline phase is a solid solution of B-quartz-B-eucryptite.
A third heat treatment step of 1800-1850oF (1 hr.) produces a
reconstructive transformation of the major crystalline phase to
a solid solution of B-spodumene.
Transparent glass-ceramics of the B-quartz and
a-spodumene-type doped with various transition metal ions were
studied by Babcock, Busdiecker, and Hagedorn at Owens-Illinois,
and a patent filed in 1965. 28 It was reported that up to 0.2
wt.% Cr203 produces a green glass which may be thermallydevitrified to a pink transparent B-spodumene glass-ceramic.
Spectral emission and lifetime studies were made of three
0.025 wt •% Cr 203 sample s made by Babcock, et a 1 • in the i rearlier investigation. The three samples were of identical
batch composition the first was an as-melted lithium
aluminum silicate (LAS) glass, the second a transparent
B-quartz glass-ceramic, and the third a transparent B-spodumene
glass-ceramic . Composition and heat-treatment schedules were
similar to those of examples 13 and 14 described in the patentof Babcock, et ~.29
The Cr 3+ : LAS glass sample had two broad absorption bandswi th maxima at 450 and 650 nm , In the Cr~5+ B-quartz
glass-ceramic, the longer wavelength absorption band maxima was
at 675 nm and the posi tion of the shorter vave l eng t h band was
obscured by scattering or absorption in the near UV. Nei ther
sample showed detectable emission. Recently, Kisilev, et ale
have reported the exci tation and emission spectra of a Cr 3+
doped ~quartz glass-ceramic. 29 Excitation and emission
spectra are similar to those from Cr3+ doped glasses.Therefore, there was no evidence to conclude that the observed
emission originated in the ~quartz phase.
-75-

The spectral characteristics of the B-spodumeneglass-ceramic were considerably different from those of the LAS
glass or the B-quartz glass-ceramic. The absorption bands
were shifted to shorter wavelength (420 and 560 nm) and intense
emission, principally in a narrow line at 694.4 nm, was
observed (see Figures 14 and 15).
The spectral features of the three samples can be
interpreted with the aid of the simplified Tanabe-Sugano
diagram for d3 ions in octahedral coordination given in Figure16. The energy levels that participate in the major absorption
and emission bands of Cr3+ are plotted as a function of crystal
field strength, Dq , Both E and Dq are! given in units of B, a
parameter that is expected to vary little for a particular ion.
The crystal field strength in Cr3+ B-spodumene
glass-ceramic is high (very similar to ruby) and the lowest
energy excited state is the 2E state. Absorption is
pr incipally via spin-allowed transitions into the 4T1 and 4T2states, and e xc Ltation very rapidly r el a xe s to the metastable2E state from which emission is ob se r ve d , Because the high
field electron configurations of the 4A2 ground state and the
2E state are the same (t~), the equilibrium position of the
ions in both states is expected to be essentially the same, and
Franck-Condon arguments suggest that emission will principally
be in a narrow zero-phonon line. The zero-phonon line,
historically labeled the R line, is split into two poorly
resolved components in Figure 15 by spin-orbi t coupling and
trigonal distortion crystal field terms. 30 The R line emission
splitting is better resolved in Figure 17 obtained with a Spec
Fl uorolog spectrofl uorometer at 0.25 nm resol ution. Evidence
for trigonal distortion is also present in the asymmetry of the
420 nm excitation band in Figure 14. When symmetry is lowered
by trigonal distortion, the 4T1 state is split into 4A2 and 4E
states. The broad, low intensi ty, structured emission al so
seen in Figure 15 is principally phonon side band emission from
-76-

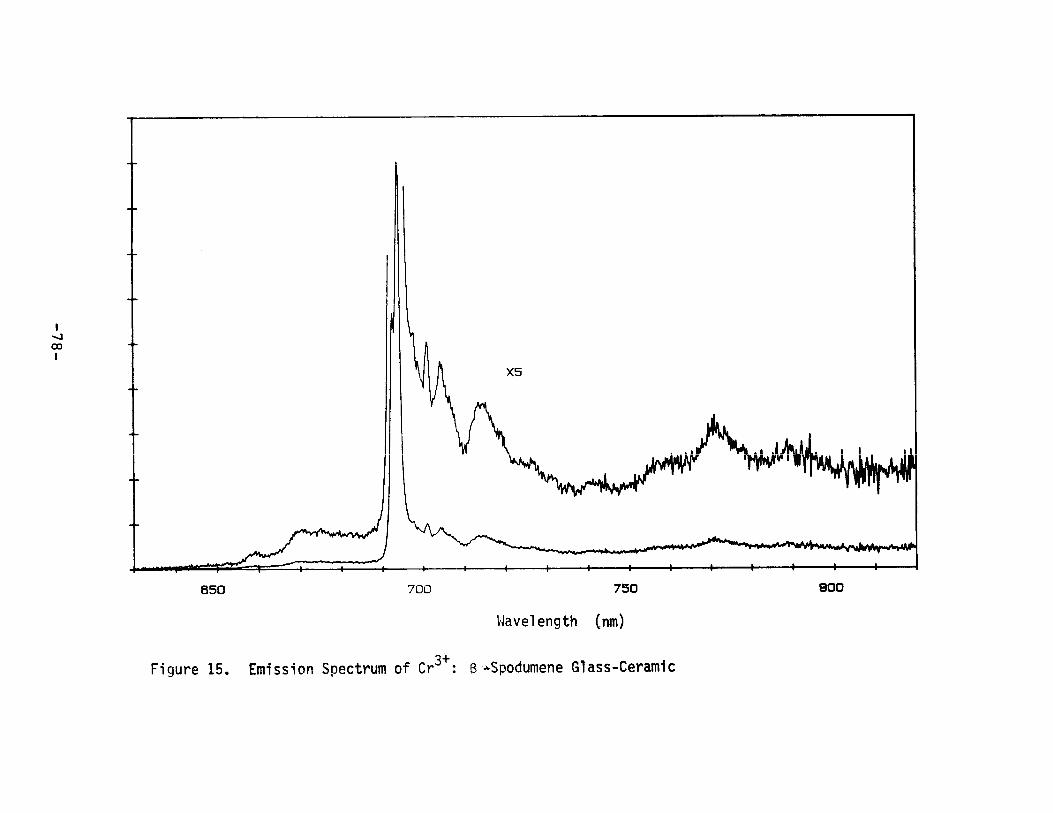

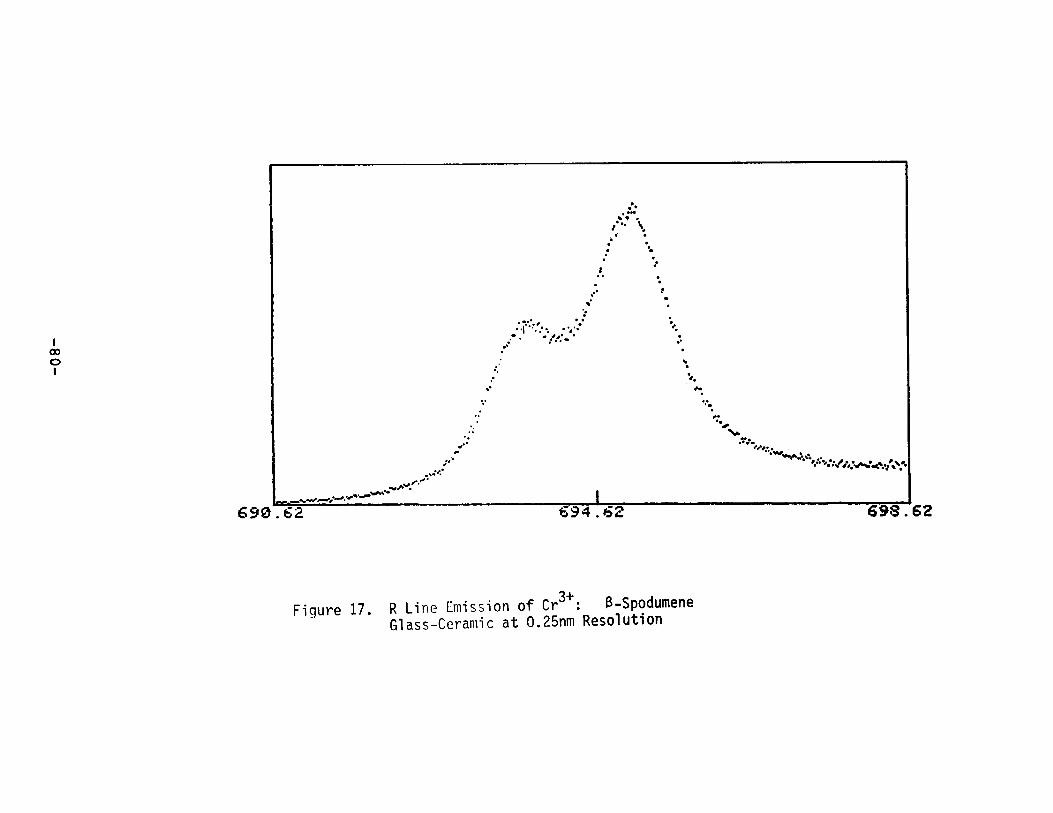
those Cr 3+ sites from which the R line emission' arises.
However, the narrower features lying within 15 nm to the red ofthe R line may be zero-phonon emission from Cr 3+ ion pairs (Nlines).
Lifetime measurements were also made of the Cr 3+ :
B-spodumene sample. Exci tation was wi th a 5 1J s duration Xe
flash lamp passing through a 459.5 nm interference filter. The
sample emission passed by a Schott RG610 glass filter (passes
wavelengths longer than 610 nm) was detected by an S-20
response photomul tiplier tube and displayed as a function of
time on an oscilloscope. The observed emission decay was
non-exponential with a first 1/e folding time of 920 II s and a
second 1/e folding time of 1.2 ms. The long observed lifetime
is consistent with emission from the 2E state.
The absorption spectrum of the Cr 3+ : LAS glass is similar
to that observed in a wide variety of Cr 3+ : glasses21 and a
number of low crystal field crystalline materials. The mean
crystal field strength is lower because of the relatively more
open structure characteristic of glasses and results in the
observed shift to longer wavelength of the 4T1 and 4T2absorption bands.
Crystallographic studies provide some clarification of the
optical properties of Cr 3+ in S-spodumene and S -quartz glass
ceramics. Crystalline Cr203 has a structure in which theoxygen positions approximate hexagonal close packing, and Cr 3+
occupies two-thirds of the octahederal interstices wi th Cr-Oo
distances of 2.02 and 1.97 A. Corundum, a-A1 20 3,o is
isomorphous wi th AI-O distances of 1.97 and 1 .86 A31 ;
therefore, Cr 3+ may be easily introduced SUbstitutionally for
Al into crystal structures that contain octahedrally
coordinated Al (i.e., ruby, Cr 3+ a-AI 20 3).Crystalline
alumino-silicates; however, consist typically of a
-81-
three-dimensional framework of 8i04 and Al0 4 tetrahedra. It ispresumed, therefore, that Cr3+ can only enter these structures
interstitially, occupying approximately octahedral cavities.
The cryatiaLl Lne phase of the a-quartz glass-ceramic is asolid solution of a-quartz (8i02) and a crystal variouslycalled in the literature a-eucryptite or y-spodumene
(LiAI8i206) whose framework is isotopic with a-quartz. Lidetermined the crystal structure of a-quartz solid solution andidentified a large cavity which was found to have a six-foldcoordination with oxygen ~ 32 The aver-age distance from theocenter of the cavity to the six nearby oxygens was 2: 40 A
owith a range from 2.28 to 2:66 A. T'hese distances are much
large~ than the typical Cr-O bond length, and it is likely thatthere is insufficient crystal field s t ab Ll.Lza t Lon energy forCr3+ to occupy the site. It iS,therefore, presumed that Cr3+
in the a-quartz glass-ceramic remains principally in theresidual glassy phase.
The S-spodumene glass-ceramics have a major crystal phasewhic h is a so I id so I ution of s-apod umene (an isomorph of
LiAISi 20S) and keatite (an isomorph of 8i02). The structure ofB-spodumene consists of a three-dimensional framework of
(8i,AI)04 tetrahedra. Distorted octahedral cavities have beenidentified by Li and Peacor in a-spodumene, but the distancefrom the center of the cavity to the six nearby oxygens, 1.84,
o2.54, and 2.S5 A,33 while smaller than those observed inS-quartz solid solution, again seem large to accommodate Cr3+ .
Nevertheless, Hummel, Auh and Johnson 34 have demonstrated that
Cr3+ is soluble in a-spodumene and tentatively suggested that
the chromium enters the octahedral sites identified by Li and
Peacor)3 Our emission data demonstrates concl usively thatCr3+ occupies high field octahedral crystalline sites; however,
whether the sites are those Lden t Lf Led by Li and Peacor in
a-spodumene or other as-yet-unidentified sites cannot be
established.
-82-
In the Luminescent Solar Concentrator context, Cr3+
~spodumene glass-ceramics fail to satisfy the minimum optical
properties cri teria. Emission intensi ty appears strong
(quantum yields were not measured); however, a large fraction
of the emission intensity is in the resonant R lines.
Therefore, self-absorption by other Cr 3+ ions in the
crystalline phase is expected to be unacceptably large.
VI. B. Spinel Glass-Ceramics
The composition and heat-treatment schedules for preparing
transparent spinel-type glass-ceramics have been described by
Beall and Duke. 25 Beall also reported in a patent disclosurethat transparent spinel glass-ceramics can be doped with Cr203to produce red transparent materials that exhibit photo1uminescence similar to ruby. 35 The absorption and emission
spectra of Cr 3+ doped single crystal spinels have beendescribed by Wood, et ~.36 and by Mikenda and Preisinger. 37
The s pine 1s con s titute a gr 0 up 0 f doub l e 0 x ide S vIi t h the
general formula AB 20 4. In the normal spinel structurecharacteristic of natural crystals, c9tion A occupies a
tetrahedral si te and cation B occupies a trigonally distorted
octahedral si te _ Synthetic samples are, however, partiallyinverse where the inverted structure is B(tet)A(oct)B(Oct)04.
The two members of the spinel group of concern here are spinel
itself, MgAl 20 4, and gahnite, ZnAl20 4- Mg-spinel forms a solidsolution series wi th alumina whose end members are MgO· Al203and roughl y MgO· 3. 5A1203. 38 It can be safel y presumed thatgahnite forms a similar solid solution series_ The AI-O
ointeratomic distance in Mg-spinel is 1.91 A,39 and, therefore,
Cr3+ easily enters the structure substitutionally for AI.
A number of transparent spinel glass-ceramJLcs containing
various levels of Cr3+ were prepared using base glass batch
-83-
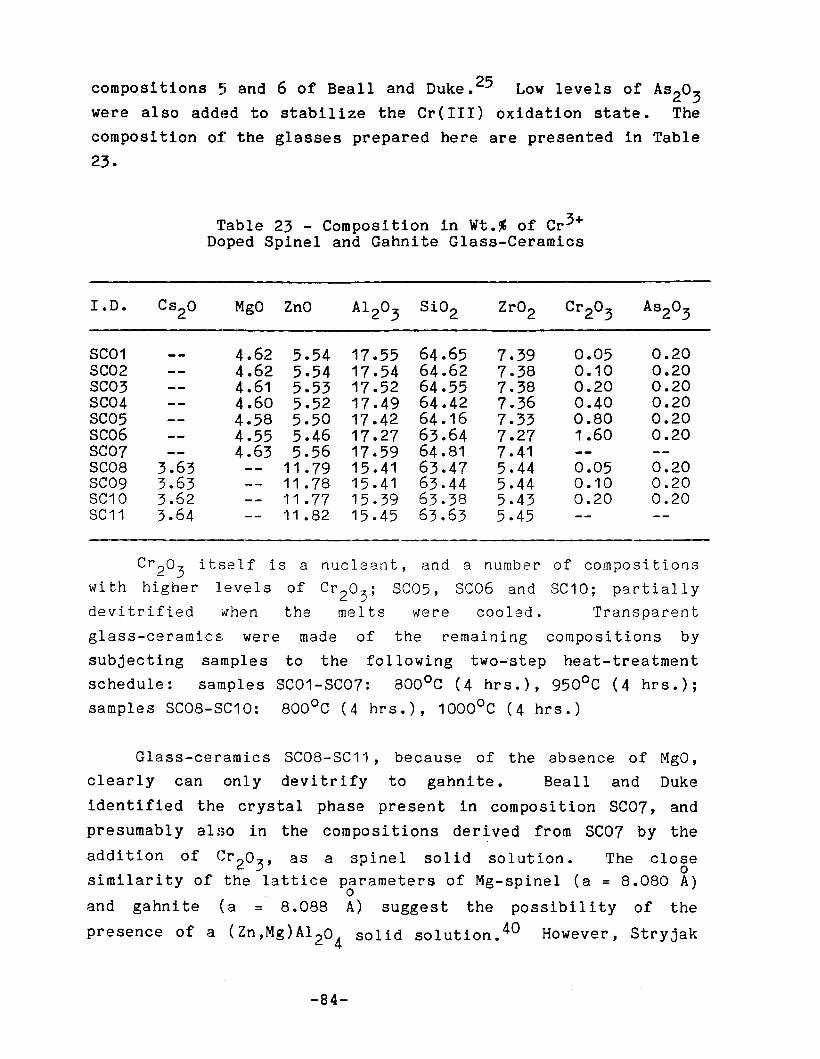
compositions 5 and 6 of Beall and Duke. 25 Low levels of AS20 3were also added to stabilize the Cr(III) oxidation state. The
composition of the glasses prepared here are presented in Table
23.
Table 23 - Composition in Wt.% of Cr3+Doped Spinel and Gahnite Glass-Ceramics
I.D.
SC01SC02SC03SC04SC05SC06SC07SC08SC09SC10SC11
3.633.633.623.64
MgO
4.624.624.614.604.584.554.63
2nO
5.545.545.535.525.505.465.56
11.7911.7811.7711 .82
17.5517.5417.5217.4917.4217.2717.5915.4115.4115.3915.45
64.6564.6264.5564.4264.1663.6464.8163.4763.4463.3863.63
7.397.387.387.367.337.277.415.445.445.435.45
0.050.100.200.400.801.60
0.050.100.20
0.200.200.200.200.200.20
0.200.200.20
Cr203 itself is a nucleant, and a number of compositionswith higher levels of Cr20 3; SC05, SC06 and SC10; partiallydevi trifiedwhen the melts were cooled. Transparent
glass-ceramics were made of the remaInIng compositions by
subjecting samples to the following two~step heat-treatment
schedule: samples SC01-SC07: 800 0C (4 hr s . ), 9500C (4 hrs.);
samples SC08-SC10: 8000C (4 hrs.), 10000C (4 hrs.)
Glass-ceramics SC08-SC11, because of the absence of MgO,clearly can only devitrify to gahnite. Beall and Duke
identified t he crystal phase present in composi tion SC07, and
presumably also in the compositions derived from SC07 by the
addition of Cr203, as a spinel solid solution. The clogesimilarity of the lattice parameters of Mg-spinel (a = 8.080 A)
oand gahnite (a = 8.088 A) suggest the possibility of the
presence of a (Zn,Mg)AI 204solid solution. 40 However, Stryjak
-84-

and McMillan have also studied composition SC07 thermally
devi trifled by the heat-treatment schedule of Beel l and Duke,
and from x-ray diffraction resul ts concl uded that the major
crystalline phase was gahni te. 41 (To be pr-ec Lse , Stryjak and
McMillan reported that 9.1 wt.% Zr02 is r-aqut r ed in SC07 for
the precipi tation of gahni te; at lower Zr02 Leve Ls a a-quartz
solid solution phase forms. However, our emission data clearly
shows that compositions SC01-SC06 formed a crystalline phase
within the spinel group.)
The exci tation and emission spectra of compo s i tion SC04
before devi trification and after devi trification is presented
in Figures 18 and 19. Emission from the gahnite glass-ceramic
is very similar to reported room temperature emission from Cr 3+
doped gahni te single crystals .36 Unresolved R line emission
occurs at 683 nm and the addition~l observed structure has been
assigned to N line emission (due to Cr 3+-Cr3+ pairs and inverse
spinel disordered sites) and phonon side bands. Thermally
popu l a t e d 4T2 emission probably contributes to the underlying
broad unstructured emission.
Quantum yield measurements were made using a 0.11 mol% U03
doped potassium borosilicate slass secondary fluorescence
standard. Glass-ceramics of composition SC02 (0.10 wt.%
Cr 203), SC03 (0.20 wt.% Cr 203) and SC04 (0.40 wt.% Cr 204) hadmeasured quantum yields of 0.62, 0.35 and 0.28, respectively.
Emission lifetimes of the three gahni te glass--ceramics were
also measured using the apparatus described in the previous
section with the exception that excitation pulses were filtered
wi th a Schott BP44 glass fi 1tel' (passes wav e l eng t hs shorter
than 440 nm) and emission was observed through a Schott RG630
glass filter (passes wavelengths longer than 630 nm ) , The
decay curve of SC02 showed a very weak fast component wi th a
1/e lifetime of 60 us , and an intense non-exponential slow
component with an apparent first order 1/e lifetime of 5 ms at
-85-
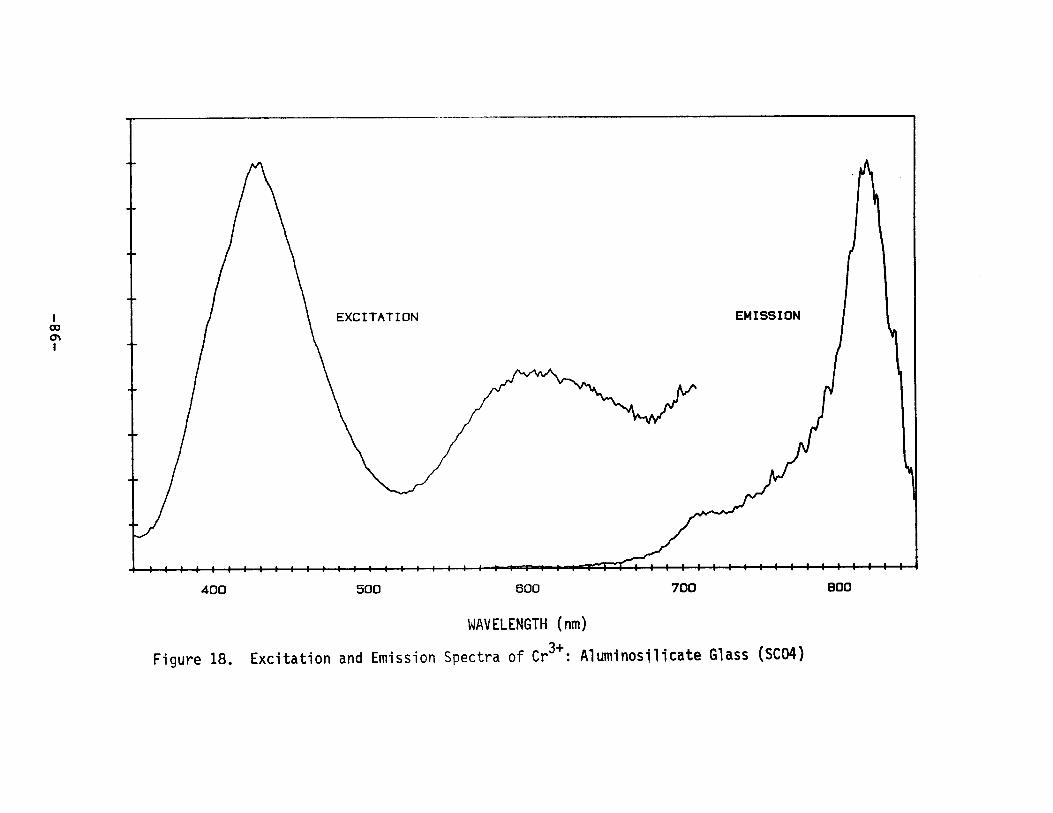


Unfortunately, a more serious
absorption by Cr 3 + ions in the
luminescence from Cr 3 + ions in
t = 5 ms and 19 ms roughly between t = 15 and t = 50 ms. At t
= 3.5 ms glass-ceramics SC02 (0.10 wt.% Cr203), SC03 (0.20 wt.%
Cr203) and SC04 (0.40 wt.~ Cr 203) showed apparent first-order
1/e lifetimes of 4.4, 3.2, and 2.7 ms, consistent with the
concentration quenching observed in the quantum yield
measurements.
On the basis of the emission spectral distribution and
lifetime data, the gahni te glass-ceramics appear to be better
candidates for an LSC material than the a-spodumene glass
ceramics. The smaller distribution of emission intensity among
zero phonon lines and the longer 2E lifetime (which indicates a
smaller 2E absorption cross-section) suggests that resonant
self-absorption is less probable in the gahnite glass-ceramics.
Concentration quenching is, however, clearly a problem in the
gahnite materials. The peak absorbance of the 4T2 band in a 3
mm thick sample of the 0.40 wt.% Cr203 glass-ceramic (SC04) is
0.55 and the quantum yield has been reduced by concentration
quenching to 0.28. Therefore, the product of relative solar
absorbance and quantum yield at the optimum Cr203 concentration
will be poor.
difficul ty associated wi th
residual glass phase of
the gahnite phase is also
present. The absorbance spectra of 3 mm thick samples of a
glass and a heat-treated gahni te glass-ceramic of composi tion
SC04 are presented in Figure 20. It is observed that the glass
has an Ln t.en se absorption tail that extends from 650 nm out
past 1 u m, 'I'he glass-ceramic has weaker absorbance over the
same region; however, the absorbance is sufficiently strong
(0.27 cm-1 at 700 nm) to cause large absorption losses,
particularly if the absorbing species is essentially
non-luminescent.
It is suggested that the source of the far-red absorption
-88-
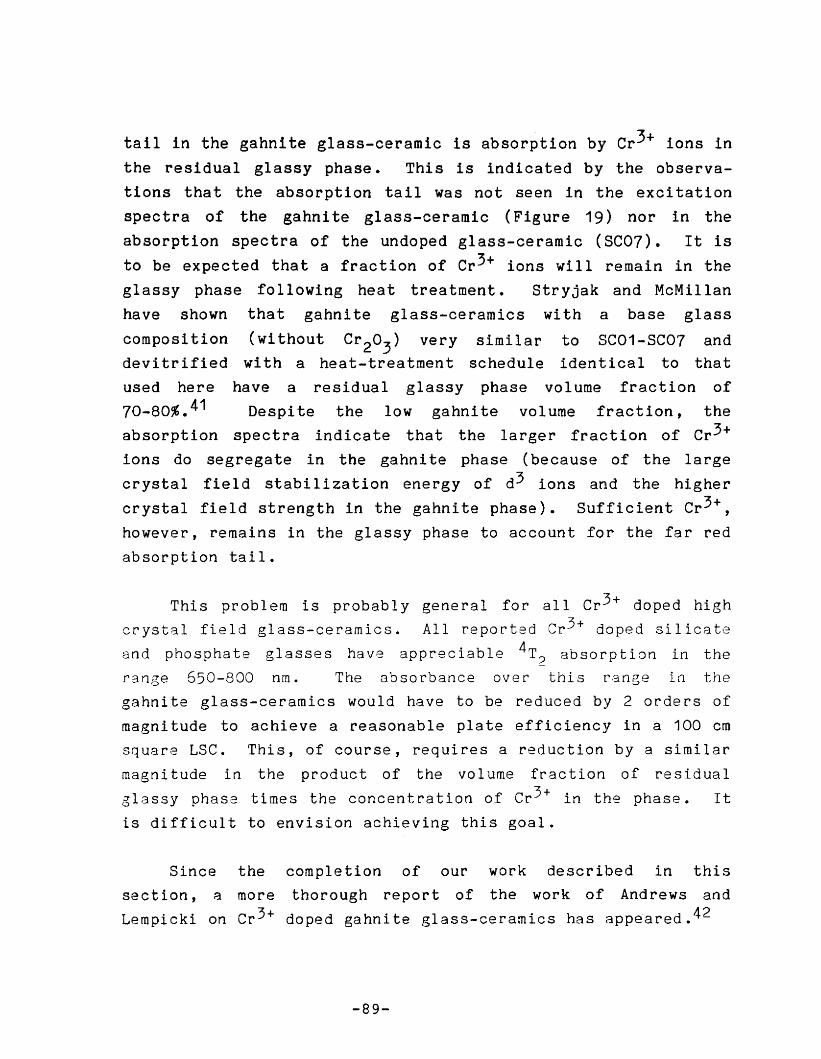
tail in the gahnite glass-ceramic is absorption by er3+ ions in
the residual glassy phase. This is indicated by the observa
tions that the absorption tail was not seen in the excitation
spectra of the gahni te glass-ceramic (Figure 19) nor in the
absorption spectra of the undoped glass-ceramic (Se07). It is
to be expected that a fraction of er3+ ions will remain in the
glassy phase following heat treatment. Stryjak and McMillan
have shown that gahnite glass-ceramics with a base glass
composition (without Cr 20 3 ) very similar to SC01-SC07 anddevi trified wi th a heat-treatment schedule identical to that
used here have a residual glassy phase volume fraction of
70-80%.41 Despite the low gahnite volume fraction, the
absorption spectra indicate that the larger fraGtion of Cr3+
ions do segregate in the gahni te phase (because of the large
crystal field stabilization energy of d3 ions and the higher
crystal field strength in the gahnite phase). Sufficient Cr3+ ,
however, remains in the glassy phase to account for the far red
absorption tail.
This problem is probably general for all Cr 3 + doped high
crystal field glass-ceramics. All reported Cr3+ doped silicate
and phosphate glasses have appreciable 4TZ absorption in the
range 650-800 nm. The absorbance over this range in the
gahnite glass-ceramics would have to be reduced by 2 orders of
magnitude to achieve a reasonable plate efficiency in a 100 cm
square LSC. This, of course, requires a reduction by a similar
magnitude in the product of the volume fraction of residual
glassy phase times the concentration of Cr3+ in the phase. It
is difficult to envision achieving this goal.
Since the completion of our work described in this
section, a more thorough report of the work of Andrews and
Lempicki on Cr 3+ doped gahnite glass-ceramics has appeared. 42
-89-
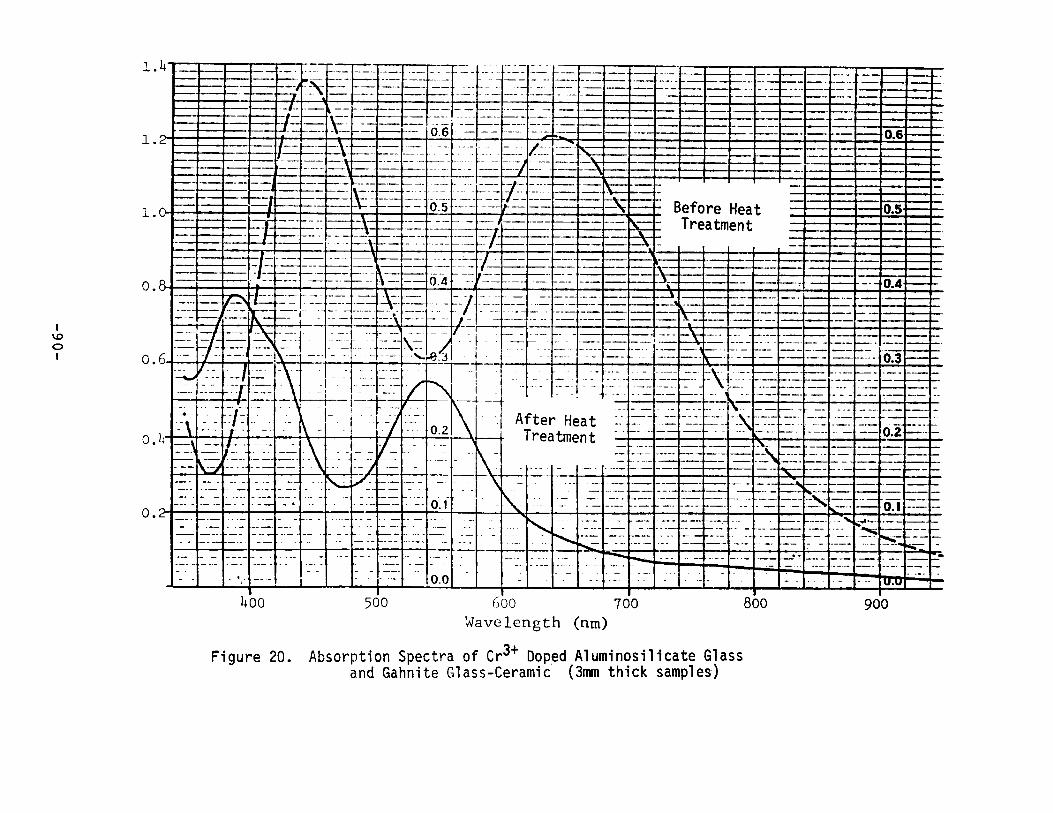
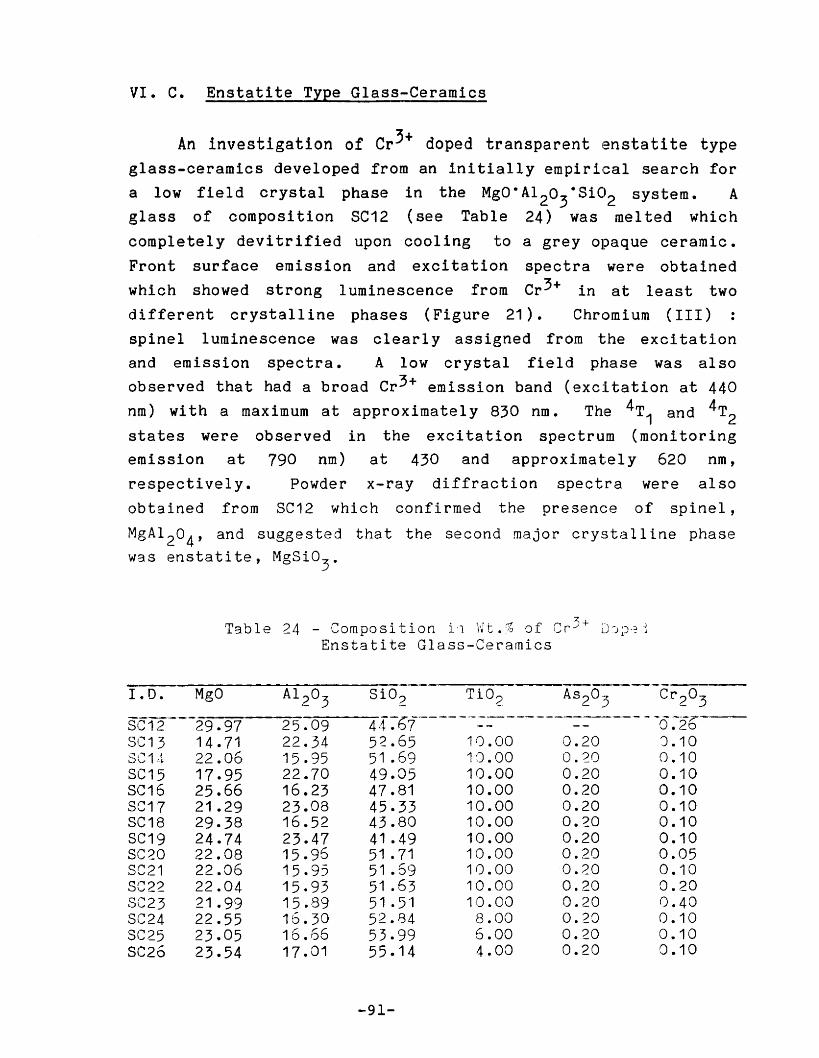
VI. C. Enstatite Type Glass-Ceramics
An investigation of Cr3+ doped transparent enstatite typeglass-ceramics developed from an initially empirical search for
a low field crystal phase in the MgO·A1203·Si02 system. A
glass of composition SC12 (see Table 24) was melted which
completely devitrified upon cooling to a grey opaque ceramic.
Front surface emission and exci tation spectra were obtained
which showed strong 1uminescence from Cr 3+ in at least two
different crystalline phases (Figure 21). Chromium (III)
spinel 1uminescence was clearly assigned from the exci tation
and emission spectra. A low crystal field phase was also
observed that had a broad Cr 3 + emission band (excltation at 440
nm) wi th a maximum at approximately 830 nm , The 4T1 and 4T2states were observed in the excitation spectrum (monitoring
emission at 790 nm) at 430 and approximately 620 nm,
respectively. Powder x-ray diffraction spectra were also
obtained from 8C12 which confirmed the presence of spinel,
MgA1 204,and suggested that the second major crystalline phase
was enstatite, Mg8i03.
Table 24 - Composition il 'l'J t . % of "r 3 + ;:J~) ~) ·~l\J
Enstatite Glass-Ceramics
----I. D. MgO A1 20 38i02 Ti02 As2025 Cr 203
G------.~------.-----~--- - -----81:12--29.97 25.09 44. 7 -- -- 0.263C13 14.71 22.34 52.65 10.00 0.20 J.10SC14 22.06 15.95 51 .69 1 ''] . 00 0.20 0.108C15 17.95 22.70 49.05 10.00 0.20 0.108C16 25.66 16.23 47.81 10.00 0.20 0.108C17 21.29 23.08 45.33 10.00 0.20 0.108C18 29.38 16.52 43.80 10.00 0.20 0.108C19 24.74 23.47 41 .49 10.00 0.20 0.108C20 22.08 15.96 51 .71 10.00 0.20 0.05SC21 22.06 15.95 51.59 10.00 0.20 0.108C22 22.04 15.93 51 .53 10.00 0.20 0.20SC23 21.99 15.89 51 .51 10.00 0.20 0.408C24 22.55 16.30 52.84 8.00 0.20 0.108C25 23.05 16.66 53.99 6.00 0.20 0.108C26 23.54 17.01 55.14 4.00 0.20 0.10
-91-

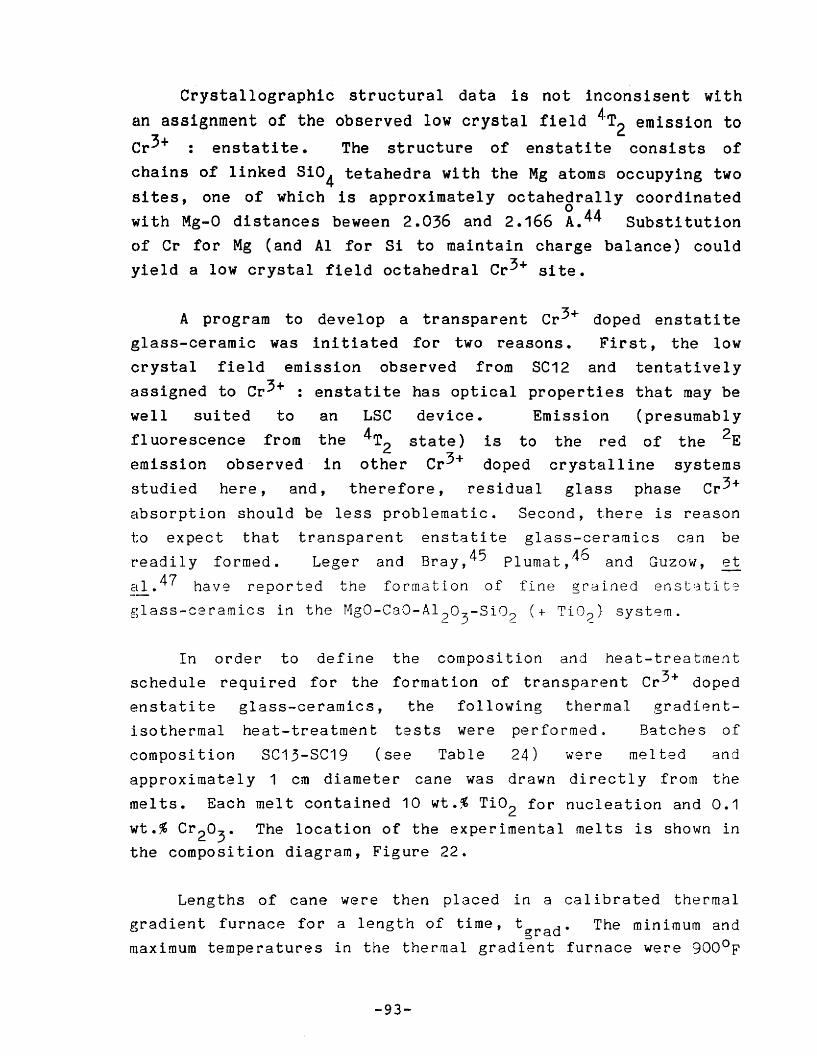
Crystallographic structural data is not inconsisent wi th
an assignment of the observed low crystal field 4T2 emission to
Cr3+ enstati te. The structure of enstati te consists of
chains of linked 3i04 tetahedra with the Mg atomfl occupying twosi tes, one of which is approximately octahedrally coordinated
owi th Mg-O distances beween 2.036 and 2.166 A.44 Substi tution
of Cr for Mg (and Al for S1 to maintain charge balance) couldyield a low crystal field octahedral Cr3+ site.
A program to develop a transparent Cr3+ doped enstati teglass-ceramic was ini tiated for two reasons. ]~irst, the low
crystal field emission observed from SC12 and tentatively
assigned to Cr3+ : enstatite has optical properties that may be
well sui ted to an LSC device. Emission (presumabl y
fluorescence from the 4T2 state) is to the red of the 2Eemission observed· in other Cr3+ doped crystalline systems
studied here, and, therefore, residual glass phase Cr3+
absorption should be less problematic. Second, there is reasonto expect that transparent enstatite glass-ceramics can bereadily formed _ Leger and Bray, 45 PI umat, 46 and Guzow, et
al _47 ha ve reported the format ion of fine grained ens t a t i t2
glass-ceramics in the MgO-CaO-AI 203
- Si 02 (+ Ti0 2 ) syst~m.
In order to define the composition and heat-treatmentschedule required for the formation of transparent Cr3+ doped
enstatite glass-ceramics, the following thermal gradient
lsothermal heat-treatment tests were performed '. Batches ofcomposition SC13-SC19 (see Table 24) were melted and
approximately 1 cm diameter cane was drawn directly from the
melts_ Each melt contained 10 wt.% Ti02 for nucleation and 0.1
wt.% Cr 203 • The location of the experimental melts is shown inthe composition diagram, Figure 22.
Lengths of cane wer-e then placed in a calibrated thermal
gr-adient furnace for a length of time, t ar ad - The minimum and,::)
maximum temperatures in the thermal gradient furnace were gOOOF
-93-

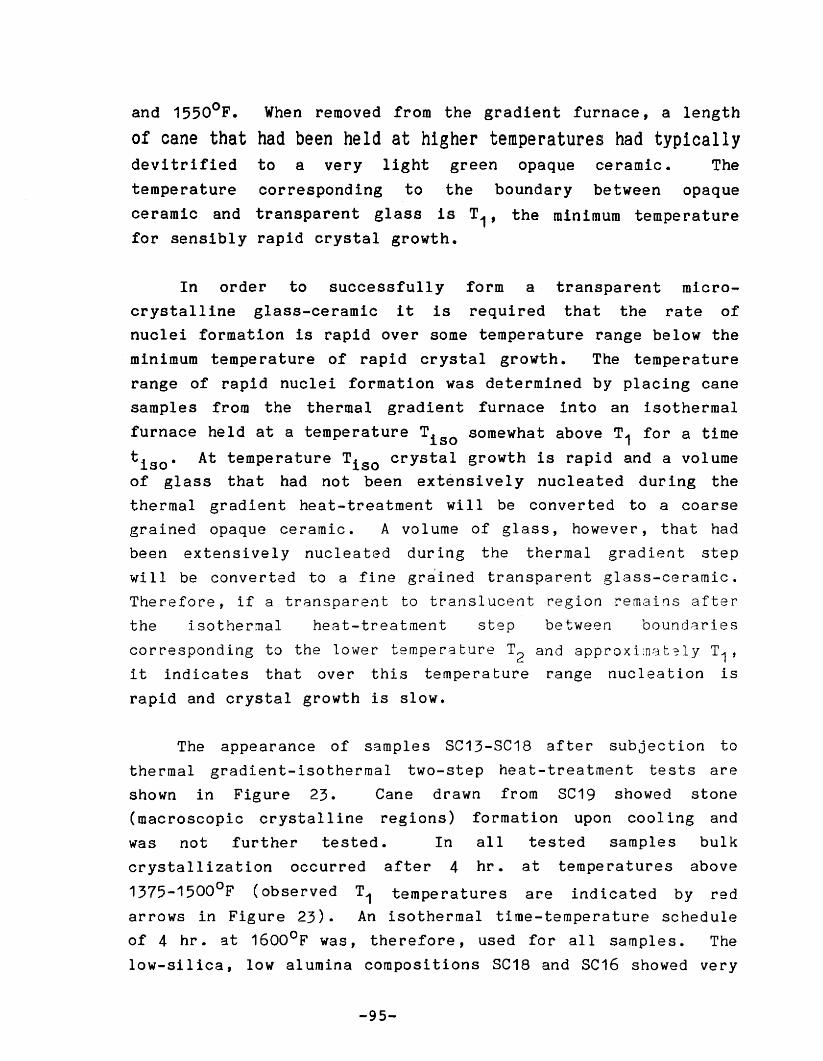
and 1550oF. When removed from the gradient furnace, a length
of cane that had been held at higher temperatures had typicallydevitrified to a very light green opaque ceramic. The
temperature corresponding to the boundary between opaque
ceramic and transparent glass is T1, the minimum temperaturefor sensibly rapid crystal growth.
In order to successfully form a transparent microcrystalline glass-ceramic it is required that the rate ofnuclei formation is rapid over some temperature range below the
minimum temperature of rapid crystal growth. The temperature
range of rapid nuclei formation was determined by placing canesamples from the thermal gradient furnace into an isothermal
furnace held at a temperature Ti s o somewhat above T1 for a time
t i s o• At temperature Ti s o crystal growth is rapid and a volumeof glass that had not been e x t e ns I vely nucleated dur ing thethermal gradient heat-treatment wi 11 be converted to a coarsegrained opaque ceramic. A vol ume of glass, howeve r , that had
been extensively nucleated during the thermal gradient stepwill be converted to a fine gr~ined transparent glass-ceramic.Therefore, if a transparent to translucent region remains afterthe isothermal heat-treatment step between boundaries
corresponding to the lower temperature T2 and app r ox Ina t e l y T1,it indicates that over this temperature range nucleation is
rapid and crystal growth is slow.
The appearance of samples SC13-SC18 after subjection tothermal gradient-isothermal two-step he a t e t r-ea t.ment tests are
shown in Figure 23. Cane drawn from SC19 showed stone(macroscopic crystall ine regions) formation upon cool ing andwas not further tested. In all tested sample s bulk
crystallization occurred after 4 hr. at temperatures above
1375-1500oF (observed T1 temperatures are indicated by redarrows in Figure 23). An isothermal time-temperature schedule
of 4 hr. at 16000F was, therefore, used for all samples. The
low-silica, low alumina compositions SC18 and SC16 showed very
-95-


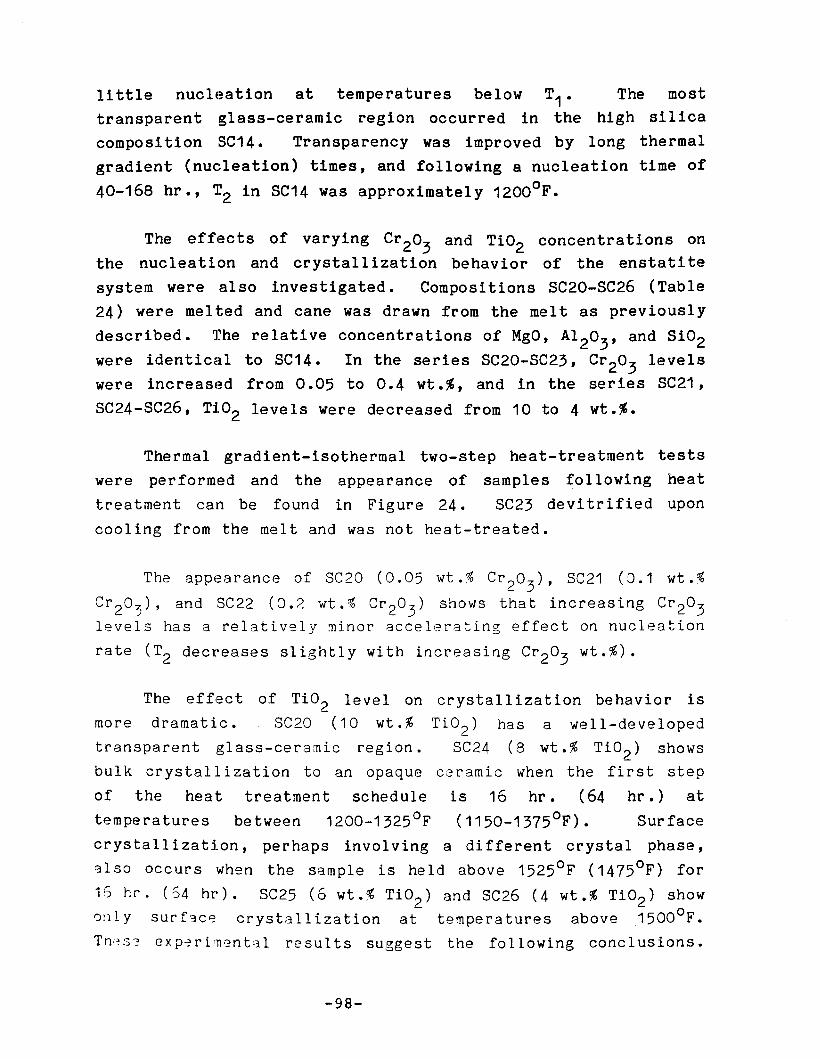
Ii ttle nuc Leab Lon at temperatures below T1• The most
transparent glass-ceramic region occurred in the high silica
composi tion 8C14. Transparency was improved by long thermal
gradient (nucleation) times, and following a nucleation time of
40-168 hr., T2 in SC14 was approximately 12000F.
The efflects of varying Cr203 and Ti02 concentrations on
the nucleation and crystallization behavior of the enstati te
system were al so investigated. Compositions SC20-SC26 (Table
24) were melted and cane was drawn from the melt as previously
described. The relative concentrations of MgO, A1 203,and Si02
were identical to SC14. In the series SC20-SC23, Cr 203levels
were Lncr-e asad from 0.05 to 0.4 wt.%, and in the series SC21,
SC24-SC26, Ti02 levels were decreased from 10 to 4 wt.%.
Thermal gradient-isothermal two-step heat-treatment tests
were performed and the appearance of samples following heat
treatment can be found in Figure 24. SC23 devi trified upon
cooling from the melt and was not heat-treated.
The appe a r anc e of SC20 (0.05 wt. % c- 2°3)' SC21 (J.1 wt. %
Cr 203), and SC22 (0.2 wt.% Cr 20 3)shows that increasing Cr 20 3
levels has a relatively minor accelerating effect on nucleation
rate (T 2 decreases slightly with increasing Cr 203 wt.%).
The e f'f'e c t of Ti02 level on crystal 1 ization behavior is
more dramatic. SC20 (10 wt.% Ti02) has a well-developed
transparent gl ass-ceramic region. SC24 (8 wt. % Ti02) shows
bulk crystallization to an opaque ceramic when the first step
of the heat treatment schedule is 16 hr • (64 nr .) at
tempe r a tures be tween 1200-1325 OF ( 1150-1375of) • Sur face
crysta 11 i zation, perhaps involving a different crystal phase,
81 so occ ur s when the sample is he l d above 15250F (14 75°F) for
16 hr. (54 hr). SC25 (6 wt.% Ti02) and SC26 (4 wt.% Ti02) show
on l y s ur f a c e crystallization at temperatures above 1500oF.
Tn;~s? e x pe r Lmen t a I results suggest the following conclusions.
-98-


i.) Bulk crystal growth does not occur in the enstatite system
without heterogeneous nucleation. ii.} Ti02 is ineffective as
a heterogeneous nucleant at concentrations below 8-10 wt. %.iii.) At the 8 wt.% Ti02 level the rate of nuclei formation istoo low for the formation of a fine grained transparentglass-ceramic and rapid enough for the formation of a coarse
grained opaque ceramic only over the temperature range roughly
1200-1350oF. iv.) At the 10 wt.% Ti02 level rapid nucleationand slow crystal growth can be achieved over the temperature
range roughly 1200-1400oF and rapid crystal growth can be
achieved above roughly 1500oF.
Larger samples of Cr3+ doped transparent enstatite
glass-ceramics were then prepared for an investigation of their
optical properties. Batch compositions and heat-treatment
schedules that appeared to optimize transparency were used.
Compositions SC20 (0.05 wt;% Cr 203), SC21 (0.1 wt.% Cr 203), and
SC22 (0.2 wt.% Cr 20 3) were melted, annealed, and cast. Samples3 mm in thickness were cut and polished for optical investiga
tion of the magnesium alumino-silicate (MAS) glass. A number
of the samples were then converted to transparent enstati te
glass-ceramics by the following two-step heat-treatment
schedule: 13500F (64 hr.), 16000F (4 hr.). Glass-ceramic SC20
was slightly translucent; however, SC21 and SC22 appeared
transparent to the eye. Glass-ceramic SC21 was investigated byx-ray diffraction. All significant diffraction peaks above the
broad scatter due to the vitreous phase were assigned to
enstatite.
Absorption spectra of the most heavily doped samples
(SC22) are presented in Figure 25. 4T1 absorption appears as ashoulder at roughly 420 nm on an intense near-UV absorption
edge in the MAS glass sample and is totally obscured(presumably by Rayleigh scattering) in the enstatite
glass-ceramic. The posi tion of the 4T2 ab so r p t t on maxima in
the MAS glass and the enstatite glass-ceramic (SC22, 0.2 wt.%
-101-
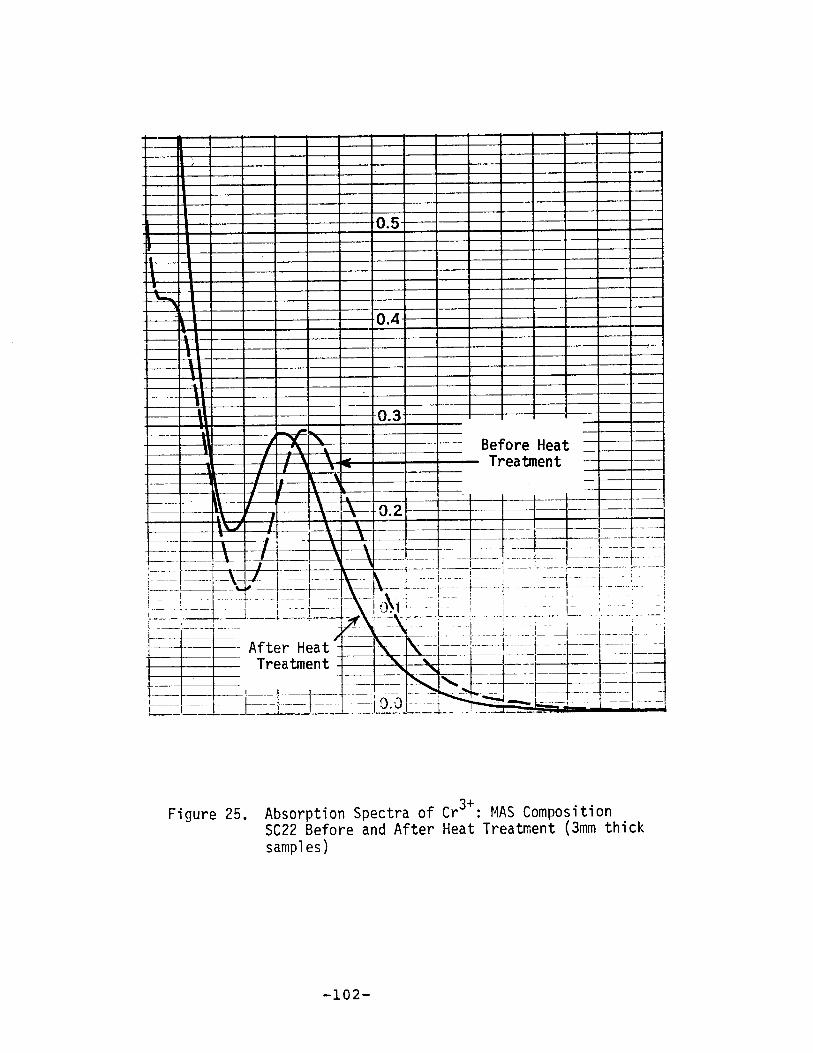
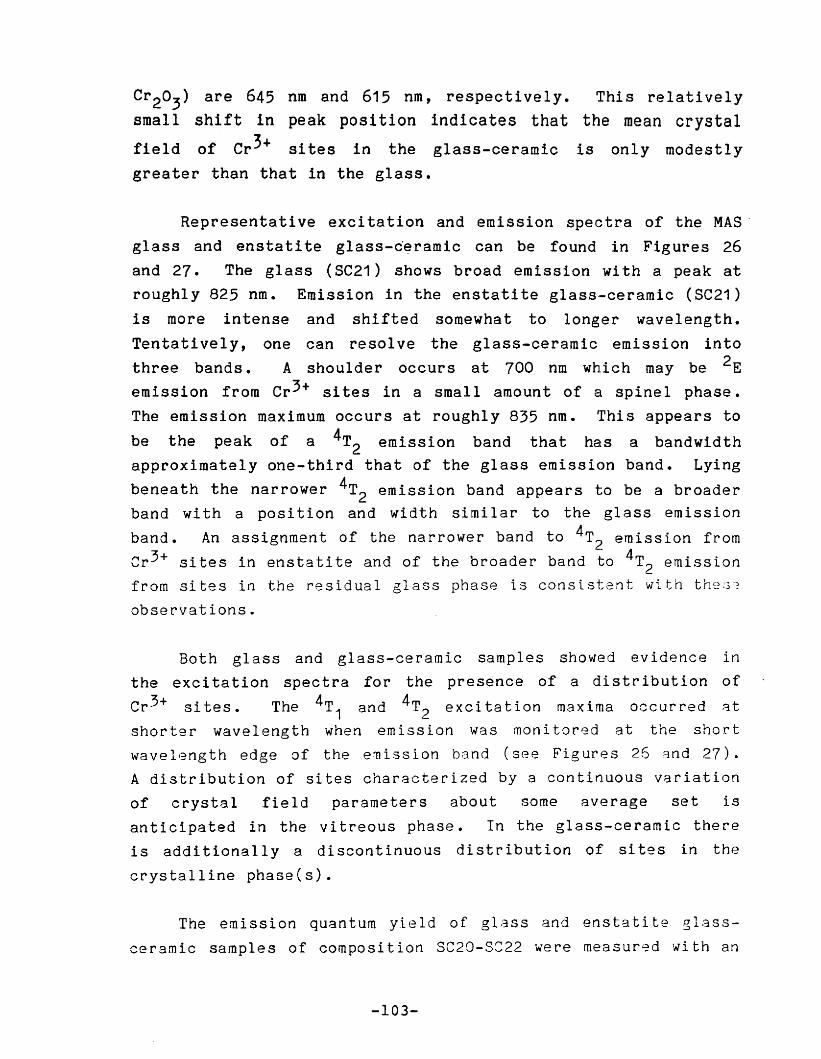
Cr 203 ) are 645 nm and 615 nm, respectively.
small shift in peak position indicates that
field of Cr 3+ sites in the glass-ceramic
greater than that in the glass.
lrhis relatively
the mean crystal
is only modestly
Representative excitation and emission spectra of the MAS'
glass and enstati te glass-ceramic can be found in Figures 26
and 27. The glass (SC21) shows broad emission with a peak at
roughly 825 nm. Emission in the enstatite glass-ceramic (SC21)
is more intense and shifted somewhat to longer wavelength.
Tentati vely, one can resol ve the glass-ceramic emission into
three bands. A shoulder occurs at 700 nm which may be 2E
emission from Cr3+ sites in a small amount of a spinel phase.
The emission maximum occurs at roughly 835 nm. This appears to
be the peak of a 4T2 emission band that has a bandwidthapproximately one-third that of the glass emission band. Lying
beneath the narrower 4T2 emission band appears to be a broaderband wi th a posi tion and width similar to the glass emission
band. An assignment of the narrower band to 4T2 emission from
Cr 3+ sites in enstatite and of the broader band to 4T2 emissionfrom sites in the residual glass phase is consistent with thes?
observations.
Both glass and glass-ceramic samples shcwe d evidence in
the exci tation spectra for the presence of a distr ibution of
Cr 3+ sites. The 4T1 and 4T2 excitation maxima occurred at
shorter wavelength when emission was monitored at the short
wavelength edge of the emission band (see Figures 26 an d 27).
A distribution of sites characterized by a continuous variation
of crystal field parameters about some average set is
anticipated in the vitreous phase. In the glass-ceramic there
is additionally a discontinuous distribution of' sites in the
crystalline phase(s).
The emission quantum yield of glass and enstatite glass
ceramic samples of composition SC20-SC22 were measur~d with an
-103-
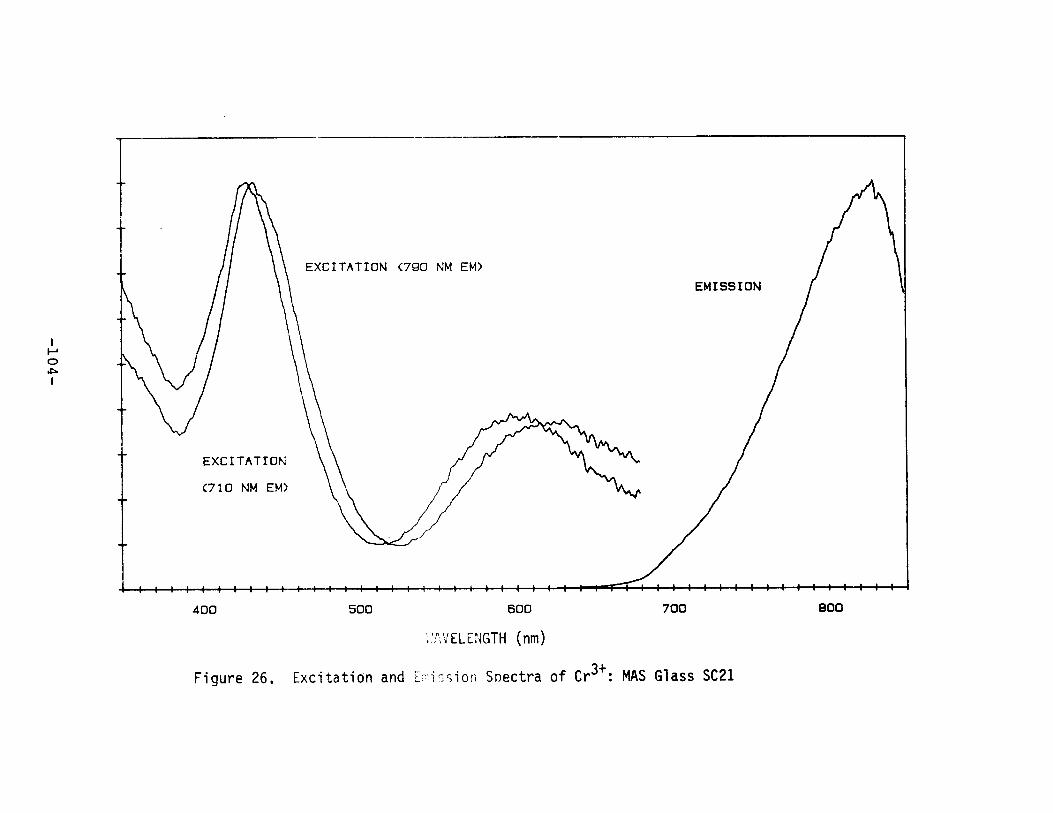

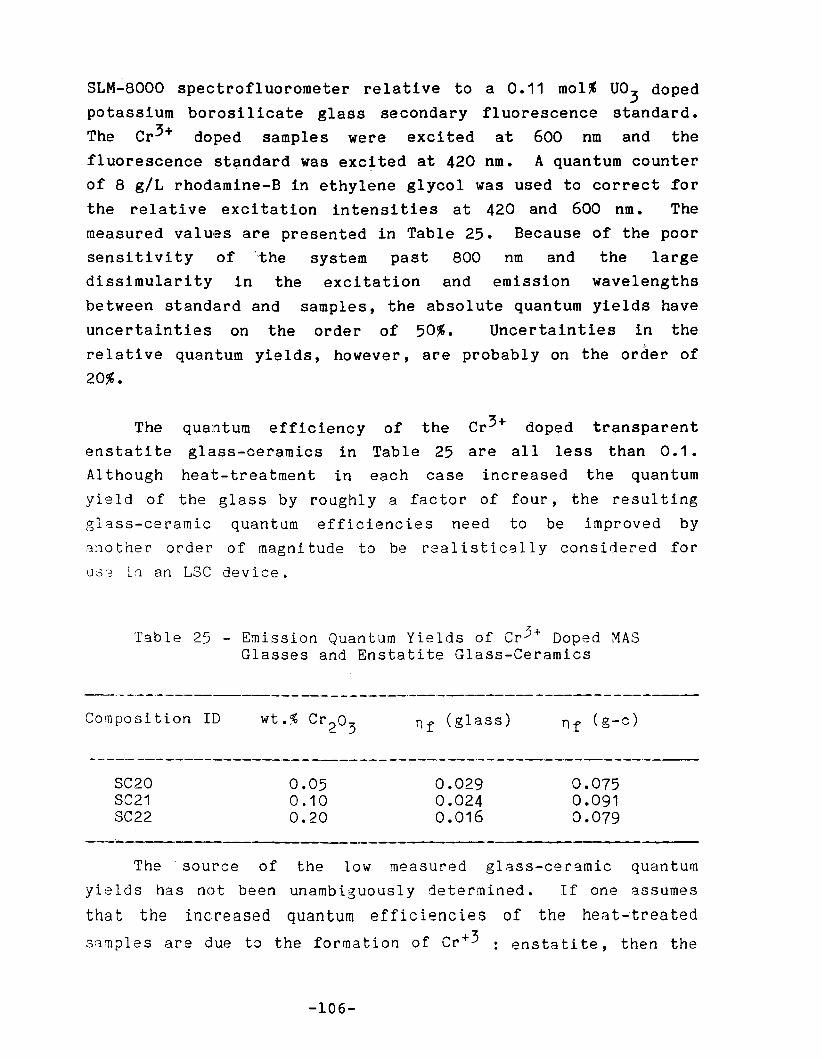
SLM-8000 spectrof1uorometer relative to a 0.11 mo1% U0 3 doped
potassium bo ro s I 1icate glass secondary f1 uorescence standard.
The Cr3+ doped samples were excited at 600 nm and the
fluorescence standard was exc~ted at 420 nm. A quantum counter
of 8 gIL rhodamine-B in ethylene glycol was used to correct for
the relative excitation intensities at 420 and 600 nm , The
measured values are presented in Table 25. Because of the poor
sensi tivi ty of 'the system past 800 nm and the large
dissimu1arity in the excitation and emission wavelengths
between standard and samples, the absolute quantum yields have
uncertainties on the order of 50%. Uncertainties in the
relative quantum yields, however, are probably on the order of
20%.
The quantum efficiency of the Cr 3+ doped transparent
enstatite glass-ceramics in Table 25 are all less than 0.1.Although heat-treatment in each case increased the quantum
yield of the glass by roughly a factor of four, the resulting
glass-ceramic quantum efficiencies need to be improved by
C.i;}O the r order of magni tude to be rea 1i st i call y cons idered for
U:3;? L'1 an LSC device.
Table 25 - Emission Quantum Yields of Cr3+ Doped MASGlasses and Enstatite Glass-Ceramics
Composition 1D nf (glass) n.r (g-c)
'_._--_.__._----_._-------_._-----------_._-,-------_.---_. ---
----------------
SC20SC21SC22
_._.~-------,
0.050.100.20
0.0290.0240.016
0.0750.0910.079
The . source of the low measured glass-ceramic quantum
yields has not been unambiguously determined. If one assumes
tha t the inc: reased quantum eff i c ienc ie s of the heat -trea ted
38mp1es are due to the formation of Cr+ 3 : enstatite, then the
-106-
observation that the Cr3+ enstatite glass-ceramics havequantum efficiencies on the order of 0.1 indicates that the
percent enstati te crystallini ty of the glass-ceramics is low,
or that the quantum efficiency of the Cr3+ : enstati te phase
itself is low or both. It appears, based on the following
evidence, that the firstal ternative is the more likely. A
comparison was made of the front surface emission intensity of
the fully crystallized opaque ceramic SC12 and the transparent
enstatite glass-ceramic SC22. Both were excited at 600 nm and
the emission spectral distr ibution of both were similar, wi th
the exception that SC12 showed a minor amount of 2E emission
that had previously been assigned to Cr3+ : spinel. The ratio
of emitted power of SC12 to SC22 was 10.9, and the percent
absorption (at 600 nm) of SC22 is 76%. If one assumes that thepercent absorption of the opaque ceramic is 100%, a lower bound
to the quantum efficiency of SC12 of 0.65 can be calculated.
Provided that the majori ty of the emission ob se r ve d in both
samples arises from Cr3+ : enstatite, this indicates that the
quantum efficiency of the Cr 3+ : enstatite phase is high, and
that the low quantum efficiency of the transparent glass
ceramic is due to low pe r-c en t crystallinity (th,~ ma j o r j t y of
absorbing Cr 3+ ions occupying sites in the vitreous phase that
are weakly luminescent).
Alternatively, the data does not allow one to rule out the
possibility that the bulk of observed emission in the
transparent glass-ceramics originates from Cr3+ ions in the
vi treous phase. The quantum efficiency improve men t observed
after heat treatment may be associated with structural
relaxation and a compositional change (due to the precipitation
of MgSi0 3 ) of the vitreous phase that occurs during the heattreatment schedule.
In either event, the possibility of s ub s t an t i a l Ly
improving the luminescence efficiency of the Cr 3 + doped
transparent enstatite glass-ceramic system appears remote. The
-107-

composition and heat-treatment schedule range required to forma transparent glass-ceramic are narrow; therefore, there islittle opportunity to substantially improve percent
crystallinity without degrading transparency. If emission doesarise from Cr3+ ions in the residual glass phase, the observedpoor quantum yield of Cr3+ doped glasses 21 also suggests thatthe possibility of improving luminescence efficiency is poor.
-108-

VII. INORGANIC GLASSES
Attention was first drawn to luminescent inorganic glasses
because of their excellent long-term stability and generallysuperior separation of luminescence and absorption bands (hence,
low luminescence self-absorption). The properties of a number of
luminescent inorganic glass systems have been discussed inprevious reports2 , 3 . The purpose of this section is to place theearl ier specific investigations into a broader context, whi Iereviewing their suitability as an LSC plate material.
Glasses wi th properties potentially sui table for use in anLSC can be classified into one of the five groups listed in Table26. The classification is generally on the basis of the natureof the optical transi tions invol ve d in emission; however, forconvenience multiphase glass-ceramics are listed separately.
Table 26
Classification of Luminescent Dopantsin Inorganic Glasses
--_._-----~--
(1) Molecular Phosphors
i.e.: U02
2 +
(2) Rare Earth Ions with Intraconfigurational f-fTransitions
i.e.: Trivalent rare earth ions - Nd3 + , Eu3+ , etc.
(3) Rare Earth and Transition Metal Ions with Interconfigurational Transitions
i . e • : fn-1 d -> fn: Ce3+ , Eu2+
d10 -> d9p: Ag+, Cu+
52 _> sp: 8n2 + , 8b 3+ , Pb 2 + , 81 3+
-109-

(4) Transition Metal Ions with Intraconfigurational d-dTransitions
i.e. : d3: Cr 3+, M03+
d5 : Mn2+, Fe3+
d2: V3+
(5) Transparent Glass-Ceramics
Inorganic glasses doped with molecular phosphors areexemplified essentially only by the uranyl ion doped glasses.
Small amounts of a variety of luminescent organic molecul~s can
also be introduced into low melting phosphate and borate glass;
however, the poor chemical stability of these glasses would seem
to preclude their practical significance. Energies of.the uranyl
glasses are determined largely by the structure of the U022+
molecular ion, and, therefore, changing base glass composi tion
has onl y a modest infl uence on the posi tion of absorption and
emission bands. Quantum yields, however, are glass-composi tion
dependent. Uranyl glasses have been studied by our group and
others. Quantum effici~ncies of 0.6 - 0.7 have been measured in
dilute U03 doped borosilicate glasses. However, the occurance ofC8nC'?~1t ration que nc h i ng 3'1d the f'a c t that abso r ption is on1y in
the UV - blue spectral region results in weak relative solar
absorption.
The absorption and emission bands of glasses doped with
trivalent rare earth ions are associated with intraconfigura
tional f-f transi tions. Because the transi tions are intracon
figurational, absorption is Laporte forbidden and weak. And
because f electrons are well shielded, crystal field
perturbations are weak and absorption and emission lines are
narrow and occur at almost the same frequency regardless of the
structure of the host. The weak crystal field perturbations also
C3use very small Stokes shift values; however, the terminal level
-110-

in many emission lines is a lower excited state, and, therefore,
in these cases self-absorption is very weak. Trivalent rareearth ion doped glasses can emit with high quantum efficiency and
have been thoroughly studied largely because of their technical
importance as laser gain media. The Eu3+ ion has been studied"
here as an acceptor of U022+ excitation with the aim of shifting
emission farther to the red. However, further studies of
trivalent rare earth ion doped glasses have not been attempted
because the rare earth oxides are costly and achieving large
relative solar absortion would reqUire large dopant levels of a
number of rare earth oxides. It is felt that such a glass, were
it successfully developed with adequate optical properties, would
be uneconomical for a primary luminescence solar concentrator.
A number of luminescent rare earth and transition metal ions
can be introduced into a glass host in which t he UV - visible
absorption and emission bands are associated with intercon
figurational transitions. The transitions are orbitally allowed,
and, hence absorption is very strong. The' mean radi us of the
excited state electron configuration is generally significantly
larger than that of the ground s t a t e . Therefore, crystal t i e l d
perturbations and Stokes shifts a r e generally large. The Large
crystal field perturbations also resul t in broad ab so r pt i on and
emission linewidths and a large sensitivity of the frequency of
absorption and emission bands to the structure of the host
rna tr ix. Factors that infl uenee the magni t ude of I umineseence
quantum efficiencies are poorly understood; however, values of
0.6 - 0.7 have been measured in a number of Eu2+ and Cu+ systems.
A major difficulty apparently shared by all luminescent glasses
of this classification is evident in the observation that the
Ii terature does not describe a single glass in which visible
absorption occurs to wavelengths longer than the bl ue spectral
region. All described glasses have absorption maxima in the UV
near UV region. \'lhile our under standing of the energy level s
involved in absorption is certainly not precise enough to
preclude the possibility of shifting absorption significantly
-111-

toward the red
achieving such
attempted here ..
by appropriate glass compositional
a goal seems very unlikely and has
changes,
not been
Transi tion metal ions with unfilled d orbital shave
absorption bands that are associated with intraconfigurational
d-d transitions. The energy levels and observed luminescent
properties of the ions in a glass matrix is generally well
described by crystal field theory. The causes of luminescence
quenching are poorly understood, but as a general rule it is
expected that those ions with electron configurations that have
low-lying energy levels will be non-emitting because of rapid
nonradiative transitions. On this basis, ions with d1, d4 , d6 ,
and d9 electron configurations can be removed from consideration.
Ions with d3 and d5 electron configurations have lowest excited
states that lie in the green -far red spectral region, and
luminescence has been described in the literature from glasses
doped with such ions. The remaining electron configurations, d2,
d7, and d8, are intermediate in nature. The lowest exci ted
st,qtes lie in the near IR; therefore, luminescence efficiency
WDulct probably be low, and in most instances emission would be to
lO~8er wavelength than the bandgap of Si photovoltaic cells.
Smission from this class of ions in crystalline systems has been
described in the literature, but there are no reports of emission
from glass systems.
Glasses doped wi th the d3 ions Cr 3+ and M03+ have been
briefly investigated here. Oscillator strengths are weak because
the absorption transitions are Laporte forbidden. Nevertheless,
good relative solar absorption val ues can be achieved wi th Cr 3+
doped glasses because the ion has two broad spin-allowed
absorption bands in the visible region and can be introduced at
high concentrations into glass systems. The r-10 3+ ion is weakly
soluble in glasses, and M03+ doped gl~sses absorb solar radiation
very weakly. The quantum effic iency of luminescent Cr 3+ doped
glasses measured here and elsewhere are unfortunately too low for
-112-

application In an LSC. Attempts have been made to improve systemquantum efficiency by using Cr3+ as a donor in a Cr3+ - trivalentrare earth ion donor - acceptor system. Resul ts to date have
been modest.
Luminescent glasses doped wi th the d5 Ions Mn2+ and Fe3+
have also been studied here. Near uni ty quantum efficiency can
be achieved in weakly doped Mn2+ glasses; hOWE!Ver, oscillator
strengths are very weak because the absorption transi tions are
all both Laporte and spin forbidden. Even at very high dopant
levels, relative solar absorption values are very low. Among the
group of ions with electron configurations that may yield
possible near IR luminescent transitions, a brief stUdy was done
of the d7 ion V3+ . On the basis of the ob se r ved absorptionspectra of V3+ doped glasses and the Tanabe-Sugano diagram of the
d7 electron configuration, one can predict a possible luminescenttransi tion at about 1 micron. A number of "13+ doped boro
alumino-phosphate glasses were prepared; however, no luminescence
was observed.
Members of the final classification considered here are
luminescent transparent glass-ceramics. The luminescent dopan t
could be any ion considered previously, but c l ea r l y adv an t age s
are to be gained in going to a glass-ceramic matrix only when a
crystalline phase markedly improves a particular optical property
that is pertinent to the efficiency of an LSC,. The greatestpotential improvements are expected to be found in the
luminescent efficiencies of unfilled d-shell ions. Cr 3+ doped
transparent glass-ceramics were, therefore, investigated because
the ion absorbs the solar spectrum well and is known to emit with
high efficiency in a number of crystalline systems. Thisapproach, however, has not to dat~ yielded a successful LSC
material. Three luminescent Cr3+ doped transparent glass-ceramicsystems were prepared by precipi tating crystalline phases from
glasses of sui table composi tion by heat-treatment. Two of the
systems showed high luminescence quantum efficiency. All,
-113-

however, showed. strong luminescence absorption by essentially
non-emitting Cr 3+ ions in the residual glass phase. This may be
an intractable problem for d3 ions in a g l as s-cce r amLc ,
Transparent gla.ss-ceramics are generally characterized by low
volume percent crystallinity and inorganic glasses are good
solvents for the smaller transition metal ions; therefore, a
sizable atom fraction of dopant ions will remain in the glass
phase. On the basi~ of the Tanabe-Sugano diagram for d3 ions and
the lower crystal field strengh of sites in glass relative to
sites in crystal phases that can be precipitated from glass, one
would generally expect poor separation of the crystalline
emission band and the lowest glass absorption band.
In summary, we have experimentally investigated the
following inorganic species in a variety of inorganic hosts:Ce3+, CdS, Cr 3+, Eu3+, Fe 3+ Mo3+ Mn2+ Nd2+ UO 2+ UO 2+_Eu3+, , , , 2 ' ~~ ,and V3+. The survey of luminescent glasses and glass-ceramics
suitable for an LSC has thus been completed. Our stUdies,
however, have failed to identify systems not characterized by
high cost, weak solar absorption, or poor I uminescence quantum
yield. Attempts to improve absorption in the visible region are
generally limited by the low oscillator strength of the
Ln t r ac on f i g ur a t Lo na l transitions responsible for absorption and
are further frustrated by the appearance of luminescence
quenching at phosphor concentrations necessary for sufficiently
large peak optical densities.
In order to establ ish an upper bound on the performance of
the various systems investigated, a first order plate efficiency
model has been utilized to estimate plate efficiencies. 3 No
system, however, has been identified with a collector efficiency
gr e a ter than 1~;, and even for co-doped inorganic systems we do
not expect collector efficiencies to reach 2%. It is thus felt
that an LSC composed primarily of inorganic phosphors is not
practical.
-114-

Although luminescent glasses have been precluded from use as
the principal active material for an LSC, it Is concluded thatglasses can be effectively used as the substrate for an organic
dye thin film LSC.3 A number of rare earth or transition metal
ion-doped glasses with intraconfiguration transitions (i.e.,
Ce3+ : al uminosilicate glass, see Figure 28) absorb strongly in
the near UV-blue and emit in the visible. They can provide solar
ultraviolet protection with additional visible radiative pumping
to a thin film organic dye. The major driver for such aconfiguration, however, is the greater near-IR transparency of
inorganic glasses relative to organic polymers.
-115-


VIII. TOTAL POWER OUTPUT OF LSCs COMPAREDTO PHOTOVOLTAIC CELLS
The LSC plate efficiency has been measured as a function
of plate temperature for a standard 200 cm2 two dye plate. A
variable temperature simulator was designed and constructed to
allow close control of plate temperature while maintaining a
constant cell temperature of 200C (see Figure 29). Therelative plate efficiency was calculated from the I-V curve ofa water-·cooled, air-coupled photovoltaic cell. This experiment
showed that over the temperature range of 30°C to 80 0C, therelative plate efficiency decreased linearly by approximately
5% (see Figure 30). Thus, the effect of elevated temperatureon LSC plate efficiency appears to be considerably smaller than
the efficiency loss expected from a silicon photovoltaic cell
(i.e., approximately 2.0 mV/oC) heated over the same
temperature range.
In order to compare the relative efficiency and theeconomics of an LSC to a flat plate pho t ovo Lta i c cell array,
the total output energy-to-peak power ratio was measured for anLSC collector, a high efficiency Sandia ph t ovo I t a i c cell, and
an Eppley Precision Spectral Pyranometer. All me a s ur emen ts
were made on a cloudless AM-1 day and the data integrated from
noon ti 11 sunset. The three devices were coplanar and ti 1ted
at 20 degrees in order to be perpendicular to the incident rays
at solar noon. It can be seen from Figure 31, that the totaloutput ~~nergy-to-peak power ratio of the LSC exceeded that of
the photovoltaic cell and pyranometer by 21% and 19%,respectively. It should be noted that for fixed position solarcollectors, the annualized relative flux of incident radiation
at large angles to the collector normal wi~l be greater than inthis experiment, as will the average amount of scattered
radiation. When these two factors ar-e taken into account, we
would expect an even greater difference in the annualized
-117-


comparative efficiencies of LSCs compared to photovoltaic
cells. This experiment thus needs to be averaged over the
course of a full year, but the preliminary resul ts indicate
that an LSC device will produce at least 20% more electrical
energy per day than ~ photovoltaic device of the same peak wattrating. It is, therefore, appropriate to revise both the
efficiency and cost analysis for this device to take this
factor into consideration.
-121-

IX. APPLICATIONS OF LUMINESCENT SOLAR CONCENTRATORS
The Uni ted States Department of Energy LSC Program, has
focused its total effort almost exclusively on the use of LSCs
for photovoltaic concentration. The reasons for this emphasis
were originally well founded, as electricity is generally
considered the most convenient and expensive form of energy.
On the basis of conversion efficiencies, the comparison is
often made that one watt of electrical energy is economically
equivalent to three watts of thermal energy. However, the
luminescent solar concentrator is such a unique and versatile
device that it has a number of other applications, some of
which may prove to be of greater importance than its use for
photovol taic conversion. A partial listing of these applica
tions is given below (also, see Section X).
The major emphasis in the use of LSCs, as stated above,
has been di rected towards primary photovol taic concentrators.
However, the use of luminescent cover plates for solar cells,
so as to spectrally shift incident sunlight from shorter to
longer wavelengths, where some cells are more sensitive, is an
important area that should be more fully investigated. The
possibility of increasing the efficiency for AIGaAs/GaAs cells
by as much as 20% and for CdS/CuInSe 2 by 10% has already been
demonstrated.
A third application that has received scant attention, but
which holds the promise for perhaps the largest efficiency
gains, is the use of LSCs for indoor building illumina
tion49,50. An overall efficiency of 9% has been calculated for
a complete LSC collection system that can deliver white light
to the deep interior of a modern high rise building. 49 In
addi tion, such an LSC system would be capable of providing
approximately 90% of the buildings lighting requirement over an

eight (8) hour day. By way of comparison, a 10% efficient
photovol taic array can provide interior building fluorescent
lighting at an overall efficiency of only 1-2%. Thus, the LSC
system appears to be on the order of fi ve (5) times more
efficient than photovoltaic cells for the end use of indoor
lighting. It is noted in this regard, that one of the
short-falls of the DOE solar electric program, is that very
little emphasis has been placed on the end use of solar
generated. electrical energy. If, as in the above example,
solar electrici ty is used for electrical lighting, the system
efficiency goes from 10% down to 1-2%, and one must therefore
question the rational of solar generated electrici ty for this
purpose.
Another interesting application for LSCs is in exploiting
their wavelength shifting ability to increase the efficiency of
hydrogen producing photosynthetic bacteria. These bacteriacannot, in general, effectively utilize the "green" spectral
region of sunlight. For this application, the LSC would again
be used like a photovol taic cell coverplate. Numerous other
applications for LSCs exist (see Table 27), including:
luminescent enhanced display devices and signs, secondary
photovoltaic concentrators, thermal concentrators, total
internal reflecting face pumped lasers, photovoltaic/thermal
hybrid systems, and numerous types of electro-optical
detectors.
-123-
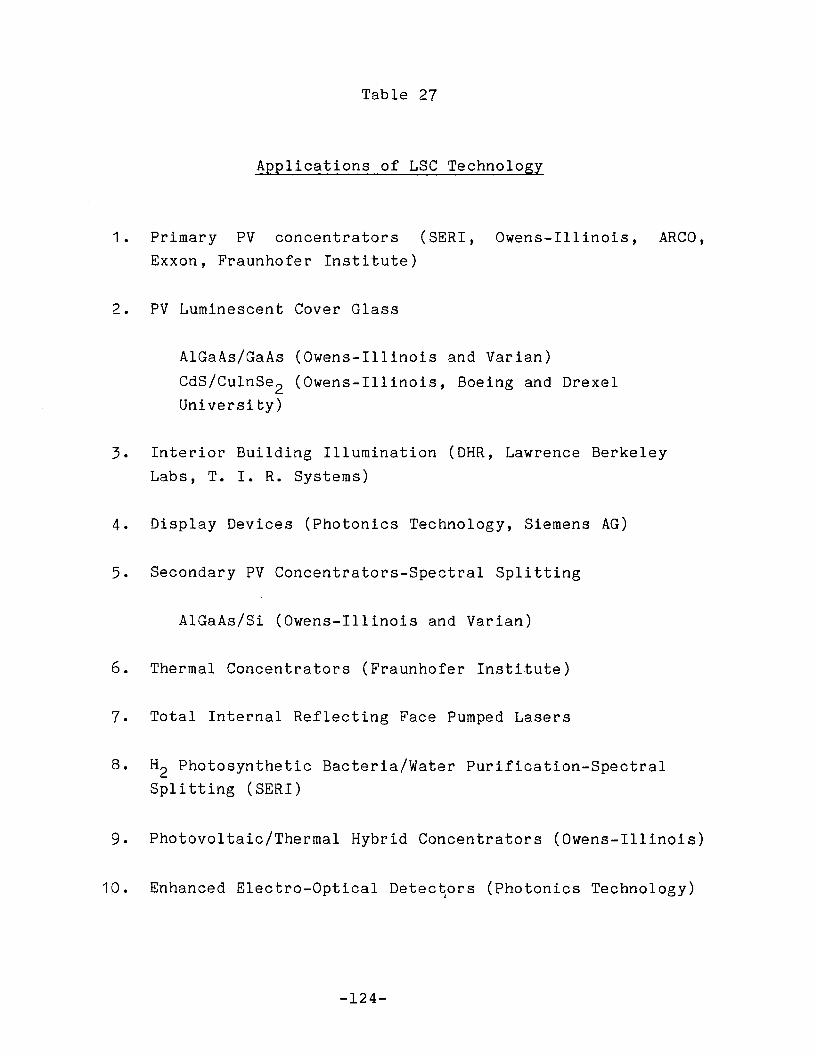
Table 27
Applications of LSC Technology
1. Primary PV concentrators (SERI, Owens-Illinois, ARCO,Exxon, Fraunhofer Institute)
2. PV Luminescent Cover Glass
AlGaAs/GaAs (Owens-Illinois and Varian)
CdS/CulnSe 2 (Owens-Illinois, Boeing and DrexelUniversity)
3. Interior Building Illumination (DHR, Lawrence BerkeleyLabs, T. I. R. Systems)
4. Display Devices (Photonics Technology, Siemens AG)
5. Secondary PV Concentrators-Spectral Splitting
AlGaAs/Si (Owens-Illinois and Varian)
6. Thermal Concentrators (Fraunhofer Institute)
7. Total Internal Reflecting Face Pumped Lasers
8. H2 Photosynthetic Bacteria/Water Purification-SpectralSplitting (SERI)
9. Photovoltaic/Thermal Hybrid Concentrators (Owens-Illinois)
10. Enhanced Electro-Optical Detectors (Photonics Technology),
-124-
x. CONCLUDING THOUGHTS ON THE FUTURE
OF LSC TECHNOLOGY
This report is the last in a series of four Final Reports
over a period of seven (7) years. We have attempted here to
summarize the major developments described in our previous
work, as well as including those topics not previously covered.
In addition, we have included the data base for all of our
stability and edge luminescence measurements, and finally have
presented a very brief survey of some of the non-photovoltaicapplications for LSC technology.
The major reason for the reduction in research activi ty
for LSC devices has been the low inherent efficiency of LSC
photovol taic concentrators. System efficiencies on the order
of 10% are feasible, but at present still illusive. Amorphous
semiconductors in comparison have achieved efficiencies in
excess of 10% for small area devices. Large area amorphous
arrays, however, have achieved only about half of this value,
which is not all that much greater than large area LSCs.
The total expendi ture by the Uni ted States Department of
Energy for all LSC research in this country, since the concep
tion of this device some ten years ago, is on the order of only
0.1% of the money spent on photovoltaic devices; yet, the
technology involved in the development of luminescent solar
concentrators (namely the organic synthesis of whole new
classes of organic dyes) is certainly at least as complex as
that required for photovoltaic cells. However, the
implications of improved luminescent materials are qUite
possibly of even greater consequence.
In Section IX we listed only some of the applications
-125-

of LSC devices. The significance of new, high efficiency,
stable chromophores is much more far reaching - incl uding new
types of lasers, color phosphors, optical memory materials,
organic semi-conductors, etc. to name but a few. It is our
hope that the LSC technology developed at Owens-Illinois under
the DOE sponsorship will prove useful in guiding future
research in this field.
-126-
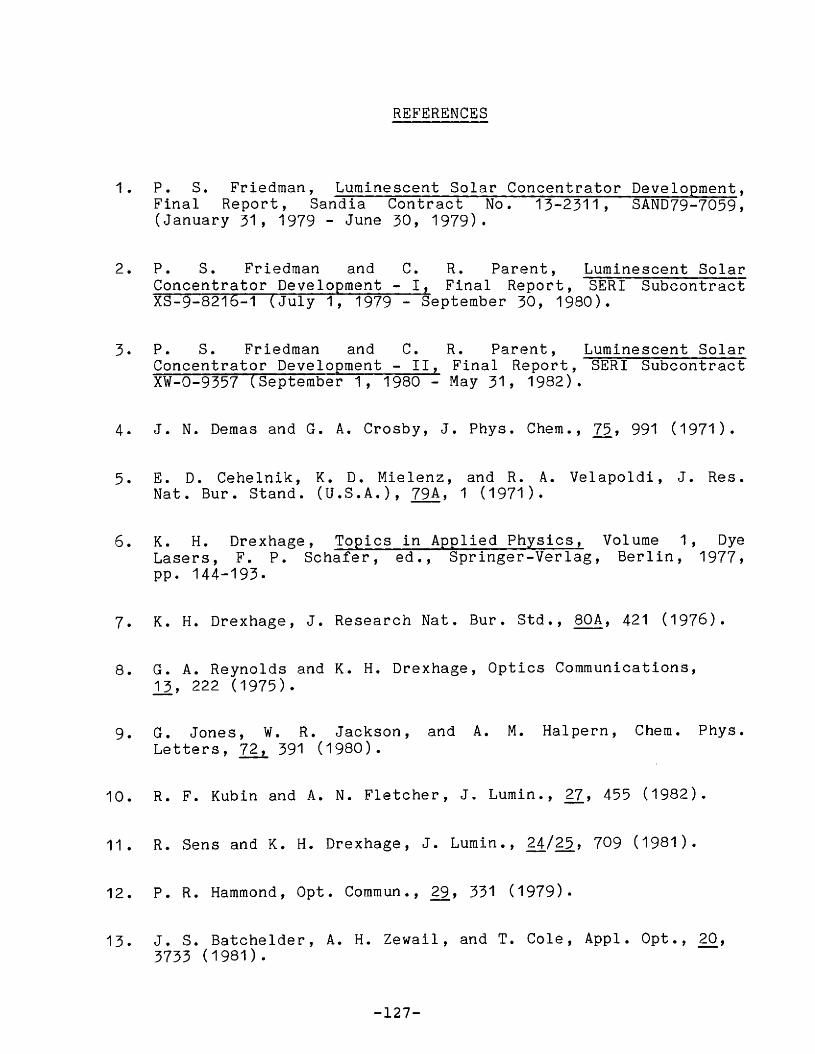
REFERENCES
1. P. S. Friedman, Luminescent Solar Concentrator Development,Final Report, Sandia Contract No. 13-2311, SAND79-7059,(January 31, 1979 - June 30, 1979).
2. P. S. Friedman and C. R. Parent, Luminescent SolarConcentrator Development - I, Final Report, SERI SubcontractXS-9-8216-1 (July 1, 1979 - September 30, 1980).
3. P. S. Friedman and C. R. Parent, Luminescent SolarConcentrator Development - II, Final Report, SERI SubcontractXW-0-9357 (September 1, 1980 - May 31, 1982).
4. J. N. Demas and G. A. Crosby, J. Phys. Chern., 75, 991 (1971).
5. E. D. Cehelnik, K. D. Mielenz, and R. A. Velapoldi, J. Res.Nat. Bur. Stand. (U.S.A.), 79A, 1 (1971).
6. K. H. Drexhage, Topics in Applied Physics, Volume 1, DyeLasers, F. P. Schafer, ed., Springer-Verlag, Berlin, 1977,pp.144-193.
7. K. H. Drexhage, J. Research Nat. Bur. Std., 80A, 421 (1976).
8. G. A. Reynolds and K. H. Drexhage, Optics Communications,TI, 222 (1975).
9. G. Jones, W. R. Jackson, and A. M. Halpern, Chern. Phys.Letters, 72, 391 (1980).
10. R. F. Kubin and A. N. Fletcher, J .. Lumin., 27, 455 (1982).
11. R. Sens and K. H. Drexhage, J. Lum l n , , 24/25,709 (1981).
12. P. R. Hammond, Opt. Commun., 29, ~531 (1979).
13. J. S. Batchelder, A. H. Zewail, and T. Cole, Appl. Op t , , 20,3733 (1981).
-127-
14.
15.
16.
17.
18.
19.
K. Kato, IEEE J. Quat. Elect., QE-16, 1017 (1980).
R. E. Sah and G. Baur, Appl. Phys., 23, 369 (1980).
K. Venkataraman, The Chemistr~ of Synthetic Dyes, Vol. II,Ch. XXXVIII, Academic Press, ew York (1952).
J. H. Brannon and D. Magde, J. Phys. Chern., 82, 705 (1978).
M. L. Lesiecki and J. M. Drake, Appl. Optics, ~, 557 (1982).
J. Olmsted, III, J. Phys. Chern., 83, 2581 (1979).
20. A. V. Butenin, B. Ya Kogan, and N. V. Gundobin, Opt.Spectrosc. (U.S.S.R.), .47, 568 (1980).
21. L. J. Andrews, A. Lempicki, and B. C. McCollum, J. Chern.Phys., 74, 5526 (1981).
22. L. J. Andrews and A. Lempicki, LSC Review Meeting, SERI(October 1980).
23. A. Lempicki, L. J. Andrews, B. C. McCollum, and S. M. Stone,LSC Review Meeting, SERI (March 1982).
24. P. W. McMillan, Glass Ceramics, 2nd Edition, Academic Press,London, 1979.
25. G. H. Beall and D. A. Duke, J. Mat. Sci., !' 340 (1969).
26. M. M. Layton and A. Herczog, Glass Technol., lQ, 50 (1969).
27. T. Kobubo and M. Tashiro, Bull. Inst. Chern. Res. Kyoto-Univ.,54, 301 (1976).
28. C. L. Babcock, R. A. Busdiecker, and E. C. Hagedorn, U. S.Patent No. 3,788,865, January 29, 1974, (filed June 15, 1965).
-128-
29. A. Kisilev, R. Reisfeld, E. Greenberg, A. Bush, and M.Ish-Shalom, Chern. Phys. Letters, 105, 405 (1984).
30. R. M. MacFarlane, J. Chern. Phys., 39, 3118 (1963).
31. R. E. Newham and Y. M. deHaan, Zeitschr. Kristallographie,117, 235 (1962).
32. Chi-Tang Li, Zeitschr. Kristallographie, 127, 327 (1968).
33. Chi-Tang Li and D. R. Peacor, Zeitschr. Kristallographie,126, 46 (1968).
34. F. A. Hummel, K. Auh, and G. H. Johnson, Mat. Res. Bull., 5,301 (1970).
35. G. H. Beall, U. S. Patent No. 3,681,102, August 1, 1972(filed March 27, 1970).
36. D. L. Wood, G. F. Imbush, R. M. MacFarlane, P. Kusliuk, andD. M. Larkin, J. Chern. Phys., 48, 5255 (1968).
37. W. Mikenda and A. Preisinger, J. Lumin., 26,53 (1981);26, 67 (1 981 ); W. Mikenda, J. Lurn Ln , , 26,85 (1981).
38. J. S. Reed, J. Am. Ceram. Soc., ~54, 202 (1971).
39. "Structure Reports for 1968 - Metals and InorganicCompounds," W. B. Pearson, gen. ed., V. Duckworth and C. B.Shounaker, sect. eds., Vol. 33A, p. 273.
40. R. W. G. Wyckoff, Crystal St r-uct ur-es , 2nd Edition, Vol. 3,Interscience, New York, 1968, pp. 75-81.
41. A. J. Stryjak and P. W. McMillan, J. Mat. Sci., 12, 1275( 1978
-129-
42. L. J. Andrews, B. C. McCollum, S. Stone, D. E. Guenther,G. J. Murphy, and A. Lempicki, "Development of Materials for aLuminescent Solar Collector", Final Report, U. S. Departmentof Energy, Contract No. DE-AC02-78ER-04996 (September 1, 1979- December 31, 1982).
43. R. Reisfeld, A. Kisilev, E. Greenberg, A. Buch, and M.Ish-Shalom, Chern. Phys. Letters, 104, 153 (1984).
44. R. W. G. Wyckoff, Crystal Structures, 2nd Edition, Vol. 4,Interscience, New York, 1968, pp. 301-4.
45. L. Leger and J. Bray, Glass Technol., 7, 134 (1966).
46. E. Plumat, Silicates Ind., 38, 97 (1972).
47. I. Gutzow, E. Zloteva, S. Alyalsov, and T. Kavatscheva, J.Mat. Sci.,~, 1190 (197'?).
48. P. S. Friedman, Opt. Eng .. , 20,887 (1981).
49. J. G. Bornstein and P. S. Friedman, Luminescent SolarConcentrator Building Lighting, Final Report, PacificNorthwest Laboratory Contract No. B-A3926-A-Z (1984).
50. J. G. Bornstein and P. S. Friedman, U.S. Patent No. 4,539,625,September 3, 1985 (filed July 31, 1984), Lighting SystemCombining Daylight Concentrators and An Artificial Source.
-130-

APPENDIX I
DYE STABILITY AND DEVICE STABILITY DATA TABLES
Appendix I is arranged such that the dye stabili ty (At)
and device stability (St) measured in a 100% nitrogen
atmosphere appear in parentheses, while all other data is for
an ambient air atmosphere. Interpretation of the host code is
given in Table 19 (see Section III). The numbers in the tables
of Appendix I immediately followi.ng the host code give the
optical density of each plate, and the interger in parenthesis
following the optical densi ty denotes the number of thin film
coats of dye responsible for the measured optical density. In
most cases, no number follows the optical density and this
means that the number of coats is one (1). It is noted that
the average thickness per coat is 15-20 microns.
All of the dye and device stabilities recorded as a
function of "measured" exposure in kWh/m2, were obtained by
outdoor exposure under ambient Toledo year-round sunlight
condi tions. Four glazed LSC Rooftop Test Boxes were
constructed3 , each capable of holding approximately 100
samples. A similar box was also constructed to enclose an
Eppley Model 8-48 Black and White Pyranometer so as to monitor
LSC sample exposure in kilowatt- hours. In order to both
record and store the total daily insolation, a LI-COR Model
LI-1776 solar monitor was employed~ This instrument can store
the daily integrated values from the pyranometer over a 24-hour
period and has a memory capacity of over 100 days. In order to
convert kWh/m2 to the number of equivalent exposure days, we
sugge~t that an average day corresponds approximately to 4.5
kWh/m incident upon a south facing glazed collector surface
which is til ted at the angle of local lati tude. If we take
-131-

into account cover glass reflectivity, soiling, early morningcondensation, enclosure sidewall shadowing, etc., then
approximately a 20-25% radiation loss can be expected, and theactual daily exposure incident upon an LSC plate will be about
3.5 kWh/m2• It is, therefore, proposed to define for the
purpose of our degradation studies than an LSC plate exposure
of 3.5 kWh/m2 is equivalent to an average day of exposure in asuitable enclosure. It is noted that the actual dailyinsolation in Toledo at our test si te, as measured over the
course of several years, is approximately 20% less than the
above proposed value.
It is noted that for a full description of the dye
degradation investigation, as well as interpretation of the
stability data results, refer to Section III of this report.
-132-

DYE SCREENING TESTS FOR DYE STABILITY (At)AND DEVICE STABILITY (ST)
Dye Stability After Given Exposure (kWh/m2)
Host Code/O.D. 50 100 200 300
BrilliantYellow (At)
CE-A/2.8CE-A/0.6CE-B/3.0CE-S/0.4CE-D/3.1CE-D/0.5CM-A/2.3CM-A/O.4CS-A/2.1CS-A/0.7AC-H/1.5AC-H/0.5MA-C/1.7MA-C/0.5AI-E/1.8AI-E/0.5AI-I/2.1AI-I/0.4AC-I/1.1
BrilliantYellow (St)
CE-A/2.8CE-A/0.6CE-B/3.0CE-B/0.4CE-D/3.1CE-D/0.5CM-A/2.3CM-A/0.4CS-A/2.1CS-A/0.7AC-H/1.5AC-H/0.5MA-C/1.7MA-C/O.5AI-E/1.8AI-E/0.5AI-I/2.1AI-I/0.4AC-I/.10
.81 ( .94) .79( .88) .63( .81 ) .57( .73)
.94( .89) .91( .77) .87( .73) .88( .68)
.76( .89) .55( .79) .34( .70) .18 ( .65)
.84( .84) .75( .75) .65( .70) .60( .61 )
.74 (1 .04) .68 (1 .04) .58( .98) .42( .81 )
.81 ( .81 ) .69( .68) .56( .62) .52( .55)
.91 ( .82) .86( .71 ) .80( .65) .84( .56)
.91 ( .73) .87( .62) .85( .57) .88( .50 )
.78( .85) .63( .72) .43( .64) .31 ( .60)
.84( .74) .74( .62) .61 ( .55) .55( .50)
.71 ( .98) .55( .94) .46( .88) .41 ( .83)
.73( .88) .60( .80) .53( .73) .48( .61 )
.73( .78) .61 ( .65 ) .55( .58) .47( .50)
.67( .71 ) .56( .56) .50( .45) .45 ( .36)
.40( .89) .35( .84) .32( .81 ) .21 ( .71 )
.54( .82) .48( .71 ) .46( .65 ) .34( .50)
.69( .93) .61 ( .90) .55( .87) .41 ( .77)
.77( .87) .72( .82) .66( .78) .53( .62)
.21 ( .89) .10C .78) .05( .70) ( .46)
1.15(1.18) 1.08(1.13) 1 .24 (1 .37) 1 .29 (1 .29).98( .94) .89( .83) .94( .95) .91 ( .87).89( .98) .81 ( .89) 1.00(1.07) 1.08( .97 ).93( .93) .82( .81 ) .83( .82) .74( .71 )
1.16(1.16) 1 .00 (1 .03) 1 .32 (1 .42) 1 .36 (1 .36).99 (1 .01 ) .83( .86) .90( .95 ) .83( .87)
1.06(1.04) 1 .07( .96) 1 .28 (1 .21 ) 1.24(1.07).93( .84) .88( .73) .95( .76) .83( .66)
1 .08 (1 .26) 1.03(1.12) 1 .38 (1 .48) 1 .25 (1 .42)1 .09 (1 .15) 1 .01 ( 1 .00) 1 .21 (1 •13 ) 1.03( .92)1.09(1.07) 1 .10 ( .95) 1.30(1.10) 1 .24 (1 .00)
.98( .95) .87( .86) .91 ( .94) .79( .79)1.16(1.01) 1 .18 ( .88) 1.28(1.03) 1 .22 ( .85 )
.85( .75) .73( .61 ) .75( .62) .69( .46)1.21(1.05) 1 .20(1.30) 1.03(1.13) .82( .99)
.59( .69) .58( .65 ) .49( .54) .37( .45)1.29(1.06) 1 .39 (1 .29) 1 .34 ( 1 •11 ) 1 .24 (1 .25 )
.88( .90) .87( .90) .76( .75) .69( .71 )1 .80 (1 .16) 1 .65 ( .92) 1 .35 ( .72)
-133-
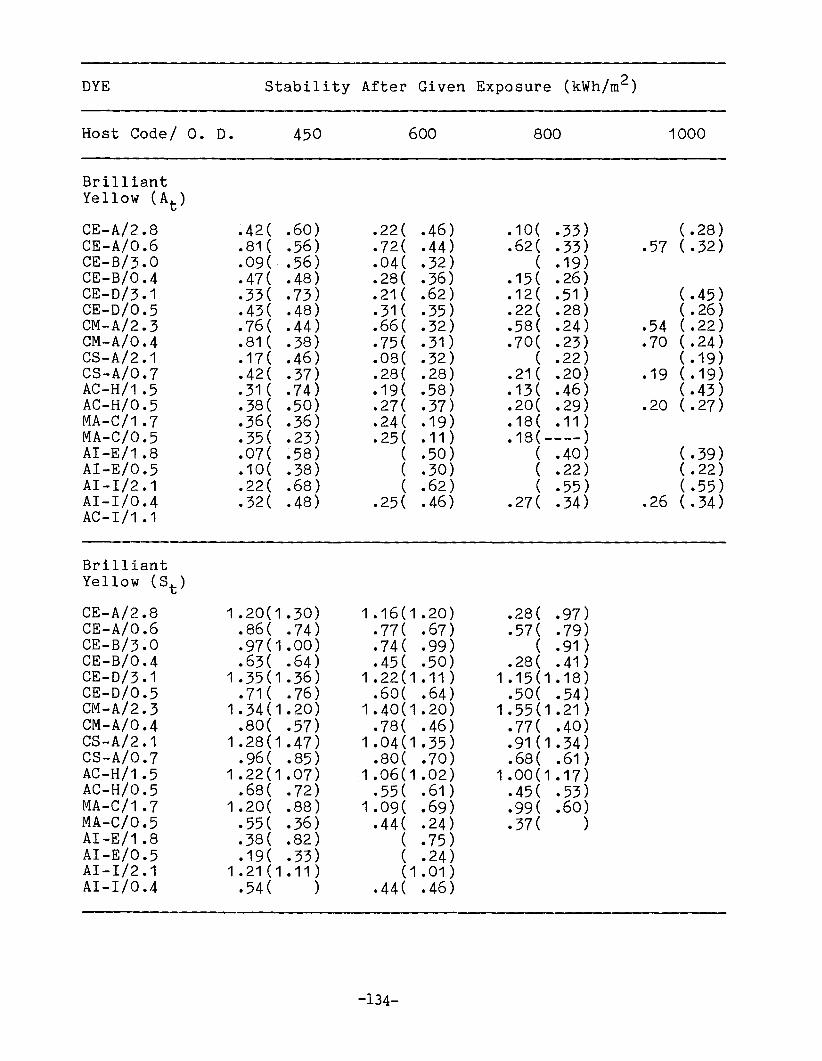
DYE Stability After Given Exposure (kWh/m2)
Host Code/ O. D. 450 600 800 1000
BrilliantYellow (At)
CE-A/2.8 .42( .60) .22( .46) .10( .33) (.28)CE-A/0.6 .81 ( .56) .72( .44) .62( .33) .57 ( .32)CE-B/3.0 .09(- .56) .04( .32) ( .19 )CE-B/0.4 .47( .48) .28( .36) .15( .26)CE-D/3.1 .33( .73) .21 ( .62) .12 ( .51 ) ( .45)CE-D/0.5 .43( .48) .31 ( .35) .22( .28) ( .26)CM-A/2.3 .76( .44) .66( .32) .58 ( .24) .54 ( .22)CM-A/O.4 .81 ( .38) .75( .31 ) .70( .23) .70 ( .24)CS-A/2.1 .17 ( .46) .08( .32) ( .22) ( .19)CS-A/O.7 .42( .37) .28( .28) .21 ( .20) .19 ( .19)AC-H/1 .5 .31 ( .74) .19( .58) .13( .46) ( .43)AC-H/O.5 .38( .50) .27( .37) .20( .29) .20 ( .27)MA-C/1.7 .36( .36) .24( .19 ) .18( .11 )MA-C/O.5 .35( .23) .25( .11 ) .18(----)AI-E/1.8 .07( .58) ( .50) ( .40) (.39)AI-E/O.5 .10 ( .38) ( .30) ( .22) ( .22)AI-I/2.1 .22( .68) ( .62) ( .55) ( .55)AI-I/O.4 .32( .48) .25( .46) .27( .34) .26 ( .34)AC-I/1.1
BrilliantYellow (St)
CE-A/2.8 1.20(1.30) 1 .16 (1 .20) .28( .97)CE-A/O.6 .86( .74) .77( .67) .57( .79)CE-B/3.0 .97 (1 .00) .74( .99) ( .91 )CE-B/0.4 .63( .64) .45( .50) .28( .41 )CE-D/3.1 1 .35 (1 .36) 1 .22 (1 .11 ) 1.15(1.18)CE-D/().5 .71 ( .76) .60( .64) .50( .54)CM-A/2.3 1.34(1.20) 1 •40( 1 .20) 1.55(1.21)CM-A/O.4 .80( .57) .78( .46) .77( .40)CS-A/2.1 1 .28 (1 .47) 1.04(1.35) .91 (1 .34)CS-A/O.7 .96( .85) .80( .70) .68( .61 )AC-H/1.5 1 .22 (1 .07) 1.06(1.02) 1 .00 (1 .17)AC-H/0.5 .68( .72) .55( .61 ) .45( .53)MA-C/1.7 1 .20( .88) 1.09( .69) .99( .60)MA-C/0.5 .55( .36) .44( .24) .37( )AI-E/1 .8 .38( .82) ( .75)AI-E/0.5 .19 ( .33) ( .24)AI-I/2.1 1.21(1.11) (1 .01 )AI-I/0.4 .54( ) .44( .46)
-134-

~--
Dye Stability After Given Exposure (kWh/m2)
Host Code/O.D. 50 100 200 300
Coumarin-6(At)
CE-A/3.4 .26( .83) .05( .49) .02( .33) .01 ( .20)CE-B/2.0 .16 ( .45) .Os( .28) .O2( .23) .O2( .16)CE-B/O.5 .32( .59) .10( .40) .04( .34) .03( .25 )CE-D/2.6 .06( .52) .01 ( .31 ) ( .22) ( .14)CE-D/0.5 .39( .72) .13 ( .56) .O2( .49) .03( .41 )CM-A/2.4 .42( .38) .19 ( .17 ) .09( . 11 ) .04( .06 )CM-A/O.5 .63( .58) .36( .37) .23( .29) · 11 ( .21 )CS-A/1.9 .04( .24) .01( .11 ) ( .08) ( .05 )CS-A/0.8 .24( .63) .05( .40) ( .30) ( .22)AC-H/1.7 .11 ( .23) .04( .07)AC-H/0.5 .15 ( .38) .07( .12 )MA-C/1.5 .14 ( .27) .02( .06)MA-C/0.5 .23( .31 ) .06( .09)AI-E/2.4 .43( .65 ) .29( .59) .19 ( .51 ) .O6( .28)AI-E/0.5 .40( .55) .28( .45) .19 ( .36) .06( .18 )AI-I/1.8 .30( .64) .16 ( .59) .09( .52) .03( .30)AI-r/O.5 .29( .59) .17 ( .53) .11 ( .44) .04( .28)AC-I/.93 .13 ( .32) .02( .28) .01 ( .18 )CE-E/1.1 .02( .12 )
Coumarin-6(St)
CE-A/3.4 .67( .70) .31 ( .6:3 ) .16 ( .69) .11 ( .60)CE-A/0.5 .62( .80) .30( .6;3) .16( .66) · 11 ( .56)CE-B/2.0 .60( .81 ) .29( .68) .21 ( .66) .14 ( .56)CE-B/O.5 .52( .73) .25( .54) .17( .52) •11 ( .40)CE-D/2.6 .42( .86) .16( 71- ) ( .74 ) ( .64)• .JCE-O/0.5 .60( .77) .31( .69) .17 ( .67) · 11 ( .56)CM-A/2.4 .82( .63 ) .65( .47) .46( .43) .25 ( .31 )CM-A/0.5 .76( .72) .50( .49) .37( .45) .19( .32)CS-A/1.9 .32( · 75) .14 ( .5"1 ) ( .44) ( .33)CS-A/0.8 .52( .80) .18 ( .6'1 ) ( .56) ( .45)AC-H/1.7 .52( .58) .22( .29)AC-H/0.5 .43( .56) .20( · 2~5 )MA-C/1.5 .38( .50) .11 ( .19 )MA-C/O.5 .36( .44) .14 ( •113 )AI-E/2.4 .71 ( .68) .66( .66) .51 ( .59) .27( .51 )AI-E/0.5 .53( .60) .40( .53) .29( .36) .16( .28)AI-I/1.8 .61 ( .72) .49{ .69) .31 ( .90) .17 ( .52)AI-I/0.5 .44( .64) .32( .60) .22( .84) .15( .35)AC-I/0.9 .25( .53 ) .14 ( .55 ) .10( .38)CE-E/1.1 .19 ( .47)
-135-

Dye Stability After Given Exposure (kWh/m2)
Host Code/O.D. 50 100 200 300
Nile Blue(At)
CE-A/2.0 .21 ( .77) .10( .59) .05( .48) .03( .39)CE-A/0.6 .57( .80) .38( .60) .23( .62) .16( .56)CE-B/3.2 .38( .91 ) .20( .79) .10( .69 ) .07( .60)CE-B/0.5 .41 ( .76) .26( .62) .15( .58) .12( .54)CE-D/2.9 .40( .83) .20( .73) .08( .65) .04( .58)CE-D/0.7 .26( .54) .14 ( .40) .06( .35) .03( .28)CM-A/1.7 .46( .71 ) .23( .51 ) .12( .40) .06( .30)CM-A/0.3 .51 ( .39) .26( .17) .15 ( .09) .10( .05 )CS-A/2.1 .21 ( .81 ) .08( .66) ( .54) ( .53)CS-A/0.6 .37( .81 ) .19 ( .65) ( .57) ( .51 )AC-H/2.1 .55 ( .51 ) .36( .78) .24( .72) .17 ( .65)AC-H/0.6 .56( .45) .38( .75) .24( .70) .23( .65)MA-C/1.4 .05( .04)MA-C/0.4 .01( .02)
Nile Blue(St)
CE-A/2.0 4.68(1.49) 4.54(1.60) 4.13(2.85) 3.08(3.05)CE-A/0.6 .88( .89) .73( .83) .68( .91 ) .54( .88)CE-B/3.2 2.03( .91 ) 2.40( .84) 2.66 (1 .15) 2.08(1.20)CE-B/0.5 1.04(1.01) .85( .90) .80( 1.08) .62( .97)CE-D/2.9 2.13(1.18) 2.17(1.33) 1 .96 (1 .88) 1 .47 (1 .85 )CE-D/0.7 .62( .79) .49( .72) .41 ( .76) .31 ( .70)CM-A/1.7 2.12(1.23) 2.12(1.40) 2.22(1.97) 1 .48 (1 .90)CM-A/0.3 .65( .52) .39( .30) .35( .29) .22( .21 )CS-A/2.1 4.35(1.43) 3.89 (1 .38) 3.36(2.63) 2.50(2.71)CS-A/0.6 .95 (1 .02) .69( .88) .59 (1 .07) .42( .96)AC-H/2.1 1.98( .84) 2.55( .72) 3.36(1.06) 3.19 (1 .36)AC-H/0.6 1 .14 ( .85) .98( .79) .95( .96) .84( .90)MA-C/1.7 1 .22 (1 .66)MA-C/0.4 .20( .24)
-136-
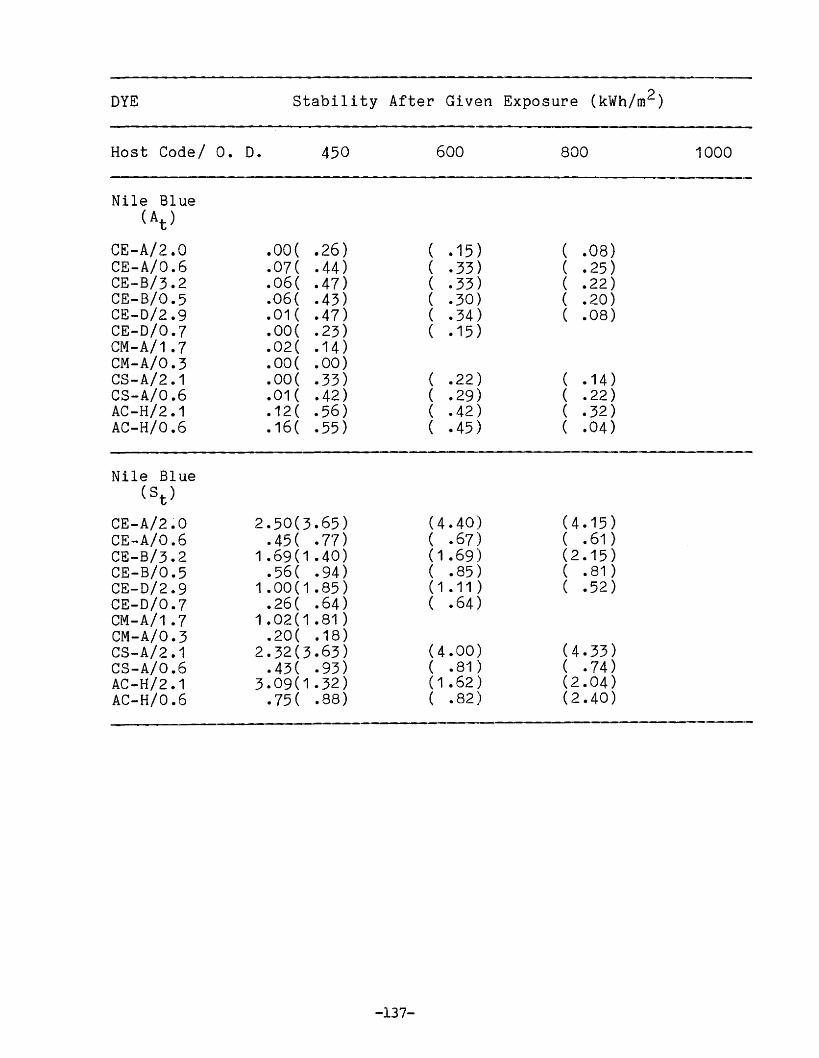
DYE Stability After Given Exposure (kWh/m2)
Host Code/ O. D. 450 600 800 1000
Nile BIue(At)
CE-A/2.0 .aO( .26) ( .15 ) ( .08)CE-A/0.6 .07( .44) ( .33) ( .25 )CE-B/3.2 .06( .47) ( .33) ( .22)CE-B/0.5 .06( .43) ( .30) ( .20)CE-D/2.9 .01( .47) ( .34) ( .08)CE-O/O.7 .OO( .23) ( .15 )CM-A/1.7 .02( .14 )CM-A/O.3 .OO( .00)CS-A/2.1 .OO( .33) ( .22) ( .14 )CS-A/O.6 .01( .42) ( .29) ( .22)AC-H/2.1 .12 ( .56) ( .42) ( .32)AC-H/0.6 .16 ( .55) ( .45 ) ( .04)
Nile Blue(St)
CE-A/2.0 2.50(3.65) (4.40) (4.15)CE-A/0.6 .45( .77) ( .67) ( .61 )CE-B/3.2 1 .69 (1 .40) (1 .69) (2.15)CE-B/0.5 .56( .94) ( .85) ( .81 )CE-D/2.9 1 .00 (1 .85 ) (1.11) ( .52)CE-D/0.7 .26( .64) ( .64)CM-A/1.7 1.02(1.81)CM-A/O.3 .20( .18 )CS-A/2.1 2.32(3.63) (4.00) (4.33)CS-A/O.6 .43( .93) ( .81 ) ( .74)AC-H/2.1 3.09(1.32) (1 .62 ) (2.04)AC-H/0.6 .75( .88) ( .82) (2.40)
-137-
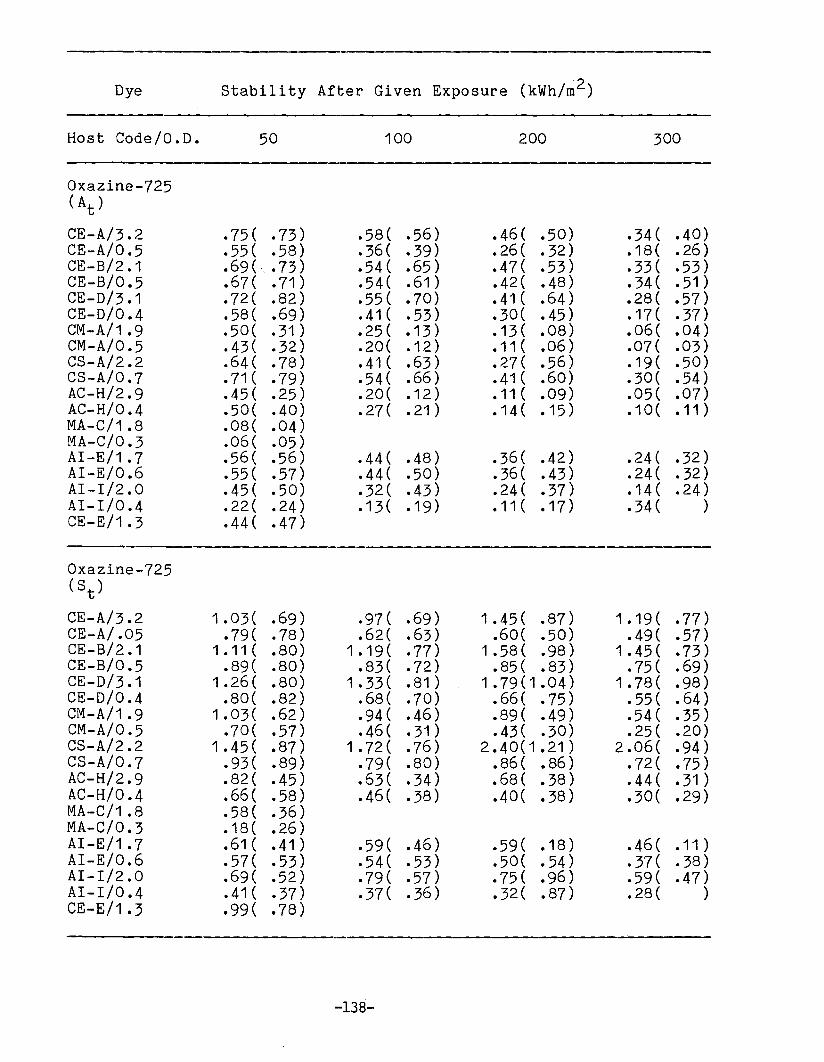
Dye Stability After Given Exposure (kWh/m 2)
Host Code/O.D. 50 100 200 300
Oxazine-725(At)
CE-A/3.2 .75( .73) .58( .56) .46( .50) .34( .40)CE-A/0.5 .55( .58) .36( .39) .26( .32) .18 ( .26)CE-B/2.1 .69 (, .73) .54( .65) .47( .53) .33( .53)CE-B/0.5 .67( .71 ) .54( .61 ) .42( .48) .34( .51 )CE-D/3.1 .72( .82) .55( .70) .41 ( .64) .28( .57)CE-D/0.4 .58( .69) .41 ( .53) .30( .45) .17( .37)CM-A/1.9 .50( .31 ) .25( .13 ) .13( .08) .06( .04)CM-A/0.5 .43( .32) .20( .12) .11 ( .06 ) .07( .03)CS-A/2.2 .64( .78) .41 ( .63) .27( .56) .19 ( .50)CS-A/0.7 .71( .79) .54( .66) .41 ( .60) .30( .54)AC-H/2.9 .45( .25) .20( .12 ) .11 ( .09) .05( .07)AC-H/0.4 .50( .40) .27( .21 ) .14( .15) .10( .11 )MA-C/1.8 .08( .04)MA-C/0.3 .06( .05)AI-E/1.7 .56( .56) .44( .48) .36( .42) .24( .32)AI-E/0.6 .55( .57) .44( .50) .36( .43) .24( .32)AI-I/2.0 .45( .50) .32( .43) .24( .37) .14 ( .24)AI-I/0.4 .22( .24) .13 ( .19 ) .11 ( .17) .34( )CE-E/1.3 .44( .47)
Oxazine-725(St)
CE-A/3.2 1.03( .69 ) .97( .69) 1 .45 ( .87) 1 .19 ( .77)CE-A/.05 .79( .78) .62( .63) .60( .50) .49( .57)CE-B/2.1 1 .11 ( .80) 1 .19 ( .77) 1 .58 ( .98) 1 .45 ( .73)CE-B/0.5 .89( .80) .83( .72) .85( .83) .75( .69)CE-D/3.1 1.26( .80) 1 .33 ( .81 ) 1 .79 (1 .04) 1 .78 ( .98)CE-D/0.4 .80( .82) .68( .70) .66( .75) .55( .64)CM-A/1.9 1.03( .62) .94( .46) .89( .49) .54( .35 )CM-A/0.5 .70( .57) .46( .31 ) .43( .30) .25( .20)CS-A/2.2 1 .45 ( .87) 1 .72 ( .76) 2.40(1.21) 2.06( .94)CS-A/0.7 .93( .89) .79( .80) .86( .86) .72( .75)AC-H/2.9 .82( .45) .63( .34) .68( .38) .44( .31 )AC-H/0.4 .66( .58) .46( .38) .40( .38) .30( .29)MA-C/1.8 .58( .36)MA-C/0.3 .18 ( .26)AI-E/1.7 .61 ( .41 ) .59( .46) .59( .18 ) .46( .11 )AI-E/0.6 .57( .53) .54( .53) .50( .54) .37( .38)AI-I/2.0 .69( .52) .79( .57) .75( .96) .59( .47)AI-I/0.4 .41 ( .37) .37( .36) .32( .87) .28( )CE-E!1.3 .99( .78)
-138-

DYE Stability After Given Exposure (kWh!m2)
Host Code! O. D. 450 600 800 1000
Oxazine-725(At)
CE-A/3.2 .22( .29) .11 ( .16 )CE-A/O.5 .09( .16)CE-B/2.1 .23( .45) .13 ( .32 ) ( .21 )CE-B/0.5 .25( .43) .17 ( .30) ( .22)CE-D/3.1 .18 ( .48) ( .36) ( .25 )CE-D/0.4 .11 ( .28) ( .17 )CM-A/1.9 .01( .01)CM-A/O.5 .OO( .00)CS-A/2.2 .10( .38) ( .27) ( .18)CS-A/0.7 .19 ( .42) ( .32) ( .22)AC-H/2.9 .02( .04)AC-H/0.4 .01 ( .04)
AI-E/1.7 .O4( .11 )AI-E/0.6 .03( .05)AI-I/2.0 .O4( .11 )AI-I/0.4 .03( .04)
Oxazine-725(St)
CE-A/3.2 1 .05 ( .72) .93( .73)CE-A/0.5 .37( .45)CE-B/2.1 1.45( .96) 1 .25 ( .99) (1 .02)CE-B/0.5 .68( .71 ) .61( .62) ( .56)CE-D/3.1 1.68( .97) (1.13) (1.21 )CE-O/0.4 .46( .56) ( .48)CM-A/1.9 .28( .26)CM-A/0.5 .21 ( .18 )CS-A/2.2 1 .94 (1 .15 ) (1 .25) (1 .39)CS-A/0.7 .61( .74) ( .44) ( .52)
AC-H/2.9 .34( .26)AC-H/0.4 .25( .24)AI-E/1.7 .27( .10)AI-E/0.6 .21 ( .20)AI-I/2.0 .44( .37)AI-I/O.4 .26( .22)
-139-

Dye Stability After Given Exposure (kWh/m2)
Host COde/O.D. 50 100 200 300
Rhodamine-101(At)
CE-A/3.0 .02( .41 ) ( .21 ) ( .10) ( .07)CE-A/0.4 .06( .36) ( .19 )CE-B/1.3 .03( .29 ) ( .14 ) ( .09) ( .07)CE-B/0.5 .04( .30) ( .17 ) ( .12 ) ( .11 )CE-D/2.7 .01 ( .35)CE-D/0.4 .OO( .28)CM-A/1.4 .08( .20) ( .08)CM-A/0.4 .07( .09) ( .04)CS-A/1.7 .01 ( .27) ( .13 ) ( .08) ( .05)CS-A/0.6 .03( .36) ( .18) ( .12 ) ( .09)AC-H/1.8 .07( .32) ( .14 ) ( .09) ( .07)AC-H/0.5 .17 ( .40) ( .20) ( .14 ) ( .11 )MA-C/1.8 .01( .02)MA-C/0.5 .01( .02)AI-E/1.6 .28( .72) .22( .62) .16( .54) .08( .35)AI-E/0.4 .52( .64) .38( .53) .29( .42) .15( .23)AI-I/1.7 .37( .69) .25( .61 ) .18 ( .54) .10( .35)AI-I/0.5 .36( .46) .24( .38) .19 ( .31) .08( .16 )AC-I/.80 .06( .28) .03( .10)
Rhodamine-101(St)
CE-A/3.0 .19 ( .66) ( .50)( .38) ( .28)CE-A/0.4 .25 ( .49) ( .84)CE-B/1.3 .19( .50) ( .32)( .28) ( .21 )CE-B/0.4 .16 ( .43) ( .28)( .24) ( .20)CE-D/2.7 .14( .61)CE-D/0.4 .09 ( .38)CM-A/1.4 .37(.26) ( .21 )CM-A/0.4 .15( .18) ( .11 )CS-A/1.7 .15( .50) ( .34)( .28) ( .21 )CS-A/0.6 .12(.51) ( .30)( .26) ( .19 )AC-H/1.8 .26(.24) ( .12)( .12 ) ( .09)AC-H/0.5 .33 ( .36) ( .21 )( .19 ) ( .04 )MA-C/1.8 .06(.06)MA-C/0.5 .12 ( .09)AI-E/1.7 .58( .53) .52 ( .52) .44( .47) .32( .28)AI-E/0.5 .48 ( .43) .39 ( .39) .30( .32) .20( .24)AC-I/.80 .26( .31) .16 ( .15 )
-140-

Dye Stability After Given Exposure (kWh/m2)
Host Code/O.n. 50 100 200 300
Sulforhodamine-B(At)
CE-A/2.9 .88(.91) .78( .81 ) .67( .73) .52( .62)CE-A/0.5 .92(.84) .31 ( .71 ) .80C .61 ) .77( .44)CE-B/3.6 .61 ( .80 ) .46( .60) .28( .50) .22( .39)CE-B/O.4 .76(.66) .63( .46) .52( .35) .43( .27)CE-D/3.4 .72 ( .93) .53( •8~)) .34( .73 ) .21 ( .65)CE-D/0.6 .85 ( .80) .74( .64) .62( .52) .54( .39)CM-A/1.7 .92( .64) .83( .36) .73( .29) .67( .19 )CM-A/O.4 .92(.73) .84( .56) .76( .45) .71 ( .34)CS-A/2.2 .83 ( .82) .51 ( .69) .59( .32) .51 ( .23)CS-A/O.6 .85 ( .81 ) .72( .66) .57( .52) .42( .45)AC-H/1.7 .28(.49) .19( .36) .14 ( .20) .12 ( .13 )AC-H/O.5 .73 ( .15) .57( .07) .44( .06) .39( .05)MA-C/2.3 .03(.20) . 01 ( .15 )MA-C/O.4 .35 ( .13) .og( .oa)AI-E/2.3 .49(.69) .42( .611 ) .37( .54) .26( .39)AI-E/0.5 .81(.27) .74( •2~1 ) .67( .16 ) .52( .13)AI-I/1.7 .26 ( .76) .23( .67) .22( .59) .18 ( .45)AI-I/O.6 .78 ( .41 ) .72( .3-'1 ) .67( .23) .54( .14)AC-I/.98 .47(.41) .38( •2~» .28( .15 )CE-A/1.2 .82( .48)CM-A/.99 .84(.33)AI-E/.75 .32 ( .44)
Sulforhodamine-B(St)
CE-A/2.9 .96( .78) .85 ( .6B) .96( .76) .92( .66)CE-A/O.5 .90( .79) .83( .69) .86( .68) .79( .57)CE-B/3.6 1 .53 ( .73) 1 .60 ( .79) 2.03(1.06) 1 .88 (1 .05)CE-B/0.4 .83( .72) .75( .58) .72( .55) .62( .40)CE-D/3.4 .97( .70) .95( .66) 1 .06 ( .80) 1 .01 ( .78)CE-D/O.6 .88( .75) .79( .66) .79( .62) .65 ( .49)CM-A/1.7 .95( .50) .78( .3B) .88( .44) .78( .33)CM-A/O.4 .93( .76) .86( .58) .85( .54) .77( .43)CS-A/2.2 .94( .79) .91 ( .75 ) .96( .86) .83( .75)CS-A/O.6 .93( .82) .82( .. 7'1 ) .83( .69) .65( .55 )AC-H/1.7 2.40( .58) 2.09( •4~~) 2.22( .60) 1 .80 ( .38)AC-H/O.5 .87( .24) .70( .1? ) .70( .17 ) .57( .15)MA-C/2.3 .16 ( .23) .13 ( .19)MA-C/O.4 .38( .22) .13 ( .1 oAI-E/2.3 2.02( .39) 2.39( .3B) 2.26( .32 ) 1 .86 ( .29)AI-E/O.5 .77( .23) .81 ( .2'1 ) .68( .20) .55( .15 )AI-I/1.7 2.13 ( .75) 2.36( .8'1 ) 2.25( .88) 1 .96 ( .77)AI-I/O.6 .77( .33) .74( .29) .55( .23 ) .59( .20)AC-I/1.0 1 .48( .55) 1 .47 ( .57) 1 .27 ( .52) .97( .37)CE-A/1.2 .93( .50)CM-A/.99 .88( .37)AI-E/.75 1.60( .27) -141-

DYE Stability After Given Exposure (kWh/m2)
Host Code/ O. D. 450 600 800 1000
Sulforhodamine-B(At)
CE-A/2.9 .40( .45 ) .25( .23)CE-A/0.5 .57( .30) .43( .14 )CE-B/3.6 .13 ( .26) ( .14 )CE-B/0.4 .30( .13 ) .22( )CE-D/3.4 .12 ( .52) ( .34) ( .10)CE-D/0.6 .40( .24) .26( .12 )CM-A/1.7 .51 ( .10) .31 ( )CM-A/0.4 .55( .10) .34( )CS-A/2.2 .36( .12 ) .22( )CS-A/0.6 .30( .26) .17 ( .13)AC-H/1.7 .09( .07)AC-H/0.5 .26( .02) .15 ( )
AI-E/2.3 .13 ( .25) ( .19 )AI-E/0.5 .29( .03) .24( )AI-I/1.7 .13 ( .29) ( .22)AI-I/0.6 .36( .07) .31 ( )
Sulforhodamine-B(St)
CE-A/2.9 .79( .54) .74( .43)CE-A/0.5 .69( .44) .62( .32)CE-B/3.6 1.61(1.03) ( .90)CE-B/0.4 .51 ( .32) .33( )CE-D/3.4 .90( .70) ( .67) ( .56)CE-D/0.6 .55( .36) .46( .24)CM-A/1.7 .71 ( .22) .59( )CM-A/0.4 .68( .26) .59( )CS-A/2.2 .71 ( .66) .44( )CS-A/0.6 .54( .43) .40( .29)AC-H/1.7 1 .44 ( .42)AC-H/0.5 .47( .16 ) .38( )
AI-E/2.3 1 .44 ( .20) ( .18 )AI-E/0.5 .43( .10) .35( )AI-I/1.7 1.79( .72) ( .65 )AI-I/0.6 .53( .15 ) .48( )
-142-

Dye Stability After Given Exposure (kWh/m2 )
Host Code/O.D. 50 100 200 300
FluorescentYellow 10-GN(At)
CE-D/1.0 .36( .76) .09( .59) .O2( .27) .01 ( .07)
FluorescentYellow 10-GN(St)
CE-O/1.0 .64( .89 ) .26( .78 ) .11 ( .49) .10( .18 )
BrilliantOrange (At)
CE-O/ .95 .80( .97) .72( .95) .44( .88) .19 ( .-75 )CE-A/ .64 .74( .90) .64( .85) .45( .72) .20( .55)
BrilliantOrange (St)
CE-D/ .95 .89( .98) .94( .96) .78( .96) .50( .82)CE-A/ .64 .83( .94) .71( .91 ) .73( .93) .60( .83)
FluorolYellow -088(At)
CE-O/1.10 .79( .66) .92( .64) .58( .40) .50( .39)
Fluor-alYellow -088(St)
CE-D/1 .10 .20{ .34) .19 ( .23) .25( .27) .25( .27)
...143-
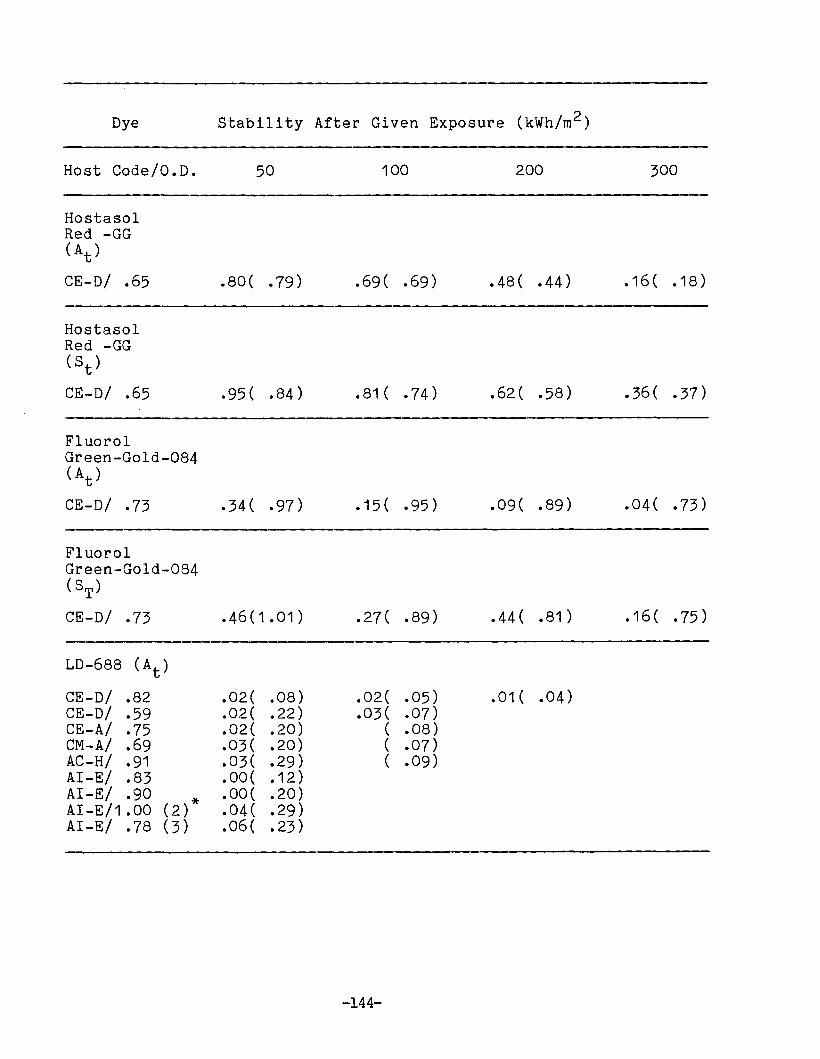
Dye Stability After Given Exposure (kWh/m2)
Host Code/O.D. 50 100 200 300
HostasolRed -GG(At)
CE-D/ .65 .80( .79) .69( .69) .48( .44) .16 ( .18 )
HostasolRed -GG(St)
CE-D/ .65 .95( .84) .81 ( .74) .62( .58) .36( .37)
FluorolGreen-Gold-084(At)
CE-D/ .73 .34( .97 ) .15 ( .95) .09( .89) .04( .73)
FluorolGreen-Gold-084(ST)
CE-D/ .73 .46(1.01) .27( .89) .44( .81 ) .16 ( .75 )
LD-688 (At)
CE-D/ .82 .02( .08) .02( .05) .01 ( .04)CE-D/ .59 .02( .22) .03( .07)CE-A/ .75 .02( .20) ( .08)CM-A/ .69 .03( .20) ( .07)AC-H/ .91 .03( .29) ( .09)AI-E/ .83 .OO( .12 )AI-E/ .90
(2)*.OO( .20)
AI-E/1.00 .04( .29)AI-E/ .78 (3) .06( .23)
-144-

Dye Stability After Given Exposure (kWh/m2 )
Host Code/O.D. 50 100 200 300
LD-688 (St)
CE-D/ .82 .05( .19 ) .O4( .oa) .04( .06) .osC .Os)CE-D/ .59 .07( .34) .07( .oa)CE-A/ .75 .04( .19 ) ( .0.5)CM-A/ .69 .06( .18 ) ( .06)AC-H/ .91 .06( .23) ( .cs)AI-E/ .83 .04( .13 )AI-E/ .90
(2)*.04( .19 )
AI-E/1.00 .06( .38)AI-E/ .78 (3) .14 ( .22)
LD-700 (At)
CE-D/1.24 .39( .90) .17 ( .84) .06( .66) .O2( .50)CE-D/1.40 .53( .94) .28( .6(3) .15( .57) .04( .40)CE-A/1.10 .44( .95) .17 ( •8~5 ) .05( .73) .02( .55 )eM-A/ .75 .20( .70) .09( .1 I)
AC-H/ .66 .26( .85) .09( .6-1 )AI-E/1 .03 .52( .84) .21 ( .74) ( .46) ( .34)AI-E/ .93 (2) .41 ( .76) .15 ( .6:3) ( .29) ( .19 )AI-E/ .99 (3) .3S( .73) .13 ( .55) ( .21 ) ( .15 )CE-E/1.1 .06( .50)
LD-700 (St)
CE-D/1.24 .86(1.02) .52( .95) .35( .93) .21 ( .91 )CE-D/1.40 .91(1.00) .73( .s6) .53( .75 ) .35( .73)CE-A/1.10 1.01(1.03) .6s( .97) .20( .93) .29( .96 )eM-A/ .75 .5S( .93) .41 ( .33)AC-H/ .66 .SO( .92) .36( .s6)AI-E/1.03 .83( .94) .63( .84) ( .72) ( .67)AI-E/ .93 (2) .73( .S4) .52( . S-1 ) ( .62) ( .53 )AI-E/ .99 (3) .70( .88) .45( .8'1 ) ( .59) ( .48)CE-E/1.1 . SO (1 .29)
-145-
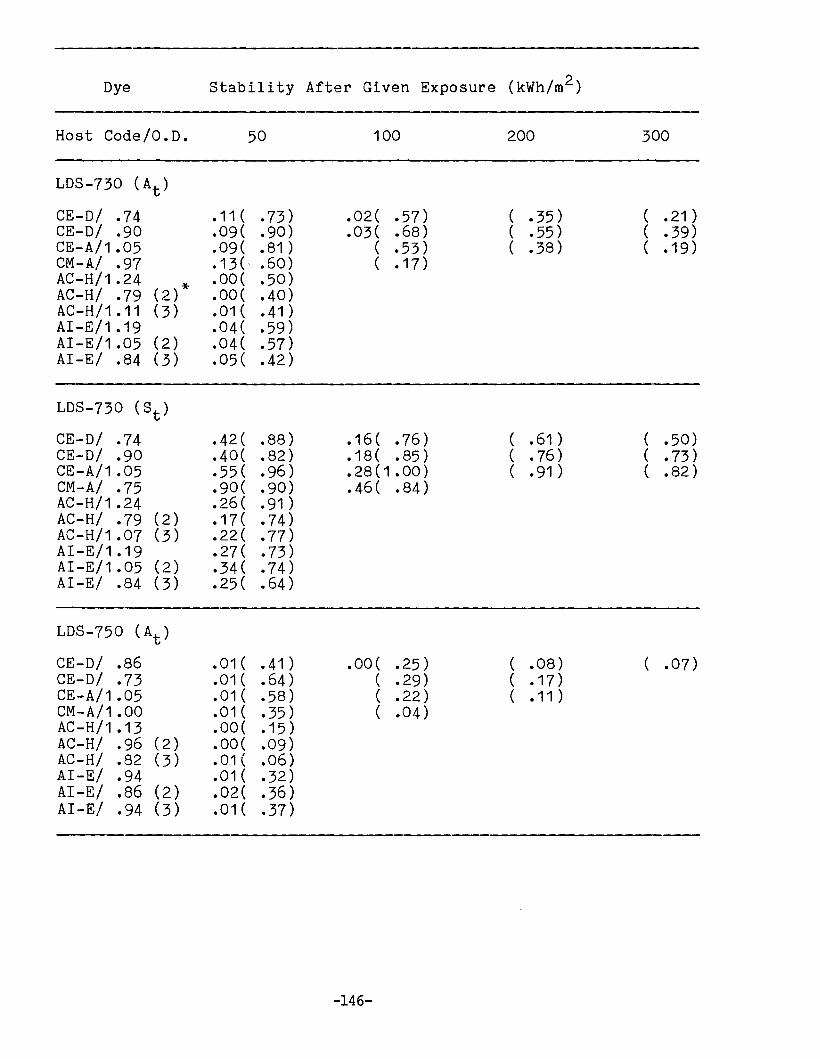
Dye Stability AftE~r Given Exposure (kWh/m2)
Host Code/O.D. 50 100 200 300
LDS-730 (At)
CE-D/ .74 .11 ( .73) .02( .57) ( .35 ) ( .21 )CE-D/ .90 .09( .90) .03( .68) ( .55) ( .39)CE-A/1.05 .09( .81 ) ( .53) ( .38) ( .19 )CM-A/ .97 .13(. .60) ( .17 )AC-H/1.24
(2)*.OO( .50)
AC-H/ .79 .OO( .40)AC-H/1.11 (3) .01 ( .41 )AI-E/1.19 .04( .59)AI-E/1.05 (2) .04( .57)AI-E/ .84 (3) .05( .42)
LDS-730 (St)
CE-D/ .74 .42( .88) .16 ( .76) ( .61 ) ( .50)CE-D/ .90 .40( .82) .18( .85 ) ( .76) ( .73)CE-A/1 .05 .55( .96) .28 (1 .00) ( .91 ) ( .82)CM-A/ .75 .90( .90) .46( .84)AC-H/1.24 .26( .91 )AC-H/ .79 (2) .17( .74)AC-H/1.07 (3) .22( .77)AI-E/1.19 .27( .73)AI-E/1.05 (2) .34( .74)AI-E/ .84 (3) .25( .64)
LDS-750 (At)
CE-D/ .86 .01( .41 ) .OO( .25) ( .08) ( .07)CE-D/ .73 .01 ( .64) ( .29) ( .17)CE-A/1.05 .01 ( .58) ( .22) ( .11 )CM-A/1.00 .01 ( .35) ( .04)AC-H/1.13 .OO( .15 )AC-H/ .96 (2) .OO( .09)AC-H/ .82 (3) .01 ( .06)AI-E/ .94 .01 ( .32)AI-E/ .86 (2) .O2( .36)AI-E/ .94 (3) .01 ( .37)
-146-

Dye Stability After Given Exposure (kWh/m2)
Host Code/O.D. 50 100 200 300
LDS-750 (St)
CE-D/ .86 .12 ( · 75) .09( .62) ( .29) ( .19 )CE-D/ .73 .15 ( .13) ( .08) ( .07)CE-A/1.05 .21(1.06) ( .65 ) ( .46)CM-A/1.00 .53( .98) ( .a8)AC-H/1 .13
(2)*.59( .98)
AC-H/ .96 .14 ( .45)AC-H/ .83 (3) .12( .31 )AI-E/ .94 .13 ( .63)AI-E/ .86 (2) .09( .55)AI-E/1.01 (3) .11 ( .62)
LDS-751 (At)
CE-D/ .82 .02( .64) .02( .43) ( .13 ) ( .07)
LDS-751 (St)
CE-D/ .82 .14 ( .76) .11 ( .56) ( .30) ( .21 )
LDS-798 (At)
CE-D/ .79 .OO( .43) ( .25)CE-D/ .75 .01( .69) ( .34) ( .17) ( .06)CE-A/ .72 .02( .63) ( .26) ( .19 )CM-A/ .86 .02( .32) ( .09)AC-H/ .80
(2)*.01( .11 )
AC-H/ .75 .01( .18 )AC-H/ .91 (3) .01( .17 )AI-E/ .96 .01( .28)AI-E/1.01 (2) .01( .31 )AI-E/ .99 (3) .O2( .12 )
-147-
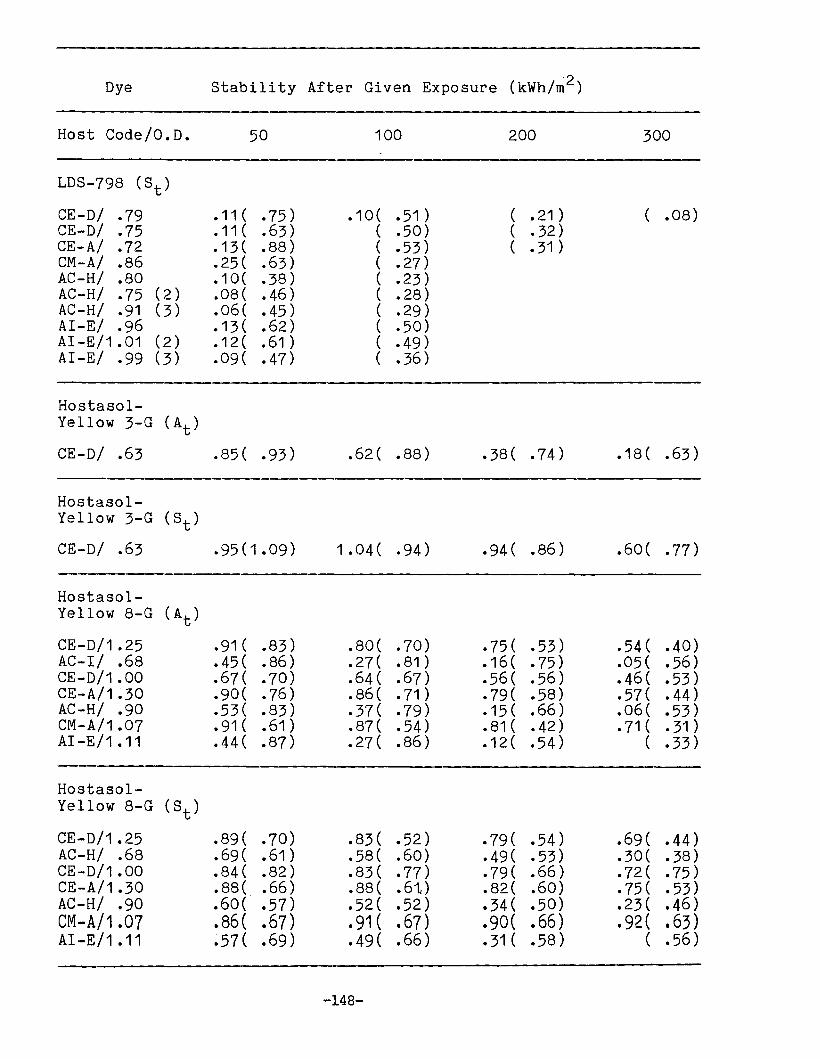
Dye Stability After Given Exposure (kWh/rn2)
Host Code/O.D. 50 100 200 300
LDS-798 (St)
CE-D/ .79 .11 ( .75) .10( .51 ) ( .21 ) ( .08)CE-D/ .75 .11 ( .63) ( .50) ( .32)CE-A/ .72 .13 ( .88) ( .53) ( .31 )CM-A/ .86 .25( .63) ( .27)AC-H/ .80 .10( .38 ) ( .23)AC-H/ .75 (2) .08( .46) ( .28)AC-H/ .91 (3) .06( .45 ) ( .29)AI-E/ .96 .13( .62) ( .50)AI-E/1.01 (2) .12 ( .61 ) ( .49)AI-E/ .99 (3) .09( .47) ( .36)
Hostasol-Yellow 3-G (At)
CE-D/ .63 .85( .93) .62( .88) .38( .74) .18 ( .63 )
Hostasol-Yellow 3-G (St)
CE-D/ .63 .95 (1 .09) 1 .04 ( .94) .94( .86) .60( .77)
Hostasol-Yellow 8-G (At)
CE-D/1.25 .91 ( .83) .80( .70) .75( .53 ) .54( .40)AC-I/ .68 .45( .86) .27( .81 ) .16 ( .75) .05( .56)CE-D/1.00 .67( .70) .64( .67) .56( .56) .46( .53 )CE-A/1.30 .90( .76) .86( .71 ) .79( .58) .57( .44)AC-H/ .90 .53( .83) .37( .79) .15 ( .66) .06( .53)CM-A/1.07 .91( .61 ) .87( .54) .81 ( .42) .71 ( .31 )AI-E/1.11 .44( .87) .27( .86) .12 ( .54) ( .33)
Hostasol-Yellow 8-G (St)
CE-D/1.25 .89( .70) .83( .52) .79( .54 ) .69( .44)AC-H/ .68 .69( .61) .58( .60) .49( .53) .30( .38)CE-D/1.00 .84( .82) .83( .77) .79( .66) .72( .75)CE-A/1.30 .8S( .66) .88( .61,) .82( .60) .75( .53)AC-H/ .90 .60( .57) .52( .52) .34( .50) .23( .46)CM-A/1.07 .86( .67) .91 ( .67) .90( .66) .92( .63)AI-E/1.11 .57( .69) .49( .66) .31 ( .58) ( .56)
-148-

DYE Stability After Given Exposure (kWh/m2)
Host Code/ O. D. 450 600 800 1000
HostasolYellow-3G (At)
CE-D/.63 .12 ( .61)
HostasolYellow-3G (St)
CE-D/.63 .37( .48)
HostasolYellow-SG (At)
CE-D/1.3 .46( .36)AC-I/.68 ( .45)CE-D/1.0CE-A/1.3AC-H/.90CM-A/1.1AI-E/1.1
HostasolYellow-8G (St)
CE-O/1.3 .57( .37)AC-I/.68 ( .35)CE-O/1.0CE-A/1.3AC-H/.90CM-A/1.1AI-E/1.1
-149-

Dye Stability After Given Exposure (kWh/m2)
Host Code/O.D.
Eastman DTTC(At)
CE-D/ .02CE-A/ .30AC-H/ .13CM-A/ .03AI-E/ .09
Eastman DTTC(St)
CE-D/ .02CE-A/ .30AC-H/ .13CM-A/ .03AI-E/ .09
Eastman DTDC(At)
CE-D/ .05CE-A/ .01AC-H/ .04CM-A/ .03AI-E/ .65
Eastman DTDC(St)
CE-D/ .05CE-A/ .01AC-H/ .04CM-A/ .03AI-E/ .65
50
.10( .12)
.02( .06)
.01 ( .02)
.15( .03)
.01( .05)
.64 ( .69)1 .47 (1 .00)1 •50( 1 .22)
.69 ( .79)
.43( .40)
.09( .02)
.00 ( .13)
.16( .03)
.18( .03)
.03( .02)
.60( .37)
.46( .50)
.64( .61)
.48 ( .48)
.13( .13)
--150-
100 200 300
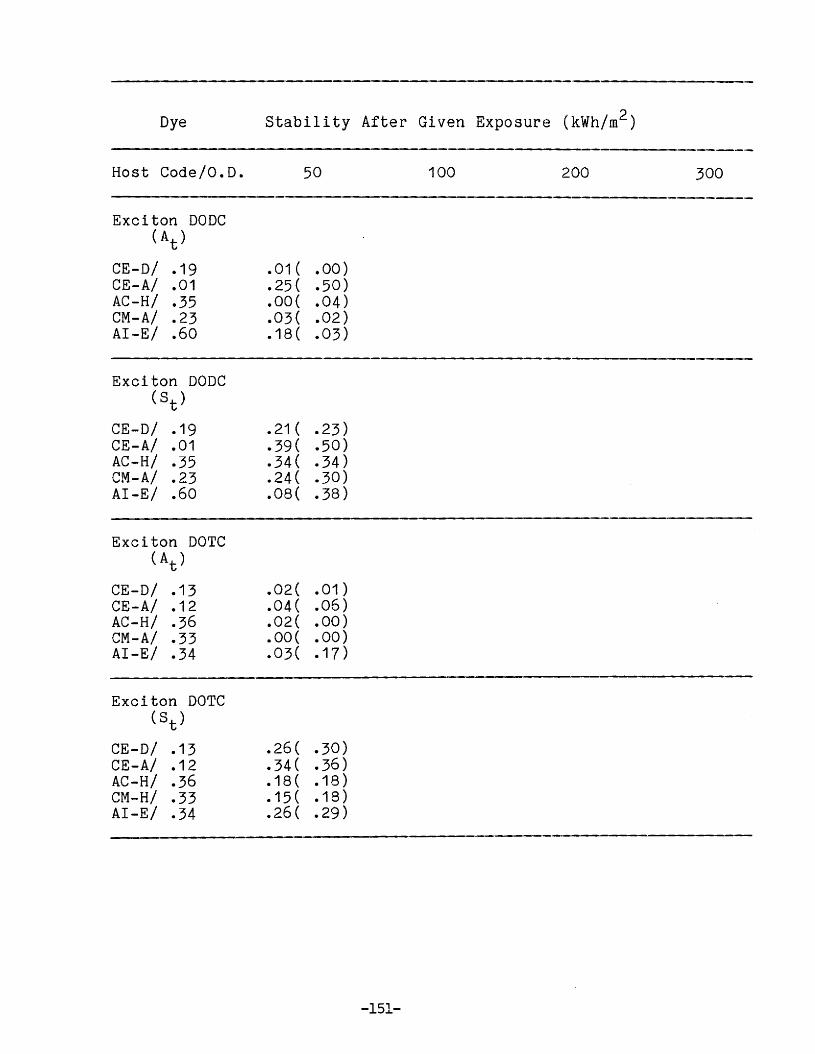
Dye Stability After Given Exposure (kWh/m2 )
Host Code/O.D. 50 100 200 300
Exciton DODC(At)
CE-D/ .19 .01 ( .00)CE-A/ .01 .25( .50)AC-H/ .35 .OO( .04)eM-A/ .23 .03( .02)AI-E/ .60 .18 ( .03)
Exciton DODC(St)
CE-D/ .19 .21 ( .23)CE-A/ .01 .39( .50 )AC-H/ .35 .34( .34)CM-A/ .23 .24( .30)AI-E/ .60 .08( .38)
Exciton DOTC(At)
CE-D/ .13 .02( .01 )CE-A/ .12 .04( .06)AC-H/ .36 .02( .00)CM-A/ .33 .OO( .00)AI-E/ .34 .03( .17 )
Exciton DOTC(St)
CE-D/ .13 .26( .30)CE-A/ .12 .34( .36)AC-H/ .36 .18 ( .18 )CM-H/ .33 .15( .18 )AI-E/ .34 .26( .29)
-151-
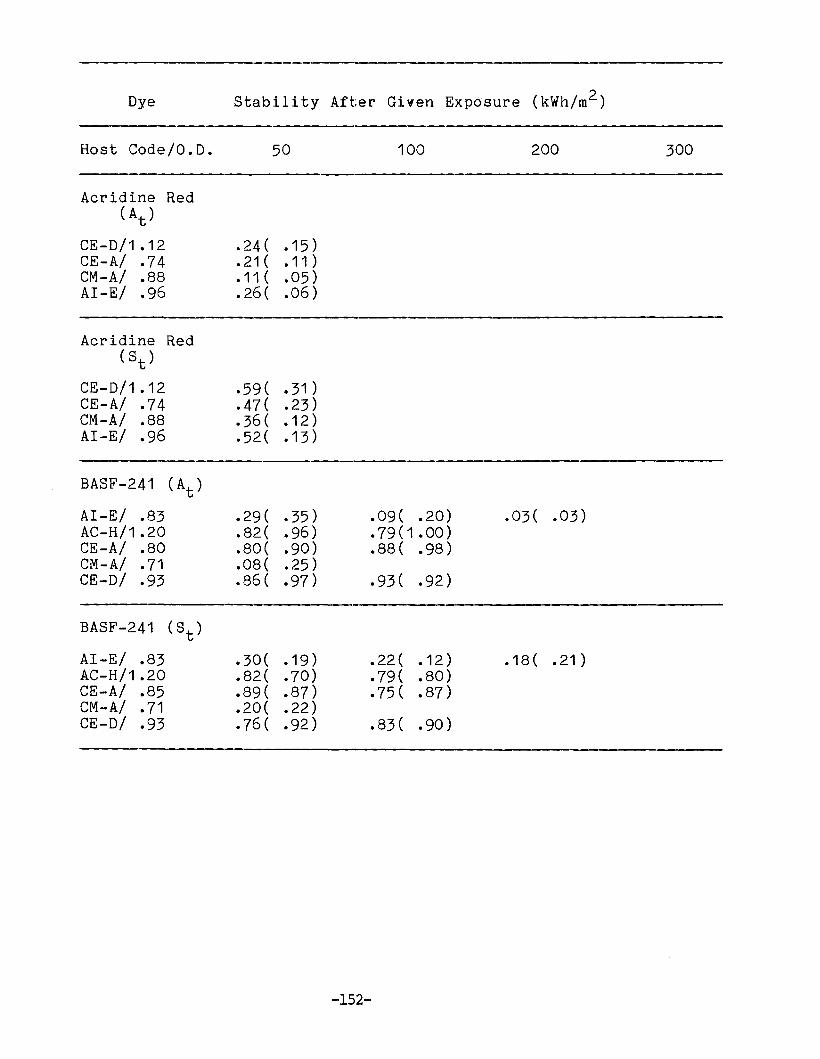
Dye Stability After Given Exposure (kWh/m2)
Host Code/O.D. 50 100 200 300
Acridine Red(At)
CE-D/1.12 .24( .15 )CE-A/ .74 .21 ( .11 )CM-A/ .88 .11 ( .05)AI-E/ .96 .26( .06)
Acridine Red(St)
CE-D/1.12 .59( .31 )CE-A/ .74 .47( .23)CM-A/ .88 .36( .12 )AI-E/ .96 .52( .13 )
BASF-241 (At)
AI-E/ .83 .29( .35) .09( .20) .03( .03)AC-H/1.20 .82( .96) .79(1.00)CE-A/ .80 .80( .90) .S8( .98)CM-A/ .71 .OS( .25)CE-D/ .93 .86( .97) .93( .92)
BASF-241 (St)
AI-E/ .83 .30( .19 ) .22( .12 ) .18 ( .21 )AC-H/1.20 .82( .70) .79( .80)CE-A/ .85 .89( .87) .75( .87)CM-A/ .71 .20( .22)CE-D/ .93 .76( .92) .83( .90)
-152-
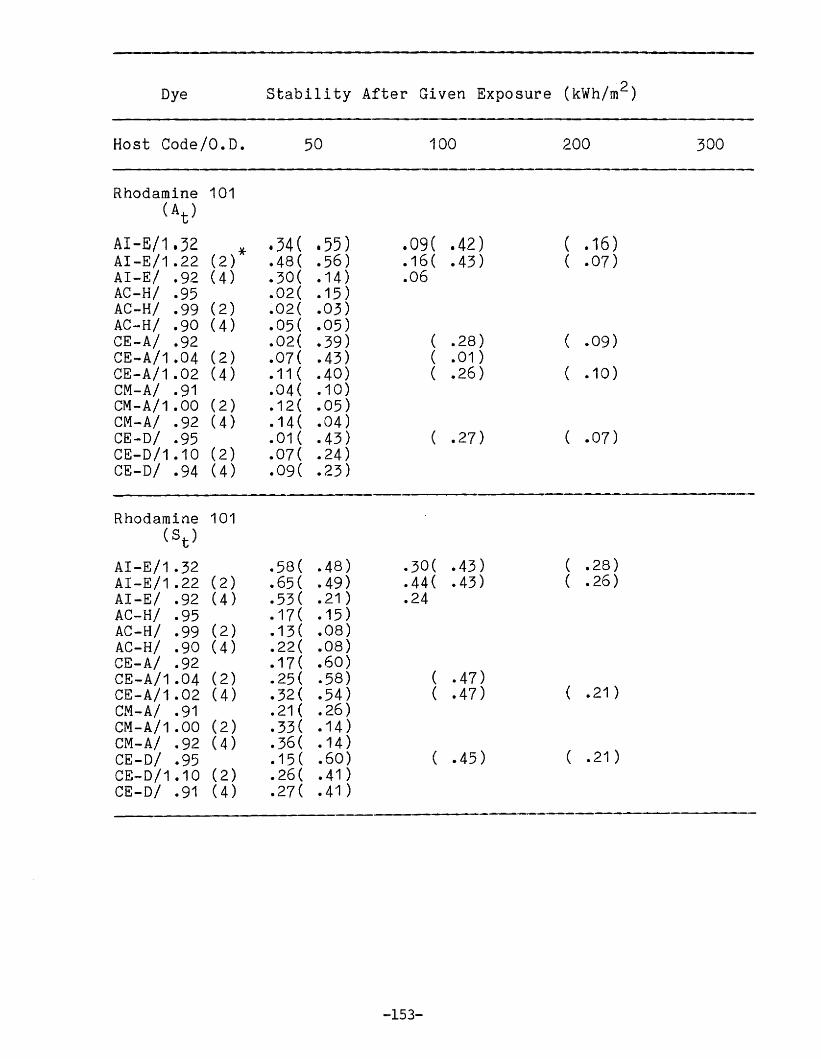
Dye Stability After Given Exposure (kWh/m2)
Host Code/O.D. 50 100 200 300
Rhodamine 101(At)
AI-E!1.32(2)*
.34( .55) .O9( .42) ( .16 )AI-E/1.22 .48( .56) .16 ( .43) ( .07)AI-E/ .92 (4) .30( .14 ) .06AC-H/ .95 .O2( .15 )AC-H/ .99 (2) .02( .03)AC-H/ .90 (4) .O5( .05)CE-A/ .92 .02( .39) ( .28) ( .09)CE-A/1.04 (2) .07( .43) ( .01 )CE-A/1.02 (4) .11 ( .40) ( .26) ( .10 )CM-A/ .91 .04( .10)eM-A/1.00 (2) .12 ( .05)CM-A/ .92 (4) .14 ( .04)CE-D/ .95 .01( .43) ( .27) ( .07)CE-D/1.10 (2) .07( .24)CE-D/ .94 (4) .09( .23)
Rhodamine 101(St)
AI-E/1.32 .58( .48) .30( .43 ) ( .28)AI-E/1.22 (2) .65( .49) .44( .43) ( .26)AI-E/ .92 (4) .53( .21 ) .24AC-H/ .95 .17( .15 )AC-H/ .99 (2) .13 ( .08)AC-H/ .90 (4) .22( .08)CE-A/ .92 .17 ( .60)CE-A/1.04 (2) .25( .58) ( .47)CE-A/1.02 (4) .32( .54) ( .47) ( .21 )CM-A/ .91 .21 ( .26)CM-A/1.00 (2) .33( .14 )CM-A/ .92 (4) .36( .14)CE-D/ .95 .15 ( .60) ( .45) ( .21 )CE-D/1.10 (2) .26( .41 )CE-D/ .91 (4) .27( .41 )
-153-

Dye Stability After Given Exposure (kWh/m2)
Host Code/O.D. 50 100 200 300
Rhodamine 6-G( At)
CE-D/ .96 .60( .38) .35( .23) .05( .07)AI-E/ .88 .68( .03) .33 .01
Rhodamine 6-G(St)
CE-D/ .96 .79( .49) .54( .35) .25 ( .23)AI-E/ .88 .68( .09) .42 .16
Rhodamine 19( At)
CE-D/1.12 .29( .30) .20( .22) .01 ( .01 )AI-E/ .43 .62( .09) .43 .19
Rhodamine 19(St)
CE-D/1.12 .77( .48) .68( .36) .24( .17 )AI-E/ .43 .66( .16) .38 .27
Rhodamine-B( At)
CE-D/1.07 .36( .24) .14( .09)AI-E/ .80 .76( .28) .34 .09
Rhodamine-B(St)
CE-D/1.07 .73( .43) .47( .28)AI-E/ .80 .69( .20) .49 .34
--154-

Dye Stability After Given Exposure (kWh/m2)
Host Code/O.D. 50 100 200 300
Rhodamine-110(At)
CE-D/ .73 .17 ( .14 )AC-I/ .47 .O5( .48)
Rhodamine-110(St)
CE-D/ .73 .52( .47)AC-I/ .47 1 .30( .86)
Coumarin-440(At)
CE-D/1.35 .05CM-AI .89 .04AI-E/1.05 .05
Coumarin-440(St)
CE-D/1.35 .41CM-AI .89 .56AI-E/1.05 .64
Coumarin-445(At)
CE-D/1.02 .02CM-AI .94 .02
Coumarin-445(St)
CE-D/1.02 .47eM-AI 94 .29
.06( .27)
.32( •95)
-155-

Dye Stability After Given Exposure (kWh/m2)
Host Code/O.D.
Coumarin-450( At)
CE-D/ .90 .02CM-A/ .98 .01
Coumarin-450(St)
CE-D/ .90 .38CM-A/ .98 .14
Coumarin-460(At)
CE-D/1.27 .01CM-A/ .98 .03AI-E/1.14 .04
Coumarin-460(St)
CE-D/1.27 .14CM-A/ .98 .28AI-E/1.14 .39
Stilbene-420(At)
CE-D/ .96 .01AI-E/ .86 .20
Stilbene-420(St)
CE-D/ .96 .14AI-E/ .86 .71
50 100
-156-
200 300
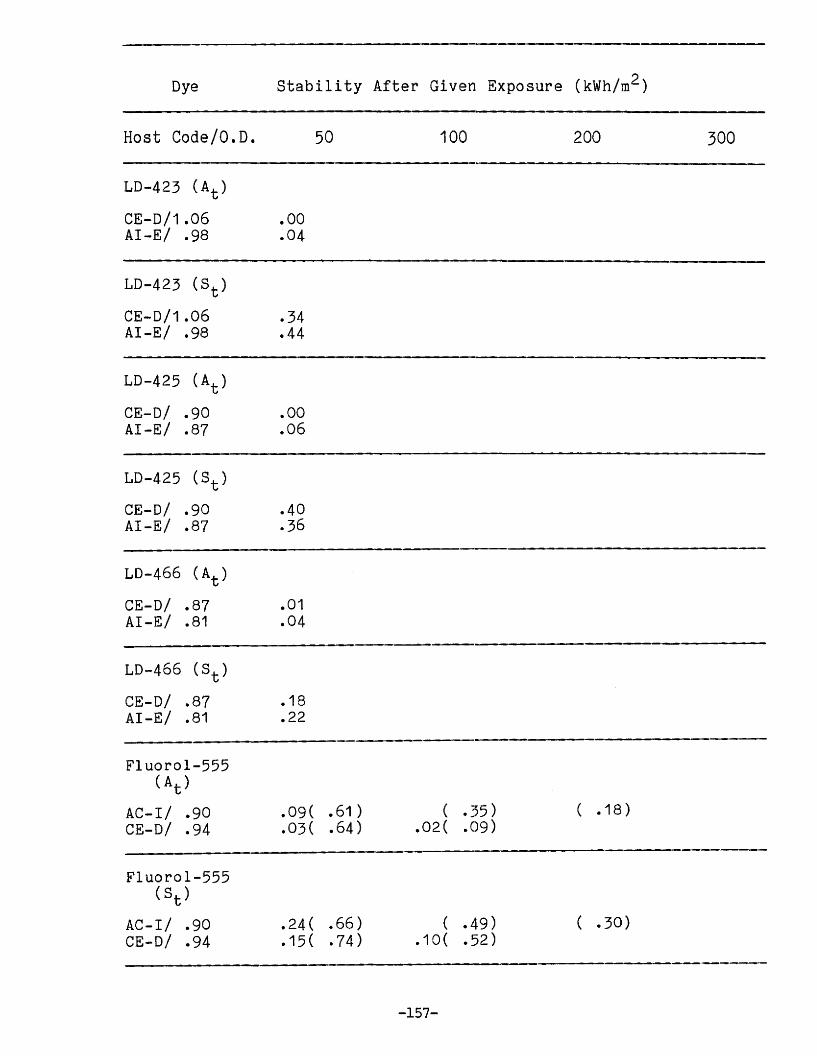
Dye Stability After Given Exposure (kWh/m2)
Host Code/O.D. 50 100 200 300
LD-423 (At)
CE-D/1.06 .00AI-E/ .98 .04
LD-423 (St)
CE-D/1.06 .34AI-E/ .98 .44
LD-425 (At)
CE-D/ .90 .00AI-E/ .87 .06
LD-425 (St)
CE-D/ .90 .40AI-E/ .87 .36
LD-466 (At)
CE-D/ .87 .01AI-E/ .81 .04
LD-466 (St)
CE-D/ .87 .18AI-E/ .81 .22
Fluorol-555(At)
AC-I/ .90 .09( .61 ) ( • ~55 ) ( .18 )CE-D/ .94 .03( .64) .02( .(9)
Fluorol-555(St)
AC-I/ .90 .24( .66) ( .49) ( .30)CE-O/ .94 .15 ( .74) .10 ( 1-2 )..)
-157-
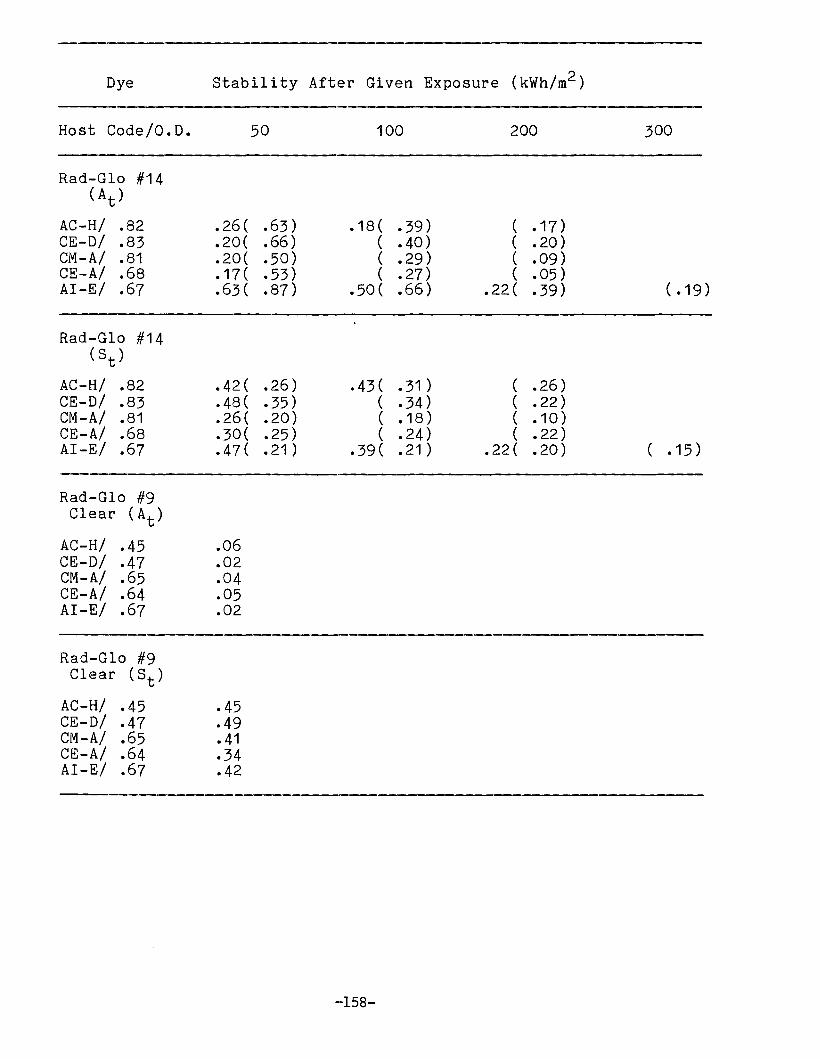
Dye Stability After Given Exposure (kWh/m2)
Host Code/O.D. 50 100 200 300
Rad-Glo #14(At)
AC-H/ .82 .26( .63) .18 ( .39) ( .17 )CE-D/ .83 .20( .66) ( .40) ( .20 )CM-A/ .81 .20( .50) ( .29) ( .09)CE-A/ .68 .17 ( .53) ( .27) ( .05 )AI-E/ .67 .63( .87) .50( .66) .22( .39) ( .19)
Rad-Glo #14(St)
AC-H/ .82 .42( .26) .43( .31 ) ( .26)CE-D/ .83 .48( .35) ( .34) ( .22)CM-A/ .81 .26( .20) ( .18 ) ( .10 )CE-A/ .68 .30( .25) ( .24) ( .22)AI-E/ .67 .47( .21 ) .39( .21 ) .22( .20) ( .15 )
Rad-Glo #9Clear (At)
AC-H/ .45 .06CE-D/ .47 .02CM-A/ .65 .04CE-A/ .64 .05AI-E/ .67 .02
Rad-Glo #9Clear (St)
AC-H/ .45 .45CE-D/ .47 .49CM-A/ .65 .41CE-A/ .64 .34AI-E/ .67 .42
--158-
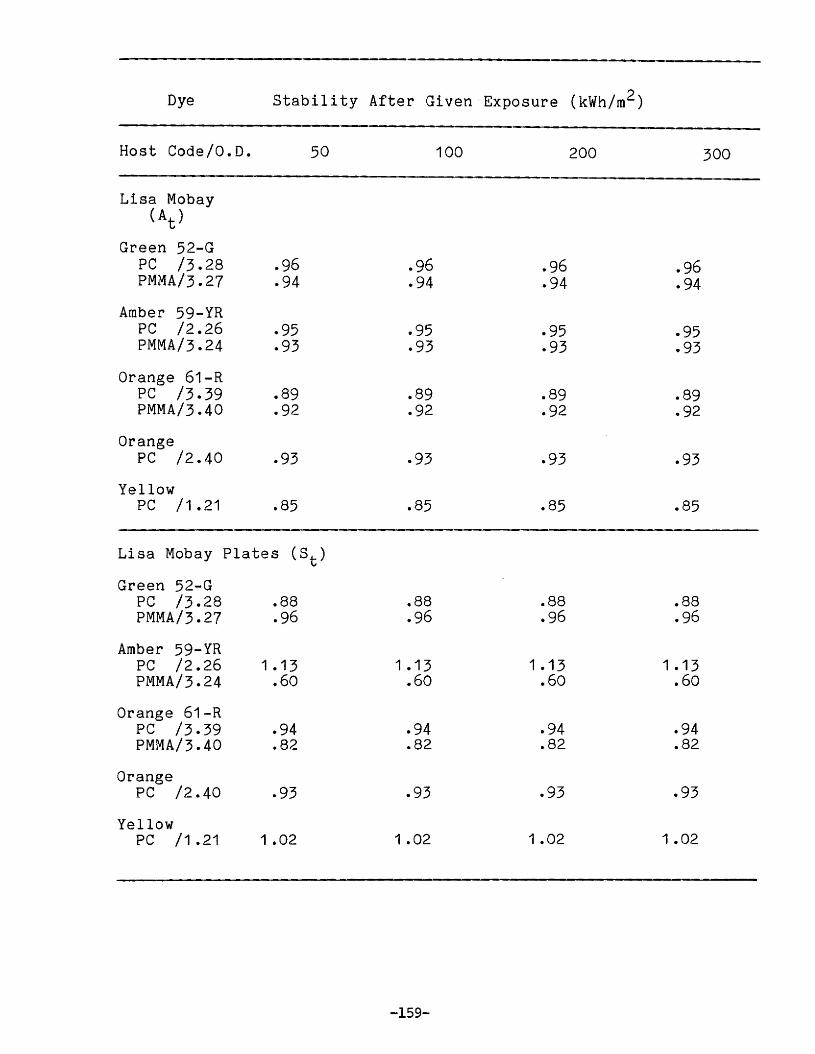
Dye Stability After Given Exposure (kWh/m2)
Host Code/O.D. 50 100 200 300
Lisa Mobay(At)
Green 52-GPC /3.28 .96 .96 .96 .96PMMA/3.27 .94 .94 .94 .94
Amber 59-YRPC /2.26 .95 .95 .95 .95PMMA/3.24 .93 .93 .93 .93
Orange 61-RPC /3.39 .89 .89 .89 .89PMMA/3.40 .92 .92 .92 .92
OrangePC /2.40 .93 .93 .93 .93
YellowPC /1 .21 .85 .85 .85 .85
Lisa Mobay Plates (St)
Green 52-GPC /3.28 .88 .88 .88 .88PMMA/3.27 .96 .96 .96 .96
Amber 59-YRPC /2.26 1 .13 1 .13 1 .13 1 .13PMMA/3.24 .60 .60 .60 .60
Orange 61-RPC /3.39 .94 .94 .94 .94PMMA/3.40 .82 .82 .82 .82
OrangePC /2.40 .93 .93 .93 .93
YellowPC /1 .21 1.02 1 .02 1 .02 1 .02
-159-
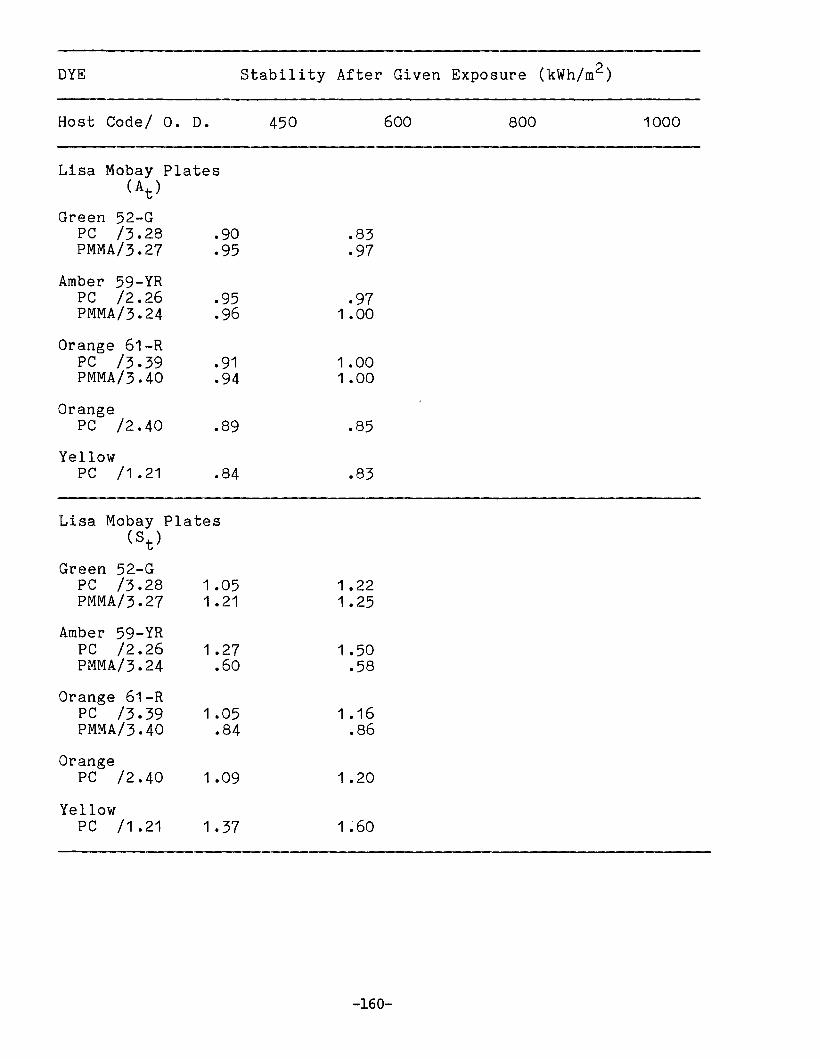
DYE Stability After Given Exposure (kWh/m2)
Host Code/ O. D.
Lisa Mobay Plates(At)
Green 52-GPC /3.28 .90PMMA/3.27 .95
Amber 59-YRPC /2.26 .95PMMA/3.24 .96
Orange 61-RPC /3.39 .91PMMA/3.40 .94
OrangePC /2.40 .89
YellowPC /1 .21 .84
450 600
.83
.97
.971 .00
1.001 .00
.85
.83
800 1000
Lisa Mobay Plates(St)
Green 52-GPC /3.28 1 .05 1.22PMMA/3.27 1 .21 1.25
Amber 59-YRPC /2.26 1 .27 1.50PMMA/3.24 .60 .58
Orange 61-RPC /3.39 1 .05 1 .16PMMA/3.40 .84 .86
OrangePC /2.40 1.09 1.20
YellowPC /1 .21 1.37 1.60
-160-
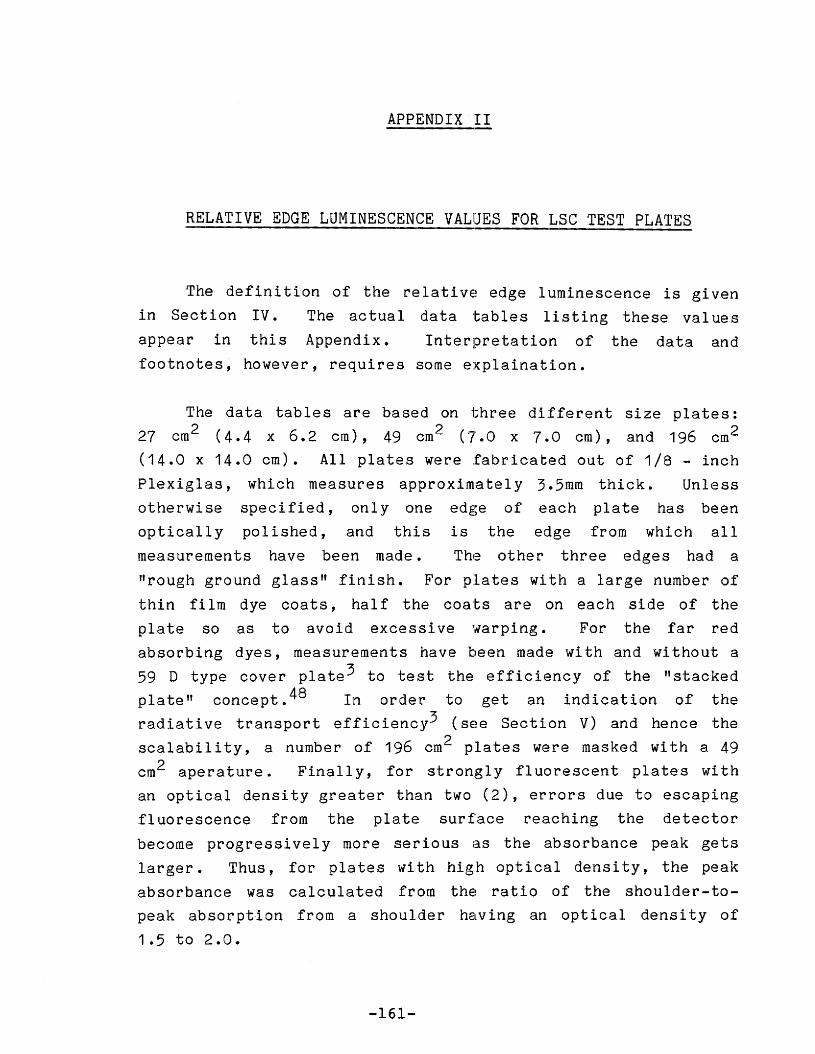
APPENDIX II
RELATIVE EDGE LUMINESCENCE VALUES FOR LSC TEST PLATES
The definition of the relative edge luminescence is given
in Section IV. The actual data tables listing these values
appear in this Appendix. Interpretation of the data and
footnotes, however, requires some explaination.
The data tables are based on three different size plates:
27 cm 2 (4.4 x 6.2 cm ) , 49 cm2 (7;.0 x 7.0 em), and 196 cm2
(14.0 x 14.0 em). All plates were fabricated out of 1/8 - inch
Plexiglas, which measures approximately 3.5mm thick. Unless
otherwise specified, only one edge of each plate has been
optically polished, and this is the edge from which all
measurements have been made. 'I'he other three edges had a
"rough ground glass" finish. For plates with a large number of
thin film dye coats, half the coats are on each side of the
plate so as to avoid excessi ve war-p Lng , For the far red
absorbing dyes, measurements have been made with and without a
59 D type cover plate 3 to test the efficiency of the "stacked
plate" concept. 48 In order to get an indication of theradiati ve transport efficiency3 (sE~e Section V) and hence the
scalability, a number of 196 cm2 plates were masked with a 49
cm2 aperature. Finally, for strongly fluorescent plates with
an optical density greater than two (2), errors due to escaping
fluorescence from the plate surface reaching the detector
become progressively more serious as the absorbance peak gets
larger. Thus, for plates wi th high optical densi ty, the peak
absorbance was calculated from t he ratio of the shoulder-to
peak absorption from a shoulder having an optical densi ty of
1.5 to 2.0.
-161-


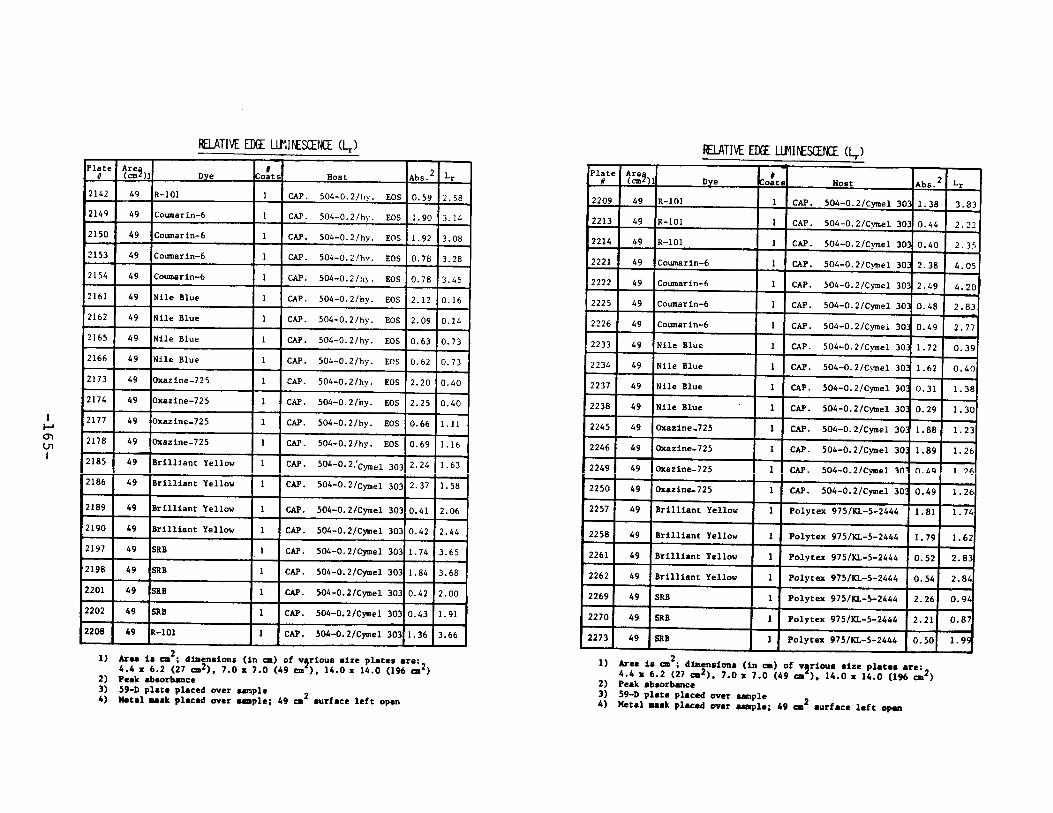
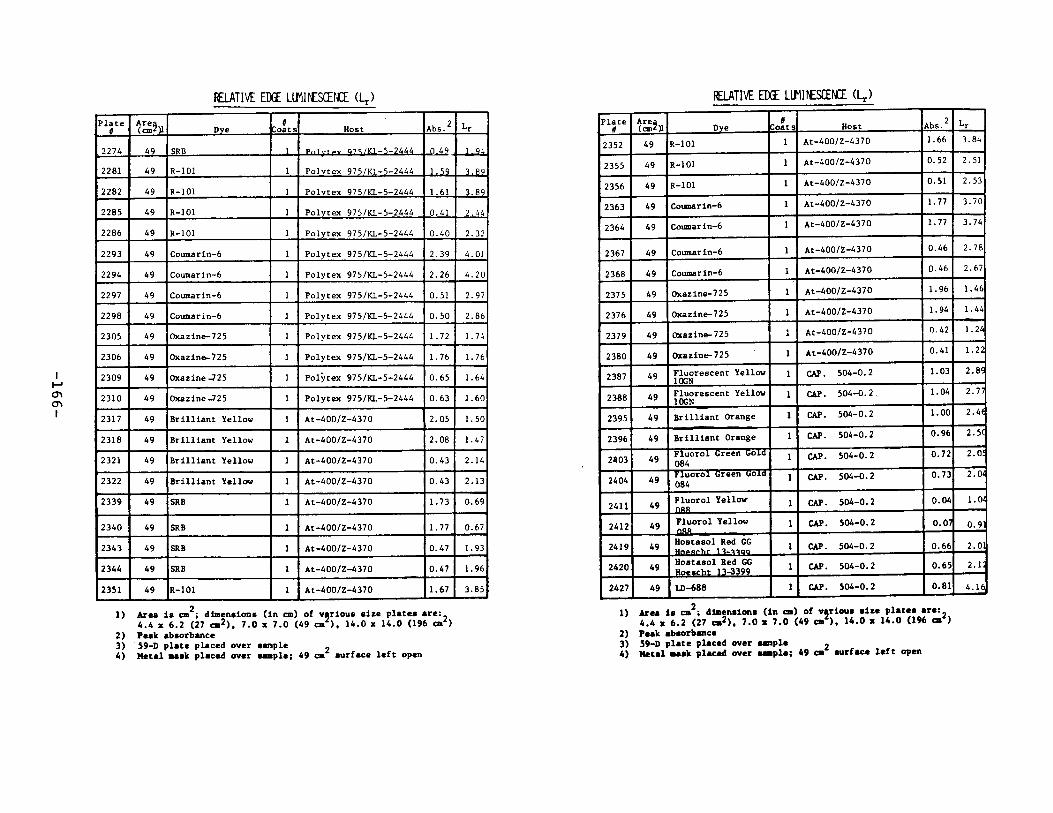

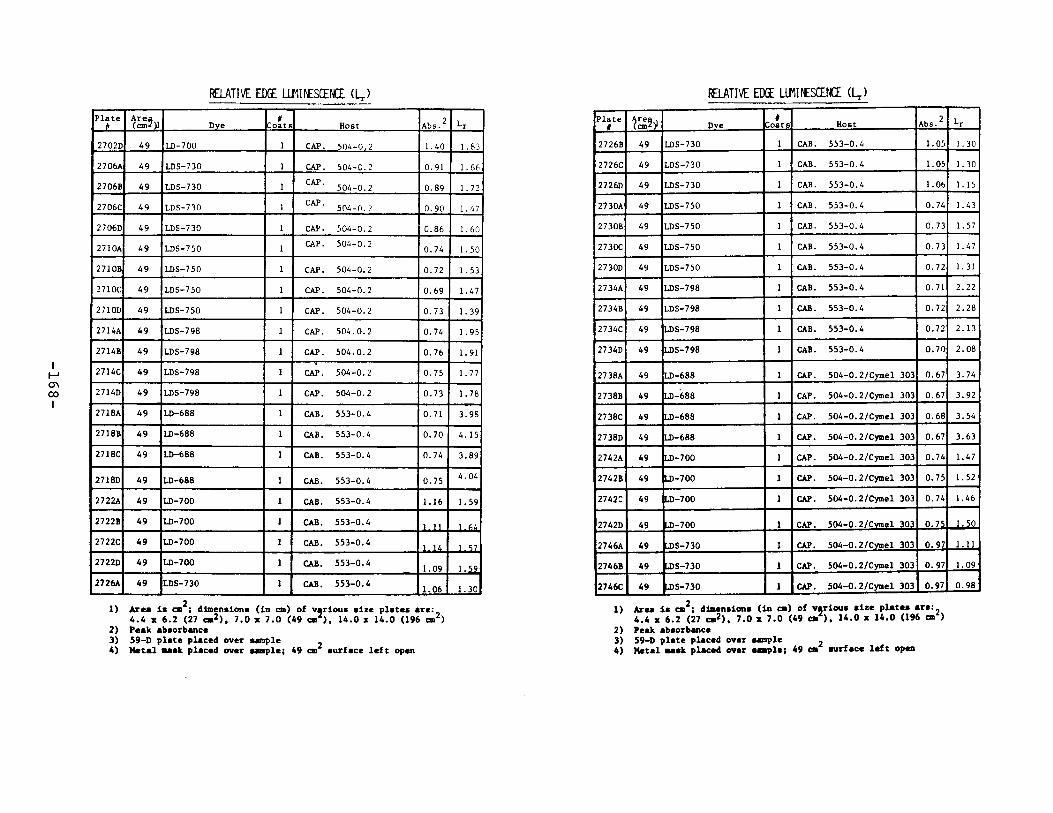

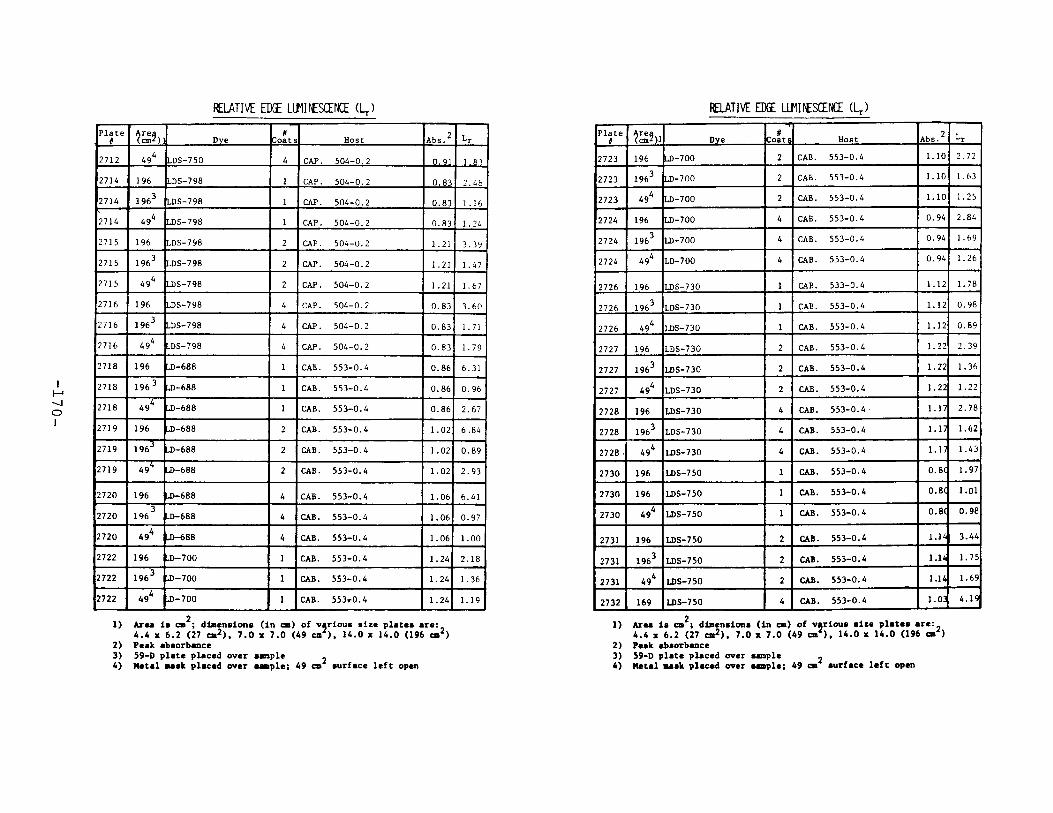


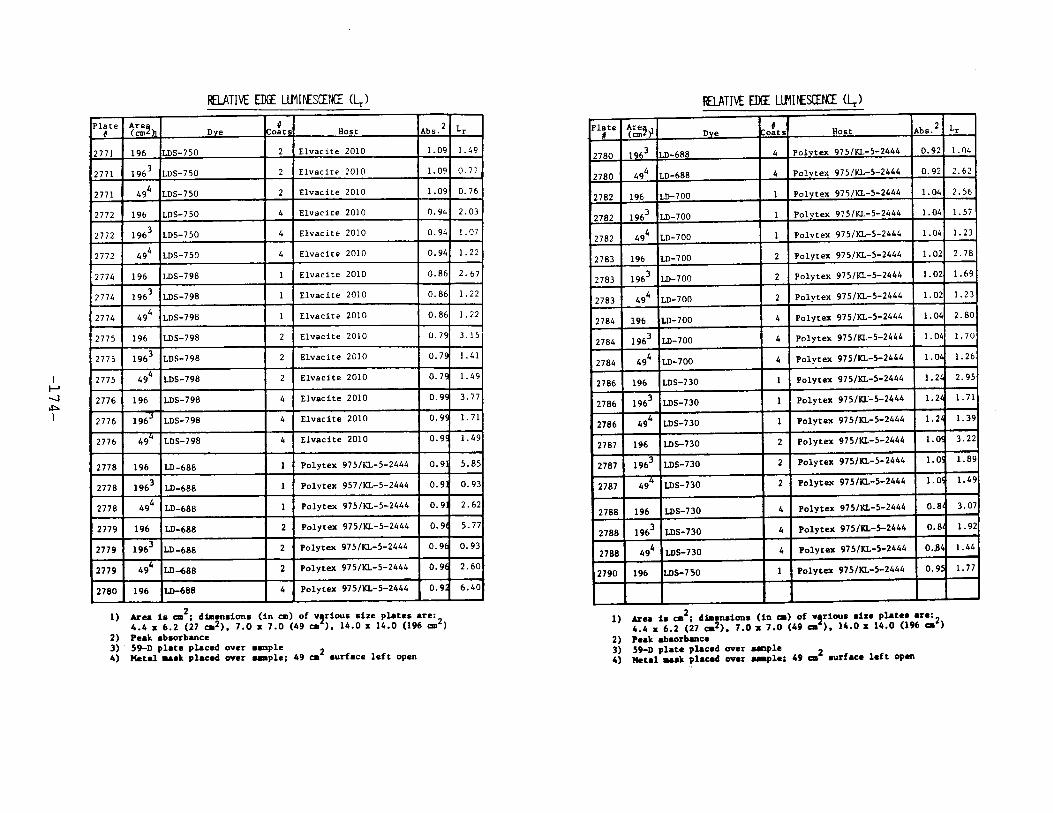
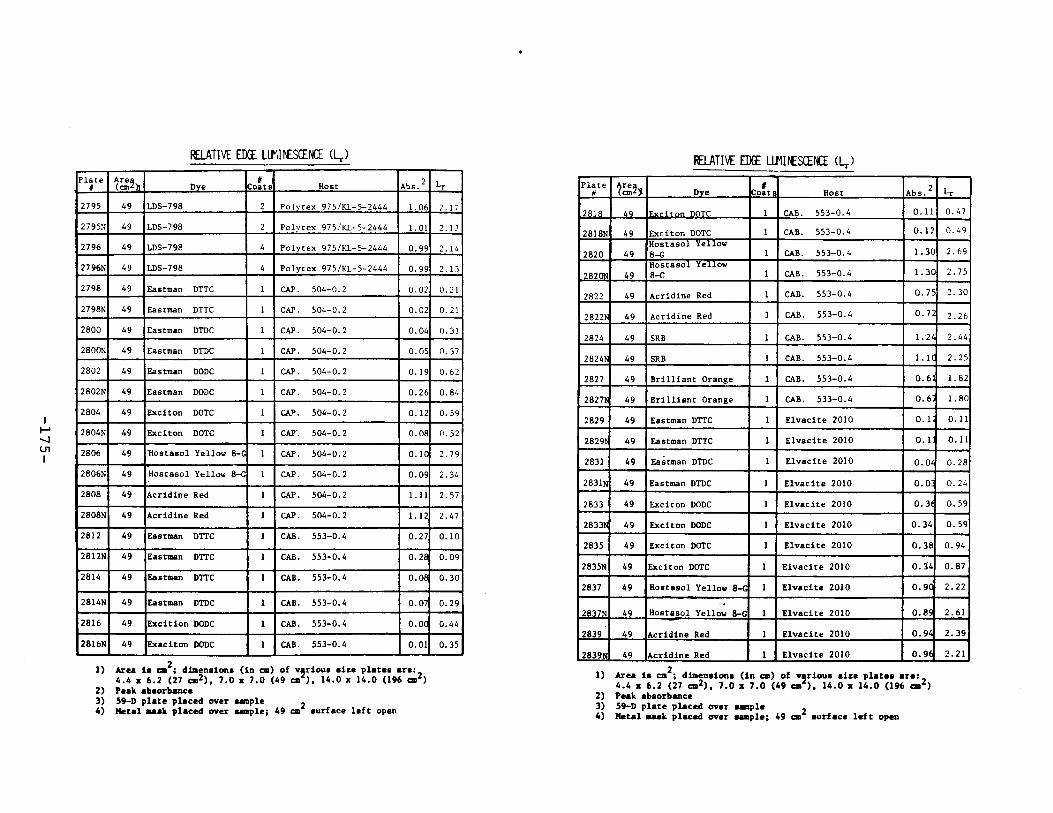
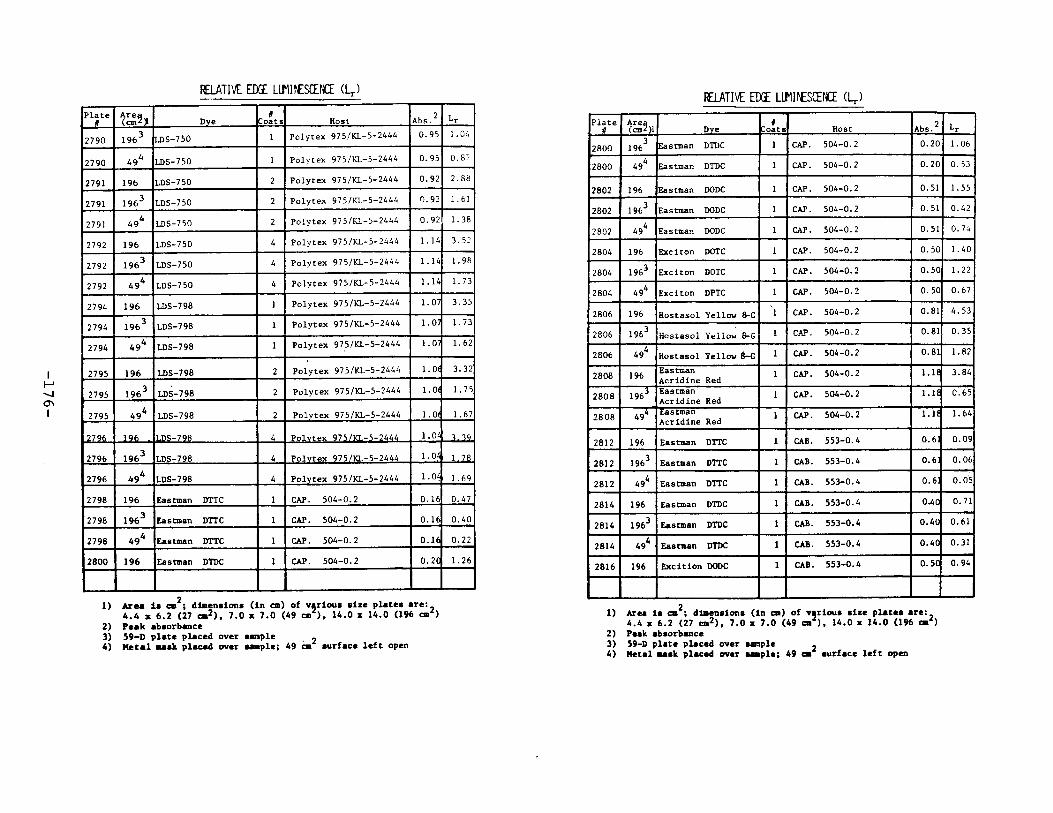
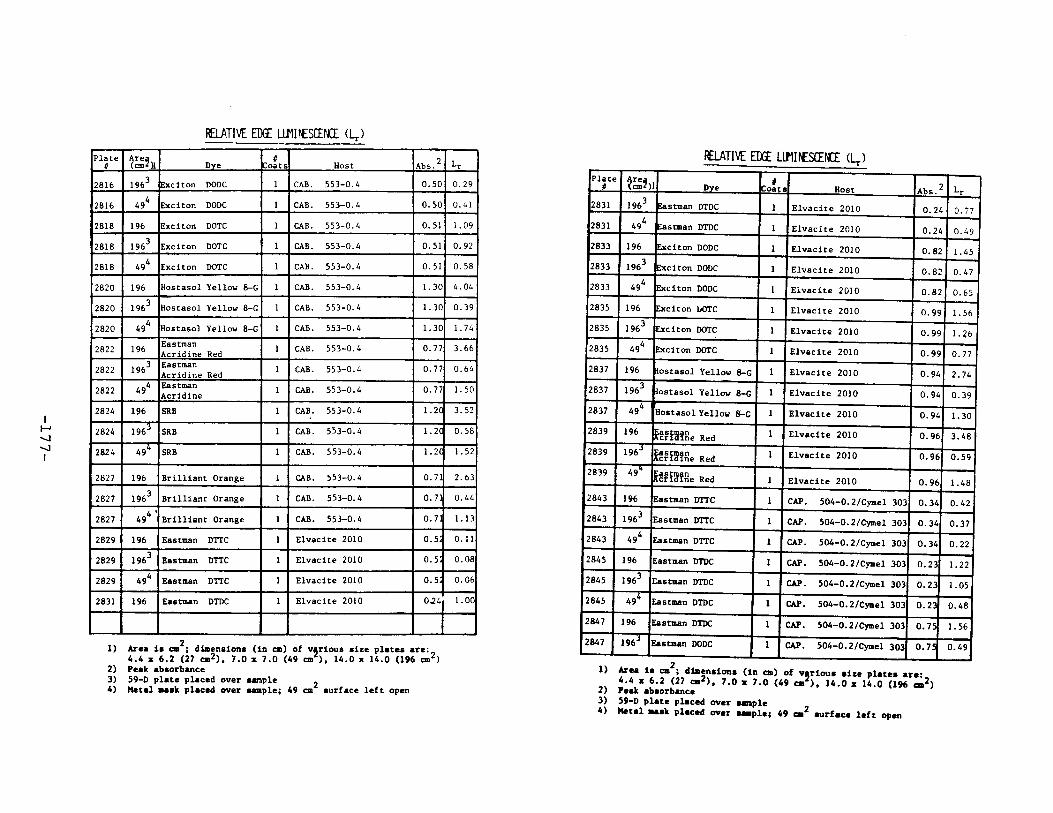


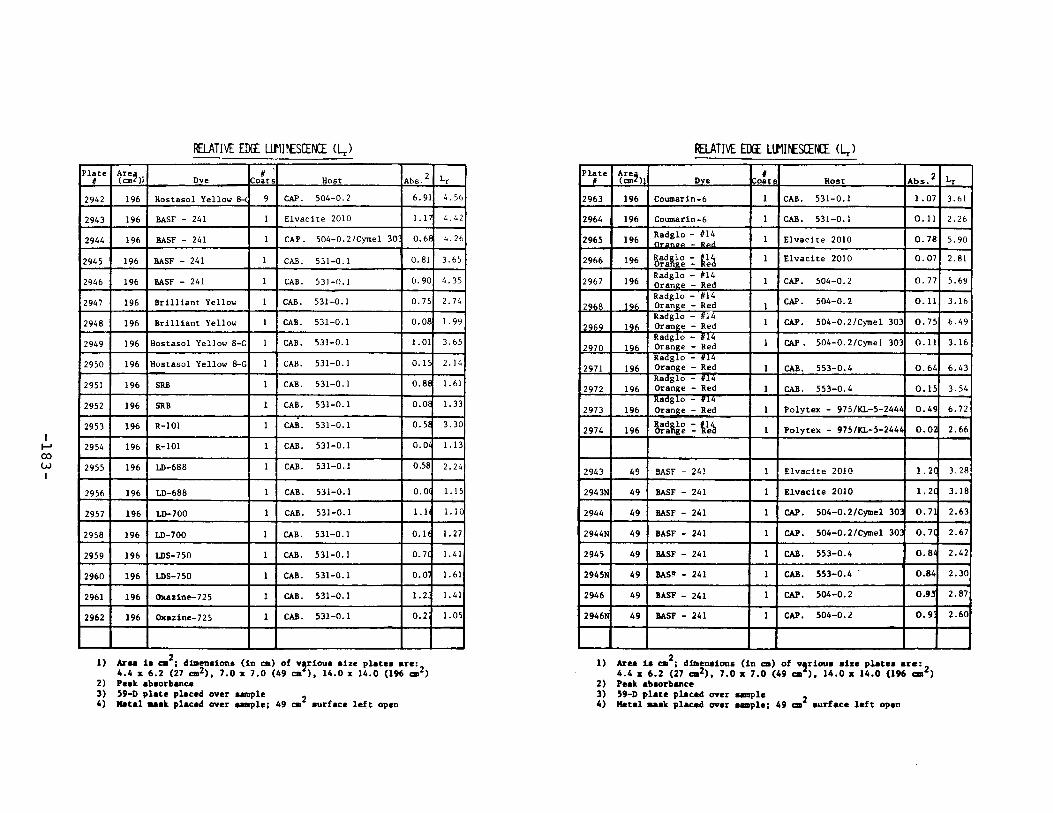


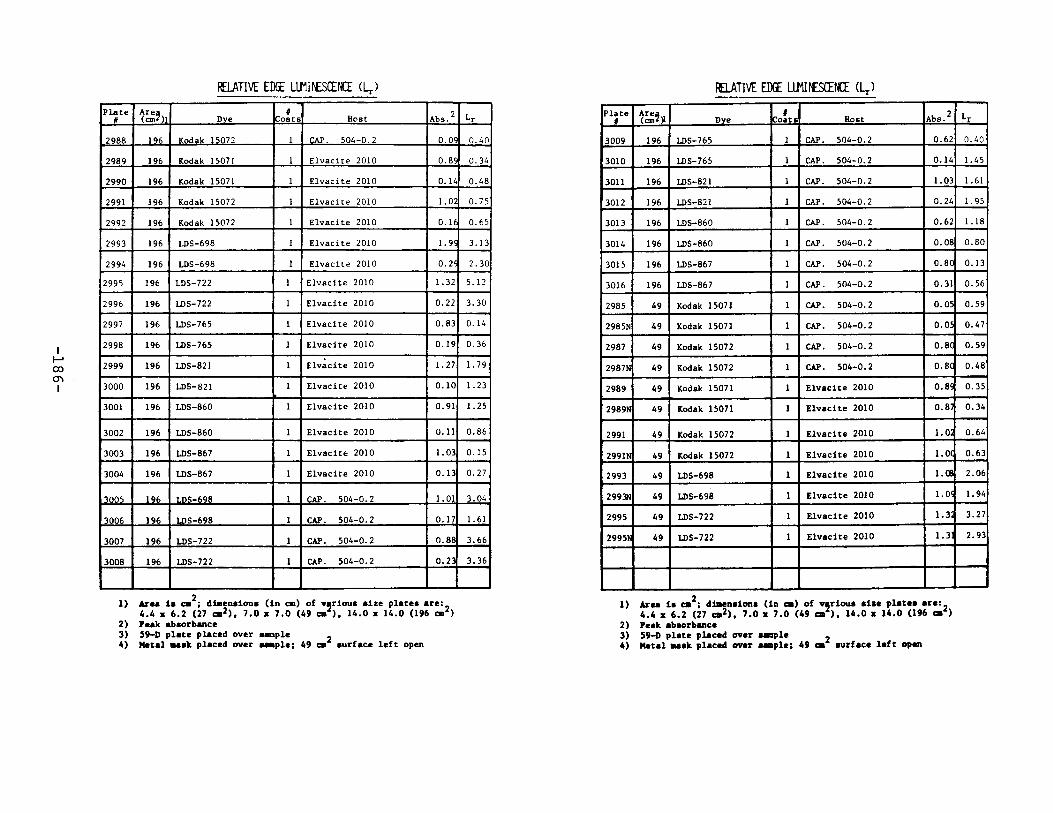
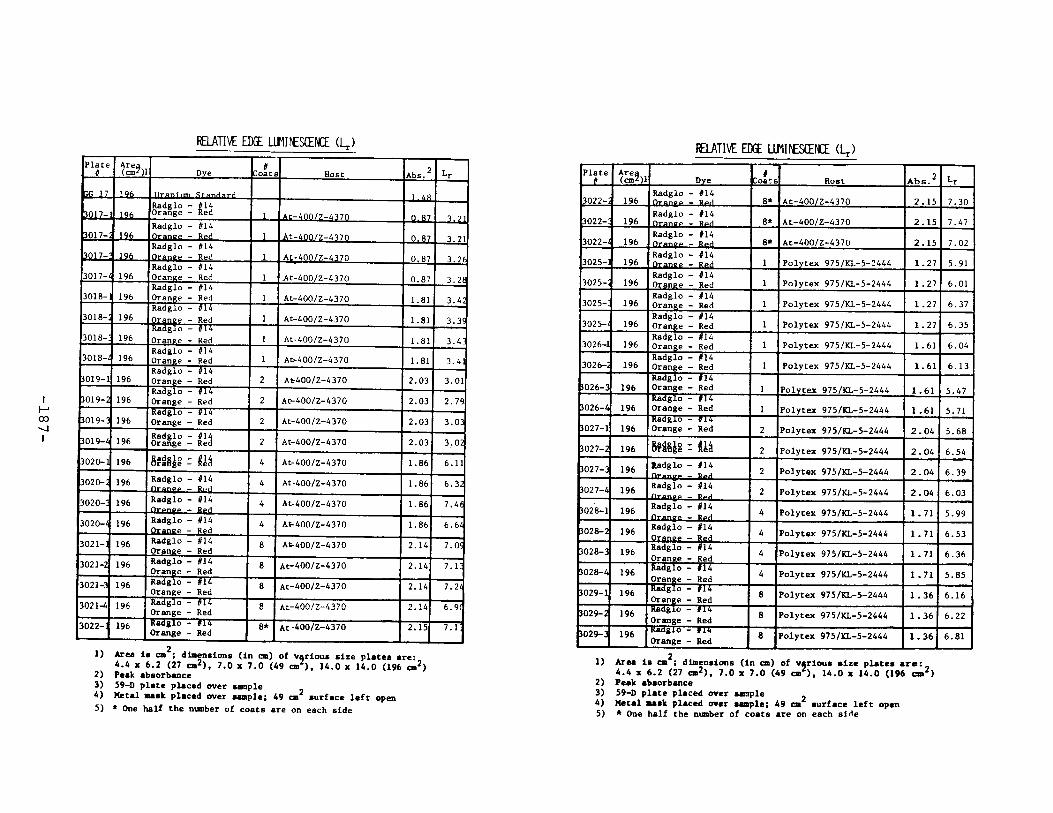
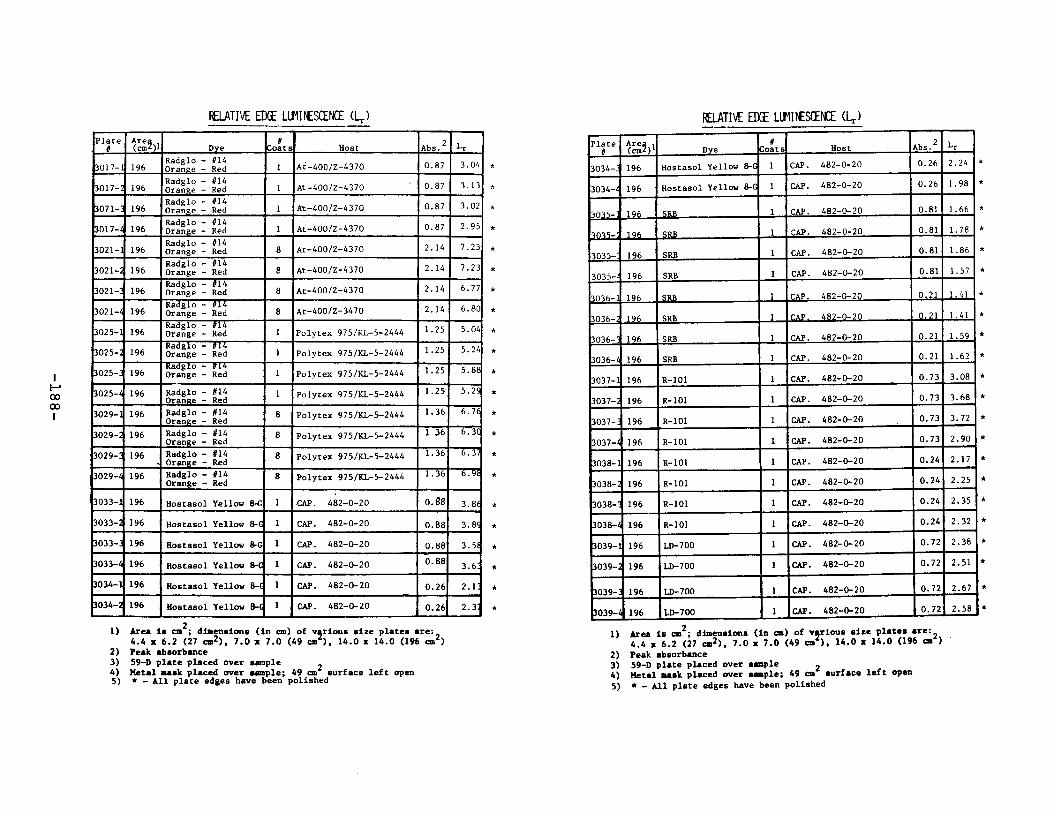

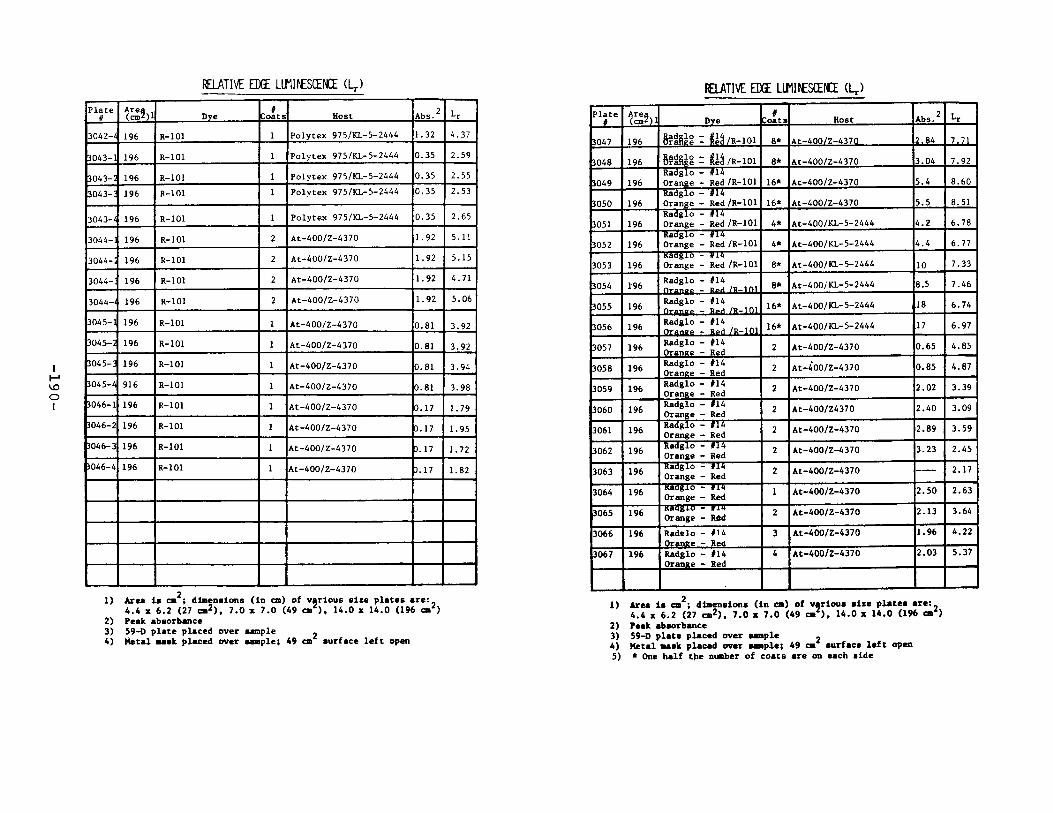

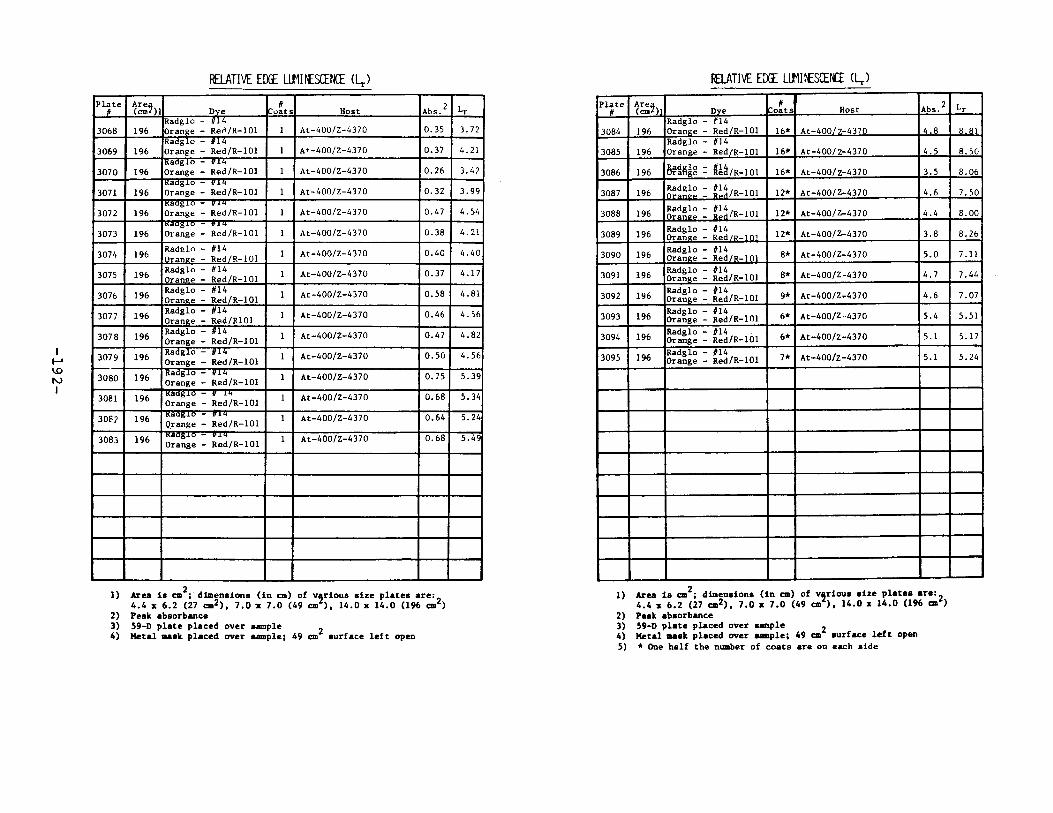

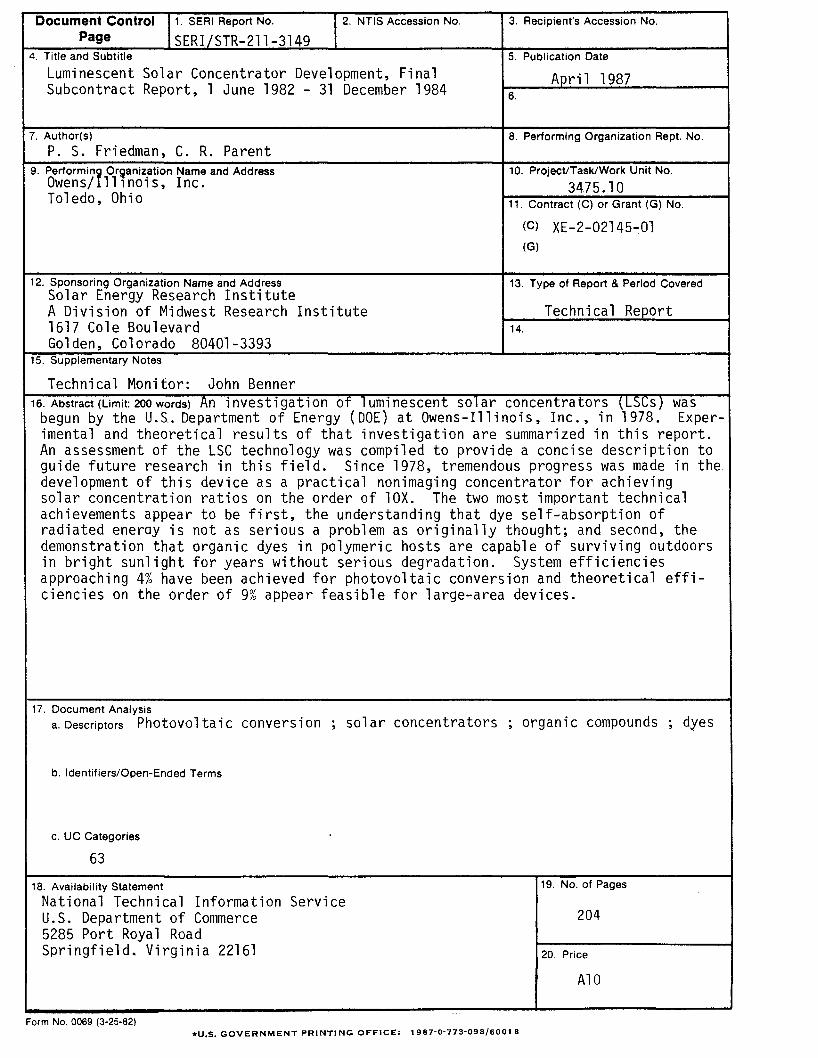
Document Control 11. SERI Report No. 12. NTIS Accession No.
Page SERI/STR-211-31494. Title and Subtitle
Luminescent Solar Concentrator Development, FinalSubcontract Report, 1 June 1982 - 31 December 1984
7. Author(s)
P. S. Friedman, C. R. Parent9. Performing Of!~anization Name and Address
Owens/llllnois, Inc.Toledo, Ohio
12. Sponsoring Organization Name and AddressSolar Energy Research InstituteA Division of Midwest Research Institute1617 Cole BoulevardGolden, Colorado 80401-3393
15. Supplementary Notes
Technical Monitor: John Benner
3. Recipient's Accession No.
5. Publication Date
Apri1 19876.
8. Performing Organization Rept. No.
10. Project/Task/Work Unit No.
3475.1011. Contract (C) or Grant (G) No.
(C) XE-2-02145-01(G)
13. Type of Report & Period Covered
Technical Report14.
16. Abstract (Limit: 200 words) An investigation of luminescent solar concentrators t_LSCs) wasbegun by the U.S.. Department of Energy (DOE) at Owens-Illinois, Inc . , in 1978. Experimental and theoretical results of that investigation are summarized in this report.An assessment of the LSC technology was compiled to provide a concise description toguide future research in this field. Since 1978, tremendous progress was made in thedevelopment of this device as a practical nonimaging concentrator for achievingsolar concentration ratios on the order of lOX. The two most important technicalachievements appear to be first, the understanding that dye self-absorption ofradiated eneray is not as serious a problem as originally thought; and second, thedemonstration that organic dyes in polymeric hosts are capable of surviving outdoorsin bright sunlight for years without serious degradation. System efficienciesapproaching 4% have been achieved for photovoltaic conversion and theoretical efficiencies on the order of 9% appear feasible for large-area devices.
17. Document Analysisa.Descriptors Photovoltaic conversion; solar concentrators, organic compounds; dyes
b. Identifiers/Open-Ended Terms
c. UC Categories
63
18. Availability Statement
National Technical Information ServiceU.S. Department of Commerce5285 Port Royal RoadSpringfield. Virginia 22161
- -
Form No. 0069 (3-25-82)*U.S. GOVERNMENT PRINTI NG OFFICE: 1987-0-773-098/60018
19. No. of Pages
204
20. Price
A10

![Multistate Luminescent Solar Concentrator “Smart” Windows · K160 dye in a pure planar cell or polymerized LC film has an order parameter around 0.5.[5,20] It should be noted](https://static.fdocuments.in/doc/165x107/5f2667f406c35b251b72adb0/multistate-luminescent-solar-concentrator-aoesmarta-windows-k160-dye-in-a-pure.jpg)