
Lugo-Palacios, DG; Cairns, J (2015) Using ambulatory care...
38
Lugo-Palacios, DG; Cairns, J (2015) Using ambulatory care sensitive hospitalisations to analyse the effectiveness of primary care services in Mexico. Social science & medicine (1982), 144. pp. 59-68. ISSN 0277-9536 DOI: https://doi.org/10.1016/j.socscimed.2015.09.010 Downloaded from: http://researchonline.lshtm.ac.uk/2305349/ DOI: 10.1016/j.socscimed.2015.09.010 Usage Guidelines Please refer to usage guidelines at http://researchonline.lshtm.ac.uk/policies.html or alterna- tively contact [email protected]. Available under license: http://creativecommons.org/licenses/by-nc-nd/2.5/
Transcript of Lugo-Palacios, DG; Cairns, J (2015) Using ambulatory care...
Lugo-Palacios, DG; Cairns, J (2015) Using ambulatory care sensitivehospitalisations to analyse the effectiveness of primary care servicesin Mexico. Social science & medicine (1982), 144. pp. 59-68. ISSN0277-9536 DOI: https://doi.org/10.1016/j.socscimed.2015.09.010
Downloaded from: http://researchonline.lshtm.ac.uk/2305349/
DOI: 10.1016/j.socscimed.2015.09.010
Usage Guidelines
Please refer to usage guidelines at http://researchonline.lshtm.ac.uk/policies.html or alterna-tively contact [email protected].
Available under license: http://creativecommons.org/licenses/by-nc-nd/2.5/
Accepted Manuscript
Using ambulatory care sensitive hospitalisations to analyse the effectiveness ofprimary care services in Mexico
David G. Lugo-Palacios, John Cairns
PII: S0277-9536(15)30115-5
DOI: 10.1016/j.socscimed.2015.09.010
Reference: SSM 10246
To appear in: Social Science & Medicine
Received Date: 20 March 2015
Revised Date: 20 August 2015
Accepted Date: 6 September 2015
Please cite this article as: Lugo-Palacios, D.G., Cairns, J., Using ambulatory care sensitivehospitalisations to analyse the effectiveness of primary care services in Mexico, Social Science &Medicine (2015), doi: 10.1016/j.socscimed.2015.09.010.
This is a PDF file of an unedited manuscript that has been accepted for publication. As a service toour customers we are providing this early version of the manuscript. The manuscript will undergocopyediting, typesetting, and review of the resulting proof before it is published in its final form. Pleasenote that during the production process errors may be discovered which could affect the content, and alllegal disclaimers that apply to the journal pertain.
MANUSCRIP
T
ACCEPTED
ACCEPTED MANUSCRIPT
Social Science & Medicine manuscript number: SSM-D-15-00757
Title: Using ambulatory care sensitive hospitalisations to analyse the effectiveness
of primary care services in Mexico
Authors: David G. Lugo-Palacios and John Cairns
Authors Affiliations: Department of Health Services Research and Policy, London
School of Hygiene and Tropical Medicine, 15-17 Tavistock Place, London WC1H
9SH, United Kingdom.
Corresponding author: David G. Lugo-Palacios ([email protected]).
Acknowledgements: We are grateful with Mariana Barraza-Lloréns for her valuable
comments and with Sebastián García-Saisó from the Ministry of Health for providing
the hospital characteristics database. We also thank the journal's referees for their
constructive comments. We acknowledge the financial support from the Mexican
Consejo Nacional de Ciencia y Tecnología (CONACyT).
MANUSCRIP
T
ACCEPTED
ACCEPTED MANUSCRIPT
1
Using ambulatory care sensitive hospitalisations to analyse the
effectiveness of primary care services in Mexico
Abstract
Ambulatory care sensitive hospitalisations (ACSH) have been widely used to study
the quality and effectiveness of primary care. Using data from 248 general hospitals
in Mexico during 2001-2011 we identify 926,769 ACSHs in 188 health jurisdictions
before and during the health insurance expansion that took place in this period, and
estimate a fixed effects model to explain the association of the jurisdiction ACSH rate
with patient and community factors. National ACSH rate increased by 50%, but
trends and magnitude varied at the jurisdiction and state level. We find strong
associations of the ACSH rate with socioeconomic conditions, health care supply
and health insurance coverage even after controlling for potential endogeneity in the
rolling out of the insurance programme. We argue that the traditional focus on the
increase/decrease of the ACSH rate might not be a valid indicator to assess the
effectiveness of primary care in a health insurance expansion setting, but that the
ACSH rate is useful when compared between and within states once the variation in
insurance coverage is taken into account as it allows the identification of differences
in the provision of primary care. The high heterogeneity found in the ACSH rates
suggests important state and jurisdiction differences in the quality and effectiveness
of primary care in Mexico.
Keywords: Mexico; ambulatory care sensitive hospitalisations; primary care; quality;
instrumental variables.
MANUSCRIP
T
ACCEPTED
ACCEPTED MANUSCRIPT
2
I. Introduction
Timely, effective and high-quality primary care services can prevent the development
or exacerbation of certain health conditions which may lead to hospitalisations.
These avoidable hospitalisations - ambulatory care sensitive hospitalisations
(ACSHs) - have been widely used to study the access to, quality and effectiveness of
primary care services, typically in high-income countries (Agency for Healthcare
Research and Quality, 2013; Ansari, 2007; Caminal, Starfield, Sánchez,
Casanova, & Morales, 2004; Finegan, Gao, Pasquale, & Campbell, 2010). This
paper analyses ACSHs before and during the health insurance expansion in Mexico,
thus adding to studies of the behaviour of ACSHs in countries where efforts to
expand the primary care coverage have been made (Macinko et al., 2011; Saha,
Solotaroff, Oster, & Bindman, 2007) .
The Mexican healthcare system comprises a public and a private sector. The public
sector is divided into two segments: workers in the formal labour market and their
dependents (insured population) covered by social security institutions financed
mostly by payroll taxes; and, non-salaried workers, unemployed, self-employed and
informal sector workers (uninsured population) receiving health care offered by non-
social security institutions financed mainly by the federal government from general
revenues. Social security institutions provide complete medical care, including
prescribed drugs, without any copayment. On the other hand, until 2003, the
uninsured population needed to pay utilisation fees out-of-pocket (with the possibility
of incurring catastrophic expenditures) in order to receive basic ambulatory care at
rural clinics and a more complete set of interventions in the biggest cities. Users of
MANUSCRIP
T
ACCEPTED
ACCEPTED MANUSCRIPT
3
the private health services belong both to the insured and to the uninsured
population; they receive medical care in heterogeneous private hospitals and
medical clinics financed mainly with out-of-pocket expenditure, but also through
private insurance companies.
In 2003, Mexico conducted a major health reform that gradually offered, through the
Seguro Popular (SP) programme operated by the 32 state health ministries, free
access to an explicit package of health care interventions to more than 50 million
population not covered by any other public insurance scheme (described as
uninsured). By 2012, the package included 284 interventions covering almost 100%
of the primary level demand and 85% of the hospitalisation and surgery demands
(Comision Nacional de Protección Social en Salud, 2 012). Since the reform,
Mexico has made substantial advances in terms of health insurance coverage and
financial protection (Knaul et al., 2012). With almost half of the Mexican population
affiliated to SP and the rest being covered by the public social security institutions,
Mexico declared universal health coverage in 2012.
While a fall in the ACSH rate might be expected following the reform, given the
increase in the funding for the provision of primary care, opposing forces may
prevent this fall. First, even when new resources were transferred from the
federation to the states, the rules for budget allocation within the states (i.e. health
jurisdictions, hospitals, primary care centres) seem to have remained unchanged
hindering major changes in the way primary care is delivered. Second, as a result of
the increase in coverage, the workload of primary care providers boomed. Since
primary care providers are salaried and are not responsible for health outcomes or
for further health care expenses, they do not necessarily have adequate incentives
to provide appropriate care (under the assumption that providing high-quality health
MANUSCRIP
T
ACCEPTED
ACCEPTED MANUSCRIPT
4
care services is both time consuming and costly, at least in terms of effort).
Therefore, primary care workers might provide poor quality services, refer patients to
specialists or hospitalise them in order to manage the increasing demand for primary
care services. Third, accessing hospital care via the emergency services is still
relatively easy. Fourth, it could be difficult to avoid hospitalisations for patients with
limited access to appropriate care before the implementation of the reform, thereby
when the reform lowered barriers to health care their condition might have worsened
to the point that the hospitalisation might not be avoidable anymore. The
increase/decrease of the ACSH rate would still be a valid effectiveness and quality
indicator if the first three forces are present, but not necessarily if the latter is also
preventing a fall in this indicator, since ensuring the provision of appropriate care to
the previously uninsured was outside the control of the primary care team.
Therefore, the two main objectives of this paper are 1) to identify the ACSH rate in
health jurisdictions focusing on the differences in the magnitude and trend of ACSHs
between and within states before and during the health insurance expansion in
Mexico; and, 2) to explore the association of this indicator with aggregated patient
and community factors. In doing this it is acknowledged that the traditional focus on
changes in the ACSH rate as an indicator of the effectiveness of primary care
services may not be valid when health insurance coverage is expanding.
II. Literature Review
ACSHs have been studied using different approaches leading to different results
and, thus, literature findings are still not conclusive. Previous efforts have focused
mainly on describing the trends of ACSHs throughout different periods of time
(Ashton et al., 1999; Kozak, Hall, & Owings, 2001; Stranges & Stocks, 2010) and

MANUSCRIP
T
ACCEPTED
ACCEPTED MANUSCRIPT
5
on using econometric methods to identify associations of several variables with
these hospitalisations. Research on ACSHs has used three different units of
analysis: individuals, hospitals, and small geographic areas; the chosen approach
being mainly driven by data availability. In most ACSH studies, the authors associate
the increase or high levels of the ACSH rate with poor primary care.
Econometric analysis of ACSHs has been addressed using ordinary least squares
(Finegan et al., 2010; Laditka, Laditka, & Probst, 2005), logistic regressions
(Culler, Parchman, & Przybylski, 1998; Saha et al., 2007; Weissman, Gatsonis,
& Epstein, 1992) , and panel data models (Dusheiko, Doran, Gravelle, Fullwood,
& Roland, 2011) . When defining the model specification, Culler et al. and Finegan et
al. followed Andersen’s behavioural model and proposed that variation in this kind of
hospital utilisation is a function of an individual’s predisposing, enabling, and need
characteristics (Andersen & Davidson, 2007).
Literature has reached consensus on the importance of the association between
socioeconomic conditions and ACSHs. Most of the studies controlling by
socioeconomic status show that a higher income level is associated with a lower
ACSH rate (Bindman et al., 1995; Blustein, Hanson, & Shea, 19 98; Epstein,
2001; Finegan et al., 2010) . Contrary to this finding, with the introduction of two
variables controlling for the effect of income, Laditka et al. (2005) did not find a
significant effect for the proportion of low-income households and the county ACSH
rate, but showed that the proportion of high-income households has a positive and
significant effect; Culler et al. (1998) did not find a significant association between
ACSHs and income level, but possibly the effect of income was captured by the
variable measuring social vulnerability that had a positive effect on the probability of
having at least one ACSH.
MANUSCRIP
T
ACCEPTED
ACCEPTED MANUSCRIPT
6
Dusheiko et al. (2011) found that moving 10% of registered diabetic patients from
poor to good glycaemic control was associated with a 14% decrease in the rate of
emergency admissions for short term complications. Shi and Samuels (1999)
showed that individuals without a primary care physician in South Carolina were
more likely to be admitted for an ACSH.
Saha et al. (2007) is one of the few studies that have examined the change of
ACSHs after increasing access to care. They found that the ACSH rate rose after
expanding Medicaid coverage in Oregon, USA. They discussed several explanations
for this increase such as easier access to inpatient care, potential decrease in the
patients’ threshold for seeking care and in the physicians’ threshold for admitting
them, sufficient health decline for those lacking timely receipt of care while
uninsured, and data-related biases. Macinko et al. (2011) analysed ACSHs after the
rolling out of a community-based primary care programme in Brazil and found that
the ACSH rate declined by about a third in 1999-2007.
The current study contributes to this literature by analysing the behaviour of the
ACSH rate for a large population located in areas experiencing different and
increasing health insurance coverage rates and examines changes in the ACSH rate
as this coverage expands. Furthermore, it challenges the traditional analysis of the
increase/decrease of the ACSH rate to measure the effectiveness of primary care
services in a health insurance expansion context and explores an alternative
interpretation of this indicator that could help to identify areas with primary care
systems performing less well than others.
III. Methods
MANUSCRIP
T
ACCEPTED
ACCEPTED MANUSCRIPT
7
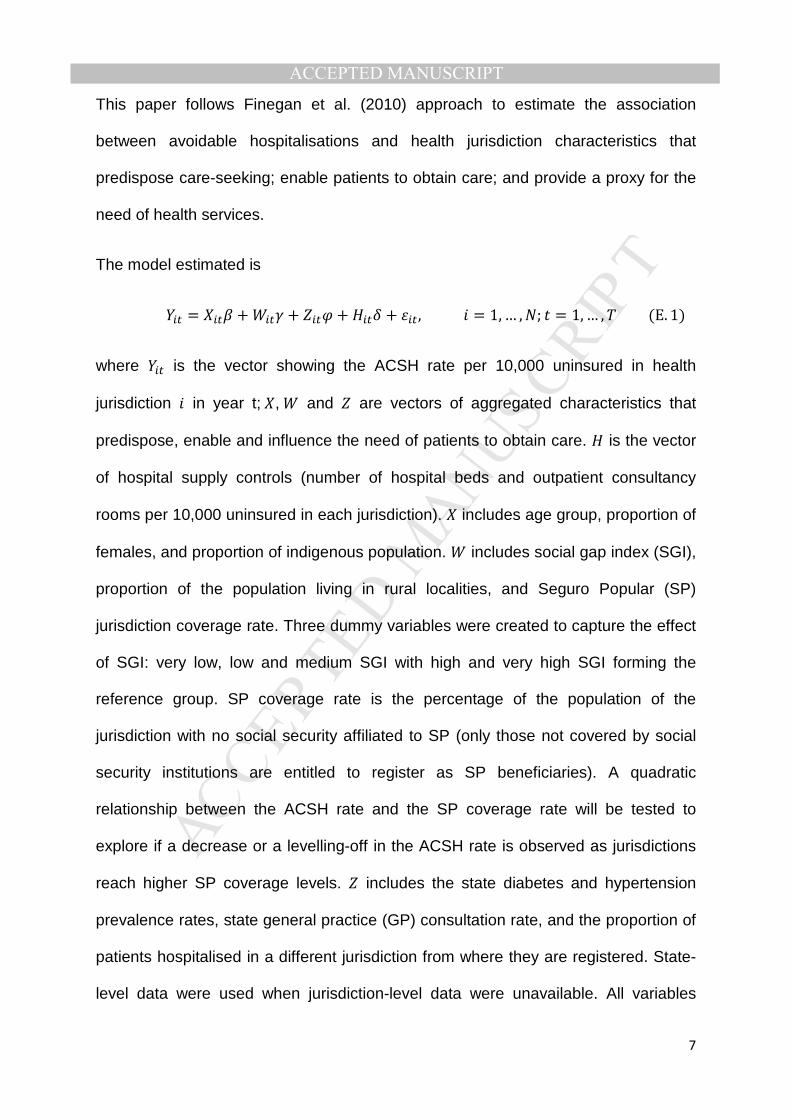
This paper follows Finegan et al. (2010) approach to estimate the association
between avoidable hospitalisations and health jurisdiction characteristics that
predispose care-seeking; enable patients to obtain care; and provide a proxy for the
need of health services.
The model estimated is
��� = ���� +�� + ���� + ��� + ���,� = 1,… ,�; � = 1,… , �(E. 1)
where ��� is the vector showing the ACSH rate per 10,000 uninsured in health
jurisdiction � in year t;�, and � are vectors of aggregated characteristics that
predispose, enable and influence the need of patients to obtain care. is the vector
of hospital supply controls (number of hospital beds and outpatient consultancy
rooms per 10,000 uninsured in each jurisdiction). � includes age group, proportion of
females, and proportion of indigenous population. includes social gap index (SGI),
proportion of the population living in rural localities, and Seguro Popular (SP)
jurisdiction coverage rate. Three dummy variables were created to capture the effect
of SGI: very low, low and medium SGI with high and very high SGI forming the
reference group. SP coverage rate is the percentage of the population of the
jurisdiction with no social security affiliated to SP (only those not covered by social
security institutions are entitled to register as SP beneficiaries). A quadratic
relationship between the ACSH rate and the SP coverage rate will be tested to
explore if a decrease or a levelling-off in the ACSH rate is observed as jurisdictions
reach higher SP coverage levels. � includes the state diabetes and hypertension
prevalence rates, state general practice (GP) consultation rate, and the proportion of
patients hospitalised in a different jurisdiction from where they are registered. State-
level data were used when jurisdiction-level data were unavailable. All variables

MANUSCRIP
T
ACCEPTED
ACCEPTED MANUSCRIPT
8
other than SP coverage rate and SGI are mean-centred and expressed per 10,000
population. �, , �, and � capture the effect of �,, �,and , respectively. Finally,
��� = �� + ��� is the disturbance of jurisdiction � composed of an unobservable
individual specific component �� and of an error component ���, independent across
time and across jurisdictions.
In Mexico, the provision of health care by public non-social security institutions is
decentralised to the state level. Within states the administrative units in charge of the
management and operation of primary care are health jurisdictions accountable to
state health ministries. Taking into account that health jurisdictions are at the heart of
primary care provision in Mexico, two units of analysis were chosen for this study:
health jurisdictions with at least one general hospital in their territory (hospital
jurisdictions) and health jurisdictions where hospitalised patients reside (origin
jurisdictions). While jurisdictions manage and operate primary care in their territories,
they do not necessarily administer hospital budgets as these may be defined directly
by state health ministries.
Both perspectives are relevant and have important advantages and disadvantages.
On the one hand, it is interesting to analyse the ACSH rate by hospital jurisdiction
since they are the administrative units where health resources were used to provide
this type of avoidable care that could otherwise had been used to provide more cost-
effective services. However, this perspective omits jurisdictions with no general
hospitals and overlooks that jurisdictions where ACSHs take place are not always
responsible for providing primary care services to the people suffering them. The
latter drawback is tackled by analysing ACSHs by origin jurisdictions; the major
disadvantage of this perspective is that not all these jurisdictions have comparable
controls for hospital supply since not all of them have a general hospital in their
MANUSCRIP
T
ACCEPTED
ACCEPTED MANUSCRIPT
9
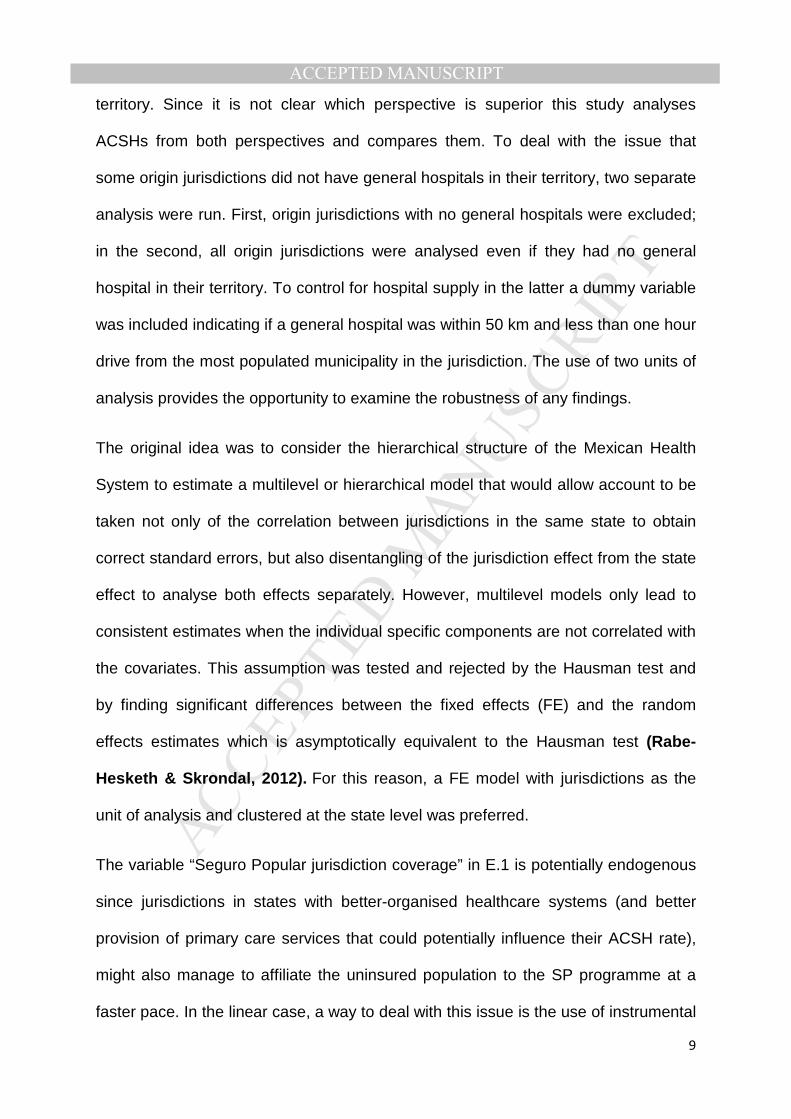
territory. Since it is not clear which perspective is superior this study analyses
ACSHs from both perspectives and compares them. To deal with the issue that
some origin jurisdictions did not have general hospitals in their territory, two separate
analysis were run. First, origin jurisdictions with no general hospitals were excluded;
in the second, all origin jurisdictions were analysed even if they had no general
hospital in their territory. To control for hospital supply in the latter a dummy variable
was included indicating if a general hospital was within 50 km and less than one hour
drive from the most populated municipality in the jurisdiction. The use of two units of
analysis provides the opportunity to examine the robustness of any findings.
The original idea was to consider the hierarchical structure of the Mexican Health
System to estimate a multilevel or hierarchical model that would allow account to be
taken not only of the correlation between jurisdictions in the same state to obtain
correct standard errors, but also disentangling of the jurisdiction effect from the state
effect to analyse both effects separately. However, multilevel models only lead to
consistent estimates when the individual specific components are not correlated with
the covariates. This assumption was tested and rejected by the Hausman test and
by finding significant differences between the fixed effects (FE) and the random
effects estimates which is asymptotically equivalent to the Hausman test (Rabe-
Hesketh & Skrondal, 2012). For this reason, a FE model with jurisdictions as the
unit of analysis and clustered at the state level was preferred.
The variable “Seguro Popular jurisdiction coverage” in E.1 is potentially endogenous
since jurisdictions in states with better-organised healthcare systems (and better
provision of primary care services that could potentially influence their ACSH rate),
might also manage to affiliate the uninsured population to the SP programme at a
faster pace. In the linear case, a way to deal with this issue is the use of instrumental
MANUSCRIP
T
ACCEPTED
ACCEPTED MANUSCRIPT
10
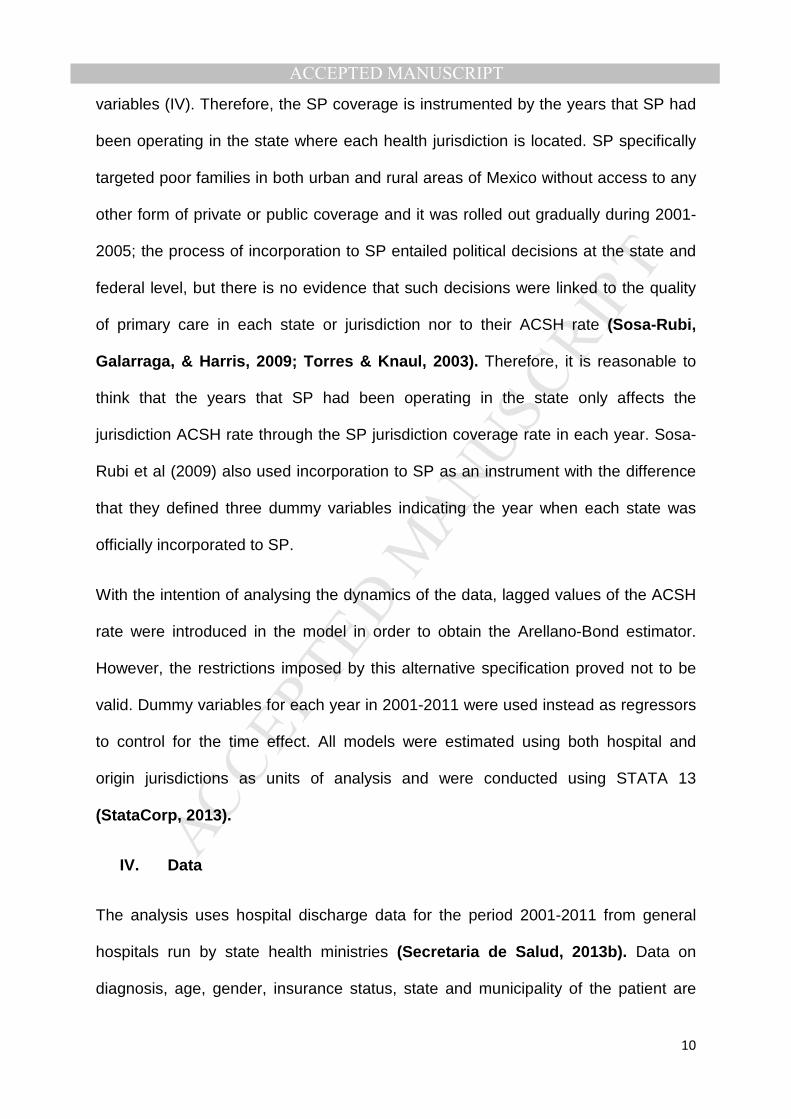
variables (IV). Therefore, the SP coverage is instrumented by the years that SP had
been operating in the state where each health jurisdiction is located. SP specifically
targeted poor families in both urban and rural areas of Mexico without access to any
other form of private or public coverage and it was rolled out gradually during 2001-
2005; the process of incorporation to SP entailed political decisions at the state and
federal level, but there is no evidence that such decisions were linked to the quality
of primary care in each state or jurisdiction nor to their ACSH rate (Sosa-Rubi,
Galarraga, & Harris, 2009; Torres & Knaul, 2003). Therefore, it is reasonable to
think that the years that SP had been operating in the state only affects the
jurisdiction ACSH rate through the SP jurisdiction coverage rate in each year. Sosa-
Rubi et al (2009) also used incorporation to SP as an instrument with the difference
that they defined three dummy variables indicating the year when each state was
officially incorporated to SP.
With the intention of analysing the dynamics of the data, lagged values of the ACSH
rate were introduced in the model in order to obtain the Arellano-Bond estimator.
However, the restrictions imposed by this alternative specification proved not to be
valid. Dummy variables for each year in 2001-2011 were used instead as regressors
to control for the time effect. All models were estimated using both hospital and
origin jurisdictions as units of analysis and were conducted using STATA 13
(StataCorp, 2013).
IV. Data
The analysis uses hospital discharge data for the period 2001-2011 from general
hospitals run by state health ministries (Secretaria de Salud, 2013b). Data on
diagnosis, age, gender, insurance status, state and municipality of the patient are
MANUSCRIP
T
ACCEPTED
ACCEPTED MANUSCRIPT
11
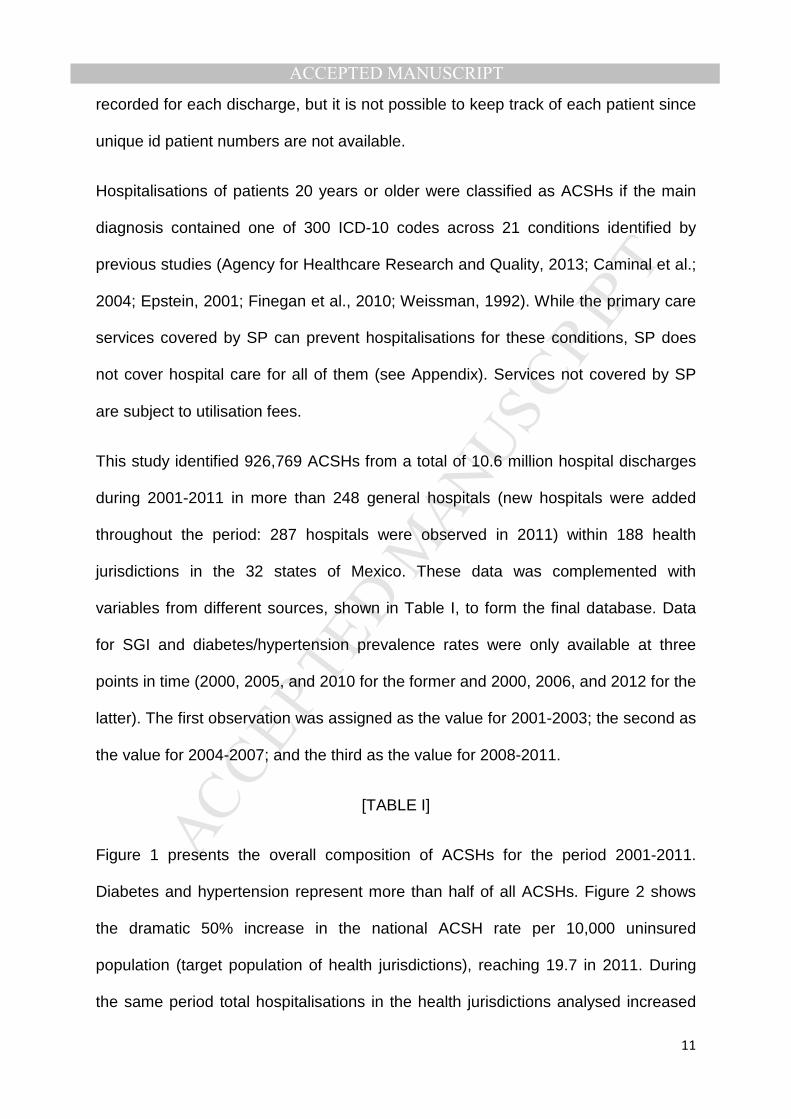
recorded for each discharge, but it is not possible to keep track of each patient since
unique id patient numbers are not available.
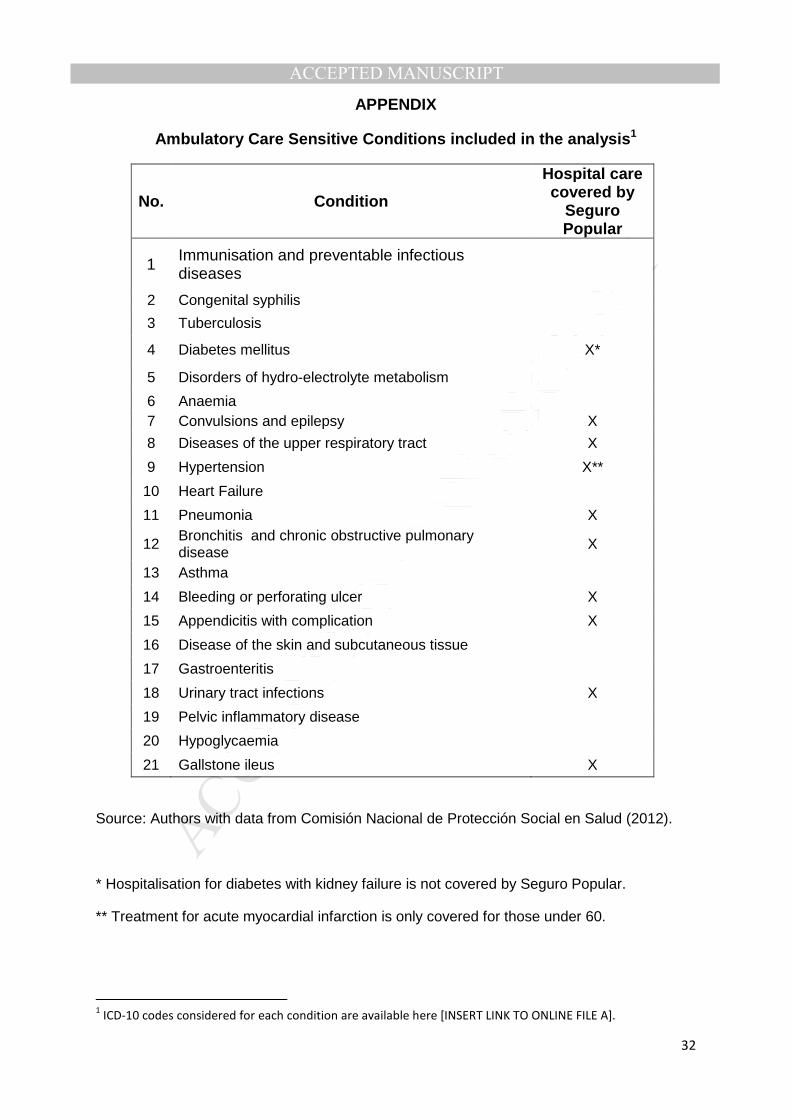
Hospitalisations of patients 20 years or older were classified as ACSHs if the main
diagnosis contained one of 300 ICD-10 codes across 21 conditions identified by
previous studies (Agency for Healthcare Research and Quality, 2013; Caminal et al.;
2004; Epstein, 2001; Finegan et al., 2010; Weissman, 1992). While the primary care
services covered by SP can prevent hospitalisations for these conditions, SP does
not cover hospital care for all of them (see Appendix). Services not covered by SP
are subject to utilisation fees.
This study identified 926,769 ACSHs from a total of 10.6 million hospital discharges
during 2001-2011 in more than 248 general hospitals (new hospitals were added
throughout the period: 287 hospitals were observed in 2011) within 188 health
jurisdictions in the 32 states of Mexico. These data was complemented with
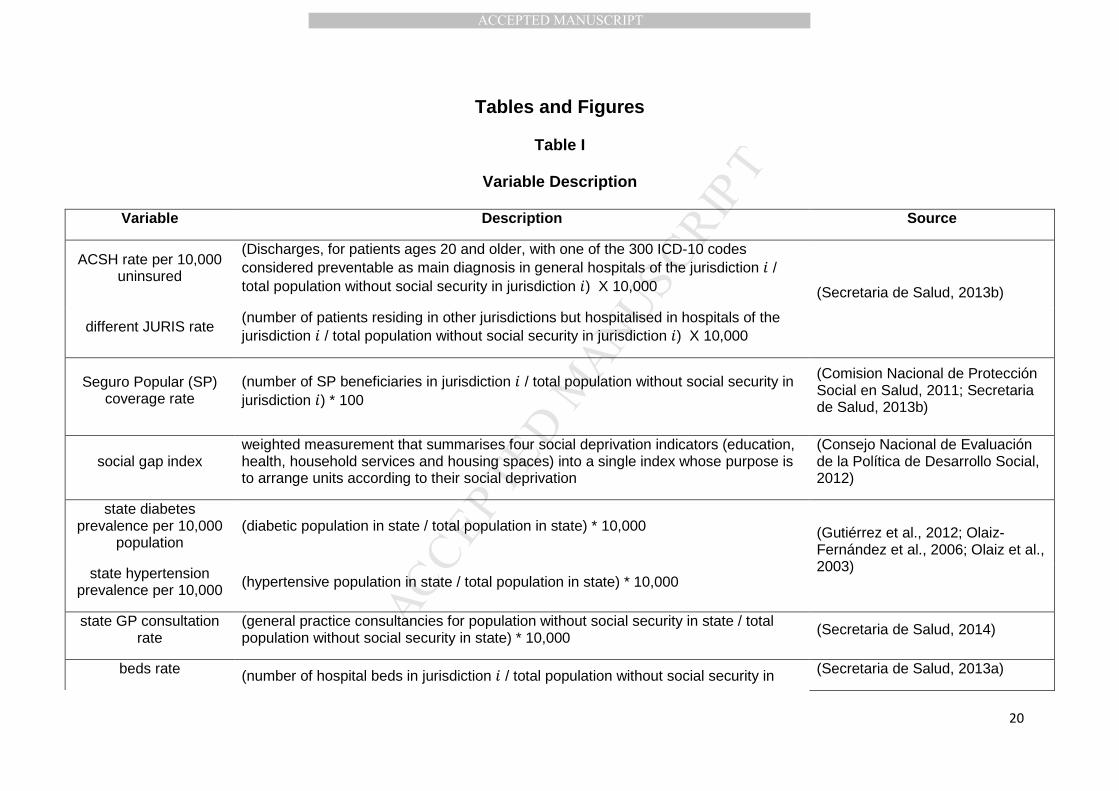
variables from different sources, shown in Table I, to form the final database. Data
for SGI and diabetes/hypertension prevalence rates were only available at three
points in time (2000, 2005, and 2010 for the former and 2000, 2006, and 2012 for the
latter). The first observation was assigned as the value for 2001-2003; the second as
the value for 2004-2007; and the third as the value for 2008-2011.
[TABLE I]
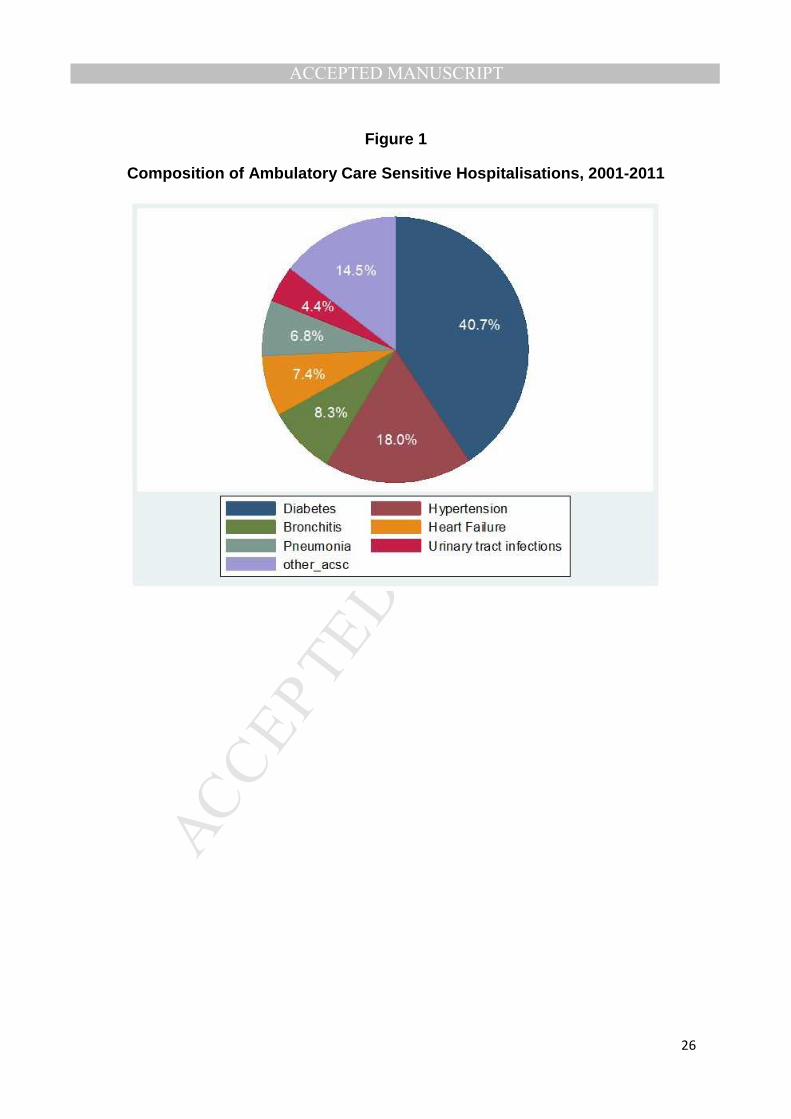
Figure 1 presents the overall composition of ACSHs for the period 2001-2011.
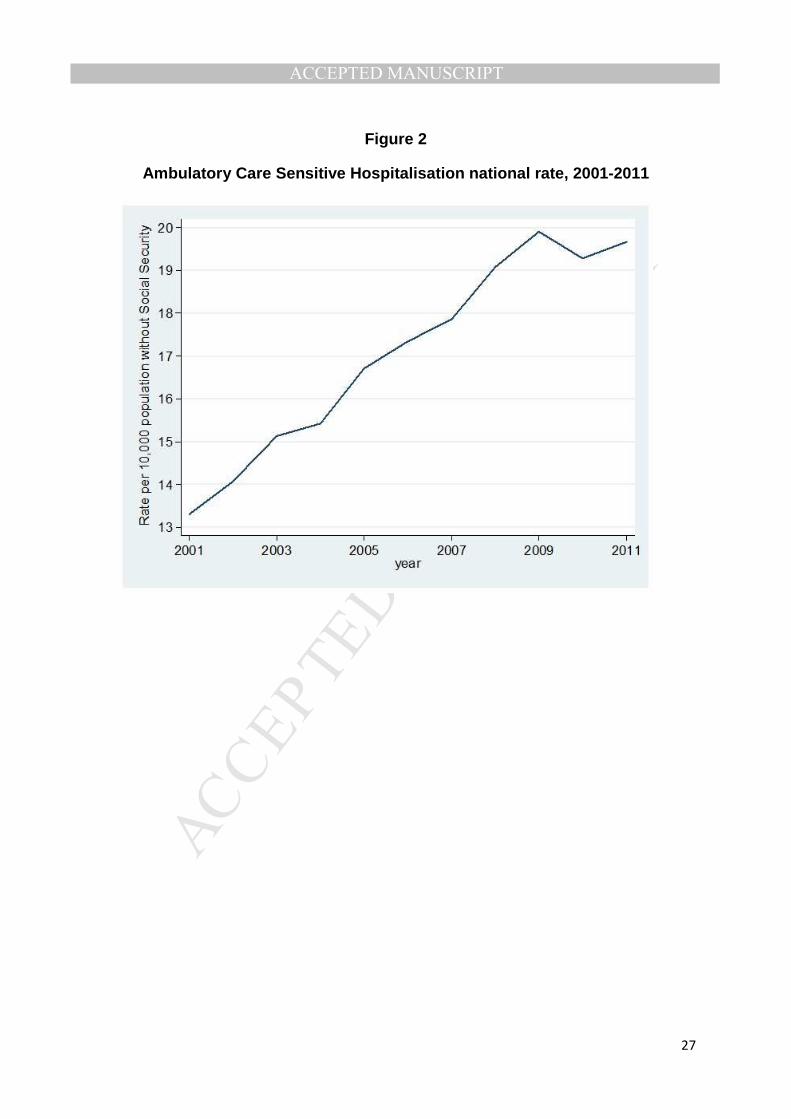
Diabetes and hypertension represent more than half of all ACSHs. Figure 2 shows
the dramatic 50% increase in the national ACSH rate per 10,000 uninsured
population (target population of health jurisdictions), reaching 19.7 in 2011. During
the same period total hospitalisations in the health jurisdictions analysed increased
MANUSCRIP
T
ACCEPTED
ACCEPTED MANUSCRIPT
12
by 42.5%. Measured as the proportion of total hospitalisations, ACSHs rose by 3.8%
overall, after an initial increase of 10.3% during 2001-2005 followed by a decline of
5.9% in 2005-2011.
[FIGURE 1]
[FIGURE 2]
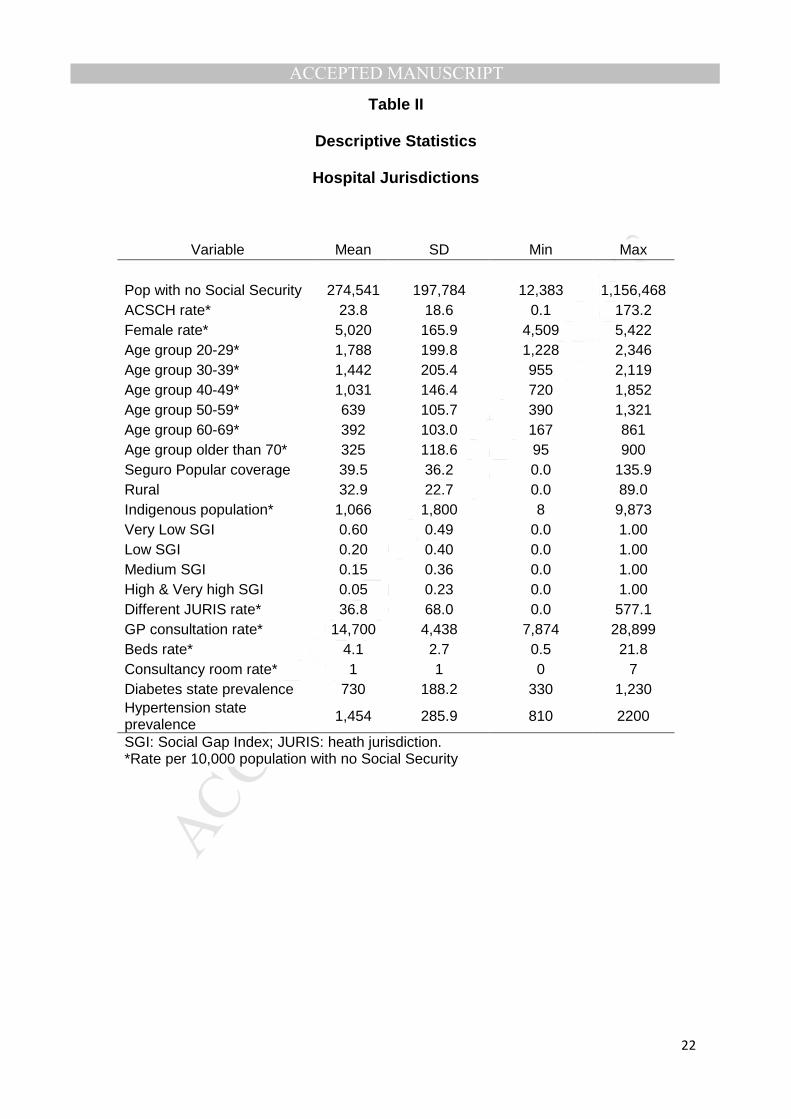
Table II shows the descriptive statistics for the 188 health jurisdictions included in the
hospital jurisdiction analysis (home to approximately 53.2 million uninsured
Mexicans). For some jurisdictions the SP coverage rate has values over 100%.
However, this is not surprising since previous studies have documented multiple
coverage among SP beneficiaries (Fundación Mexicana para la Salud, 2012). The
high proportion of jurisdictions with very low SGI may reflect that only health
jurisdictions with at least one general hospital were analysed and usually general
hospitals tend to be located in jurisdictions with better socioeconomic conditions than
the ones without a general hospital, but also that the jurisdictional SGI was obtained
as a weighted average of the SGI of all the municipalities in the jurisdiction. Forty
four jurisdictions were excluded from the hospital jurisdiction analysis. The reasons
for excluding them were either because they did not have a general hospital in their
territory or because general hospitals in the jurisdiction changed their classification
during the period studied and in one case because the general hospital in the
jurisdiction was inside a prison. In general, the excluded jurisdictions are less
populous and have higher rate of uninsured population, lower SP coverage rate,
higher percentage of rural population, and higher SGI indices. When changing the
unit of analysis from origin jurisdictions to hospital jurisdictions, there is no loss in the
number of hospitalisations only in the number of jurisdictions: origin jurisdictions with
no general hospitals are not included in the hospital jurisdiction analysis but patients

MANUSCRIP
T
ACCEPTED
ACCEPTED MANUSCRIPT
13
with ACSHs coming from these jurisdictions are classified in jurisdictions where the
hospitalisation occurred.
[TABLE II]
V. Results
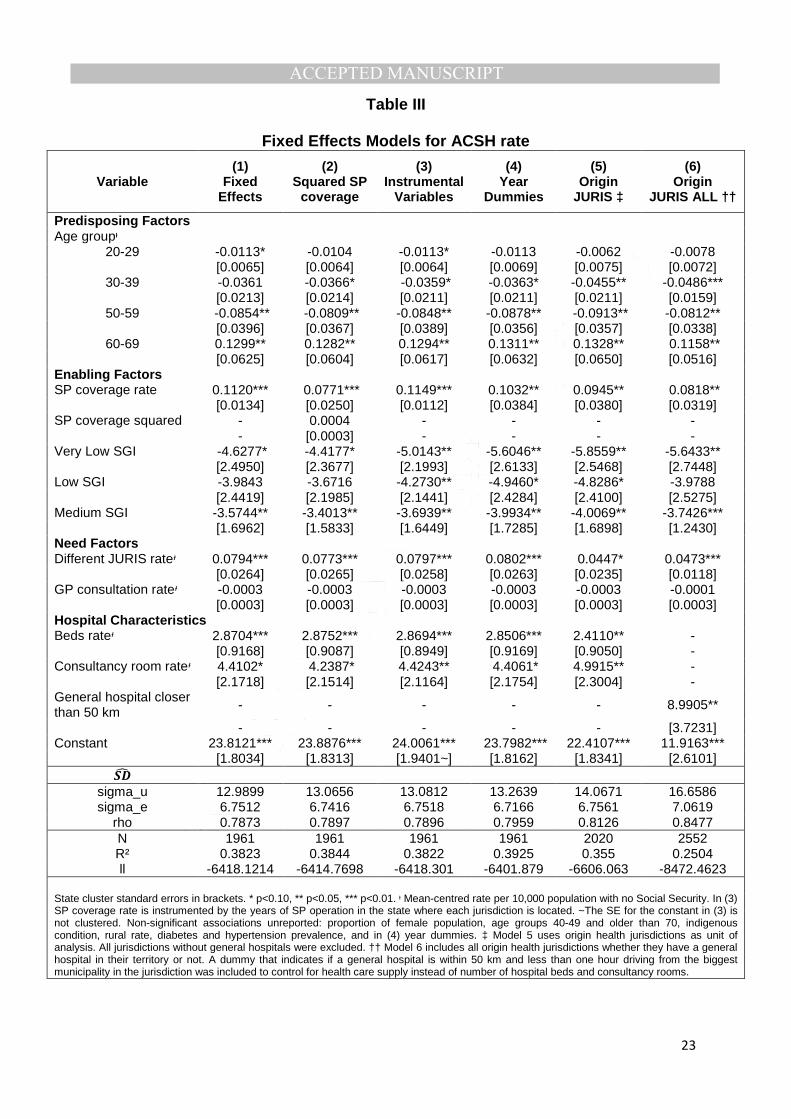
Table III reports the main results of the models described above. The FE and the IV
model from the origin jurisdictions perspective are not reported, but they are
available from the authors upon request. The estimates are robust for different
specifications and a likelihood ratio test indicates that model 4 is preferred to model
1 (χ2(10) statistic = 32.48). As expected, since chronic conditions are the most prevalent
causes of ACSHs, the younger age groups have a negative association with ACSHs
while this relation is positive for the older age groups. With the exception of the
proportion of the population living in rural localities, enabling factors show a strong
association with the ACSH rate: the higher the jurisdiction SGI and the higher the SP
jurisdiction coverage rate, the higher the ACSH jurisdiction rate. A quadratic
relationship between the ACSH rate and the SP coverage rate was discarded in
model 2. It is worth noting that the strongest association is between SGI and the
ACSH rate. The estimated coefficient for SP coverage changed only slightly after an
explicit control for the effect of time is introduced (model 4); in the models where
origin jurisdictions are the unit of analysis (models 5 and 6) the estimated coefficients
are within the 95 per cent confidence interval for those estimated in model 4. The
individual estimates for each year dummy variable in models 4-6 are not reported in
Table III but they show an increasing association, for example in model 4 it goes
from 1.2 in 2003 to 3.3 in 2009 (although not always significantly different from 2001,
the reference year).
MANUSCRIP
T
ACCEPTED
ACCEPTED MANUSCRIPT
14
[TABLE III]
An important relationship between hospital supply in health jurisdictions and ACSH
rate was also found; having one consultancy room more than the mean per 10,000
uninsured is associated with more than 4 additional ACSHs per 10,000 uninsured.
One unit deviation from the mean of hospital beds per 10,000 uninsured is
associated with an additional 2.9 ACSHs per 10,000 uninsured. The latter remains
significant and with a similar magnitude in model 5. Regarding the coefficient of
consultancy rooms, it remained significantly different from zero in all the models
where it was included. It can be observed that in model 6 having a general hospital
less than 50 km and one hour drive away has the highest association with the ACSH
rate. Model 6 does not include the same hospital supply controls previously used
because these were perfectly correlated for the jurisdictions with no general
hospitals and the availability of a general hospital within 50 km seems to be a more
relevant supply variable in this case.
Table III displays a positive association between the rate of hospitalised patients
coming from different jurisdictions and the ACSH rate. This variable controls for the
proportion of patients seeking care in a different jurisdiction from the one in which
they live for a condition that should have been managed at the primary level that will
be expected to take place, preferably, in their registered area of residence. The
association for this variable is significant from the two perspectives used, but the
magnitude in models 1-4 is almost twice that of models 5 and 6.
This analysis reports a lack of a significant association between the ACSH rate at the
jurisdiction level and utilisation of primary care services measured through GP
consultations per 10,000 uninsured at the state level.
MANUSCRIP
T
ACCEPTED
ACCEPTED MANUSCRIPT
15
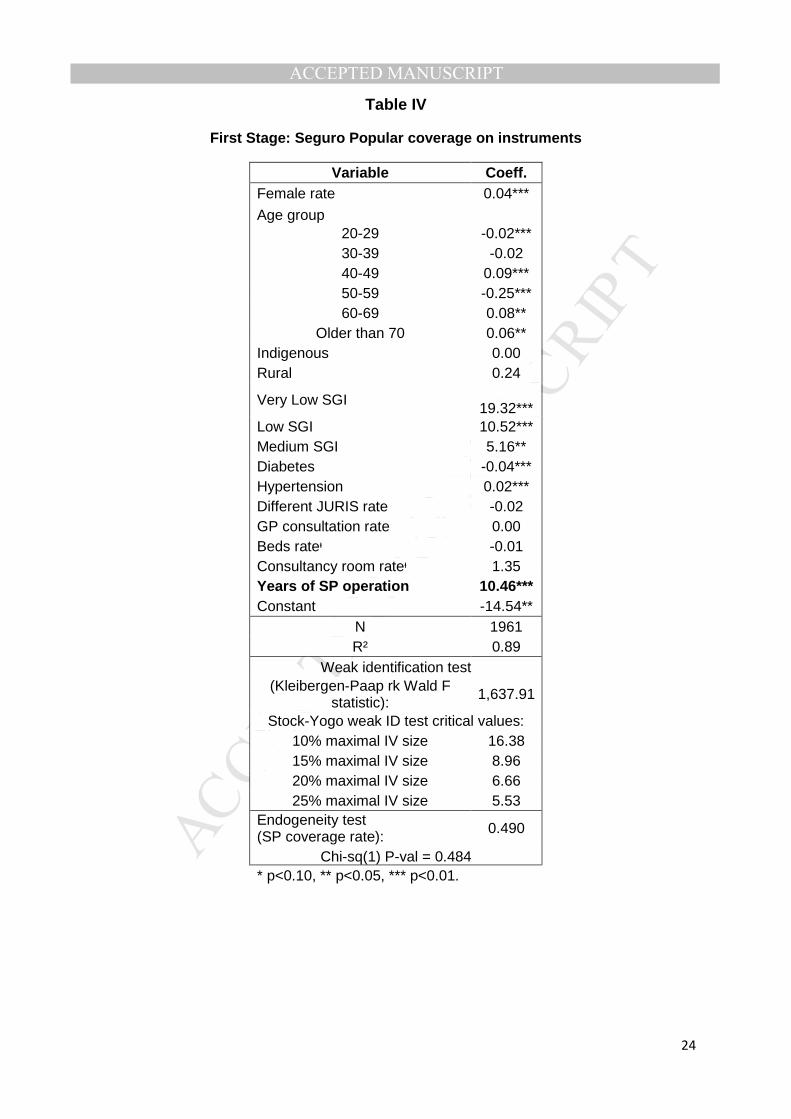
Table IV shows the first stage of the 2SLS reported in column (3) in Table III. Years
of SP operation in the state seem to be a strong instrument for SP jurisdiction
coverage rate since its effect on the coverage rate is not only significant at the 1%
level but it also has one of the highest estimated coefficients. The strength of the
instrument is supported by a high R2 in the regression of SP jurisdiction coverage
rate on its instruments and also by the weak identification test where the null
hypothesis that the instrument is weak is rejected at the 1% level. Also in Table IV,
the endogeneity test for SP jurisdiction coverage rate does not reject the null
hypothesis of treating this variable as exogenous, supporting the assumption in
Table III columns (4-6) that SP jurisdiction rate is an exogenous variable.
As an additional robustness check, the same analysis was conducted only for the
diabetes ACSHs subgroup (not reported). While the magnitude of the estimated
coefficients is considerably lower, the sign and significance of the findings prevail
(with the exception of the SGI variables whose coefficients were not different from
zero in models 1-3 and only significant for the medium SGI category in models 4-6).
[TABLE IV]
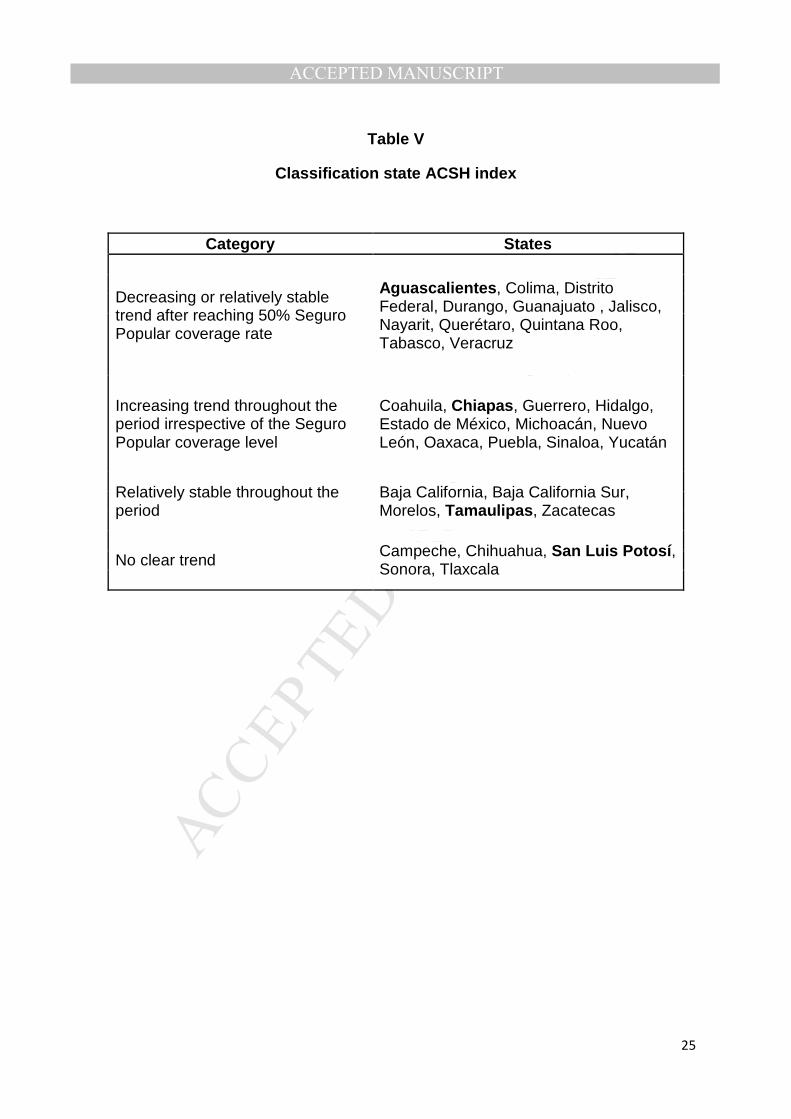
The increase in the ACSH rate and its positive association with the SP coverage rate
should be interpreted carefully. It is important to stress that this study analyses data
from a period where SP was in a gradual, continuous, and heterogeneous expansion
across the country, and, consequently, access to both primary and hospital care
improved for more than 50 million previously uninsured people. In general, states
show an increase in their ACSH rate at an earlier stage of the SP coverage
expansion, but the ACSH rate did not follow the same trend in all states as SP
continued to expand. Hence, states can be classified into those with a decreasing or
MANUSCRIP
T
ACCEPTED
ACCEPTED MANUSCRIPT
16
stable ACSH trend after reaching SP coverage levels above 50%; states with
increasing ACSH trend irrespective of the SP coverage level; states with apparent
stable ACSH rate throughout the period; and states without a clear ACSH trend.
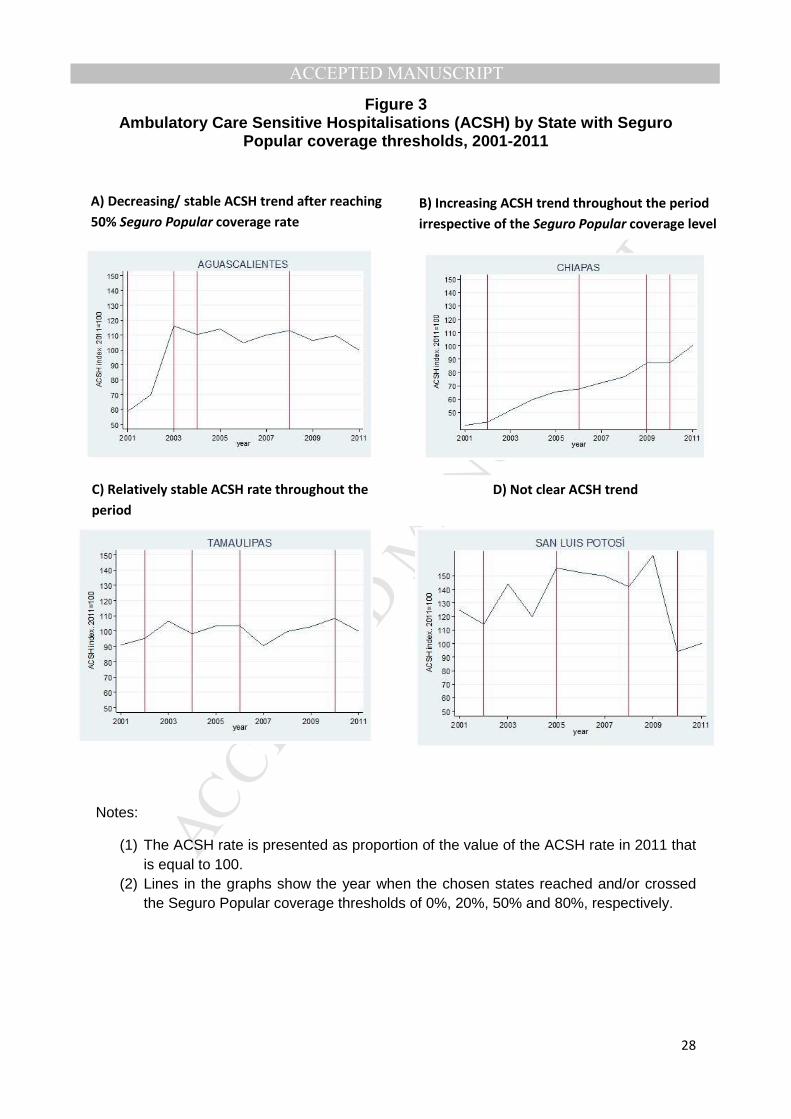
Table V shows how states can be classified in these four categories and Figure 3
presents one example of each group indicating the year when each of these states
reached and/or passed the 0%, 20%, 50% and 80% SP coverage thresholds. High
heterogeneity was also found for jurisdictions within states.
[TABLE V]
[FIGURE 3]
VI. Discussion
The increase in health insurance coverage experienced in Mexico after the Health
Reform of 2003 did not lead to a decrease in the ACSH rate, but rather the ACSH
rate boomed in the following decade. The analysis conducted suggests that this
increase was driven by the expansion in health insurance coverage, at least during
the initial expansion stage, as SP reached people with chronic conditions without
sufficient access to appropriate health care services prior to the coverage expansion
whose poorly controlled condition hindered the ability of primary care to avoid
ACSHs. Therefore, the increase in ACSHs does not necessarily imply that the
primary care services provided is ineffective or of low-quality. Focusing on the
increase/decrease of the ACSH rate may not be an appropriate way to measure the
effectiveness of primary care services in the Mexican post-reform context. Rather it
shows the immediate consequences of years of limited access to primary care that
have health and financial implications over both patients and providers that are worth
exploring in further studies. This is not the first study to find an increase in the ACSH
MANUSCRIP
T
ACCEPTED
ACCEPTED MANUSCRIPT
17
rate after an expansion in health coverage, Saha et al. (2007) observed a similar
trend in preventable hospitalisations after the expansion of Medicaid coverage in
Oregon.
The use of this indicator becomes relevant in the Mexican setting when ACSH rates
are compared across states because after taking into account differences in the SP
coverage rate among states and among jurisdictions, there are still unexplained
differences in the ACSH rate that may be due to differences in primary care
performance. This argument is supported not only by the different trends in ACSH
rate during the period studied, but also by the different reactions of the ACSH rate
after high SP coverage levels are reached. The differences observed in the ACSH
rates between and within states reflect serious structural differences in management
and primary care infrastructure across states that might have been worsened by the
decentralisation processes of the 1980’s and 1990’s and that the Reform of 2003
has been unable to reduce as it did with the inter-state health-financing gap
(Autrique-Echeveste, 2012) . Once SP coverage rates converge across the country,
as a result of achieving universal health coverage in 2012, monitoring and comparing
the ACSH rate across states, jurisdictions and facilities as well as complementing
this information with primary care utilisation data will provide a clearer picture of the
quality of care provided by the state health ministries.
The associations found for age and socioeconomic status are consistent with
previous research: the higher the proportion of older population and the poorer
socio-economic conditions, the higher is the ACSH jurisdiction rate (Culler et al.,
1998; Finegan et al., 2010; Shi & Samuels, 1999). It was also found that hospital
supply is strongly linked to the ACSH rate; when this result is interpreted jointly with
the positive coefficient of the rate of patients coming from different jurisdictions, it
MANUSCRIP
T
ACCEPTED
ACCEPTED MANUSCRIPT
18
suggests that jurisdictions with greater availability of general hospital services attract
cases that should be solved at the primary care level.
The lack of association between GP consultations at the state level and the
jurisdiction ACSH rate could result from differences in access to and provision of
primary care services within states. This explanation of the apparently insignificant
association with the ACSH jurisdiction rate could be confirmed by better utilisation
data at the jurisdiction level. Finegan et al. (2010) also found no significant
association of this factor with the ACSH rate, they argue that effectiveness of primary
care is not equivalent to the number of visits per se and that GP visits should be
complemented with new effective therapies.
This study has some limitations. First, it is possible that data limitations biased the
results. Using state level data as a proxy for the data at the jurisdiction level is not
ideal and might have led to severe biases in the estimated coefficients of primary
care utilisation and condition prevalence rates. A second limitation is that the
analysis is subject to the environmental fallacy, since information is only available for
individuals being hospitalised and individuals not being hospitalised for any reason
(either because they did not need it or because they were not able to access to it)
are not considered. This problem will remain without a survey of primary care and
hospital utilisation, and future studies will continue to be unable to uncover the real
problems of access, quality and effectiveness of health care. Third, this paper only
analyses ACSHs in general hospitals run by state health ministries without
considering those occurring in smaller public and private hospitals. This decision was
made due to the high heterogeneity present in the hospital services offered by
smaller hospitals. Even when heterogeneity is still present in general hospitals a
comparison among them seems to be more appropriate since in order to be
MANUSCRIP
T
ACCEPTED
ACCEPTED MANUSCRIPT
19
classified as general hospitals they need to meet minimum standards for the number
of services offered. Fourth, as with any other study using administrative data, it is
vulnerable to coding and measurement errors. However, these data are not used to
reimburse hospitals, meaning that hospitals do not have strong incentives for
upcoding; thus, the assumption that errors follow a normal distribution and do not
introduce significant bias is plausible.
To conclude, it is important to note that despite significant associations between
several predisposing, enabling, need and hospital supply factors and the health
jurisdiction ACSH rate, an important proportion of the variation in the rate could not
be explained with the proposed model. From the dispersion shown in Table III (rho)
we can infer that the main source of this unexplained variation is the high
heterogeneity at the health jurisdiction level; from the figures shown above we can
also conclude that the trends vary substantially from state to state. Therefore, this
paper suggests that some states and jurisdictions are performing less well than
others. As long as large differences in the ACSH rate are not explained, the potential
role of the ineffectiveness of primary care and the provision of low-quality services in
Mexico cannot be disregarded.
MANUSCRIP
T
ACCEPTED
ACCEPTED MANUSCRIPT
20
Tables and Figures
Table I
Variable Description
Variable Description Source
ACSH rate per 10,000 uninsured
(Discharges, for patients ages 20 and older, with one of the 300 ICD-10 codes considered preventable as main diagnosis in general hospitals of the jurisdiction � / total population without social security in jurisdiction �) X 10,000 (Secretaria de Salud, 2013b)
different JURIS rate (number of patients residing in other jurisdictions but hospitalised in hospitals of the jurisdiction � / total population without social security in jurisdiction �) X 10,000
Seguro Popular (SP) coverage rate
(number of SP beneficiaries in jurisdiction � / total population without social security in jurisdiction �) * 100
(Comision Nacional de Protección Social en Salud, 2011; Secretaria de Salud, 2013b)
social gap index weighted measurement that summarises four social deprivation indicators (education, health, household services and housing spaces) into a single index whose purpose is to arrange units according to their social deprivation
(Consejo Nacional de Evaluación de la Política de Desarrollo Social, 2012)
state diabetes prevalence per 10,000
population (diabetic population in state / total population in state) * 10,000 (Gutiérrez et al., 2012; Olaiz-
Fernández et al., 2006; Olaiz et al., 2003) state hypertension
prevalence per 10,000 (hypertensive population in state / total population in state) * 10,000
state GP consultation rate
(general practice consultancies for population without social security in state / total population without social security in state) * 10,000 (Secretaria de Salud, 2014)
beds rate (number of hospital beds in jurisdiction � / total population without social security in (Secretaria de Salud, 2013a)

MANUSCRIP
T
ACCEPTED
ACCEPTED MANUSCRIPT
21
jurisdiction �) * 10,000
consultancy room rate (number of consultancy rooms in general hospitals of the jurisdiction � / total population without social security in jurisdiction �) * 10,000
rural population (population from the jurisdiction � residing in localities with less than 2,500 population / total population without social security in jurisdiction �) * 100
(Consejo Nacional de Población, 2012, 2013)
indigenous population (indigenous population in the jurisdiction � / total population without social security in jurisdiction �) * 10,000
(Comision Nacional para el Desarrollo de los Pueblos Indigenas, 2010)
MANUSCRIP
T
ACCEPTED
ACCEPTED MANUSCRIPT
22
Table II
Descriptive Statistics
Hospital Jurisdictions
Variable Mean SD Min Max
Pop with no Social Security 274,541 197,784 12,383 1,156,468 ACSCH rate* 23.8 18.6 0.1 173.2 Female rate* 5,020 165.9 4,509 5,422 Age group 20-29* 1,788 199.8 1,228 2,346 Age group 30-39* 1,442 205.4 955 2,119 Age group 40-49* 1,031 146.4 720 1,852 Age group 50-59* 639 105.7 390 1,321 Age group 60-69* 392 103.0 167 861 Age group older than 70* 325 118.6 95 900 Seguro Popular coverage 39.5 36.2 0.0 135.9 Rural 32.9 22.7 0.0 89.0 Indigenous population* 1,066 1,800 8 9,873 Very Low SGI 0.60 0.49 0.0 1.00 Low SGI 0.20 0.40 0.0 1.00 Medium SGI 0.15 0.36 0.0 1.00 High & Very high SGI 0.05 0.23 0.0 1.00 Different JURIS rate* 36.8 68.0 0.0 577.1 GP consultation rate* 14,700 4,438 7,874 28,899 Beds rate* 4.1 2.7 0.5 21.8 Consultancy room rate* 1 1 0 7 Diabetes state prevalence 730 188.2 330 1,230 Hypertension state prevalence 1,454 285.9 810 2200
SGI: Social Gap Index; JURIS: heath jurisdiction. *Rate per 10,000 population with no Social Security
MANUSCRIP
T
ACCEPTED
ACCEPTED MANUSCRIPT
23
Table III
Fixed Effects Models for ACSH rate
Variable (1)
Fixed Effects
(2) Squared SP
coverage
(3) Instrumental
Variables
(4) Year
Dummies
(5) Origin
JURIS ‡
(6) Origin
JURIS ALL ††
Predisposing Factors Age groupᶧ
20-29 -0.0113* -0.0104 -0.0113* -0.0113 -0.0062 -0.0078 [0.0065] [0.0064] [0.0064] [0.0069] [0.0075] [0.0072]
30-39 -0.0361 -0.0366* -0.0359* -0.0363* -0.0455** -0.0486*** [0.0213] [0.0214] [0.0211] [0.0211] [0.0211] [0.0159]
50-59 -0.0854** -0.0809** -0.0848** -0.0878** -0.0913** -0.0812** [0.0396] [0.0367] [0.0389] [0.0356] [0.0357] [0.0338]
60-69 0.1299** 0.1282** 0.1294** 0.1311** 0.1328** 0.1158** [0.0625] [0.0604] [0.0617] [0.0632] [0.0650] [0.0516]
Enabling Factors SP coverage rate 0.1120*** 0.0771*** 0.1149*** 0.1032** 0.0945** 0.0818** [0.0134] [0.0250] [0.0112] [0.0384] [0.0380] [0.0319] SP coverage squared - 0.0004 - - - - - [0.0003] - - - - Very Low SGI -4.6277* -4.4177* -5.0143** -5.6046** -5.8559** -5.6433** [2.4950] [2.3677] [2.1993] [2.6133] [2.5468] [2.7448] Low SGI -3.9843 -3.6716 -4.2730** -4.9460* -4.8286* -3.9788 [2.4419] [2.1985] [2.1441] [2.4284] [2.4100] [2.5275] Medium SGI -3.5744** -3.4013** -3.6939** -3.9934** -4.0069** -3.7426*** [1.6962] [1.5833] [1.6449] [1.7285] [1.6898] [1.2430] Need Factors Different JURIS rateᶧ 0.0794*** 0.0773*** 0.0797*** 0.0802*** 0.0447* 0.0473*** [0.0264] [0.0265] [0.0258] [0.0263] [0.0235] [0.0118] GP consultation rateᶧ -0.0003 -0.0003 -0.0003 -0.0003 -0.0003 -0.0001 [0.0003] [0.0003] [0.0003] [0.0003] [0.0003] [0.0003] Hospital Characteristics Beds rateᶧ 2.8704*** 2.8752*** 2.8694*** 2.8506*** 2.4110** - [0.9168] [0.9087] [0.8949] [0.9169] [0.9050] - Consultancy room rateᶧ 4.4102* 4.2387* 4.4243** 4.4061* 4.9915** - [2.1718] [2.1514] [2.1164] [2.1754] [2.3004] - General hospital closer than 50 km - - - - - 8.9905**
- - - - - [3.7231] Constant 23.8121*** 23.8876*** 24.0061*** 23.7982*** 22.4107*** 11.9163***
[1.8034] [1.8313] [1.9401~] [1.8162] [1.8341] [2.6101] ��
sigma_u 12.9899 13.0656 13.0812 13.2639 14.0671 16.6586 sigma_e 6.7512 6.7416 6.7518 6.7166 6.7561 7.0619
rho 0.7873 0.7897 0.7896 0.7959 0.8126 0.8477 N 1961 1961 1961 1961 2020 2552 R² 0.3823 0.3844 0.3822 0.3925 0.355 0.2504 ll -6418.1214 -6414.7698 -6418.301 -6401.879 -6606.063 -8472.4623
State cluster standard errors in brackets. * p<0.10, ** p<0.05, *** p<0.01. ᶧ Mean-centred rate per 10,000 population with no Social Security. In (3) SP coverage rate is instrumented by the years of SP operation in the state where each jurisdiction is located. ~The SE for the constant in (3) is not clustered. Non-significant associations unreported: proportion of female population, age groups 40-49 and older than 70, indigenous condition, rural rate, diabetes and hypertension prevalence, and in (4) year dummies. ‡ Model 5 uses origin health jurisdictions as unit of analysis. All jurisdictions without general hospitals were excluded. †† Model 6 includes all origin health jurisdictions whether they have a general hospital in their territory or not. A dummy that indicates if a general hospital is within 50 km and less than one hour driving from the biggest municipality in the jurisdiction was included to control for health care supply instead of number of hospital beds and consultancy rooms.
MANUSCRIP
T
ACCEPTED
ACCEPTED MANUSCRIPT
24
Table IV
First Stage: Seguro Popular coverage on instruments
Variable Coeff. Female rate 0.04***
Age group 20-29 -0.02*** 30-39 -0.02 40-49 0.09*** 50-59 -0.25*** 60-69 0.08**
Older than 70 0.06** Indigenous 0.00 Rural 0.24
Very Low SGI 19.32***
Low SGI 10.52*** Medium SGI 5.16** Diabetes -0.04*** Hypertension 0.02*** Different JURIS rate -0.02 GP consultation rate 0.00 Beds rateᶧ -0.01 Consultancy room rateᶧ 1.35 Years of SP operation 10.46*** Constant -14.54**
N 1961 R² 0.89
Weak identification test (Kleibergen-Paap rk Wald F
statistic): 1,637.91
Stock-Yogo weak ID test critical values: 10% maximal IV size 16.38 15% maximal IV size 8.96 20% maximal IV size 6.66 25% maximal IV size 5.53
Endogeneity test (SP coverage rate): 0.490
Chi-sq(1) P-val = 0.484 * p<0.10, ** p<0.05, *** p<0.01.
MANUSCRIP
T
ACCEPTED
ACCEPTED MANUSCRIPT
25
Table V
Classification state ACSH index
Category States
Decreasing or relatively stable trend after reaching 50% Seguro Popular coverage rate
Aguascalientes , Colima, Distrito Federal, Durango, Guanajuato , Jalisco, Nayarit, Querétaro, Quintana Roo, Tabasco, Veracruz
Increasing trend throughout the period irrespective of the Seguro Popular coverage level
Coahuila, Chiapas , Guerrero, Hidalgo, Estado de México, Michoacán, Nuevo León, Oaxaca, Puebla, Sinaloa, Yucatán
Relatively stable throughout the period
Baja California, Baja California Sur, Morelos, Tamaulipas , Zacatecas
No clear trend Campeche, Chihuahua, San Luis Potosí , Sonora, Tlaxcala
MANUSCRIP
T
ACCEPTED
ACCEPTED MANUSCRIPT
26
Figure 1
Composition of Ambulatory Care Sensitive Hospitalis ations, 2001-2011
MANUSCRIP
T
ACCEPTED
ACCEPTED MANUSCRIPT
27
Figure 2
Ambulatory Care Sensitive Hospitalisation national rate, 2001-2011
MANUSCRIP
T
ACCEPTED
ACCEPTED MANUSCRIPT
28
Figure 3 Ambulatory Care Sensitive Hospitalisations (ACSH) b y State with Seguro
Popular coverage thresholds, 2001-2011
Notes:
(1) The ACSH rate is presented as proportion of the value of the ACSH rate in 2011 that is equal to 100.
(2) Lines in the graphs show the year when the chosen states reached and/or crossed the Seguro Popular coverage thresholds of 0%, 20%, 50% and 80%, respectively.
A) Decreasing/ stable ACSH trend after reaching
50% Seguro Popular coverage rate
B) Increasing ACSH trend throughout the period
irrespective of the Seguro Popular coverage level
C) Relatively stable ACSH rate throughout the
period
D) Not clear ACSH trend
MANUSCRIP
T
ACCEPTED
ACCEPTED MANUSCRIPT
29
References
Agency for Healthcare Research and Quality. (2013). Quality Indicators. Retrieved 8 May, 2013, from http://www.qualityindicators.ahrq.gov/Default.aspx
Andersen, R. M., & Davidson, P. L. (2007). Improving access to care in America. Changing the US
health care system: key issues in health services policy and management. 3a. edición. San
Francisco: Jossey-Bass, 3-31. Ansari, Z. (2007). The Concept and Usefulness of Ambulatory Care Sensitive Conditions as Indicators
of Quality and Access to Primary Health Care. Australian Journal of Primary Health, 13(3), 91-110.
Ashton, C. M., Petersen, N. J., Souchek, J., Menke, T. J., Yu, H., Pietz, K., . . . Wray, N. P. (1999). Geographic Variations in Utilization Rates in Veteran Affairs Hospitals and Clinics. The New
England Journal of Medicine, 340(1), 32-39. Autrique-Echeveste, D. (2012). Análisis de los efectos de la descentralización del Sistema de Salud en
México, para la atención de la población sin seguridad social, sobre la distribución
interestatal de variables selectas de oferta de servicios de salud. (Licenciatura en Economía), ITAM, México, D.F.
Bindman, A. B., Grumbach, K., Osmond, D., Komaromy, M., Vranizan, K., Lurie, N., . . . Stewart, A. (1995). Preventable hospitalizations and access to health care. JAMA: the journal of the
American Medical Association, 274(4), 305-311. Blustein, J., Hanson, K., & Shea, S. (1998). Preventable hospitalizations and socioeconomic status.
Health Affairs, 17(2), 177-189. doi: 10.1377/hlthaff.17.2.177 Caminal, J., Starfield, B., Sánchez, E., Casanova, C., & Morales, M. (2004). The role of primary care in
preventing ambulatory care sensitive conditions. The European Journal of Public Health,
14(3), 246-251. Comision Nacional de Protección Social en Salud. (2011). Sistema de Administración del Padrón
Nacional de Beneficiarios. México, D.F: Secretaría de Salud. Comision Nacional de Protección Social en Salud. (2012). Informe de Resultados. Enero - Julio 2012.
México, D.F: Secretaría de Salud. Comision Nacional para el Desarrollo de los Pueblos Indigenas. (2010). Sistema de información e
indicadores sobre la población indígena de México. Retrieved 15 January, 2014, from http://www.cdi.gob.mx/index.php?option=com_content&view=category&id=38&Itemid=54
Consejo Nacional de Evaluación de la Política de Desarrollo Social. (2012). Índice de Rezago Social. Retrieved 11 January, 2014, from http://www.coneval.gob.mx/Medicion/Paginas/Que-es-el-indice-de-rezago-social-en.aspx
Consejo Nacional de Población. (2012). Indicadores Demográficos Basicos de las Entidades Federativas 1990-2010. Retrieved 19 December, 2013, from http://www.conapo.gob.mx/es/CONAPO/De_las_Entidades_Federativas_1990-2010
Consejo Nacional de Población. (2013). Proyecciones de la Población de las Entidades Federativas 2010 - 2030. Retrieved 19 December 2013, 2013, from http://www.conapo.gob.mx/es/CONAPO/De_las_Entidades_Federativas_2010-2050
Culler, S. D., Parchman, M. L., & Przybylski, M. (1998). Factors related to potentially preventable hospitalizations among the elderly. Medical Care, 36(6), 804-817.
Dusheiko, M., Doran, T., Gravelle, H., Fullwood, C., & Roland, M. (2011). Does higher quality of diabetes management in family practice reduce unplanned hospital admissions? Health Serv
Res, 46(1 Pt 1), 27-46. doi: 10.1111/j.1475-6773.2010.01184.x Epstein, A. J. (2001). The role of public clinics in preventable hospitalizations among vulnerable
populations. Health services research, 36(2), 405. Finegan, M. S., Gao, J., Pasquale, D., & Campbell, J. (2010). Trends and geographic variation of
potentially avoidable hospitalizations in the veterans health-care system. Health Services
Management Research, 23(2), 66-75. doi: 10.1258/hsmr.2009.009023
MANUSCRIP
T
ACCEPTED
ACCEPTED MANUSCRIPT
30
Fundación Mexicana para la Salud. (2012). Universalidad de los Servicios de Salud. Una propuesta de FUNSALUD. Mexico, D.F: FUNSALUD.
Gutiérrez, J., Rivera-Dommarco, J., Shamah-Levy, T., Villalpando-Hernández, S., Franco, A., Cuevas-Nasu, L., . . . Hernández-Ávila, M. (2012). Encuesta Nacional de Salud y Nutrición 2012. Resultados Nacionales. Cuernavaca, México: Instituto Nacional de Salud Pública.
Knaul, F. M., González-Pier, E., Gómez-Dantés, O., García-Junco, D., Arreola-Ornelas, H., Barraza-Lloréns, M., . . . Frenk, J. (2012). The quest for universal health coverage: achieving social protection for all in Mexico. The Lancet, 380(9849), 1259-1279. doi: 10.1016/s0140-6736(12)61068-x
Kozak, L. J., Hall, M. J., & Owings, M. F. (2001). Trends In Avoidable Hospitalizations, 1980-1998. Health Affairs, 20(2), 225-232. doi: 10.1377/hlthaff.20.2.225
Laditka, J. N., Laditka, S. B., & Probst, J. C. (2005). More may be better: evidence of a negative relationship between physician supply and hospitalization for ambulatory care sensitive conditions. Health services research, 40(4), 1148-1166. doi: 10.1111/j.1475-6773.2005.00403.x
Macinko, J., de Oliveira, V. B., Turci, M. A., Guanais, F. C., Bonolo, P. F., & Lima-Costa, M. F. (2011). The Influence of Primary Care and Hospital Supply on Ambulatory Care–Sensitive Hospitalizations Among Adults in Brazil, 1999–2007. American Journal of Public Health,
101(10), 1963-1970. doi: 10.2105/AJPH.2010.198887 Olaiz-Fernández, G., Rivera-Dommarco, J., Shamah-Levy, T., Rojas, R., Villalpando-Hernández, S.,
Hernández-Avila, M., & Sepúlveda-Amor, J. (2006). Encuesta Nacional de Salud y Nutrición 2006. Cuernavaca, México: Instituto Nacional de Salud Pública.
Olaiz, G., Rojas, R., Barquera, S., Shamah, T., Aguilar, C., Cravioto, P., . . . Sepúlveda, J. (2003). Encuesta Nacional de Salud 2000. Tomo 2. La salud de los adultos. Cuernavaca, México: Instituto Nacional de Salud Pública.
Rabe-Hesketh, S., & Skrondal, A. (2012). Multilevel and Longitudinal Modeling Using Stata (Vol. I ). College Station, TX: Stata Press.
Saha, S., Solotaroff, R., Oster, A., & Bindman, A. B. (2007). Are preventable hospitalizations sensitive to changes in access to primary care?: The case of the Oregon Health Plan. Medical Care,
45(8), 712-719. Secretaria de Salud. (2013a). Recursos Físicos y Humanos en Hospitales de la Secretaria de Salud
Table produced by Dirección General de Información en Salud. México, D.F. Secretaria de Salud. (2013b). Sistema Nacional de Información en Salud. Retrieved 28 May, 2013,
from http://www.sinais.salud.gob.mx Secretaria de Salud. (2014). Boletín de Información Estadística. Retrieved 11 April, 2014, from
http://www.sinais.salud.gob.mx/publicaciones/bie.html Shi, L., & Samuels, M. E. (1999). Patient Characteristics Associated With Hospitalizations for
Ambulatory Care Sensitive Conditions in South Carolina. Southern Medical Journal, 92(10), 989-998.
Sosa-Rubi, S. G., Galarraga, O., & Harris, J. E. (2009). Heterogeneous impact of the “Seguro Popular” program on the utilization of obstetrical services in Mexico, 2001–2006: A multinomial probit model with a discrete endogenous variable. J Health Econ, 28(1), 20-34.
StataCorp. (2013). Stata Statistical Software: Release 13. College Station, TX: StataCorp LP. Stranges, E., & Stocks, C. (2010). Potentially Preventable Hospitalizations fro Acute and Chronic
Conditions, 2008. Rockville, MD: Agency for Healthcare Research and Quality. Torres, A.-C., & Knaul, F.-M. (2003). Determinantes del gasto de bolsillo en salud e implicaciones
para el aseguramiento universal en México: 1992-2000. In F. Knaul & G. Nigenda (Eds.), Caleidoscopio de la Salud (pp. 209-225). Distrito Federal, Mexico: Fundacion Mexicana para la Salud.

MANUSCRIP
T
ACCEPTED
ACCEPTED MANUSCRIPT
31
Weissman, J. S., Gatsonis, C., & Epstein, A. M. (1992). Rates of avoidable hospitalization by insurance status in Massachusetts and Maryland. JAMA: the journal of the American Medical
Association, 268(17), 2388-2394.
MANUSCRIP
T
ACCEPTED
ACCEPTED MANUSCRIPT
32
APPENDIX
Ambulatory Care Sensitive Conditions included in th e analysis 1
No. Condition
Hospital care covered by
Seguro Popular
1 Immunisation and preventable infectious diseases
2 Congenital syphilis
3 Tuberculosis
4 Diabetes mellitus X*
5 Disorders of hydro-electrolyte metabolism
6 Anaemia 7 Convulsions and epilepsy X
8 Diseases of the upper respiratory tract X
9 Hypertension X**
10 Heart Failure
11 Pneumonia X
12 Bronchitis and chronic obstructive pulmonary disease X
13 Asthma
14 Bleeding or perforating ulcer X
15 Appendicitis with complication X
16 Disease of the skin and subcutaneous tissue
17 Gastroenteritis
18 Urinary tract infections X
19 Pelvic inflammatory disease
20 Hypoglycaemia
21 Gallstone ileus X
Source: Authors with data from Comisión Nacional de Protección Social en Salud (2012).
* Hospitalisation for diabetes with kidney failure is not covered by Seguro Popular.
** Treatment for acute myocardial infarction is only covered for those under 60.
1 ICD-10 codes considered for each condition are available here [INSERT LINK TO ONLINE FILE A].

MANUSCRIP
T
ACCEPTED
ACCEPTED MANUSCRIPT
Research Highlights
• We analyse the avoidable hospitalisation (ACSH) rate in Mexico during 2001-
2011.
• The ACSH rate in Mexico boomed after health insurance expansion.
• ACSH rate may not be a valid effectiveness indicator when health coverage
expands.
• ACSH rate may identify differences in primary care between and within states.
• The heterogeneity found in the ACSH rates suggests regional differences in
quality.
MANUSCRIP
T
ACCEPTED
ACCEPTED MANUSCRIPT
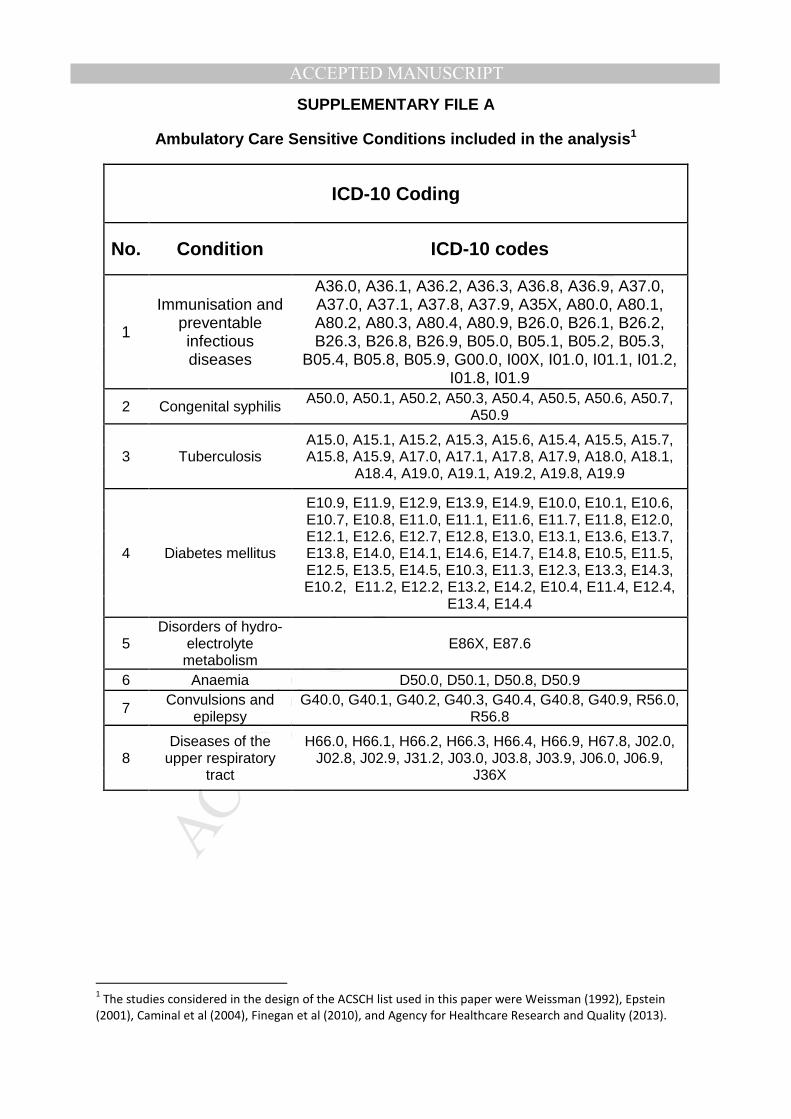
SUPPLEMENTARY FILE A
Ambulatory Care Sensitive Conditions included in the analysis1
ICD-10 Coding
No. Condition ICD-10 codes
1
Immunisation and preventable infectious diseases
A36.0, A36.1, A36.2, A36.3, A36.8, A36.9, A37.0, A37.0, A37.1, A37.8, A37.9, A35X, A80.0, A80.1, A80.2, A80.3, A80.4, A80.9, B26.0, B26.1, B26.2, B26.3, B26.8, B26.9, B05.0, B05.1, B05.2, B05.3,
B05.4, B05.8, B05.9, G00.0, I00X, I01.0, I01.1, I01.2, I01.8, I01.9
2 Congenital syphilis A50.0, A50.1, A50.2, A50.3, A50.4, A50.5, A50.6, A50.7, A50.9
3 Tuberculosis A15.0, A15.1, A15.2, A15.3, A15.6, A15.4, A15.5, A15.7, A15.8, A15.9, A17.0, A17.1, A17.8, A17.9, A18.0, A18.1,
A18.4, A19.0, A19.1, A19.2, A19.8, A19.9
4 Diabetes mellitus
E10.9, E11.9, E12.9, E13.9, E14.9, E10.0, E10.1, E10.6, E10.7, E10.8, E11.0, E11.1, E11.6, E11.7, E11.8, E12.0, E12.1, E12.6, E12.7, E12.8, E13.0, E13.1, E13.6, E13.7, E13.8, E14.0, E14.1, E14.6, E14.7, E14.8, E10.5, E11.5, E12.5, E13.5, E14.5, E10.3, E11.3, E12.3, E13.3, E14.3, E10.2, E11.2, E12.2, E13.2, E14.2, E10.4, E11.4, E12.4,
E13.4, E14.4
5 Disorders of hydro-
electrolyte metabolism
E86X, E87.6
6 Anaemia D50.0, D50.1, D50.8, D50.9
7 Convulsions and epilepsy
G40.0, G40.1, G40.2, G40.3, G40.4, G40.8, G40.9, R56.0, R56.8
8 Diseases of the
upper respiratory tract
H66.0, H66.1, H66.2, H66.3, H66.4, H66.9, H67.8, J02.0, J02.8, J02.9, J31.2, J03.0, J03.8, J03.9, J06.0, J06.9,
J36X
1 The studies considered in the design of the ACSCH list used in this paper were Weissman (1992), Epstein
(2001), Caminal et al (2004), Finegan et al (2010), and Agency for Healthcare Research and Quality (2013).
MANUSCRIP
T
ACCEPTED
ACCEPTED MANUSCRIPT
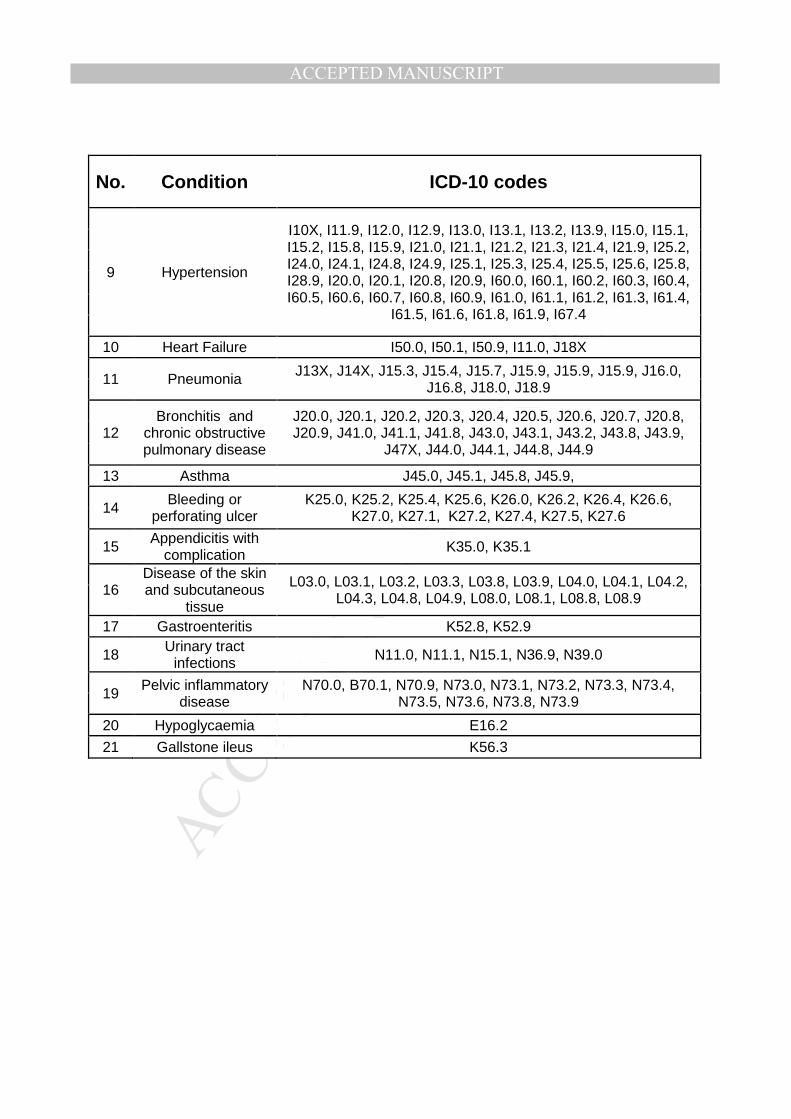
No. Condition ICD-10 codes
9 Hypertension
I10X, I11.9, I12.0, I12.9, I13.0, I13.1, I13.2, I13.9, I15.0, I15.1, I15.2, I15.8, I15.9, I21.0, I21.1, I21.2, I21.3, I21.4, I21.9, I25.2, I24.0, I24.1, I24.8, I24.9, I25.1, I25.3, I25.4, I25.5, I25.6, I25.8, I28.9, I20.0, I20.1, I20.8, I20.9, I60.0, I60.1, I60.2, I60.3, I60.4, I60.5, I60.6, I60.7, I60.8, I60.9, I61.0, I61.1, I61.2, I61.3, I61.4,
I61.5, I61.6, I61.8, I61.9, I67.4
10 Heart Failure I50.0, I50.1, I50.9, I11.0, J18X
11 Pneumonia J13X, J14X, J15.3, J15.4, J15.7, J15.9, J15.9, J15.9, J16.0, J16.8, J18.0, J18.9
12 Bronchitis and
chronic obstructive pulmonary disease
J20.0, J20.1, J20.2, J20.3, J20.4, J20.5, J20.6, J20.7, J20.8, J20.9, J41.0, J41.1, J41.8, J43.0, J43.1, J43.2, J43.8, J43.9,
J47X, J44.0, J44.1, J44.8, J44.9
13 Asthma J45.0, J45.1, J45.8, J45.9,
14 Bleeding or perforating ulcer
K25.0, K25.2, K25.4, K25.6, K26.0, K26.2, K26.4, K26.6, K27.0, K27.1, K27.2, K27.4, K27.5, K27.6
15 Appendicitis with complication K35.0, K35.1
16 Disease of the skin and subcutaneous
tissue
L03.0, L03.1, L03.2, L03.3, L03.8, L03.9, L04.0, L04.1, L04.2, L04.3, L04.8, L04.9, L08.0, L08.1, L08.8, L08.9
17 Gastroenteritis K52.8, K52.9
18 Urinary tract infections N11.0, N11.1, N15.1, N36.9, N39.0
19 Pelvic inflammatory disease
N70.0, B70.1, N70.9, N73.0, N73.1, N73.2, N73.3, N73.4, N73.5, N73.6, N73.8, N73.9
20 Hypoglycaemia E16.2
21 Gallstone ileus K56.3