
LUG IN HYBRID ELECTRIC VEHICLE IMPACT STUDY … · Regenerative braking is a completely different...
27
CSE CONSULTING PLUG-IN HYBRID ELECTRIC VEHICLE IMPACT STUDY FOR THE PROGRESS ENERGY CAROLINAS TERRITORY: Condensed Grid Impact Report for PHEV2007 Conference October 16 th , 2007 Prepared by CSE Consulting Mike Waters Tom Outlaw
Transcript of LUG IN HYBRID ELECTRIC VEHICLE IMPACT STUDY … · Regenerative braking is a completely different...
CSE CONSULTING
PLUG-IN HYBRID ELECTRIC VEHICLE IMPACT STUDY FOR THE PROGRESS ENERGY CAROLINAS TERRITORY: Condensed Grid Impact Report for PHEV2007 Conference
October 16th, 2007 Prepared by CSE Consulting Mike Waters Tom Outlaw
Plug-In Hybrid Electric Vehicle Study for the Progress Energy Carolinas Territory page 2 of 27
CSE CONSULTING
Executive Summary In 2007, the Center for Sustainable Enterprise Consulting program was engaged by Progress Energy Carolinas (PEC) to explore the market viability of Plug-In Electric Hybrids (PHEV) and to estimate the potential impact to the company’s electricity generation system. Plug-In Hybrids offer the convenience of an internal combustion engine with the addition of a larger battery to allow for prolonged periods of electrically powered driving. Unlike standard Hybrids, a PHEV battery is recharged by plugging it into a common household outlet instead of the internal combustion engine. This study concludes that PHEVs will provide a greater value to consumers through the ability to
better satisfy their needs and desires compared to conventional or standard Hybrid vehicles. This is despite the fact that PHEVs will initially cost up to $2,000 more over the modeled five-year ownership period. Fuel savings are estimated at over $600 compared to a conventional vehicle and $250 versus a standard Hybrid with the potential to increase significantly depending on the cost of gasoline. The developed market model predicts that PHEVs will most likely achieve a sales market share of 26% by 2030, resulting in 329,000 vehicles on the road in the PEC region. This will require a 0.8% increase in the expected load generation, or 670 GWh, to charge the expected fleet in 2030. This study also examined three potential charging scenarios: uncontrolled, delayed after 10 P.M., and optimized off-peak. The uncontrolled scenario results in additional peak demand and may be undesirable in the long run, although requires no special infrastructure. The delayed and off-peak scenarios are easily capable of handling even a massive penetration of PHEVs without plant or T&D capacity increases. Using PROSYM, the generation mix in 2030 is estimated to be a variety of sources for the uncontrolled case and shifting predominantly to coal in the off-peak charging scenario. Generation costs decrease dramatically from 8.9 to 3.4¢/kWh as greater control is placed on charging time period and base load coal plants are more fully utilized. Incremental emission rates for SO2 and NOx decrease in the off-peak scenario despite the higher mix of coal, likely as the result of more efficient plants or better pollution control. The CO2 emission rate increases slightly in the off-peak charging scenario due to the greater use of coal. On a net vehicle emissions basis, our study indicates that all PHEV charging scenarios significantly increase SO2 emissions compared to a standard Hybrid, while NOx emissions are equal to or slightly greater than a Hybrid. Mercury emissions increase ~1% and there is no offset from reduced gasoline consumption. All the above emission rates must be taken into context with the cap and trade system, which would
require reductions in other locations to prevent a net increase. Net CO2 emission rates for PHEVs are estimated to decrease up to 36% compared to a conventional car and 5 to 11% compared to a standard Hybrid on a per mile basis. There are also significant external benefits associated with the relocation of emissions away from densely populated areas and the greater feasibility for additional reductions on a smaller number of fixed sites. PHEVs can also serve as a key component to a complete alternative fuel strategy and provide a significant reduction in foreign oil imports. Based on the low risk and potential benefits to utilities and their customer base, we recommend that
Progress Energy seize a leadership position in promoting PHEV adoption and advancing the technology where possible. We also recommend that this be part of a longer term and broader objective to serve as a leader in renewable energy and carbon reduction technology.

Plug-In Hybrid Electric Vehicle Study for the Progress Energy Carolinas Territory page 3 of 27
CSE CONSULTING
1.0 Introduction Recent increases in the cost of gasoline coupled with emerging concerns over greenhouse gas emissions and foreign oil dependence had resulted in a renewed interest to find alternative means to fuel our vehicles. One option of particular interest is to power vehicles using stored electrical energy in batteries. The concept is not new, and in fact the earliest automobiles were powered using batteries. However, advances in the internal combustion engine and cheap prices for refined gasoline soon made all battery electric vehicles (BEV) obsolete. Most recently, BEVs were trialed between 1997 and 2003 as air quality concerns in Southern California led to the requirement for zero emission vehicles. Car and truck models were developed by several auto makers, the most famous of which was the GM-EV1. The requirements were eventually lifted and the programs soon cancelled. Since that time, Hybrid electric vehicles have become a very popular vehicle led by the front runner Toyota Prius. Although still completely powered by gasoline, standard Hybrids provide greater fuel efficiency and thereby help reduce emissions and the consumption of gasoline. Many have continued to argue, however, that a better version of a Hybrid is still possible – a Plug-In Hybrid (PHEV). In early 2007, Progress Energy Carolinas requested assistance from the Center of Sustainable Enterprise Consulting program to help evaluate the potential impact of Plug-In Hybrid Electric Vehicles. This project represented the intersection of sustainable technology and business case modeling that is ideal for a CSE Consulting project team. The project was conducted over a ten week period during the summer of 2007, concluding on July 27.
2.0 Background
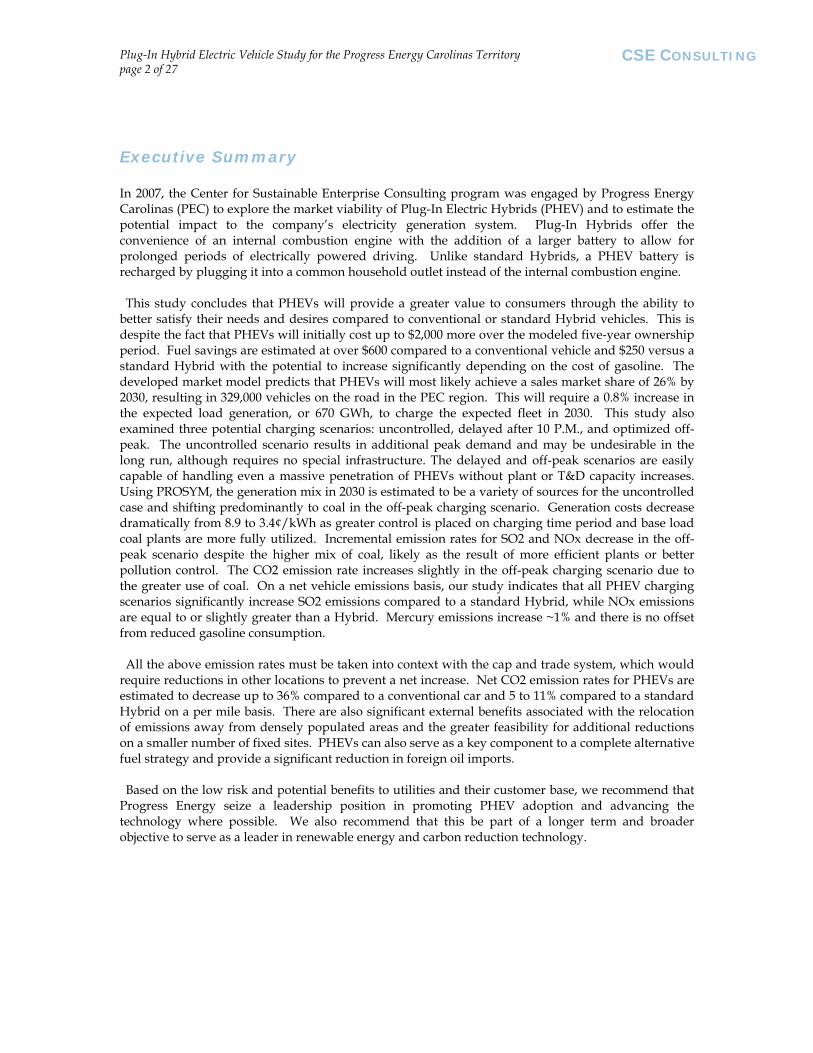
2.1 Utility System Progress Energy Carolinas is one of two electric utility holdings under the corporate parent of Progress Energy. The region predominantly covers eastern North Carolina along with the north eastern region of South Carolina. This study is an exclusive study of the Carolinas region and does not include operations in Florida. Figure 1 illustrates the PEC coverage area along with major power plants.
Plug-In Hybrid Electric Vehicle Study for the Progress Energy Carolinas Territory page 4 of 27
CSE CONSULTING
Figure 1: Progress Energy Coverage Area and Generation Facilities1
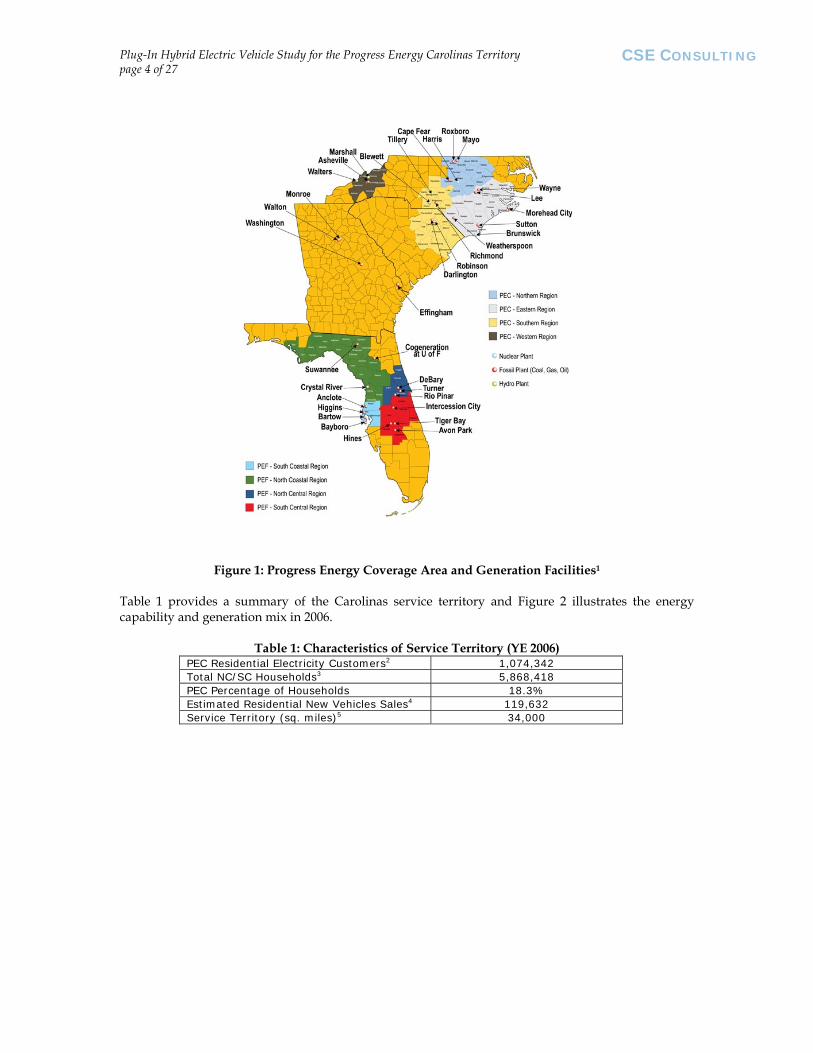
Table 1 provides a summary of the Carolinas service territory and Figure 2 illustrates the energy capability and generation mix in 2006.
Table 1: Characteristics of Service Territory (YE 2006) PEC Residential Electricity Customers2 1,074,342 Total NC/SC Households3 5,868,418 PEC Percentage of Households 18.3% Estimated Residential New Vehicles Sales4 119,632 Service Territory (sq. miles)5 34,000
Plug-In Hybrid Electric Vehicle Study for the Progress Energy Carolinas Territory page 5 of 27
CSE CONSULTING
Figure 2: PEC Energy Capability and Actual Generation Mix6 (2006)
2.2 PHEV Details
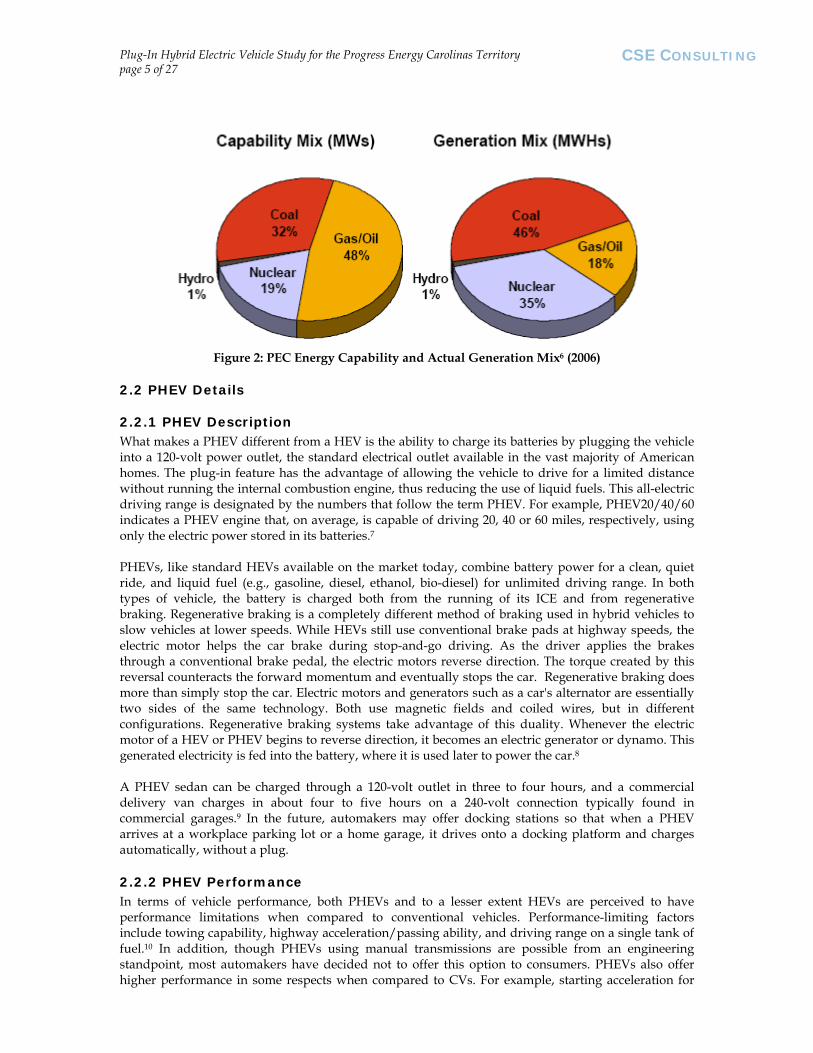
2.2.1 PHEV Description What makes a PHEV different from a HEV is the ability to charge its batteries by plugging the vehicle into a 120-volt power outlet, the standard electrical outlet available in the vast majority of American homes. The plug-in feature has the advantage of allowing the vehicle to drive for a limited distance without running the internal combustion engine, thus reducing the use of liquid fuels. This all-electric driving range is designated by the numbers that follow the term PHEV. For example, PHEV20/40/60 indicates a PHEV engine that, on average, is capable of driving 20, 40 or 60 miles, respectively, using only the electric power stored in its batteries.7 PHEVs, like standard HEVs available on the market today, combine battery power for a clean, quiet ride, and liquid fuel (e.g., gasoline, diesel, ethanol, bio-diesel) for unlimited driving range. In both types of vehicle, the battery is charged both from the running of its ICE and from regenerative braking. Regenerative braking is a completely different method of braking used in hybrid vehicles to slow vehicles at lower speeds. While HEVs still use conventional brake pads at highway speeds, the electric motor helps the car brake during stop-and-go driving. As the driver applies the brakes through a conventional brake pedal, the electric motors reverse direction. The torque created by this reversal counteracts the forward momentum and eventually stops the car. Regenerative braking does more than simply stop the car. Electric motors and generators such as a car's alternator are essentially two sides of the same technology. Both use magnetic fields and coiled wires, but in different configurations. Regenerative braking systems take advantage of this duality. Whenever the electric motor of a HEV or PHEV begins to reverse direction, it becomes an electric generator or dynamo. This generated electricity is fed into the battery, where it is used later to power the car.8 A PHEV sedan can be charged through a 120-volt outlet in three to four hours, and a commercial delivery van charges in about four to five hours on a 240-volt connection typically found in commercial garages.9 In the future, automakers may offer docking stations so that when a PHEV arrives at a workplace parking lot or a home garage, it drives onto a docking platform and charges automatically, without a plug.
2.2.2 PHEV Performance In terms of vehicle performance, both PHEVs and to a lesser extent HEVs are perceived to have performance limitations when compared to conventional vehicles. Performance-limiting factors include towing capability, highway acceleration/passing ability, and driving range on a single tank of fuel.10 In addition, though PHEVs using manual transmissions are possible from an engineering standpoint, most automakers have decided not to offer this option to consumers. PHEVs also offer higher performance in some respects when compared to CVs. For example, starting acceleration for
Plug-In Hybrid Electric Vehicle Study for the Progress Energy Carolinas Territory page 6 of 27
CSE CONSULTING
PHEVs is greatly enhanced due to the extra torque provided by electric motors, which lack the need to “rev” the engine to transfer extra power to the wheels. Though there are inevitable tradeoffs in performance when designing any new vehicle, PHEVs are considered by design experts to be on par with conventional vehicles in most major aspects of performance considered important to consumers.11 A key point to consider in evaluating performance differences between PHEVs and CVs is that most performance tradeoffs represent not engineering limitations, but conscious, strategic decisions by the auto industry. These decisions are aimed to enhance the features consumers demand most, while de-emphasizing the features that are not in demand. The most obvious example is the deliberate and growing focus by automakers on fuel efficiency. This emphasis on “mileage over muscle” is driven by growing consumer interest in fuel economy over power and performance. This is demonstrated by Honda’s recent decision to discontinue production of the V6 version of its Accord HEV. According to Business Week magazine, “[t]he engineers at Honda got carried away with…the idea that a load of people would be impressed…with six cylinder power. Not so much. The typical Accord buyer is not that interested in horsepower. And to pay $9,000 more for the hybrid than the four-cylinder [CV] made sense to very few customers.12”
2.2.3 PHEV Features PHEVs have several new and attractive features compared to conventional vehicles. These include:
The ability to pre-heat or pre-cool the vehicle remotely A quieter ride, especially when operating in electric-only mode Added torque from the electric drivetrain Fuel-security from having dual power sources (electric and liquid fuel) The ability to operate the PHEV engine as an electric generator13
Consumer demand data is increasingly emphasizing the central performance feature of PHEVS: increased fuel efficiency. A recent on-line survey by Toyota reveals consumers’ growing preference for fuel-efficiency when making vehicle purchasing decisions. By a ratio of 6-to-1, consumers answered the question, “What direction would you like to see hybrids go?” by indicating they prefer higher fuel economy or PHEVs over increased power output.14
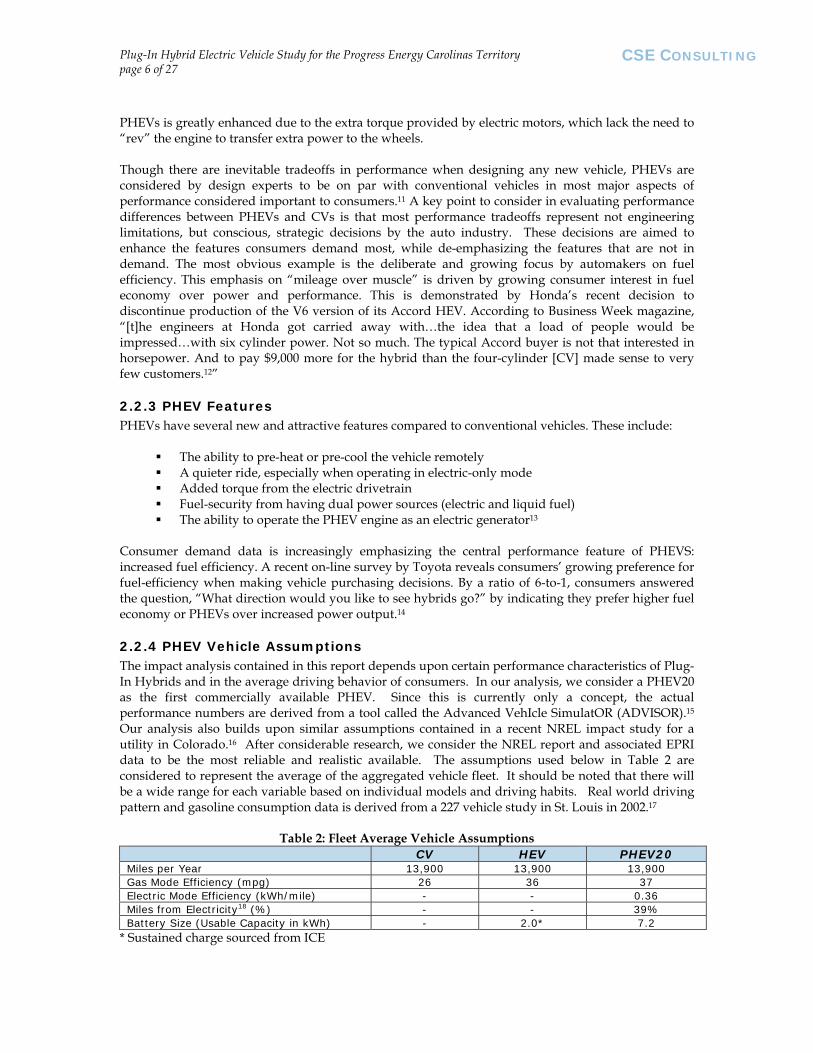
2.2.4 PHEV Vehicle Assumptions The impact analysis contained in this report depends upon certain performance characteristics of Plug-In Hybrids and in the average driving behavior of consumers. In our analysis, we consider a PHEV20 as the first commercially available PHEV. Since this is currently only a concept, the actual performance numbers are derived from a tool called the Advanced VehIcle SimulatOR (ADVISOR).15 Our analysis also builds upon similar assumptions contained in a recent NREL impact study for a utility in Colorado.16 After considerable research, we consider the NREL report and associated EPRI data to be the most reliable and realistic available. The assumptions used below in Table 2 are considered to represent the average of the aggregated vehicle fleet. It should be noted that there will be a wide range for each variable based on individual models and driving habits. Real world driving pattern and gasoline consumption data is derived from a 227 vehicle study in St. Louis in 2002.17
Table 2: Fleet Average Vehicle Assumptions CV HEV PHEV20
Miles per Year 13,900 13,900 13,900 Gas Mode Efficiency (mpg) 26 36 37 Electric Mode Efficiency (kWh/mile) - - 0.36 Miles from Electricity18 (%) - - 39% Battery Size (Usable Capacity in kWh) - 2.0* 7.2
* Sustained charge sourced from ICE
Plug-In Hybrid Electric Vehicle Study for the Progress Energy Carolinas Territory page 7 of 27
CSE CONSULTING
3.0 Auto Industry This section has been removed from the conference paper in order to focus on the grid impact to the local utility. The contents include a summary of the current PHEV conversion vehicles in the U.S. and the future plans of major automakers to manufacture PHEVs in the coming years.
4.0 Consumer Demand This section has been removed from the conference paper in order to focus on the grid impact to the local utility. The contents include an in depth analysis of the commercial viability of PHEVs and a market model developed to predict penetration rates in the Carolinas. The most likely PHEV20 sales market share is 26% by 2030. This results in 21% of the fleet, or 329,000 vehicles, in operation in the PEC region by 2030. The most sensitive variables in the PHEV market share model are in order: selection, market coverage/availability, utility, price premium, gasoline costs, and electricity costs. The full report contains the complete market analysis.
5.0 Progress Energy Carolinas Impact
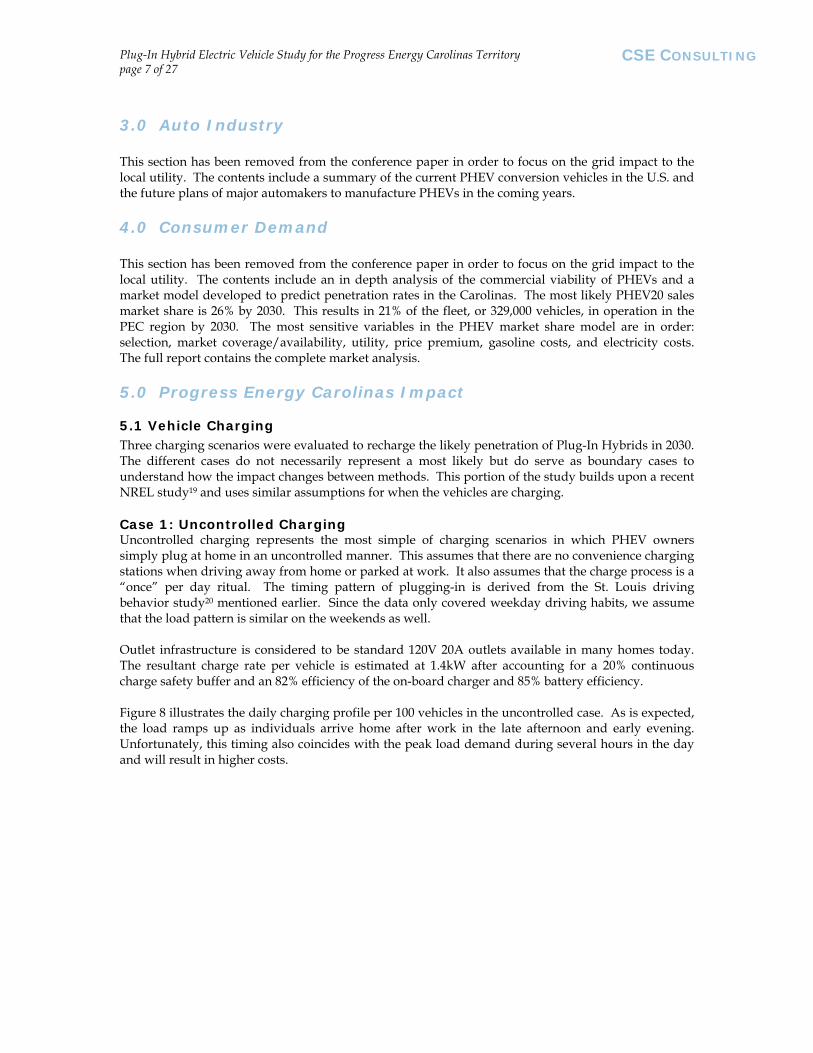
5.1 Vehicle Charging Three charging scenarios were evaluated to recharge the likely penetration of Plug-In Hybrids in 2030. The different cases do not necessarily represent a most likely but do serve as boundary cases to understand how the impact changes between methods. This portion of the study builds upon a recent NREL study19 and uses similar assumptions for when the vehicles are charging. Case 1: Uncontrolled Charging Uncontrolled charging represents the most simple of charging scenarios in which PHEV owners simply plug at home in an uncontrolled manner. This assumes that there are no convenience charging stations when driving away from home or parked at work. It also assumes that the charge process is a “once” per day ritual. The timing pattern of plugging-in is derived from the St. Louis driving behavior study20 mentioned earlier. Since the data only covered weekday driving habits, we assume that the load pattern is similar on the weekends as well. Outlet infrastructure is considered to be standard 120V 20A outlets available in many homes today. The resultant charge rate per vehicle is estimated at 1.4kW after accounting for a 20% continuous charge safety buffer and an 82% efficiency of the on-board charger and 85% battery efficiency. Figure 8 illustrates the daily charging profile per 100 vehicles in the uncontrolled case. As is expected, the load ramps up as individuals arrive home after work in the late afternoon and early evening. Unfortunately, this timing also coincides with the peak load demand during several hours in the day and will result in higher costs.
Plug-In Hybrid Electric Vehicle Study for the Progress Energy Carolinas Territory page 8 of 27
CSE CONSULTING
0
20
40
60
80
100
120
140
160
180
200
220
240
1 2 3 4 5 6 7 8 9 10 11 12 13 14 15 16 17 18 19 20 21 22 23 24
Hour Ending
kW/1
00 V
ehic
les
Figure 8: Uncontrolled Charging Daily Load Profile for 2026
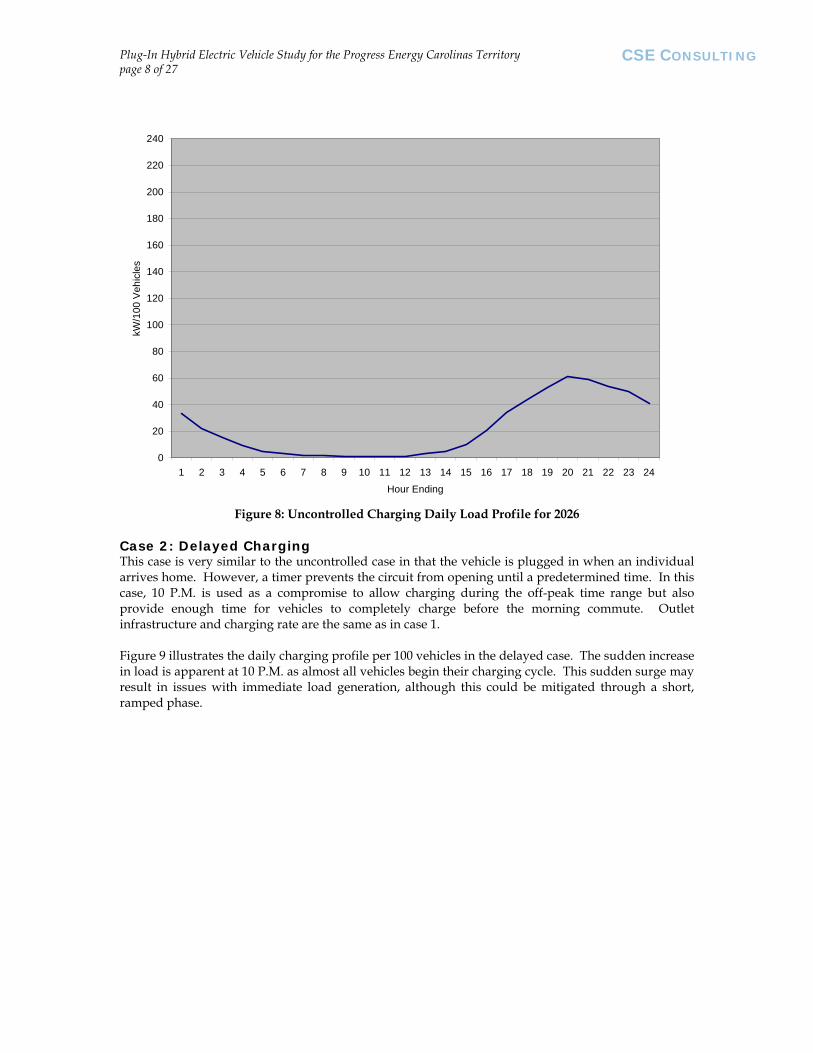
Case 2: Delayed Charging This case is very similar to the uncontrolled case in that the vehicle is plugged in when an individual arrives home. However, a timer prevents the circuit from opening until a predetermined time. In this case, 10 P.M. is used as a compromise to allow charging during the off-peak time range but also provide enough time for vehicles to completely charge before the morning commute. Outlet infrastructure and charging rate are the same as in case 1. Figure 9 illustrates the daily charging profile per 100 vehicles in the delayed case. The sudden increase in load is apparent at 10 P.M. as almost all vehicles begin their charging cycle. This sudden surge may result in issues with immediate load generation, although this could be mitigated through a short, ramped phase.
Plug-In Hybrid Electric Vehicle Study for the Progress Energy Carolinas Territory page 9 of 27
CSE CONSULTING
0
20
40
60
80
100
120
140
160
180
200
220
240
1 2 3 4 5 6 7 8 9 10 11 12 13 14 15 16 17 18 19 20 21 22 23 24Hour Ending
kW/1
00 V
ehic
les
Figure 9: Delayed Charging Daily Load Profile for 2026
Case 3: Optimized Off-Peak Charging This case is a boundary case for the most economical scenario. In this case, it is assumed that there are “smart” timers that allow the power company to initiate and stop the charging of individual vehicles. This may be accomplished through 2 way communication or a response to price signals sent through the electrical lines. The goal would be to fill in the time periods of lowest demand overnight with the required energy needed to recharge all available PHEVs. This could be reasonably calculated with historical trends of energy load and a rough estimate of the number of PHEVs attached to the grid. Since vehicles are often parked at the residence and not in use during this time, there is a significant window of time available. As long as vehicles are charged by the morning commute, individuals should not object to the scheduling. Actually getting individuals to agree to give up control of charging may still prove to be difficult. On the other hand, similar technology already exists that allows utilities to turn on and off air conditioning units and electric water heater due to excessive load demand. In order to optimize valley filling, the overall fleet charging rate must increase to about 2.3 kW based on the number of PHEV vehicles predicted in 2030. This is due to the steep valleys that can not be completely filled at the base charging rate of 1.4 kW and the low number of vehicles available. We estimate this would require about 22% of the vehicles to be charging on 240V 40A circuits for the worst case month of February. During the summer, the valleys become broader and therefore require less energy per hour to fill. The upgraded charging rate per vehicle is estimated at 5.7 kW after accounting for a 20% continuous charge safety buffer and an 87% efficiency of the on-board charger and 85% battery efficiency. As the number of vehicles available for charging increases, the percentage of 240V outlets required decreases. In the extreme case of 6x the incremental load, there is no requirement of upgraded outlets although the crossover occurs sometime before this load level. The optimized off-peak scenario requires feedback between the anticipated load and how best to fill the lowest region of the load curve. As seasons change, the position and breadth of the valley also changes within the day. As such, a constant daily load would not optimally fill in the valley
Plug-In Hybrid Electric Vehicle Study for the Progress Energy Carolinas Territory page 10 of 27
CSE CONSULTING
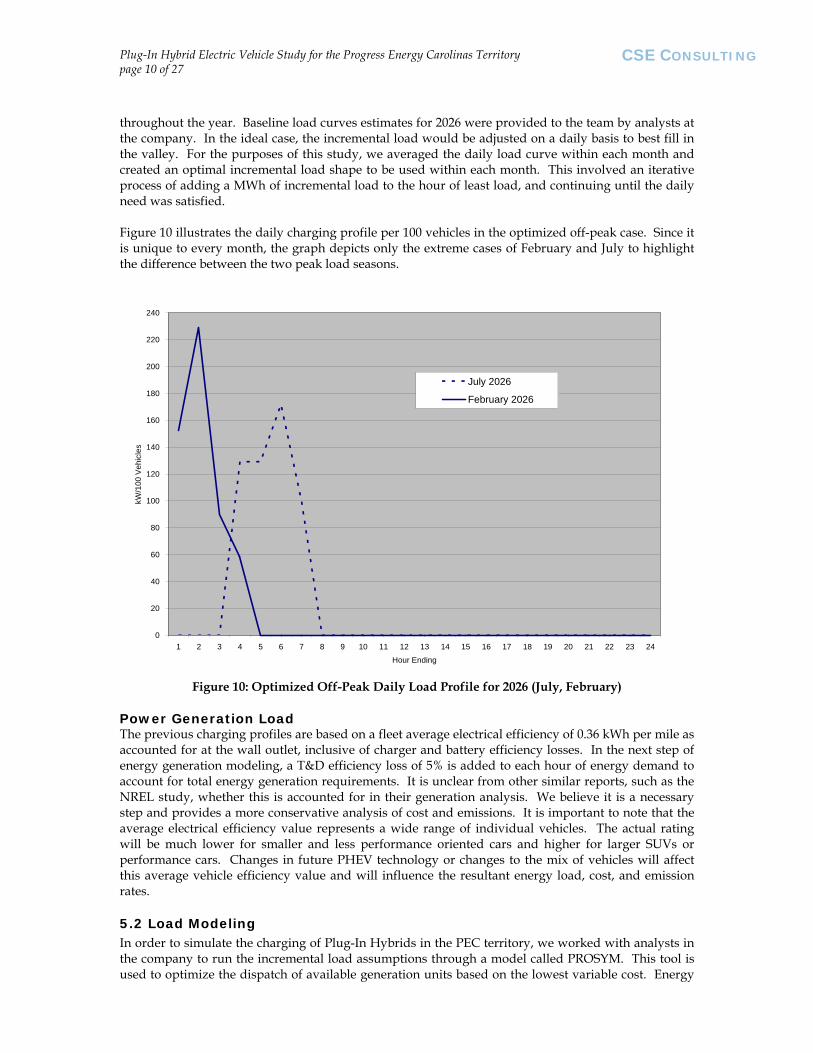
throughout the year. Baseline load curves estimates for 2026 were provided to the team by analysts at the company. In the ideal case, the incremental load would be adjusted on a daily basis to best fill in the valley. For the purposes of this study, we averaged the daily load curve within each month and created an optimal incremental load shape to be used within each month. This involved an iterative process of adding a MWh of incremental load to the hour of least load, and continuing until the daily need was satisfied. Figure 10 illustrates the daily charging profile per 100 vehicles in the optimized off-peak case. Since it is unique to every month, the graph depicts only the extreme cases of February and July to highlight the difference between the two peak load seasons.
0
20
40
60
80
100
120
140
160
180
200
220
240
1 2 3 4 5 6 7 8 9 10 11 12 13 14 15 16 17 18 19 20 21 22 23 24
Hour Ending
kW/1
00 V
ehic
les
July 2026
February 2026
Figure 10: Optimized Off-Peak Daily Load Profile for 2026 (July, February)
Power Generation Load The previous charging profiles are based on a fleet average electrical efficiency of 0.36 kWh per mile as accounted for at the wall outlet, inclusive of charger and battery efficiency losses. In the next step of energy generation modeling, a T&D efficiency loss of 5% is added to each hour of energy demand to account for total energy generation requirements. It is unclear from other similar reports, such as the NREL study, whether this is accounted for in their generation analysis. We believe it is a necessary step and provides a more conservative analysis of cost and emissions. It is important to note that the average electrical efficiency value represents a wide range of individual vehicles. The actual rating will be much lower for smaller and less performance oriented cars and higher for larger SUVs or performance cars. Changes in future PHEV technology or changes to the mix of vehicles will affect this average vehicle efficiency value and will influence the resultant energy load, cost, and emission rates.
5.2 Load Modeling In order to simulate the charging of Plug-In Hybrids in the PEC territory, we worked with analysts in the company to run the incremental load assumptions through a model called PROSYM. This tool is used to optimize the dispatch of available generation units based on the lowest variable cost. Energy

Plug-In Hybrid Electric Vehicle Study for the Progress Energy Carolinas Territory page 11 of 27
CSE CONSULTING
load requirements are input on an hourly basis for the entire year. Also included in the model are assumptions of capacity increases over the next 20 years which are often subject to change. Although we had planned to run the PROSYM model for the year 2030 to align with the last year of the market model, PROSYM is only able to predict out to 2026. Regardless, our team used the market penetration data from 2030 to input into in PROSYM and assumed that the generation capacity and costs would be similar between those years. The output of interest from the PROSYM simulations included generation mix, variable costs such as fuel, O&M, and startups, as well as total emissions for CO2, NOx, SO2, and Mercury. Four specific model runs will be examined in this study. The first three are the three different charging scenarios outlined above assuming the most likely PHEV fleet penetration rate of 21%. The actual number of vehicles, 323,500, is slightly lower than stated earlier due to later refinements of the market model; however the minor difference will not affect the incremental analysis. The last model run is an extreme case of six times the incremental energy load. This reflects an extremely optimistic case in which every vehicle is a PHEV with an increased all electric range of 30 miles as opposed to 20. While this is highly unlikely, it provides an interesting boundary case for the future. In this extreme case, we only examine the optimized off-peak charging scenario. For both the uncontrolled and delayed charging scenario, the incremental load is based only on time and therefore is the same for every day. This daily incremental load was added to the baseline by simply copying it to every day within the year. For the two optimized off-peak cases in which the position and shape of the valley changes seasonally, we instead apply a separate daily load profile for each month. Although it does not optimally fill the valley on a daily basis, on average it is considered a close assumption. All cases are compared against a baseline load generated in 2026 without consideration of any PHEV charging.
5.3 Results For the most likely PHEV penetration rate of 21%, the amount of required incremental energy is equal to 670 GWh over the course of the year. This is an increase of 0.8% over the baseline load. The extreme penetration case requires 4,170 GWh for the year, an increase of 4.7%. Each of the charging scenarios reflects a significant difference in the source and cost of electricity, and also impacts the incremental emissions. Although the extreme case will be depicted in most graphs as a reference, we will concentrate discussion on the most likely PHEV penetration results. As a reminder, the analysis is based in the last year available for PROSYM, 2026. We will first examine how the load curves change between charging scenarios.
5.3.1 Net PHEV Load The following graphs provide a comparison of the timing of the incremental load to the baseline load curve. Each graph is a snapshot of the average load curve for the month of July, typically the highest load of the year.

Plug-In Hybrid Electric Vehicle Study for the Progress Energy Carolinas Territory page 12 of 27
CSE CONSULTING
6,000
7,000
8,000
9,000
10,000
11,000
12,000
13,000
14,000
15,000
Hr-1
Hr-2
Hr-3
Hr-4
Hr-5
Hr-6
Hr-7
Hr-8
Hr-9
Hr-10
Hr-11
Hr-12
Hr-13
Hr-14
Hr-15
Hr-16
Hr-17
Hr-18
Hr-19
Hr-20
Hr-21
Hr-22
Hr-23
Hr-24
Hour Ending
MW
Case 1: Uncontrolled
Baseline
Figure 11: Net PHEV Load for Uncontrolled Charging Scenario (July 2026)
6,000
7,000
8,000
9,000
10,000
11,000
12,000
13,000
14,000
15,000
Hr-1
Hr-2
Hr-3
Hr-4
Hr-5
Hr-6
Hr-7
Hr-8
Hr-9
Hr-10
Hr-11
Hr-12
Hr-13
Hr-14
Hr-15
Hr-16
Hr-17
Hr-18
Hr-19
Hr-20
Hr-21
Hr-22
Hr-23
Hr-24
Hour Ending
MW
Case 2: Delayed
Baseline
Figure 12: Net PHEV Load for Delayed Charging Scenario (July 2026)
Plug-In Hybrid Electric Vehicle Study for the Progress Energy Carolinas Territory page 13 of 27
CSE CONSULTING
6,000
7,000
8,000
9,000
10,000
11,000
12,000
13,000
14,000
15,000
Hr-1
Hr-2
Hr-3
Hr-4
Hr-5
Hr-6
Hr-7
Hr-8
Hr-9
Hr-10
Hr-11
Hr-12
Hr-13
Hr-14
Hr-15
Hr-16
Hr-17
Hr-18
Hr-19
Hr-20
Hr-21
Hr-22
Hr-23
Hr-24
Hour Ending
MW
Case 3: Off-Peak (Most Likely)Case 3: Off-Peak (Extreme)Baseline
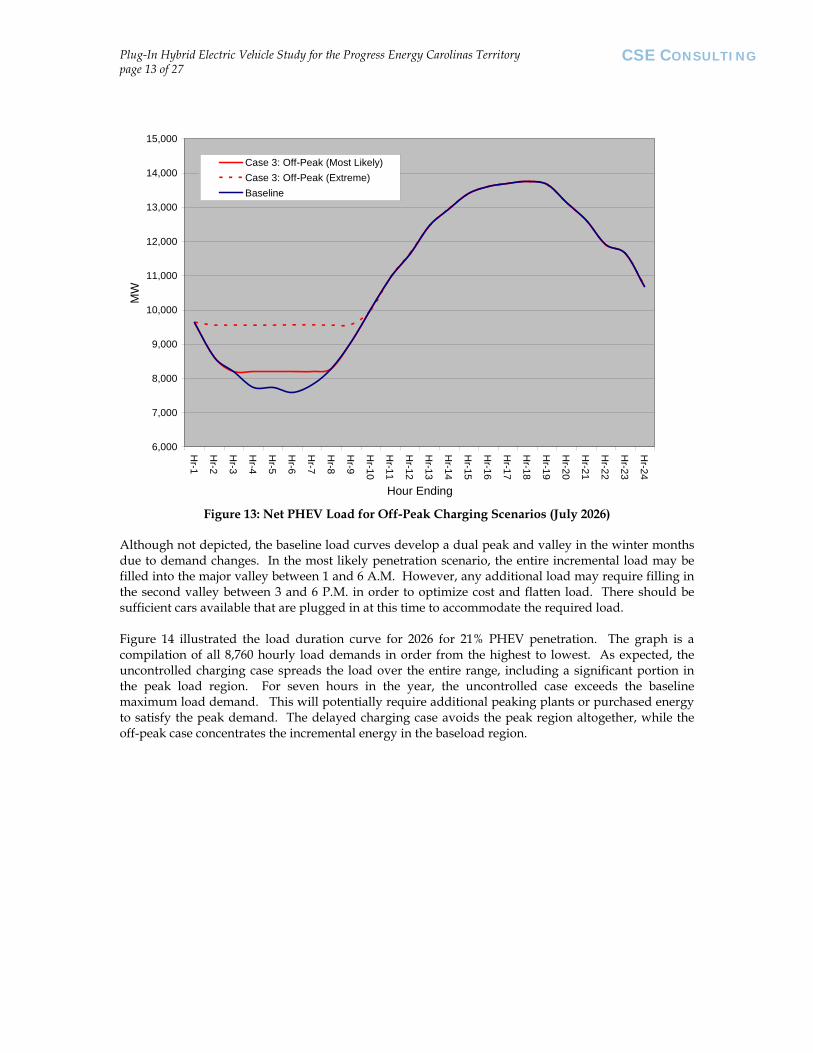
Figure 13: Net PHEV Load for Off-Peak Charging Scenarios (July 2026)
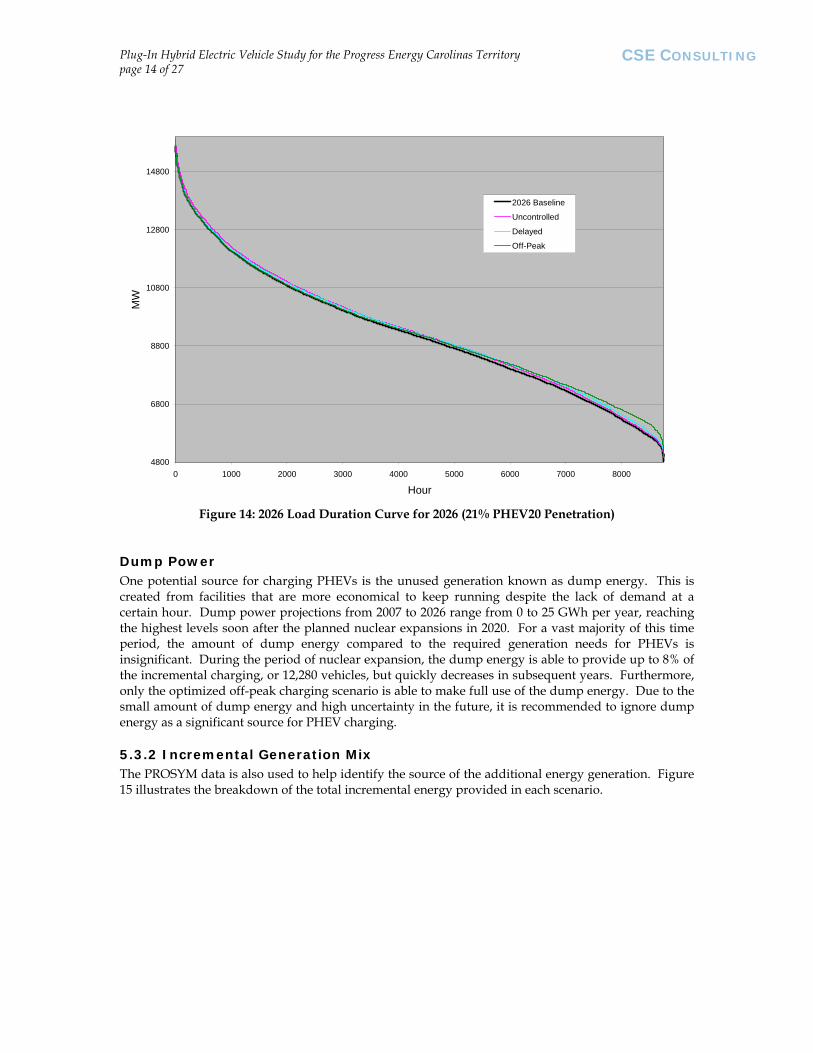
Although not depicted, the baseline load curves develop a dual peak and valley in the winter months due to demand changes. In the most likely penetration scenario, the entire incremental load may be filled into the major valley between 1 and 6 A.M. However, any additional load may require filling in the second valley between 3 and 6 P.M. in order to optimize cost and flatten load. There should be sufficient cars available that are plugged in at this time to accommodate the required load. Figure 14 illustrated the load duration curve for 2026 for 21% PHEV penetration. The graph is a compilation of all 8,760 hourly load demands in order from the highest to lowest. As expected, the uncontrolled charging case spreads the load over the entire range, including a significant portion in the peak load region. For seven hours in the year, the uncontrolled case exceeds the baseline maximum load demand. This will potentially require additional peaking plants or purchased energy to satisfy the peak demand. The delayed charging case avoids the peak region altogether, while the off-peak case concentrates the incremental energy in the baseload region.
Plug-In Hybrid Electric Vehicle Study for the Progress Energy Carolinas Territory page 14 of 27
CSE CONSULTING
4800
6800
8800
10800
12800
14800
0 1000 2000 3000 4000 5000 6000 7000 8000
Hour
MW
2026 Baseline
Uncontrolled
Delayed
Off-Peak
Figure 14: 2026 Load Duration Curve for 2026 (21% PHEV20 Penetration)
Dump Power One potential source for charging PHEVs is the unused generation known as dump energy. This is created from facilities that are more economical to keep running despite the lack of demand at a certain hour. Dump power projections from 2007 to 2026 range from 0 to 25 GWh per year, reaching the highest levels soon after the planned nuclear expansions in 2020. For a vast majority of this time period, the amount of dump energy compared to the required generation needs for PHEVs is insignificant. During the period of nuclear expansion, the dump energy is able to provide up to 8% of the incremental charging, or 12,280 vehicles, but quickly decreases in subsequent years. Furthermore, only the optimized off-peak charging scenario is able to make full use of the dump energy. Due to the small amount of dump energy and high uncertainty in the future, it is recommended to ignore dump energy as a significant source for PHEV charging.
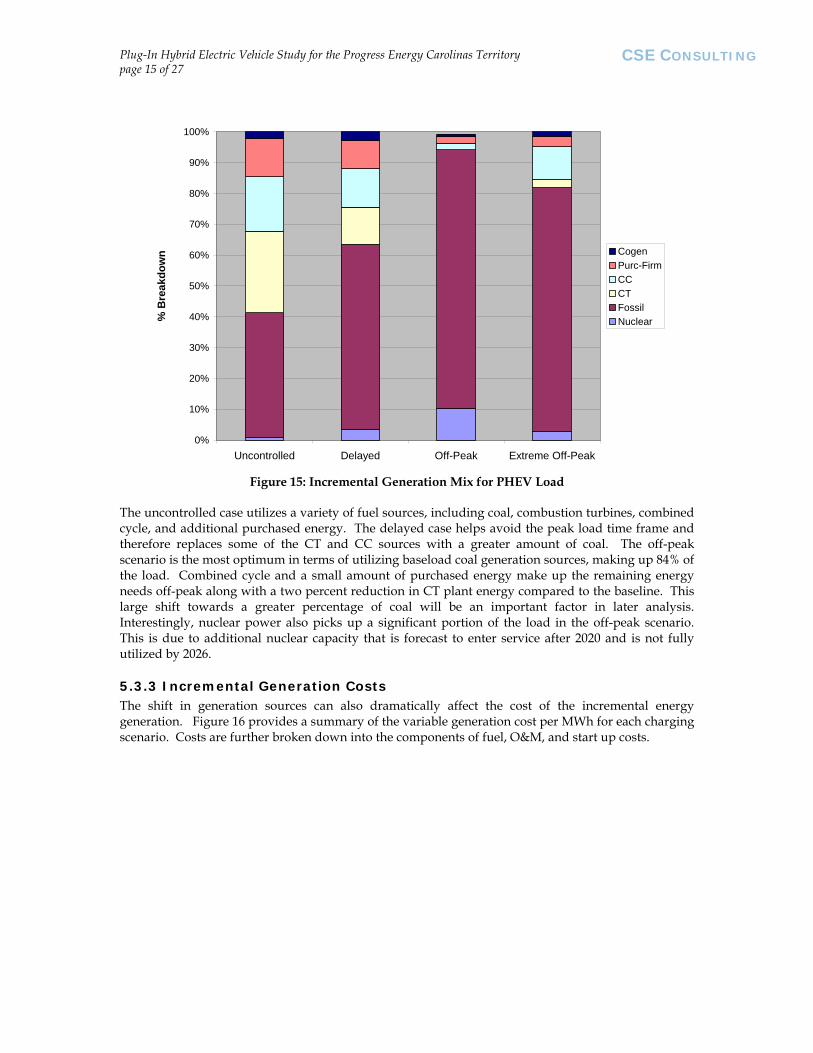
5.3.2 Incremental Generation Mix The PROSYM data is also used to help identify the source of the additional energy generation. Figure 15 illustrates the breakdown of the total incremental energy provided in each scenario.
Plug-In Hybrid Electric Vehicle Study for the Progress Energy Carolinas Territory page 15 of 27
CSE CONSULTING
0%
10%
20%
30%
40%
50%
60%
70%
80%
90%
100%
Uncontrolled Delayed Off-Peak Extreme Off-Peak
% B
reak
dow
n CogenPurc-FirmCCCTFossilNuclear
Figure 15: Incremental Generation Mix for PHEV Load
The uncontrolled case utilizes a variety of fuel sources, including coal, combustion turbines, combined cycle, and additional purchased energy. The delayed case helps avoid the peak load time frame and therefore replaces some of the CT and CC sources with a greater amount of coal. The off-peak scenario is the most optimum in terms of utilizing baseload coal generation sources, making up 84% of the load. Combined cycle and a small amount of purchased energy make up the remaining energy needs off-peak along with a two percent reduction in CT plant energy compared to the baseline. This large shift towards a greater percentage of coal will be an important factor in later analysis. Interestingly, nuclear power also picks up a significant portion of the load in the off-peak scenario. This is due to additional nuclear capacity that is forecast to enter service after 2020 and is not fully utilized by 2026.
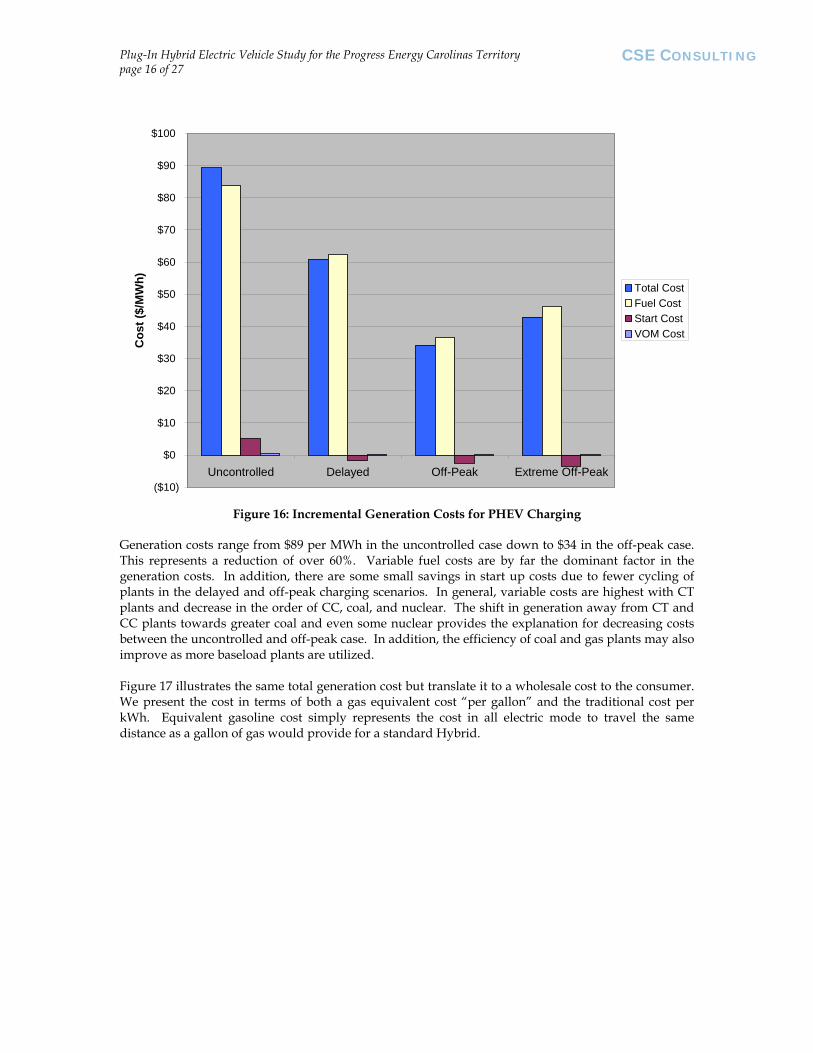
5.3.3 Incremental Generation Costs The shift in generation sources can also dramatically affect the cost of the incremental energy generation. Figure 16 provides a summary of the variable generation cost per MWh for each charging scenario. Costs are further broken down into the components of fuel, O&M, and start up costs.
Plug-In Hybrid Electric Vehicle Study for the Progress Energy Carolinas Territory page 16 of 27
CSE CONSULTING
($10)
$0
$10
$20
$30
$40
$50
$60
$70
$80
$90
$100
Uncontrolled Delayed Off-Peak Extreme Off-Peak
Cos
t ($/
MW
h)
Total CostFuel CostStart CostVOM Cost
Figure 16: Incremental Generation Costs for PHEV Charging
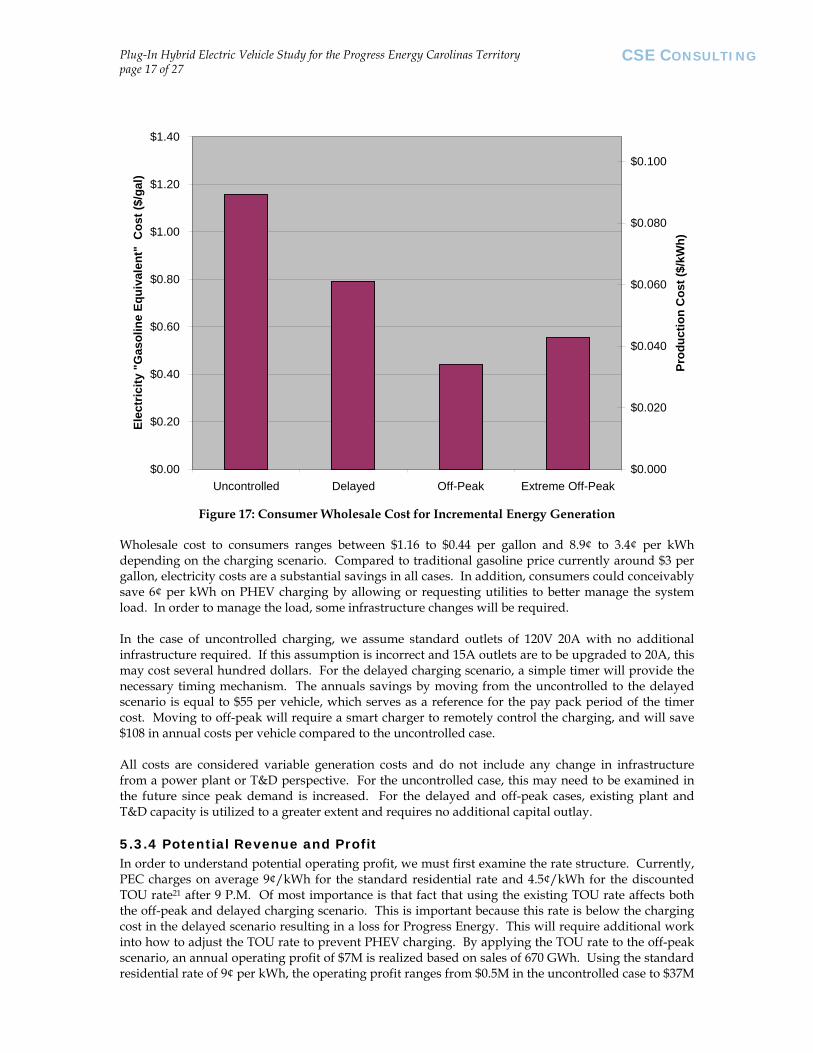
Generation costs range from $89 per MWh in the uncontrolled case down to $34 in the off-peak case. This represents a reduction of over 60%. Variable fuel costs are by far the dominant factor in the generation costs. In addition, there are some small savings in start up costs due to fewer cycling of plants in the delayed and off-peak charging scenarios. In general, variable costs are highest with CT plants and decrease in the order of CC, coal, and nuclear. The shift in generation away from CT and CC plants towards greater coal and even some nuclear provides the explanation for decreasing costs between the uncontrolled and off-peak case. In addition, the efficiency of coal and gas plants may also improve as more baseload plants are utilized. Figure 17 illustrates the same total generation cost but translate it to a wholesale cost to the consumer. We present the cost in terms of both a gas equivalent cost “per gallon” and the traditional cost per kWh. Equivalent gasoline cost simply represents the cost in all electric mode to travel the same distance as a gallon of gas would provide for a standard Hybrid.
Plug-In Hybrid Electric Vehicle Study for the Progress Energy Carolinas Territory page 17 of 27
CSE CONSULTING
$0.00
$0.20
$0.40
$0.60
$0.80
$1.00
$1.20
$1.40
Uncontrolled Delayed Off-Peak Extreme Off-Peak
Elec
tric
ity "
Gas
olin
e Eq
uiva
lent
" C
ost (
$/ga
l)
$0.000
$0.020
$0.040
$0.060
$0.080
$0.100
Prod
uctio
n C
ost (
$/kW
h)
Figure 17: Consumer Wholesale Cost for Incremental Energy Generation
Wholesale cost to consumers ranges between $1.16 to $0.44 per gallon and 8.9¢ to 3.4¢ per kWh depending on the charging scenario. Compared to traditional gasoline price currently around $3 per gallon, electricity costs are a substantial savings in all cases. In addition, consumers could conceivably save 6¢ per kWh on PHEV charging by allowing or requesting utilities to better manage the system load. In order to manage the load, some infrastructure changes will be required. In the case of uncontrolled charging, we assume standard outlets of 120V 20A with no additional infrastructure required. If this assumption is incorrect and 15A outlets are to be upgraded to 20A, this may cost several hundred dollars. For the delayed charging scenario, a simple timer will provide the necessary timing mechanism. The annuals savings by moving from the uncontrolled to the delayed scenario is equal to $55 per vehicle, which serves as a reference for the pay pack period of the timer cost. Moving to off-peak will require a smart charger to remotely control the charging, and will save $108 in annual costs per vehicle compared to the uncontrolled case. All costs are considered variable generation costs and do not include any change in infrastructure from a power plant or T&D perspective. For the uncontrolled case, this may need to be examined in the future since peak demand is increased. For the delayed and off-peak cases, existing plant and T&D capacity is utilized to a greater extent and requires no additional capital outlay.
5.3.4 Potential Revenue and Profit In order to understand potential operating profit, we must first examine the rate structure. Currently, PEC charges on average 9¢/kWh for the standard residential rate and 4.5¢/kWh for the discounted TOU rate21 after 9 P.M. Of most importance is that fact that using the existing TOU rate affects both the off-peak and delayed charging scenario. This is important because this rate is below the charging cost in the delayed scenario resulting in a loss for Progress Energy. This will require additional work into how to adjust the TOU rate to prevent PHEV charging. By applying the TOU rate to the off-peak scenario, an annual operating profit of $7M is realized based on sales of 670 GWh. Using the standard residential rate of 9¢ per kWh, the operating profit ranges from $0.5M in the uncontrolled case to $37M
Plug-In Hybrid Electric Vehicle Study for the Progress Energy Carolinas Territory page 18 of 27
CSE CONSULTING
in the off-peak case with the same incremental sales. It is important to note that this load level could just be the first phase and will continue to grow as the fleet derives a greater percentage of miles from electricity. For example, the extreme PHEV penetration case achieves almost $200M in operating profit assuming a standard rate plan.
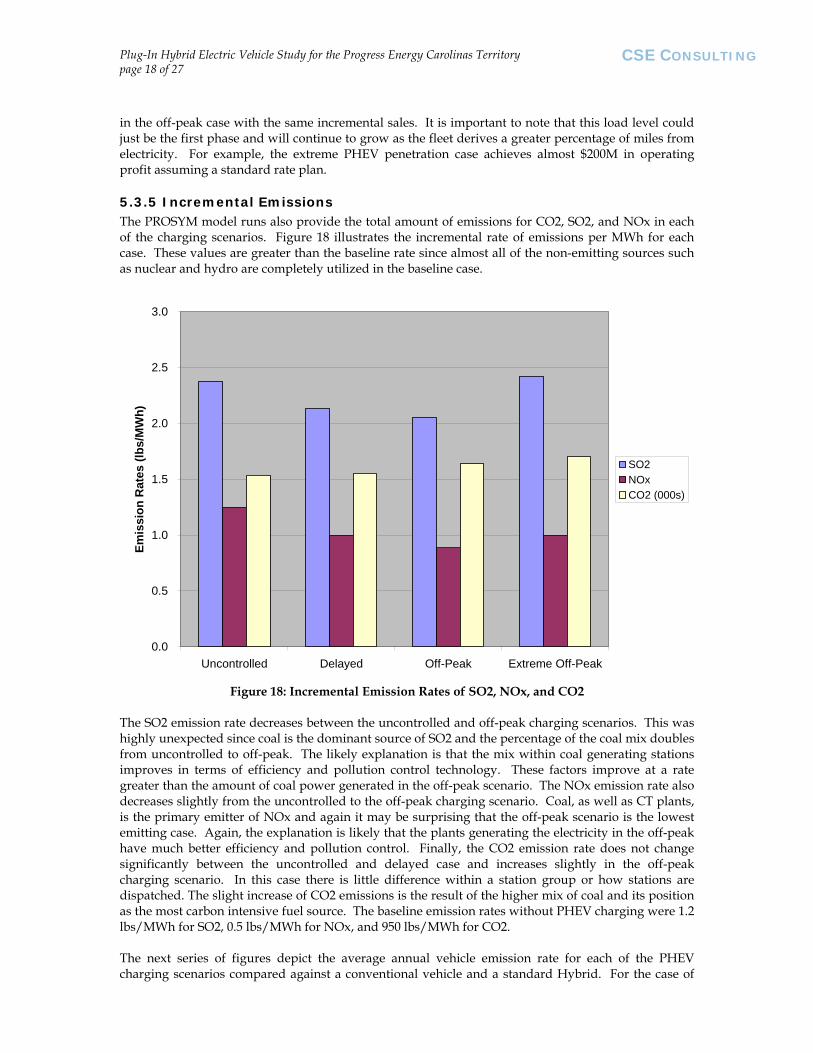
5.3.5 Incremental Emissions The PROSYM model runs also provide the total amount of emissions for CO2, SO2, and NOx in each of the charging scenarios. Figure 18 illustrates the incremental rate of emissions per MWh for each case. These values are greater than the baseline rate since almost all of the non-emitting sources such as nuclear and hydro are completely utilized in the baseline case.
0.0
0.5
1.0
1.5
2.0
2.5
3.0
Uncontrolled Delayed Off-Peak Extreme Off-Peak
Emis
sion
Rat
es (l
bs/M
Wh)
SO2NOxCO2 (000s)
Figure 18: Incremental Emission Rates of SO2, NOx, and CO2
The SO2 emission rate decreases between the uncontrolled and off-peak charging scenarios. This was highly unexpected since coal is the dominant source of SO2 and the percentage of the coal mix doubles from uncontrolled to off-peak. The likely explanation is that the mix within coal generating stations improves in terms of efficiency and pollution control technology. These factors improve at a rate greater than the amount of coal power generated in the off-peak scenario. The NOx emission rate also decreases slightly from the uncontrolled to the off-peak charging scenario. Coal, as well as CT plants, is the primary emitter of NOx and again it may be surprising that the off-peak scenario is the lowest emitting case. Again, the explanation is likely that the plants generating the electricity in the off-peak have much better efficiency and pollution control. Finally, the CO2 emission rate does not change significantly between the uncontrolled and delayed case and increases slightly in the off-peak charging scenario. In this case there is little difference within a station group or how stations are dispatched. The slight increase of CO2 emissions is the result of the higher mix of coal and its position as the most carbon intensive fuel source. The baseline emission rates without PHEV charging were 1.2 lbs/MWh for SO2, 0.5 lbs/MWh for NOx, and 950 lbs/MWh for CO2. The next series of figures depict the average annual vehicle emission rate for each of the PHEV charging scenarios compared against a conventional vehicle and a standard Hybrid. For the case of
Plug-In Hybrid Electric Vehicle Study for the Progress Energy Carolinas Territory page 19 of 27
CSE CONSULTING
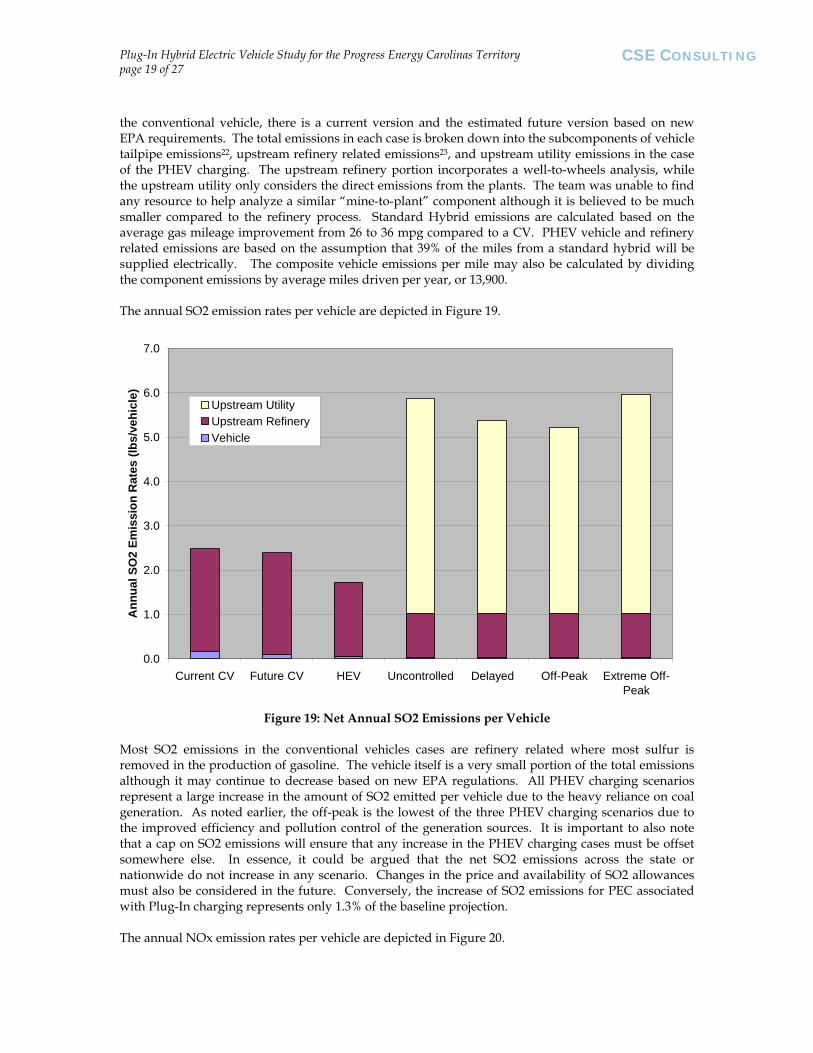
the conventional vehicle, there is a current version and the estimated future version based on new EPA requirements. The total emissions in each case is broken down into the subcomponents of vehicle tailpipe emissions22, upstream refinery related emissions23, and upstream utility emissions in the case of the PHEV charging. The upstream refinery portion incorporates a well-to-wheels analysis, while the upstream utility only considers the direct emissions from the plants. The team was unable to find any resource to help analyze a similar “mine-to-plant” component although it is believed to be much smaller compared to the refinery process. Standard Hybrid emissions are calculated based on the average gas mileage improvement from 26 to 36 mpg compared to a CV. PHEV vehicle and refinery related emissions are based on the assumption that 39% of the miles from a standard hybrid will be supplied electrically. The composite vehicle emissions per mile may also be calculated by dividing the component emissions by average miles driven per year, or 13,900. The annual SO2 emission rates per vehicle are depicted in Figure 19.
0.0
1.0
2.0
3.0
4.0
5.0
6.0
7.0
Current CV Future CV HEV Uncontrolled Delayed Off-Peak Extreme Off-Peak
Ann
ual S
O2
Emis
sion
Rat
es (l
bs/v
ehic
le)
Upstream UtilityUpstream RefineryVehicle
Figure 19: Net Annual SO2 Emissions per Vehicle
Most SO2 emissions in the conventional vehicles cases are refinery related where most sulfur is removed in the production of gasoline. The vehicle itself is a very small portion of the total emissions although it may continue to decrease based on new EPA regulations. All PHEV charging scenarios represent a large increase in the amount of SO2 emitted per vehicle due to the heavy reliance on coal generation. As noted earlier, the off-peak is the lowest of the three PHEV charging scenarios due to the improved efficiency and pollution control of the generation sources. It is important to also note that a cap on SO2 emissions will ensure that any increase in the PHEV charging cases must be offset somewhere else. In essence, it could be argued that the net SO2 emissions across the state or nationwide do not increase in any scenario. Changes in the price and availability of SO2 allowances must also be considered in the future. Conversely, the increase of SO2 emissions for PEC associated with Plug-In charging represents only 1.3% of the baseline projection. The annual NOx emission rates per vehicle are depicted in Figure 20.

Plug-In Hybrid Electric Vehicle Study for the Progress Energy Carolinas Territory page 20 of 27
CSE CONSULTING
0.0
2.0
4.0
6.0
8.0
10.0
12.0
14.0
Current CV Future CV HEV Uncontrolled Delayed Off-Peak Extreme Off-Peak
Ann
ual N
Ox
Emis
sion
Rat
es (l
bs/v
ehic
le) Upstream Utility
Upstream RefineryVehicle
Figure 20: Net Annual NOx Emissions per Vehicle
The most obvious difference in NOx emissions is an EPA change to future vehicles under Tier 2 standards. This presents a much lower baseline for the new PHEVs to compete against. However, all PHEV charging cases are still lower than a CV and the off-peak charging scenario is almost equivalent. In addition, a cap on NOx emissions will have the same effect as with SO2, providing no net increase on a state or nationwide level. EPA rules are always evolving and significant changes to emission standards will likely continue to occur at the refinery, vehicle, and utility level making future comparisons very difficult. In addition, there are potential technology difficulties for PHEVs to ensure that emission control equipment is hot enough to optimally perform after long periods of the engine not running and then suddenly starting. The annual CO2 emission rates are depicted in figure 21.
Plug-In Hybrid Electric Vehicle Study for the Progress Energy Carolinas Territory page 21 of 27
CSE CONSULTING
0.0
1.0
2.0
3.0
4.0
5.0
6.0
7.0
Current CV Future CV HEV Uncontrolled Delayed Off-Peak Extreme Off-Peak
Ann
ual C
O2
Emis
sion
Rat
es (t
ons/
vehi
cle)
Upstream UtilityUpstream RefineryVehicle
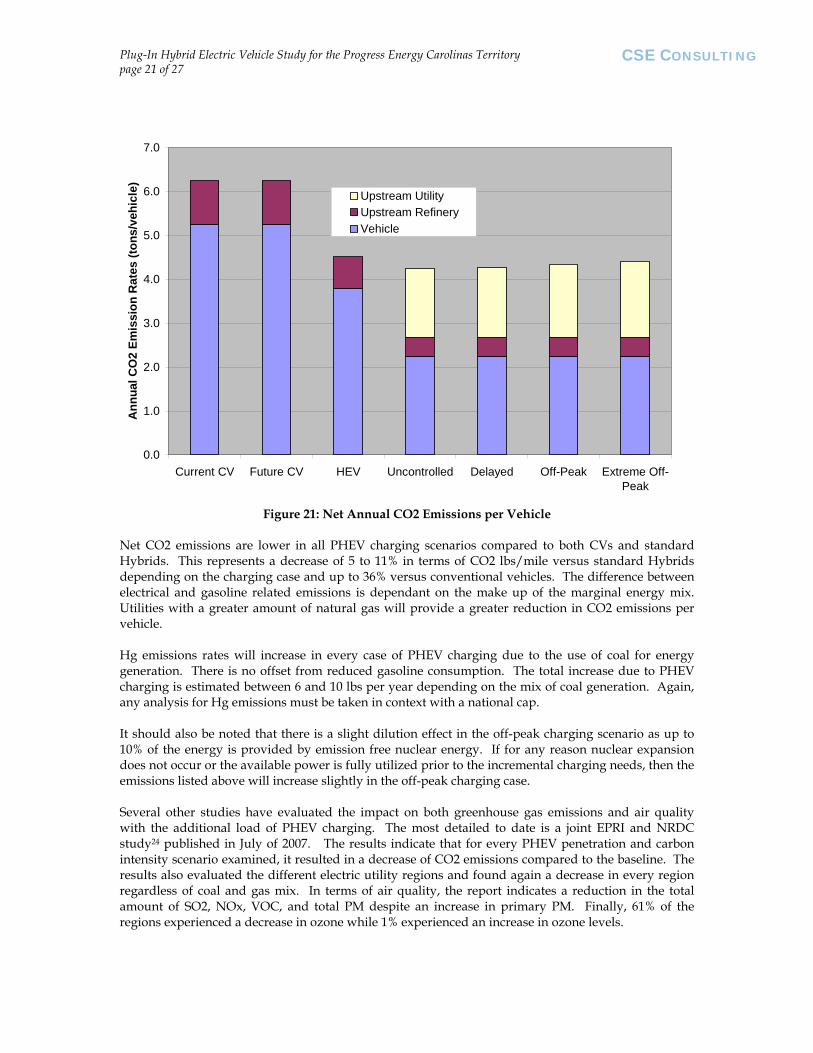
Figure 21: Net Annual CO2 Emissions per Vehicle
Net CO2 emissions are lower in all PHEV charging scenarios compared to both CVs and standard Hybrids. This represents a decrease of 5 to 11% in terms of CO2 lbs/mile versus standard Hybrids depending on the charging case and up to 36% versus conventional vehicles. The difference between electrical and gasoline related emissions is dependant on the make up of the marginal energy mix. Utilities with a greater amount of natural gas will provide a greater reduction in CO2 emissions per vehicle. Hg emissions rates will increase in every case of PHEV charging due to the use of coal for energy generation. There is no offset from reduced gasoline consumption. The total increase due to PHEV charging is estimated between 6 and 10 lbs per year depending on the mix of coal generation. Again, any analysis for Hg emissions must be taken in context with a national cap. It should also be noted that there is a slight dilution effect in the off-peak charging scenario as up to 10% of the energy is provided by emission free nuclear energy. If for any reason nuclear expansion does not occur or the available power is fully utilized prior to the incremental charging needs, then the emissions listed above will increase slightly in the off-peak charging case. Several other studies have evaluated the impact on both greenhouse gas emissions and air quality with the additional load of PHEV charging. The most detailed to date is a joint EPRI and NRDC study24 published in July of 2007. The results indicate that for every PHEV penetration and carbon intensity scenario examined, it resulted in a decrease of CO2 emissions compared to the baseline. The results also evaluated the different electric utility regions and found again a decrease in every region regardless of coal and gas mix. In terms of air quality, the report indicates a reduction in the total amount of SO2, NOx, VOC, and total PM despite an increase in primary PM. Finally, 61% of the regions experienced a decrease in ozone while 1% experienced an increase in ozone levels.
Plug-In Hybrid Electric Vehicle Study for the Progress Energy Carolinas Territory page 22 of 27
CSE CONSULTING
6.0 External Factors Although we have discussed in great detail the direct financial and emission impacts to Progress Energy Carolinas, there are additional societal or external effects to take into consideration as well. A significant penetration of PHEVs can serve as an integral part of the solution towards greater energy independence and using alternative fuels. In this simple case, we assume a PHEV20 will replace 40% of the gasoline required for the average driver. The U.S. currently imports 12.5 M barrels of oil a day, 9.1 M of which supplies our motor gasoline needs.25 If everyone owned a PHEV20, the U.S. could reduce the amount of imported oil by 28%. As PHEV technology advances, so will the reduction in oil imports. Many groups advocate such a change will help provide greater national security by reducing the reliance on unstable regions throughout the world.26 In addition, imported oil currently makes up a significant amount of the national trade deficit. The money otherwise spent on imported goods will instead go towards greater domestic energy production. Finally, the ability to use bio-fuels as a replacement for gasoline has received much press, however the potential capacity of current corn based ethanol is limited and may only be able to replace up to 30% of gasoline demand.27 In addition, significant corn supply and price pressures have already increased the price of food and other related products. PHEVs will reduce the amount of liquid fuels required and provide the ability for bio-fuels to potentially completely replace gasoline. The technology associated with PHEVs will also provide an excellent starting platform for eventual all electric vehicles or even fuel cell technology. The shifting of pollution from millions of vehicles to a few dozen fixed sites presents greater opportunities to improve air quality and reduce GHG emissions. Even if emissions related to utility charging of PHEVs are equal to the emissions generated through gasoline combustion, health effects could be dramatically improved by the relocation away from densely populated cities. More importantly, the transition towards a few fixed sites opens up new opportunities to help further reduce emissions that would be economically unfeasible or impossible on a vehicle level. This includes the ability to add post-combustion controls which will continue to improve or may not be completely installed across all generation plants. New technology in terms of efficiency improvements or carbon capture and sequestration may also become available in the future for utilities. In addition, renewable energy sources may now be utilized to help power vehicles through the storage of solar, wind, or biomass energy. Finally, these costs can be evenly spread over billions of kWh providing lower costs to consumers than on-board vehicle changes.
7.0 Summary of Risks and Benefits
7.1 Benefits Each major stakeholder involved the PHEV landscape will realize benefits from the adoption of PHEV technology. For the auto industry, they will be able to provide a differentiated product and offer new and enhanced features that consumers are beginning to demand. The fact that the Prius is listed as the 6th most popular passenger car and 9th most popular vehicle sold28 in the U.S. is proof that the market is evolving towards Hybrid technology. In addition, it may be an important strategic component for the auto industry to achieve new CAFÉ standards. Consumers will have greater opportunity to purchase vehicles that are much lower in fuel costs and have a lower impact on the environment. Other features such as a quieter ride or auxiliary power without an engine running may also provide greater utility to consumers. Finally, a study by EPRI indicated that 56% of individuals preferred plugging in at home versus 4% that preferred to fuel at gas stations.29 Utilities such as Progress Energy benefit from additional sales without having to build or expand existing generation capacity. The load curve may be flattened and baseload plants can be utilized to a greater extent along with fewer cycling of peak plants. One of the biggest issues of always providing energy on demand may also be alleviated by the ability to store energy in hundreds of thousands of batteries and then utilize it at a later time. This may have a significant impact on the business case for

Plug-In Hybrid Electric Vehicle Study for the Progress Energy Carolinas Territory page 23 of 27
CSE CONSULTING
renewable energy sources such as wind which can not be dispatched and must be fully utilized. Finally, Vehicle to Grid (V2G) technology may advance to allow vehicles to supply energy back to the grid in periods of high demand. This could reduce the need to build inefficient peaking plants that are only utilized for a fraction of the year. In addition, it may provide consumers an additional revenue stream and provide a more compelling financial case for PHEVs. The common ground for all stakeholders is the potential for greater value for each entity. Each may also find a common cause in reducing the system load, whether you think of it as an electrical utility demand or on a more global scale. Finally, there is a strong case towards greater health and wellness with the ability for significant improvements in the future. By working together in recognition of these common benefits, the likelihood of successful PHEV penetration can be dramatically improved as opposed to the involvement of just one or two stakeholders.
7.2 Risks As with any new technology adoption, there are many potential barriers that may slow or prevent widespread adoption of PHEVs. In the case of the auto industry, the most significant concern is battery technology. New Li-On battery technology is quickly advancing and very promising, but it may be several years before they are commercially available in vehicles. Also of particular concern is the unknown factor of whether consumers will buy the product despite higher prices. The industry is very cautious in investing millions in new research and production without assurances of consumer demand. Similarly, consumers will not adopt PHEVs at a significant rate without a wide selection available and effective cost on par with other offerings. This creates a difficult cycle in which the industry will stall arguing little demand and consumers arguing there is little demand due to the initial high prices and low selection. Consumers will also need greater education on the benefits and operation of PHEVs since little is known today. Utilities will also face several minor risks, although not as major as the other stakeholders. The current rate plan must be modified to help encourage individuals to plug in when best determined by the utility without offering a TOU rate below the generation costs. Due to the cheap prices of electricity relative to gas, consumers may simply decide to plug in at any time of day which could lead to increased peak demand. The ability for utilities to optimize off-peak charging will also require smart timers and upgraded 240V outlets in some homes. Finally, if a significant amount of revenue is lost in gas road taxes, the government may begin to tax a portion of electricity sales to recover the amount. There are several actions that Progress Energy can take to help mitigate these risks. Internally, the company can begin to research and develop new rate plans to help encourage optimum PHEV charging while not losing money. The company may also choose to develop closer ties to those already experimenting with smart meters, such as SoCal Edison or EPRI. In regards to outlet upgrades, research could be conducted to gauge the cost of retrofitting existing outlets or pushing for new homes to require a 240V outlet in the garage. Externally, Progress Energy can still provide some influence in mitigating the risks to consumers and the auto industry. The company can initiate a campaign to help educate consumers, through billing inserts or other advertising on the benefits of PHEVs. It may develop rebates or encourage government legislation to provide tax credits to help jumpstart the adoption of new PHEVs. Through its customer base, it may seek to compile soft orders to help demonstrate the level of demand. Finally, it can participate in PHEV trials or help provide battery warranty assurances to consumers. All of these actions will help reduce the up front costs to consumers and the risks to automakers of moving forward with PHEV model introductions.
Plug-In Hybrid Electric Vehicle Study for the Progress Energy Carolinas Territory page 24 of 27
CSE CONSULTING
8.0 Conclusions The cost of electricity in equivalent terms of gasoline ranges from $0.44 to $1.16 per gallon, far
below the prevailing rate of $3 per gallon of gasoline currently. This can provide fuel savings in the range of $1,000-1,400 per year versus a CV and $300-400 per year versus a HEV.
The incremental load required to charge PHEVs in 2030 represents less than 0.8% of the total
baseline generation estimate and less than 5% in the extreme case of 100% PHEV30 penetration. Uncontrolled charging of a significant number of PHEV vehicles will result in peak load demand
in both the summer and winter. This could potentially require capacity increase to generation plants or T&D.
The incremental load for even a massive number of PHEV vehicles can easily be accommodated
through the use of a simple timer to delay charging until after 10 P.M. Even more sophisticated smart meters will allow the Utility to optimize the load and provide the most economical and efficient power generation.
Coal use dramatically increases between the uncontrolled and off-peak case, providing for a 60%
decrease in the generation cost for the off-peak case. Generation costs range from 3.4 to 8.9¢ per kWh depending on the charging scenario.
Incremental emission rates for SO2 and NOx decrease moving from the uncontrolled to the off-
peak charging scenario despite the increase in coal mix. This is likely due to the dispatch of generating stations with greater efficiency and/or pollution controls. The CO2 emission rate is stable between the uncontrolled and delayed charging case, but rises slightly in the off-peak case due to the greater mix of carbon intense coal.
Total net SO2 emission rate from the PHEV cases is much greater than CVs or HEVs. This is a
result of the high sulfur content in coal and the minute amounts in gasoline. Any analysis in SO2 emissions must be taken in context with the cap and trade system for SO2. Any increase due to utility generation must be offset elsewhere to prevent a net increase.
The total net NOx emission rate from PHEV charging is less than a CV but equal to or slightly
more compared to a HEV. However, there are likely additional emission controls that will help to reduce the utility impact in the future. In addition, a cap on NOx emissions will result in no increase of net NO2 emissions on a larger scale.
The total emission rate for Hg is completely driven by coal and there is no offset from reduced
gasoline consumption. Hg emissions are expected to increase from 6-10 lbs per year depending on the mix of coal.
The total net CO2 emission rate from PHEV charging is significantly lower than CVs and 5-11%
lower than HEVs for all cases. In addition, this move opens the possibility to provide carbon free emissions to power vehicles through renewable and nuclear power.
8.1 Recommendations Based on the analysis contained in this report, CSE Consulting recommends that Progress Energy Carolinas pursue the following strategies:
1) Seize the opportunity and become a leader and advocate for PHEV technology
Plug-In Hybrid Electric Vehicle Study for the Progress Energy Carolinas Territory page 25 of 27
CSE CONSULTING
Based on this and other studies, there appears to be little risk and significant gain with respect to Progress Energy and its consumer base. From a financial standpoint, the generation cost is well below the consumer’s willingness to pay and so the only question is how much the company can afford to risk in promoting the program. We believe that $1M invested in up front promotion would quickly be recovered from additional sales later on. In the worst case, the publicity and market awareness may still be worth the investment. It is also the opinion of CSE Consulting that Progress Energy Carolinas is currently lagging behind in public awareness of activities focused on improving efficiency, improving health, and mitigating GHG emissions. This may be in contrast to actual activities inside the company, however a coordinated effort should be employed to ensure that the customer base is aware of any such activities and that they align with expectations. Conversely, another large utility in the region is well known for its activities in pushing for a carbon tax and interest in CCS and new coal gasification technology. We believe a PHEV program would be the ideal opportunity for Progress Energy to take a leadership position in an effort that provides benefits to consumers, the environment, and the Utility.
2) Tie program into a larger scale effort in carbon reduction Part of the rationale for PHEV technology is the reduction of greenhouse gases. If this is truly an argument presented to the public, then it makes sense for Progress Energy to also pursue a carbon reduction strategy for its own power generation. The benefit gained for converting from a CV to a PHEV is a one time gain in which a utility does not have to actively change its power generation technology. Furthermore, any utility can provide this benefit. We recommend that Progress Energy tie together the PHEV program with a longer term vision of reducing carbon emissions through greater renewable energy and improvements to existing generation technology. Based on the current political and societal trends, it is likely that some sort of carbon tax will exist in the future. The Supreme Court recently pronounced that the EPA does indeed have the authority and responsibility to regulate GHGs.30 In addition, renewable energy portfolios standards are currently working their way through the state legislature. By focusing on a strategy to reduce carbon emissions today, Progress Energy will not only reduce its risk in the future, but will also become associated as a leader in reducing its impact on the environment.
The ideal combination of both strategies is to pursue a renewable energy program and connect the incremental energy required by PHEVs to a carbon free source. Much like NC GreenPower, the actual power generation does not have to directly charge the vehicles, just offset an equivalent generation source of coal or gas. The total generation capability to charge PHEVs is quite small, even in 2030. We estimate that an equivalent renewable energy generation plant of 75 MW would be able to supply PHEV needs, compared to the current total capacity of 21,000 MW. We believe the promotional effect will be exponential by the image of vehicles fueled from renewable sources. It will also influence consumers to be more willing to voluntarily agree to special rate or timing plans. As a back up, it can still be shown that with over 80% coal generation, net CO2 emissions can still decrease with PHEVs. Finally, if utilities are required to supply a certain level of renewable energy, it will be easy for critics to counter the argument of carbon free incremental charging. Because of this, we recommend going above and beyond the minimum requirements to clearly demonstrate that “old” energy sources are replaced. Again, this study indicates the percent of total generation effected is less than 0.8% in 2030.
8.2 Next Steps Our team has compiled a list of suggested action items to help promote a PHEV program in the Carolinas. Short Term (6 months)

Plug-In Hybrid Electric Vehicle Study for the Progress Energy Carolinas Territory page 26 of 27
CSE CONSULTING
Create an internal PHEV working group across functions to be the subject matter experts in their field. This should include those working in finance, marketing, energy policy, generation, environmental, and other groups.
Reach out to external partners early on. Success of PHEVs will depend on a broad coalition of partners.
Study the commercial and governmental fleet impact. Complete a similar study for PE Florida. Verify the financials and results in this study. Develop and announce a PHEV program (including the following components):
Join Plug-in Partners. Participate in a PHEV trial (EPRI is currently seeking bucket truck sponsors). Create a $1M fund to help subsidize adoption costs. Educate consumers and employees
Intermediate (6-18 months)
Investigate carbon reduction technology options. Incorporate energy storage potential into business case for renewable energy. Build broad coalition to promote PHEVs across the country (EEI). Get involved with research into Smart Meter and V2G technology. Develop new rate and incentive plans.
Long Term (18+ months)
Determine outlet upgrade strategy if required. Utilize the Claritas Prizm offering to help better understand and target the market. Secure leadership position in renewable and carbon reduction technologies.
In closing, we emphasize that successful PHEV adoption will only take place through the concerted and combined effort of many stakeholders. If consumers or utilities simply stand by and wait for it to happen, it likely never will. Although Progress Energy may not have direct control over the technology or introduction of PHEVs, we have highlighted many specific steps it can take to help reduce the consumer cost, improve education, and reduce the market uncertainties to manufacturers. We are confident that if Progress Energy and other utilities pursue these actions and engage with consumers, the current concept PHEV designs will stand a much better chance of becoming tomorrow’s vehicle of choice.

Plug-In Hybrid Electric Vehicle Study for the Progress Energy Carolinas Territory page 27 of 27
CSE CONSULTING
References: 1 http://www.progress-energy.com/aboutenergy/coverage/map.asp. Accessed May 10, 2007. 2 Source: John Mills, Principal Analyst at Progress Energy 3 http://quickfacts.census.gov/qfd/states/37000.html. Accessed May 10, 2007. 4 Based on PEC ratio of households and total number of NC/SC sales of 653,470 from the North American Dealer Association. http://www.nada.org/NR/rdonlyres/233DD641-C551-479A-8669-5D7E877A5B92/0/NADA_DATA_2007.pdf. Accessed May 1, 2007. 5 http://www.progress-energy.com/aboutus/operations/coverage.asp. Accessed May 10, 2007. 6 http://www.progress-energy.com/aboutenergy/powerplants/corpcapabilities.pdf. Accessed May 10, 2007. 7 EPRI (2007). “Environmental Assessment of Plug-in Hybrid Electric Vehicles”. EPRI, NRDC. July 2007. http://www.epri-reports.org/. 8 http://www.wisegeek.com/what-is-regenerative-braking.html. Accessed July 10, 2007. 9 EPRI (2007). 10 UBS/Ricardo Global Autos Research. www.ricardo.com/download/pdf/R119361S.pdf. Accessed May 24, 2007. 11 personal communication, UC Davis PHEV Research Center staff, June, 2007. 12 Kiley, D., Failure of Accord Hybrid is a Marketing Fiasco, Business Week, June 5, 2007. 13 “Plug-ins: The Future for Hybrid Electric Vehicles?” Argonne National Laboratory. December 1, 2006. 14 http://www.toyota.com/html/hybridsynergyview/2007/winter/question.html. Accessed July 1, 2007. 15 ADVISOR. T. Markel, A. Brooker, T. Hendricks, V. Johnson, K. Kelly, B. Kramer, M. O’Keefe, S. Sprk and K. Wipke. “ADVISOR: a systems analysis tool for advanced vehicle modeling.” Journal of Power Sources. Volume 110, Issue 2. August 22, 2202. Pages 255-266. 16 NREL (2007). Parks, K, P Denholm, and T Markel. “Costs and Emissions Associated with Plug-in Hybrid Electric Vehicle Charging in the Xcel Energy Colorado Service Territory”. NREL. 2007. 17 St. Louis (2002). J. Gonder, T. Markel, A. Simpson, M. Thorton. “Using GPS Travel Data to Assess the Real World Driving Energy Use of Plug-in Hybrid Electric Vehicles.” (In progress) 18 EPRI (2001). “Comparing the Benefits and Impact of Hybrid Electric Vehicle Options.” EPRI. Palo Alto, CA. 10003496892. 19 NREL (2007). 20 St. Louis. 21 http://www.progress-energy.com/aboutenergy/rates/nctariffs.asp#b0. Accessed May 30, 2007. 22 Tailpipe emissions based on EPA’s MOBILE6 Vehicle Emission Model as referenced in NREL (2007). http://www.epa.gov/otaq/m6.htm. 23 Refinery related emissions based on Argonne National Laboratory’s GREET model. http://www.transportation.anl.gov/software/GREET/ as referenced in NREL (2007). It is our understanding this component incorporates the well-to-wheels cycle for gasoline. 24 EPRI (2007). 25 Energy Information Administration. http://www.eia.doe.gov/. Accessed June 20, 2007. 26 Institute for the Analysis of Global Security. http://www.iags.org/costofoil.html. Accessed July 22, 2007. 27 “Biomass as Feedstock for a Bioenergy and Bioproducts Industry.” USDA DOE. April, 2005. http://www1.eere.energy.gov/biomass/pdfs/final_billionton_vision_report2.pdf. Accessed June 25, 2007. 28 http://www.hybridcars.com/market-dashboard/may07-overview.html. Accessed June 10, 2007. 29 “Plug-in HEVs”. EPRI. 2003. http://www.energy.ca.gov/2003_energypolicy/documents/2003-08-21_hearing/2003-08-21_TAYLOR_DEAN.PDF. Accessed July 12, 2007. 30 http://www.supremecourtus.gov/opinions/06pdf/05-1120.pdf. Accessed July 22, 2007.
![REGENERATIVE BRAKING SYSTEM IN ELECTRIC VEHICLES · REGENERATIVE BRAKING SYSTEM IN ELECTRIC VEHICLES ... REGENERATIVE BRAKING SYSTEM ... Regenerative action during braking[9].](https://static.fdocuments.in/doc/165x107/5adccef67f8b9a1a088c7cf0/regenerative-braking-system-in-electric-vehicles-braking-system-in-electric-vehicles.jpg)