Luck and entrepreneurial success - INSEADfaculty.insead.edu/urs-peyer/documents/2013-01-03...
44
Luck and entrepreneurial success Diego Liechti, Claudio Loderer, and Urs Peyer * January 3, 2013 Abstract How much of entrepreneurial performance is sheer luck compared to talent, experience, education, and hard work? Since luck is difficult to measure objectively, we ask a large number of entrepreneurs. According to those entrepreneurs, luck accounts for less than one third of performance variation. This self-reported assessment is affected but its magnitude cannot be explained by personal characteristics such as illusion of control. Luck, however, plays a significant role in individual management activities such as finding the appropriate business idea and choosing the right moment to enter a market. The perceived importance of luck in performance shapes actual decisions, including the entrepreneurial decision itself, the choice of financial leverage, and the choice of the industry in which to operate. What entrepreneurs believe is luck correlates with the unexplained variation in a model of entrepreneurial performance. The evidence also shows that experience, education, and hard work, the pillars of high work ethic, pay off. Keywords: luck, start-ups, entrepreneur, factors of success, performance JEL codes: G3, G02, M13 ◊ An earlier version of this paper was entitled: “What matters more for entrepreneurial success: Skills, personality, or luck?” We are indebted to Claude Federer from Creditreform, a business information provider specialized in rating credit risk, for giving us the addresses of firms from the official Swiss corporate register. Many thanks go to the employees, entrepreneurs, and managers who helped us refine and clarify our questionnaire, and to the many persons who took the time to participate in the survey. Moreover, we would like to thank Daniel Aeberhard, Demian Berchtold, Markus Senn, Jonas Stulz, Niklaus Stulz, Urs Wälchli, and Jonas Zeller for their various suggestions, and Demian Berchtold, Lorenzo Bretscher (especially), Anita Bühler, Jonas Friedrich, Adrian Michel, and Janine Taugwalder for their research assistance. Mike Jahn set up an invaluable scanner solution. We are particularly grateful to an anonymous referee and to Martin Weber (a discussant at the 2012 European Winter Finance Conference) as well as to Artur Baldauf, Evgenia Golubeva, Denis Gromb, Petra Jörg, Frauke Lammers, Philippe Mueller, Lukas Roth, and the seminar participants at the 2009 Conference of the Academy of Entrepreneurial Finance in Chicago, the 2010 European Financial Management Symposium in Montreal, the Law and Economics Workshop at Harvard University, the 2011 Interdisziplinäre Jahreskonferenz zur Gründungsforschung, the 2012 European Winter Finance Conference, and an INSEAD and ETH seminar for helpful comments and suggestions. This research is sponsored by the Swiss National Science Foundation. The article represents the view of the authors and all errors are our own. * Diego Liechti is from the Institut für Finanzmanagement, University of Bern, Switzerland and PPCmetrics AG, Claudio Loderer is from the Institut für Finanzmanagement, University of Bern, Switzerland, and Urs Peyer is from INSEAD, France.
Transcript of Luck and entrepreneurial success - INSEADfaculty.insead.edu/urs-peyer/documents/2013-01-03...
Luck and entrepreneurial success◊
Diego Liechti, Claudio Loderer, and Urs Peyer*
January 3, 2013
Abstract
How much of entrepreneurial performance is sheer luck compared to talent, experience, education, and hard work? Since luck is difficult to measure objectively, we ask a large number of entrepreneurs. According to those entrepreneurs, luck accounts for less than one third of performance variation. This self-reported assessment is affected but its magnitude cannot be explained by personal characteristics such as illusion of control. Luck, however, plays a significant role in individual management activities such as finding the appropriate business idea and choosing the right moment to enter a market. The perceived importance of luck in performance shapes actual decisions, including the entrepreneurial decision itself, the choice of financial leverage, and the choice of the industry in which to operate. What entrepreneurs believe is luck correlates with the unexplained variation in a model of entrepreneurial performance. The evidence also shows that experience, education, and hard work, the pillars of high work ethic, pay off.
Keywords: luck, start-ups, entrepreneur, factors of success, performance JEL codes: G3, G02, M13
◊ An earlier version of this paper was entitled: “What matters more for entrepreneurial success: Skills, personality,
or luck?” We are indebted to Claude Federer from Creditreform, a business information provider specialized in rating credit risk, for giving us the addresses of firms from the official Swiss corporate register. Many thanks go to the employees, entrepreneurs, and managers who helped us refine and clarify our questionnaire, and to the many persons who took the time to participate in the survey. Moreover, we would like to thank Daniel Aeberhard, Demian Berchtold, Markus Senn, Jonas Stulz, Niklaus Stulz, Urs Wälchli, and Jonas Zeller for their various suggestions, and Demian Berchtold, Lorenzo Bretscher (especially), Anita Bühler, Jonas Friedrich, Adrian Michel, and Janine Taugwalder for their research assistance. Mike Jahn set up an invaluable scanner solution. We are particularly grateful to an anonymous referee and to Martin Weber (a discussant at the 2012 European Winter Finance Conference) as well as to Artur Baldauf, Evgenia Golubeva, Denis Gromb, Petra Jörg, Frauke Lammers, Philippe Mueller, Lukas Roth, and the seminar participants at the 2009 Conference of the Academy of Entrepreneurial Finance in Chicago, the 2010 European Financial Management Symposium in Montreal, the Law and Economics Workshop at Harvard University, the 2011 Interdisziplinäre Jahreskonferenz zur Gründungsforschung, the 2012 European Winter Finance Conference, and an INSEAD and ETH seminar for helpful comments and suggestions. This research is sponsored by the Swiss National Science Foundation. The article represents the view of the authors and all errors are our own.
* Diego Liechti is from the Institut für Finanzmanagement, University of Bern, Switzerland and PPCmetrics AG, Claudio Loderer is from the Institut für Finanzmanagement, University of Bern, Switzerland, and Urs Peyer is from INSEAD, France.

- 1 -
Those who have succeeded at anything and don't mention luck are kidding themselves.
Larry King, American television and radio host
1 Introduction
Whether good or bad performance is the result of chance or things like talent and hard work is a
question that we regularly confront when witnessing other people’s exceptional performance in
sports, private life, or in the business world. Are some of Roger Federer’s most memorable shots
just fortuitous or the expression of his talents? Was the superior performance of Peter Lynch, the
famed manager of the Fidelity Magellan Fund, a reflection of luck or skills? The reason for our
keen interest is that we want to admire true, exceptional heroes and not just lucky people. We
also don’t want to blame ourselves for lack of success, if our failure is the result of happenstance.
And we want to believe in our own chances of success. If someone else can do it, it is
comfortable to know, then we can also do it—unless it’s pure luck.
This paper looks at the special case of entrepreneurs. Are successful entrepreneurs like Bill
Gates exceptionally skilled individuals or are they just lucky? Is it simply bad luck that one out
of every two entrepreneurial ventures that get started every year is gone five years later? It is
difficult to answer these questions because it is not clear what part of observed performance is
fortuitous and what is not. For example, is being at the right time at the right place pure
coincidence, the result of intuition, or the outcome of careful planning? It is hard to tell from the
outside. Allegedly, 3M’s Post-it notes were invented fairly accidentally when Art Fry found an
application for an adhesive developed by Spencer Silver, a colleague at 3M. If we had to tell
what fraction of the financial success of the Post-it notes was unintended, it would probably be
impossible to say without asking Art Fry and Spencer Silver directly. In trying to assess the
relevance of luck in entrepreneurial performance, this paper therefore does exactly that, namely
it asks entrepreneurs. They are, in principle, the only ones to know. What is not luck is the
result of things like talent as well as experience, education, and hard work, the pillars of high
work ethic. We therefore also look for evidence for the belief that these virtues pay off both in
the mind of entrepreneurs and in reality. The exposition uses the terms luck and chance
interchangeably.
Implicitly, the literature defines luck as unexplained performance. Bertrand and
Mullainathan (2001), for example, define it as “observable shocks beyond the CEO’s control” (p.

- 2 -
901). Kahneman (2011) talks about “factors that the CEO does not control” (p. 205). The
problem is that we don’t know the correct functional form of the model of entrepreneurial
performance, nor do we know all of the relevant variables and their proxies. Additionally, the
necessary data might be impossible to collect or even to observe. Hence, unexplained
performance variation yields a noisy, possibly biased estimate of truly uncontrollable
performance shocks. Perhaps more important, it is not clear what drivers of performance we
want to condition our definition of luck on. Any definition of luck is conditional. For example,
if we start from an existing firm, and therefore take things like its industry, size, resources, and
the entrepreneur’s experience and talent as given, then unexpected performance is what we
cannot explain with these variables. However, if we go back in time before the firm has been
started and ask ourselves how much of the later performance is the result of chance, then many
of the variables we just took as given are the result of luck themselves. Whether a firm in the
computer business produces software or hardware, whether it is a global or a local player,
whether it is large or small, how experienced the entrepreneur is, etc. is itself a matter of chance.
If we go back long enough, every variable that drives performance, including the entrepreneur’s
personal characteristics, reflects at least in part luck. Talent, for example, is ultimately a matter
of genes (a random draw for the individual in question) and a number of uncontrollable
contingent situations such as family, location, environment, and time (see also the discussion in
Gladwell (2008)). As a result, the only possibility to assess the importance of luck in
entrepreneurship is to ask those individuals directly. To investigate the biases that arise from
selective memory, the temptation to rewrite history, or pride, we perform a battery of robustness
tests. To sum up, the main hypothesis of our paper is:
Hypothesis 1. Luck is very important for entrepreneurial success.
In our survey we therefore ask participants about the importance of luck in determining
entrepreneurial performance. While in a first pass we inquire about overall performance, in a
second pass we examine individual components of that performance the importance of luck for
different entrepreneurial management tasks (e.g., idea generation, finding financing, finding
customers).
Hypothesis 2. Luck is very important in the following management tasks: finding the
business idea, finding the optimal timing for entry, finding employees, gaining
- 3 -
customers, securing suppliers, receiving financing, establishing the necessary
business connections, and establishing necessary private connections.
However, we choose to be agnostic about a detailed definition of luck, and simply ask about
the relevance of uncontrollable events thereby relying on the implicit definition that
entrepreneurs have in mind. If nothing else, it is perceptions and beliefs that ultimately decide
entrepreneurial behavior. However, we do eventually test what entrepreneurs have in mind, and
investigate whether it correlates with the unexplained component in a standard model of
performance. Moreover, we examine whether and how these beliefs affect entrepreneurial
choices. Thus, we propose the following three hypotheses about the influence of the beliefs
about luck on their actual behavior:
Hypothesis 3. Individuals that believe luck is important for entrepreneurial success
are less likely to pursue an entrepreneurial career.
Hypothesis 4. Entrepreneurs that believe luck is important for entrepreneurial
success use less debt in the initial start-up financing.
Hypothesis 5. Serial entrepreneurs that believe they were lucky in their first venture
are more likely to stay in the same industry.
The basis for our investigation is a survey we conducted in Switzerland in 2007.1 About one
third of the respondents were entrepreneurs who had registered their businesses between 2002
and 2006. The rest was a control sample of non-entrepreneurs, including managers and
employees. The sample of entrepreneurs is similar to that used by Bitler, Moskowitz, and
Vissing-Jørgensen (2005), and Landier and Thesmar (2009). Based on the survey responses
from more than 3,000 entrepreneurs and 5,000 non-entrepreneurs, we find that entrepreneurs
believe luck is a less important factor in explaining performance variation than, for example,
hard work and education, and that it explains at best one third of entrepreneurial performance
variation. Only 15 percent of the entrepreneurs in the sample believe luck is a very important
factor in the overall performance of the start-up, whereas roughly 79 percent think that it is the
1 The survey was in three different languages. In the German version, the term for luck was “Zufall” (as opposed
to “Glück”). In the French version, it was “hasard,” and in the Italian version, it was “caso.”

- 4 -
least important factor. A big concern with our endeavor is that personal traits, such as
overconfidence, risk aversion, and illusion of control (Langer (1975)) might lead entrepreneurs
to underestimate the importance of luck. There is some evidence of that, but it does not affect
our conclusions. Moreover, even Bill Gates admits that luck played an immense role, so why
can’t the average entrepreneur tell the truth, especially if there is no payoff since they are filling
out an anonymous questionnaire and not giving a talk in front of people.2 Therefore, we do not
believe that the opinions of entrepreneurs are biased in general in the sense of Kahneman (2011).
After a principal component analysis, we can conclude that luck accounts for less than one third
of performance variation. Interestingly, however, a full 60 percent of our entrepreneurs believe
luck is very important in at least one out of eight entrepreneurial activities, such as finding the
relevant business idea or deciding about the optimal time to enter the market. The analysis
suggests that entrepreneurs take an average across various areas of entrepreneurial activities to
form an assessment of the importance of luck in the overall performance of new ventures.
Furthermore, we find that entrepreneurs’ assessment of the importance of luck affects their
behavior. For example, individuals who believe luck is an important determinant of performance
tend to shy away from an entrepreneurial career, consistent with the experimental results in
Camerer and Lovallo (1999). Moreover, when they do opt for such a career, their decisions, for
example the financial leverage choice, are affected by their perceptions. These results hold even
after controlling for a large number of characteristics, including the entrepreneurs’ risk aversion
and overconfidence.
Finally, as mentioned, we investigate what entrepreneurs mean by luck and test whether it
correlates with the unexplained variation in a standard regression model of performance. Even if
such models yield noisy measures of truly uncontrollable shocks to performance, we show that
this is the correct approach to gauge whether perceptions of luck are proxies for those shocks.
We find that what entrepreneurs believe is good (bad) luck correlates positively (negatively) and
significantly with that unexplained variation. Our analysis suggests that luck is responsible for
2 See Bill Gates Answers Most Frequently Asked Questions Bill Gates answers are also helpful to understand the
width of luck since he admits that he was lucky to have parents and friends that encouraged him and to have Paul Allen to work with. (http://download.microsoft.com/download/0/c/0/0c020894-1f95-408c-a571-1b5033c75bbc/billg_faq.doc).
- 5 -
less than one third of the performance in start-up firms. Interestingly, and consistent with
popular belief, hard work, experience, and education do contribute to actual success. It turns out
that the performance model we estimate with these data replicates many of the results reported in
the literature with secondary data.
Entrepreneurs are the engines of economic growth. This study contributes to a better
understanding of entrepreneurs, their motivations, and their decisions, and suggests ways to
nurture entrepreneurship and, ultimately, economic growth. If entrepreneurs believed success
were mostly a random event (as in Kihlstrom and Laffont (1979)), individuals with high self-
assessed skills, would probably be discouraged from opting for an entrepreneurial career
(Camerer and Lovallo (1999)). Second, perceptions about the importance of luck appear to
matter when entrepreneurs make decisions. Third, we present evidence that these perceptions
are not simply a psychological quirk, but are consistent with reality. Fourth, we contribute to the
literature that documents the importance of behavioral aspects in managerial behavior, in
general, and finance decisions, in particular. Fifth, and arguably foremost, the study helps assess
what proportion of growth seems to be sheer luck. Finally, and related, the evidence shows that
commitment, hard work, and dedication can overcome sheer luck, a finding that should be of
interest to educators, investors, policymakers, and regulators alike. In fact, we document that
these pillars of high work ethic do affect performance.
To the best of our knowledge, this is one of the first empirical studies to attempt an appraisal
of the importance of luck in entrepreneurial performance. One significant exception is Gompers,
Kovner, Lerner, and Scharfstein (2010). According to that paper, successful entrepreneurs have
persistent market timing abilities as opposed to sheer luck—the reason, we show, could be that
these entrepreneurs work harder and are more talented. In the corporate finance literature,
Chang, Dasgupta, and Hilary (2010) find that CEOs’ abilities contribute to firm performance
over and above the effects of firm-specific assets and luck. Other studies have analyzed the
influence of luck on executive pay (e.g., Fama (1980), Bertrand and Mullainathan (2001)). The
issue of luck versus skills in performance is much more popular in the investment literature,
starting with Fama, Fisher, Jensen, and Roll (1969). More recently, Kosowski, Timmermann,
Wermers, and White (2006) conclude that a significant minority of mutual funds have skills that
allow them to outperform, while Fama and French (2010) conclude that most of the variation in
mutual fund alpha is driven by luck.

- 6 -
2 Sample description and characteristics
2.1 Sample selection
The survey was conducted in Switzerland at the end of 2007. Two questionnaires were used:
one for entrepreneurs and one for a control group of managers and employees randomly chosen
from the official Swiss telephone guide (both questionnaires can be downloaded from the
Internet at http://www.ifm.unibe.ch/). Following Bitler, Moskowitz, and Vissing-Jørgensen
(2005) and Landier and Thesmar (2009), entrepreneurs are individuals with an equity
participation in the firm they work for. The narrower definition by Gompers, Lerner, and
Scharfstein (2005) that requires that entrepreneurs also be the firm's founders or cofounders was
used as well. Unless explicitly stated, the analysis uses the broader definition. The results go
through with either definition.
The questionnaire for entrepreneurs was sent to 40,000 randomly selected chairmen of the
board, joint owners of companies with limited liability, and sole proprietors of start-ups under
the rationale that these individuals were likely to meet one of the two definitions of entrepreneur.
Their names were from the official Swiss Commercial Register. To make sure that these
individuals remembered the information we were seeking, we focused on recently founded firms,
namely those founded in 2002, 2004, or 2006. To ensure a random sample of firms, we applied
stratified sampling with starting year, legal form, and region as strata. The questionnaire focused
on seven topics: company founding, current company data, professional background and
education, personal characteristics, relative importance of luck, social environment, and personal
financial circumstances.
In designing our survey, we followed the procedure suggested by Graham and Harvey
(2001). Specifically, we first took a look at other questionnaires on entrepreneurship. Based on
those questionnaires and a careful review of the existing literature, we drafted a first version in
German and circulated it to a group of academics for feedback. We revised the questionnaire on
the basis of their critique and suggestions. Then we sought the advice of marketing and
psychology scholars on survey design and execution. In particular, we discussed measures to
maximize the response rate and minimize possible response biases. Thereafter, we sent the
questionnaire to a group of entrepreneurs and managers for a pretest. Having revised the
questionnaire based on their suggestions, we asked a communication specialist to look over the
design and wording of the questionnaire. Finally, we discussed the revised document with

- 7 -
several entrepreneurs and managers to make sure every question was understandable. The final
version was nine pages long and contained 54 questions, most of them with subparts.
The questionnaire for the control group contained the same questions (except for the two
company-related sections). It was sent to 23,202 individuals, namely managers and other
employees (public employees, teachers, engineers, mechanics, and commercial clerks) randomly
picked from the official Swiss telephone guide. For this sample, we used profession and region
as strata. Both questionnaires promised strict anonymity. Because Switzerland has three official
languages, each questionnaire had a German, a French, and an Italian version.
To increase the response rate, a cover letter and a postage-paid return envelope were
included. As a further incentive to participate, respondents could order an analysis report. After
two weeks, people were sent a reminder, and those who had misplaced the questionnaire were
given the possibility of obtaining a new copy by physical mail or e-mail, or from a Web site that
was created for that purpose. Over 300 individuals ordered a second copy. A telephone hotline
was also set up to answer questions.
A total of 8,245 individuals filled out one of the two questionnaires. The response rate of
more than 13 percent is comparable to that reported in other studies.3 Of the 8,245 respondents,
3,104 were entrepreneurs according to the broader definition, 2,778 were entrepreneurs
according to the more restrictive definition, and 5,141 were individuals from the control group.
4,410 individuals filled out the questionnaire completely. The responding individuals are similar
in terms of legal form, registration year, and Canton of registration with the overall population in
the official Swiss Commercial Register. To maximize the number of observations in the
analysis, whenever there are missing data, we use nondisclosure dummies (see, for example,
Himmelberg, Hubbard, and Palia (1999)). These binary variables equal one if a given
respondent does not disclose a particular piece of information, and zero otherwise; the variable
itself is given a value of zero for the respondents who don’t provide the information in question.
3 That rate is between 7 and 12% in surveys of CFOs (Graham and Harvey (2001), Brav, Graham, Harvey, and
Michaely (2005), and between 16 and 19% in surveys of entrepreneurs (Bosma, Van Praag, Thurik, and De Wit (2004) and Forbes (2005).

- 8 -
2.2 Sample description
In line with Bitler, Moskowitz, and Vissing-Jørgensen (2005), about 70 percent of the
entrepreneurs in our sample hold 100 percent of the firm’s equity, and 90 percent at least 50
percent. Eighty-nine percent founded their firm, 4 percent inherited it, and the rest bought it
from someone else (not shown). In 78 percent of the cases, the firm was funded initially by the
founder alone (not shown). Initial equity financing was as follows: 87 percent by the founder
himself, 9 percent by family and friends, 1 percent by strategic investors, and 1 percent by
business angels (not shown). Sixty firms in the sample, about 2 percent, have VC or business-
angel financing, compared with the less than 0.1 percent reported in Asker, Farre-Mensa, and
Ljungqvist (2011) for the U.S.
< Insert Table 1 here >
About 44 percent of the firms are sole proprietorships, 31 percent are companies with
limited liability, and 24 percent are corporations (Table 1). Companies with limited liability
have a minimum capital of CHF 20,000 (the exchange rate was about CHF 1.02 to the USD at
the time of the survey); all owners participate in firm management. Corporations have many of
the same characteristics as U.S. corporations; the minimum capital is CHF 100,000, half of it
paid in.
The entrepreneurs’ firms were very small when they were started. The median company
began with one employee, the average with 3, and the largest with 330 (Table 1). By the time
they made it into the sample, however, these firms had grown somewhat. The median company
has 2 employees, the average 5.6, and the largest 1,190. Ninety-one percent of the entrepreneurs
have worked for a firm before, but only 17 percent in a start-up (not shown). The companies that
acted as incubators are fairly evenly distributed across firm size: 24 percent of the entrepreneurs
worked for companies with more than 250 employees, and 29 percent for companies with fewer
than 10 employees (not shown). There are 13 different industries (industry allocation is based on
what respondents say). Most companies are either in IT or commerce (17 and 16 percent,
respectively), the fewest are in agriculture and energy (2 and 1 percent, respectively).

- 9 -
2.3 Performance measures
To measure performance, survey participants were asked about sales, earnings, personal income,
and initial invested capital. Based on the replies, and in keeping with Bitler, Moskowitz, and
Vissing-Jørgensen (2005), we construct three performance measures for the year 2006: an
industry-adjusted natural logarithm of sales, an industry-adjusted natural logarithm of aggregate
income, and an industry-adjusted return on the capital originally invested in the firm (ROI). The
definitions are in the Appendix. To minimize the impact of potential outliers, all performance
metrics are winsorized at the 5th and 95th percentiles.
Table 1 shows that the average firm has CHF 2 million in sales, with a median of CHF
200,000. The sales of the smallest firm are zero; those of the largest are CHF 2.5 billion.
Moreover, the average (median) aggregate income is CHF 169,000 (119,000), and the average
(median) ROI is 421 percent (220 percent). For tax purposes, entrepreneurs might choose to
draw salaries rather than paying out dividends. Hence, simply focusing on earnings could yield a
downward biased measure of firm performance. The problem is that the entrepreneurs disclose
only total personal income, not the income derived from the particular firm under investigation.
When investigating performance measures that involve personal income, we therefore focus on
only full-time entrepreneurs and ignore part-timers.
The sample is more comparable with that of Bitler, Moskowitz, and Vissing-Jørgensen
(2005) and Landier and Thesmar (2009) than with that of Gompers, Kovner, Lerner, and
Scharfstein (2010). Whereas only 7.3 percent of the firms in Gompers, Kovner, Lerner, and
Scharfstein (2010) are profitable and only 46.9 percent are able to generate any revenue, the
fraction of profitable firms in our sample is 96 percent. Bitler, Moskowitz, and Vissing-
Jørgensen (2005) report similar numbers. The reason for the difference from Gompers, Kovner,
Lerner, and Scharfstein (2010) could be that they concentrate on venture-capital (VC) backed
entrepreneurs.
2.4 Other variables
The survey data fall into three main categories: a) entrepreneurial skills, b) personal
characteristics, c) and firm-specific variables. Definitions are in the Appendix and descriptive
statistics in Table 2. Entrepreneurs have an average 24.4 years of working experience, 11.9
years in managerial positions. The cross-sectional variation in working and management

- 10 -
experience is fairly substantial. More than 20 percent of the entrepreneurs were successful in
their prior venture, and 8 percent were unsuccessful (not shown).
< Insert Table 2 here >
The personal characteristics indicate, among other things, that entrepreneurs are more
overconfident and less risk averse than non-entrepreneurs (Table 2). Thirty percent of the
entrepreneurs are part-timers. The firm-specific variables include size, organizational form,
ownership, VC backing, leverage, and a binary variable that captures regions with a Protestant
majority in the population. Size is, alternatively, the natural logarithm of the initial capital
raised at the start of the company (Bitler, Moskowitz, and Vissing-Jørgensen (2005)) and the
natural logarithm of the number of employees (Bitler, Moskowitz, and Vissing-Jørgensen
(2005)).
2.5 Non-response, survivorship, and self-selection bias
To examine the presence of non-response bias in the data, we compared the answers of early
respondents with those of late respondents (Graham and Harvey (2001)). Filion (1975) argues
that late respondents resemble non-respondents. According to a Wilcoxon rank-sum test, early
answers differed from late answers for 12 of the total 27 variables with confidence 0.95 (not
tabulated). Yet the differences were mostly related to firm characteristics, not with respect to
luck perceptions, education, experience, and personal characteristics. We replicated the analysis
for early and late respondents, separately. The conclusions were unaffected (not shown).
There could also be survivorship bias in the data, for unlucky firms eventually cease to exist
and cannot be surveyed. Based on data from the Bundesamt für Statistik und
Unternehmensdemographie, it is known that 80.7 percent of the firms that are started at any time
are still operating one year later, 69.8 percent after two years, and only 50.0 percent after five.
The results are qualitatively unchanged, however, when the analysis includes only entrepreneurs
that started their firm at the end of the sample period, namely in 2006. If there had been
survivorship bias, it would have been smaller in this cohort of firms, since they didn’t have much
time to disappear before we conducted the survey.
- 11 -
Another problem could be self-selection bias. It is possible that entrepreneurs of
unsuccessful firms are less likely to participate in a survey. Yet we do not believe this issue
poses a significant problem. First, close to 20 percent of the sample firms actually report
negative earnings during a period of overall economic growth. Second, we checked whether
early respondents differ from late respondents with respect to profitability. If unsuccessful
entrepreneurs were hesitant to participate, and if late respondents were similar to non-
respondents, then late respondents should have been less profitable than early respondents. Yet
mean and median comparison tests rejected this hypothesis (not shown).
There were two further concerns. One was that respondents might not answer truthfully.
We cannot exclude that. However, the nature of the questions does not seem to be particularly
confidential. More importantly, as we will see, we obtain results similar to those reported in the
literature. The second concern was that the questions might be misunderstood. This issue was
addressed in three different ways. First, wherever possible, we used questions from past surveys
reported in the literature. Second, the questions were pre-tested with a diverse sample of
entrepreneurs and employees. Third, respondents were asked to indicate which questions were
hard to understand. Only 9 percent did so. Dropping these individuals from the sample had no
material effect on the conclusions (not shown).
3 Luck perceptions
To assess hypothesis 1, i.e., the relevance of luck in performance, the survey asked: “How
important are the following aspects for business success: pure luck, experience, talent, effort,
education, and connections?” Respondents could score these factors from very important (1) to
quite unimportant (5). They could give the same score to different factors. In other words,
respondents could give all factors a 2, if they thought they were all fairly unimportant.
Participants were asked to mention other possible factors besides the six suggested. Only nine
out of every 100 respondents took advantage of this possibility. They mentioned things like
confidence, stamina, and family support. However, there was no consensus on any one of these
additional factors. Consequently, we assume that the six factors in question are exhaustive. This
is a conservative assumption, since it limits the number of factors that could potentially rank
ahead of luck to five. Since scores are subjective, they are not necessarily comparable across
respondents. We therefore use the scores provided by each respondent to infer his/her rankings
- 12 -
of the various factors. A ranking of 1 is assigned to the success factor with the respondent’s
highest score.4
3.1 Rankings of success factors
Table 3 details the answers from approximately 3,000 entrepreneurs. Panel A provides summary
statistics. With a median rank of 5, luck places far behind the other factors. In comparison,
effort, experience, and talent have a median rank of 1, and education and connections one of 2.
Panel B indicates that only about 15 percent of the respondents think luck is the most important
key to success, whereas a whopping 78 percent regard it as the least important. Effort comes out
on top of the rankings—about 75 percent of the entrepreneurs in the sample consider it the most
important basis for success, and only 15 percent believe it is the least important. Talent places
very close to effort. Then comes experience, whereas education and connections rank lower,
although considerably ahead of luck.
We also asked the question: “Can a start-up be financially successful without lucky random
events?” Possible answers were yes, in part, and no. Even though this question focuses on the
upside and addresses luck as a necessary condition, people who believe luck is very important
should also tend to believe that there is no success without luck. That is indeed the case. The
relation is positive and the chi-squared test highly significant (not shown). Hence, the answers
that people give seem to be consistent.
< Insert Table 3 here >
The obvious reservation is that the rankings in Table 3 are self-reported opinions—and
opinions are bound to be colored by personal circumstances. In what follows, we therefore test
whether these circumstances could have biased our conclusions. The analysis is conducted in
Table 4.
4 The drawback of translating scores into rankings is that we lose information about the distance between high and
low scores. However, the inferences are unaffected when we use the self-reported scores directly (not tabulated).

- 13 -
3.2 Analysis of scoring bias
We first test whether self-attribution bias affects the ranking of luck. Successful entrepreneurs
are more likely to ascribe their success to superior abilities and planning, whereas unsuccessful
entrepreneurs blame their failure on bad luck (Miller and Ross (1975) and Zuckerman (1979)).
We therefore split the sample according to various dimensions of performance. First, we focus
on actual performance. Well-performing firms have sales above the median in the group of peer
firms with the same age and in the same industry; the rest are poorly performing firms. When
we do that, the ranking of luck among the six factors of success is the same as the unconditional
ranking of Table 3 regardless of firm performance (not shown). Luck always ranks at the
bottom. The only difference we find is that entrepreneurs from firms that do better believe a bit
more strongly that the luck of the draw is not necessary to succeed—the corresponding
proportions are 62 percent among successful firms and 55 percent among unsuccessful ones.
The relative ranking is also unaffected for the remaining five factors. Effort, experience, and
talent are slightly more important than education and connections, regardless of performance.
The results are similar when splitting the sample into firms that, in the opinion of their
entrepreneurs, have performed worse than anticipated, as anticipated, or better (not shown).
Along the same lines, we also sorted the sample by whether the entrepreneur is a first-time
entrepreneur, and, if he is not, by whether the venture was successful or unsuccessful. The
conclusions remain the same (not shown). In general, we find no evidence that past performance
induces a self-attribution bias significant enough to affect the ranking of luck.
However, there could be other biases. Table 4 tests whether entrepreneurs with an internal
locus (illusion) of control, i.e., people who believe they have their life under control (see, e.g.,
Langer (1975)), score the importance of luck differently. We find that, while entrepreneurs with
an internal locus of control do indeed give luck a significantly lower rank than respondents with
an external locus of control (median test), luck remains the least important determinant of
performance in both groups. Significantly more entrepreneurs believe no luck is necessary for
success when they have an internal locus of control (69 percent vs. 55 percent).
< Insert Table 4 here >

- 14 -
Conceivably, the more confident and less risk averse entrepreneurs might underestimate the
importance of luck. We therefore test if the ranking remains the same if we group entrepreneurs
by degree of risk aversion and overconfidence. Yet luck clearly remains the least important
success factor regardless of subsample, and the ranking of the remaining factors is unaffected
(not shown).
We also inquired into whether survival changes the opinion of entrepreneurs. We therefore
distinguished between seasoned and rookie entrepreneurs. Rookie entrepreneurs assign luck a
significantly higher average rank, yet luck remains the least important success factor also for
them (not shown). The same goes for age. Younger entrepreneurs assign significantly more
importance to luck, yet they also rank it last (not shown). We also find that individuals who
profess that their career was accidental give luck an average rank of 4.1, whereas individuals
whose career followed a deliberate path give it a rank of 5.4. Both groups, however, believe luck
is the least important factor of success (not shown). The same conclusion follows when
distinguishing different industries.
Overall, we therefore find some evidence that the perceptions about the importance of luck
are distorted by personal situations, abilities, or past experience. However, that does not affect
the ranking of luck. The strength of our inference should be moderated, however, by the fact that
our tests might be correlated. For example, overconfident people are also less risk averse; the
correlation between the two variables is –0.32 (not shown). We therefore repeat the analysis in a
multivariate context using an ordered logit regression (not shown). The results support the
conclusion that luck ranks last among the six factors of success considered.
3.3 Perceptions of non-entrepreneurs
It could be that entrepreneurs as a group have a warped perception of reality. After all,
entrepreneurs are more overconfident and less risk averse than non-entrepreneurs (Table 2). We
therefore compare the assessments provided by these two groups of economic agents (not
shown). Surprisingly, the rankings provided by non-entrepreneurs, managers in particular, are
almost identical to those observed for entrepreneurs. Luck is at the bottom of the rankings, and
the other success factors maintain their relative level of importance. The same holds when
comparing entrepreneurs and government employees.
- 15 -
The similarity in the answers could be genuine, but it could also suggest that it was
secretaries who filled out the questionnaire. To test this, we hypothesize that delegation would
be more likely to occur in larger firms, since there are no secretaries in small firms to begin with.
However, the ranking of luck is unrelated with firm size (not shown). Moreover, and contrary to
the notion that secretaries filled out the questionnaire, entrepreneurs and non-entrepreneurs differ
significantly in many of their other answers, including those relating to personal characteristics
(Table 2).
Overall, entrepreneurs appear to think in the same way as people who chose a different
career. Luck is always the least important success factor. Together with the evidence presented
in the preceding section of no significant perception bias, we therefore find no reason to believe
that entrepreneurs misread reality.
Our results have striking implications for the contribution that luck makes to performance.
If the six factors were uncorrelated, and if they were equally important, then each one would be
responsible for at most 1/6th (17 percent) of firm performance. And, since luck is actually the
least important success factor, it would explain even less than that. In what follows, we want to
take a closer look at this conclusion.
3.4 Principal component analysis
The conclusion rests on the assumption that there are in fact six independent success factors. To
test that, Panel C of Table 3 computes Kendall rank correlation coefficients between all the
different pairs of factor rankings. Because of the large number of observations, most coefficients
are significantly different from zero with confidence 0.95 or better, even if they are all
numerically fairly small. The only sizable coefficients are those linking experience, talent,
education, and effort, four personal characteristics that are easily transferable to other firms or
industries. Connections and especially luck are uncorrelated with the remaining factors.
A conservative interpretation of the panel is that there are only three fundamental factors of
success: transferable personal characteristics, connections, and luck. If so, luck would be
responsible for one third of performance variation at most. To investigate this formally, we
perform a principal component analysis. The limitation of this analysis is that we have to use
actual scores (as opposed to ranks). Three components explain 66 percent of total variation (not
shown). For an interpretation, Table 5 performs a varimax rotation of these three components.

- 16 -
The rotation maximizes the variance of the squared loadings and tends to generate components
with loadings of unity and zero. The first component loads on transferable personal
characteristics. The second component has a loading of 0.92 on connections, and minor loadings
on the remaining variables. The third component has a loading of 0.93 on luck, and negligible
loadings on the rest. If so, given that luck ranks last in importance and is one of three
uncorrelated components, it should in fact not explain more than 33 percent of firm performance.
We cannot exclude, however, that there might be additional factors that explain performance. If
so, the importance of luck would seem to be even smaller than 33 percent.
< Insert Table 5 here >
One possible reason for this limited role of luck could be that, as pointed out in Bhidé
(2000), entrepreneurs don’t typically pursue radically new ideas but mostly follow comparatively
safe strategies and replicate or modify ideas seen in previous employment. We come back to this
issue in the conclusions.
4 Entrepreneurial activities and luck
According to the evidence, we cannot reject the conclusion that, overall, luck plays a
comparatively limited role in overall performance. And since there is no reason to believe that
these perceptions are the result of bias, there is also no reason to believe that they do not
correspond to reality. One might need luck to come up with a highly successful product, but
even a moderately good product can be turned into a success with hard work, experience, and the
proper connections. Conversely, even a potentially great product that one stumbles upon does
not guarantee success unless it is supported by the appropriate expertise, hard work, and
connections. Yet a moderate role in performance doesn’t necessarily mean that luck is of little
relevance in general. Entrepreneurial success is a function of all the different activities that
enable firms to bring their products and services to market. Hence, luck could be very important
in some of those tasks and yet, if its overall relevance is an average across tasks, it might end up
having only little impact on overall performance.
To find out our hypotesis 2, the questionnaire asked respondents to indicate the importance
of luck in eight different areas, namely the identification of the right business idea, the decision

- 17 -
of when to enter the market, the hiring of employees, the gaining of customers, the securing of
suppliers, the obtaining of financial support, the establishing of business connections, and the
setting up of private connections. For each one of these activities, people were asked to score the
importance of luck from very important (1) to quite unimportant (5). We want to examine what
fraction of entrepreneurs believes luck is very important in at least one of these activities, and
test whether more entrepreneurs do so than the 15 percent we find in the case of overall firm
performance (Table 3). Moreover, we test whether there is any evidence that the rank assigned
to luck in performance is an average of the ranks given to luck in the individual activities.
Table 6 reports summary statistics. To avoid interpersonal comparisons of scores, we used
the scores given to the importance of luck in the eight different management areas to infer the
personal rankings of the importance of luck across the eight business activities. Finding the
business idea, gaining customers, and establishing business connections are management sectors
where luck is believed to play a very important role, as evidenced by median rank of 1 of these
factors. With a median rank of 2, establishing private connections and deciding when to enter
the market are areas where luck is slightly less important. Finding employees has a median rank
of 3. And obtaining suppliers and financing are activities least subject to the vagaries of chance
(median rank of 4).
< Insert Table 6 here >
There is no evidence that respondents provide undifferentiated assessments and simply
assign the same score to luck across management tasks. To see this, we used these personal
scores and conducted a principal component analysis and a varimax rotation (not shown). Luck
in each individual management activity loads only on one of seven factors (with a coefficient of
1). Hence, luck plays a separate role in each individual management activity. The exception is
that luck in private and business connection is driven by the same factor.
Table 7 therefore tests whether luck in individual management activities is seen as being
substantially more critical than in overall performance. The test focuses on the instances in
which entrepreneurs give the importance of luck the maximum possible score of 5, and therefore
avoids interpersonal comparisons. Close to 60 percent of the responding entrepreneurs do so for
at least one of the eight management tasks considered; 40 percent do it for at least two tasks, 25

- 18 -
percent for at least three, and 16 percent for at least four. By comparison, and as already
mentioned, only 15 percent assign luck the highest score in overall firm performance (Panel B of
Table 3). Thus, the majority of entrepreneurs view luck as being very important in at least one
management area, but only 15 percent believe it plays the most important role in overall
performance. This finding is consistent with our conclusion that personal characteristics such as
self-attribution and illusion of control cannot explain the low ranking assigned to luck in overall
performance. Otherwise, luck would be equally unimportant across management areas.
< Insert Table 7 here >
Yet why is there a difference in importance in individual management areas versus in the
overall performance? We hypothesize that entrepreneurs assess the relevance of luck in
performance by taking an average of its relevance across different management tasks. Different
weights in that average could reflect the different relevance of individual management tasks for
overall performance.
For a formal test of this proposition, we run a probit regression. The dependent variable,
importance of luck, equals 1 if the entrepreneur assigns luck the highest possible score of 5 in
importance as a determinant of performance and zero otherwise. The arguments are binary
variables equal to 1 if the entrepreneur believes luck is very important in the management area in
question (and zero otherwise). The results are in Table 8. With the exception of financing, all
the arguments have a significant coefficient. The importance of luck in performance therefore
seems to derive from the importance of luck in individual management tasks. Moreover, all
coefficients are smaller than 1, and their sum (if we include the intercept) equals 1.06, consistent
with the claim that the importance of luck in overall performance is a weighted average of the
scores in the individual management tasks. However, note that the relevance of luck in securing
suppliers is negatively related to luck’s overall importance. The possible interpretation is that
being lucky enough to lock up the right suppliers reduces the firm’s exposure to overall chance
because of the advice these suppliers provide. The explanatory power of the regression,
however, is limited. As suggested also by the significant intercept, there are probably other
sources or dimensions of luck outside the eight management areas considered.

- 19 -
< Insert Table 8 here >
In sum, luck in entrepreneurial success appears to derive from luck in various management
areas. Moreover, about 60 percent of the entrepreneurs believe luck plays a very important role
in at least one of those areas.
5 Perceived luck and decision making
The next question is whether perceptions affect decisions, and how. To answer it, note that
entrepreneurs who assign luck an important role believe that a significant part of firm
performance is the result of fortuitous events. Hence, assuming they are risk averse, they will
tend to either avoid situations that expose them to chance or try to be in a position to manage the
consequences of chance. We examine the following situations: (a) the entrepreneurial career
decision (hypothesis 3); (b) the use of debt in the initial start-up financing (hypothesis 4); and (c)
the decision to switch industry for repeat entrepreneurs (hypothesis 5).
5.1 The decision to become an entrepreneur
We model the decision to pursue an entrepreneurial career with a probit regression that borrows
from the extant literature (see, for example, the survey articles of Bhidé (2000), Rauch and Frese
(2000), and Parker (2004)). The difference is that we expand the set of regression arguments
with the scores assigned by respondents to the various drivers of entrepreneurial success. We
therefore estimate the following model:
Entrepreneuri = ai + ßi×(perceived importance of luck, perceived importance of other success
factors, control variables, identification variables)i + νi , (1)
where νi is a standard disturbance term, and entrepreneur is a binary variable equal to one if the
individual in question is an entrepreneur, and zero otherwise. Strictly taken, since we use cross-
sectional data, equation (1) does not model the decision to become an entrepreneur but rather the
probability of being one. Being an entrepreneur is the result of both a career decision and of the
probability of survival (Evans and Leighton (1989)). The results remain the same, however,
when we focus on the subset of entrepreneurs who started their company during the last year in
the sample. For them, given that they have been operating for at most one year, becoming an

- 20 -
entrepreneur should be the same as being one. We test whether the prospect of being exposed to
luck discourages an entrepreneurial career. The more strongly a risk-averse individual believes
that success is driven by random chance, the more reluctant he should be to opt for an
entrepreneurial career, as suggested by the experimental evidence in Camerer and Lovallo
(1999). It is not clear, though, how the perceptions about the importance of the remaining five
success factors affect that decision. They should all matter, since, as we saw, they are believed
to determine entrepreneurial success, but we cannot tell how. Believing, for example, that
education is important should encourage educated individuals to join the entrepreneurial ranks,
but it will deter uneducated people.
Table 9 reports the estimation results. In column (1), the coefficient of importance of luck is
negative and significant, as predicted. Believing that performance is a matter of luck does
indeed discourage people from going for an entrepreneurial career. Note that the variable
importance of luck is measured with the score provided by respondents. We measure the
importance of the remaining factors of success the same way. The results, however, remain
essentially the same when we measure importance with a binary variable (important vs.
unimportant). Using scores provides more variation in the measurement of these individual
factors.
< Insert Table 9 here >
Individuals who believe education is important are also deterred. As we mentioned, this
result could be driven by people who feel they lack the appropriate education. In contrast,
individuals who believe effort and connections are important are more likely to pursue an
entrepreneurial career, possibly because they are willing to put in the necessary effort and have
the necessary connections. We also find, however, that individuals who score experience and
talent as important success factors are not more likely to become entrepreneurs.
In column (2), we replace the subjective scores of the success factors (other than importance
of luck) with the actual proxies for those factors. The new variables are:
a) working, industry and management experience, three proxies for experience;
b) previously successful entrepreneur (previously unsuccessful entrepreneur), a proxy for skills,
according to Gompers, Kovner, Lerner, and Scharfstein (2010));

- 21 -
c) previously unemployed, a proxy inversely related with skills;
d) number of children, a proxy inversely related with effort;
e) foreigner, a proxy directly related with effort, under the assumption that foreigners are more
likely to put in an extra effort to compensate for the lack of proper connections. For
entrepreneurs, we could also measure effort with the variable part-time entrepreneur. The
problem is that we don’t have that information for non-entrepreneurs. We will use this
variable, however, in the subsequent analysis of entrepreneurial performance;
f) education and balanced education, two proxies for education; and
g) connections, a proxy for connections.
Under this specification, importance of luck maintains its negative and significant
coefficient. As for the other success factors, working and management experience, education,
the willingness to put in a higher effort, and connections (Honig and Davidsson (2000))
encourage an entrepreneurial career. However, longer industry experience has a negative
coefficient, possibly because industry-specific knowledge depreciates over time or because
longer industry experience is associated with better remuneration, which raises the opportunity
costs of entrepreneurship. Moreover, previously successful entrepreneurs don’t seem to be more
likely to get involved in another start-up. It is previously unsuccessful entrepreneurs who tend to
try again. Hence, the possible stigma associated with failure discussed in Landier (2006) does
not seem to discourage entrepreneurs from taking another crack. Failed entrepreneurs seem to
believe they have their chances, consistent with a deep market for failed entrepreneurs (Gromb
and Scharfstein (2005)). Along similar lines, previously unemployed individuals are also more
likely to embark on an entrepreneurial career, a regularity already noted by Evans and Leighton
(1989).
Column (3) repeats the estimation with the addition of the interaction variable importance of
luck*high management experience. High management experience is a binary variable equal to 1
if the individual’s management experience is in the highest quartile of the sample distribution,
and equal to zero otherwise. The purpose is to test whether the relevance of luck provides
different motivations, depending on people’s abilities. The hypothesis is that individuals with
good abilities are discouraged from becoming entrepreneurs if they believe performance is
mostly a matter of luck (Camerer and Lovallo (1999)). The evidence is consistent with this
hypothesis. The coefficient of the interaction term is negative and significant. The remaining
- 22 -
coefficients remain essentially unchanged. Note that the coefficient of importance of luck alone
loses its statistical significance.
Column (4) replaces high with low management experience in the interaction term. Low
management experience is a binary variable equal to 1 if the individual’s experience is in the
lowest quartile of the sample distribution, and equal to zero otherwise. Individuals with low self-
assessed skills could be attracted to an entrepreneurial career if they believe in the importance of
luck, since they may see better chances to succeed (Hogarth and Karelaia (2008)). The evidence,
however, contradicts this conjecture. This interaction term has a negative and significant
coefficient as well. These individuals might be afraid that their lack of experience could make it
more difficult to deal with the consequences of adverse developments.
The regressions include a number of control variables that describe personal characteristics
(not shown to save space). Several of their coefficient estimates have the same sign and
significance observed elsewhere in the literature with non-survey data. This increases our
confidence in the usefulness of our survey data. The coefficient of internal locus of control, for
example, is positive and highly significant. Hence, individuals who believe they control their
life are more likely to opt for an entrepreneurial career. Perhaps not surprisingly, people in
Protestant regions are also more likely to try an entrepreneurial career, possibly because they
believe in the virtues of high work ethic. Moreover, risk aversion has a negative effect
(Brockhaus (1980), Stewart Jr. and Roth (2001)) and overconfidence has a positive one,
consistent with Holtz-Eakin, Joulfaian, and Rosen (1994) and Camerer and Lovallo (1999).
Furthermore, divorced individuals have a higher propensity for trying an entrepreneurial career,
which they might see as the opportunity for a change. The opposite seems to be the case for
married people. The risk of failure is probably too large to take. We also find that women are
significantly less likely to enter the entrepreneurial ranks. Finally, personal age has a nonlinear
impact, in line with Van Gelderen, Thurik, and Bosma (2006). The probability of becoming an
entrepreneur first increases until age 33, and then it declines.
The regressions also include five identification variables used later in our Heckman two-
stage analysis of firm performance. The first one is career by chance, a binary variable that
identifies individuals who claim to have chosen their career by chance. Similarly, need for
achievement, a psychological trait often mentioned in the management and psychology literature
(Zhao and Seibert (2006)), also has a positive and significant coefficient. We also find that

- 23 -
personal wealth encourages the entrepreneurial decision (Hurst and Lusardi (2004)). The same
goes for individuals who worked for small firms (Barnett and Dobrev (2005), Sørensen (2007))
and, in part, for people with entrepreneurial parents (Blanchflower and Oswald (1998)).
In conclusion, the results in Table 9 therefore indicate that the entrepreneurial decision is
shaped by what people believe, particularly about the role that luck plays in bringing about
success. Consistent with our predictions, those who believe luck is important tend to be reluctant
to embark on an entrepreneurial career. Perceptions about the importance of the other success
factors and the proxies for those factors also matter. In spite of all the measurement errors, these
results are economically significant. To assess that, we used a binary variable to distinguish
cases in which luck was deemed to be of some importance (scores larger than 1) as opposed to
no importance at all (scores equal to 1). When we repeat the estimation with that definition (not
shown), we find that individuals who assign luck at least some importance are about 7 percent
less likely to become entrepreneurs. As it turns out, this effect is similar to that of believing that
connections are important, but about half the discouraging effect of being a woman.
5.2 Luck perceptions and financial leverage
We also want to know whether the perceived importance of luck shapes financing choices. In
Landier and Thesmar (2009), optimistic entrepreneurs prefer short-term debt. We hypothesize
that, holding risk aversion constant, entrepreneurs who believe luck plays an important role in
performance choose lower leverage to reduce their exposure to the risk of financial distress.
Formally, we estimate probit regressions of leverage on the binary variable importance of luck
(bin). The specification is the same as that of column (2) of Table 9. The dependent variable,
financial leverage, is binary, and it equals 1 if the firm relies on debt financing, and 0 otherwise.
As it turns out the maximum leverage is 11 percent in proprietorships, compared with 47
percent in limited-liability companies, and 38 percent in corporations. Moreover, 74 percent of
the proprietorships in the sample have no debt at all, compared to 66 percent in limited-liability
companies, and 59 percent in corporations. Possibly, proprietorships are unable to access the
debt market. Hence, our predictions apply to limited- liability companies and corporations only.
Estimation results are in Table 10. Consistent with the prediction, importance of luck in the
full sample has a negative and significant coefficient: The higher the importance of luck, the
lower the firm’s financial leverage. Capital structure decisions are therefore not only affected by

- 24 -
optimism (as in Landier and Thesmar (2009)), but also by views about the importance of luck.
The table also reports the coefficients of selected control variables. Overconfidence has a
positive and significant coefficient, possibly because it induces people to downplay the risks of
insolvency, while risk aversion is unrelated with leverage. When splitting the sample into
proprietorships and corporations, we see that the significance of importance of luck (bin) comes
in fact from corporations.
< Insert Table 10 here >
5.3 Luck perceptions and the decision to switch industry
Finally, we examine whether perceived abnormal performance affects the decision of repeat
entrepreneurs to stay in the same industry or to switch to a different one. According to the
evidence (not shown), serial entrepreneurs that decide to remain in the same industry are without
exception entrepreneurs who believe they performed better than expected, i.e., had good luck. In
contrast, serial entrepreneurs who decided to switch industry for their new start-up invariably
think they did worse than expected in their previous venture, i.e., they believe they experienced
bad luck. Hence, perceptions about chance affect the industry which entrepreneurs decide to
operate in.
6 Perceived luck and unexplained performance
The last step in the analysis is to clarify what entrepreneurs have in mind when they think of
luck. All our questions referred to luck as unexpected events. Of course, there is no guarantee
that respondents had that in mind when they answered. As a validation test, we therefore
investigate whether what is unexpected to entrepreneurs correlates with the unexplained
component in a standard model of entrepreneurial performance.
6.1 The performance regression
For our test, we need more than simply the variable importance of luck, since that variable
measures a hypothetical importance. Here, we want an assessment of luck in specific cases. As
possible proxies, we therefore use two measures of actual luck, namely good luck (a binary

- 25 -
variable equal to 1 if the entrepreneur says performance was better than expected, and equal to 0
otherwise) and bad luck (a binary variable equal to 1 if the entrepreneur says performance was
worse than expected, and equal to 0 otherwise).5 In 37 percent of the cases, entrepreneurs say
they had good luck, in 13 percent they say they had bad luck. In the remaining 50 percent of the
cases, they claim to have performed as expected. The performance model we use is similar to
that in Bitler, Moskowitz, and Vissing-Jørgensen (2005) and Gompers, Kovner, Lerner, and
Scharfstein (2010). Formally, we estimate the following cross-sectional regression:
Performancei = a i + ßi×(skills, personal characteristics, control variables)i + ε i , (3)
where i indicates the entrepreneur and his firm, and ε i is the unexplained component. As stated
in the introduction, there are various reasons to believe this unexplained component is a noisy,
and possibly biased proxy of luck. We can therefore represent it as the sum of three terms:
Unexplained component of performance = ε = true luck + bias + noise. (4)
Hence, if our subjective proxies for luck (good luck, bad luck) measure what we believe they
measure, they should be correlated with unexplained performance via the true luck component.
To alleviate the concern that our proxies are systematically influenced by characteristics that also
lead to bias in unexplained performance, we include a large number of control variables for
personal characteristics, as well as firm characteristics and time.
In the following analysis, we first estimate equation (3) without the two proxies for luck in
order to estimate what fraction of performance can be explained by the standard performance
5 This measure of unexpected performance is related but different from Landier and Thesmar’s (2009) measure of
optimism. Landier and Thesmar have information on the anticipated sales at the time of firm founding. Optimism is the difference between actual and anticipated sales at the time of founding. Our measure of unexpected performance relies on an ex-post measure of expectations. Consequently, if recall is imperfect or if expectations are revised over time, our measure of unexpected performance differs from Landier and Thesmar’s (2009) measure of optimism. For an alternative measure of optimism, see Puri and Robinson (2007).

- 26 -
model. Later, we add the proxies for luck to test whether these proxies correlate with the
unexplained variation in performance.
6.2 Estimation results
Because entrepreneurs are unlikely to be drawn from a random sample of individuals, we
perform the analysis of equation (3) with a Heckman two-stage estimation procedure.
Entrepreneurs might possess unobserved characteristics related to entrepreneurial performance
that could bias the estimates of equation (3) (Hamilton (2000)). We therefore use the model of
entrepreneurial career choice in equation (1) as the first stage. Although the non-linearities of
the probit model might already fulfill the exclusion restrictions (Wooldridge (2002)), we rely on
the identification variables described in the discussion of equation (1) above. In the second-stage
regression, we estimate the performance regression (3) with the addition of the inverse Mills
ratio from the first stage.
When estimating the second-stage regression equation (3), the number of observations
differs across performance proxies as not all respondents provided the necessary information.
There are 2,348 observations for sales, 1,511 for aggregate income, and 1,433 for return on
initial capital (ROI). Depending on the proxy for performance, the model explains 6.9 percent
(return on initial capital), 13.1 percent (aggregate income), and 37.6 percent (sales) of the cross-
sectional variation in industry-adjusted performance, respectively (not shown).
We then estimate the performance regression (3), augmented with the two proxies good luck
and bad luck. If they are related to unexplained performance, the two proxies should have power
to explain the error term in (3). Furthermore, whereas good luck should have a positive
coefficient, bad luck should have a negative one.
The evidence in Table 11 confirms all three predictions. Both variables have highly
significant coefficients regardless of how we measure performance. Moreover, they have a
symmetric effect—the absolute value of their coefficients is practically identical, except in the
regression that examines the return on invested capital. An alternative interpretation of the
negative coefficient of our bad luck variable could be optimism since optimistic entrepreneurs
are more likely to be disappointed with their business progress (Hmieleski and Baron (2009)).
However, since we control for unobserved heterogeneity, optimism should not distort our results.
- 27 -
< Insert Table 11 here >
The two luck variables have also tangible explanatory power, which can be shown in two
different ways. First, we compute the difference in R-squared when adding the two variables in
the regression equation. When we do so, we obtain incremental differences in R-squared values
of 5.5 percent (sales), 10.2 percent (income), and 4.6 percent (ROI), respectively. This
corresponds to a relative increase in explanatory power of 15 percent (sales), 63 percent
(income), and 47 percent (ROI). This procedure assumes that the luck variables are orthogonal
to the model’s other arguments. As an alternative, we employ the method suggested by Kruskal
(1987) and average the differences in R-squared observed when entering the proxies for luck in
regressions involving all possible combinations of the arguments in the model.6 Under this
approach, the contribution of luck to the R-squared of the regressions is 8.3 percent (sales), 12.8
percent (income) and 5.0 percent (ROI), respectively.
The implication of all this is that what entrepreneurs have in mind when they envision
chance is correlated with unexplained performance variation. Hence, perceived luck is
unexpected performance shocks. Remember, however: not only is the assessment of luck self-
reported, but also the performance measures are. The analysis also allows for interesting
comparisons with the extant literature, which has used performance regression models such as
(3) quite extensively. In the following, we briefly describe how our survey-based estimation
results compare with earlier studies that have used other sources of data.
Table 11 also reports the coefficient estimates of the various control variables. A brief look
shows that the success factors are indeed related to performance, and mostly in line with the
extant literature. In particular, management experience has generally a positive effect, consistent
with Kaplan, Sensoy, and Strömberg (2009). So does, at least marginally, industry experience,
as in Chatterji (2009). Similarly, part-time entrepreneur has a significantly negative relation
with sales, in agreement with the notion that a feeble effort weakens performance. Number of
6 For example, to obtain the relative importance of x1 in the case of a regression with two independent variables
(x1, x2), we take the average of two changes in R-squared. The first change is that observed when x1 is the only regressor compared to a regression without any independent variables. The second change is that computed when going from a regression with x2 as the only regressor to a regression with both independent variables.

- 28 -
children, another proxy for effort (entrepreneurs of larger families might have to work harder to
maintain them), has a positive coefficient, at least in the case of sales. Likewise does foreigner.
Foreigners probably have to compensate for weaker networks and institutional knowledge with a
greater effort. These results are compatible with those of Bitler, Moskowitz, and Vissing-
Jørgensen (2005). Furthermore, both proxies for education and talent (education and balanced
education) have positive and significant coefficients. However, previously successful
entrepreneur and previously unsuccessful entrepreneur, two other proxies for talent, are
unrelated with performance. This latter finding seems to contradict Gompers, Kovner, Lerner,
and Scharfstein (2010) who find performance persistence among previously successful
entrepreneurs. Yet previous success could be a proxy for variables included here but not in that
paper, such as management experience and management education.7 The results also show that,
having been unemployed before becoming an entrepreneur has generally a negative effect,
possibly because formerly unemployed people are less talented entrepreneurs, consistent with
Evans and Leighton (1989). Finally, the last success factor, connections, has insignificant
coefficients.
With regard to personal characteristics, Protestant has mostly a negative coefficient. In
contrast, married has a positive coefficient. Married entrepreneurs might feel a stronger pressure
to succeed to support their family. Consistent with that, the first-stage regression indicates that
married people are reluctant to begin an entrepreneurial career. Risk aversion has no effect on
performance. In contrast, overconfidence tends to have negative coefficients. This is consistent
with Camerer and Lovallo (1999), according to whom overconfident people tend to ignore
competitors and to enter a market, thereby depressing profits. Hirshleifer, Low, and Teoh
(2010), however, find little relation between overconfidence and firm performance. Female is
mostly negatively correlated with performance. Since this coefficient is conditional on firm size,
it cannot be explained with the tighter capital constraints that female entrepreneurs may be facing
7 We repeated the estimation with the same variables that Gompers, Kovner, Lerner, and Scharfstein (2010) use,
except for the characteristics of the VC firm, since most of our firms receive no VC backing. With that specification and their OLS approach, we also found that previously successful entrepreneurs repeat (not shown). The same held when we replicated the analysis with a Heckman two-stage estimation approach (not shown). However, when we added the variables for skills and personal characteristics, the importance of previous entrepreneurial success went away.

- 29 -
(Parker (2004)). Our finding is consistent with Cole and Mehran (2010). Finally, age has a
concave relation with sales and aggregate income.
As concerns the firm-specific controls, firm size (measured either in terms of initial capital
or number of employees) has mostly a positive relation with performance, possibly because the
size of a start-up is a proxy for success. Equity ownership has a negative and significant effect
on sales, no significant correlation with aggregate income, and a positive association with ROI.8
Leverage has a similar non-uniform effect. Sole proprietorship has a positive effect on ROI and
aggregate income, but a negative one on sales, possibly because sole proprietorships tend to be
substantially smaller organizations. VC backing is unrelated with performance. This result
should be taken with a grain of salt, since few firms enjoy VC support to begin with.
Overall, the estimation of the effect of the various control variables shows that what
entrepreneurs indicate as being success factors are indeed mostly tied to performance. Perhaps
more importantly, it documents that our primary data yield results consistent with those reported
in the literature on the basis of secondary data.
7 Conclusions
We recognize that our inferences are based on self-reported data. However, the fact that our
survey data replicate findings in the literature that are based on secondary data bear out the
validity of the analysis. Success factors matter both in the perception of entrepreneurs and in
reported performance. In particular, the pillars of high work ethic do indeed contribute to better
performance. Interestingly, however, experience and hard work rank significantly ahead of
education in the perception of entrepreneurs. Luck is the least important factor of success, even
among people likely to have a weaker self-attribution bias. In spite of that, perceptions about the
importance of luck affect entrepreneurial choices and behavior.
8 The negative association between ownership and sales is consistent with the OLS findings in Bitler, Moskowitz,
and Vissing-Jørgensen (2005). Ownership, however, might be endogenous. We therefore estimate a two-stage least squares regression with the same instruments as Bitler, Moskowitz, and Vissing-Jørgensen (2005) for the case of sales. The instruments are binary variables that identify whether the entrepreneur is the founder and whether he has inherited the firm, as well as age, and age squared. Under that specification, ownership has a positive impact on performance (not shown). However, the instruments are potentially weak according to the F-test proposed by Staiger and Stock (1997).

- 30 -
Kahneman (2011) argues that people are prone to underestimate the role of chance in events.
Assuming causality and being on the lookout for systematic patterns in the environment might be
a characteristic that could have helped our ancestors to be more vigilant about predators and
might therefore have provided evolutionary advantages. Do the results reported here, in
particular the role of less than one third assigned to luck, reflect a primordial underestimation of
luck? We don’t believe they do because we do not find any evidence of a bias.
First, the interpretation of the results should rely on the proper anchor. When thinking about
start-ups, many people think about Google and its many uncertainties. The problem is that, as
Bhidé (2000) points out, most start-ups don’t innovate. They often simply replicate things
observed elsewhere. That enables them to also learn from people who have preceded them in
similar situations. The Googles are the great exception. Extrapolating from them to reflect
about start-ups would be inappropriate.
Another likely anchor that many readers unavoidably will use to interpret the results is the
observation that every other firm in a given cohort of start-ups is gone within five years. How
can an annual frequency of random events of one third bring about such a drastic reduction in
start-ups over time? As it turns out, the conundrum is more apparent than real. Exits are not all
random events. A sizable fraction of firms that disappear do so predictably—either because they
are predictably poorly managed and are consequently liquidated, or because they are predictably
well managed and are therefore taken over or merged. According to Philosophov, Batten, and
Philosophov (2008), for example, roughly 30 percent (net of “false alarms”) of listed firms that
go bankrupt can be predicted to do so five years in advance. Among unlisted firms, the
proportion is likely to be even larger. A similar argument can be made about firms that do well
and are taken over. Hence, the importance that entrepreneurs attribute to luck is not necessarily
inconsistent with observed survival frequencies.
Finally, whereas entrepreneurs attribute less than one third of performance variation to
chance, they also believe that luck is very important in individual aspects of entrepreneurship.
So, it is not the case that entrepreneurs simply understate the importance of chance regardless.
At the same time, even though personal characteristics such as self-attribution do affect opinions,
they don’t reverse the relevance of luck. Overall, we therefore find little reason to believe that
entrepreneurs underestimate the role of chance.
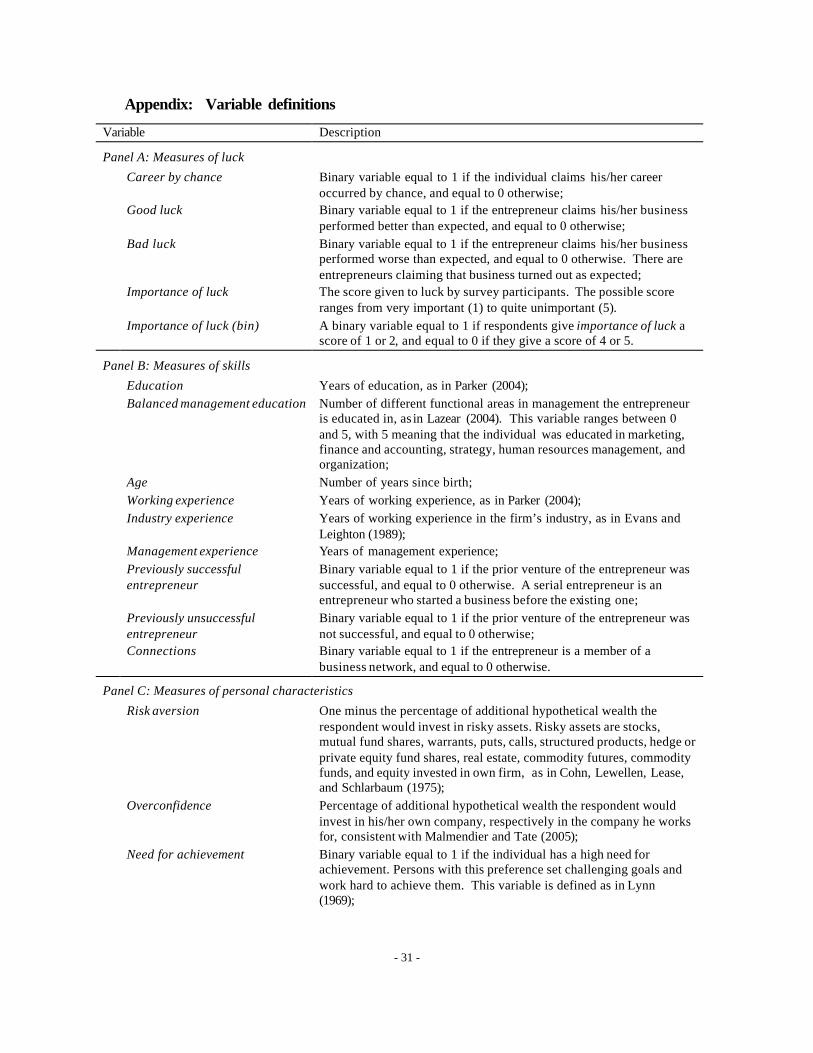
- 31 -
Appendix: Variable definitions
Variable Description
Panel A: Measures of luck
Career by chance Binary variable equal to 1 if the individual claims his/her career occurred by chance, and equal to 0 otherwise;
Good luck Binary variable equal to 1 if the entrepreneur claims his/her business performed better than expected, and equal to 0 otherwise;
Bad luck Binary variable equal to 1 if the entrepreneur claims his/her business performed worse than expected, and equal to 0 otherwise. There are entrepreneurs claiming that business turned out as expected;
Importance of luck The score given to luck by survey participants. The possible score ranges from very important (1) to quite unimportant (5).
Importance of luck (bin) A binary variable equal to 1 if respondents give importance of luck a score of 1 or 2, and equal to 0 if they give a score of 4 or 5.
Panel B: Measures of skills
Education Years of education, as in Parker (2004); Balanced management education Number of different functional areas in management the entrepreneur
is educated in, as in Lazear (2004). This variable ranges between 0 and 5, with 5 meaning that the individual was educated in marketing, finance and accounting, strategy, human resources management, and organization;
Age Number of years since birth; Working experience Years of working experience, as in Parker (2004); Industry experience Years of working experience in the firm’s industry, as in Evans and
Leighton (1989); Management experience Years of management experience; Previously successful
entrepreneur Binary variable equal to 1 if the prior venture of the entrepreneur was successful, and equal to 0 otherwise. A serial entrepreneur is an entrepreneur who started a business before the existing one;
Previously unsuccessful entrepreneur
Binary variable equal to 1 if the prior venture of the entrepreneur was not successful, and equal to 0 otherwise;
Connections Binary variable equal to 1 if the entrepreneur is a member of a business network, and equal to 0 otherwise.
Panel C: Measures of personal characteristics
Risk aversion One minus the percentage of additional hypothetical wealth the respondent would invest in risky assets. Risky assets are stocks, mutual fund shares, warrants, puts, calls, structured products, hedge or private equity fund shares, real estate, commodity futures, commodity funds, and equity invested in own firm, as in Cohn, Lewellen, Lease, and Schlarbaum (1975);
Overconfidence Percentage of additional hypothetical wealth the respondent would invest in his/her own company, respectively in the company he works for, consistent with Malmendier and Tate (2005);
Need for achievement Binary variable equal to 1 if the individual has a high need for achievement. Persons with this preference set challenging goals and work hard to achieve them. This variable is defined as in Lynn (1969);

- 32 -
Variable Description Internal l ocus of control Binary variable equal to 1 if the individual has an internal locus of
control. Individuals with an internal locus of control believe their life mainly depends on their personal decisions and effort (Rotter (1966));
Part-time entrepreneur Binary variable equal to 1 if the entrepreneur has another job, and equal to 0 otherwise;
Panel D: Firm-specific control variables and other variables
Ownership Entrepreneurial ownership in percent, as in Bitler, Moskowitz, and Vissing-Jørgensen (2005);
Net wealth Gross assets of the individual (including real estate holdings, financial assets, and value of equity participation in unlisted firms) minus total debt in Swiss Francs;
Sole proprietorship Binary variable equal to 1 if firm is a sole proprietorship, and equal to 0 otherwise;
Initial capital Capital raised at the start of the company, adjusted for the formation year of the company by compounding at the risk free rate;
Current equity Firm equity;
Sales Firm sales; Employment Current number of employees, as in as in Bitler, Moskowitz, and
Vissing-Jørgensen (2005); Leverage Current debt/equity ratio; Venture capital backed Binary variable equal to 1 if firm is venture capital or business angel
backed; Protestant Binary variable equal to 1 if the entrepreneur lives in a Canton where
the majority of the population is Protestant;
Panel E: Measures of firm performance
Industry-adjusted log(sales) Natural logarithm of firm sales, minus the corresponding median value in the subsample of firms in the same industry that were started in the same year. The variable is winsorized at the 5 percent and 95 percent tails;
Industry-adjusted log(aggregate income)
Natural logarithm of the sum of firm earnings and personal income of the entrepreneur, minus the corresponding median value in the subsample of firms in the same industry that were started in the same year. The variable is winsorized at the 5 percent and 95 percent tails;
Industry-adjusted return on initial capital
Aggregate income after taxes in the year 2006 as a percent of initial capital, minus the corresponding median value in the subsample of firms in the same industry that were started in the same year. The variable is winsorized at the 5 percent and 95 percent tails.

- 33 -
References
Asker, J.W., Farre-Mensa, J., Ljungqvist, A., 2011. Comparing the Investment Behavior of Public and Private Firms. NBER Working Paper No. 17394
Barnett, W.P., Dobrev, S.D., 2005. Organizational Roles and Transition to Entrepreneurship. Academy of Management Journal 48, 433-449
Bertrand, M., Mullainathan, S., 2001. Are CEOS Rewarded for Luck? The Ones without Principals Are. Quarterly Journal of Economics 116, 901-932
Bhidé, A.V., 2000. The Origin and Evolution of New Businesses. Oxford University Press Inc., New York
Bitler, M.P., Moskowitz, T.J., Vissing-Jørgensen, A., 2005. Testing Agency Theory with Entrepreneur Effort and Wealth. The Journal of Finance 60, 539-576
Blanchflower, D.G., Oswald, A.J., 1998. What Makes an Entrepreneur? Journal of Labor Economics 16, 26-60
Bosma, N., Van Praag, C.M., Thurik, R., De Wit, G., 2004. The Value of Human and Social Capital Investments for the Business Performance for Start-ups. Small Business Economics 23, 227-236
Brav, A., Graham, J.R., Harvey, C.R., Michaely, R., 2005. Payout policy in the 21st century. Journal of Financial Economics 77, 483-527
Brockhaus, R.H., 1980. Risk Taking Propensity of Entrepreneurs. Academy of Management Journal 23, 509-520
Camerer, C., Lovallo, D., 1999. Overconfidence and Excess Entry: An Experimental Approach. American Economic Review 89, 306-318
Chang, Y.Y., Dasgupta, S., Hilary, G., 2010. CEO Ability, Pay, and Firm Performance. Management Science 56, 1633-1652
Chatterji, A.K., 2009. Spawned with a Sliver Spoon? Entrepreneurial Performance and Innovation in the Medical Device Industry. Strategic Management Journal 30, 185–206
Cohn, R.A., Lewellen, W.G., Lease, R.C., Schlarbaum, G.G., 1975. Individual Investor Risk Aversion and Investment Portfolio Composition. Journal of Finance 30, 605-620
Cole, R.A., Mehran, H., 2010. Gender and the Availability of Credit to Privately Held Firms: Evidence from the Surveys of Small Business Finances. Working Paper, 1-48
Evans, D.S., Leighton, L.S., 1989. Some Empirical Aspects of Entrepreneurship. American Economic Review 79, 519-535

- 34 -
Fama, E.F., 1980. Agency Problems and the Theory of the Firm. Journal of Political Economy 88, 288-307
Fama, E.F., Fisher, L., Jensen, M.C., Roll, R., 1969. The Adjustment of Stock Prices to New Information. International Economic Review 10, 1-21
Fama, E.F., French, K.R., 2010. Luck versus Skill in te Cross Section of Mutual Fund Returns. Journal of Finance 65, 1915-1947
Filion, F.L., 1975. Estimating bias to nonresponse in mail surveys. Public Opinion Quarterly 39, 482-492
Forbes, D.P., 2005. Are some Entrepreneurs more Overconfident than others? Journal of Business Venturing 20, 623-640
Gladwell, M., 2008. Outiliers; The Story of Success. Little Brown, New York
Gompers, P., Kovner, A., Lerner, J., Scharfstein, D., 2010. Performance persistence in entrepreneurship. Journal of Financial Economics 96, 18-32
Gompers, P.A., Lerner, J., Scharfstein, D., 2005. Entrepreneurial Spawning Public Corporations and the Genesis of New Ventures, 1986 to 1999. Journal of Finance 60, 577-614
Graham, J.R., Harvey, C.R., 2001. The theory and practice of corporate finance: evidence from the field. Journal of Financial Economics 60, 187-243
Gromb, D., Scharfstein, D., 2005. Entrepreneurship in Equilibrium. NBER Working Paper Series No. 9001, 1-29
Hamilton, B.H., 2000. Does Entrepreneurship Pay? An Empirical Analysis of the Returns to Self-Employment. Journal of Political Economy 108, 604-631
Himmelberg, C.P., Hubbard, R.G., Palia, D., 1999. Understanding the determinants of managerial ownership and the link between ownership and performance. Journal of Financial Economics 53, 353-384
Hirshleifer, D., Low, A., Teoh, S.H., 2010. Are overconfident CEOs better innovators? Journal of Finance, forthcoming
Hmieleski, K.M., Baron, R.A., 2009. Entrepreneurs' Optimism and New Venture Performance: A Social Perspective. Academy of Management Journal 52, 473-488
Hogarth, R., Karelaia, N., 2008. Skill, Luck, Overconfidence, and Risk Taking. Working Paper
Holtz-Eakin, D., Joulfaian, D., Rosen, H.S., 1994. Sticking it Out: Entrepreneurial Survival and Liquidity Constraints. The Journal of Political Economy 102, 53-75

- 35 -
Honig, B., Davidsson, P., 2000. The Role of Social and Human Capital among Nascent Entrepreneurs. Academy of Management Proceedings
Hurst, E., Lusardi, A., 2004. Liquidity Constraints, Household Wealth, and Entrepreneurship. Journal of Political Economy 112, 319- 347
Kahneman, D., 2011. Thinking, fast and slow. Penguin Books, London
Kaplan, S.N., Sensoy, B.A., Strömberg, P., 2009. Should Investors Bet on the Jockey or the Horse? Evidence from the Evolution of Firms from Early Business Plans to Public Companies. Journal of Finance 64, 75-115
Kihlstrom, R.E., Laffont, J.-J., 1979. A General Equilibrium Entrepreneurial Theory of Firm Formation Based on Risk Aversion. Journal of Political Economy 87, 719-748
Kosowski, R., Timmermann, A., Wermers, R., White, H., 2006. Can Mutual Fund "Stars" Really Pick Stocks? New Evidence from a Bootstrap Analysis. Journal of Finance 61, 2551-2595
Kruskal, W., 1987. Relative Importance by Averaging Over Orderings. The American Statistician 41, 6-10
Landier, A., 2006. Entrepreneurship and the Stigma of Failure. Working Paper
Landier, A., Thesmar, D., 2009. Financial Contracting with Optimistic Entrepreneurs. Review of Financial Studies 22, 117-150
Langer, E.J., 1975. The Illusion of Control. Journal of Personality and Social Psychology 32, 311-328
Lazear, E.P., 2004. Balanced Skills and Entrepreneurship. American Economic Review, Papers & Proceedings, 208-11
Lynn, R., 1969. An Achievement Motivation Questionnaire. British Journal of Psychology 60, 529-534
Malmendier, U., Tate, G., 2005. CEO Overconfidence and Corporate Investment. Journal of Finance 60, 2661-2700
Miller, D.T., Ross, M., 1975. Self-serving biases in the attribution of causality: Fact or fiction? Psychological Bulletin 82, 213-225
Parker, S.C., 2004. The Economics of Self-Employment and Entrepreneurship. Cambridge University Press, Cambridge
Philosophov, L.V., Batten, J.A., Philosophov, L., 2008. Predicting the event and time horizon of bankruptcy using financial ratios and the maturity schedule of long-term debt. . Mathematics and Financial Economics 1

- 36 -
Puri, M., Robinson, D.T., 2007. Optimism and economic choice. Journal of Financial Economics 86, 71-99
Rotter, J.B., 1966. Generalized Expectancies for Internal Versus External Control of Reinforcement. Psychological Monographs 80, 1-28
Sørensen, J.B., 2007. Bureaucracy and Entrepreneurship: Workplace Effects on Entrepreneurial Entry. Administrative Science Quarterly 52, 387-412
Staiger, D., Stock, J.H., 1997. Instrumental Variables Regression with Weak Instruments. Econometrica 65, 557-586
Stewart Jr., W.H., Roth, P.L., 2001. Risk Propensity Differences Between Entrepreneurs and Managers: A Meta-Analytic Review. Journal of Applied Psychology 86, 145-153
Van Gelderen, M., Thurik, R., Bosma, N., 2006. Success and Risk Factors in the Pre-Startup Phase. Small Business Economics 26, 319-335
Wooldridge, J.M., 2002. Economic Analysis of Cross Section and Panel Data. The MIT Press, Cambridge, Massachusetts, London, England
Zhao, H., Seibert, S.E., 2006. The Big Five Personality Dimensions and Entrepreneurial Status: A Meta Analytical Review. Journal of Applied Psychology 91, 259-271
Zuckerman, M., 1979. Attribution of success and failure revisited, or: The motivational bias is alive and well in attribution theory. Journal of Personality 47, 245-287

- 37 -
Table 1 Summary Statistics for Entrepreneurs
Entrepreneurs are individuals who work at least part-time in a company in which they hold a financial stake. Variable definitions are in the Appendix. Variable Mean Min Lower
quartile Median Upper
quartile Max Standard
Deviation N
Panel A: Personal characteristics
Part -time entrepreneur 0.29 0.00 0.00 0.00 1.00 1.00 0.46 3,051 Ownership (percentage) 85.31 1.00 80.00 100.00 100.00 100.00 25.91 3,104 Initial employment 3 0 1 1 2 330 8.66 2,956 Current equity in thousands 856 0 41 118 312 200,000 7,970 1,332
Panel B: Firm-specific variables
Sole proprietorship (proportion) 0.44 0 0 0 100 100 – 3,087 Initial capital in thousands 193 0 22 53 116 16,500 831 193 Current equity in thousands 856 0 41 118 312 200,000 7,970 1,332 Leverage (percentage) 0.72 0.00 0.00 0.00 0.25 47.08 2.94 1,301
Venture-capital- backed (proportion)
0.02 0.00 0.00 0.00 0.00 1.00 – 3,000
Protestant (proportion) 0.53 0.00 0.00 1.00 1.00 1.00 – 2,956
Panel C: Firm performance
Firm sales in thousands 2,010 0 70 200 600 2,500,000 48,800 2,697 Aggregate income in thousands 169 –3,330 60 119 190 5,370 308 1,586 Return on initial capital 4.21 0.06 0.81 2.20 5.63 19.75 5.10 1,457 Personal income in thousands 110 0 50 62 125 1,000 123 2,960
Table 2 Sample Averages: Comparison of Entrepreneurs and Non-Entrepreneurs
Means (frequencies for binary variables), standard deviations, and differences in means between entrepreneurs and non-entrepreneurs, as well as z-values (based on a Mann-Whitney test). Entrepreneurs are defined as individuals who work at least part-time in a company in which they hold a financial stake. The sample consists of 2,485 entrepreneurs and 3,467 employees. Variable definitions are provided in the Appendix. Asterisks denote statistical significance at the 1% (***), 5% (**), or 10% (*) level (two-sided tests).
All Entrepreneurs Non-entrepreneurs Difference
Entrepreneurial skills Education 14.12 14.47 13.92 0.55*** Working experience 28.27 24.42 30.59 –6.17*** Management experience 12.35 11.93 12.62 –0.70*** Previously successful entrepreneur 0.18 0.23 0.14 0.09***
Personal characteristics Risk-aversion 0.38 0.30 0.43 –0.13*** Overconfidence 0.13 0.21 0.08 0.14*** Internal locus of control 0.22 0.24 0.21 0.03*** Age 50.50 45.10 53.74 –8.64*** Female 0.23 0.18 0.26 –0.08*** Foreigner 0.12 0.16 0.09 0.08*** Protestant (proportion) 0.50 0.53 0.48 0.05***
Identification variables Career by chance 0.67 0.73 0.63 0.10*** Need for achievement 0.37 0.43 0.33 0.10*** Net wealth 12.56 12.63 12.52 0.11** Connections 0.10 0.16 0.07 0.09***

- 38 -
Table 3 Rankings of Success Factors in Entrepreneurial Performance
Entrepreneurs were asked to provide scores for six factors of entrepreneurial success: luck, experience, talent, effort, education, and connections. The possible scores range from very important (1) to quite unimportant (5). For each respondent, we used the reported scores to infer his/her rankings of the factors of success (the highest possible rank is 1 and the lowest is 5). Entrepreneurs are individuals who work at least part-time in a company in which they hold a financial stake. Variable definitions are provided in the Appendix. Panel A provides descriptive rankings statistics. Panel B shows what proportion of respondents give a particular factor the highest (or the lowest) rank. Panel C computes rank-correlation coefficients between pairs of success factor ranks.
Panel A: Rankings
Ranking Mean St Dev Min Median Max Number of observations Luck 4.50 1.86 1.00 5.00 6.00 3,018 Effort 1.58 1.18 1.00 1.00 6.00 3,063 Experience 1.94 1.39 1.00 1.00 6.00 3,055 Talent 1.61 1.13 1.00 1.00 6.00 3,054 Education 2.48 1.67 1.00 2.00 6.00 3,049 Connections 2.62 1.78 1.00 2.00 6.00 3,044
Panel B: Extreme Rankings Proportion of cases who rank a factor as highest vs. lowest Luck 15.47% ; 78.43% Effort 74.86% ; 14.53% Experience 60.43% ; 18.46% Talent 70.99% ; 14.34% Education 47.23% ; 28.30% Connections 47.11% ; 28.12% Start-ups do not need luck to succeed 57.80% Minimum number of observations 3,018
Panel C: Kendall Rank Correlation Matrix of Factor Ranks
Luck Effort Experience Talent Education Connections Luck 1.0 Effort -0.17 1.00 Experience -0.09 0.12 1.00 Talent -0.13 0.17 0.22 1.00 Education -0.24 0.14 0.14 0.15 1.00 Connections -0.03 -0.04 -0.03 -0.05 -0.01 1.00

- 39 -
Table 4 Rankings of Success Factors and Entrepreneurial Locus of Control
Entrepreneurs were asked to provide scores for six factors of entrepreneurial success: luck, experience, talent, effort, education, and connections. The possible scores range from very important (1) to quite unimportant (5) . Based on these scores, for each entrepreneur, we inferred the rankings of success factors. Entrepreneurs are individuals who work at lest part-time in a company in which they hold a financial stake. The table splits the sample by the entrepreneur’s locus of control. Variable definitions are provided in the Appendix. Asterisks denote statistical significance at the 1% (***) level of confidence (two-sided tests). Internal locus of control External locus of control Effort 1.41 1.63*** Talent 1.58 1.61*** Experience 1.90 1.95 Education 2.37 2.52*** Connections 5.06 2.49*** Luck 5.06 4.32*** Start-ups do not need luck to succeed 69.1% 55.0%*** Number of observations 708 2,216
Table 5 Principal Component Analysis of Six Success Factors; Varimax Rotation
The table performs a principal component analysis of the six success factors with a varimax rotation of the coordinates to help the interpretation. In doing so, we reduce the number of components to three. Entrepreneurs were asked to provide scores for six factors of entrepreneurial success: luck, experience, talent, effort, education, and connections. The possible scores range from very important (1) to quite unimportant (5). Entrepreneurs are individuals who work at least part-time in a company in which they hold a financial stake. Variable definitions are provided in the Appendix. Variable Component 1 Component 2 Component 3 Luck 0.021 0.040 0.927 Effort 0.535 0.020 0.202 Experience 0.565 –0.162 0.100 Talent 0.472 –0.073 –0.178 Education 0.414 0.344 –0.238 Connections –0.030 0.921 0.048 Eigenvalue 1.872 1.055 1.050
Cumulative proportion of variance explained 0.312 0.488 0.663
Table 6 Importance of Luck in Eight Management Tasks: Summary Statistics
The table reports descriptive statistics for the importance of luck in eight different management activities. The original question asked: “How important is pure chance for an entrepreneur in the following areas: business idea, optimal timing for entry, finding employees, gaining customers, securing suppliers, financing, business connections, and private connections?” The possible scores for each item ranged from very important (1) to very unimportant (5). For each respondent, we then used these scores to obtain a ranking of the importance of luck across the different areas. Entrepreneurs are individuals who work at least part-time in a company in which they hold a financial stake.
Area Mean Min Lower quartile Median Upper
quartile Max Standard deviation N
Gaining customers 2.28 1 1 1 3 8 1.76 2,957 Establishing business connections 2.30 1 1 1 3 8 1.69 2,958 Conceiving the business idea 2.60 1 1 1 4 8 2.09 2,974 Establishing private connections 2.86 1 1 2 4 8 2.08 2,952 Optimal timing for entry 3.02 1 1 2 5 8 2.25 2,953 Finding employees 3.28 1 1 3 5 8 2.23 2,944 Obtaining financing 4.06 1 1 4 6 8 2.40 2,942 Securing suppliers 4.18 1 2 4 6 8 2.34 2,923

- 40 -
Table 7 Frequency of Entrepreneurs W ho Believe Luck is Very Important in Different Management Tasks
The table examines how many entrepreneurs believe luck is very important in individual management activities. Entrepreneurs were asked to score the importance of luck in eight individual management activities. The original question asked: “How important is pure chance for an entrepreneur in the following areas: business idea, optimal timing for entry, finding employees, gaining customers, securing suppliers, obtaining financing, establishing business connections, and establishing private connections?” We focus here on the instances in which entrepreneurs gave the importance of luck the maximum score of 5. Entrepreneurs are individuals who work at least part-time for the company in which they hold a financial stake. Frequency of entrepreneurs who believe luck is important in at least …
Frequency Percentage
One management area 1,612 57.88% Two management areas 1,114 40.00% Three management areas 702 25.21% Four management areas 451 16.19% Total number of responding entrepreneurs 2,785 100.00%
Table 8 Luck as a Determinant of Entrepreneurial Success and Luck in Eight Different Management Tasks
The table reports estimates of a probit regression. The dependent variable is a dummy variable equal to 1 if the entrepreneur believes luck is a very important determinant of overall firm performance (score of 5), and equal to 0 otherwise. The regression arguments are dummy variables equal to 1 if the entrepreneur believes luck is very important in the management area in question, and equal to 0 otherwise. Entrepreneurs work at least part-time for the company in which they hold a financial stake. Variable definitions are provided in the Appendix. Asterisks denote statistical significance at the 1% (***), 5% (**), or 10% (*) level (two-sided tests).
Area Coefficient estimate t-value
Business idea 0.380*** 5.45 Optimal timing for entry 0.438*** 6.43 Finding employees 0.176*** 2.41
Gaining customers 0.312*** 4.17
Securing suppliers –0.177** –2.14
Obtaining financing –0.045 –0.57
Establishing business connections 0.405*** 4.95
Establishing private connections 0.245*** 3.17
Constant -0.674*** -10.33
Observations 1,849 Pseudo R-squared 0.139

- 41 -
Table 9 Importance of Luck and the Decision to Start an Entrepreneurial Career
The table reports the results of probit regressions that model the entrepreneurial career decision. The dependent variable takes the value of 1 if an individual is an entrepreneur, and zero otherwise. Entrepreneurs are individuals who work at least part-time in a company in which they hold a financial stake. Column (1) tests the relevance of the success factors using the scores that these factors receive from the entrepreneurs. The possible scores range from very important (1) to very unimportant (5). High (low) management experience is a binary variable equal to 1 if the individual’s experience is in the highest (lowest) quartile of the sample distribution, and equal to zero otherwise. The remaining columns replace the subjective assessments of the importance of the success factors with proxies for the actual value of those factors. All regressions include nondisclosure dummies. Variable definitions are provided in the Appendix. Asterisks denote statistical significance at the 1% (***), 5% (**), or 10% (*) level (two-sided tests). Regression arguments (1) (2) (3) (4)
Success factors: subjective scores
Importance of luck –0.052*** (–3.11)
–0.037** (–2.19)
–0.020 (–1.13)
–0.018 (–1.06)
Importance of luck*High management experience –0.057***
(–3.20)
Importance of luck*Low management experience –0.081***
(–5.54)
Importance of experience 0.031 (1.21)
Importance of talent 0.007 (0.24)
Importance of effort 0.194*** (6.68)
Importance of education –0.118*** (–5.65)
Importance of connections 0.114*** (6.13)
Success factors: actual values
Working experience 0.006** (1.92)
0.006** (1.96)
0.006** (1.99)
Industry experience –0.011***
(–5.96) –0.011***
(–6.06) –0.011***
(–6.00)
Management experience 0.014***
(7.07) 0.020***
(7.49) 0.008***
(3.40)
Previously successful entrepreneur 0.062 (1.38)
0.063 (1.40)
0.058 (1.28)
Previously unsuccessful entrepreneur 0.286***
(4.12) 0.285***
(4.11) 0.275***
(3.96)
Previously unemployed 0.566*** (5.79)
0.548*** (5.51)
0.556*** (5.58)
0.568*** (5.69)
Number of children –0.073***
(–4.93) –0.073***
(–4.89) –0.072***
(–4.86)
Foreigner 0.228***
(4.38) 0.228***
(4.37) 0.230***
(4.42)
Education 0.020***
(2.56) 0.018** (2.40)
0.016** (2.11)
Balanced education 0.082***
(5.91) 0.081***
(5.88) 0.078***
(5.63)
Connections 0.374***
(6.90) 0.375***
(6.91) 0.373***
(6.87)
Personal characteristics
Internal locus of control 0.174*** (4.24)
0.155*** (3.74)
0.154*** (3.71)
0.154*** (3.71)
Protestant 0.151*** (3.73)
0.132*** (3.17)
0.133*** (3.20)
0.134*** (3.23)
Risk-aversion –0.538*** (–8.14)
–0.414*** (–6.08)
–0.413*** (–6.05)
–0.412*** (–6.03)
Overconfidence 1.198*** (13.90)
1.158*** (13.23)
1.156*** (13.21)
1.139*** (13.00)
Other control variables Yes Yes Yes Yes
Identification variables Yes Yes Yes Yes
Number of observations 8,245 8,245 8,245 8,245
Pseudo R2 0.262 0.291 0.292 0.294
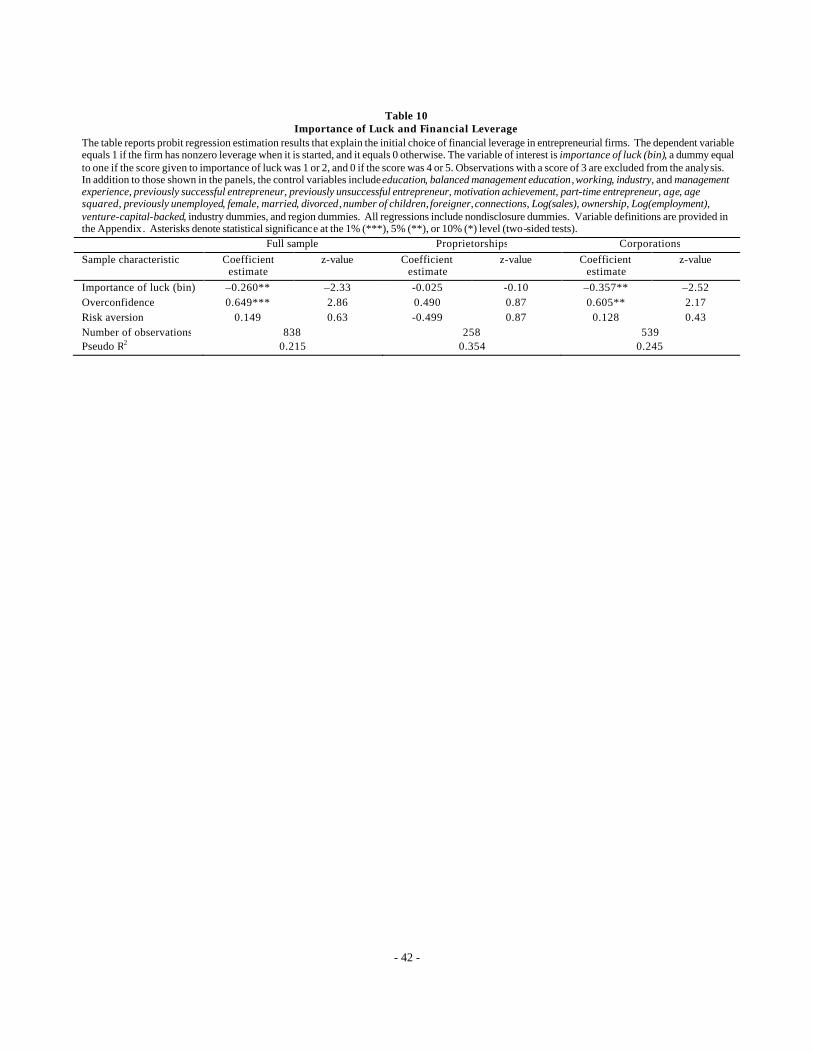
- 42 -
Table 10
Importance of Luck and Financial Leverage The table reports probit regression estimation results that explain the initial choice of financial leverage in entrepreneurial firms. The dependent variable equals 1 if the firm has nonzero leverage when it is started, and it equals 0 otherwise. The variable of interest is importance of luck (bin), a dummy equal to one if the score given to importance of luck was 1 or 2, and 0 if the score was 4 or 5. Observations with a score of 3 are excluded from the analysis. In addition to those shown in the panels, the control variables include education, balanced management education , working, industry, and management experience, previously successful entrepreneur, previously unsuccessful entrepreneur, motivation achievement, part-time entrepreneur, age, age squared, previously unemployed, female, married, divorced, number of children, foreigner, connections, Log(sales), ownership, Log(employment), venture-capital-backed, industry dummies, and region dummies. All regressions include nondisclosure dummies. Variable definitions are provided in the Appendix. Asterisks denote statistical significance at the 1% (***), 5% (**), or 10% (*) level (two-sided tests). Full sample Proprietorships Corporations Sample characteristic Coefficient
estimate z-value Coefficient
estimate z-value Coefficient
estimate z-value
Importance of luck (bin) –0.260** –2.33 -0.025 -0.10 –0.357** –2.52 Overconfidence 0.649*** 2.86 0.490 0.87 0.605** 2.17 Risk aversion 0.149 0.63 -0.499 0.87 0.128 0.43 Number of observations 838 258 539 Pseudo R2 0.215 0.354 0.245

- 43 -
Table 11 Performance of Entrepreneurial Firms and Subjective Luck
This table reports estimates of the performance regression (3) in the text. Because entrepreneurs are unlikely to be drawn from a random sample of individuals, we perform the analysis with a Heckman two-stage estimation procedure. We therefore use the model of entrepreneurial career choice in equation (1) as the first stage. In the second-stage, we estimate the performance regression (3) with the addition of the inverse Mills ratio from the first stage. Furthermore, we include two variables that measure whether the entrepreneur believes his or her firm has done unexpectedly well or unexpectedly poorly (good luck and bad luck). Entrepreneurs are individuals who work at least part-time in a company in which they hold a financial stake. All regressions include nondisclosure dummies. Variable definitions are in the Appendix. Asterisks denote statistical significance at the 1% (***), 5% (**), or 10% (*) level (two-sided tests).
Industry-adjusted log(firm sales)
Industry-adjusted log(aggregate income)
Industry-adjusted return on initial capital
Coefficient z-Statistic Coefficient z-Statistic Coefficient z-Statistic
Constant –0.841** –2.069 –1.303*** –3.876 0.575 0.266
Entrepreneurial luck Good luck 0.492*** 11.12 0.373*** 10.19 1.604*** 6.819 Bad luck –0.474*** –6.929 –0.425*** –6.770 –1.270*** –3.322
Success factors
Working experience –0.001 –0.307 –004 –1.012 –0.024 –1.076 Industry experience 0.005* 1.877 0.002 0.841 0.020 1.470 Management experience 0.009*** 2.932 0.009*** 3.462 0.011 0.660 Previously successful entrepreneur 0.039 0.743 0.091** 2.013 –0.010 –0.036 Previously unsuccessful entrepreneur 0.018 0.222 –0.012 –0.181 0.252 0.601 Previously unemployed –0.216* –1.855 –0.261*** –2.824 –0.198 –0.347 Number of children 0.0471** 2.546 0.001 0.074 0.060 0.584 Foreigner –0.012 –0.203 0.113** 2.271 1.082*** 3.392 Part -time entrepreneur –0.264*** –5.427 Education 0.004 0.371 0.021*** 2.716 0.118** 2.387 Balanced management education 0.028* 1.757 0.021 1.546 –0.110 –1.294 Connections –0.075 –1.231 0.010 0.193 –0.176 –0.547
Personal characteristics
Internal locus of control 0.026 0.520 0.052 1.297 0.189 0.736 Protestant –0.097* –1.836 –0.077* –1.735 –0.425 –1.486 Risk-aversion –0.019 –0.203 –0.042 –0.561 –0.211 –0.435 Overconfidence 0.086 0.772 –0.063 –0.671 –2.420*** –4.009 Married 0.139** 2.573 0.090** 1.989 –0.247 –0.868 Divorced 0.111 1.320 0.030 0.433 –0.643 –1.432 Female –0.235*** –3.808 –0.186*** –3.503 –0.034 –0.098 Age 0.029* 1.897 0.022* 1.771 –0.083 –1.026 Age squared –0.386x10⁻³** –2.247 –0.207x10⁻³ –1.502 0.001 1.210
Firm-specific controls
Equity ownership –0.004*** –4.537 0.002 0.181 0.0145*** 2.718 Sole proprietorship –0.595*** –11.93 0.149*** 3.609 0.912*** 3.458 Log(initial capital) 0.058*** 7.248 0.013* 1.821 Log(employment) 0.245*** 16.60 0.0991*** 6.982 –0.145 –1.621 Leverage 0.0183* 1.929 –0.004 –0.383 –0.075 –1.551 Venture-capital-backed 0.237 1.410 –0.050 –0.366 –0.606 –0.757
Region dummies Yes Yes Yes Formation year dummies Yes Yes Yes Inverse Mills ratio (λ) –0.229** –2.338 0.053 0.671 0.031 0.062 Number of observations 2,349
0.431 1,499 0.236
1,421 0.111 Adjusted R-squared