lubricin in rat knee articular cartilage distribution of ...
24
Page 1/24 Effects of in vivo cyclic compressive loading on the distribution of local type II collagen and supercial lubricin in rat knee articular cartilage XIANG JI Kyoto University Akira Ito ( [email protected] ) Kyoto University https://orcid.org/0000-0002-9645-9777 Akihiro Nakahata Kyoto University Kohei Nishitani Kyoto University Hiroshi Kuroki Kyoto University Tomoki Aoyama Kyoto University Research article Keywords: In vivo cyclic compression, Post-traumatic osteoarthritis, Cartilage degeneration, Rat model, Type II collagen, Supercial lubricin Posted Date: December 26th, 2019 DOI: https://doi.org/10.21203/rs.2.19640/v1 License: This work is licensed under a Creative Commons Attribution 4.0 International License. Read Full License
Transcript of lubricin in rat knee articular cartilage distribution of ...
Page 1/24
Effects of in vivo cyclic compressive loading on thedistribution of local type II collagen and super�ciallubricin in rat knee articular cartilageXIANG JI
Kyoto UniversityAkira Ito ( [email protected] )
Kyoto University https://orcid.org/0000-0002-9645-9777Akihiro Nakahata
Kyoto UniversityKohei Nishitani
Kyoto UniversityHiroshi Kuroki
Kyoto UniversityTomoki Aoyama
Kyoto University
Research article
Keywords: In vivo cyclic compression, Post-traumatic osteoarthritis, Cartilage degeneration, Rat model,Type II collagen, Super�cial lubricin
Posted Date: December 26th, 2019
DOI: https://doi.org/10.21203/rs.2.19640/v1
License: This work is licensed under a Creative Commons Attribution 4.0 International License. Read Full License
Page 2/24
AbstractBackground
This study aimed to examine the effects of a single episode of in vivo cyclic loading on rat knee articularcartilage (AC) in mid-term observation and investigate relevant factors associated with the progression ofpost-traumatic osteoarthritis (PTOA).
Methods
Twelve-week-old Wistar rats underwent one episode of 60 cycles of dynamic compression of 20 N or 50 Non their right knee joint. The spatiotemporal changes in the AC after loading were evaluated usinghistology and immunohistochemistry at 3 days, 1, 2, 4 and 8 weeks after loading (n=6 for eachcondition). The chondrocyte vitality was assessed at 1, 3, 6 and 12 hours after loading (n=2 for eachcondition).
Results
A localized AC lesion on lateral femoral condyle was con�rmed in all subjects. The surface andintermediate cartilage in the affected area degenerated after loading, yet the calci�ed cartilage remainedintact. The expression of type II collagen in the lesion cartilage was upregulated after loading, whereasthe super�cial lubricin layer was eroded in response to cyclic compression. However, the distribution ofsuper�cial lubricin gradually recovered to the normal level 4 weeks after loading-inducedinjury.Conclusion
We con�rmed that 60 times cyclic loading exceeding 20 N could result in cartilage damage in rat knee.Endogenous repairs in well-structured joints work well with rebuilding protective layers on the lesioncartilage surface, which could be the latent factor in delaying the progression of PTOA.
BackgroundPost-traumatic osteoarthritis (PTOA) is a classi�cation of clinical osteoarthritis (OA) which is morecommon among patients who have a history of articular cartilage (AC) damage and ligament injury.Animal models play an important role in understanding the pathophysiology of and developing noveltreatments for PTOA. Small animals like rodents, have an advantage of a faster pathological process andhave lower maintenance costs in comparison to large animals, and hence, are widely used as PTOAmodels for experimental purpose. The anterior cruciate ligament transection (ACLT) and destabilizationof medial meniscus (DMM) have been the optimal options for short term studies since past. In the recentdecades, non-surgical models were alternatively taken into account in order to avoid surgery-inducedin�ammation that could affect the results of evaluation. One of the most promising candidates is thecyclic compression on knee AC [1].
Page 3/24
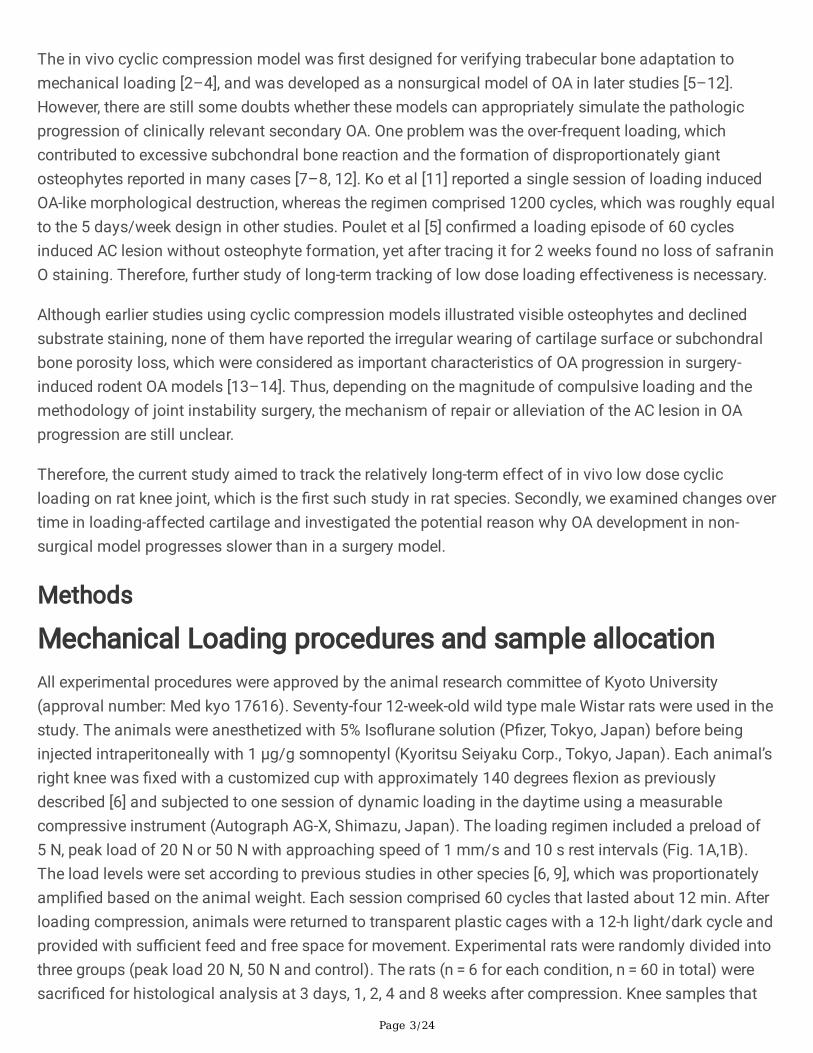
The in vivo cyclic compression model was �rst designed for verifying trabecular bone adaptation tomechanical loading [2–4], and was developed as a nonsurgical model of OA in later studies [5–12].However, there are still some doubts whether these models can appropriately simulate the pathologicprogression of clinically relevant secondary OA. One problem was the over-frequent loading, whichcontributed to excessive subchondral bone reaction and the formation of disproportionately giantosteophytes reported in many cases [7–8, 12]. Ko et al [11] reported a single session of loading inducedOA-like morphological destruction, whereas the regimen comprised 1200 cycles, which was roughly equalto the 5 days/week design in other studies. Poulet et al [5] con�rmed a loading episode of 60 cyclesinduced AC lesion without osteophyte formation, yet after tracing it for 2 weeks found no loss of safraninO staining. Therefore, further study of long-term tracking of low dose loading effectiveness is necessary.
Although earlier studies using cyclic compression models illustrated visible osteophytes and declinedsubstrate staining, none of them have reported the irregular wearing of cartilage surface or subchondralbone porosity loss, which were considered as important characteristics of OA progression in surgery-induced rodent OA models [13–14]. Thus, depending on the magnitude of compulsive loading and themethodology of joint instability surgery, the mechanism of repair or alleviation of the AC lesion in OAprogression are still unclear.
Therefore, the current study aimed to track the relatively long-term effect of in vivo low dose cyclicloading on rat knee joint, which is the �rst such study in rat species. Secondly, we examined changes overtime in loading-affected cartilage and investigated the potential reason why OA development in non-surgical model progresses slower than in a surgery model.
Methods
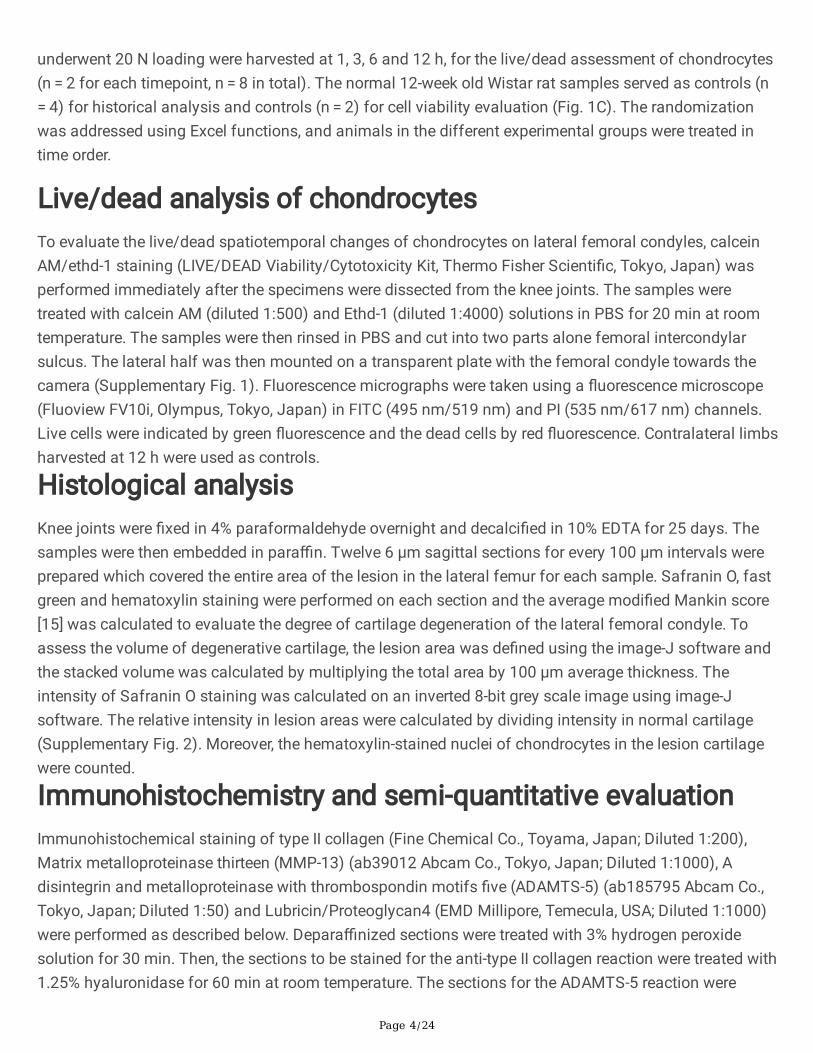
Mechanical Loading procedures and sample allocationAll experimental procedures were approved by the animal research committee of Kyoto University(approval number: Med kyo 17616). Seventy-four 12-week-old wild type male Wistar rats were used in thestudy. The animals were anesthetized with 5% Iso�urane solution (P�zer, Tokyo, Japan) before beinginjected intraperitoneally with 1 µg/g somnopentyl (Kyoritsu Seiyaku Corp., Tokyo, Japan). Each animal’sright knee was �xed with a customized cup with approximately 140 degrees �exion as previouslydescribed [6] and subjected to one session of dynamic loading in the daytime using a measurablecompressive instrument (Autograph AG-X, Shimazu, Japan). The loading regimen included a preload of5 N, peak load of 20 N or 50 N with approaching speed of 1 mm/s and 10 s rest intervals (Fig. 1A,1B).The load levels were set according to previous studies in other species [6, 9], which was proportionatelyampli�ed based on the animal weight. Each session comprised 60 cycles that lasted about 12 min. Afterloading compression, animals were returned to transparent plastic cages with a 12-h light/dark cycle andprovided with su�cient feed and free space for movement. Experimental rats were randomly divided intothree groups (peak load 20 N, 50 N and control). The rats (n = 6 for each condition, n = 60 in total) weresacri�ced for histological analysis at 3 days, 1, 2, 4 and 8 weeks after compression. Knee samples that
Page 4/24
underwent 20 N loading were harvested at 1, 3, 6 and 12 h, for the live/dead assessment of chondrocytes(n = 2 for each timepoint, n = 8 in total). The normal 12-week old Wistar rat samples served as controls (n = 4) for historical analysis and controls (n = 2) for cell viability evaluation (Fig. 1C). The randomizationwas addressed using Excel functions, and animals in the different experimental groups were treated intime order.
Live/dead analysis of chondrocytesTo evaluate the live/dead spatiotemporal changes of chondrocytes on lateral femoral condyles, calceinAM/ethd-1 staining (LIVE/DEAD Viability/Cytotoxicity Kit, Thermo Fisher Scienti�c, Tokyo, Japan) wasperformed immediately after the specimens were dissected from the knee joints. The samples weretreated with calcein AM (diluted 1:500) and Ethd-1 (diluted 1:4000) solutions in PBS for 20 min at roomtemperature. The samples were then rinsed in PBS and cut into two parts alone femoral intercondylarsulcus. The lateral half was then mounted on a transparent plate with the femoral condyle towards thecamera (Supplementary Fig. 1). Fluorescence micrographs were taken using a �uorescence microscope(Fluoview FV10i, Olympus, Tokyo, Japan) in FITC (495 nm/519 nm) and PI (535 nm/617 nm) channels.Live cells were indicated by green �uorescence and the dead cells by red �uorescence. Contralateral limbsharvested at 12 h were used as controls.
Histological analysisKnee joints were �xed in 4% paraformaldehyde overnight and decalci�ed in 10% EDTA for 25 days. Thesamples were then embedded in para�n. Twelve 6 µm sagittal sections for every 100 µm intervals wereprepared which covered the entire area of the lesion in the lateral femur for each sample. Safranin O, fastgreen and hematoxylin staining were performed on each section and the average modi�ed Mankin score[15] was calculated to evaluate the degree of cartilage degeneration of the lateral femoral condyle. Toassess the volume of degenerative cartilage, the lesion area was de�ned using the image-J software andthe stacked volume was calculated by multiplying the total area by 100 µm average thickness. Theintensity of Safranin O staining was calculated on an inverted 8-bit grey scale image using image-Jsoftware. The relative intensity in lesion areas were calculated by dividing intensity in normal cartilage(Supplementary Fig. 2). Moreover, the hematoxylin-stained nuclei of chondrocytes in the lesion cartilagewere counted.
Immunohistochemistry and semi-quantitative evaluationImmunohistochemical staining of type II collagen (Fine Chemical Co., Toyama, Japan; Diluted 1:200),Matrix metalloproteinase thirteen (MMP-13) (ab39012 Abcam Co., Tokyo, Japan; Diluted 1:1000), Adisintegrin and metalloproteinase with thrombospondin motifs �ve (ADAMTS-5) (ab185795 Abcam Co.,Tokyo, Japan; Diluted 1:50) and Lubricin/Proteoglycan4 (EMD Millipore, Temecula, USA; Diluted 1:1000)were performed as described below. Depara�nized sections were treated with 3% hydrogen peroxidesolution for 30 min. Then, the sections to be stained for the anti-type II collagen reaction were treated with1.25% hyaluronidase for 60 min at room temperature. The sections for the ADAMTS-5 reaction were
Page 5/24
treated with HistoVT one solution (Nacalai Tesque, Inc., Kyoto, Japan; diluted 1:10) for 40 min at 65 ℃.After rinsing in PBS, non-speci�c reaction was suppressed by blocking with 5% normal goat serum for60 min. Subsequently, the sections were treated with primary antibodies and incubated at 4 ℃ overnight.Sections were then washed in PBS and treated with goat anti-rabbit IgG (MMP-13 and ADAMTS-5) orgoat anti-mouse IgG (type II collagen and lubricin) for 30 min at room temperature. Detection wasperformed using the streptavidin–biotin–peroxidase complex technique with an Elite ABC kit (diluted1:100; Vector Laboratories, Burlingame, CA, USA). Localization was detected using 3,3-diaminobenzidinesolution (Vector Laboratories) followed by counterstaining with hematoxylin.
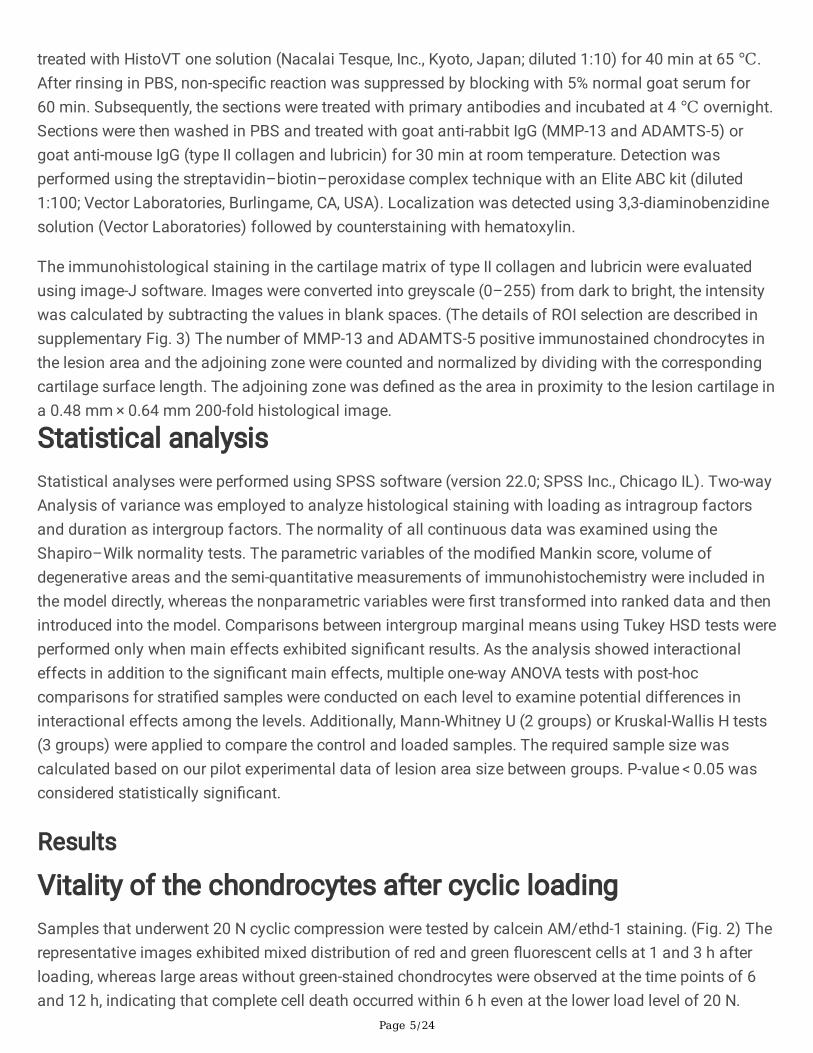
The immunohistological staining in the cartilage matrix of type II collagen and lubricin were evaluatedusing image-J software. Images were converted into greyscale (0–255) from dark to bright, the intensitywas calculated by subtracting the values in blank spaces. (The details of ROI selection are described insupplementary Fig. 3) The number of MMP-13 and ADAMTS-5 positive immunostained chondrocytes inthe lesion area and the adjoining zone were counted and normalized by dividing with the correspondingcartilage surface length. The adjoining zone was de�ned as the area in proximity to the lesion cartilage ina 0.48 mm × 0.64 mm 200-fold histological image.
Statistical analysisStatistical analyses were performed using SPSS software (version 22.0; SPSS Inc., Chicago IL). Two-wayAnalysis of variance was employed to analyze histological staining with loading as intragroup factorsand duration as intergroup factors. The normality of all continuous data was examined using theShapiro–Wilk normality tests. The parametric variables of the modi�ed Mankin score, volume ofdegenerative areas and the semi-quantitative measurements of immunohistochemistry were included inthe model directly, whereas the nonparametric variables were �rst transformed into ranked data and thenintroduced into the model. Comparisons between intergroup marginal means using Tukey HSD tests wereperformed only when main effects exhibited signi�cant results. As the analysis showed interactionaleffects in addition to the signi�cant main effects, multiple one-way ANOVA tests with post-hoccomparisons for strati�ed samples were conducted on each level to examine potential differences ininteractional effects among the levels. Additionally, Mann-Whitney U (2 groups) or Kruskal-Wallis H tests(3 groups) were applied to compare the control and loaded samples. The required sample size wascalculated based on our pilot experimental data of lesion area size between groups. P-value < 0.05 wasconsidered statistically signi�cant.
Results
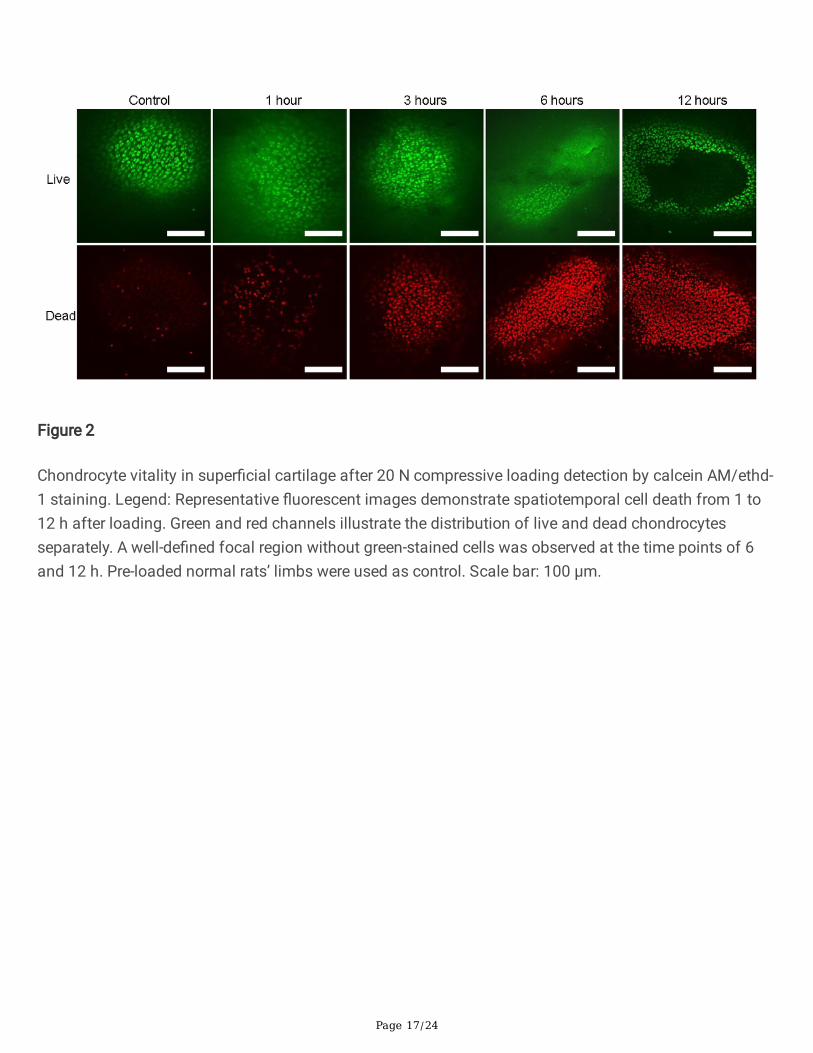
Vitality of the chondrocytes after cyclic loadingSamples that underwent 20 N cyclic compression were tested by calcein AM/ethd-1 staining. (Fig. 2) Therepresentative images exhibited mixed distribution of red and green �uorescent cells at 1 and 3 h afterloading, whereas large areas without green-stained chondrocytes were observed at the time points of 6and 12 h, indicating that complete cell death occurred within 6 h even at the lower load level of 20 N.
Page 6/24
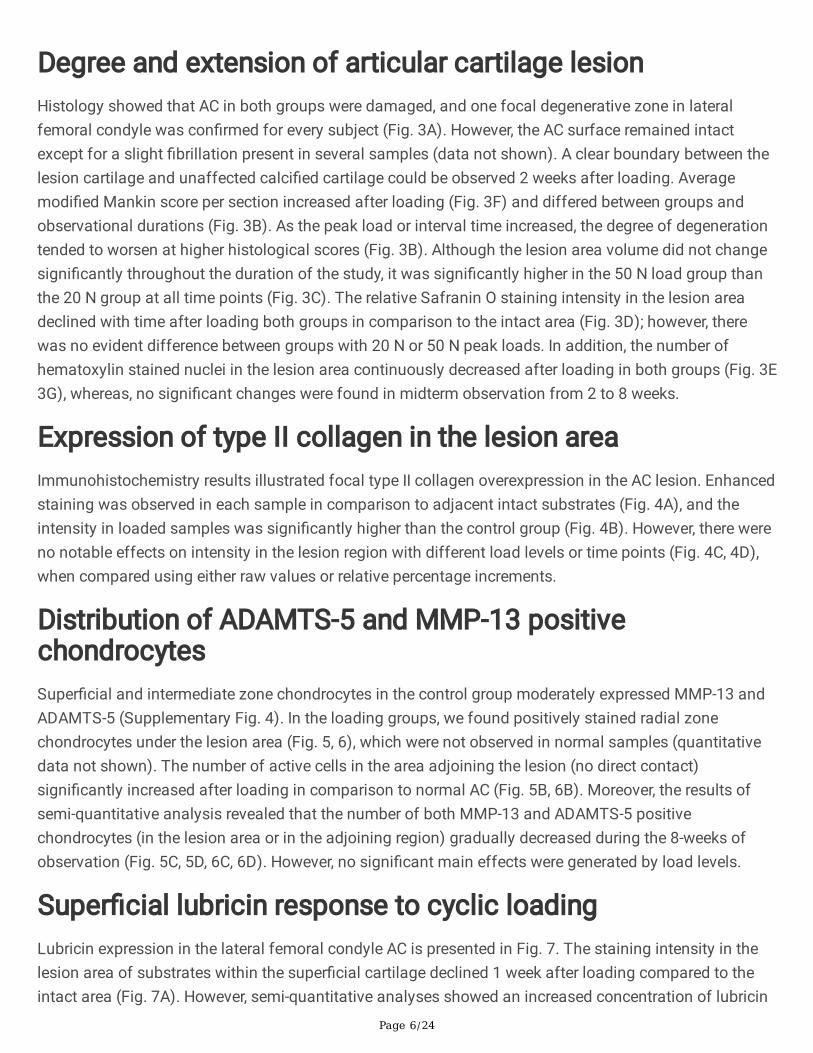
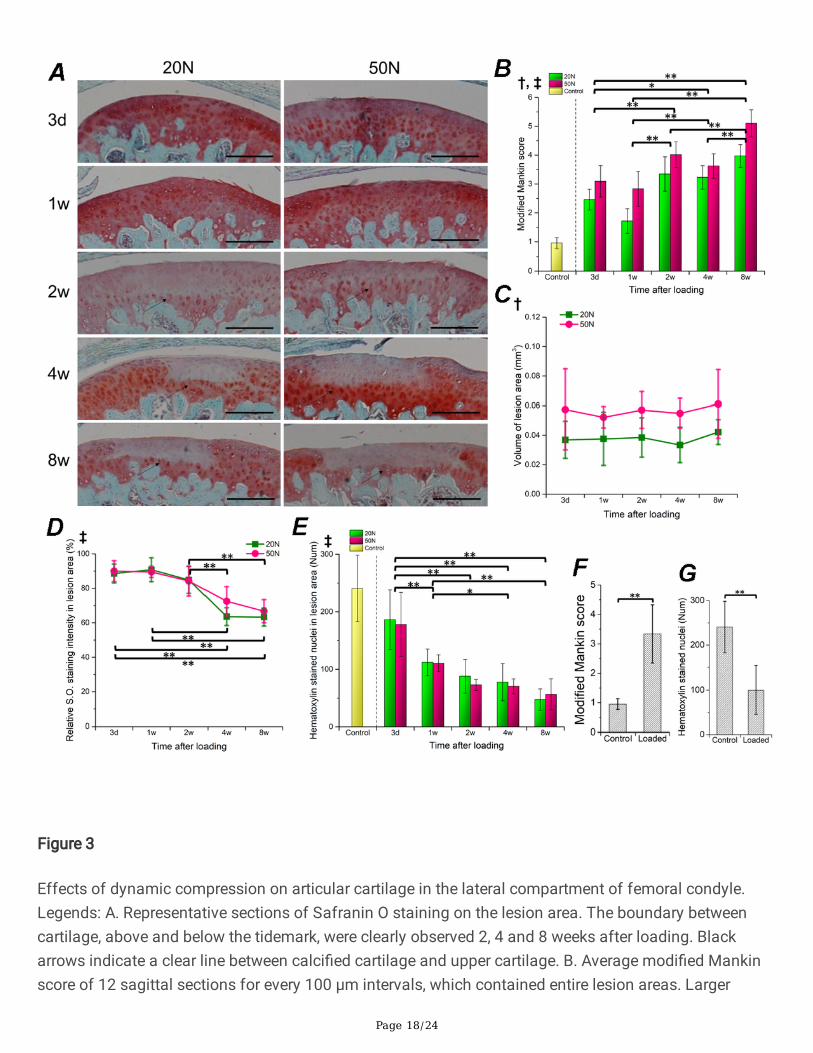
Degree and extension of articular cartilage lesionHistology showed that AC in both groups were damaged, and one focal degenerative zone in lateralfemoral condyle was con�rmed for every subject (Fig. 3A). However, the AC surface remained intactexcept for a slight �brillation present in several samples (data not shown). A clear boundary between thelesion cartilage and unaffected calci�ed cartilage could be observed 2 weeks after loading. Averagemodi�ed Mankin score per section increased after loading (Fig. 3F) and differed between groups andobservational durations (Fig. 3B). As the peak load or interval time increased, the degree of degenerationtended to worsen at higher histological scores (Fig. 3B). Although the lesion area volume did not changesigni�cantly throughout the duration of the study, it was signi�cantly higher in the 50 N load group thanthe 20 N group at all time points (Fig. 3C). The relative Safranin O staining intensity in the lesion areadeclined with time after loading both groups in comparison to the intact area (Fig. 3D); however, therewas no evident difference between groups with 20 N or 50 N peak loads. In addition, the number ofhematoxylin stained nuclei in the lesion area continuously decreased after loading in both groups (Fig. 3E3G), whereas, no signi�cant changes were found in midterm observation from 2 to 8 weeks.
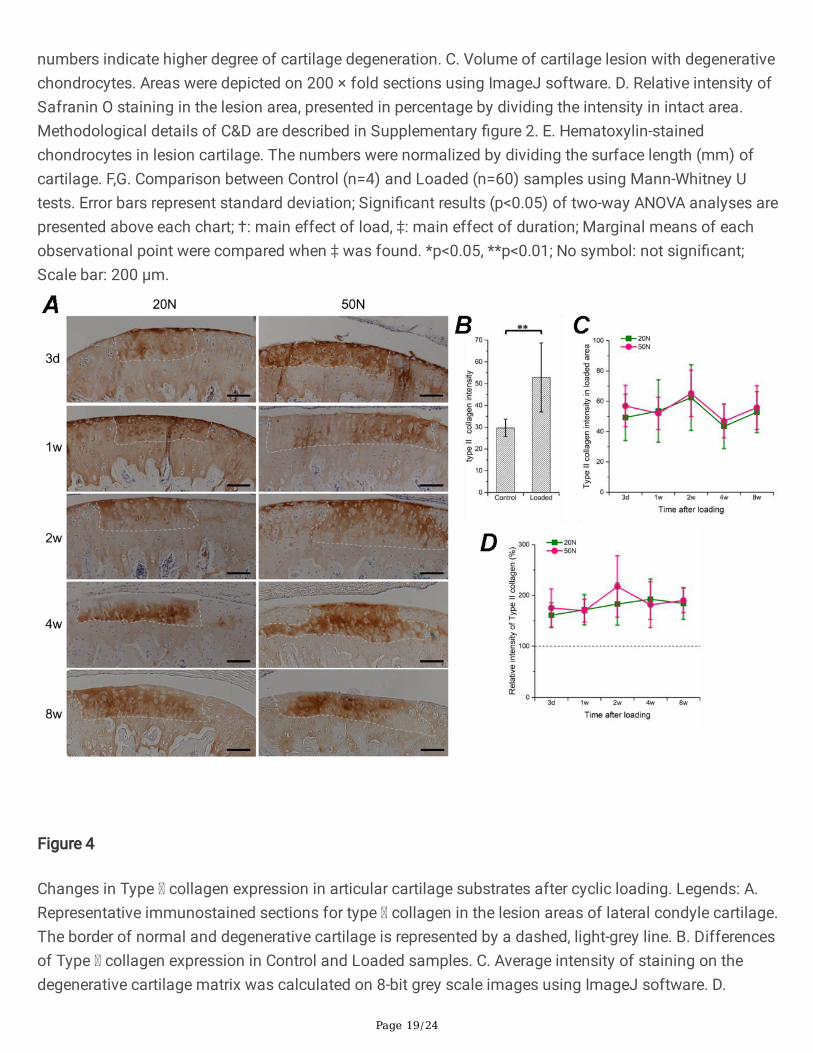
Expression of type II collagen in the lesion areaImmunohistochemistry results illustrated focal type II collagen overexpression in the AC lesion. Enhancedstaining was observed in each sample in comparison to adjacent intact substrates (Fig. 4A), and theintensity in loaded samples was signi�cantly higher than the control group (Fig. 4B). However, there wereno notable effects on intensity in the lesion region with different load levels or time points (Fig. 4C, 4D),when compared using either raw values or relative percentage increments.
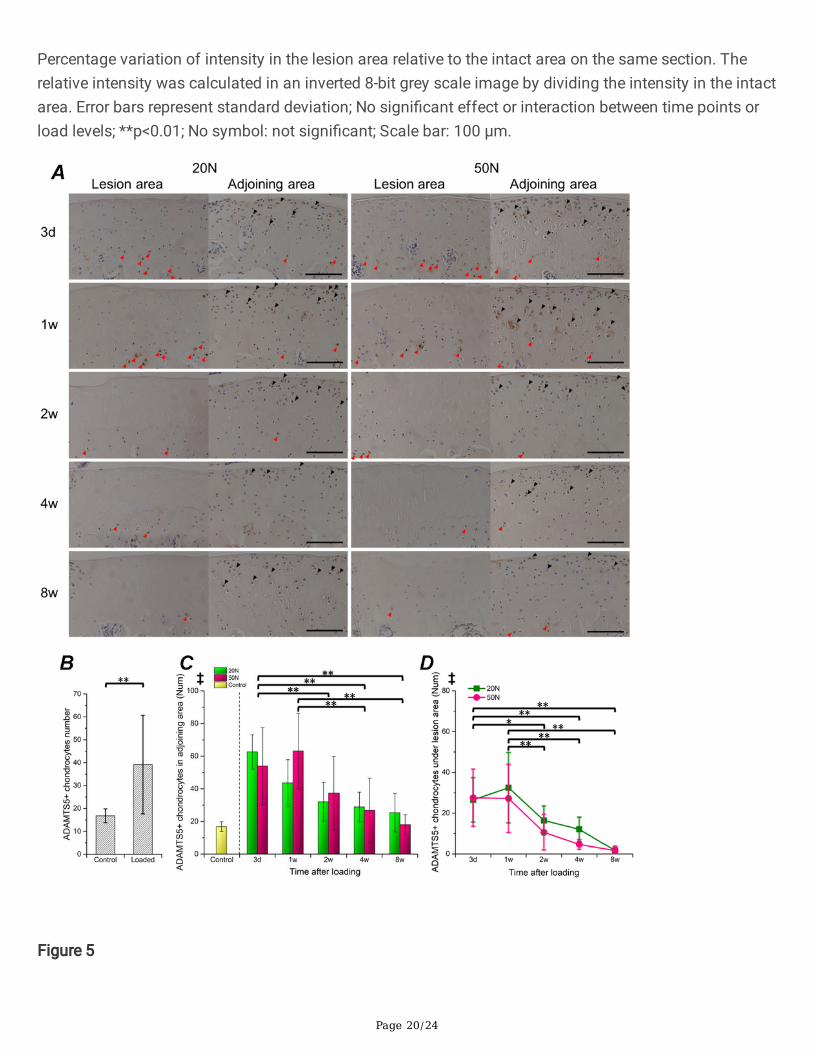
Distribution of ADAMTS-5 and MMP-13 positivechondrocytesSuper�cial and intermediate zone chondrocytes in the control group moderately expressed MMP-13 andADAMTS-5 (Supplementary Fig. 4). In the loading groups, we found positively stained radial zonechondrocytes under the lesion area (Fig. 5, 6), which were not observed in normal samples (quantitativedata not shown). The number of active cells in the area adjoining the lesion (no direct contact)signi�cantly increased after loading in comparison to normal AC (Fig. 5B, 6B). Moreover, the results ofsemi-quantitative analysis revealed that the number of both MMP-13 and ADAMTS-5 positivechondrocytes (in the lesion area or in the adjoining region) gradually decreased during the 8-weeks ofobservation (Fig. 5C, 5D, 6C, 6D). However, no signi�cant main effects were generated by load levels.
Super�cial lubricin response to cyclic loadingLubricin expression in the lateral femoral condyle AC is presented in Fig. 7. The staining intensity in thelesion area of substrates within the super�cial cartilage declined 1 week after loading compared to theintact area (Fig. 7A). However, semi-quantitative analyses showed an increased concentration of lubricin
Page 7/24
on the AC lesion over time, which reached the same level at the time points of 4 and 8 weeks incomparison to the intact area (Fig. 7B). No statistical load level effect was found, whereas main effectsof duration and interaction between observational duration and load effect were con�rmed. Furthermore,results of strati�ed analysis revealed that super�cial lubricin in 20 N loaded samples were more likely torecover (more pairwise differences) in comparison to 50 N samples (Fig. 7C, 7D). Additionally, we foundthe signs of staining aggregating around the site of degenerative chondrocytes or even the lacunae fromdead cells without hematoxylin-stained nuclei.
DiscussionThe current study demonstrated for the �rst time that a single episode of 60 cycles of mechanical stimulican induce AC lesion in the lateral femoral condyle of rat, which is consistent with the results reported insmaller rodents like mouse [5–6]. The scope and localization of the lesion area were relatively steady inboth the high and low load level groups as estimated by the chondrocyte-degenerative volume in eachsample with low cartilage structural destruction except mild �brillation in rare samples. However, thehistological scores deteriorated over time due to the Safranin O staining loss and diffused hypocellularityin the affected area [15]. ADAMTS-5, which is reportedly the primary catalyst for aggrecan degradation[16], was found to be overexpressed immediately after AC injury in the current study (Fig. 5). However, theSafranin O stained substances continued to degrade whereas the ADAMTS-5 expression dropped tonormal levels after 4 weeks. Furthermore, the affected chondrocytes in the direct contact area did notdemonstrate a positive response (Fig. 5). Studies on cell signaling have considered that overloading willactivate the toll-like receptors expressed on chondrocytes, resulting in the release of proteinases andin�ammatory cytokines [17]. However, our results showed that color fading only occurred in the centralregion of cell death but not in the adjoining positive cells area. These results suggested that theaggrecanase of ADAMTS-5 might combine with other factors to augment proteoglycan degradation. Weassumed that the integrity of �brillar collagen networks or chondrocyte vitality may also play importantroles in the maintenance of aggrecan homeostasis, which needs to be investigated in the future.Moreover, there was a distinct difference of staining between AC above and below the tidemark (Fig. 3A),which were consistent with the in vitro results that calci�ed radial zones of cartilage suffered less than5% of the total mechanical stress [18–19].
The PTOA models of ACLT and DMM, which induced instability of the entire joint or de�ection of loadbearing towards medial or lateral tibial compartment, were widely used in rodents for short-term studies.The histological characteristics were de�ned as gradually developing chondrocyte apoptosis andcartilage matrix loss [20]. However, we did not �nd any apoptotic cell around the lesion area even at veryearly observation of 6 h after loading (data not shown), which was considerably different from theprevious results in mouse that illustrated that clustered active chondrocytes by TUNEL staining wereretained in degenerative AC until 14 days after loading [6]. Our results of live/dead staining demonstratedthat chondrocytes in the super�cial lesion cartilage were dead within 6 h by direct damage (Fig. 2). In thisstudy, we set up the loading routine based on the weight ratio between rat and mouse as indicated inprevious studies, which may have led to results slightly different from the previous study. We quanti�ed
Page 8/24
the size of the lesion area and found that the volume containing degenerative chondrocytes had notchanged much between each time point for both groups. However, the decreased Safranin O stainingarea enlarged over time that indicated the gradual depletion of glycosaminoglycans in the chondrocytedeath region after loading. On the other hand, the AC shape destruction did not progress as rapidly as theinvasive models, which illustrated jagged cartilage surface and subchondral bone perforation within 4weeks after instability surgery [21–22]. According to our investigation, this non-surgical model may bebetter for the simulation of acute extensive AC damage, which is more common in the �eld of sportinjuries.
Expression of Col2 was found to be transiently increased within 1 h after ex vivo mechanical loading inseveral experiments using extracted cartilage explants [23–24]. In the tissue engineering �eld, a recentlypublished review [25] summarized biochemical anabolism of synthetic substrate-seeded chondrocytessubjected to in vitro dynamic loading, most of which demonstrated subsequent results of Col2upregulation in response to varied loading regimens. Ragan PM [23] reported transient upregulation oftype-II collagen within 4 h in extracted bovine cartilage explants subjected to static mechanicalcompression, but did not check the chondrocytes survival rate. The current study, to our knowledge, is a�rst report of focal enhanced staining of type II collagen on lesion cartilage which has undergone in vivocyclic loading, even with the complete death of the affected surface chondrocytes within 6 h. A previousstudy reported decreased Safranin O and Col2 staining in an osteochondral defect model [26], which wasdirectly created on the AC surface using a 1-mm biopsy punch. However, our model illustrateddiametrically opposite Type II collagen response to cyclic loading. Although one of the majorcollagenases, MMP-13 overexpressed immediately after loading injury (Fig. 6), the morphologicaldegradation of AC did not progress extensively as in regular OA development. Further studies shouldfocus on whether type II collagen proliferation is bene�cial or harmful to AC protection.
The lubricin localized in the cartilage surface is reportedly a protective and lubricating component of theO-linked glycoprotein [27]. We found that super�cial lubricin staining in the damaged area decreaseddrastically immediately after cyclic loading in comparison with the non-loaded region (Fig. 7). Adecreased super�cial cartilage lubricin/proteoglycan 4 level was con�rmed in both in vivo [28] and exvivo [29] experiments. Several studies have reported increased coe�cient of friction within few hours ofcyclic loading [30–31], and also that lubricin in the cartilage surface was denuded by loading, even in thejoint where most chondrocytes remained alive throughout the observation period [31]. Our study revealedsimilar results in a non-surgical model at early observation after in vivo cyclic compression, whereas theresults of immunohistochemistry illustrated that cartilage surface lubricin staining diminished only in thelesion area where cell death occurred. Further studies should provide more quantitative data and exploreif super�cial lubricin depleted independently of the factor of cell death. On the other hand, in theexperimental sheep [32–33] and horse [34–35] models, lubricin concentration in the synovial �uid wasupregulated transiently at the acute phase after injury, and synovial PRG4 (The gene encodes Lubricin)expression presented positive correlation with TNFα and ADAMTS-5 [35]. Our results similarly illustratedthat cleavage products of MMP-13 and ADAMTS-5 mounted dramatically within 1 week after trauma anddropped to the basal level gradually (Fig. 5, 6). Further investigations should also focus on synovium
Page 9/24
response and check if in vivo cyclic loading will promote or inhibit the synovial cell secretion of intra-articular lubricin.
Meanwhile, after tracking different time points within 8 weeks, we found that super�cial cartilage stainingwith lubricin gradually recovered to the normal level (Fig. 8). The results after 4 weeks indicated adifferent direction of OA progression compared to those with joint instability-induced OA. Although,lubricin expression on cartilage was found elevated in late-stage OA patients [36], the mainstream resultson the posttraumatic OA of human [37] and animal joint instability models [28, 38–40] in a long-termobservation demonstrated that the joint lubricin concentration decreased after injury or surgery.Combining the results of decreased Prg4 expression in unstable joint after forced movement [41–42] withour results, we hypothesized that the instability-induced persistent incentives should play a moreimportant role than the magnitude of loading in determining irreversible lubricin loss. Several studies [39,43–44] where exogenous recombinant lubricin was delivered to medial meniscectomized rats found thatthe cartilage surface protein was prevented from depletion in the experimental group. In the current study,we found a self-healing process in the loading-damaged AC without any lubricin supplementation, whichindicates that endogenous lubricin is an important repair mechanism in the post-traumatic knee andprovides a plausible explanation that the cartilage degradation progression of non-invasive loadingmodel was slower than joint instability surgery models. Interestingly, although super�cial cell death wascon�rmed completely within 6 h after loading, the locations of cartilage lacunae were strongly stainedwith lubricin even at 8 weeks after injury. Previous studies found chondrocytes encapsulated in agarose[19, 45] and cartilage explants [46] expressed higher prg4 gene subject to compressive strain, and theintensi�ed lacunae staining around cells were con�rmed in the immuno�uorescence images [19], which issimilar to our results. Further studies should focus on potential links between chondrocyte-derivedlubricin and the mechanism of super�cial cartilage repairment.
The current study has some limitations. First, it focused on investigating the mid-term changes over timefrom 3 days to 8 weeks after loading implementation. Since cell death, type II collagen biosynthesis andsuper�cial lubricin degradation happened earlier than our expectation, further studies should moreprecisely design the unit of observation intervals in hours to disclose the full process of dynamic loading-induced cellular reaction. Second, we did not examine the synovial changes in response to loading. As wedescribed above, upregulated in�ammatory cytokines and PRG4 expression were found in multipleresearches, which possibly induced the changes of microenvironment in the joint cavity, and weakenedthe signi�cance of the antigen detection results in the AC. For instance, the results like the increase ofcartilage surface-adhesive protective proteins like lubricin could be confused by the higher secretion oflubricin in synovial �uid after injury, which gives rise to the question whether lubricin recovery couldascribe to self-healing capabilities or is simply due to high concentration of lubricin in the environment.Study in the future should evaluate the synovium using quantitative techniques to eliminate internalinterference factors. Third, in the current study, we only assessed the cartilage lesion on lateral femurcondyle. The cartilage damage on the other contact surface of lateral tibia should be examined in thefuture. Last, we failed to compare the current model to any surgery-induced model. As we describedabove, the surface lubricin reportedly diminished in many injury-induced OA animals [28, 38–40], whereas
Page 10/24
it is still unknown if the factor of joint instability independently affected the progression of post-traumaticOA, especially in the lesion area. Further studies should combine invasive destabilization surgery to pre-existing lesion caused by cyclic compression, which could re�ect the spatiotemporal changes of cartilagein the non-contact area.
In conclusion, we found a speci�c-localized AC lesion in both the 20 N and 50 N groups that underwent60 cycles of compression in rat knee joints. The size of lesion was affected by the load level and theintensity of histological staining weakened with time after loading. The local expression of type IIcollagen was raised after repeated loading whereas lubricin in the cartilage surface was lost in responseto cyclic compression. However, the distribution of super�cial lubricin recovered at 4 weeks after non-surgical injury (Fig. 8). These results indicated that dynamic loading exceeding 20 N could damage thelateral femoral condyle AC in rat. Although the damage caused localized chondrocyte deaths andupregulated expression of degrading enzymes, endogenous repairments in well-structured joint worked byrebuilding the layer of protective proteins on the super�cial cartilage.
List Of AbbreviationsAC: Articular cartilage
PTOA: Post-traumatic osteoarthritis
ACLT: Anterior cruciate ligament transection
DMM: Destabilization of medial meniscus
MMP-13: Matrix metalloproteinase thirteen
ADAMTS-5: A disintegrin and metalloproteinase with thrombospondin motifs �ve
DeclarationsEthics approval and consent to participate
All experimental procedures were approved by the animal research committee of Kyoto University(approval number: Med kyo 17616).
Consent for publication
Not applicable.
Availability of data and materials
All data generated or analysed during this study are included in this published article and itssupplementary information �les.

Page 11/24
Competing interests
The authors declare no competing interests.
Funding
This study was supported in part by a JSPS KAKENHI Grant, number JP18H03129 and JP18K19739.
Acknowledgments
None
Author Contributions
XJ: conception and design of the study, acquisition, analysis, and interpretation of data, drafting of thearticle, revision of the article, �nal approval of the article.
AI: conception and design of the study, interpretation of data, drafting of the article, revision of the article,�nal approval of the article.
AN: conception and design of the study, interpretation of data, revision of the article, �nal approval of thearticle.
KN: conception and design of the study, interpretation of data, revision of the article, �nal approval of thearticle.
HK: obtaining of funding, conception and design of the study, interpretation of data, revision of the article,�nal approval of the article.
TA: conception and design of the study, interpretation of data, revision of the article, �nal approval of thearticle.
References1. Kuyinu EL, Narayanan G, Nair LS, Laurencin CT. Animal models of osteoarthritis: classi�cation,
update, and measurement of outcomes. J Orthop Surg Res 2016; 11: 19.
2. De Souza RL, Matsuura M, Eckstein F, Rawlinson SC, Lanyon LE, Pitsillides AA. Non-invasive axialloading of mouse tibiae increases cortical bone formation and modi�es trabecular organization: anew model to study cortical and cancellous compartments in a single loaded element. Bone 2005;37: 810-818.
3. Holguin N, Brodt MD, Sanchez ME, Kotiya AA, Silva MJ. Adaptation of tibial structure and strength toaxial compression depends on loading history in both C57BL/6 and BALB/c mice. Calcif Tissue Int2013; 93: 211-221.

Page 12/24
4. Lynch ME, Main RP, Xu Q, Walsh DJ, Scha�er MB, Wright TM, et al. Cancellous bone adaptation totibial compression is not sex dependent in growing mice. J Appl Physiol (1985) 2010; 109: 685-691.
5. Poulet B, Hamilton RW, Shefelbine S, Pitsillides AA. Characterizing a novel and adjustablenoninvasive murine joint loading model. Arthritis Rheum 2011; 63: 137-147.
�. Wu P, Holguin N, Silva MJ, Fu M, Liao W, Sandell LJ. Early response of mouse joint tissue tononinvasive knee injury suggests treatment targets. Arthritis Rheumatol 2014; 66: 1256-1265.
7. Lockwood KA, Chu BT, Anderson MJ, Haudenschild DR, Christiansen BA. Comparison of loading rate-dependent injury modes in a murine model of post-traumatic osteoarthritis. J Orthop Res 2014; 32:79-88.
�. Ko FC, Dragomir C, Plumb DA, Goldring SR, Wright TM, Goldring MB, et al. In vivo cyclic compressioncauses cartilage degeneration and subchondral bone changes in mouse tibiae. Arthritis Rheum 2013;65: 1569-1578.
9. Poulet B, de Souza R, Kent AV, Saxon L, Barker O, Wilson A, et al. Intermittent applied mechanicalloading induces subchondral bone thickening that may be intensi�ed locally by contiguous articularcartilage lesions. Osteoarthritis Cartilage 2015; 23: 940-948.
10. Onur TS, Wu R, Chu S, Chang W, Kim HT, Dang AB. Joint instability and cartilage compression in amouse model of posttraumatic osteoarthritis. J Orthop Res 2014; 32: 318-323.
11. Ko FC, Dragomir CL, Plumb DA, Hsia AW, Adebayo OO, Goldring SR, et al. Progressive cell-mediatedchanges in articular cartilage and bone in mice are initiated by a single session of controlled cycliccompressive loading. J Orthop Res 2016; 34: 1941-1949.
12. Adebayo OO, Ko FC, Wan PT, Goldring SR, Goldring MB, Wright TM, et al. Role of subchondral boneproperties and changes in development of load-induced osteoarthritis in mice. OsteoarthritisCartilage 2017; 25: 2108-2118.
13. McErlain DD, Appleton CT, Litch�eld RB, Pitelka V, Henry JL, Bernier SM, et al. Study of subchondralbone adaptations in a rodent surgical model of OA using in vivo micro-computed tomography.Osteoarthritis Cartilage 2008; 16: 458-469.
14. Iijima H, Aoyama T, Ito A, Tajino J, Nagai M, Zhang X, et al. Destabilization of the medial meniscusleads to subchondral bone defects and site-speci�c cartilage degeneration in an experimental ratmodel. Osteoarthritis Cartilage 2014; 22: 1036-1043.
15. Bomsta BD, Bridgewater LC, Seegmiller RE. Premature osteoarthritis in the Disproportionatemicromelia (Dmm) mouse. Osteoarthritis Cartilage 2006; 14: 477-485.
1�. Glasson SS, Askew R, Sheppard B, Carito B, Blanchet T, Ma HL, et al. Deletion of active ADAMTS5prevents cartilage degradation in a murine model of osteoarthritis. Nature 2005; 434: 644-648.
17. Jorgensen AEM, Kjaer M, Heinemeier KM. The Effect of Aging and Mechanical Loading on theMetabolism of Articular Cartilage. J Rheumatol 2017; 44: 410-417.
1�. Wong M, Carter DR. Articular cartilage functional histomorphology and mechanobiology: a researchperspective. Bone 2003; 33: 1-13.
Page 13/24
19. Jeon JE, Schrobback K, Hutmacher DW, Klein TJ. Dynamic compression improves biosynthesis ofhuman zonal chondrocytes from osteoarthritis patients. Osteoarthritis Cartilage 2012; 20: 906-915.
20. Iijima H, Aoyama T, Ito A, Yamaguchi S, Nagai M, Tajino J, et al. Effects of short-term gentle treadmillwalking on subchondral bone in a rat model of instability-induced osteoarthritis. OsteoarthritisCartilage 2015; 23: 1563-1574.
21. Hayami T, Pickarski M, Wesolowski GA, McLane J, Bone A, Destefano J, et al. The role ofsubchondral bone remodeling in osteoarthritis: reduction of cartilage degeneration and prevention ofosteophyte formation by alendronate in the rat anterior cruciate ligament transection model. ArthritisRheum 2004; 50: 1193-1206.
22. Iijima H, Aoyama T, Tajino J, Ito A, Nagai M, Yamaguchi S, et al. Subchondral plate porositycolocalizes with the point of mechanical load during ambulation in a rat knee model of post-traumatic osteoarthritis. Osteoarthritis Cartilage 2016; 24: 354-363.
23. Ragan PM, Badger AM, Cook M, Chin VI, Gowen M, Grodzinsky AJ, et al. Down-regulation ofchondrocyte aggrecan and type-II collagen gene expression correlates with increases in staticcompression magnitude and duration. J Orthop Res 1999; 17: 836-842.
24. Fitzgerald JB, Jin M, Dean D, Wood DJ, Zheng MH, Grodzinsky AJ. Mechanical compression ofcartilage explants induces multiple time-dependent gene expression patterns and involvesintracellular calcium and cyclic AMP. J Biol Chem 2004; 279: 19502-19511.
25. Anderson DE, Johnstone B. Dynamic Mechanical Compression of Chondrocytes for TissueEngineering: A Critical Review. Front Bioeng Biotechnol 2017; 5: 76.
2�. Yamaguchi S, Aoyama T, Ito A, Nagai M, Iijima H, Tajino J, et al. The Effect of Exercise on the EarlyStages of Mesenchymal Stromal Cell-Induced Cartilage Repair in a Rat Osteochondral Defect Model.PLoS One 2016; 11: e0151580.
27. Coles JM, Zhang L, Blum JJ, Warman ML, Jay GD, Guilak F, et al. Loss of cartilage structure,stiffness, and frictional properties in mice lacking PRG4. Arthritis Rheum 2010; 62: 1666-1674.
2�. Elsaid KA, Machan JT, Waller K, Fleming BC, Jay GD. The impact of anterior cruciate ligament injuryon lubricin metabolism and the effect of inhibiting tumor necrosis factor alpha on chondroprotectionin an animal model. Arthritis Rheum 2009; 60: 2997-3006.
29. Jones AR, Chen S, Chai DH, Stevens AL, Gleghorn JP, Bonassar LJ, et al. Modulation of lubricinbiosynthesis and tissue surface properties following cartilage mechanical injury. Arthritis Rheum2009; 60: 133-142.
30. McCann L, Ingham E, Jin Z, Fisher J. In�uence of the meniscus on friction and degradation ofcartilage in the natural knee joint. Osteoarthritis Cartilage 2009; 17: 995-1000.
31. Drewniak EI, Jay GD, Fleming BC, Zhang L, Warman ML, Crisco JJ. Cyclic loading increases frictionand changes cartilage surface integrity in lubricin-mutant mouse knees. Arthritis Rheum 2012; 64:465-473.
32. Barton KI, Ludwig TE, Achari Y, Shrive NG, Frank CB, Schmidt TA. Characterization of proteoglycan 4and hyaluronan composition and lubrication function of ovine synovial �uid following knee surgery.
Page 14/24
J Orthop Res 2013; 31: 1549-1554.
33. Atarod M, Ludwig TE, Frank CB, Schmidt TA, Shrive NG. Cartilage boundary lubrication of ovinesynovial �uid following anterior cruciate ligament transection: a longitudinal study. OsteoarthritisCartilage 2015; 23: 640-647.
34. Antonacci JM, Schmidt TA, Serventi LA, Cai MZ, Shu YL, Schumacher BL, et al. Effects of equine jointinjury on boundary lubrication of articular cartilage by synovial �uid: role of hyaluronan. ArthritisRheum 2012; 64: 2917-2926.
35. Reesink HL, Watts AE, Mohammed HO, Jay GD, Nixon AJ. Lubricin/proteoglycan 4 increases in bothexperimental and naturally occurring equine osteoarthritis. Osteoarthritis Cartilage 2017; 25: 128-137.
3�. Neu CP, Reddi AH, Komvopoulos K, Schmid TM, Di Cesare PE. Increased friction coe�cient andsuper�cial zone protein expression in patients with advanced osteoarthritis. Arthritis Rheum 2010;62: 2680-2687.
37. Elsaid KA, Fleming BC, Oksendahl HL, Machan JT, Fadale PD, Hulstyn MJ, et al. Decreased lubricinconcentrations and markers of joint in�ammation in the synovial �uid of patients with anteriorcruciate ligament injury. Arthritis Rheum 2008; 58: 1707-1715.
3�. Wei L, Fleming BC, Sun X, Teeple E, Wu W, Jay GD, et al. Comparison of differential biomarkers ofosteoarthritis with and without posttraumatic injury in the Hartley guinea pig model. J Orthop Res2010; 28: 900-906.
39. Flannery CR, Zollner R, Corcoran C, Jones AR, Root A, Rivera-Bermudez MA, et al. Prevention ofcartilage degeneration in a rat model of osteoarthritis by intraarticular treatment with recombinantlubricin. Arthritis Rheum 2009; 60: 840-847.
40. Young AA, McLennan S, Smith MM, Smith SM, Cake MA, Read RA, et al. Proteoglycan 4downregulation in a sheep meniscectomy model of early osteoarthritis. Arthritis Res Ther 2006; 8:R41.
41. Elsaid KA, Zhang L, Waller K, Tofte J, Teeple E, Fleming BC, et al. The impact of forced joint exerciseon lubricin biosynthesis from articular cartilage following ACL transection and intra-articularlubricin's effect in exercised joints following ACL transection. Osteoarthritis Cartilage 2012; 20: 940-948.
42. Teeple E, Jay GD, Elsaid KA, Fleming BC. Animal models of osteoarthritis: challenges of modelselection and analysis. Aaps j 2013; 15: 438-446.
43. Vugmeyster Y, Wang Q, Xu X, Harrold J, Daugusta D, Li J, et al. Disposition of human recombinantlubricin in naive rats and in a rat model of post-traumatic arthritis after intra-articular or intravenousadministration. Aaps j 2012; 14: 97-104.
44. Jay GD, Fleming BC, Watkins BA, McHugh KA, Anderson SC, Zhang LX, et al. Prevention of cartilagedegeneration and restoration of chondroprotection by lubricin tribosupplementation in the ratfollowing anterior cruciate ligament transection. Arthritis Rheum 2010; 62: 2382-2391.
Page 15/24
45. Nugent GE, Aneloski NM, Schmidt TA, Schumacher BL, Voegtline MS, Sah RL. Dynamic shearstimulation of bovine cartilage biosynthesis of proteoglycan 4. Arthritis Rheum 2006; 54: 1888-1896.
4�. Schatti OR, Markova M, Torzilli PA, Gallo LM. Mechanical Loading of Cartilage Explants withCompression and Sliding Motion Modulates Gene Expression of Lubricin and Catabolic Enzymes.Cartilage 2015; 6: 185-193.
Figures
Page 16/24
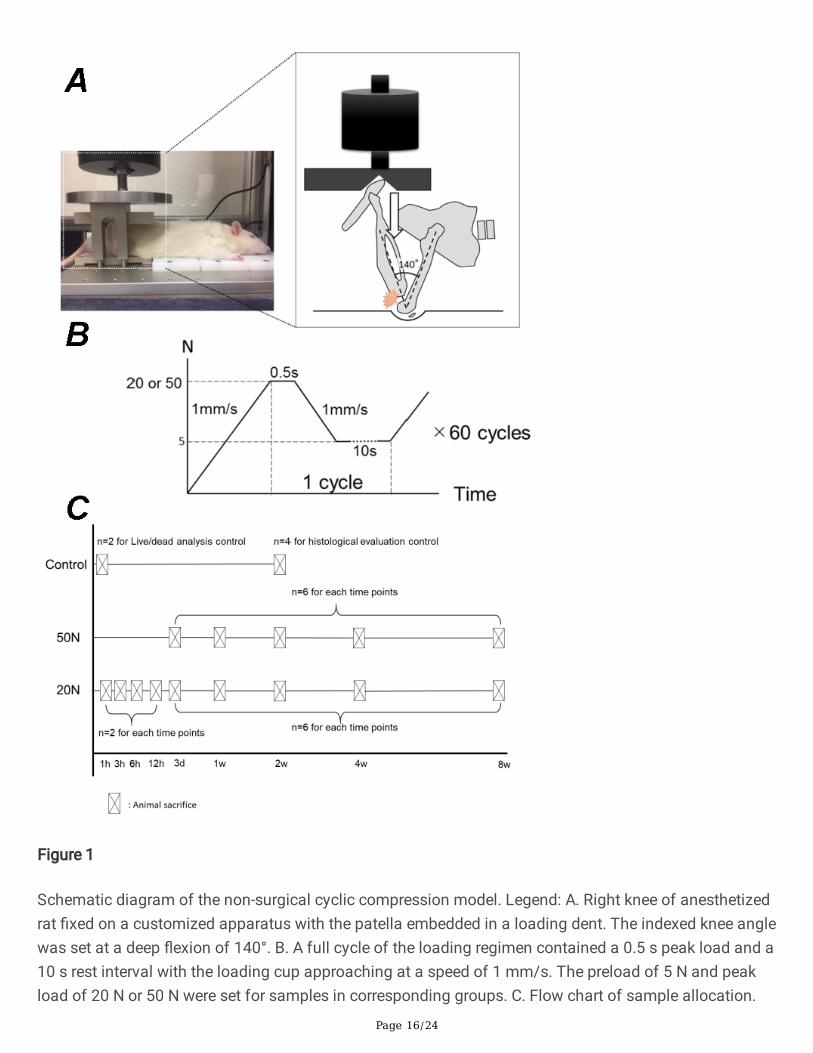
Figure 1
Schematic diagram of the non-surgical cyclic compression model. Legend: A. Right knee of anesthetizedrat �xed on a customized apparatus with the patella embedded in a loading dent. The indexed knee anglewas set at a deep �exion of 140°. B. A full cycle of the loading regimen contained a 0.5 s peak load and a10 s rest interval with the loading cup approaching at a speed of 1 mm/s. The preload of 5 N and peakload of 20 N or 50 N were set for samples in corresponding groups. C. Flow chart of sample allocation.
Page 17/24
Figure 2
Chondrocyte vitality in super�cial cartilage after 20 N compressive loading detection by calcein AM/ethd-1 staining. Legend: Representative �uorescent images demonstrate spatiotemporal cell death from 1 to12 h after loading. Green and red channels illustrate the distribution of live and dead chondrocytesseparately. A well-de�ned focal region without green-stained cells was observed at the time points of 6and 12 h. Pre-loaded normal rats’ limbs were used as control. Scale bar: 100 μm.
Page 18/24
Figure 3
Effects of dynamic compression on articular cartilage in the lateral compartment of femoral condyle.Legends: A. Representative sections of Safranin O staining on the lesion area. The boundary betweencartilage, above and below the tidemark, were clearly observed 2, 4 and 8 weeks after loading. Blackarrows indicate a clear line between calci�ed cartilage and upper cartilage. B. Average modi�ed Mankinscore of 12 sagittal sections for every 100 μm intervals, which contained entire lesion areas. Larger
Page 19/24
numbers indicate higher degree of cartilage degeneration. C. Volume of cartilage lesion with degenerativechondrocytes. Areas were depicted on 200 × fold sections using ImageJ software. D. Relative intensity ofSafranin O staining in the lesion area, presented in percentage by dividing the intensity in intact area.Methodological details of C&D are described in Supplementary �gure 2. E. Hematoxylin-stainedchondrocytes in lesion cartilage. The numbers were normalized by dividing the surface length (mm) ofcartilage. F,G. Comparison between Control (n=4) and Loaded (n=60) samples using Mann-Whitney Utests. Error bars represent standard deviation; Signi�cant results (p<0.05) of two-way ANOVA analyses arepresented above each chart; †: main effect of load, ‡: main effect of duration; Marginal means of eachobservational point were compared when ‡ was found. *p<0.05, **p<0.01; No symbol: not signi�cant;Scale bar: 200 μm.
Figure 4
Changes in Type collagen expression in articular cartilage substrates after cyclic loading. Legends: A.Representative immunostained sections for type collagen in the lesion areas of lateral condyle cartilage.The border of normal and degenerative cartilage is represented by a dashed, light-grey line. B. Differencesof Type collagen expression in Control and Loaded samples. C. Average intensity of staining on thedegenerative cartilage matrix was calculated on 8-bit grey scale images using ImageJ software. D.
Page 20/24
Percentage variation of intensity in the lesion area relative to the intact area on the same section. Therelative intensity was calculated in an inverted 8-bit grey scale image by dividing the intensity in the intactarea. Error bars represent standard deviation; No signi�cant effect or interaction between time points orload levels; **p<0.01; No symbol: not signi�cant; Scale bar: 100 μm.
Figure 5
Page 21/24
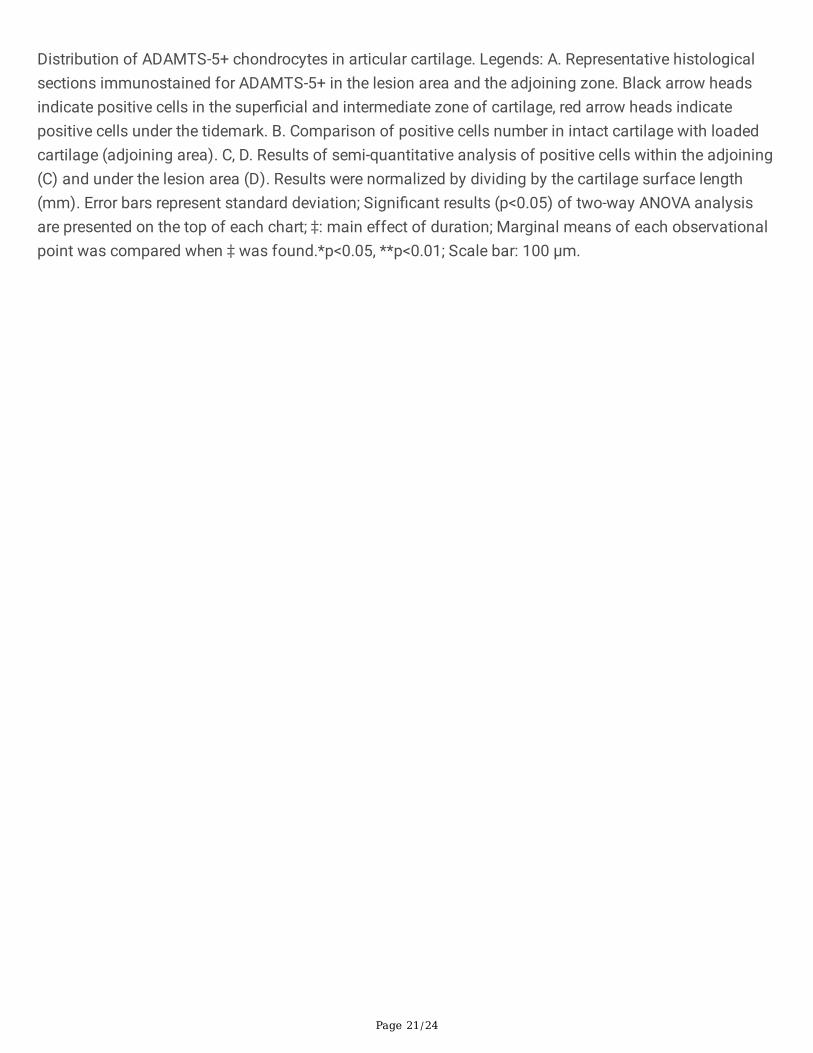
Distribution of ADAMTS-5+ chondrocytes in articular cartilage. Legends: A. Representative histologicalsections immunostained for ADAMTS-5+ in the lesion area and the adjoining zone. Black arrow headsindicate positive cells in the super�cial and intermediate zone of cartilage, red arrow heads indicatepositive cells under the tidemark. B. Comparison of positive cells number in intact cartilage with loadedcartilage (adjoining area). C, D. Results of semi-quantitative analysis of positive cells within the adjoining(C) and under the lesion area (D). Results were normalized by dividing by the cartilage surface length(mm). Error bars represent standard deviation; Signi�cant results (p<0.05) of two-way ANOVA analysisare presented on the top of each chart; ‡: main effect of duration; Marginal means of each observationalpoint was compared when ‡ was found.*p<0.05, **p<0.01; Scale bar: 100 μm.
Page 22/24
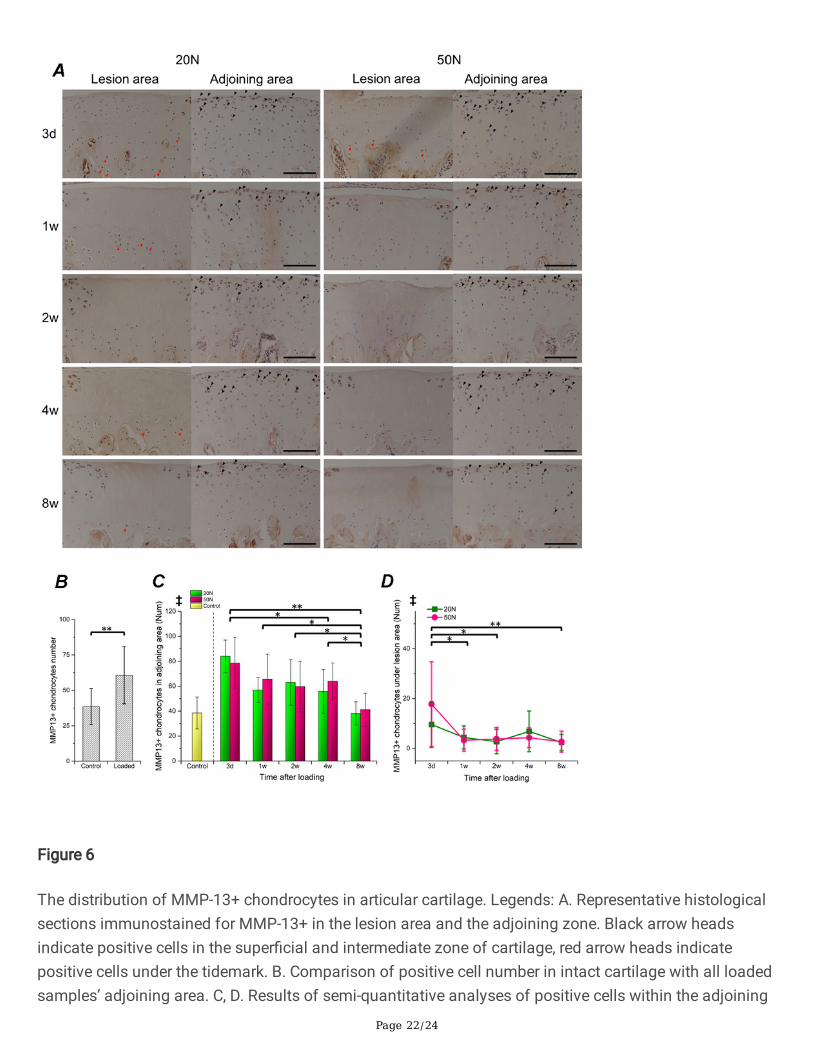
Figure 6
The distribution of MMP-13+ chondrocytes in articular cartilage. Legends: A. Representative histologicalsections immunostained for MMP-13+ in the lesion area and the adjoining zone. Black arrow headsindicate positive cells in the super�cial and intermediate zone of cartilage, red arrow heads indicatepositive cells under the tidemark. B. Comparison of positive cell number in intact cartilage with all loadedsamples’ adjoining area. C, D. Results of semi-quantitative analyses of positive cells within the adjoining
Page 23/24
(C) and under the lesion area (D). Results were normalized by dividing by the cartilage surface length(mm). Error bars represent standard deviation; The signi�cant results (p<0.05) of ANOVA analysis ‡: maineffect of duration was presented on the top of each chart. Marginal means of each observational pointwas compared when ‡ was found.*p<0.05, **p<0.01; Scale bar: 100 μm.
Figure 7
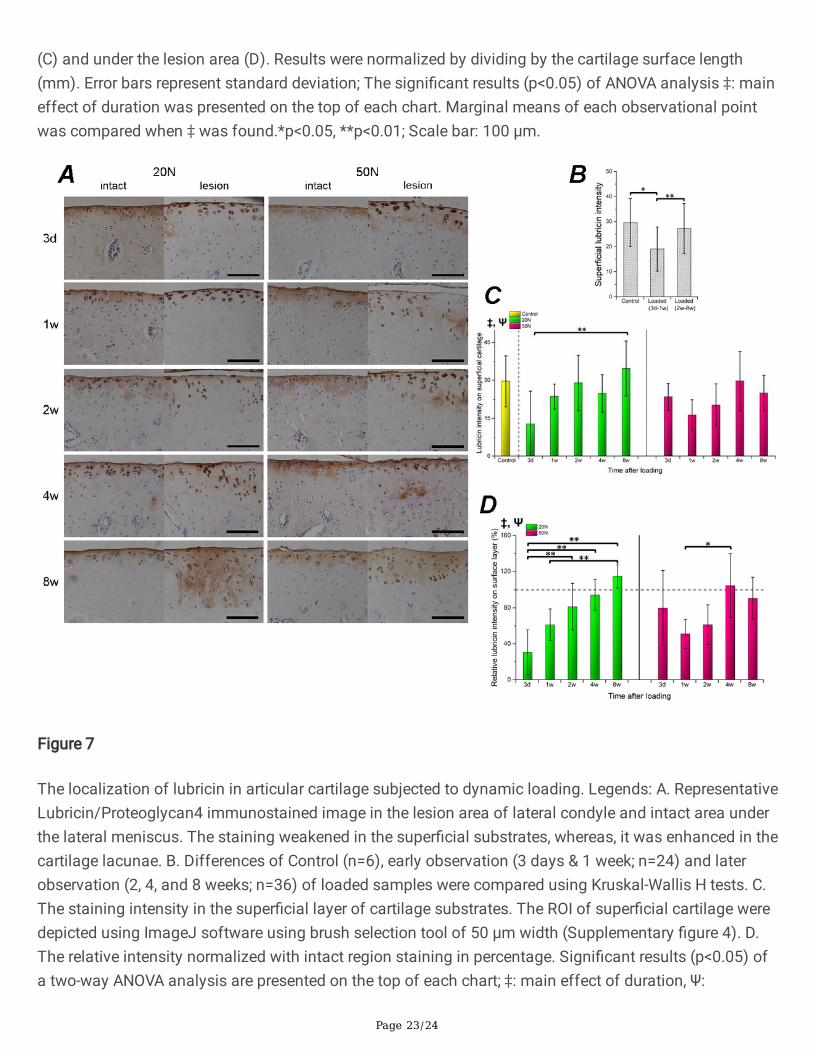
The localization of lubricin in articular cartilage subjected to dynamic loading. Legends: A. RepresentativeLubricin/Proteoglycan4 immunostained image in the lesion area of lateral condyle and intact area underthe lateral meniscus. The staining weakened in the super�cial substrates, whereas, it was enhanced in thecartilage lacunae. B. Differences of Control (n=6), early observation (3 days & 1 week; n=24) and laterobservation (2, 4, and 8 weeks; n=36) of loaded samples were compared using Kruskal-Wallis H tests. C.The staining intensity in the super�cial layer of cartilage substrates. The ROI of super�cial cartilage weredepicted using ImageJ software using brush selection tool of 50 μm width (Supplementary �gure 4). D.The relative intensity normalized with intact region staining in percentage. Signi�cant results (p<0.05) ofa two-way ANOVA analysis are presented on the top of each chart; ‡: main effect of duration, Ψ:
Page 24/24
interaction effects; Strati�ed one-way ANOVA on each load level with multiple comparison were appliedwhenever Ψ was found. *p<0.05, **p<0.01; No symbol: not signi�cant; Scale bar: 100 μm.
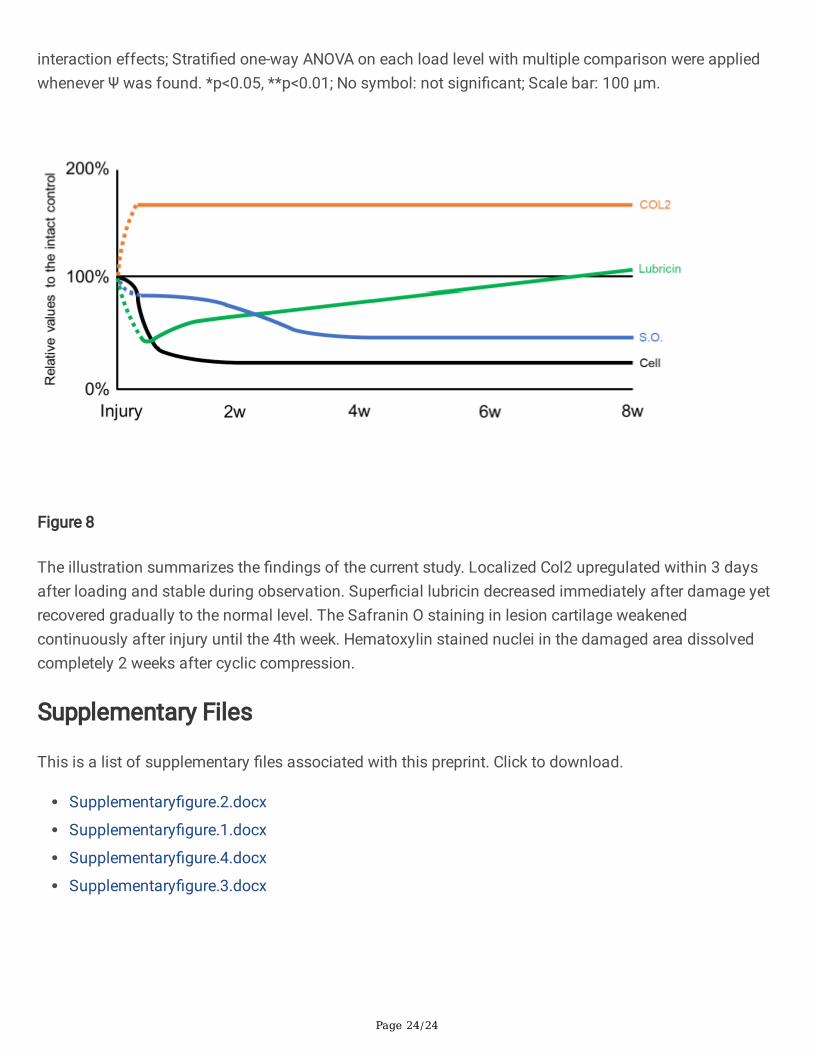
Figure 8
The illustration summarizes the �ndings of the current study. Localized Col2 upregulated within 3 daysafter loading and stable during observation. Super�cial lubricin decreased immediately after damage yetrecovered gradually to the normal level. The Safranin O staining in lesion cartilage weakenedcontinuously after injury until the 4th week. Hematoxylin stained nuclei in the damaged area dissolvedcompletely 2 weeks after cyclic compression.
Supplementary Files
This is a list of supplementary �les associated with this preprint. Click to download.
Supplementary�gure.2.docx
Supplementary�gure.1.docx
Supplementary�gure.4.docx
Supplementary�gure.3.docx