LSL New Build Index September 2015
4
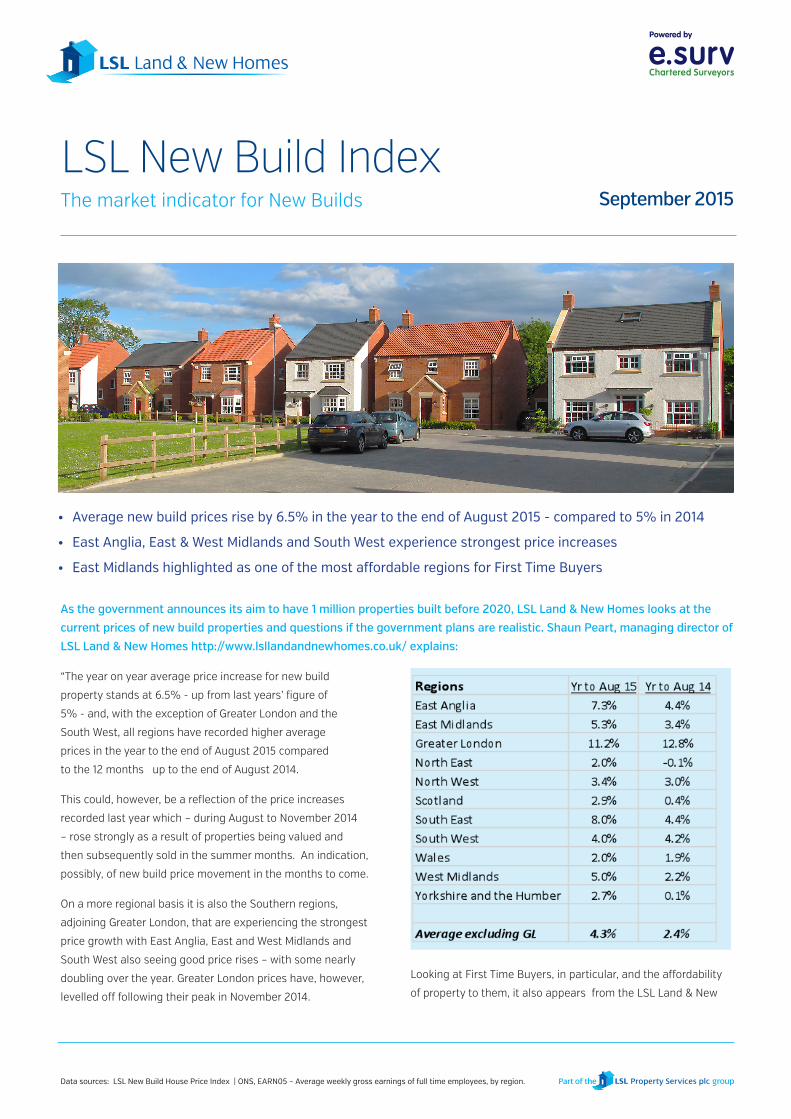
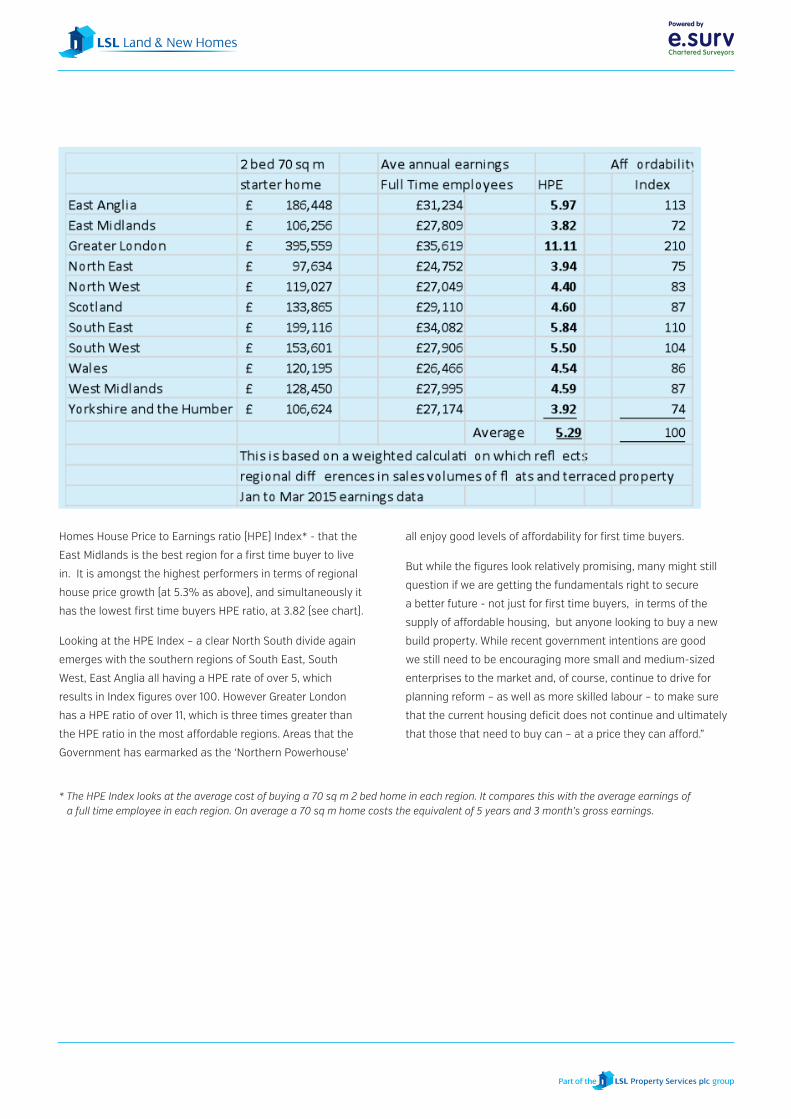
As the government announces its aim to have 1 million properties built before 2020, LSL Land & New Homes looks at the current prices of new build properties and questions if the government plans are realistic. Shaun Peart, managing director of LSL Land & New Homes http://www.lsllandandnewhomes.co.uk/ explains: “The year on year average price increase for new build property stands at 6.5% - up from last years’ figure of 5% - and, with the exception of Greater London and the South West, all regions have recorded higher average prices in the year to the end of August 2015 compared to the 12 months up to the end of August 2014. This could, however, be a reflection of the price increases recorded last year which – during August to November 2014 – rose strongly as a result of properties being valued and then subsequently sold in the summer months. An indication, possibly, of new build price movement in the months to come. On a more regional basis it is also the Southern regions, adjoining Greater London, that are experiencing the strongest price growth with East Anglia, East and West Midlands and South West also seeing good price rises – with some nearly doubling over the year. Greater London prices have, however, levelled off following their peak in November 2014. Looking at First Time Buyers, in particular, and the affordability of property to them, it also appears from the LSL Land & New Powered by Data sources: LSL New Build House Price Index | ONS, EARN05 – Average weekly gross earnings of full time employees, by region. LSL New Build Index The market indicator for New Builds September 2015 • Average new build prices rise by 6.5% in the year to the end of August 2015 - compared to 5% in 2014 • East Anglia, East & West Midlands and South West experience strongest price increases • East Midlands highlighted as one of the most affordable regions for First Time Buyers
-
Upload
lsl-land-new-homes -
Category
Documents
-
view
218 -
download
0
description
As the government announces its aim to have 1 million properties built before 2020, LSL Land & New Homes looks at the current prices of new build properties and questions if the government plans are realistic.
Transcript of LSL New Build Index September 2015
As the government announces its aim to have 1 million properties built before 2020, LSL Land & New Homes looks at the
current prices of new build properties and questions if the government plans are realistic. Shaun Peart, managing director of
LSL Land & New Homes http://www.lsllandandnewhomes.co.uk/ explains:
“The year on year average price increase for new build
property stands at 6.5% - up from last years’ figure of
5% - and, with the exception of Greater London and the
South West, all regions have recorded higher average
prices in the year to the end of August 2015 compared
to the 12 months up to the end of August 2014.
This could, however, be a reflection of the price increases
recorded last year which – during August to November 2014
– rose strongly as a result of properties being valued and
then subsequently sold in the summer months. An indication,
possibly, of new build price movement in the months to come.
On a more regional basis it is also the Southern regions,
adjoining Greater London, that are experiencing the strongest
price growth with East Anglia, East and West Midlands and
South West also seeing good price rises – with some nearly
doubling over the year. Greater London prices have, however,
levelled off following their peak in November 2014.
Looking at First Time Buyers, in particular, and the affordability
of property to them, it also appears from the LSL Land & New
Powered by
Data sources: LSL New Build House Price Index | ONS, EARN05 – Average weekly gross earnings of full time employees, by region.
LSL New Build IndexThe market indicator for New Builds September 2015
• Averagenewbuildpricesriseby6.5%intheyeartotheendofAugust2015-comparedto5%in2014
• EastAnglia,East&WestMidlandsandSouthWestexperiencestrongestpriceincreases
• EastMidlandshighlightedasoneofthemostaffordableregionsforFirstTimeBuyers
Powered by
Homes House Price to Earnings ratio (HPE) Index* - that the
East Midlands is the best region for a first time buyer to live
in. It is amongst the highest performers in terms of regional
house price growth (at 5.3% as above), and simultaneously it
has the lowest first time buyers HPE ratio, at 3.82 (see chart).
Looking at the HPE Index – a clear North South divide again
emerges with the southern regions of South East, South
West, East Anglia all having a HPE rate of over 5, which
results in Index figures over 100. However Greater London
has a HPE ratio of over 11, which is three times greater than
the HPE ratio in the most affordable regions. Areas that the
Government has earmarked as the ‘Northern Powerhouse’
all enjoy good levels of affordability for first time buyers.
But while the figures look relatively promising, many might still
question if we are getting the fundamentals right to secure
a better future - not just for first time buyers, in terms of the
supply of affordable housing, but anyone looking to buy a new
build property. While recent government intentions are good
we still need to be encouraging more small and medium-sized
enterprises to the market and, of course, continue to drive for
planning reform – as well as more skilled labour – to make sure
that the current housing deficit does not continue and ultimately
that those that need to buy can – at a price they can afford.”
* The HPE Index looks at the average cost of buying a 70 sq m 2 bed home in each region. It compares this with the average earnings of a full time employee in each region. On average a 70 sq m home costs the equivalent of 5 years and 3 month’s gross earnings.
Powered by
Average New Home Prices
*Size adjusted average price
PeriodSeptember2014toAugust2015and%variationoversameperiod2013/14.
SCOTLAND £ AVERAGE %+/-
£257,133 2.0% ↑
£137,168 2.3% ↑
£165,606 3.3% ↑
£187,912 7.8% ↑
NORTH EAST £ AVERAGE %+/-
£259,407 5.3% ↑
£106,312 0.6% ↑
£153,757 -1.1% ↓
£142,627 0.1% ↑
NORTH WEST £ AVERAGE %+/-
£290,129 4.9% ↑
£127,243 1.6% ↑
£168,670 2.3% ↑
£161,502 4.6% ↑
YORKSHIRE & THE HUMBER £ AVERAGE %+/-
£268,815 4.2% ↑
£118,604 3.1% ↑
£152,693 -0.1% ↓
£150,597 3.2% ↑
WEST MIDLANDS £ AVERAGE %+/-
£311,754 3.7% ↑
£135,100 7.1% ↑
£191,964 4.2% ↑
£183,761 5.3% ↑
EAST MIDLANDS £ AVERAGE %+/-
£281,307 7.5% ↑
£108,645 5.8% ↑
£169,300 2.8% ↑
£159,596 3.8% ↑
-1.1%
WALES £ AVERAGE %+/-
£240,381 0.2% ↑
£139,333 5.8% ↑
£164,294 3.0% ↑
£162,037 2.7% ↑
EAST ANGLIA £ AVERAGE %+/-
£372,400 9.2% ↑
£199,421 5.9% ↑
£247,876 6.4% ↑
£249,877 7.9% ↑
SOUTH WEST £ AVERAGE %+/-
£342,351 4.1% ↑
£168,132 4.9% ↑
£216,063 3.5% ↑
£210,328 3.6% ↑
GREATER LONDON £ AVERAGE %+/-
£664,680 11.1% ↑
£391,628 11.7% ↑
£450,856 5.6% ↑
£462,511 5.5% ↑
SOUTH EAST £ AVERAGE %+/-
£466,667 8.4% ↑
£203,936 7.9% ↑
£301,623 9.6% ↑
£279,464 6.9% ↑
Detached
Flats
Semis
Terrace
11.7%
LARGEST % DECREASENORTH EAST
GREATER LONDONLARGEST % INCREASE
Powered by
This Index has been prepared by e.surv using anonymised data
based on a proportion of all new build valuations provided for lending
purposes. Figures represent 12 month rolling averages for each
period. The copyright and all other intellectual property rights in the
Index belong to e.surv. Reproduction in whole or part is not permitted
unless an acknowledgement to e.surv as the source is included. No
modification is permitted without e.surv’s prior written consent.
Whilst care is taken in the compilation of the Index no representation
or assurances are made as to its accuracy or completeness. e.surv
reserves the right to vary the methodology and to edit or discontinue
the Index in whole or in part at anytime.
e.surv (www.esurv.co.uk) is the Valuation business of LSL Property
Services plc (www.lslps.co.uk) and is the UK’s largest residential
valuation practice, acting for lenders, developers, Social Housing
organisations and other stakeholders in the residential property
market.
The business employs circa 450 chartered surveyors and covers the
entire UK.
LSL Land & New Homes is a trading style for members of the LSL
Property Services Group Estate Agency Division, one of the leading
residential property services groups in the UK. It’s strategy is to create
partnerships with developers and builders to support their objectives
and add value to their businesses.
It can provide integrated solutions for their benefit drawing on the
expertise of companies who are also under the LSL Group umbrella
including valuation services (e.surv), rental portfolio services, asset
management services and estate agency services fronted by well-
known high street estate agency brands like Your Move and Reeds
Rains. Services can be tailored to suite individual needs from bespoke
site sales and marketing, agency referral to the disposal of part
exchange, assisted schemes and new build stock, land sales and
acquisitions.
Data for the LSL New Build Database is collected off the web sites of over 300 house builders on a rolling quarterly basis so giving a rough timeline of when sites start and finish and how many units have been built.
PLEASE NOTE: The majority of new build market activity data is quite historic, being based on returns made via the NHBC or Local Authority completions data. The LSL New Build Database tracks the new build activity of over 300 leading house builders with data collected from their websites on a rolling quarterly basis so giving a rough time line when sites start and finish and how many units have been built.
Disclaimer: The data is provided by LSL Land & New Homes and is based on data provided as described above. While reasonable skill and care has been taken in the preparation of the data – the copyright and all other intellectual property rights of which belong to e.surv limited - neither e.surv Limited nor LSL Land & New Homes can accept liability for the accuracy or completeness of the data provided.
Reproduction in whole or part is not permitted unless an acknowledgment to e.surv Limited is included. No modification is permitted without e.surv Limited’s prior written consent.
No warranty of the figures is given and no responsibility or liability of any nature to you or any third party for the whole or any part of its content is accepted. It is assumed that you will carry out your own due diligence before proceeding with any proposals or making any financial commitments.
Forfurtherinformationorenquiriesregardingtheunderlyingdataofthe
LSLNewBuildIndex,pleasecontactRichardSextonviaemail
[email protected] 932118.
For further information about the LSL Property Services Group including
LSL Land & New Homes and e.surv, visit www.lslps.co.uk
Notes