
LSL England & Wales House Price Index Jan 2015
17
Under embargo until 00:01 Friday 13th February 2015 January 2015 1 House price growth slows to ten-month low Capital leads downturn with monthly price fall, offering respite to London buyers as market stabilizes Overall, prices start climbing again in January, with values in the North experiencing biggest boost Strongest sales growth found in North and Yorkshire due to surging first-time buyer demand House Price Index Monthly Change % Annual Change % Annual Change % (excluding London & SE) £277,857 266.3 0.3 7.5 4.5 Adrian Gill, director of Reeds Rains and Your Move estate agents, comments: “January’s 7.5% annual growth is the smallest yearly improvement witnessed for 10 months, and represents a deceleration from 8.9% in December as house price inflation continues to flag. After some recent price falls, average property values haven’t taken any steps forward from where they stood in November – and what we’re seeing is a far cry from the marathon of monthly increases that set off this time last year. “In a reversal of fortune, London is leading this slowdown. The capital has long been the propeller driving forward growth, but after cruising ahead at full speed in 2014, the London property market has run aground momentarily. Average London house prices experienced the biggest drop during December (1.1%), but this is just a symptom of the unsustainable rate of growth that the market stretched to last year, as the capital now takes a pause. While a prospective Mansion Tax and higher rate of Stamp Duty on million pound homes may be a blot on the buying landscape at the top end, everyday buyers are simply able to take their time to deliberate and get their finances in order now that market conditions have rationalised again. With a greater supply of available homes on the market, we are striking a better balance between sellers and buyers, and at the bottom rungs of the ladder in particular, demand remains vibrant. The lowest priced London borough, Barking & Dagenham, has seen the biggest boost in home sales during Q4 2014, up 33% on the same period a year previously, helping to drive annual house price growth of 14.4%. “The London story acts as a miniature model of what’s happening in the rest of the UK housing market. The market is temporarily treading water at the higher end, but fast-moving in areas where price growth has been more modest, and where cheaper properties are within reach of new buyers and borrowers who can access Help to Buy. For instance, when you exclude the colossal London and the South East from the equation, the slowdown in annual price growth is much shallower, as growth across other parts of the country continue to sail along steadily. The North saw the biggest uplift in prices in December, while property values made similarly positive progress in Yorkshire & Humberside, and Wales. In these areas demand is thriving as buyers enjoy the perfect storm of record low mortgage rates, more affordable house prices and lower stamp duty costs, and the best properties are being snapped up quickly. Coupling those conditions with steady price growth, buyers are seeing many reasons to act now. “While sales volumes across the south are slightly more sluggish, the North is the current powerhouse of activity, with completed home sales up 7.0% year-on-year during Q4 2014, followed by 4.1% annual increase in Yorkshire & Humberside. This growth is built on sustained first-time buyer appetite for homes, and as this slice of the market continues to grow, flats and terraces are changing hands at the fastest pace – as the property type most common among new buyers. For example, Yorkshire & Humberside have seen the most significant jump in flat sales during Q4 2014, up 18.6% year-on-year. “Overall, completed home sales in January dipped a slight 0.5% compared to a year ago, but with Stamp Duty savings now sweetening the deal and low mortgage rates fostering a host of competitive long-term fixes, homeownership is spreading its wings and breeding further confidence in the market – all in all, it’s a promising start to the New Year.” NB: The LSL/Acadata house price index incorporates all transactions, including cash. For detailed analysis by Dr Peter Williams, housing market specialist and Chairman of Acadata, see page 3.
-
Upload
lsl-land-new-homes -
Category
Documents
-
view
215 -
download
0
description
• Capital leads downturn with monthly price fall, offering respite to London buyers as market stabilizes • Overall, prices start climbing again in January, with values in the North experiencing biggest boost • Strongest sales growth found in North and Yorkshire due to surging first-time buyer demand
Transcript of LSL England & Wales House Price Index Jan 2015

Under embargo until 00:01 Friday 13th February 2015
January 2015
1
House price growth slows to ten-month low
Capital leads downturn with monthly price fall, offering respite to London buyers as market stabilizes
Overall, prices start climbing again in January, with values in the North experiencing biggest boost
Strongest sales growth found in North and Yorkshire due to surging first-time buyer demand
House Price Index Monthly Change % Annual Change % Annual Change % (excluding London & SE) £277,857 266.3 0.3 7.5 4.5
Adrian Gill, director of Reeds Rains and Your Move estate agents, comments: “January’s 7.5% annual growth is the smallest yearly improvement witnessed for 10 months, and represents a deceleration from 8.9% in December as house price inflation continues to flag. After some recent price falls, average property values haven’t taken any steps forward from where they stood in November – and what we’re seeing is a far cry from the marathon of monthly increases that set off this time last year.
“In a reversal of fortune, London is leading this slowdown. The capital has long been the propeller driving forward growth, but after cruising ahead at full speed in 2014, the London property market has run aground momentarily. Average London house prices experienced the biggest drop during December (1.1%), but this is just a symptom of the unsustainable rate of growth that the market stretched to last year, as the capital now takes a pause. While a prospective Mansion Tax and higher rate of Stamp Duty on million pound homes may be a blot on the buying landscape at the top end, everyday buyers are simply able to take their time to deliberate and get their finances in order now that market conditions have rationalised again. With a greater supply of available homes on the market, we are striking a better balance between sellers and buyers, and at the bottom rungs of the ladder in particular, demand remains vibrant. The lowest priced London borough, Barking & Dagenham, has seen the biggest boost in home sales during Q4 2014, up 33% on the same period a year previously, helping to drive annual house price growth of 14.4%.
“The London story acts as a miniature model of what’s happening in the rest of the UK housing market. The market is temporarily treading water at the higher end, but fast-moving in areas where price growth has been more modest, and where cheaper properties are within reach of new buyers and borrowers who can access Help to Buy. For instance, when you exclude the colossal London and the South East from the equation, the slowdown in annual price growth is much shallower, as growth across other parts of the country continue to sail along steadily. The North saw the biggest uplift in prices in December, while property values made similarly positive progress in Yorkshire & Humberside, and Wales. In these areas demand is thriving as buyers enjoy the perfect storm of record low mortgage rates, more affordable house prices and lower stamp duty costs, and the best properties are being snapped up quickly. Coupling those conditions with steady price growth, buyers are seeing many reasons to act now.
“While sales volumes across the south are slightly more sluggish, the North is the current powerhouse of activity, with completed home sales up 7.0% year-on-year during Q4 2014, followed by 4.1% annual increase in Yorkshire & Humberside. This growth is built on sustained first-time buyer appetite for homes, and as this slice of the market continues to grow, flats and terraces are changing hands at the fastest pace – as the property type most common among new buyers. For example, Yorkshire & Humberside have seen the most significant jump in flat sales during Q4 2014, up 18.6% year-on-year.
“Overall, completed home sales in January dipped a slight 0.5% compared to a year ago, but with Stamp Duty savings now sweetening the deal and low mortgage rates fostering a host of competitive long-term fixes, homeownership is spreading its wings and breeding further confidence in the market – all in all, it’s a promising start to the New Year.”
NB: The LSL/Acadata house price index incorporates all transactions, including cash.
For detailed analysis by Dr Peter Williams, housing market specialist and Chairman of Acadata, see page 3.

House price index: historical data
2
Table 1. Average House Prices in England & Wales for the period January 2014 – January 2015 link to source Excel
House Price Index Monthly Change % Annual Change %
January 2014 £258,548 247.8 1.5 7.1
February 2014 £261,003 250.2 0.9 7.2
March 2014 £263,716 252.8 1.0 7.8
April 2014 £265,340 254.3 0.6 8.2
May 2014 £268,387 257.2 1.1 9.5
June 2014 £271,332 260.1 1.1 10.7
July 2014 £272,856 261.5 0.6 10.8
August 2014 £274,883 263.5 0.7 10.9
September 2014 £276,377 264.9 0.5 10.8
October 2014 £277,593 266.1 0.4 10.6
November 2014 £277,882 266.3 0.1 10.2
December 2014 £277,164 265.7 -0.3 8.9
January 2015 £277,857 266.3 0.3 7.5
Press Contacts:
Melanie Cowell, LSL Property Services 01904 698860 [email protected] Richard Sumner, Acadata 020 8392 9082 [email protected] Emily Barnes, Wriglesworth PR 020 7427 1403 [email protected]

Further commentary by Dr Peter Williams
3
Dr Peter Williams, housing market specialist and Chairman of Acadata, comments:
House prices
In January 2015, the average price paid for a home in England & Wales was £277,857. This was an increase of £700, or 0.3% over December, almost exactly matching the fall in prices that month. The average house price is now just £25 lower than it was at the end of November 2014 - the average price has effectively been at a standstill since then.
On an annual basis, the average house price in England & Wales has risen by £19,300, or 7.5% over the last year. This represents a decline of 1.4% from the 8.9% recorded last month. It is the fifth month in succession in which the annual rate of house price inflation has fallen. Each month has shown a faster rate of decline than the preceding month, indicating a sustained reduction in house price inflation at the aggregate level.
Figure 1 below illustrates the rate of change in average house prices on an annual basis for the period January 2013 – January 2015, including the effect of London & the South East on the national rate.
Figure 1. The Annual Rate of House Price Growth in England & Wales by month January 2013 – January 2015, including and excluding London & SE link to source Excel
This Figure shows the annual rate of house price growth increasing from May 2013 across all of England & Wales, until September 2014, when a downturn in the growth rate began. The steeper decline in the rate of growth of house prices over the most recent three months is clearly visible, with the series including London falling more sharply than those which exclude the capital. This has resulted in a narrowing of the differential gap between the series.
Table 2. The % change in average house prices analysed by Region October – December 2014. link to source Excel
Reg
ion
Gre
ater
Lon
do
n
Engl
and
&
Wal
es
East
Mid
lan
ds
East
An
glia
Sou
th E
ast
No
rth
Wes
t
Wal
es
Sou
th W
est
York
s &
Hu
mb
er
Wes
t
Mid
lan
ds
No
rth
Oct-14 0.6% 0.4% -0.2% 0.5% 0.3% 0.3% 0.9% 0.3% 0.8% 0.7% 0.7%
Nov-14 0.3% 0.1% 0.1% -0.7% 0.2% -0.4% -0.1% -0.2% 0.6% 0.2% -0.4%
Dec-14 -1.1% -0.3% -0.1% -0.1% 0.0% 0.0% 0.2% 0.3% 0.3% 0.3% 0.4%
Table 2 above shows the monthly change in house prices during Q4 2014, by Region. The Table has been set out by the order of price change in December 2014. Greater London saw the largest fall in prices over the period in December at -1.1%, with the East Midlands and East Anglia also both experiencing price falls in that month. The Region recording the highest rise in house prices over the period was Wales in October, with an increase of 0.9%, closely followed by Yorkshire & Humberside with an increase of 0.8% in the same month. Overall one can detect, with a few exceptions, that the rate of price change has been consistently falling over the three months in all regions.
0.0
2.0
4.0
6.0
8.0
10.0
12.0
An
nu
al %
ch
ange
in h
ou
se p
rice
s
Annual House Price Growth, including and excluding London & SE
including London
excluding London
excluding London & SE

Further commentary by Dr Peter Williams
4
The monthly change in prices in December, shown in Table 2, is almost in reverse order to the change in prices that have taken place on an annual basis during 2014 (see Figure 5 on page 8). In Figure 5, the North had the lowest increase in annual prices at 3.0%, while Greater London saw the highest increase in prices at 13.9%. This suggests that Greater London caused a ripple effect on house prices in its near locality throughout 2014, but that this is now resulting in falling - as opposed to rising - property values.
Last month we reflected on the considerable uncertainty that exists in the market. All the evidence points to a cooling in the market centred on London, but then slowly rippling out from the capital. The explanations for this cooling are many and varied but a combination of the upcoming General Election, the continued slow recovery in the economy and wages, and a tighter mortgage market all impact upon the market in terms of appetite and capacity to buy or move. Indeed, slowing prices generate uncertainty amongst both buyers and sellers, and reduce the pressure to complete the transaction. Although consumer confidence has been rising and the housing market is still in better shape than a year ago, we are clearly experiencing a pause. In part, this is because affordability is still quite stretched, despite improving mortgage terms and prices: it is worth remembering that with some fluctuations prices have been rising since May 2009, i.e. for over 6 years. The RICS has shown that new instructions have been falling - this will ultimately mean more competition, and price pressure remains around the fewer homes for sale. New housing supply is edging up slowly, but with considerable pent-up demand this is unlikely to relieve the market greatly in the medium term. The Stamp Duty changes are broadly positive in terms of helping the market, but the Mansion Tax proposals have cast a not insignificant shadow over those parts of London where the £2 million+ homes are concentrated (90% of the homes affected are in four London boroughs).
Looking ahead to the spring and summer, warmer weather, greater clarity following the General Election in terms of policy measures, continued lender adjustment to the new mortgage market rules (aided potentially by outcomes from the on-going Financial Conduct Authority review), and the inevitable build-up of demand along with the government’s new stepping onto the ladder programme - all these may all combine to restore activity in the market. Most commentators anticipated a slowing and then a recovery into the second half of 2015. At this point, this is indeed the track we seem to be on.
Housing Transactions
We estimate that the number of housing transactions in England & Wales in January 2015, as recorded by the Land Registry, will total some 66,500. This is 17% lower than the level seen in December 2014: however, this decline is typical for the time of year. Perhaps more importantly, looking at the sales volumes in January 2015 compared to January 2014, there was a small fall of 0.5% in the number of properties sold. This follows the trend seen in the last quarter of 2014, when total transactions were down 0.4% on sales levels in Q4 2013. We analyse this pattern further in Table 3 below.
As can be seen in Figure 2 below, sales volumes in 2014 were consistently higher than the previous three years, with the exception of the last two months of the year, when transactions fell below the levels reached in 2013. Although the January 2015 transaction level has been plotted on the graph, it is difficult to identify, since the estimated sales volume in the month matches that recorded for January 2014, and we need further monthly data to establish the trend line.
Figure 2. Number of properties sold per month in England & Wales, January 2011 – January 2015. Source Land Registry link to source Excel
30,000
40,000
50,000
60,000
70,000
80,000
90,000
100,000
Jan Feb Mar Apr May Jun Jul Aug Sep Oct Nov Dec
Nu
mb
er
of
ho
use
s so
ld p
er
mo
nth
Housing Transactions per Month 2011 - 2015
2011
2012
2013
2014
2015

Further commentary by Dr Peter Williams
5
Table 3 below analyses the number of property transactions that took place in Q4 2014, by Region, compared to Q4 2013, as recorded at the Land Registry. In England & Wales as a whole, transactions in Q4 2014 are down by a marginal 0.4% on the same period in 2013; however this single statistic masks the substantial differences that have occurred between the regions. For example, in the North sales volumes increased by 7.0% in Q4 2014 compared to Q4 2013, whereas in Greater London sales volumes fell by 10.5% over the same period.
Table 3. The % change in the number of housing transactions between Q4 2013 and Q4 2014, analysed by Region. link to source Excel
REGION Oct - Dec 2013 Oct - Dec 2014 % change
NORTH 10,572 11,311 7.0%
YORKS & HUMBER 19,202 19,981 4.1%
EAST MIDLANDS 19,192 19,943 3.9%
NORTH WEST 22,076 22,700 2.8%
WEST MIDLANDS 19,670 20,011 1.7%
WALES 10,560 10,575 0.1%
SOUTH EAST 58,265 58,074 -0.3%
SOUTH WEST 26,723 26,386 -1.3%
EAST ANGLIA 11,712 11,376 -2.9%
GREATER LONDON 30,894 27,662 -10.5%
ENGLAND & WALES 228,866 228,019 -0.4%
The four regions that have experienced falls in the number of properties sold, when comparing Q4 2014 to Q4 2013, are the same four regions that have experienced the highest rise in house prices over the last year, see Figure 5.
Table 4. The % change in the number of housing transactions between Q4 2013 and Q4 2014, analysed by property type. link to source Excel
REGION Detached Semi Terraced Flats All Types
NORTH 7.9% 3.4% 7.3% 16.2% 7.0%
YORKS & HUMBER 0.8% -0.1% 7.6% 18.6% 4.1%
EAST MIDLANDS 0.1% 0.6% 10.7% 18.0% 3.9%
NORTH WEST 0.6% -1.4% 5.5% 13.3% 2.8%
WEST MIDLANDS -1.6% 1.1% 3.8% 6.9% 1.7%
WALES 0.9% -1.3% -2.6% 15.8% 0.1%
SOUTH EAST -6.4% -6.2% 0.5% 14.2% -0.3%
SOUTH WEST -5.1% -5.0% 0.0% 8.7% -1.3%
EAST ANGLIA -5.8% 0.0% -3.6% 3.0% -2.9%
GREATER LONDON -18.3% -14.7% -10.0% -8.8% -10.5%
ENGLAND & WALES -3.0% -2.9% 1.3% 4.3% -0.4%
Table 4 shows the % change in the volume of transactions between Q4 2013 and Q4 2014, by region, analysed by property type. As can be seen, the highest increase in sales by type is that for flats, which have increased by 4.3% over the period, followed by terraced properties, up by 1.3%. Both of these property types are popular with first time buyers, suggesting that this sector of the market has continued to strengthen over this last year. In contrast, the number of semi-detached and detached properties sold has fallen over the period by 2.9% and 3.0% respectively.
In percentage terms, the region with the highest increase in flat sales is Yorkshire & Humberside, up by 18.6%, followed by the East Midlands showing an increase of 18.0% in the sale of flats over this period. In absolute terms it is the South East that has seen the highest increase in flat sales, with an additional 1,640 units sold in Q4 2014 compared to Q4 2013. This figure contrasts starkly with the reduction in flat sales that took place in Greater London, which were down by 1,454 units over this period.
The region with the highest percentage increase in terraced property sales is the East Midlands, up by 10.7%, followed by Yorkshire & Humberside, up 7.6%. In absolute terms, it is the East Midlands that has seen the highest increase in the sale of terraces, with an additional 519 units sold in Q4 2014 compared to Q4 2013.

Further commentary by Dr Peter Williams
6
The North has seen both the highest percentage increase, as well as the largest absolute increase in sales of semi-detached properties, up by 3.4% and 121 units respectively. A similar picture emerges in the sale of detached properties, with the North also seeing the largest percentage and absolute increases in the sale of such properties, up by 7.9% and an additional 191 units.
Greater London has seen the largest percentage fall in the number of properties sold across all property types between Q4 2013 and Q4 2014, and is the only region to have experienced a reduction in the number of flats sold over this period. Greater London has also seen the largest fall in transactions in absolute terms for flats and terraced properties, but it is the South East which has seen the largest drop in absolute terms in the sale of semi-detached and detached properties, down by 917 and 1,001 units respectively.
NOTES 1. LSL Acad E&W HPI is the only house price index to use:
the actual prices at which every property in England & Wales was transacted, including prices for properties bought with cash, using the factual Land Registry data as opposed to valuation estimates or asking prices
the price of every single relevant transaction, as opposed to prices based upon samples LSL Acad E&W HPI is a price series as opposed to a value series.
2. the current month LSL Acad E&W HPI comprises a forecast of the LR outcome, using an academic “index of indices” model, pending release of sufficient real data from the Land Registry.
3. LSL Acad E&W HPI forecasts are progressively replaced with real data, until every transaction reported to the Land Registry has been recorded and we have provided our LSL Acad E&W HPI “ultimate” data. All LSL Acad E&W HPI numbers, published prior to receipt of all transaction data, are subject to change; in publishing precise numbers for a number of reasons, we do not claim precision.
4. the Acadata website enables comparisons of selected indices over selected timescales to be undertaken here with ease and provides historic results and other information.
5. Acadata is an independent privately owned consultancy working with Dr Stephen Satchell, Economics Fellow Trinity College Cambridge, and specialist in the assessment of risk in property and mortgage portfolios.
6. Acadata Prices and Transactions (sample here), which exclude any forecast element, underlie the LSL Acad E&W HPI data and are available upon subscription for organisations needing the factual month by month Land Registry prices, at county/London borough level by property type, for e.g. property portfolio valuation, planning and advisory purposes.

Comparison of indices
7
Figure 3. ANNUAL CHANGE IN HOUSE PRICES - COMPARISON OF INDICES CHART link to source Excel
Figure 4. MONTHLY CHANGE IN HOUSE PRICES - COMPARISON OF INDICES CHART link to source Excel
All the indices that have published their results for January 2015 are showing positive increases in annual house price inflation ranging from +8.5% (Halifax) to +6.8% (Nationwide). This month has the smallest variance in the reported rates of house price inflation over the last year, although the Land Registry and the ONS have yet to publish. The near unanimity of the indices may reflect the decline in the sale of top-end properties for cash during Q4 2014, which tend to receive different treatments in each of the published indices.
In Figure 4, we can see that Halifax and Rightmove are both reporting a high rate of growth in prices for January at 2.0% and 1.4% respectively, while Nationwide and LSL Acad are both showing a more modest change of 0.3% for the month. The Halifax monthly index is one of the more volatile indices published, with the Halifax itself noting ”The monthly figures in January can be particularly volatile due to the lower volumes of activity at this time of year and there have been unusually large rises on occasion in the past, such as in 2007 (2.3%) and 2009 (2.4%).”
Acadata has published a briefing note on the different house price indices and their performance over time. Readers are invited to download this document from our website given that these differences are now a key area for debate and intervention. Indeed, the ONS is currently consulting interested parties on its proposed new government house price index, which has a potential launch date of February 2016. Last month, the Financial Times published a helpful short review of selected indices (see FT Money, Financial Times, 3rd January, 2015, page 2).
0.0
2.0
4.0
6.0
8.0
10.0
12.0
14.0
Jan 14 Feb 14 Mar 14 Apr 14 May 14 Jun 14 Jul 14 Aug 14 Sep 14 Oct 14 Nov 14 Dec 14 Jan 15
Perc
enta
ge
LSL Acad E&W
CLG/ONS
LR Index
Nationwide
Halifax
Rightmove
-3.0
-2.0
-1.0
0.0
1.0
2.0
3.0
4.0
5.0
Jan-14 Feb-14 Mar-14 Apr-14 May-14 Jun-14 Jul-14 Aug-14 Sep-14 Oct-14 Nov-14 Dec-14 Jan-15
Pe
rce
nta
ge
LSL Acad E&W
CLG/ONS
LR Index
Nationwide
Halifax
Rightmove

Regional analysis of house prices
8
Figure 5. The annual change in the average house price, analysed by region link to source Excel
Figure 5 above shows the annual rate of change for December, averaged over three months, for each of the ten regions in England & Wales. All ten regions are showing a positive quarterly movement in house prices. This month three regions are showing an increase in their averaged annual rate of change compared to the previous month (the North West, East Midlands and East Anglia), with seven regions showing a decrease. Greater London saw the largest drop in the annual rate of house price growth compared to last month, being down 2.9%, followed by the South East, down 1.6%. There were two regions recording peak average house prices in December; the South West and the West Midlands, with the South East and Greater London both having dropped out of this group. As we reported last month “If price changes ripple out from London as they have in previous periods, this does begin to hint at a cooling in the market”. It would appear that in December this process was gaining momentum.
London and the South East v the Rest
This month we consider the extent to which the annual house price inflation in England & Wales would differ if we were to exclude both Greater London and the South East from the HPI calculations. The results of this analysis are shown in Table 5 below. As expected, the annual rate is lower if we exclude London & the SE from the calculations. It is however noticeable that the gap between the rates including and excluding Greater London and the South East are beginning to diminish. This gap was at its maximum in June 2014 at 5.4%, but has subsequently reduced to 3.0% in January 2015. This accords with the view of the many analysts who have predicted that the price of properties in both Greater London and the South East will fall at a faster rate than the remainder of England & Wales.
Table 5. The annual percentage change in house prices in England & Wales, from January 2014 – January 2015, including and excluding Greater London and the South East. link to source Excel
Month including London
excluding London
excluding London &
SE
Jan-14 7.1 4.8 3.9
Feb-14 7.2 4.8 3.7
Mar-14 7.8 5.7 4.8
Apr-14 8.2 5.9 5.0
May-14 9.5 6.7 5.7
Jun-14 10.7 7.1 5.3
Jul-14 10.8 7.4 5.5
Aug-14 10.9 7.8 5.7
Sep-14 10.8 7.9 5.6
Oct-14 10.6 7.8 5.7
Nov-14 10.2 7.7 5.6
Dec-14 8.9 6.9 5.4
Jan-15 7.5 6.0 4.5
3.4%
4.2%
4.3%
4.9%
6.0%
5.9%
6.8%
7.0%
10.2%
10.7%
16.8%
3.0%
3.9%
4.3%
4.6%
5.6%
5.9%
6.2%
7.3%
8.9%
9.1%
13.9%
0.0% 2.0% 4.0% 6.0% 8.0% 10.0% 12.0% 14.0% 16.0% 18.0%
North
Wales
North West
Yorks & Humber
West Midlands
East Midlands
South West
East Anglia
ENGLAND & WALES
South East
Greater London
Average Annual Change Over Last Three Months
This month
Last Month
Regional analysis of house prices
9
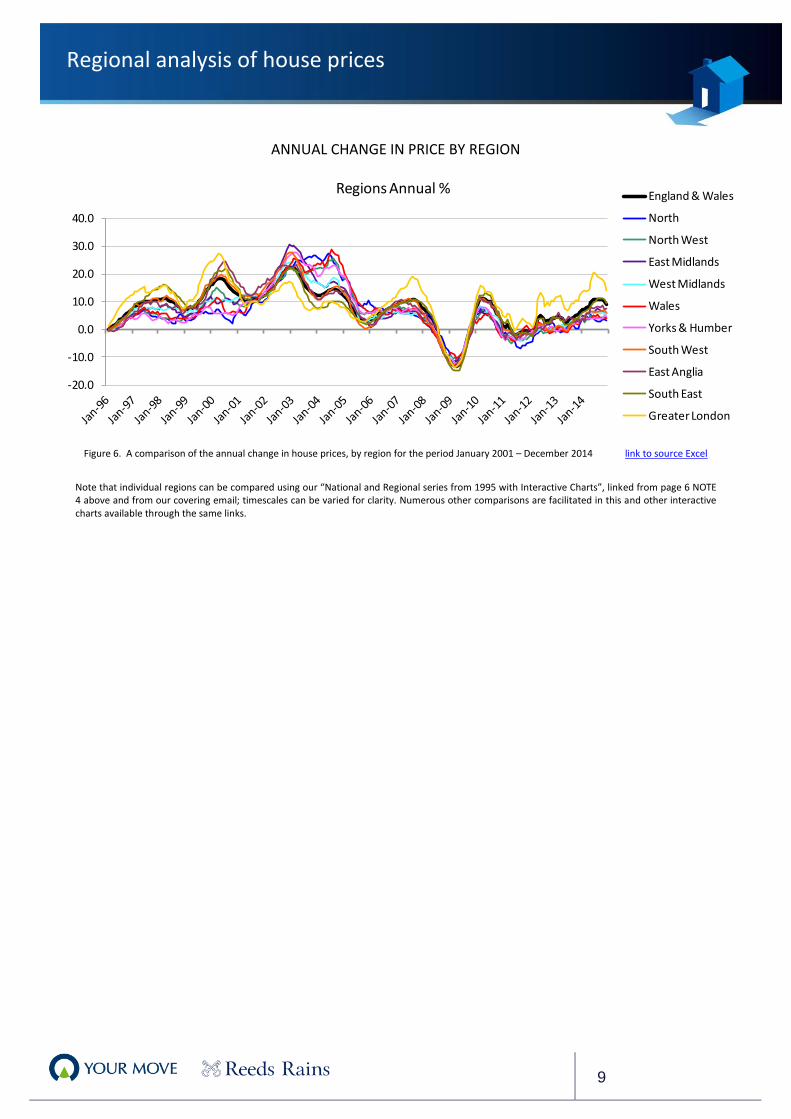
ANNUAL CHANGE IN PRICE BY REGION
Figure 6. A comparison of the annual change in house prices, by region for the period January 2001 – December 2014 link to source Excel
Note that individual regions can be compared using our “National and Regional series from 1995 with Interactive Charts”, linked from page 6 NOTE 4 above and from our covering email; timescales can be varied for clarity. Numerous other comparisons are facilitated in this and other interactive charts available through the same links.
-20.0
-10.0
0.0
10.0
20.0
30.0
40.0
Regions Annual %England & Wales
North
North West
East Midlands
West Midlands
Wales
Yorks & Humber
South West
East Anglia
South East
Greater London

London boroughs, Counties and unitary authorities
10
Table 6. The change in house prices, for the 33 London boroughs, comparing December 2013 and November 2014 with December 2014. link to source Excel
PRIOR YR RANK
RANK BY PRICE LONDON BOROUGH Dec-13 Nov-14 Dec-14
Month % Change
Annual % Change
1 1 KENSINGTON AND CHELSEA 1,717,995 1,954,427 1,818,363 -7.0% 5.8% 2 2 CITY OF WESTMINSTER 1,220,702 1,623,442 1,563,831 -3.7% 28.1% 4 3 HAMMERSMITH AND
FULHAM 836,618 1,009,699 1,012,208 0.2% 21.0%
3 4 CAMDEN 880,650 984,267 961,231 -2.3% 9.2% 5 5 CITY OF LONDON 787,280 923,125 880,196 -4.7% 11.8% 6 6 RICHMOND UPON THAMES 653,506 803,704 809,165 0.7% 23.8% 7 7 WANDSWORTH 644,900 742,578 744,321 0.2% 15.4% 8 8 ISLINGTON 610,486 656,477 655,972 -0.1% 7.5% 9 9 BARNET 502,847 562,753 561,837 -0.2% 11.7%
11 10 MERTON 490,309 601,702 557,699 -7.3% 13.7% 17 11 KINGSTON UPON THAMES 439,068 524,867 540,822 3.0% 23.2% 10 12 HARINGEY 494,683 530,308 533,960 0.7% 7.9% 16 13 EALING 453,652 517,858 521,080 0.6% 14.9% 12 14 SOUTHWARK 483,505 519,242 520,441 0.2% 7.6% 15 15 HACKNEY 457,844 534,544 519,737 -2.8% 13.5% 13 16 LAMBETH 481,639 524,267 512,730 -2.2% 6.5% 14 17 BRENT 477,017 485,363 503,963 3.8% 5.6% 20 18 HOUNSLOW 395,033 484,367 470,227 -2.9% 19.0% 18 19 TOWER HAMLETS 428,094 437,530 443,430 1.3% 3.6% 19 20 HARROW 397,847 427,077 438,034 2.6% 10.1% 21 21 BROMLEY 375,705 423,075 425,964 0.7% 13.4% 23 22 LEWISHAM 329,981 387,666 391,056 0.9% 18.5% 22 23 GREENWICH 365,136 380,172 382,675 0.7% 4.8% 26 24 HILLINGDON 323,731 372,664 374,487 0.5% 15.7% 24 25 REDBRIDGE 329,160 367,756 372,421 1.3% 13.1% 27 26 WALTHAM FOREST 306,154 365,732 368,664 0.8% 20.4% 25 27 ENFIELD 324,798 368,895 367,175 -0.5% 13.0% 28 28 SUTTON 297,181 345,915 344,802 -0.3% 16.0% 29 29 CROYDON 288,625 334,224 336,394 0.6% 16.6% 30 30 HAVERING 263,208 293,927 300,157 2.1% 14.0% 31 31 BEXLEY 248,525 283,713 284,334 0.2% 14.4% 32 32 NEWHAM 238,953 281,084 277,401 -1.3% 16.1% 33 33 BARKING AND DAGENHAM 198,082 223,379 226,575 1.4% 14.4%
ALL LONDON 505,601 582,259 576,093 -1.1% 13.9%
Table 6 above shows the average house price and percentage change (over the last month and year) by London borough for December 2013, November 2014 and December 2014. The rate of annual house price inflation in London in December was 13.9%, down 2.9% from November. Housing analysts are anticipating further reductions in the rate of house price inflation in the London market over the next few months, as the higher SDLT rates on properties over £1.1 million and concerns over the mansion tax begin to have an effect.
All 33 London boroughs continue to show a positive movement in their average house prices over the year, ranging from a substantial +28.1% in the City of Westminster to a modest +3.6% in Tower Hamlets. In the City of Westminster flats are the most popular property type, with 228 being purchased in December at an average price of £1.35 million. In Tower Hamlets flats are also the most popular property choice, with 275 units having been purchased in December at an average price of £450k, being a third of the cost of similar properties in the City of Westminster, some seven miles distant.
During the month of December, average house prices fell in London by 1.1%, which was the first time in 17 months that price changes have been negative. Looking at the top third of boroughs ranked by average price, seven of the eleven boroughs saw price falls, while the mid and bottom eleven boroughs by price only had three boroughs apiece recording price falls. In general, it is the top priced boroughs that have seen the largest price reductions, with Kensington and Chelsea and the City of London recording respective falls of 7.0% and 4.7%, although this month Merton has experienced the largest decline in prices at -7.3%.
In December there were 14 boroughs with peak prices (highlighted in grey in the above table), compared to 17 such boroughs one month earlier. Of these 14 boroughs, 7 are among the lowest 11 boroughs by average price, 4 are among the top 11 boroughs by average price, and 3 are in the middle 11 boroughs by average price. The lower priced boroughs are thus continuing to experience strong demand for properties, while the highest priced areas are seeing a slackening in demand.
London boroughs, Counties and unitary authorities
11
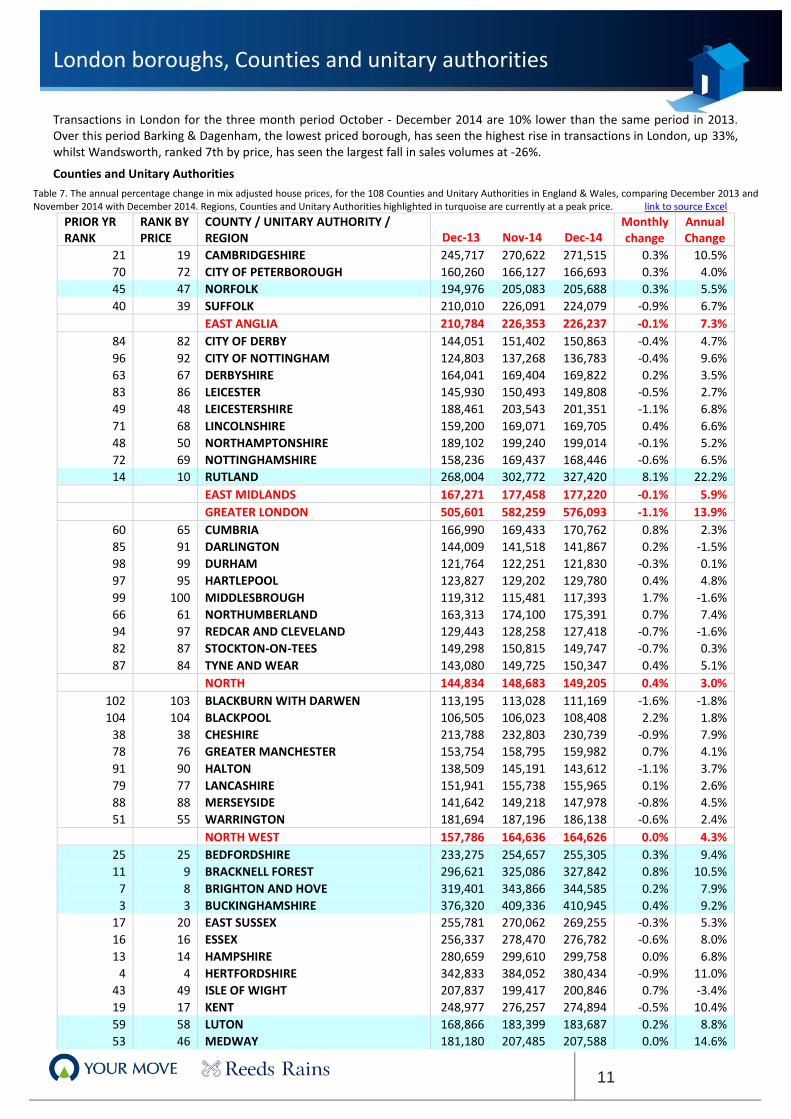
Transactions in London for the three month period October - December 2014 are 10% lower than the same period in 2013. Over this period Barking & Dagenham, the lowest priced borough, has seen the highest rise in transactions in London, up 33%, whilst Wandsworth, ranked 7th by price, has seen the largest fall in sales volumes at -26%.
Counties and Unitary Authorities
Table 7. The annual percentage change in mix adjusted house prices, for the 108 Counties and Unitary Authorities in England & Wales, comparing December 2013 and November 2014 with December 2014. Regions, Counties and Unitary Authorities highlighted in turquoise are currently at a peak price. link to source Excel
PRIOR YR RANK
RANK BY PRICE
COUNTY / UNITARY AUTHORITY / REGION Dec-13 Nov-14 Dec-14
Monthly change
Annual Change
21 19 CAMBRIDGESHIRE 245,717 270,622 271,515 0.3% 10.5%
70 72 CITY OF PETERBOROUGH 160,260 166,127 166,693 0.3% 4.0%
45 47 NORFOLK 194,976 205,083 205,688 0.3% 5.5%
40 39 SUFFOLK 210,010 226,091 224,079 -0.9% 6.7%
EAST ANGLIA 210,784 226,353 226,237 -0.1% 7.3%
84 82 CITY OF DERBY 144,051 151,402 150,863 -0.4% 4.7%
96 92 CITY OF NOTTINGHAM 124,803 137,268 136,783 -0.4% 9.6%
63 67 DERBYSHIRE 164,041 169,404 169,822 0.2% 3.5%
83 86 LEICESTER 145,930 150,493 149,808 -0.5% 2.7%
49 48 LEICESTERSHIRE 188,461 203,543 201,351 -1.1% 6.8%
71 68 LINCOLNSHIRE 159,200 169,071 169,705 0.4% 6.6%
48 50 NORTHAMPTONSHIRE 189,102 199,240 199,014 -0.1% 5.2%
72 69 NOTTINGHAMSHIRE 158,236 169,437 168,446 -0.6% 6.5%
14 10 RUTLAND 268,004 302,772 327,420 8.1% 22.2%
EAST MIDLANDS 167,271 177,458 177,220 -0.1% 5.9%
GREATER LONDON 505,601 582,259 576,093 -1.1% 13.9%
60 65 CUMBRIA 166,990 169,433 170,762 0.8% 2.3%
85 91 DARLINGTON 144,009 141,518 141,867 0.2% -1.5%
98 99 DURHAM 121,764 122,251 121,830 -0.3% 0.1%
97 95 HARTLEPOOL 123,827 129,202 129,780 0.4% 4.8%
99 100 MIDDLESBROUGH 119,312 115,481 117,393 1.7% -1.6%
66 61 NORTHUMBERLAND 163,313 174,100 175,391 0.7% 7.4%
94 97 REDCAR AND CLEVELAND 129,443 128,258 127,418 -0.7% -1.6%
82 87 STOCKTON-ON-TEES 149,298 150,815 149,747 -0.7% 0.3%
87 84 TYNE AND WEAR 143,080 149,725 150,347 0.4% 5.1%
NORTH 144,834 148,683 149,205 0.4% 3.0%
102 103 BLACKBURN WITH DARWEN 113,195 113,028 111,169 -1.6% -1.8%
104 104 BLACKPOOL 106,505 106,023 108,408 2.2% 1.8%
38 38 CHESHIRE 213,788 232,803 230,739 -0.9% 7.9%
78 76 GREATER MANCHESTER 153,754 158,795 159,982 0.7% 4.1%
91 90 HALTON 138,509 145,191 143,612 -1.1% 3.7%
79 77 LANCASHIRE 151,941 155,738 155,965 0.1% 2.6%
88 88 MERSEYSIDE 141,642 149,218 147,978 -0.8% 4.5%
51 55 WARRINGTON 181,694 187,196 186,138 -0.6% 2.4%
NORTH WEST 157,786 164,636 164,626 0.0% 4.3%
25 25 BEDFORDSHIRE 233,275 254,657 255,305 0.3% 9.4%
11 9 BRACKNELL FOREST 296,621 325,086 327,842 0.8% 10.5%
7 8 BRIGHTON AND HOVE 319,401 343,866 344,585 0.2% 7.9%
3 3 BUCKINGHAMSHIRE 376,320 409,336 410,945 0.4% 9.2%
17 20 EAST SUSSEX 255,781 270,062 269,255 -0.3% 5.3%
16 16 ESSEX 256,337 278,470 276,782 -0.6% 8.0%
13 14 HAMPSHIRE 280,659 299,610 299,758 0.0% 6.8%
4 4 HERTFORDSHIRE 342,833 384,052 380,434 -0.9% 11.0%
43 49 ISLE OF WIGHT 207,837 199,417 200,846 0.7% -3.4%
19 17 KENT 248,977 276,257 274,894 -0.5% 10.4%
59 58 LUTON 168,866 183,399 183,687 0.2% 8.8%
53 46 MEDWAY 181,180 207,485 207,588 0.0% 14.6%

London boroughs, Counties and unitary authorities
12
33 30 MILTON KEYNES 220,002 248,432 244,162 -1.7% 11.0%
6 6 OXFORDSHIRE 330,538 357,474 356,125 -0.4% 7.7%
57 57 PORTSMOUTH 176,278 184,164 184,441 0.2% 4.6%
18 18 READING 249,482 268,643 274,521 2.2% 10.0%
30 21 SLOUGH 225,253 267,124 266,568 -0.2% 18.3%
54 51 SOUTHAMPTON 179,735 195,138 193,923 -0.6% 7.9%
29 23 SOUTHEND-ON-SEA 225,329 253,090 257,258 1.6% 14.2%
2 2 SURREY 438,969 476,906 481,592 1.0% 9.7%
47 43 THURROCK 189,956 215,165 215,375 0.1% 13.4%
8 7 WEST BERKSHIRE 311,280 348,027 345,099 -0.8% 10.9%
12 12 WEST SUSSEX 288,415 314,880 316,019 0.4% 9.6%
1 1 WINDSOR AND MAIDENHEAD 477,664 527,823 518,984 -1.7% 8.7%
5 5 WOKINGHAM 339,456 377,288 378,909 0.4% 11.6%
SOUTH EAST 294,515 321,419 321,283 0.0% 9.1%
10 11 BATH AND NORTH EAST SOMERSET 302,293 332,385 326,493 -1.8% 8.0%
28 27 BOURNEMOUTH 226,358 239,624 249,624 4.2% 10.3%
27 31 CITY OF BRISTOL 226,788 245,313 242,490 -1.2% 6.9%
69 63 CITY OF PLYMOUTH 161,838 173,883 173,624 -0.1% 7.3%
31 33 CORNWALL 223,587 233,696 237,020 1.4% 6.0%
23 26 DEVON 238,299 253,514 250,663 -1.1% 5.2%
15 15 DORSET 265,734 285,938 286,901 0.3% 8.0%
22 24 GLOUCESTERSHIRE 240,336 251,083 256,851 2.3% 6.9%
26 29 NORTH SOMERSET 226,851 247,239 247,137 0.0% 8.9%
9 13 POOLE 308,063 310,741 310,736 0.0% 0.9%
41 41 SOMERSET 209,445 217,936 218,208 0.1% 4.2%
32 35 SOUTH GLOUCESTERSHIRE 221,488 236,290 234,832 -0.6% 6.0%
55 53 SWINDON 176,703 189,258 189,022 -0.1% 7.0%
50 56 TORBAY 182,479 183,832 186,016 1.2% 1.9%
20 22 WILTSHIRE 248,477 262,683 263,752 0.4% 6.1%
SOUTH WEST 232,004 245,781 246,446 0.3% 6.2%
108 108 BLAENAU GWENT 86,155 89,063 89,485 0.5% 3.9%
86 81 BRIDGEND 143,748 153,374 152,425 -0.6% 6.0%
95 96 CAERPHILLY 126,046 127,845 128,112 0.2% 1.6%
46 45 CARDIFF 194,875 207,296 209,022 0.8% 7.3%
90 83 CARMARTHENSHIRE 138,660 147,276 150,547 2.2% 8.6%
52 52 CEREDIGION 181,266 188,381 189,256 0.5% 4.4%
77 64 CONWY 154,745 172,238 173,533 0.8% 12.1%
80 78 DENBIGHSHIRE 151,549 152,213 155,304 2.0% 2.5%
68 70 FLINTSHIRE 162,044 169,631 168,165 -0.9% 3.8%
64 74 GWYNEDD 163,971 160,875 161,124 0.2% -1.7%
62 71 ISLE OF ANGLESEY 164,777 162,309 166,995 2.9% 1.3%
106 105 MERTHYR TYDFIL 102,755 109,190 108,201 -0.9% 5.3%
36 34 MONMOUTHSHIRE 217,616 239,901 236,206 -1.5% 8.5%
101 102 NEATH PORT TALBOT 115,915 110,689 111,673 0.9% -3.7%
81 80 NEWPORT 150,092 153,839 153,812 0.0% 2.5%
61 60 PEMBROKESHIRE 166,500 183,465 182,816 -0.4% 9.8%
56 54 POWYS 176,382 188,471 188,304 -0.1% 6.8%
103 101 RHONDDA CYNON TAFF 110,383 114,559 114,760 0.2% 4.0%
74 85 SWANSEA 156,371 152,958 150,030 -1.9% -4.1%
37 42 THE VALE OF GLAMORGAN 213,997 212,996 216,145 1.5% 1.0%
92 94 TORFAEN 137,346 137,633 131,900 -4.2% -4.0%
75 79 WREXHAM 156,081 152,618 154,222 1.1% -1.2%
WALES 157,404 163,183 163,510 0.2% 3.9%
34 36 HEREFORDSHIRE 218,963 229,949 231,089 0.5% 5.5%
44 44 SHROPSHIRE 204,801 211,165 212,940 0.8% 4.0%

London boroughs, Counties and unitary authorities
13
58 59 STAFFORDSHIRE 170,507 181,891 182,857 0.5% 7.2%
107 107 STOKE-ON-TRENT 100,270 100,919 101,475 0.6% 1.2%
24 28 WARWICKSHIRE 234,779 245,355 249,002 1.5% 6.1%
67 66 WEST MIDLANDS 162,275 170,142 170,224 0.0% 4.9%
42 40 WORCESTERSHIRE 209,302 225,614 223,741 -0.8% 6.9%
73 73 WREKIN 156,735 161,713 163,048 0.8% 4.0%
WEST MIDLANDS 180,284 189,719 190,339 0.3% 5.6%
105 106 CITY OF KINGSTON UPON HULL 104,589 103,303 104,835 1.5% 0.2%
65 62 EAST RIDING OF YORKSHIRE 163,960 176,278 173,911 -1.3% 6.1%
100 98 NORTH EAST LINCOLNSHIRE 118,870 122,917 125,459 2.1% 5.5%
93 93 NORTH LINCOLNSHIRE 132,276 136,095 135,360 -0.5% 2.3%
35 37 NORTH YORKSHIRE 218,609 228,015 231,009 1.3% 5.7%
89 89 SOUTH YORKSHIRE 140,337 146,756 146,340 -0.3% 4.3%
76 75 WEST YORKSHIRE 155,668 160,344 160,377 0.0% 3.0%
39 32 YORK 212,214 233,608 237,434 1.6% 11.9%
YORKS & HUMBER 160,516 167,421 167,886 0.3% 4.6%
ALL ENGLAND & WALES 254,627 277,882 277,164 -0.3% 8.9%
Table 7 shows the average house price for each of the 108 unitary authorities and counties in England & Wales, together with a regional summary for December 2013, and November and December 2014. It also records the percentage change in these prices over the last month and year, and highlights the great diversity that exists across markets in England & Wales.
The headline annual increase in prices for England & Wales in December was 8.9%, which is down 1.3% from November. In December, as reported earlier, there were only two regions recording peak average prices, being the West Midlands and the South West, with Greater London and the South East dropping out of this group, at least for the time being. In the South East, 9 of the 25 unitary authorities/counties now have peak prices (highlighted in turquoise in the above table), compared to the 14 seen last month. Outside of Greater London and the South East regions, peak prices are also being recorded in nine (last month eleven) unitary authority areas. These nine areas with record peak prices are Norfolk (East Anglia), Rutland (East Midlands), Dorset, Gloucestershire and Wiltshire (South West), Cardiff (Wales), Warwickshire and the West Midlands (West Midlands) and finally York (Yorkshire & Humberside).
Annual Trends
On an annual basis, prices have increased in 98 of the 108 unitary authorities (three less than last month). Thus prices have risen over the year in 91% of the unitary authorities across England & Wales, with annual price rises in double digits, i.e. of 10% or more, now being seen in 16 authorities, compared with 21 last month. Of the ten unitary authorities having negative house price growth over the year, three are located in the North (Darlington, Middlesbrough and Redcar and Cleveland), one in the North West (Blackburn with Darwen), one in the South East (Isle of Wight) and five in Wales (Gwynedd, Neath Port Talbot, Swansea, Torfaen and Wrexham).
Table 8 below shows the annual rate of house price growth, outside of Greater London, ordered by quartiles in terms of the average house price of each unitary authority. The table highlights the fact that the most expensive unitary authority areas in England & Wales are seeing the highest increase in house prices. However, comparing the figures this month with the equivalent for those produced last month, we can see that all quartiles are showing a decline in their respective annual rates.
Table 8. The change in house prices in the 108 unitary authority/counties, for the period Oct – Dec 2013 to Oct – Dec 2014, analysed by quartile, based on average house prices.
Quartile Price range Average price change
over the year Last month’s equivalent price
change over the year
1st Quartile £0 - £152,035 2.1% 2.9%
2nd Quartile £152,035 - £187,221 4.5% 5.2%
3rd Quartile £187,221 - £249,157 6.8% 7.4%
4th Quartile Above £249,157 9.5% 10.7%
Monthly Trends
Turning now to monthly as opposed to annual trends, the headline rate for prices in England & Wales in December 2014 shows a fall in average prices of -0.3%, down 0.4% from the +0.1% one month earlier. This is the first time that the monthly national rate has been negative in the last eighteen months. The fall in the monthly rate of -0.3% reverses to a positive +0.2% increase in average prices if London and the South East are excluded from the national figures. This is not such a rare event as

London boroughs, Counties and unitary authorities
14
might at first be anticipated, with a similar reversal of negative monthly prices being observed in August 2012, with London and the South East excluded from the figures.
In December, there were price rises over the month in 62 unitary authorities and falls in 46. The similar figures for November were 58 authorities with price rises and 50 with price falls. Hence, excluding the Greater London boroughs, prices rose in December in 57% of the unitary authorities in the country, despite the headline annual rate having fallen in the month.
Highest and lowest unitary authorities
Looking at the unitary authority areas on an individual basis, Rutland tops the league in terms of the highest price changes on an annual basis, but Rutland has very few transactions in a year, so its percentage change in house prices tends to be volatile. Rutland is followed by Slough (+18.3%) which has appeared in our listings of the highest performer in terms of annual house price change in each of the last three months. As we reported last month, flats are the most popular property type in Slough, having increased from 120 units sold in the three months October 2013 – December 2013 to 225 units sold in the same three months of 2014. The average price of a Slough flat has risen from £145k to £175k over this same period.
By way of contrast, the area with the largest reduction in annual prices is Swansea, down 4.1%. In Swansea, it is detached properties that have seen the largest fall in prices, down from an average £240k in October – December 2013 to £210k in the same three months of 2014.
Transactions
In terms of transactions, looking at the three months October 2014 to December 2014 and comparing with the same three months in 2013, 44 of the 108 unitary authorities in England & Wales have seen a decline in sales volumes over the period, compared to just eighteen last month. The area with the largest decline in transactions over the period was Redcar and Cleveland, down 14.7%, with a 20% decline in the number of detached and semi-detached properties being sold.
The area that recorded the highest increase in transactions of any English or Welsh unitary authority was Leicester, up by 41%, with the sale of terraced properties increasing by 50% over the year. The increase in property sales in the area is likely to have been assisted by the recent development of a former shoe factory into terraces and apartments, with the purchasers being aided to move into this site by the Government’s Help to Buy scheme.

Regional data table
15
Table 9. Average house prices by region, January 2014 – January 2015, with monthly and annual % growth link to source Excel
Av HP %monthly %annual Av HP %monthly %annual Av HP %monthly %annual Av HP %monthly %annual
Jan-14 £147,265 1.7 4.0 £158,983 0.8 3.6 £170,750 2.1 5.1 £181,462 0.7 4.2
Feb-14 £148,749 1.0 4.0 £159,665 0.4 2.5 £171,990 0.7 4.6 £183,026 0.9 4.1
Mar-14 £150,477 1.2 4.6 £160,716 0.7 3.5 £173,429 0.8 5.9 £183,646 0.3 5.0
Apr-14 £149,017 -1.0 3.7 £160,208 -0.3 3.3 £172,860 -0.3 5.6 £183,695 0.0 5.4
May-14 £149,643 0.4 5.3 £161,666 0.9 4.8 £173,113 0.1 6.5 £183,661 0.0 6.1
Jun-14 £148,849 -0.5 3.6 £161,407 -0.2 3.8 £173,622 0.3 5.9 £184,215 0.3 5.4
Jul-14 £148,706 -0.1 3.1 £162,447 0.6 4.0 £175,128 0.9 6.7 £186,141 1.0 6.1
Aug-14 £148,953 0.2 2.8 £163,493 0.6 4.2 £176,298 0.7 7.2 £187,815 0.9 6.2
Sep-14 £148,119 -0.6 2.8 £164,855 0.8 4.4 £177,543 0.7 6.8 £188,072 0.1 6.0
Oct-14 £149,218 0.7 3.5 £165,286 0.3 4.5 £177,213 -0.2 6.4 £189,433 0.7 6.2
Nov-14 £148,683 -0.4 3.4 £164,636 -0.4 4.3 £177,458 0.1 5.9 £189,719 0.2 6.0
Dec-14 £149,205 0.4 3.0 £164,626 0.0 4.3 £177,220 -0.1 5.9 £190,339 0.3 5.6
Av HP %monthly %annual Av HP %monthly %annual Av HP %monthly %annual Av HP %monthly %annual
Jan-14 £158,138 0.5 3.5 £161,357 0.5 3.6 £233,063 0.5 3.6 £212,826 1.0 3.9
Feb-14 £159,748 1.0 3.3 £161,542 0.1 3.9 £235,430 1.0 4.0 £214,745 0.9 2.7
Mar-14 £159,591 -0.1 3.7 £162,570 0.6 4.1 £237,952 1.1 5.4 £219,943 2.4 5.6
Apr-14 £159,287 -0.2 3.7 £162,704 0.1 3.7 £240,442 1.0 6.3 £221,631 0.8 5.7
May-14 £158,131 -0.7 3.7 £163,149 0.3 3.9 £240,637 0.1 6.6 £223,734 0.9 7.6
Jun-14 £159,430 0.8 5.0 £163,067 -0.1 3.6 £240,040 -0.2 6.5 £224,232 0.2 7.5
Jul-14 £159,451 0.0 4.6 £163,304 0.1 4.1 £240,988 0.4 6.3 £225,275 0.5 7.6
Aug-14 £161,535 1.3 5.3 £164,206 0.6 3.7 £244,126 1.3 6.5 £227,283 0.9 8.2
Sep-14 £161,833 0.2 4.1 £165,229 0.6 4.1 £245,647 0.6 6.5 £226,868 -0.2 7.9
Oct-14 £163,308 0.9 4.1 £166,495 0.8 4.0 £246,296 0.3 6.7 £228,061 0.5 8.6
Nov-14 £163,183 -0.1 4.2 £167,421 0.6 4.9 £245,781 -0.2 6.8 £226,353 -0.7 7.0
Dec-14 £163,510 0.2 3.9 £167,886 0.3 4.6 £246,446 0.3 6.2 £226,237 -0.1 7.3
Av HP %monthly %annual Av HP %monthly %annual Av HP %monthly %annual
Jan-14 £298,096 1.2 6.1 £520,343 2.9 13.6 £258,548 1.5 7.1
Feb-14 £302,020 1.3 6.5 £524,852 0.9 13.8 £261,003 0.9 7.2
Mar-14 £304,865 0.9 6.9 £532,024 1.4 13.4 £263,716 1.0 7.8
Apr-14 £307,168 0.8 7.3 £537,989 1.1 14.4 £265,340 0.6 8.2
May-14 £310,100 1.0 8.2 £552,257 2.7 17.1 £268,387 1.1 9.5
Jun-14 £313,376 1.1 9.7 £567,096 2.7 20.4 £271,332 1.1 10.7
Jul-14 £316,135 0.9 10.2 £568,960 0.3 20.1 £272,856 0.6 10.8
Aug-14 £318,377 0.7 10.9 £572,361 0.6 19.1 £274,883 0.7 10.9
Sep-14 £319,687 0.4 11.2 £577,312 0.9 18.6 £276,377 0.5 10.8
Oct-14 £320,685 0.3 10.9 £580,680 0.6 18.0 £277,593 0.4 10.6
Nov-14 £321,419 0.2 10.7 £582,259 0.3 16.8 £277,882 0.1 10.2
Dec-14 £321,283 0.0 9.1 £576,093 -1.1 13.9 £277,164 -0.3 8.9
Jan-15 £277,857 0.3 7.5
North North West East Midlands West Midlands
South East Greater London ENGLAND & WALES
Wales Yorks & Humber South West East Anglia

Footnotes on data and methodology
16
1. LSL Acad E&W HPI is derived from Land Registry (LR) house price data, seasonally and mix adjusted by property type. © Crown copyright material reproduced with the permission of Land Registry. The prices are smoothed to show underlying trends. LSL Acad E&W HPI includes cash purchase prices and is the only index based upon the complete, factual house price data for England & Wales, as opposed to a sample.
2. Most indices employ data available to the provider as result of its business; index methodologies are designed to exploit the advantages and overcome the disadvantages of each particular dataset; a valuation series (whether the values are professionally estimated at e.g. time of mortgage offer or by an estate agent) is not the same as a price series; price series (LSL Acad E&W HPI, ONS HPI and LR HPI) can be prepared only when the prices at which properties have been transacted have been recorded by the Land Registry (LSL Acad E&W HPI and LR HPI) or when firm prices at mortgage completion (ONS HPI) have been made available by lenders; valuation series can be prepared whenever the data (e.g. asking or mortgage offer prices) are available to the provider; publicity accrues to those indices which are released first; indices published at or before month end are likely to employ data for the current and prior months.
3. Typically, only some 38% of transactions are reported to LR at month end. LSL Acad E&W HPI overcomes this delay with an “index of indices” forecasting model, purpose developed by Dr Stephen Satchell Economics Fellow Trinity College Cambridge and Dr George Christodoulakis, then at the Sir John Cass Business School. LR HPI relies on the sample being reflective of all of the month’s price changes and uses c.40% of these (say c.9,000 price changes) being the prices of properties for which two prices are recorded on the Land Register and a repeat sales regression methodology based on work published by USA academics, notably for the USA S&P Case Shiller HPI. RSR was developed to prepare indices for single family homes using only the limited data volumes available for metropolitan districts, since the USA lacks a central Land Registry. LSL Acad E&W HPI, LR HPI and ONS HPI are published monthly in this order.
4. LSL Acad E&W HPI provides prices at national and regional level back to 1995 and, at county/London borough level, back to 2000; back-cast national prices for graphing are available to 1987. With only some 60,000 monthly transactions now occurring compared with at least 100,000 in past markets, reduced data volumes are a problem for every HPI. LSL Acad HPI employs not only the above “index of indices”, but also a series of auto regression and averaging models. The latter use a rolling 3 months of data to provide an average price for each month to show trends, as mentioned above. After the elapse of one month, LR provides c.88% of the transactions for the prior month, used to replace the initial LSL Acad E&W HPI “forecast” with a first LSL Acad E&W HPI “updated” result. Two months after any given month, LR provides c.96 % of the month’s transactions, sufficient to enable us to describe our next update as an LSL Acad E&W HPI “final” index, closely approximating the LSL Acad E&W HPI “ultimate” results; LSL Acad E&W HPI “ultimate” includes the price of virtually every single LR transaction for the month, smoothed, seasonally and mix adjusted; the LSL Acad E&W HPI “updated” now uses c.37,000 real transactions for the month (as well as, by smoothing, c.40,000 transactions for the prior month); LR HPI also provides an updated LR “latest” HPI shown in our monthly Comparison of Indices table. ONS HPI with, in 2013, c. 28,000 mortgage completions (and the Rightmove asking price index) are also based upon significant data volumes; lender HPI data volumes are not quantified; the Halifax HPI employs three month smoothing for annual but not for monthly change results; Hometrack provides survey data and specifies that theirs is a survey, not an index.
5. In each of the 10 regions, an average of only some 6,000 transactions now occur monthly; hence, we wait one month, pending receipt from LR of the c.88% sample and provide monthly results one month in arrears of the most recent month. In our Regional data table, red data represent LSL Acad E&W HPI “forecast” results, blue data represent LSL Acad E&W HPI “updated” results and black data represent the LSL Acad E&W HPI “final” index.
6. At county and London borough levels, c.60,000 national monthly transactions, spread over 10 regions and 108 counties and 33 London boroughs, provide an average of only c.425 house prices monthly within each sub-district. Even delayed one and smoothed over three months, LSL Acad E&W HPI is indicative until we are able to publish the LSL Acad E&W HPI “final” index using the LR 96% sample. LSL Acad E&W HPI data are calculated on a consistent basis from county and London borough through to region and ultimately to national level; at every level, the current month price represents the average of the prices for the current month and for the prior and subsequent months (“three month, centre month smoothed”). LR employs a “four month, end month smoothed”, process for county/London borough data, but not for national and regional results.
7. Data limitations are not confined to volumes. LSL Acad E&W HPI and the LR HPI are unable to identify different prices according to e.g numbers of bedrooms; the lender hedonic indices and the ONS mix adjusted HPI do so. LR data exclude commercial and, thus auction sales and do not reflect repossession prices on the grounds that such prices do not reflect those between a willing buyer and a willing seller; some feel that auction prices represent true market prices; others believe that the repossession prices do not.
8. LSL Acad E&W HPI is prepared from Land Registry data using a methodology designed to provide a “true measure of house price inflation”; Acadata does not guarantee the accuracy of the LSL Acad E&W HPI results and Acadata shall not be liable for any loss or damage, whatsoever, consequential upon any error, incorrect description of or inadequacy in the data; persons using the data do so entirely at their own risk; LSL Acad E&W HPI is freely provided for publication with due attribution to Acadata. Permission is required for any commercial use of the data.
9. The monthly, smoothed, average Land Registry prices at regional, county and London borough level by property type, which underlie LSL Acad E&W HPI, together with historic data, are available from Acadata as in page 5 NOTE 7 above.
10. LSL Acad E&W HPI was published under the name FTHPI from September 2003 until December 2009. Until the October 2013 LSL Acad E&W HPI was published, it was prepared by Acadametrics. Acadametrics then changed its name to Acadata to reflect its new focus entirely upon house price indices and data following its agreement to sell its 50% holding in MIAC Acadametrics to MIAC Analytics over a 4 year period.
[email protected] © Acadata Limited
Note to editors
17
LSL PROPERTY SERVICES PLC
LSL is one of the leading residential property services companies in the UK and provides a broad range of services to a wide range of customers including mortgage lenders together with buyers and sellers of residential properties.
LSL’s operations cover four key areas; surveying, estate agency, corporate services and financial services.
Surveying
LSL’s surveying business operates under the e.surv Chartered Surveyors brand, and the Walker Fraser Steele brand in Scotland. e.surv is one of the largest employers of residential Chartered Surveyors in the UK and is the largest distributor and manager of mortgage valuations and private surveys.
Estate Agency
LSL’s estate agency business operates under the Your Move, Reeds Rains, Intercounty and several independent brands. Your Move is the single largest estate agency brand in the UK.
In January 2010 the acquisition of the Halifax Estate Agency (HEA) business from Lloyd Banking Group saw LSL increase in size to become the second largest UK estate agency network - with around 570 branches. It is also the largest letting agency in the UK.
Corporate Services
LSL Corporate Client Services was launched in 2008 to provide asset management and lettings property portfolio management services to corporate clients. This business has grown through the addition of St Trinity Asset Management - which previously operated as HEA Corporate Services - and Templeton LPA, which LSL acquired in February 2010.
Financial Services
LSL offers financial services across its entire branch network. In May 2010 LSL acquired over 450 advisers from leading financial services network Home of Choice - these advisers now operate under the brand of First Complete.
In October 2010 LSL also announced the acquisition of mortgage distribution company, Advance Mortgage Funding Limited (trading as Pink Home Loans) and its subsidiary business BDS Mortgage Group Limited, (together known as Pink), from Skipton Building Society. It further confirmed LSL’s position as one of the largest mortgage advisory businesses in the UK today.
For further information see www.lslps.co.uk