
LSI MegaRAID Configuration for the LSI 1068 Controller - Supermicro

1111
MICHOCOr'Y SOLUT ION [LSI. CHAN Ir+Arnirvq LJIiii cr IV6.4 A

RE E
RD 128 025 JC 760 461
/MOOR Alfred, Richard L.; And OthersTITLE Profile Characteristics of Entering Students-
1975.INSTITUTION New York City Community Coll,- Brooklyn, N.Y.PUB DATE Jal 76NOTN 90p.
BURS PRICE MF-$0 83 HC-$4.67 Plus Postage.DESCRIPTORS *college Freshmen; College Students; Comm nlry
Colleges; Comparative Analysis; *Demography;Enrollment Trends; *Junior colleges; *Junior CollegeStudents; Negro Students; *Student Characteristics;Surveys; Urban Population; Urban SChools
IDENTIY!ERs Comparative Guidance and Placement Program; New Yorkcity Community College
ABSTR CTDesigned as a profile 'summary of personal,
demographic, intellective, ani motivational characteristics ofcommunity college students, this report describes the studentpopulation of New York City Community College (MCC). The data inthis report are predicated on the Biographical Inventory of theComparative Guidance and Placement Program which was administered tostudents applying_for admission to NYCCC during fall 1975.Approximately 4,498 potential students completed and returned usableinventories. This study had twobasic purposes: (1) description andanalysis of the characteristics of entry-level students in amulti-campus urban community college, and (2) examination of thatpopulation in comparison with a nationwide sample of first-timestudents enrolled in_100 comprehensive two-year colleges, and incomparison with previous student populations entering NYCCC. A totalof 42 student characteristics are described in this report with thedata for each measuredcharacteristic reported in am appendix. Thesocioeconomic backgrounds and career interests of students enteringMCC clearly differentiate them from students entering four-yearcolleges and from those who do not attend college.,Because MCC'sstudent population is.rapidly changing, research on thecharacteristics of its students should be:a continuing effort.(JDS)
************! 1******* ******- ***** *************#****************Documents acquired by ERIC include many informal unpublished
* materials not'available from other sources. ERIC makes every effort ** to obtain the best copy available. Nevertheless, items of marginal **- reproducibility are _often eucountered and this affects the quality ** of the microfiche and hardcopy reproductions ERIC makes available, ** via the ERIC Document Reproduction Service (EDRS). EDRS is not ** responsiblefor the quality of the'original document.Reproductions *4g:supplied by EDRS are the best-that cam be made from the original.***********************************************************************

PROFILE CHARACTERISTICSOP ENTERING STUDENTS
Fall 1975
Richard L. Alfred, Ed. D.
Jeanne Ganmel, Ed. D.
Roberta Rettner, B.A.
Joseph Heredia, B.A.
NEW YORK CITY commuNirr COL -_EGEOffice of Educational Reseatch
and Development
Richard L. Alfred, Directo
Joseph Heredia, Research Assistant
Roberta Rettner, Research Assistant
Gilda Antman, Secretary
July 1976
2
UL OMPARTMRNT OF RIERLyR.EDUCATION A WELFARENATIONAL INSTITUTE OF
IDUCATION
THIS DOCUMENT HAS BEEN REPRO.DUCEO EXACTLY AS RECEIVE° FROMTHE PERSON OR OROANIIP -;ON ORIGIN.ATINO IT POINTS OF VIEI OR OPINIONSSTATED DO NOT NEcEssA,III,T REPRE.SENT OFFICIAL NATIONAL ' JITITUTE OFEDUCATION PUSITION OR POLICY

ABST- IUCT
An important segment of research in higher education in-
volves the description of characteristics of students enrolled
in community colleges. The data in this report are predicated
on the Biographical Inventory of the Comparative Guidance Pro-
gram which was administered to student5 applying for admission
to the College during Fall semester 1975. Approximately 4,498
potential students completed and returned usable inventories.
The study was guided by two basic purposes: 1) to describe and
analyze the characteristics of entry-level students in a multi-
campus urban community college and 2) to examine the entering
studen- population in context with other populations in a na-
tional sample of two-year institution- and in context with
previous entering student populations in New York City Co_T-
munity College.
Although administ ative efforts to develop a single compre-
hensive data bank on student charact- istics are usually expensive
and fraught with problems, this study represents a systematic ap-
proach to profile analysis of the qualitative dimension of stu-
dent enrollment in New York City Community College. This dimension
relates profile characteristi-s of entering students to their dis-
tinctive college subgroups.
The study begins with the presentation of a model for class
fication and analysis of student characteristics data in com-
munity colleges. Longitudinal and cro --sectional studies of stu-.
dent characteristics require four classes of data: 1) basic clas-
-
iii

si ication data (sex age, race, enrollment status, etc.
2) demographic data (parental occupat on, family income,- level
of education); 3) intell Adve data (grade point average, ap-
titude test scores, incidence of poor grades, et ,and 4) per-
ceptual-attitudinal data (major reasons for attenaing college,
need for college services, degree objectives, career plans( etc.)
A total of 42 student characteri tic variables are described in
this report. Thewe variables are grouped according to the following
scheme:
Basic Clas ification Variables. General descriptivevariables having primary reference to routine class-
ification of the entering student population (age, sex,
enrollment status, class level, etc.).
Day/Evening Enrollment DistributionOrigin of EnrollmentSexAgeRace and Ethnic OriginMarital StatusType of High SchoolSize of Graduating ClassInception of StudyCurriculum Choice
9fmographic Variables. Socioeconomic variables repre-
sentative of the-stratification of the entering stu-
dent population (income.of parents, occupation of
father, level of education of parents, place of home
residence, etc.).
ResidenceCommuting Distance to CampusMode of TransporationPlans for EmploymentHours of EmploymentFamily IncomeSiblings Dependent on Parents for Support
Supplementary Family IncomeFinancial Dependence of Students
4
iv

Father's OccupationMother's OccupationFather's EducationMother's Education
Intellective Variables. Achievement variables r pre-sentative of the high school performance of theentering student population.
High School Grade Point AverageFinal High School Grade in EnglishFinal High School Grade in MathHigh School Scholastic HonorsTermination of Study in Other ins it tions
Perceptual-Attitudinal Variables. Attitudinal variablesdescriptive of the social psychological sector of stu-dent relationships with the college environment (e.g.,reasons for college selection, career objectives, degreeobjectives, future enrollment plans, etc.).
Reasons for College SelectionDegree ObjectivesStability of Curriculum ChoicesPlans After CollegeTransfer CurriculumImportance of GradesNeed for Assistance in ReadingNeed for Assistance in Developing Study TechniquesNeed for Assistance in Finding EmploymentNeed for Assistance in Locating HousingNeed for Financial AidNeed for Counseling about Educational and
Vocational PlansNeed for Counseling about Personal ProblemsFuture Enrollment Plans
The soci economic backgrounds and career interests of stu-
dents entering New York City Community College clearly differentia-
them from students who enter four-year colleges and from those
who do not attend College. Students enrolling in the College
were likely to have come f om families in which Cx t,..! or both
parents had not completed a high school education and with a
combined family income at poverty level or below. Not only were
many parents poorly educated and financially disadvantaged, b-t
they also were employed primarily in semi-skilled and unskilled
occupations.
Because the student-parent relationship seems so obviously
related to college attendance and persistence, it is of interest
to note that many students came to the College with pre-established
curriculum choices, employment plans, and traAsfer goals. Almo-t
half the potential entering students selected New York City Com-
munity College for its strength in specific career fields and its
academic reputation. As a group, they demonstrated strong interest
occupational curricula; in pursuing their education on a con-
tinuous basis; and in availing themselves of the academic and stu-
dent services offered by the College. The only area in which they
indicated a lack of interest was the personal counseling ser_ice
offered in various divis-ons.
The characteristics of students described in this study are
necessarily influenced by the philosophy, objectives and =age
of New York City Community College. Many events have happened
to alter the nature and aims of the College since its founding
in 1946. The regional population has grown rapidly, the demand
for college opportunity has increased in the face of new
social needs, and the fiscal crisis has mandated significant re-
ductions in the educational program. While the conventional liberal
arts program continues to be a vital part of the College, new
emphasis has been placed on occupational programs that prepare
students to fill positions in business, industry, government,
6
vi

social service, and other areas essential to the technological
development of New York City. The importance of education for
the remedi tion cf learnino deficiencies has also played an
important role in the affairs of the College although this
role has been constricted by recent cutbacks.
It is critically important to understand the character-
istics of students enrolling in New York City Community College
but it should be remembered that this population is rapidly
changing. Research on the characteristics of college students
should, therefore, be a continuing effort.
vii

LIST oF TABLES
Table
1
2
4
Day/Evening Enrollment Distribution.... . .
Origin of Enr011ment ... ...
....Sex. .. ................ 0.00 .
Age Distribution...................... . 00 . 0 .. 00.00
Page
40
41
42
43
5 Race............................." ......... ..... . 44
6 Typo of High School........ 0040.......... . 0 45
7 Size of Graduating class.-- . . .. . . ..,.. ... ...... 46
8 Inception of Study..... . . .. ... ... ......tme.... 47
9 Marital Shatus..._.. 48
10 Major Field Selection........... .. .. . .6000000.6 49
11 . a.* 51
12 commuting Dista 06..0 060.0.000.000 52
13 Mode of Transportation. .. ............. . . . 53
14 Plans for Employment.-- . . . .. . ............ 54
15 Hours Worked........ 55
16 Family Income ........ ....a..06..... 56
17 Siblings Dependent on Parents for Support......... 57
18 Supplementary Family Income .... ..58
19 Financial Independence from Parents... . . .. 59
20 Father's Ocoupation -...................... 60
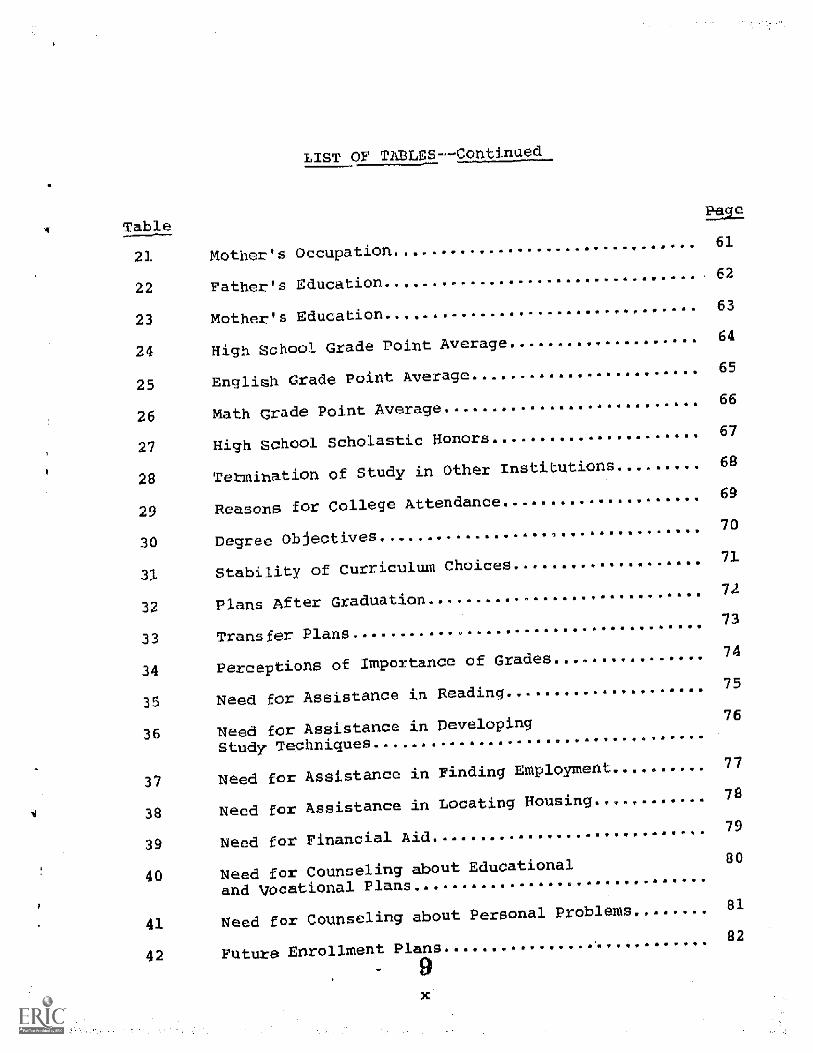
LIST OF PALSS--Continued
Table
21
22
23
24
Mo her's Occupation..........
Father's Education...... 000*. ## . ***.*****.........
Mother'sEducation................ . ............. .
High School GradePoint Average........ ....... .. . . .
61
62
63
64
25 Englih Grade Point Average.- . ..... . . . . . 65
26 Math Grade Point Average............ .. ... 49.0900946 66
27 High SchoolScholastic Honors. ...... ........ . . . . . 67
28 Termination of Study in Other Institutions 68
29 Reasons for College Attendance69
30 Degree Objectives... ..... ..........,70
31 Stability of Curriculum Choices, 71
32 Plans After Graduation72
33 Transfer Plans... . .. .. 909 49.9.9900990.0 9 94 73
34 Perceptions of Importance of Grades.... ..... . .. 74
35 Need for Assistance in Reading75
36 Need for Assistance in Developing76
StudTechniques....................... . .. . ..,. ... .
37 Need for Assistance in Finding Employment 77
38 Need for Assistance in Locating Housing......... .. 78
39 Need for Financial Aid..... ...... .. .79
40 Need for Counseling about Educational
and VocationalPlans............................. . .
80
41 Need for Counseling about Personal Problems........ 81
42 Future Enrollment Plans82
9

1
Beginning with the Fall semester 1974, the Office of Edu-
cational Research and Development has tabulated summary data
pertaining to the characteristics of full-time and part-time
students entering New York City Community College. This report
is one in a sequence of reports designed to systematically
analyze and interpret student data to college staff. Its ob-
jective is to present information in a format comparable to
previous year reports to contrast consecutive entering classes
over a two-year period--1974 through 1975.
hod
Designed as a profile summary of personal, demographic,
intellective and motivational characteristics of college stu-
dents, the report describes the student population, In parison
with a national sample of first-time students enrolled in one
hundred comprehensive public two-year colleges. Datawere available
for both groups not only on the Comparative Guidance and Place-
ment Test battery (CGP) but also on a Biographical Inventory from
which the data in this report are derived. It should be noted
that there are limitations in the data presented. First, the
New York City Community College student population is comprised
of potential entering s udents In Fall 1975. Of the 4,498 students
who took the CGP battery, 2,934 (65 percent) actually enrolled
in the Fall of 1975. Second, no description of the national
sample of two colleges using the CGP was available in terms
of their size, location, racial composition, average fees, etc.
10

Por these reasons, the analyses made in this study should be
interpreted with caution.
DeScri-tion of Variables
A total of 42 student characteristic variables are de
scribed in this report. These variables are grouped into four
classes and are described as follows:
Basic Classification Variables: General descriptivevariables having primary reference to "routine"classification of the potential entering studenpopulation (i.e., age, sex, enrollment status, race,cu riculum, marital status, etc.).
Demo raphic Variables: Socioeconomic variables des-cribing selected f-ea-Eures of the socioeconomic statusof the entering student population (i.e., familyincome, parent's occupation, parent's education, placeof residence, siblings in family, etc.).
Intellective. Variables: Achievement variables such as--E_e-itance of potential'students en-rolling in New York City Community College (scholastichonors, incidence of poor grades, etc.).
Perce tual7Attitudinal.Variablesr Attitudinal variablesdescribing- StUdent needd in relationship to the collegeenvironment (reasons for college-selection, degree ob-jectives, future enrollment plans, need for counselingetc.).
Profile Data Analyses
The 1975 Entering Student Characteristics Report examined
each of 42 variables one at a time for the total population and
two sub-populations (male and female). Percentage distributions
are tabulated and the results presented in a series of tables
included in the Appendix. The general format consists of a brief
discussion of observed trends and comparisons with the national
sample and the previous year entering class.
During t e Fall semester 1975, 4,498 new students appl-
ied for admission to New York City Community College and com-
pleted usable CGP inventories. Table 1 presents the enrollment_
di_stri.bution for the total student body at New York City Com-
munity College during Fall semester 1975 by sex and enrollment
status. The data indicate that three-quarters of the day stU-
dents enrolled in transfer programs were females while males
were more heavily represented in the career programs (63 percent).
A similar trend is observed in the evening division.
Approximately 58 percent of all full-time students were
male whereas 42 percent were female. Among full-time day stu-
dents, 56 percent were male while 44 percent were female. Women
comprised 61 percent of the part-time day population while men
made up the majority (56 percent) of the part-time evening
population. Altogether 53 percent of the part-time students
were male while 44 percent were female.
Table 2 presents data describing the aLaLa_af_zuleilazaL
of stude ts entering New York City Community college during Fall
semester 1975 according to various programs of admission (i.e.,
University Application Processing Center , processed by the
College, College Discovery, and Education Assistance Program
The University Applicat on Processing Center accounted for 86
percent (2,534) of the total entering freshman class of 2,934.
Alternate forms of admission accounted for 400 or 14 percent of
the entering students. These data indicate that student en-
rollment in community colleges of the city University of New York
is a function of student admission into particular colleges based

on geographical location, curriculum specialization and available
space and not on unrestricted college selection.
Basic Clagslfica
classification variables
'enables. The primary utility of basic
age, race, sex, enrollment status,
marital status, etc.) rests in their reporting value to agencies
of regional, state and federal government. Every institution must
describe its student population in some basic way and New York
City Community College is not an exception. Seven variables sug-
gested by the Higher Education General Information System (REGIS)
are considered in this report.
The sex bi-sakdowil_ of the entering student population is
presented in Table 3. Of the total nutber of responding students
(N=4,498),54 percent were male and 45 percent were female. A
number of students (48) did not indicate a sex designation. This
distribution compares favorably with the previous year population,
the only difference being a three percent reduction in- the pm-
portion of women entering New York City Community College in
1975 (45 percent) as compared to 1974 (48 percent). The national'
CGP population contained a greater percentage of women (53 percent)
and a smaller proportion,of men (46 p rcent) in comparison with
local students.
The data in Table 4 indicate that the a_crip di_s_tTi_bon of the
potential entering students has changed appreciably in the
past year. Approximately 60 percent of the entering freshmen in
*The_CGP national population is camprised of 68,238 studentstaking the CGP and enrolled in one-hundred public two-yearcolleges.

1975 were 20 years old or less while the proportien in 1974 was
69 percent. No national data were available for-age comparisons
but projected data indicate that many more students enter New York
City Community College direct from high school than is character-
istic of the national population (Table 4). Sixty percent of the
local students entered college directly from high school while
the national rate was 44 percent. New York City Community Col-lege, because of its urban location, its flexible entrance re-
quirements, and its low fee policies, may offer students a
more accessible education thereby enhancing its ability to draw
large numbers of recent high school graduates.
The concept of race has been largely ignored in the literature
on higher education. A basic classification variable, race has re-
search application in this study because of the changing demographyof the New York City metropolitan area. The data in Table 5 reveal
that 32 percent of the potential entering population was Black,
28 percent white, 14 percent Puerto-Rican, 4 percent Spanish sur-name, 4 percent Oriental, and 18 percent were unclassified. Com-
parison with national data indicates that New York City Community
College is somewhat unique in its minority composition; 20 percent
of the students in the national population were Black, 64 percent
were white, and 2 percent Puerto-Rican.
Between-year comparisons for 1974 and 1975 reveal only
moderate changes in the racial distribution of students. In 1975
there was a one percent increase in the proportion of Black,
Puerto Rican and Oriental students and a one percent decrease in
the proportion of white students. The greatest con tration of
14

race and e hnicity occirred among women studnt as 39 per
were Black, and 24 percent were classified into ethnic categories--
figures which represent a substantial increase over the previous
year. Minority representation among males remained stable with
26 percent Black and 21 percent classified into the Spanish
surname, Puerto-Rican and Orien al categories.
An unusually heavy burden of universal access now falls,
and will continue to fall, on New York City Community College.
It has varied programs and appeals to a wide variety of students.
Its geographical dispersion makes it a readily accessible In-
stitution for many students. Little is known, however, about the
types of secondary schools students attended or the size of the
graduating senior classes in regional secondary schools.
Table 6 presents data describing the .542LE_ELJILLIL
schools students attended prior to their enrollment in New York
City Community College. The majority (63 percent), of entering
freshmen attended publi- secondary schools, 8 percent att nded
denominational schools, and 9 percent completed a GED program.
rn comparison with 1974 data, a shift is observed in the types
high schools attended by potential entering students. A decrease
of two percent was demonstrated for public high school graduates
while GED graduates increased by 2'percent. The decline it public
school graduates was primarily accounted for by males (-3 percent).
The distribution of entering women did not change. The percentage
of "denominational" high school graduates remained approximately
the same for both men and women. Males from catholic schools
15

increased by 1 percent while women remained constant. P. 3 percent
increase in male equivalency diploma students was matched by
a 2 perc nt increase among women. Of those who "did not graduate",
the proportion of males remained the same while women increased
by one percent.
It is generally believed that students attending urban
community colleges originate, for the most part, in public
secondary schools. The data in this study do not support this
belief. Comparison with national CGP data reveals that more
students in the national population attended public secondary
schools (71 percent) than students in the local popUlation
(63 percent). Differences were also apparent in the 21422..E
the graduating class for each population Twenty-eight percent
of the local population came from graduating classes of 500 or
more as contrasted to 21 percent for the national population
(Table 7). Between-year differences were almost inconsequential
as 65 percent of the potential entering students attended
public high school and 29 percent graduated in a class of 500'
or more students. These data would seem to indicate a comparatively
strong commitment to private secondary education among regional
community college students and an educatienal background marked
by early exposure to complex educational structures that are
part of urban secondary education in New York City.
The smooth flow of students between high school and
college was a predominant trend throughout the 1960's. During the
70's, however, this trend has turned toward a pattern of dis-
continuous enrollment with students more often initiating
16
'enrollment in the middle or in sammer semesters of the academic
year. Table e reports the percentage distribution of students
holding various plans for Inception of study. The majority
(81 percent) planned to begin their studies in Fall semester
1975 or later. This compares to 78 percent of students in the
national population initiating study during the Fall and Winter
semesters of the academic year. Between-year comparisons were
not possible since response options were not updated between
consecutive entering classes.
Discontinuous patterns of enrollment between high school
and college can be explained in part by the family background
of first-time student8. Previous research has shown that many
students marry directly after high school and thus postpone
their college plans to a later point in'life (Trent and Medsker,
1968 and Cross, 1972). The findings in this study pertaining
to ms:rital status (Table 9) were consistent with this trend.
Altogether, 10 percent of the entering students were married
and 76 percent were single, divorced or widowed. Among male
students, 8 percent were married and 79 percent were classified
into the "unmarried" category. The percentage of married women
was higher as 13 percent were married and 74 percent were un-
married. The national figures, somewhat to the contrary, show
70 percent of the total entering population was unma ried and
21 percent was married. Thus, some 11 percent fewer of the entering
New York City Community College students werema_ ried at the time
they begL.,1 their studies.

Comparison with the previous year data reveal relatively
over-11 changes except for a one percent increase in the total
number of married students. Interesting changes did occur among
males and females. A 3 percent increase was evidenced in the
proportion of married males while females, in this cat gory,
decreased by one percent. As would be expected, the proportion
of single men dropped by 3 percent while the non-response rate re-
mained stable at 13 percent of the total male population. The
proportion of single women increased by 3 percent while the non-
response rate decreased from 16 to 13 percent. As a group New
York City Community College freshmen were relatively young and
open to m--y ne_ life experiences.
One of the most important decisions made by students during
their college career i_ the selection of a inajo1 field. The
entering freshman class in New York City Community College ex-
hibited several distinctive characteristics in curriculum choice.
Table 10 reveals that approximately two-thirds (67 percent)
selected major fields representing occupational curricula in the
College. Twenty-three percent selected major fields in the
Division of Commerce, 29 percent in the Division of Technology,
14 percent in the Division of Allied Health and Natural Science
and 25 percent in the Division of Liberal Arts. Nine percent n
dicated a category of "other."
No national CGP data were available related to student cheice
f major field but data comparisons with other community colleges
revealed that an appreciably higher percentage of students en-
tering New York City Community College enroll in occupational
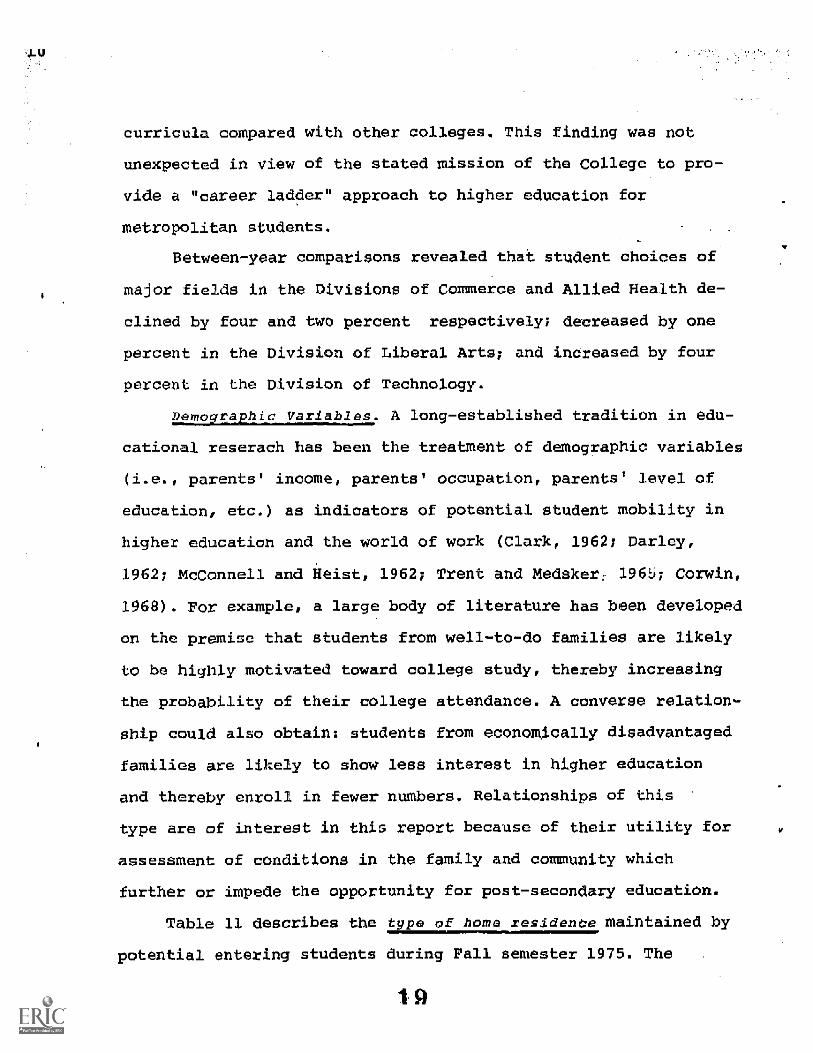
curricula compared with other colleges. This finding was not
unexpected in view of the stated mission of the College to pro-
vide a "career ladder" approach to highe- education for
metropolitan students.
Between-year comparisons revealed that student choices of
major fields in the Divisions of Coxmrierce and Allied Health de-
clined by four and two percent respectively; decreased by one
percent in the Division of Liberal Arts; and inCreased by four
percent in the Division of Technology.
224i2.2r4j A long-established tradition in edu-
cational reserach has been the treatment of demographic variables
(i.e., parents' income, parents' occupation, parents' level of
education, etc.) as indicators of potential student mobility in
higher education and the world of work (Clark, 1962; Parley,
1962; McConnell and Heist, 1962; Trent and Medsker 1965; Corwin,
1968) For example, a large body of literature has been developed
on the premise that students from well-to-do families are likely
to be highly motivated toward college study, thereby increasing
the probability of their college attendance. A converse relation-
ship could also obtain: students from economically disadvantaged
families are likely to show less interest in higher education
and thereby enroll in fewer nuMbers. Relationships of this
type are of interest in th _ report because of their utility for
assessment of conditions in the family --d community which
further or impede the opportunity for post-secondary education.
Table 11 describes the t pe of llome residence maintained by
potential entering students during Fall semester 1975. The
19

majority (65 percent) of students lived at home with their
parents while 16 percent lived in their own home or apartment.
The student population is partitioned into subgroups by sex.
Sixty-one percent of the female students lived with parents
while 69 percent of the men maintained a similar residence;
21 percent of the women lived in their own home or apartment
whereas the percentage for men was 11 percat; and 4 percent
f the women and men lived with friends or relatives. Prevlous
Ircar data reveal changes in two residence categories: the
number of students residing at "home with parents" and in their
"own home or apartment" increased by one percent between Fall
semesters 1974 and 1975. The proportion of students in the re-
maining categories remained the same.
In comparison, national figures show that 53 percent of
the students lived with parents while 30 percent lived in their
own home or apartment. The local trend for women to be more
highly represented in the "own home or apartment" category also
appeared among students in the national population of the women
32 pewcent. compared with 27 percent of the men maintained this
type of residence.
Findings of this type establish a clear distinction between
entering male and female students at both the local and national
levels. Although students enrolling in Naw York City Community
College tend to reside with parents more frequently than do
students in the national population, women in both groups
show a greater tendency to establish living arrangements
outside of the family than do men. The reasons for this
are unknown but it is possible that a relationship could
LZ
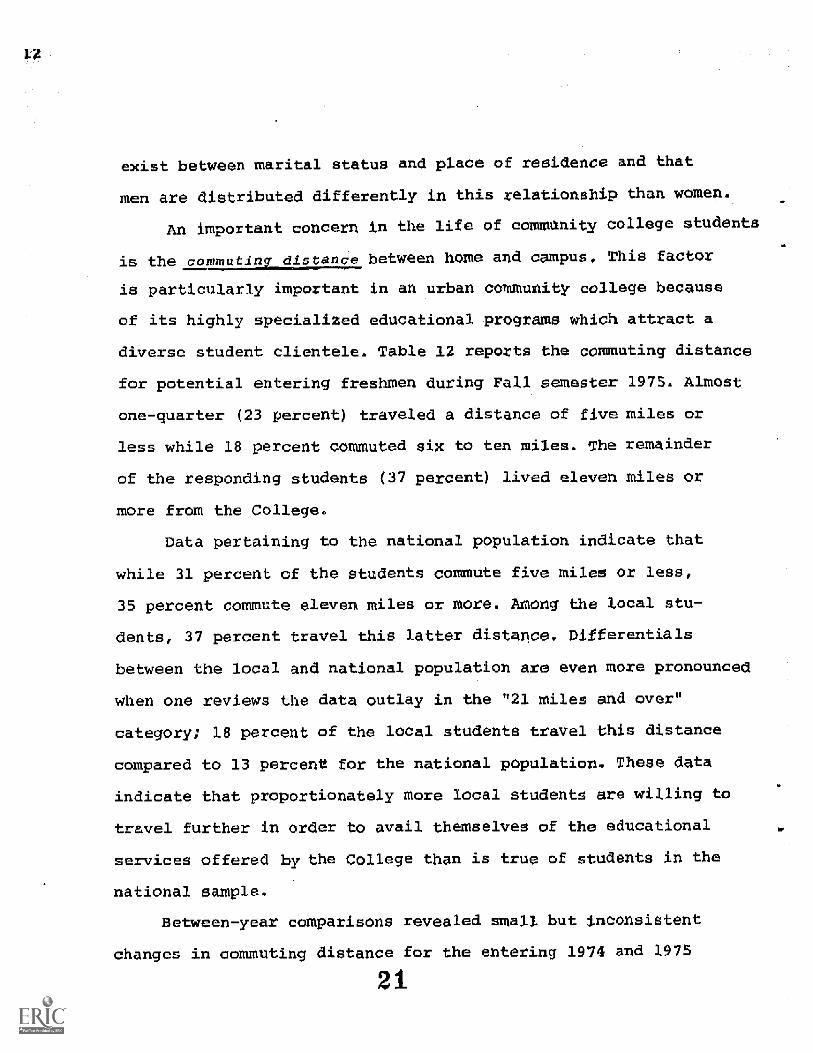
exist between marital status and place of residence and that
men are di tributed differently in this relationship than women
An important concern in the life of commanity college students
is the commut ng distance between home and campus This factor
is particularly important in an urban community college because
of its highly specialized educational programs which attract a
diverse student clientele. Table 12 reports the commuting distance
for potential entering freshmen during Fall semester 1975. Almost
one-quarter (23 percent) traveled a distance of five miles or
less while 18 percent commuted six to ten miles. The remainder
of the responding students (37 percent) lived eleven miles or
more from the College.
Data pertaining to the nati nal population indicate that
while 31 percent of the students commute five miles or less,
35 percent commute eleven miles or more. Among the local stu-
dents, 37 percent travel this latter distance. Differentials
between the local and national population are even more pronounced
when one reviews the data outlay in the "21 miles and over"
category; 18 percent of the local students travel this distance
compared to 13 percent for the national population. These data
indicate that proportionately more local students are willing
travel further in order to avail themselves of the educational
services offered by the College than is true of students in the
national sample.
Between-year compar sons revealed small but inconsistent
c anges in commuting distance for the entering 1974 and 1975
21

13
Fall semester classes. Increas s of one percent were observ d
in two categories--"two miles or le s" and "eleven to twenty
miles"--while a one percent decrease was observed in the "six to
ten miles" category. Among male students, declining percentages
occurred in the "three to five miles" and "non-response" categories,
while the "two miles or less" category increased and the remaining
categories remained stable. Women demonstrated a greater latitude
in responses as increases of one percent were noted in all
categories except the "six to ten miles" category (-1 percent)
and the "n n-response"category (-4 percent).
Table 13 presents data pertaining to the mode of tran ortation
used by potential entering students for travel to campus during
Fall 1975. As would be expected in an urban college, the majority
(81 percent) of students used public transportation. Variation
is observed bet een men and women as more women (84 percent)
traveled to campus by public transportation than men (79 percent).
Only 1 percent of the student population walked to campus.
National data contrast sharply with the local pattern. Seventy-
one percent of the students in the national population indicated
that they would travel to campus by automobile while 16 percent
would use public transportation. Private automobile was by far
the most important mode of travel for students in the national
sample.
Between-year local comparisons show relatively small changes
in the distribution of students in transportati n categories. Students
indicating travel to campus by "family car" and "public transportation"
22

14
increased by one percent in 1975 whereas students in the "walkin "
and "non-response" categories decreased by one percent.
An important concern among faculty and administrators during
the past decade has been the increasing number of students en-
rolling for part-time study. A fa tor which may at least partially
account for this trend is the emp1oznent plans of students
during college. The data in Table 14 indicate that 71 percent of
the potential entering Students planned to seek employment while
in college. This figure compares favorably with the national
percentage of 75 percen
Between-year local comparisons reveal that a trend is de-
veloping in the direction of decreased numbers of students plan-
ning to work during college. Uwe percent fewer of the Fall 1975
potential entering students indicated plans to work compared with
students entering in Pall 1974 (73 percent). Among males a de-
crease of two percent in the percentage planning to work was re-
corded betieen 1974 and 1975 while among females a decrease of
one percent was noted.
The number -orked varied among subgroups (Table 15).
Thirty-one percent of the men planned to work 21 hours per week
or more, whereas the p rcentage for women was 18 percent. As
might be expected, more women (62 percent) than men (49 percent)t
planned to work 20 hours or less a week. Fifteen percent of the
total population indicated no plans for work.
National CM) data indicate that a higher percentage of
students in the national population (18 percent) maintained no
plans for work in comparison with those in the local population.

15,
Additionally, many more students in the national group (16 percent)
indicated plans to work 30 hours per week or more while attending
college. The rate for the local population was 8 percent, far
below the national average. Women in both the national and local
groups worked, on the average, fewer hours than their male
counterparts. Their greatest concentration came in the "no plans
to work", "16 to 20 hours", and "non-response" categories. Men, on
the other hand, were more heavily represented in the "21 to 25
hours" and "more than 30 hours" categories.
Comparisons with previous year data reveal a pattern of in-
creasing student representation in the upper and lower ranges
of the work scale. Increases were noted in four catego ies:
"no work planned" (2 percent), "less than 6 hours"(1 percent
"6 to 11 hours" (1 percent) and "more than 30 hours" (1 percent).
A two percent decrease was recorded in the "26 to 30 hours"
category. The remaining categories either remained stable or de-
clined by one perrlent.
Interesting differences were apparent in the between-year
responses of male and female students. Among women there was a
6 percent increase in the proportion of those who did not plan
to work and a 3 percent decrease in those planning to work
"26 to 30 hours. " The proportion of men planning to work "21 to
25 hours" and "30 hours or more" increased by two percent while
those holding plans for "21 to 25 hours" of work decreased by
two percent. These data show a differential in work plans
according to sex and a trend toward increasing workloads among
men.

16
Table 16 reports the percentage distribution of LaaLig_LEE2E2
for pot ntial entering students during Fall semester 1975. Observing
the data, almost half (46 percent) are classified into five income
categories: "less than $3,000" (10 percent), "$3,000-5,999"
(14 percent) , $6,000-7,499" (8 percent) , "$7 500-8-999" (7 percent)
and '$9,000-10,499" (7 percent). Differences between male and-
female students were apparent in selected income categories. On
the one hand, more men (26 percent3 .than women (18 percent) came
from families with incomes in the range of $7,500 to $13,499.
On the other hand, many more women were represented in the "0-$2,999"
"$3,000-5,999" and "non-response" categories. The high rate of
preference for the"non-r_spons category may mean that women do
not maintain the same level of interest in financial matters as
men or that they feel a greater need for privacy n these matters.
Comparisons with national data reveal that a greater per-
centage of local students (24 percent) are classified into the
$5,999 or less income range than students in the national
sample (16 percent). Family incomes in the $6,000 to $13,499
range contained the same proportion of students in b-th the local
and national groups (30 percent). Twenty-six percent of the re-
lipondents in the national population were accounted for by the
A3,500 and above income range while the local group was found
to contain 10 percent in this category. The non-response rate
both locally and nationally was high, 36 percent and 28 percent
respectively, suggesting a reluctance on the part of students to
divulge personal financial_ information.25
17
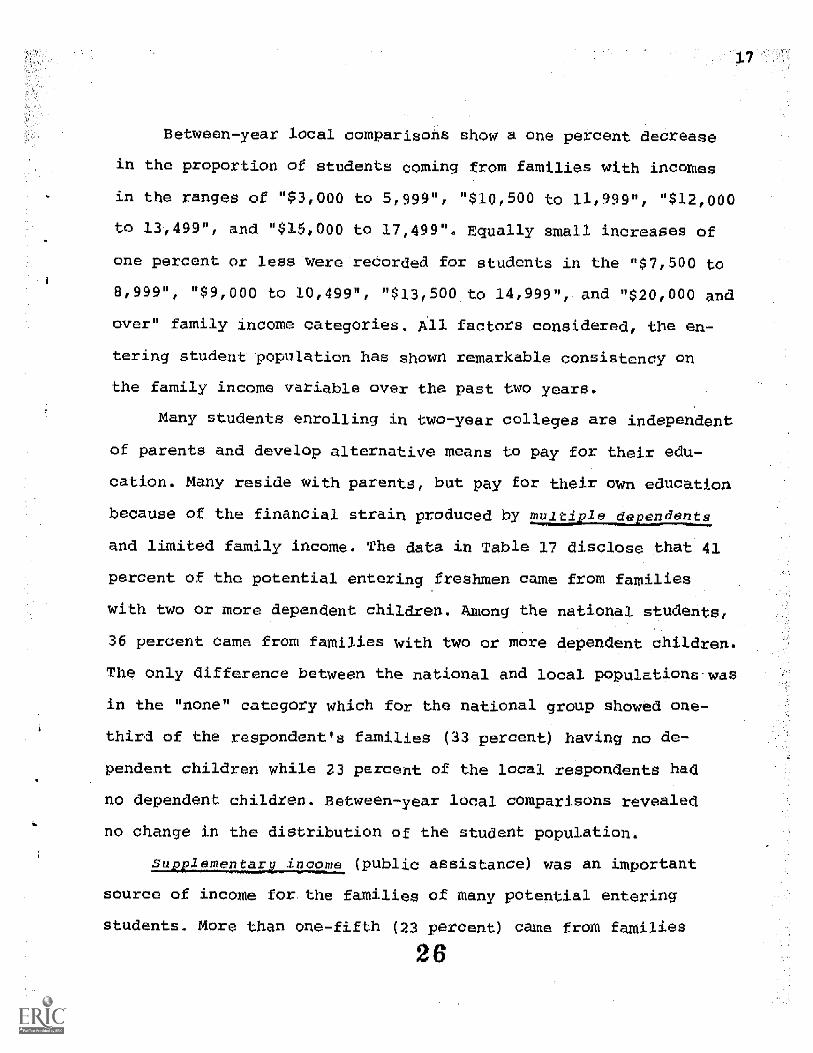
Between-year local comparisons show a one percent decrease
in the proportion of students coming from families with incomes
in the ranges of "$3,000 to 5,999". "$10 500 to 11,999", "$12,900
to 11,499", and "$15,000 to 17,499". Equally small increases of
one percent or less Vere-reCorded for students in the "$71500 to
8,999", "$9,000 to 10,499", "$13,500.to 14,999",. and "$20,000 and
over" family income categories. All factors considered, the en-
tering student- population has shown remarkable consistency on
the family income variable over the past two years.
Many students enrolling in two-year colleges are independent
of parents and develop alternative means to pay for their edu-
cation. Many re ide with parents, but pay for their own education
because of the financial strain produced by mu4t421441_11frjlepq
and limited family income. The data in Table 17 disclose that 41
percent of the potential entering freshmen came from families
with two or more dependent children. Among the national students
36 percent came from families with two or more dependent children.
The only difference bet een the national and local populat4.0na-was
in the "none" category which for the national group showed one-
third of the espondent,s famili 3 percent) having no de-
pendent children while 23 percent of the local respondents had
no dependent children. Between-year local comparisons revealed
no change in the distribution of the student population.
ImELtrItalluumat (public a s stance) was an important
source of income for, the families of many potential entering
students. More than one-fifth (23 percent ) came from families
2 6

hat depended on public assistance to meet basic living costs
Table 18). National CGP data showed a similar trend, as almost
he same proportion of students came from families receiving
ublio assistance (22 percent). Between-year local data re-
ealed an increase in the proportion of families receiving
ublio assistance monies. The number of women increased in
he public assistance cate=ry from 22 to 26 percent between
974 and 1975 while men increased by t o percent (from 19 to
I percent).
It is to be expected that many students enrolling in an
rban community college would come from famili s of limited
.
Lnancial means and maintain financial independence from parents.
le data in this study support this expectation. More than half
56 percent) of the potential entering students in Fall 1975
r'e independent of parents and were likely to require financial
Ld or part-time work to meet basic living expenses (Table 19).
tional da.._a show entering freshmen in New York City Community
alege to be similar to students in other colleges. Sixty-four
r!cent of the students in the national sample were independent
! parents while 22 percent were not.
Data comparisons for the 1974 and 1975 potential entering
u.dent populations reveal a nine percent increase in the number
students reporting financial independence. Women reporting in-
pendent status increased by 8 percent (54 percent) while men
, this status increased by 12 percent (59 percent). These increases,
lle placing the local population below the national saMple

19
represent a significant change in the financial status of the
entering student population.
A major index of the socioeconomic background of potential
entering students is the occupational status of their parents.
Tables 20 and 21 report the percentage distribution of parenta4
occupations for first-time freshmen according to ten categories
of employment. More than one quarter (26 percent) of the fathers
of entering students were employed as unskilled or semi-skilled
workers. Eighteen percent of the entering students indicated
that their mothers work in similar occupations. Service workers,
skilled workers, and sales personnel accounted for 26 percent of
the fathers' occupations and 15 percent of the employed mothers.
Ten percent of the students reported that their fathers held p o-
fessional positions or owned business establishments.
One percent of the employed mothers owned or managed small
businesses and 1 percent held positions requiring a B.A. or B.S.
degree. The largest segment of the mothers were housewives (30 per-
cent) The "non-response" category was chosen by almost two-fifths
of the students (39 percent) for fathers' occupa ion and one-third
for mothers'occupation.
Comparison of the local distribution of emplOyment categories
with the national s -_ple reveals both differences and similarities.
For example, 24 percent of the fathers in the national sample
were employed in unskilled or semi-skilled occupations as com-
pared to 26 percent in the local sample.-Among mothers the rates
were 14 and 18 percent respectively. The reverse was true in the
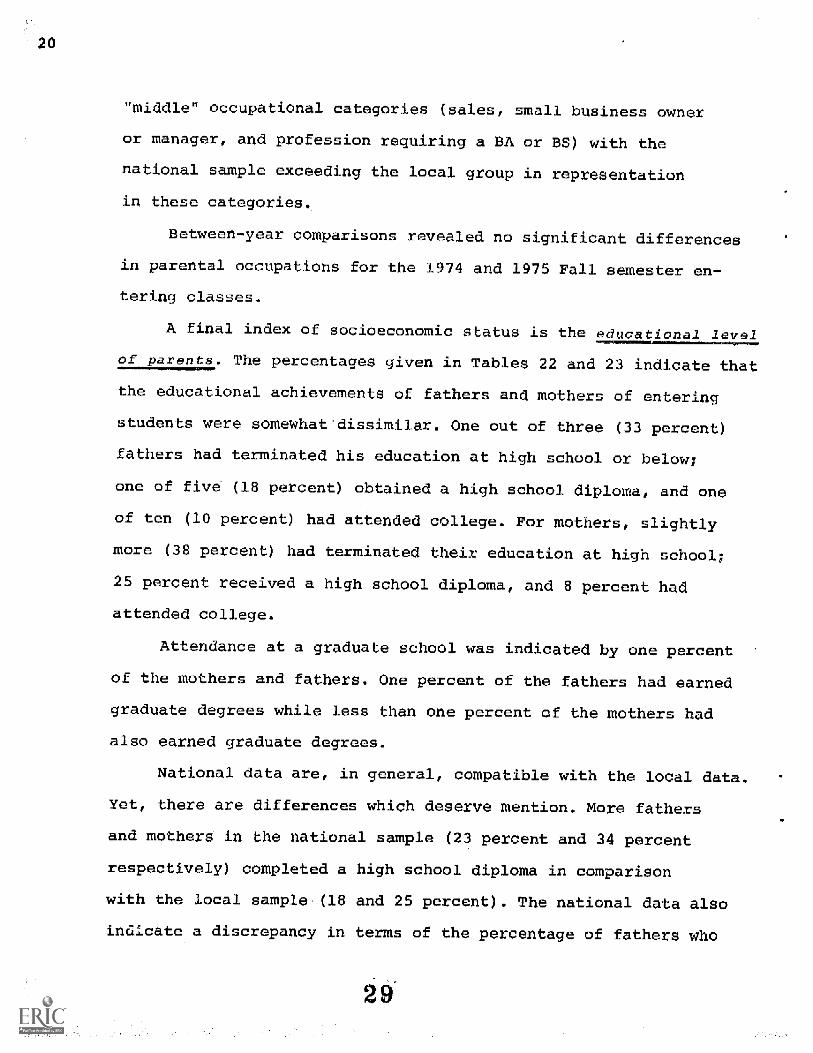
20
"middle" occupational categories (sales, small business owner
or manager, and profession requiring a BA or BS) with the
national sample exceeding the local group in representation
in these categories.
Bet-een-year comparisons revealed no significant differences
in parental occupations for the 1974 and 1975 Fall semester en-
tering classes.
A final index of socioeconomic status is the educational level
of parents The percentages given in Tables 22 and 23 indicate that
the educational achievements of fathers and mothers of entering
students were somewhat dissimilar. One out of three (33 percent)
fathers had terminated his education at high school or below;
one of five (18 percent) obtained a high school diploma, and one
of ten (10 percent) had attended college. For mothers, slightly
more (38 percent) had terminated their education at high school;
25 percent received a high school diploma, and 8 percent had
attended college.
Attendance at a graduate school was indicated by one percent
of the mothers and fathers. One percent of the fathers had earned
graduate degrees while less than one percent of the mothers had
also earned graduate degrees.
National data are, in general, compatible with the local data.
Yet, there are differences which deserve mention. More fathers
and mothers in the national sample (23 percent and 34 percent
respectively) completed a high school diploma in comparison
with the local sample (18 and 25 percent). The national data also
indicate a discrepancy in terms of the percentage of fathers who

21
graduated from college: five percent more of the national fathers
completed a four-year degree program in comparison to the local
fathers.
Comparisons with previous year data reveal almost no change
in the educat onal achievement of local parents. For fathers, an
increase of t .o percent occurred in the "some grade school"
category while a one percent increase was noted in the "high school
diploma" and "two-year college degree" categories. Among the
mothers, a one percent increase was observed in the "some high
school" category and decreases of one percent occurred in the
"two-year college degree" and "high school diploma" categories.
These findings parallel data in national studies on two-year
college students. Many come frori, educationally disadvantaged
families (Cross, 1968; Bushnell, 1973; Gleazerf 1973). In part,
this can be explained by the rapid increase in enrollment of
non-traditional students. it can also be explained by the merit-
ocratic pattern of higher education which restricted opportunities-
for adult learners in the 50's and 60's. The implication for a
multi-unit institution such as New York City Community College
one of a challenge to the structure of traditional learning
systems and a need for new resource- to develop innovative
teaching strategies.
Intellective Variables. The academic achievement of stu-
dents is one of the best researched areas in higher education. We
know a great deal about the performance of various groups of stu-
dents on "traditional" tests of academic ability such as the
Scholastic Aptitude Test and the Comparative Guidance Program.
3 0

22
Furthermore, we can state with cons able confidence that
mean scores on ability instruments for students attending two-
year colleges are generally lower than those of students attend-
ing four-year colleges and that community college students as
a group score higher on these tests than students who graduate
from high school but do not go on to colleae. The research sup-
porting these facts is national in scope, it is unanimous in
findings, and it is based on many different measures of academic
aptitude.
Five measures of student achievement are of concern in this
report: high school grade point average, high school English
grades, high school mathematics grades, scholastic honors, and
termination of study in other institutions. Information pertainingto the schoolq potential entering stu-
dents is presented in Table 24. The data disclose that 15 percent
achieved an average in the range of 85-100 ("mostly A's, some B's),
21 percent achieved an average of 80-84 ("mostly B's)), 41 per-
cent achieved a 70-79 average ("mostly C's"), and 3 percent
achieved an average of 69 or below.
Differences are observed between male and female students
in the upper and lower grade ranges. Twenty-one percent of the
women were represented in the 85-100 gtade range as compared to
9 percent of the men. Males were more likely to be represented
in the 70-79 grade range (47 percent) than women (34 percent).
On the surface, these data could be interpreted to mean that
women perform better academically in high school than men.
31

A quest
23
_n remains, however, as to the accuracy of grade-
point data as an indicator of academic aptitude. This question,
and its implications for prediction of performance, is not
answered by this report.
Comparison of local and national data reveals consistency
between the two samples In only one category were there dif-
ferences in the percentage distributions: 16 percent of the
students the national sample were classified into the 70-
74 grade category compared to 10 percent for the local sample.
These differences obtained for both male and female students.
Nationally, one-fifth (20 percent) f the men were classified
into this category while 13 percent of the local men were so
classified. Among the w men, 12 percent of the national group
fell into this category while the proportion for the local
group was 7 percent.
These data, when compared to previous year local data,
1-iow a slight decrease (2 percent) in the representation of
students in the "70-74" category ("mostly C's") and an equally
small increase (1 percent) in their representation in the
"80-74" ("mostly E's") and "75-79" ("half B's and half C's")
categories. This finding, although positive in terms of
the high school achievements of potential entering students,
could simply be a function of random selection and therefore
should be interpreted with caution.
To additional indicators of student achievement are high
school grades in English and math. Tables 25 and 26 present
data that depict student performance according to five cat-
egories of grades. Approximately 62 percent of the entering
32

24
students reported a final grade of "C" or better in their
/ast hi h school En lish course. of this group seven percent
achieved a grade of "A", 29 percent a grade of "B", and
26 percent a grade of "C".
Women achieved higher grades than men. The al female
breakdown shows that 43 percent of the women got grades of
either "A" or "B" while 30 percent of the men achieved
similar grades. Men received a grade of "C" more frequently than
did women (29 percent and 22 percent respectively).
Compared to the national sample, the English grades of the
local population are somewhat below standard. Fifteen percent
of the students in the national sample received "A's" as com-
pared to 7 percent in the local group. The remaining classifi-
cations are stable, although a significant proportion of students
in both groups failed to respond to the question.
Between-year comparisons reveal a stable pattern of grades
with relatively few changes in the distributions of potential
entering students. Current year data show a two percent increase
in the proportion of students achieving a grade of "C"
(70-79) in their last high school English course. Decreases
of one percent between 1974 and 1975 were observed for students
in the "A" and "C" grade categories. For male and female students,
these percentages are indicative of a strong trend toward
constancy on intellective variables related to college attendance.

25
The pattern of grades reported for high school math
reflects a different standard of performance than that for
English. Fifty percent of the potential entering students
achieved a grade of "C" or better in the final course of high
school math as compared to 62 percent for English. The distri-
bution of percentages was as follows: 8 percent achieved a grade
of "A", 19 percent a grade of "B", and 23 percent a grade of "C".
Contrary to the pattern of "below average" grades in English
(6 percent achieved a grade of "D" or below), 15 percent
achieved a final course grade of "D" or below in math.
There was substantial variation between the local and
tional samples with regard to the grades received in the
last high'school math course. In the 70-79, 80-89, and 90-100
grade categories, the national group was more heavily represented
than the local group while the converse was true in the 60-69
and "below 60" Categories. Caution should be ob-erved in
interpreting these data because of the high non-response rate
(34 percent), but the observation generally can be made that
performance in high school mathematics was lower for the local
sample than it was for students in the national sample.
Data describing the distribution of grades in high school
mathematics between the two-year period 1974-1975,show a two
percent decrease in the number of students entering the College
with a grade-point aver ge of "D" or less in their last math course
and a one percent increase in the number receiving a grade of
"C" or better. These results, while indicating a modest
improvement in the mathematics grades of potential entering
students still must be interpreted as indicating that entering
3 4

26
freshmen may experience difficulty in meeting ins itutional
standards in math during the initial phase of their enrollment.
The same holds true for English although a higher standard
of perfoiwance should obtain because of the index of superior
achievement in high school.
It has been repeatedly demonstrated that information re-
ported by students relating to scholastic achievement does not
constitute an acceptable criterion on which to base predictions
of academic success. It does, however, provide a good index of
motivation toward academic work. One variable--high school
scholastic honors or awardscan be used to de-scribe the
academic motivation of students prior tO their enrollment in
college. The data in Table 27 indicate that more than one-third
(34 percent) of the first-time students received one or more
scholastic honors in high school. The data are consistent for
both males and females in the local and national subgroups with
the exception that more men in the national sample (59 percent)
received no awards than any of the other groups examined.
Between-year comparisons reveal an increase in the number of
students receiving no awards and a decrease in the number re-
ceiving three or more awards for the Fall 1975 entering
class.
A fif h and final indicator of academic achievement
is termination of study in other in ons d e to poor_yrade_s.
A prominent trend in recent years has been the enrollment of
students in two-year colleges following study in other institu-
tions. The reasons for this trend are multiple (' e. academic
35
27
problems' part-time employment, proximity to home, family
obligations, financial difficulty, etc.). Transfer is on the
increase, however, and we know little about the students who
enroll in college with a post secondary background. The data
in Table 28 reveal that less than one percent of the potential
entering stu:=tents reported having terminated study in another
institution prior to enrollment in New York City Community
College. Between-year local comparisons and 1975 national and
local comparisons indicate no differences in termination rates
among potential entering students.
retu1-Attitudina2Variab1es. Research on udents'
attitudes and beliefs, particularly their importance for under
standing individual behavior, has probably generated more in-
terest among faculty and administrators than any other .topic.
College s_lection is a sifting and weighing process whereby the
attitudes students bring with them to campus may shape their
relationship with the college. Previous research has shown that
many students attend two-year colleges because of uncertainty
about career interests or further study (Knoell and Medsker,
1965; Blocker, Plummer and Richardson, 1965; Cross, 1968;
Thurston and O'Banion, 1972). Researchers are in agreement that
community college students are more influenced by practical
considerations (e.g. , location, low cost, nearness to home,
etc.) in college selection than their four-year college counter-
parts. Pour-year college student- on the other hand, have been
shown to place greater emphasis on intellectual interests
g., scholastic status, characteristics of faculty, academic
3 6

28
reputation, etc.) as a pri_ary consideration in college selection.
Table %9 presents data pertaining to reasons for college
attendance among potential entering students in New York City
Community College. Almost one-fifth (18 percent) of the first-
time students indicated "low cost" or "closeness to home" as
their primary reasons for attendance. One-third 33 percent) of
the entering students considered the strength in their in-
tended major as the main reason for atte- dance. The remaining
categories--"academic reputation," "non-a ceptance by first
,nhoic(--" and "impression of campus"--were selected by small per-
clntages of students as their reason for attendance.
When students are classified according to sex, several
distinctive differences are noted for male and female students.
Almost one-fifth of the females (19 percent) chose closeness
to home as their main reason, while 9 percent of the males gave
this reason. Men (38 percent) gave the reason of "strength in
inte ded major" more often than women (27 percent).
National data demonstrate a different pattern. Forty per-
cent of the entering students chose their college because it
was either inexpensive or close to home, compared to 18 percent
for the local respondents. Seventeen percent of the national
group chose their college on the basis of strength in their in-
tended major field as compared to one-third of the local group.
These data demonstrate the sound academic standing of New York
City Community College and the fact that this status is being
communicated to student- before they start their college careers.
37

29
Compar_ -ons with previous ye_r data show a similar trend and
reinforce the concept of the College as a viable training
ground for further education and the careers. Since the Col-
lege enrolls eighty percent of its students in occupational pro-
grams, it is to be expected that many freshmen would list
"perceived strength in major field" as a primary reason for
attendance. A similar condition wc A probably obtain in the
liberal arts program among students who view the College as
the first step in preparation for the professions.
Previous research has shown that A2LE2.2_:LLaELLLEI held
by students are a motivational force underlying college attend-
ance. (Cross, 1968; Trent and Medsker, 1968; Newcomb and
Feldman, 1969). Table 30 reports the percentage distribution
of degree objectives among potential entering students
during Fall semester 1975. More than one-fifth (22 percent)
aspired toward a baccalaureate degree and 11 percent more
planned to earn a graduat_ degree. Thirty-four percent in-
dicated plans to complete a two-year specialized training
program and 4 percent indicated no plans whatsoever. The
greatest variation among students occurred in the special-
ized training and liberal arts degree categories. More men
(36 percent) than women (32 percent) indicated plans to
obtain a specialized degree. This trend was reversed for
the liberal arts degree as women outnumbered men by 5 percent.
National and local comparisons showed a similar pattern
0: results. Approximately one-quarter (27 percent) of the
30
national group planned to attain a two-year specia ized
degree while the proportion for local students was 34 percent.
A higher proportion of students in the national group (27
percent) planned to complete a four-year degree and these
differences are most pronounced for students classified
according to sex. Almost one-fifth (19 percent) of the males
in the national group were interested in a two-year special-
ized degree while the percentage for local males was 36 per-
cent. Thirty-two percent of the males in the national sample
indicated an interest in a four-year college degree compared
to 23 percent in the_local population. The distribution of
women in degree categories was essentially the same fOr both
the national and local groups.
Between-year local comparisons show an increase of
2 percent in the proportion of students who plan to go on for
a four-year degree among the potential entering freshmen in
Fall 1975. Male and female students showed no appreciable
differences in the pattern of their responses between 1974
and 1975.
These findingsemphasize the career education mission of
New York City Community College. Occupational programs offered
by the College have been widely recognized as a model for the
"career ladder" concept in community college education. This
has led to a natural selection among students into programs that
embody this concept and lead directly to a technical career or
an advanced degree program. The career education mission, what-
ever its applidation, guarantees students the opportunity to
3 9

market a technical skill in a variety of fields.
31
Efforts were made in this study to determine the level
confidence students h d in curriculum choices prior to their
entry to college as well as their immediate plans after grad-
uation. The data in Table 31 reveal that almost half (48 percent)
of the potential first-time students came tc college with a
definite curriculum choice in mind while another 32 percent
were "fairly definite" about their choice. A small group
(5 percent) were "indefinite" about their curriculum plans.
No real differences were observed between males and
females and local and national subgroups. Between-year comparisons
showed a moderate increase in the number of students indicating
a "fairly definite" choice of curriculum. Women were more apt
to choose this category than men but the pattern as a whole
appeared to signal a trend toward greater clarity in curriculum
choices made by students. The distribution of males and females
in other categories was approximately the same as it was in
1974.
The ost-5raduate plans of students followed a pattern
similar to that of their curriculum chOices. More than one-half
(58 percent) maintained a definite plan for aork or further
study (Table 32). Of the total population, 29 percent planned to
enter full-time work while another 29 percent planned to tran fer
to'a four-year college. More than one-quarter (26 percent) we_ e
undecided about their future. Males (31 percent) indicated a
preference for a four-year college degree more often than
females (26 percent) but this was reversed for full-time work
4 0
as women (33 percent) expressed a greate: interest than men
(25 percent). National data showed that a higher.percentage
of students planned to transfer (35 percent) and work (33 per-
cent) after graduation than those in the local population.
Almost one-fifth (19 percent) of the national students.were
undecided about their plans after leaving college compared to
26 percent of the local group. Over twofifths (42 percent)
of the males in the national sample planned to transfer to a
senior college while the proportion for local males was sub-
stantially lower at 31 percent. For males, both locally and
nationally, the same percentage of men (25 percent) planned to
enter full-time work. The distribution of women holding plans
for work was more heavily weighted toward the national group
with 41 percent choosing full-time work compared to only 33
percent for the local sample.
If a conclusion were to be drawn from these data, it would
be that college attendance forjaany students has become a means
for achieving pre-planned goals. Between-year comparisons offer
support for this finding in the'form of data indicating in-
creasing numbers of students holding firm plans to transfer
(to a four-year college) compared to their nuMber in 1974. This
trend cannot be generalized beyond the transfer category,
however, as more students indicated "uncertainty" about theirl
future plans in 1975 than in 1974. Additional research on the
post-college plans of potential entering students is warranted
in view of the competing trendssuggested by these findings.-

The transfer plans of students are of interest in this
report because of the continuing debate over the educational
mission of the two-year college. Is it primarily a transfer
institution or is it an agency for career preparation? The
data in Table 33 reveal that 44 percent of first-time students
in New York City Commnnity College planned to transfer and had
selected a curriculum for a four-year college. The distribution
of curriculum choiceswas as follows: Biological and Health
Sciences (9 percent), Physical Science or Mathematics (1 percent),
Social Science (3 percent) Humanities or Fine Arts (2 percent)
Education (4 percent) Business (8 percent), and Engineering
(9 percent). Of the total respondents 17 percent had not de-
cided on a curriculum and 20 percent did not plan to transfer
to a four-year institution. Differences were most apparent
between men and women in the Biological and Health Sciences
where 5 percent of the men and 14 percent of the women planned
to major in related curricula and in Engineering where almost
one-fifth of the men (17 percent) and less than one percent of
the women planned to enroll.
More students in the national sample did not plan to
continue their education beyond the a sociate degree. More
than one-quarter (26 percent) planned to terminate their edu-
cation with the associate degree while the proportion for local
students was 20 percent. The curriculum plans of the national;
sample showed a strong emphasis on the Business and Social
Science fields. The local sample, on the other hand, exhibited
4 2
a greater degree of interest in the Engineering and Engineering-
related fields.
Between-year comparisons show an increase in the number of
students selecting a major in Education as preparation for
transfer to a four-year college. Increases were also noted
the number of students indicating "Undecided" and "Other"
as categories representing their plans for transfer to a
four-year college. A decrease of two percent was observed
in the number of students who did not plan to further their
education beyond the associate degree.
Academic aptitude and interest in advanced study
are factors that have a definite bearing on student perceptions
of_the ortance ogrddes earned while in college. Although
college grades are highly correlated with native.ability, the
motivation to succeed must be present if students are to perform
at a level commensurate with institutional standards for re-
tention. Table 34 presents data pertaining to perception6 of
grades held by potential entering students Almost three-
quarters (73 percent) felt that grades were important, 11 per-
cent indicated "no importance" or "moderate importance" and
16 percent indicated "no response" to the item. Women were more
apt to perceive grades as "very"important or "quite' important
than men. More than th ee-quarters (77 percent) of the women
rated grades in these categories while among the men the pro-
portion was 70 percent. The most noticeable difference
occurred in the "very important" category where 57 percent
of the women chose this designation compared to 43 percent of
the men. More men (12 percent) perceived grades as being
"moderately" important than women (7 percent).
The national data indicate that 31 percent of the students
in the national sample perceived grades as "quite important"
compared to 24 percent of the local entering students. Forty-
nine percent of the local students perceived-grades as "very
important" while the national proportion was 42 percent. A
larger percentage of national than local men viewed grades as
"moderately" Important. This trend was reversed in the "very
important" category with 43 percent of the local males and 37
percent of the national men indicating this category. Comparison
of the responses for local and national women revealed a
pattern similar to that observed for the men. A rating of
"Moderately Important" was assigned to grades by 7 percent of
the local women and 12 percent of the national group. One-fifth
of the local females compared to 31 percent of the national .
sample reported that grades were "quite important." More than
half of the women (57 percent) in the local sample considered
grades to be "very important" while 46 percent of the national
sample responded similarly.
Comparison with the previous year's data reveals a two
percent increase in-the proportion of 1975-potential entering
students evaluating grades as "very important ' Women alone
accounted for the greatest part of this increase as 7 percent
more in 1975 reported college grades to be "very important."
Four percent less of the 1975 entering females viewed grades as
"quite Important" compared to their number in 1974.
Several other factors related to the social psychological
side of coll-ge life are considered in this report. Student neegs

36
for assistance in improving reading skills; developing study
techniques; locating employment; establishing a residence;
qualifying for financial aid; and receiving educational,
vocational and personal.counseling are reported in Tables
35 through 41 -Approximately half of the potential entering
freshmen indicated a need for ass stance in reading, developing
study techniques, finding employment, applying for financial
aid, and counseling in educational and vocational matters.
Assistance in locating housing Was indicated by 10 percent of
the respondents while 16 percent perceived a need for personal
counseling.
Comparable data were not available for the national
sample. Between-year comparisons were possible and the pattern
observed was one of increasing needs for counseling services
expressed by 1975 potential entering students in the areas of
reading skills, developing study techniques, finding employment
locating housing, applying for financial aid, and resolving
educational and vocational problems. The specific rates of
increase in each area were the following:
Area Percent increase (1975-1975)
Reading +5 percentDeveloping Study +1l'echniques
Finding EmployMent +3
Locating Housing +1Applying for Financial +5
AidEducational and Vocational +1
. Counseling
In only one category, "personal counseling"' did the
need level reported by students stay the same or decrease
from its level in 1974.

The willingness of students to indicate their "needs for
assistance" on a standardized instrumentis somewhat surprising
in view of the expressed reluctance on the part of many in-
stitutions to request personal information from students. Much ,
more information is needed, particularly related to the move-
ment toward non-continuous education among-college-age youth.
Data were obtained in this study describing the future e -
rollment plAn.s ofstudents after completion of Pall semester,
study. Almost three-quarters (70 percent) of the potential
entering freshmen indicated they would return for full-
time study during the Spring semester; ten percent indicated
plans that varied between half-time and three-quarter ti e
,enrollment; and 21 percent planned to enroll quarter-time
or did not respond to the question (Table 42).
There was.sutprisingly little variation between male and
female students regarding future enrollment plans exCept in-the
"full-time" category. Compared to men, women were-more uncertain-
of their future plans and indicated a lower prebabilityof re-
turn for full-time study. Although the reasons.for this . finding
cannot be deduced from the data, it is probable that many of the
factors involved in enrollment a e beyond the control f the in-
stitution and require additional research if faculty and
administrators are to understand the dynamics of non-continuous
enrollment.
4 6

APPENDIX
4 7

Table 1
,
Distribution. of. Day/Evening. Enrollmentof Total, Regular
New York City Community College
Student, Population
,
,
Pall Semester. 1975
. .
,
,
Enrollment.
Full-Time!
,
Part-Time
*TOTAL
.,
Status
Male
Female
Male
Female
Male
Fe ale!
N%
N%
N%
N%
NN
Day. Session Transfer
495 30%
1146
70%.
95
15%
554
85%
590
26% 1700
74%
Day. Session Occup.
,
3646 64%,
2049
36%
511
57%
378
43%
4157
63% 2427
37%
Sub-Total
4141 56%,
3195
44%
606
39%
932
61%,
4747
54% 4127
46%
Evening Transfer
199 45%
132
55%
255
29%
623
71%
364
32%
755
68%
Evening. Session. Occup
311 741
112- 26%
1395
68%
654
32%
1706
69%
766
31%
Sub-Total
420 63%;
244
37%
1650
56%
1277
44%
2070
5.81 1521
42%
Non-Matriculated
Total
603 69%
275
31%.
5164 58A;
3914,
421
2258
56%
1810
441,
1
4514.
531
4019
47%
2861
58% 2085
42.%
9678
561 7733.
441
*48 students in, the local data and. 913students in, the national data did not respondto
the question on. sex. These nuMbers, however.,
are included in, the totals presented. above.

f
Table 2
Origin of Enrollment of
First-Time Students in
New York City Community
College
Fall Semester 1975
First-Time
Freshmen
I Matriculated
and
Registered
Male
N
Day
%
1
Female
1
N%
1 1
Even,ing
Male
Female
N%
N%
Total
N'
University
Application
Process
Center
Processed by
College
1
College
Discovery
1
Educational
Assistant
Program
Total
1
1392
56
133 3
1584
58%
41%
55%
21%
57%
1021
42%
BO
59%
107
45%
11
79%
1219
43%
74
61%
47
375%
1
1
350%
3
1
II
-
1 1
1
80
61%
51
1
II
39
25%
1
50
39%
2534
140
246 14
1
2934
1
5%
I
1
B%
1%
1
1
1
....
1
1«,7
!

Table 3
Sex of Potential Entering
Students:
Fall Semester 1975
Sex
Local
National
N
Male
r
2,413
54
31,267
46
Female
2,037
45
36,058
53
Non-Response
48
1913
1
Total
4,498
_68,238
_

Table 4
Patterns of Entrance, of Potential Entering
Students:.
Fall Semester. 1975
,
Pattern of
Entrance
,
SEX
TOTAL*
ales
Females
Local
National
Local.
National
Local
Nationaa
(N=2,41.
(N=3I,267)
(.N=2,037)
:N=36,0581
N=4,498)
(N=68,238
,
Direct from High.
School
Transfer froiri Other
641
2%
431,
4%
H
57%
45%
2%
51,
60%
44%
H,
2%
4%
College
1
-From Military Svce.
L3%
12%
0%
0%
2%
6%
oFull-Time Work.
or. 2 years)
6%.
8%.
, H5%;
81
5%
8%
FromFuilTjmeWOrk
or more. years)
7%.
13%
9%,
14%
14%,
Other.
6%,
9%
13%.
619%
10%
14%,
Non-Response
13%
10%
131
9%
13%
10%
*48 students in the local
data and 913 students in the national data did
not respond to
the question on sex.. These numbers,
however, are included in the totals presented above.

Table 5
Race and Ethnicity of PotentialEntering Students:
Fall Semester 1915
..111
111F
Race.
er ican Indian.
ack, Afro-American
Negro
Caucasian, White.
Mexican American,
Spanish American
Puerto Rican
Oriental
Non Resp nse
SEX
les:
Local
National
(N=2,413)
(N=31,267)
TOTAL*
Females
H,
.
Local
National.
Local
National.
(N.-2,037)
N=36,058)
(N=4,49 1
(N=68,238).
,
0%
1%
0%
1%
26%
17%
H39%
23%
35%.
66%
5%
0%
11
32%
20%
20%
62%
28%
64%
4%
1%
4%
1%
16%
2%
14%
4%
1%
4%
17%
.10%
18%
*48 students in the local
data and 913 students in the national
data did not respond to
the question on
sex. These numbers, however, are included
in the totals presented above.
\

Table 6
Type of High School Graduated
From for Potential
Entering Students:
Fall Semester 1975
Type, of.
High School
Males
Local
National.
N=2,413)
(N=31,267)
SEX
Females
Local
National
(N=2,037)
(N=36,058)
H Public
Private, Non-Religious
Non-Military
Denominational Other
Than Catholic
Catholic
Adult Education
or
GED Diploma
Did Not Graduate
Other
Noa-Response
64%
69%
2%
1%
0%
0%
7%;
5%
9%.
10%
63%
1%
72% 1%
0%
0%
8%
6%
9%
6%
1%
3%
I
3%
21
11.
l%
151
111
14%
4%
1%
9%
TOTAL*
Local
(N=4,498)
National
(N.=68 238
631.
71%
1.%
1%;
0%
0%
8%
6%
9%
8%
2%
3%
2%
1%
"15%
10%
*48 students in the
local data and 913 students in the national
data did not respond to
the question on
sex. These numbers, however, are included in
the totals,presented-above.

Table 7
Size of Graduating Class for Potential
Entering Students:
Fall Semester 1975
Size of
Graduating
Class
SEX
TOTAL*
Local
National
N=4,498)
N=68 2
Males
Local
National
(N=2,413)
(N=31,267)
, 1r--
Females
Local
(N=2,037)
National
N=36,058)
Fewer than 50
50 - 199
200 - 499
5 0 - 999
1, 00 or more
Non-Response
6%
6%
10%
19%
26%
33%
19%
16%
10%
4%
29%
21%
.
7%
11%
25%
20%-
8%
30%
6%
21%
34%
18%
4%
18%
7%
6%
10%
20%
25%
19%
17%
,
9%
4%
30%
20%
*48 students in the local data and 913 students inthe national data did not respond to
the question on sex. These numbers, however,
are included in the totals pres nted above.

Inception of Studies,
at New York City Community
College,
for Potential. Entering
Students:
Fall Semester 1975
Plans To
Begin Studies
SEX
Males
Females,
Local.
National
Local.
National.
(N=2,413)
(N=31,267)
INT=21037)
IST=36,0581
TOTAL*
.Local
Nati nal
(N=4, 498)
, 23.8)
all. 1973
or earlier
0%
11
0%
11
0%,
0%
0%
0%
0%
0%
0%
0%
0%
0%
0%
0%
0%
01
0%
1%
1%
1%,
1%
...Ili
1%
11.
1%
1%
1%
1%
1%
1%
78%
72%
78%
72%
Winter 1973,74,
:Spring 1974
...I-Summer 1974
-rFall 1 74
'Winter 1974-75
Spring 1975
Summer 1975
Fall 1975
Winter 1975-76
1.
..
3%.
6%
3%
7%
-or later-
on-Response
151
171
151
15%
0%1%
0%
0%
01.
0%
0%
0%
11
1%
1%
1%
1%
1%
1%
78%
72%
3%
6%
15%
16%
*48 students in the
local data and 913 students
in the national data did
not respond to
the question on
sex. These numbers, however,
are included in the totals presented
above.

Table 9
Marital Status of Potential
Entering Students:
Fall Semester 1975
Marital
Status
SEX
TOTAL*
Local
National
N=4,498)
(N=68,23
'
Males
Local
National
(N=2,4134
(N=31,267
)
Li
Females
Local
National
I(N=2,037)
N=36,058)
Married
Single, Divorced,
Widowed
Non-Response
8%
21%
79%
69%
13%
10%
13%
21%
74%
70%
13%
8%
,
10%
21%
76%
70%
13%
9%
*48 studiants in the
local data and 913 students in the nat onal
data did not respond to
the question on sex. These numbers, however,
are included in the totals presented above.

Table 10. Curriculum Preferences of Entering Students:Fall Semester 1975
Divisionand
CurriculumNumber and Percent
DIVISION OF COMMERCE
Accounting 178 4.0%Art & A.dvertising Design 160 3.6%Data Processing 133 3.0%Graphic Arts 80 1.8%Hotel.& Restaurant Tech 127 2.8%Lithographic Offset 34 0.8%Marketing/Management )
3.1%. Marketing/RetailSecretarial Science/Legal)
246 5.5%& Exec.Secretarial Science/Medical)Secretarial Science/School ) 73 1.6%
Subtotal 1172 26 1%
DIVISION OF kLLIED REALTHSCIENCE
Chemical Tech 81 1.8%Dental Hygiene 63 1.4%Dental Lab 73 1.6%Medical Lab 101 2.2%Nursing 167 3.7%Ophthalmic Dispensing 84 1.9%Radiology 66 1.5%
Subtotal 635 14.1%
I4g.__..t.=.._.q..==,..5 7
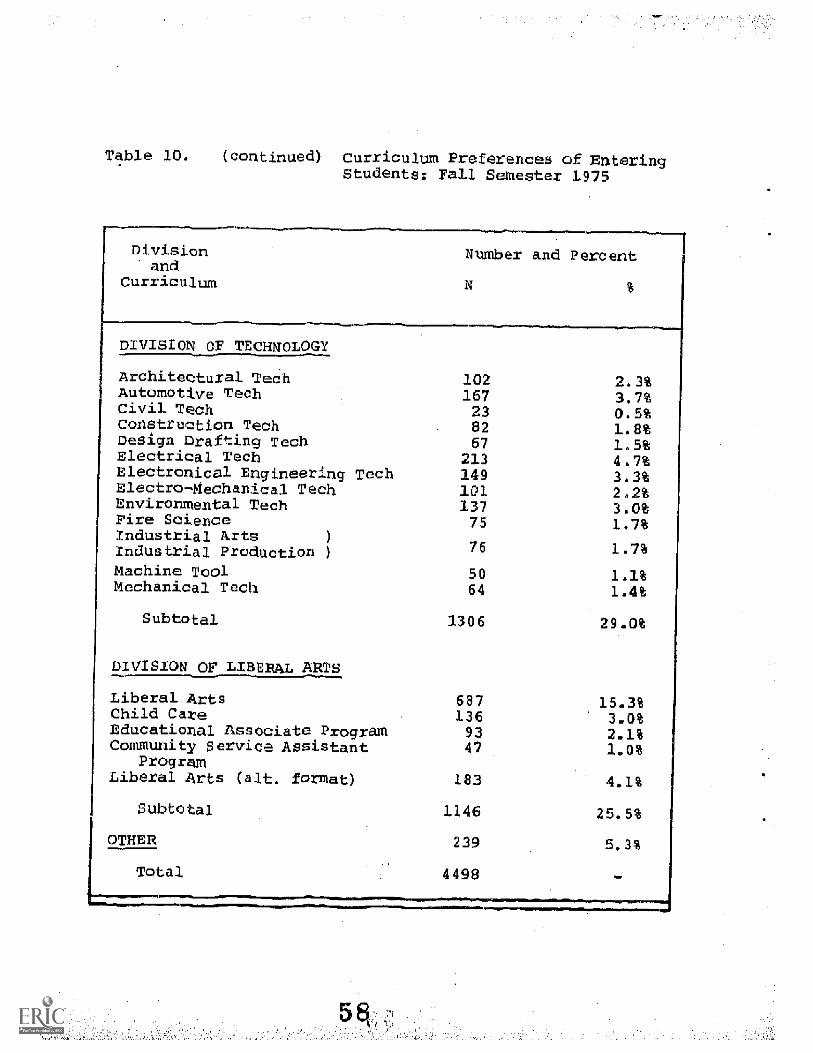
Taae 10. (continued) Curriculum Preferences of EnteringStudents: Fall Semester 1975
Divisionand
Curriculum
umber and Percent
DIVISIO OF TECHNOL GY
Architectural Tech 102 2.3%Automotive Tech 167 3.7%Civil Tech 23 0.5%Construction_Tech 82 1.8%Design Drafting Tech 67 1.5%Electrical Tech 213 4.7%Electronical Engineering Tech 149 3.3%Electro-Mecharical Tech 101 2.2%Environmental Tech 137 3.0%Fire Science 75 1.7%Industrial artsIndustrial Production ) 76 1.7%
Machine Tool 50 1.1%Mechanical Tech 64 1.4%
Subtotal 1306 29.0%
DIVISION OF LIaERL ARTS
Liberal Arts 687 15.3%Child Care 136 3.0%Educatiorial Associate PrograM 93 2.1%Communit17 Service AssiStant 47 1.0%
ProgramLiberal Arts (alt. format) 183 4.1%
Subtota1 1146 25.5%
OTHER 239 5.3%
Total 4498

Table. 11
Type. of. Home ResidenceMaintained by Potential
Entering Students;
Fall Semester 197S
Type: of
Residence
SEX
-Campus Housing
At Home With Parents
.ith Relatives
or
Friends
Private Room of
Campus
Ow
nme or Apt.
Other Off-Campus
Housing
Non-Response
Males
Local
(N=2,413)
National
(N=31 267)
1%
1%
69%
53%
4%
4%
1%
2%
11%
27%
1%
2%
14%
104
Females
Local
National
(N=2,037)
M=26,058)
614
52%
4%
4%
0%
1%
21%
32%
0%
1%
13%
9%
TOTAL*
L cal
NI= ,498)
National
1%
65%
53%
4%
4%
1%1%
16%
30%
11
2%
14%
10%
*48 students
in the local data and.
913 students in the- national
data-did not respond to
-the: question on
sex. These nuMbers, however,
are included, in the totals
presented above.

Table 12
Commuting Distance Between Residence
and College for Potential Entering
Students:
Fall Semester 1975
SEX
TOTAL*
,
Commuting
Distance
Ma les
Females
Local
National
Local
National
Local
National
(N=2,413)
(N=31,267)
(N=2,037)
N=36,058)
'N=4,49
N=68,238)
Live on Campus
0%
1%
1%
1%
0%
1%
2 miles or less
7%
9%
11%
8%
10%
3-5 miles
14%
21%
16%
15%
21%
6-10 mil
20%
24%
16%
22%
123%
11-20 miles
23%
22%
,
15%
22%
19%
2Z%
21 miles or more
16%
13%
20%
13%
19%
13%
Non-Response
18%
11%
23%
11%
21%
11%
*48 students in the local
data and 913 students in the national data did
not respond to
the question on sex. These numbers,
however, are included in the totals presented above.

Sods
Tr
le. 1.3
flovtatioh Med by
Potential Entering.
laents +0 Commute to
College
Vali Semester 1975
Mode of
Transportation
Own Car
Family Car
Car Pool
ublic Transport tio
Motorcycle, Scooter
or Bicycle
Walk
Non-Response
SEX
Males
Loc
alN
atio
nal.
(N=2,4131
(N=31,267)
11
01
791
0%
1%2%
14%
II%
Loc
al(N
=2
, 037
)National
N=
36 ,
056)
44%
19% 7%
19%
I%2%
13%
9%
TOTAL*
Local
,N=
4,49
8)N
atio
nal
(N=
68,2
.38)
14%
2%
10%
*48 students in the
local data and 913 students in
the national data did not
respond to
the question on
sex. These numbers, however, are included
in the totals presented above.

Table 1.4
Employment Plans of Potential.Entering Students:
Fall Semester 1975
, I
Employment
,
SEX
1
,
(
TOT
Local
=4,498)
, National,
(N=68,238)
.
1
Plans
, ,
Males,
Local
National
(N=2,413)
(N=31,267)
,
Females.
Local
,
(14=2,037)
National
N=36,0581
1
Yes, Work to Finance
Education
No, Work. for Other
Reasons
Do. Not. Plan. to Work
Non-Response.
.
52%
461
I
22%
30
1
9%
9%
1
16%
111
,
,
H , ,
,
1
,
53%
16%
15%
161
48%
231.
20%
9%
1
,
I
,
,
,
,
52%
19%
121
17%
47%
,
28%
,
15%
10
*48 students in the
local data and 913 students in the
national, data did not respond
to
the question on sex. Thesenumbers, however, are included in thetotals presented above,

Table 15
Employment Status of
Potential Entering
Students,:
Fall Semester
1975
SEX
TOTAL*
Hours Plan
to Work.
Males
Females
Local
National
Local.
National
Local
National
(N=2,413)
(N=31,267)
N=2,037)
N=36,058)
(N=4,498)
(N=681238),
-....1
None
12%
12%
20%
24%
15%
18%
Less than 6. hours
H
5%
3%
H9%,
4%
7%
4%
6 to 10 hours
7%
7%
H111
9%
9%,
8%
-11 to 15 hours
H9%
9%
H9%
10%
H9%
10%
1.6 to 20 hours
16%
161
13%
151
141
16%
-21 to 25 hours.
121
111
,71.
8%
10%,
9%
26 to 30 hours.
More than.. 30 hours
9%,
8%
10%
22%
5%,
5%
,
6%
11%
7%
6%.
8%
1.61
Non-Response
211
131,
.21%
121
21%
31.
,
,
*48 students in
the local data and
913 students in the
national data did
not respond to
the question
on sex. These numbers,
however, are included in
the totals presented
above.
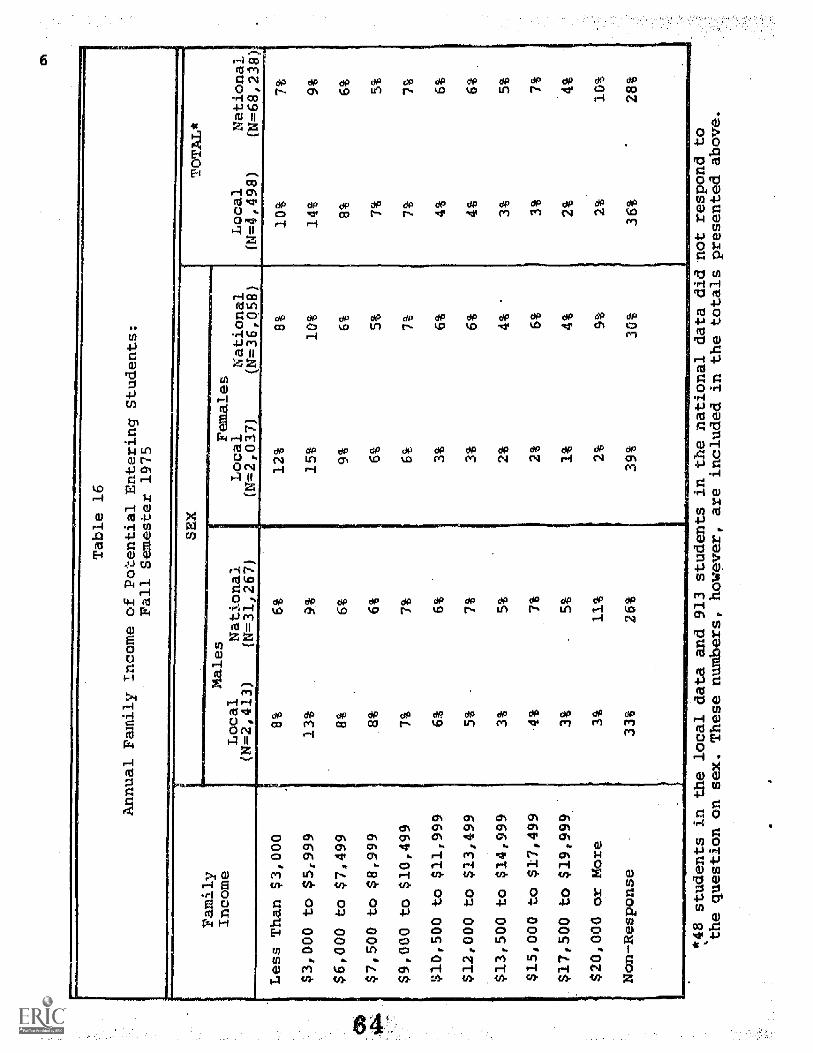
Table 16
Annual Family Income of Potential Entering Students:
Fall Semester 1975
SEX
TOT
Family
Income
Males
Local
National
Females
Local
National
Local
National
(N=2,413)
(N=31,267)
(N=2,037)
N=36,058)
N=4,498
(N=68,2
,
Less Than $3,000
8%
6%
12%
8%
10%
7%
$3,000 to $5,999
13%
9%
15%
10%
14%
9%
$6,000 to $7,499
8%
6%
9%
6%
8%
6%
$7,500 to $8,999
8%
6%
6%
5%
7%
5%
$9 000 to $10,499
7%
7%
6%
7%
7%
7%
$10 500 to $11,999
6%
6%
3%
6%
4%
6%
$12,000 to $13,499
5%
7%
3%
6%
1
4%
6%
$13,500 to $14,999
3%
5%
2%
4%
3%
5%
$15,000 to $17,499
4%
7%
1
2%
6%
3%
7%
$17,500 to $19,999
3%
5%
1%
4%
2%
4%
$20,000 or More
3%
11%
2%
9%
2%
10%
Non-Response
33%
26%
39%
30%
36%
.
28%
1
*48 students in the local data and 913 students in the national data did not respond to
the question on sex. These numbers, however, are included in the totals presented above.

Table 17
Number of Siblings
Financially Dependent
on Parents
for Support for
Potential EnteringStudents:
Fall Semester 1975
Number of
Siblings
SEX
TOTAL*
Local
Nat
iona
l(N
=4,
498)
(N=68,238
Local
(4=2,41
MalesNational-
)(N=31,267)
Females
Local
National
(N=21037)
N=36,058)
None
22%
33%
23%
32%
23%
33%
One
20%
20%
17%
19%
18%
19%
Two
15%
15%
15%
14%
15%
Three
11%
9%
11%
10%
11%
10%
Fou.z
7%.
7%
6%
7%
5%
Five or More
8%
5%
11%
7%
9%
6%
Non-Resp nse
17%
12%
18%
11%
18%
12%
*48 students in
the local data and 913
students in the national
data did not respond to
the question on
sex. These numbers, however,
are included in the totals
presented above.
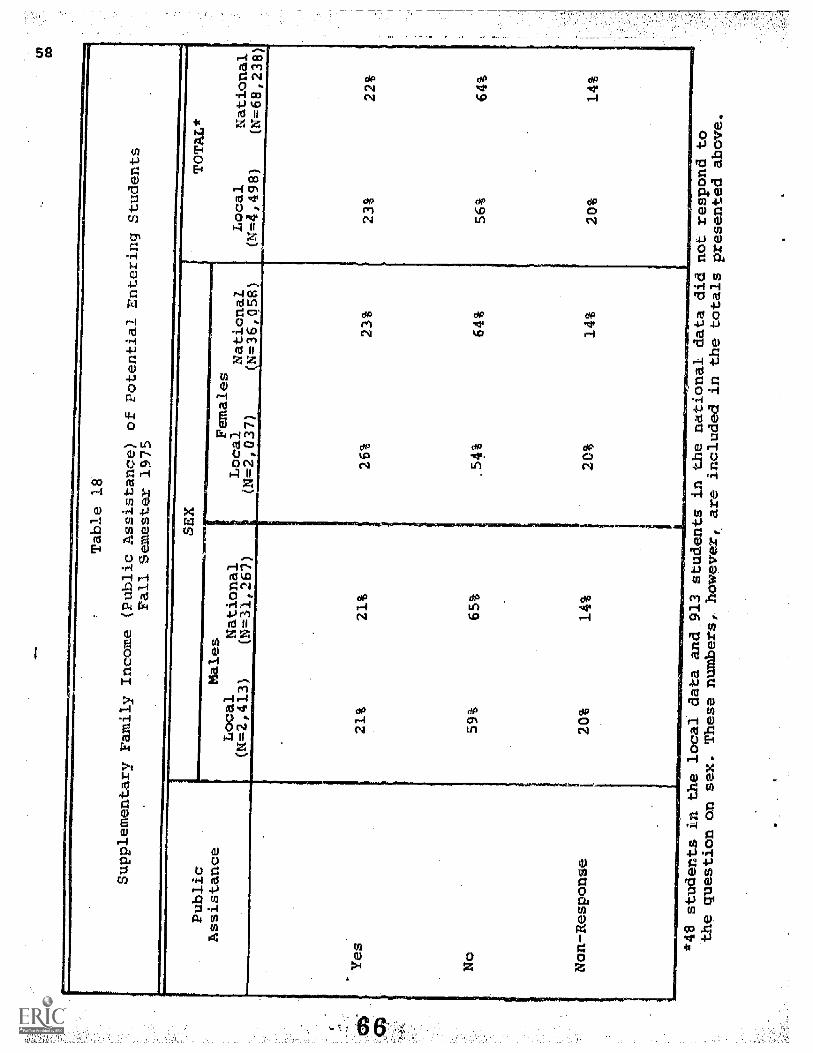
Table 18
Supplementary Family Income (Public
Ass stance) of Potential Entering
Students
Fall Semester 1975
Publ
icSEX
TOTAL*
Local
National
(N=4,498)
(N=68,238)
Assistance
Males
Local
National
(N=2,413)
(N=31,267)
Females
Local
National
(N=2,037)
.N=360158)
Yes
21%
21%
26%
23%
23%
22%
No
59%
65%
.54%
64%
56%
64%
Non-Response
20%
14%
20%
14%
20%
14%
*48 stmdents in the local
data and 913 students in the
national data did not respond
to
the question on sex. These numbers,
however, are included in the totals
presented above.
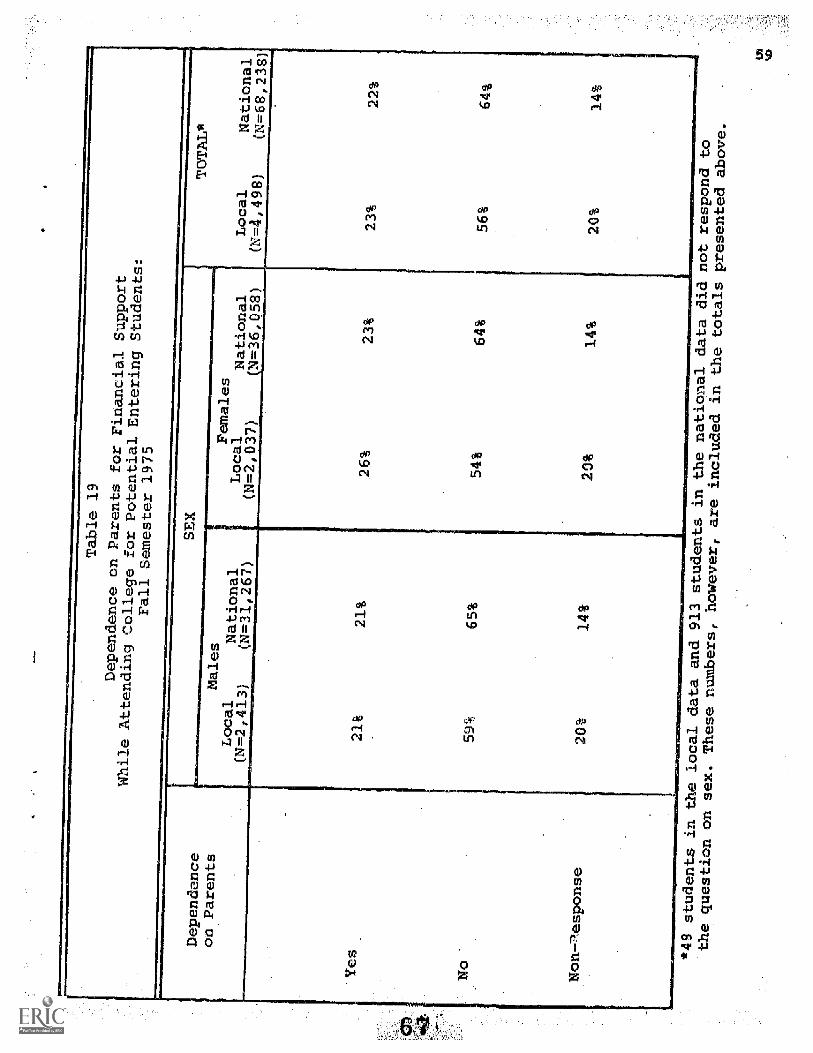
Table 19
Dependence on Parents
for Financial
Support
Whi e Attending
College for PotentialEntering Students:
Fall Semester 1975
Dependence
on Parents
Males
Females.
Local.
National
HLocal.
National,
Local
National'
(N=2,413)
(N=31 267)
I
N=2,031)
(N=36,058)
(N=4 498)
(N=68,238)
SEX
TOTAL*
'Yes
Non-zIesponse
21%
21%
.26%
23%
23%
22%
59%
65%
54%
64%
14%
20%
14%
56%
64%
20%
14%
*49 students in
the local data and 913
students in the national
data did not respond
to
the questionon sex. These numbers,
however, are included in
the totals presented
above.

'Table 20
FA:
e's Occupation for Potential
Entering Students:
Fall Semester. 1975
Father's
SEX
TOTAL*
Local
National
N=4,498)
N=68,2
Occupation
Males
Local
National
N=2,413)
(N=31,267)
Females
Local
National
(W=2,037)
N=36,08)
Unskilled Worker
111
8%
12%
10%
11%
9%
Semi-Skilled Worker
15A
15%
H14%
16%
15%
15%
Service Worker
9%
7%
H,
7%
7%
8%
7%
Craftsman or Skilled
15%
18%
12%
17%
14%
18%
Worker
Salesman, Bookkeeper,
4%
6%
4%
5%
4%
5%
Salesclerk, Secty.
Owner, Mgr. Small Bus
7%
13%
5%
13%
6%
13%
Profession Requiring
a B.A. or B.S.
er, Exec. Large
2%
1%
6%
3%
H1%
6%
2%
2%
6%
31'
Business
Profession Requiring
1%
2%
H1%
2%
1%2%
Advanced Degree
Ho emaker
01
'01
0%
0%0%
0%Non-Response
35%
22%
43%
23%
39%
23%
*48 students in the
local data and 913
s udents in the national data did
not respond to
the question on
sex. These number
, however, are included in the totals presented
above.
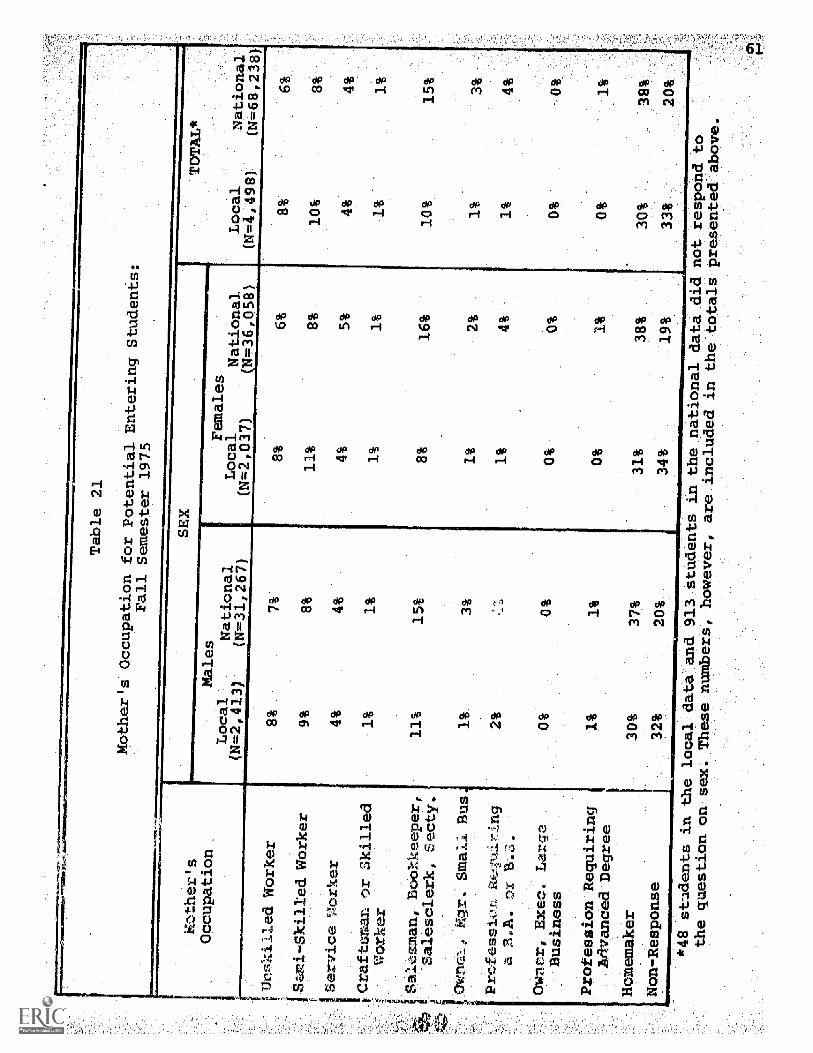
inn
S
if...-atherts
Occupation
Table. 21
Mother's Occupation
for Potential Entering
S ildents:
Fall Semester 1975
d Worker.
-Skilled Worker
Service Worker
CraftsNan or Skilled
Worker
sman,
(Jo3;y-zeeper,
Salesclerk, Secty.
Prcfessio17.
a B.A. or B 0,
Small Bus
rExec. L
Business
Profession Requirin
Advanced Degree
Homemaker
Non-Response
SEX
TOTAL*
Local
Nat
iona
(N=4,498)
(N=68,238)
Local
(N=2,413 )
lesNational
(N=311267)
Females
Local
National
(N=2,037)
M=36,058)
8%
9%
4%
1%
7%
8%
4%
1%
8%
11%
4%
1%
6%
8%
H
5%
1%.
8%
10%
4%
1%
6%
8%
4%
1%
11%
115%
81
161,
H10%.
15%
3%
1%
2%
H1%
3%
2%
1%
4%
1%
-4%
0%
0%
0%
1%
0%
0%
3.19%"
37%,
31%
38%
30%
38%
?2%
20%
34%
19%
20%
48 students in the
local data and 913 students
in the nationa
data did not respond to
the question on
sex. These numbers, however,
a e included in the totals
presented above.

Table 22
Father's Education forPotential Entering
Students:
Fall Semester 1975
,
SEX
TOTAL*
Father's
IIEducation
Males
Females
Local
National
Local
National
Local
National
(N=2,413)
(N=31,287)
1=2,031
,
.360:t
=41498
N=,68,238
None, or Some Grade,
School
9%
71
,
11%
,
10%
8%
Grade School
,
9%
9%
9%,
9%
9%
9%
Some High school
15%
14%
14%
14%
14%
14%
,Righ School Diploma
19%
24%
16%
23%
18%
23%
Business or Trade
4%
4%
4%
5%
4%
54
School
Soue College
II5%
7%
,
3%
7%
4%
7%
Two-Year Coll. Deg.
21
3%
,
2%
3%
2%
3%
Pour-Year Coil. Deg.
2%
81
2%
3%
2%
7%
Attended Grad. Zchool
1%
2%
1%
2%
It
2%
Graduate Degre
1%
3%
1
1%
3%
1%
3%
Non-Response
I
201
38%
20%
,
20%
1 1
448 students
in
-the question on
sex. These numbers, however,
are included in the totals presented
above.
e local data and 913 students in the national
data aid not respondto
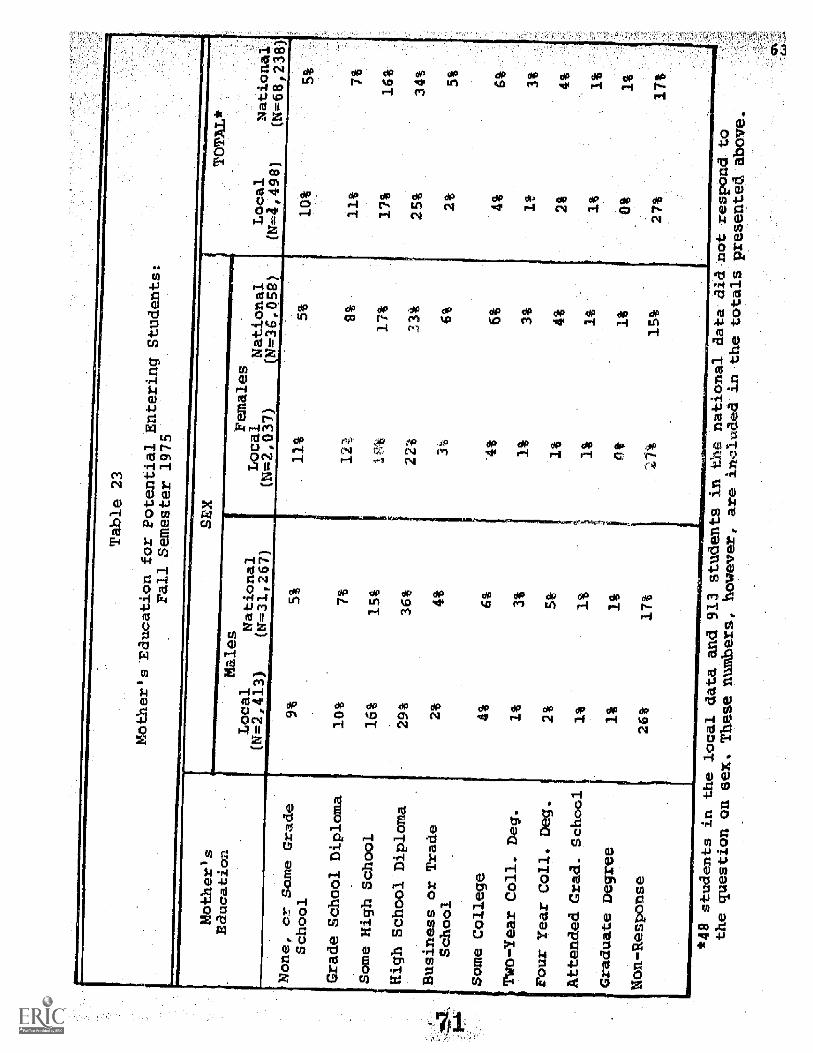
Table 23
Mother's 'Education
for Potential-Entering
Students:
Fall Semester 1975
.
Mother's
Education
SEx
'None or SomeGrade
School,
Grade School Diploma
Some High School
High School Diploma
Business or Trade
School
Some College
'7U101.-qear Coll. Deg.
Four Year Coll. Deg.
Attended Grad. School
Graduate Degree
Non-Response
Males
Local
National
( =2,413)
(N=311267)
9%
10%
16%
29%
2%
5%
7%
15%
36%
4%
4%
6%
1%
3%
2%
5%
1%1%
1%
1%
26%
17%
Females
Local
-National.
(W.20,033)
.
,N=36,058)
11%
1-84
6.
22;
3Ns
6%
TO
TA
L*
Local
National
(N=4,498)
(N=68i238)
10%
11%
17%
25%
2%
5%
4%
6%
*42 students in
the local dataand 913 students in the
national data did
not respond to
the questionon sex. These numbers, however,
are included in the totalspresented above.
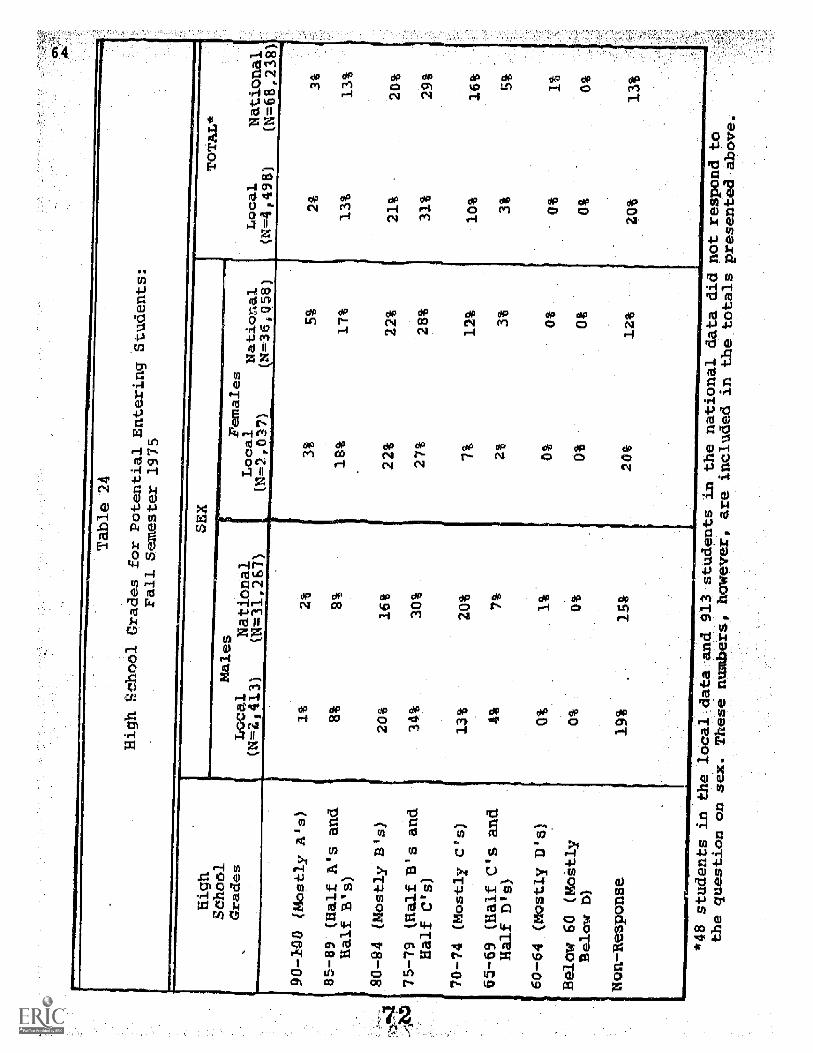
Table 24
High School Grades forPotential Entering
tudents:
Fall Semester 1975
High
School
Crades
SEX
TO
tAL
*
Mostly Als)
1%
85-
(Half A's and.
Half B's)
8%
alesNational
N=36058)
.3%
5%
8%
17%
Local
(H:=4:1 9 8)
-94 Mostly
75-79 (Half B's
Half CH's)
70-74 Mostly c
65-69 (Half C.'s: and.
Half Ws)
60-64 .(MOstly D'
Below 60 (MoStly
Below d)
n.-Response
203
16%
34%
30%
22%
22%
27%
28%
13% 4%
20%
0% 0%
11 0%
21%
31%
29%
12%
2%
3%
OS
OA
0%
181
20%
12%
*48 students in the local,data.and 913 students in thenational data did not respond
to
the question on
sex. These numbers, however,
are included in the totals presented
above.
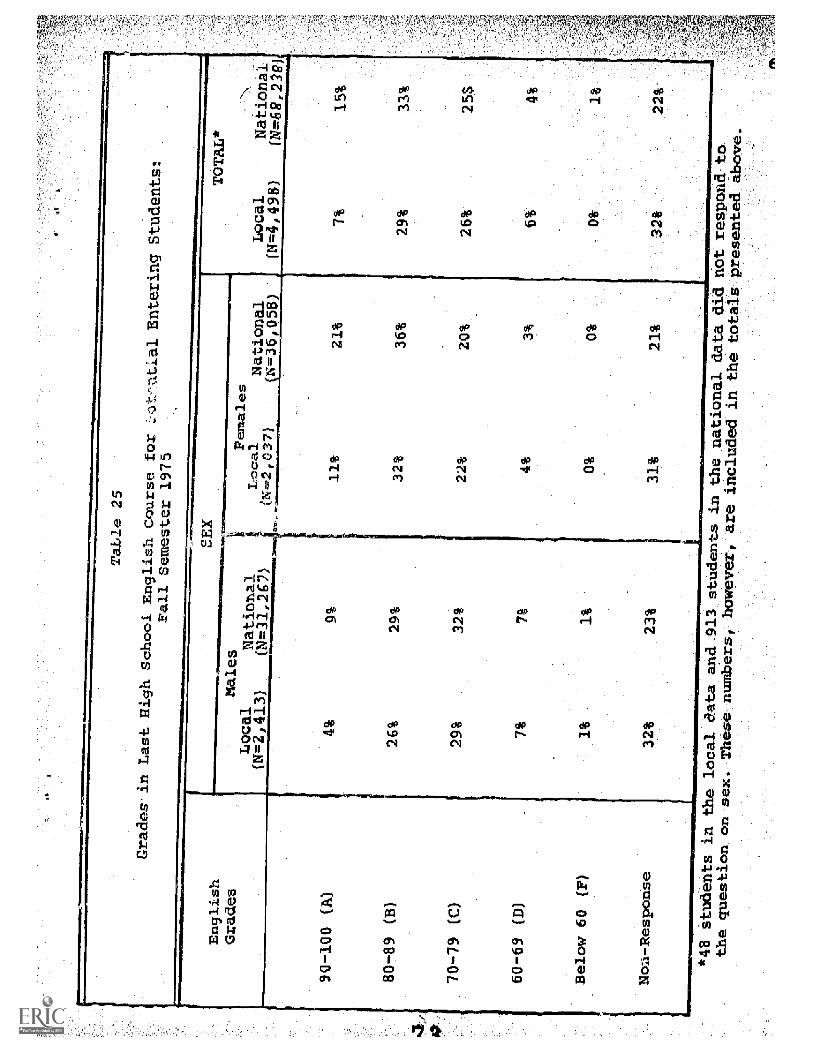
Table 25
Grades.in Last. High School
English. Course, tor
ttia1 Entering Students!
rail Semester-1975
English
Grades
SEX
.1M
MIN
IME
ININ
CIN
...,
males
Females
Local
Natiohal.
Local
(N=
2,41
3)(1
12:3
1,26
-7)
.'''
'--.2
037)
I90
-100
CA
)
ational
=36
/Q58
)
(B)
26%
29%
32%
36%
70-79 tC)
29%
32%
22%
20%
60 69 (D)
Below 60 (F)
Noa-Response
4%
0%
0%
321
%
7%15
%
29%
26%
25$
6%14
%
1%
32%
22%
*48 students in th
local aata and 913 students
in the national data,did not respond to
the question on
sex. These numbers
however, are included in the
totals presented above.

_able 26
Grades in Last High
School Math Course
for Poten ialEntering Students:
Fall, Semester
1975
.
I
SEX
TOTAL*
Local
National '
(N=4,498)
(N=68,238)
8%
10%
19%
23%
31%
/
12%
11%
3%
2%
34%
24%
Math
Grades
Males
Local
National
(N=2,413 )
Ot=31,267)
Females
Local
National
(N=2,037)
gi=36,058)
10%
18%
19%
22%
ZO%
,
12%
2%
21.
0%
34%
23%
90-100 (A)
80-89 (B)
i
70-79 (C)
60-c9 cp)
Below 60 (F)
Non-ResFonse
7%
I
20%
29%
24%
32%
12%
,
1%
,
34%
24%
*48 students inthe local data and 913
students in the national
data did not respondto
the question on
sex. These numbers, however,
are included in the totals
presented above.
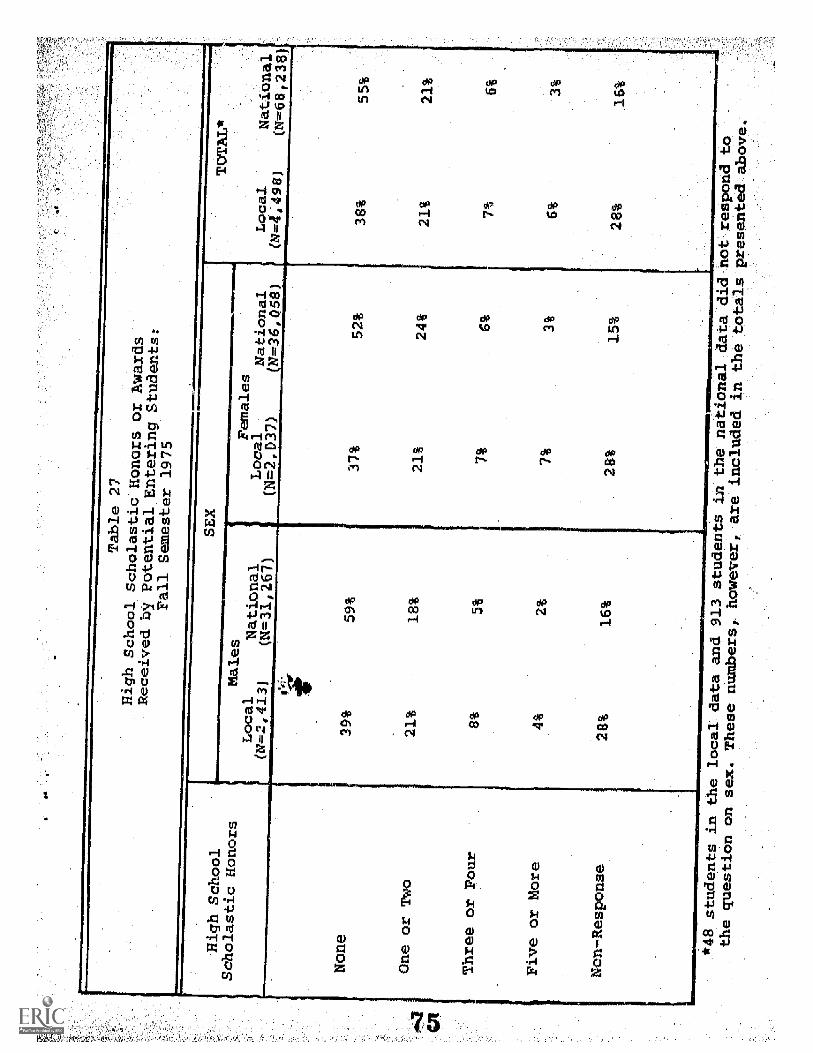
4g
Table 27
High School
Scholastic Honors
or Awards
Received by
Potential Entering
Students:
Fall Semester 1975
High School
Scholastic Honors
T TAL*
Males
Local
National
(&=2, 413)
(N=31,267)
Females
Local
National
(N=2,037)
=5
(.7!771:8)
(N=68,238)
National
0.3
None
One or Two
Three or Four
Five or More
Non-Response
39%
59%
37%
52%
381
21%
18%
211
241
8%
5%7%
6%
41
2%7%
.3%
28%
16%
H
28%
151
*48 students in the
local data and 913
students in the national
data did not respond to
the question onsex. These numbers, however,
are included in the totals
presented above.

Table 28
Termination of Study in Other Institution
Due to Poor Grades for Potential Entering Students:
Fall Semester 1975
Termination. of
Study. in Other
Intiitution
SEX
Local
(N=2 41'
leNational
(N=31,267)
Yes
No
Non-Response,
'85%
2%
88%
14%
10%
Females.
Local
National,
(N=2,037)
11=36,858)
0%1%
871
90%
13%
9%
TOTAL*
Local
National
N=4,498)
(N=68,238)
*48 students in the local data and 913 students in the nationaldata did not respond to
the question on sex. These numbers, however, are included in the totals
presented above.

Reason for
Attendance
es National
(N=31,267)Table 29
Main Reason for Attendance.for
Potential Entering. Students:
.
Fall Semester 1975
Local
(N=2 41.1
Inexpensive
Close to Home
Certain or Almost
Certain of Admission
Friends Attending
General Acadamic
Reputation
Strength of Intended
Major
Impression of Campus
and Students
eligious Affiliation
Not Accepted by First
Choice College
Contact with Repre-
sentative from Inst.
Other
Non-Response
9%
3%
Females
Local
National
N=2,037)
(N=36,058)
12%
29% 3%
1%
2%
2%
2%
6%
7%
7%
8%
38%
16%
H27%
18%
2%
3%
3%
0%
0%
0%
0%
7%
7%
2%
1%
2%
2%
1%
TOTAL*
Local
N=4;498)
National
(N=68,23
512
13%
28%
4%
3%
2%
2%
6%
7%
33%
17%
2%
3%
0%
7%
2%
1%
2%
12%
15%
12%
13%
12%
14%
15%
11%
15%
9%
15%
10%
48 students in the local
data and 913 students in
the national data did
not respond to
the question on
sex. These numbers, however,
are included in the totals presented
above.

Table 30
Degree Objectives of Potential
Entering Students:
Fall Semester 1975
Degree
Objective
es
Local
Nati nal
(=3l, 267)
$ EX
No Special Plans
H4%
8%
One-Year Program
0%
2%
One and One-Half
Year Program
Two-YLar Spializ d
36%
19%
Training Program
Two-Year Liber.n1
Arts Degree (A.A.)
Four-Year Coll. Deg.
23%
Masters Degree
Ph.D., M.D., Other
Professional Degrees
Other
Non-Response
0%
1%
6%
9%
32%
8%
8%
4%
61
3%
4%
TOT
Local.
44,=4,4981
Na: onai
(N=Gaill
Females
Local.
National
(g.=2,037)
:N=.36,059)
4%
6%
4%
7%
5%
0%
3%
I%
I%
11
1%
32%
34%
34%
27%
11%
8%
9%
20%
23%
22%
271
6%
6%
7%
7%
4%
3%
4%
4%
4%
.4%
4%
18%
10%
-17%
11%
*48 students in the
local data and 913 students
in the national data did
not respond to
the question on
sex. These nuithérs, however;
are included in the totals presented
above.
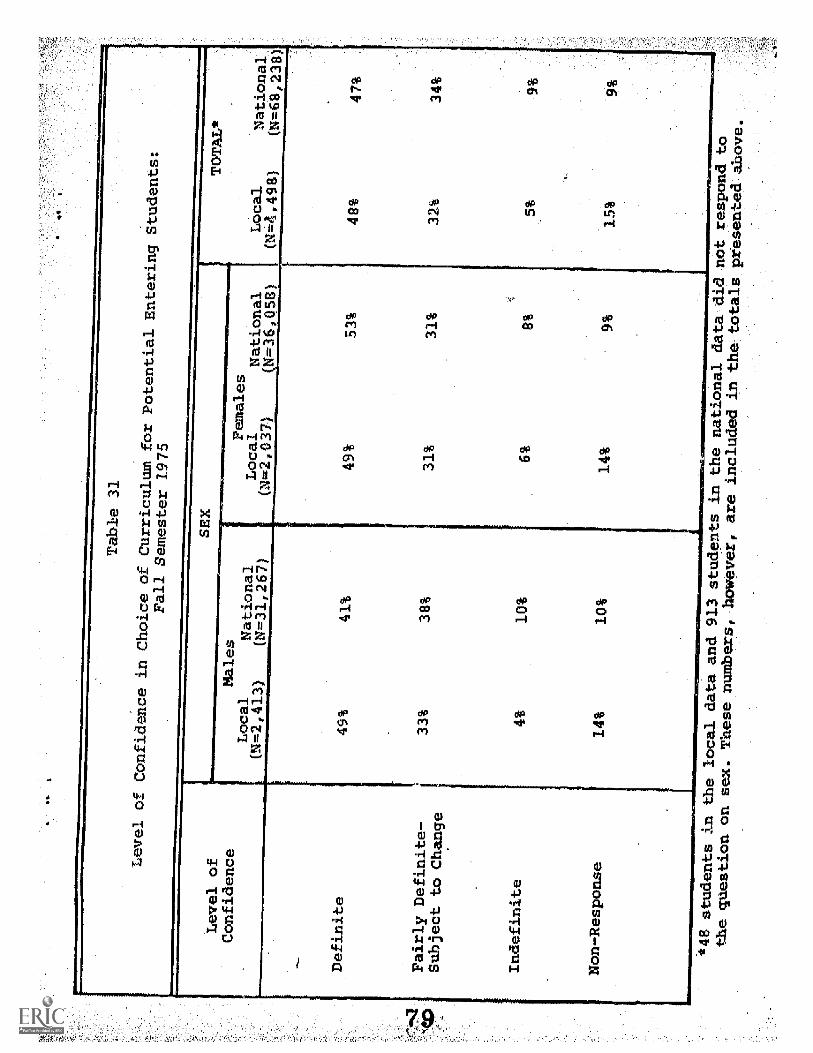
Table. 31.
Level of Confidence
in Choice of Curriculum
for Potential Entering
Students:
Fall Semester 1975
Level of
Confidence
4111
110,
Definite
Fairly Definite-
Subject to Change
Indefinite
Non-Response
Males
Local.
National.
(N=2,41:
N=31,267)
SEx.
Females
Local
National
Local
National
N=2,037)
N=36,0.58)
074,49
(N=68,238)
TOTAL*
49%
41%
49%
53%
H48%
47%
33%
38%
31%
31%
32%
34%
4%.
10%
6%
8%
5%
,9%
14%
10%
14%
9%
15%
9%
*48 students in
the local data and 913
students in the national
data did not respondto
the question on
sex. These numbers, however,
are included in the totals
presented above.
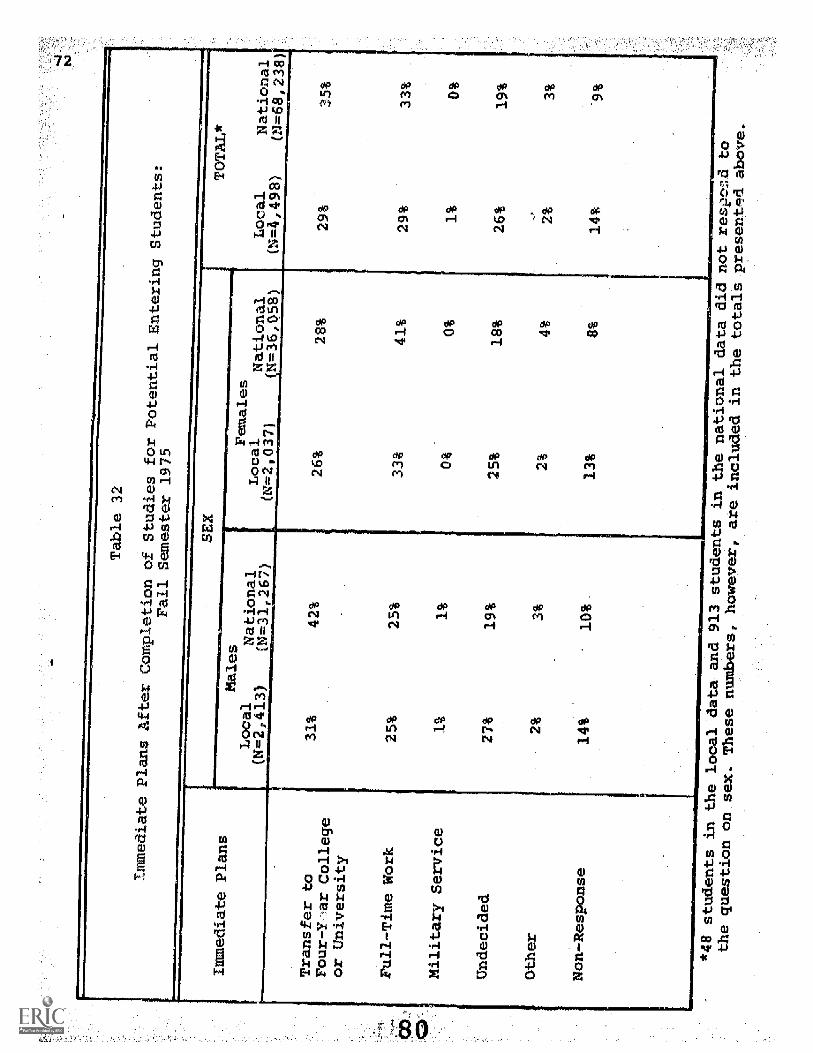
Table 32
mmediate Plans After
Completion of Studies
for Potential Entering
Students:
Fall Semester 1975
SEX
TOTAL*
Immediate Plans
Males
Local
National
'
(N=2,413).
N=31,267)
Females
Local
National
(N=2,037)
N=36,058)
Local
(N=
4 4
98)
National
l=68
, 2
Transfer to
31%
42%
26%
28%
29%
35%
Four-Y ar College
or University
Full Time Work
25%
25%
3.
411
29%
33%
Military Service
1%
1%
0%
1%
0%
Undecided
27%
19%
25%
181
26%
19%
Other
2%
3%
2%
4%
2%
3%
Non-Response
14%
10%
13%
8%,
14%
9%
*48 students in
the local data and 913
students in the national
data did not resi.,v1,
the question on
sex. These numbers, however,
are included in the totals
presentod above.

.100
1=11
.11i
Table 33
Major nell of Study
Planned for Transfer
to a Four-Year Inst.':
on for Potential Entering
Students:
Semester 1975
Major Field
of Transfer
SEX
Biology
Science or Math
Social Science
Humanities or
Fine Arts
Education
Business
Engineering
Other
Undecided
Not Transfer
Non-Response
Males
Local
National.
(N=2,413,
(N=31,267)
5%
6%
1%
2%
3%
6%
2%
4%
2%
2%
6%
15%
17%
9%
10%
9%
18%
16%
16%
19%
13%
Females
Local
-National
(N=2,037)
N=36,058)
13%
1%
6%.
3%
5%
9%
0%
5%
13%
33%
12%.
TOTAL*
Local
(g=4,49 )
National
(N=68,238)
9%
10%
1%
1%
3%
6%
2%
3%
4%
4%
8%
12%
9%
4%
8%
7%
17%
14%
20%
26%
19%
13%
*48 students in
the local data and 913
studen s in the national
data did not respond to
the question on
sex. These numbers, however,
are included in the totals
presented above.

"1".
"
-Table 34
Perceived Importance
of Grades forPotent al Entering
Students:
Fall Semester
1975
Perceived
Importance
of Grades
SEX
Local
(N=2,41
LesNational
44=21,267)
Females
Local
Nat
iona
l(N=2,037)
.N.=
058)
Local
National
(N=4,498)
(N=68, 238)
Not tmportant
Moderate, v
Important
12%
17%
10%
14%-
Quite Important
Very Important
No -.Response
27%
31%
37%
46%
24%
31%
49%
42%
16%
12%
*48 students in the
local data and 913 studen
s in the nati nal data did
not respond to
the question on sex. Thesenumber
however, are included irk
the totals presented above.

SEX,
Require
Assistance
a i es.
Local
National
N=2,41
(N=31,267)
Females
Local
National
Local
Nation
(N=2,037)
N=36,058)
(N= ,498)T
OT
'
Yes
45%
44%
50%
42%
47%
43%
34%
41%
30%
45%
32%
43%
21%
14%
20%
13%
21%
14%
No
Non-Response
*48 students, in the
local data. and 913 students in the
national data did not respond
to
the: question on.
sex. These nutbers, however, are: included in
the totals, presented above.

Table 36
Need. for Assistance in
Developing Study Techniques
]for Potential Entering.
Students:
Fall. Semester 1975
Require
AsPstance
Males
Local
National
(N=2,413)
(N=31,267)
11
Yes
49%
54%
No
29%
32%
Non-Response
22%
15%
SEX
Females
Local
National
(N=2,037)
1N=36,..Q
52%
52%
TOTAL*
Local
National.
(N=4, 498)
N=68 -238)
50%
*48 students in the
local data and 913 students in the national
data did not respond to
the question on Lex. Thesenumbers, however, are included in the
totals presented above.

Table 37
se
Need for Assistance
in. Finding Employment
for Potential Ente.
Fall Semester 1975
g S.
.dents:
SEX
TOTAL*
Require
Assistance
Females
Local
National.
Local
Natioma
N=2,037)
=36,058)
(N=4,498)
-=68,23
Yes
54%
36%
56%
41%
55%
39%
No
Non-R ponse
25%
48%
21%
16%
22%
45$
23%
46%
22%
15%
22%
15%
'*48 students
in the local data
and 913 students
in the national
data did not respond
the question
on sex. These numberF,
however, are included
in the totals
presented above.
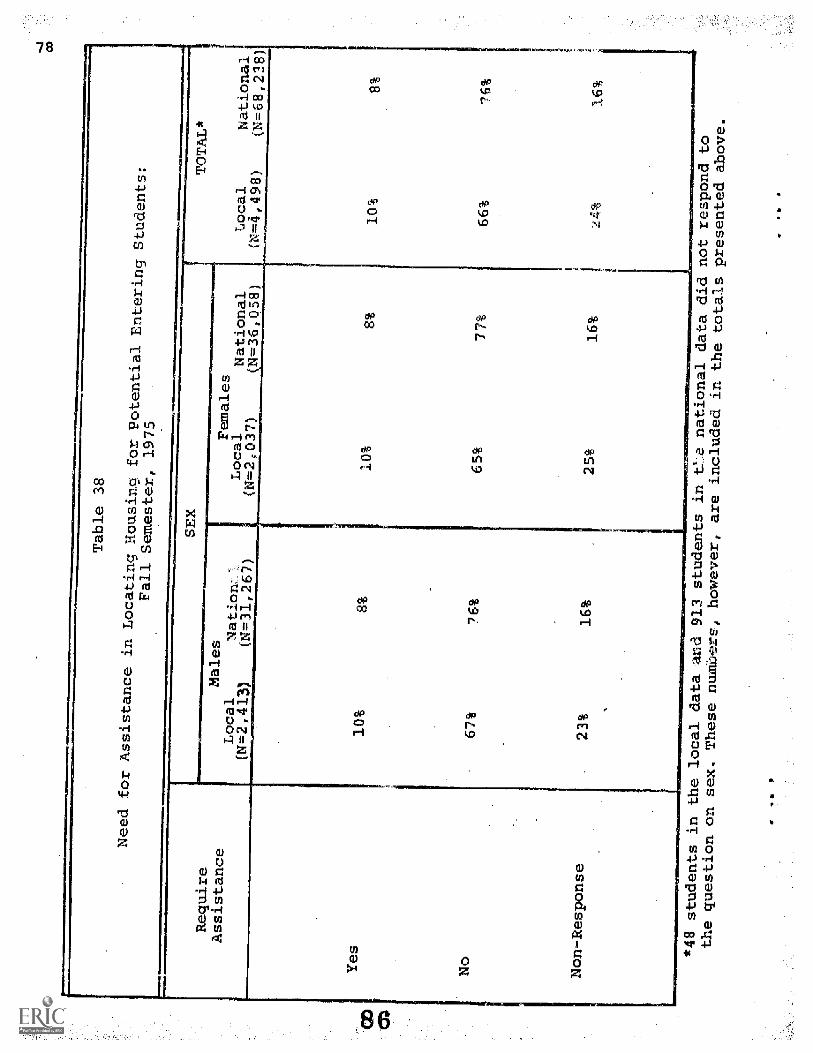
Table 38
Need for Assistance
in Locating Housing
for Potential Entering
Students:
Fall Semester,
1975
Require
Assistance
Males
Local
Nation:
(N=2,413)
(N=31,267)
Yes
10%
SEX
Allo
w
Females
Local
National.
(N=2
Ii=3.6,058)
8%
L10%
8%.
67%
76%
65%
77%
Non-Response
23%
16%
*48 students in the
local data and 913 students in
le_e national data didnot respond to
the question on
sex. These numuers, however,
are included in the totals presented
above.
25%
TOTAL*
Local
National
4,498)
(N=68,238)
10%
8%
66%
76%
16%
16%

*A
**
Table 39
Need for Financial
A'A for Potential
Entering Students:
Fall Semester,
1975
Require
Financial
Aid
Yes
No
Non-Response
Local
(N=2,41
55%
alesNational
(N=31,267)
38%
25%
47%
SEX
Females
Local
National
(N=2,037)
N=36,058)
TOTAL*
Local
N=4,498)
59%
46%
National
(N=68,238)
57%
42%
19%
40%
22%
43%
20%
15%
22%
14%
21%
15%
*48 students in
the local data
and 913 studen s in thenational data did
not respond to
the questionon sex. These numbers,
however, are included in
the totals presented
above.

03
.11
Table 40
AM
MIN
ER
"Jor
Need for Educational. and.Vocational. Counseling. forPotential Entering. Students:
Fall-Semester, 1975
SEX
TOTAL*
1
Local
National
(T=4,498)
N=68,238
Require
Counseling
Local,
N=2,41
MalesNational
(N=31,267)
Fema es
Local.
(N=2,037)
National.
(N=36,058)
Yes
No
Non-Response
55%
24%
22%
52%
15%
56%
21%
2
55%
30%
15%
55%
22%
2373
54%
31%
15%
*48 students in the
local data and 913 students in
the national data did
not respond to
the question on
sex. These number, however,
are included in the totals presented
above.
a
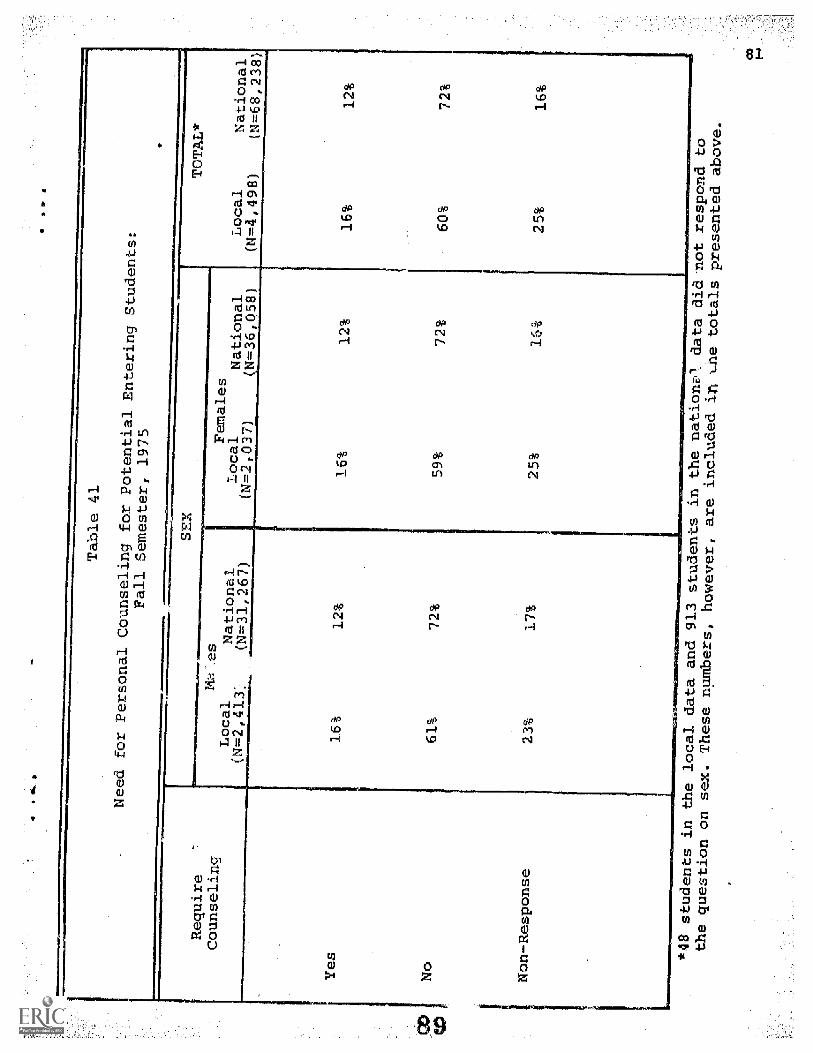
*
Table 41
Need for Personal
Counseling for Potential
Entering S udents:
Require
Counseling
Yes
No
Non
-Res
pons
e
Fall Semester, 1975
SEX
TOTAL*
Local
National
N=4,498)
=68,238)
Local
(N=2,41.3
esNational.
(N=31,267)
Females
Local.
National
N=2.0
N=36,058
16%
61%
23%
12%
72%
17%
16%
59%
25%
12%
72%
16%
16%
60%
25%
12%
72%
16%
*48 students in
the local data and 913
students in the nati np
the question on
sex. These numbers, however,
are included in
data did not respond
e totals presented above.

z0.
0Table 42
Future Enrollment Plans of Potential
Ent ring Students:
Fall Semester, 1975
Plans To
Return
SEX
Males,
Local
National.
(N=2,413)
(N=31,267)
Full-Time
Three-Qua' ers
Time
One-Half Time.
One-Quarter or
Less,
Non-Response
Females
Local
National
(N=2,037)
N=36,058)
72%
72%
69%
70%
4%
1%
18%
6%
3%
4%
6%
9%
3%
7%
1.0%
H
TOTAL*
Local
N=4,498)
National
(N=68,238
70%
71%
4%
5%
6%
8%
2%,
5%
19%
11%
*48 .students in the local data and 913
students in the national data did nf3t respond to-
the question, on sex. These numbers, however,
are included in the, totals presented above.

4