LSF9 Balta Issuer S.à r.l. 2017 · • rugs: woven and tufted area rugs, known under the brand...
40
ANNUAL report 2017 LSF9 Balta Issuer S.à r. l. Registered office: 5, rue Guillaume Kroll, L-1882 Luxembourg R.C.S. Luxembourg: B 198084 LSF9 Balta Issuer S.à r.l. Senior Secured Notes due 2022 Annual report ended December 31 2017
Transcript of LSF9 Balta Issuer S.à r.l. 2017 · • rugs: woven and tufted area rugs, known under the brand...

ANNUAL report
2017
LSF9 Balta Issuer S.à r. l.
Registered office: 5, rue Guillaume Kroll, L-1882 Luxembourg
R.C.S. Luxembourg: B 198084
LSF9 Balta Issuer S.à r.l.
Senior Secured Notes due 2022
Annual report ended December 31 2017

BA
LTA
IS
SU
ER
A
NN
UA
L R
EPO
RT
2017
32
TABLE OF contentsIMPORTANT NOTICE 4
THE GROUP AT A GLANCE 6
SECTION I: MANAGEMENT REPORT 14
I.1. HISTORY OF THE COMPANY 15
I.2. HIGHLIGHTS AND KEY FIGURES 15
I.3. BUSINESS REVIEW 17
I.4. FINANCIAL REVIEW 19
I.5. OTHER REVIEW 20
SECTION II: CONSOLIDATED FINANCIAL STATEMENTS 24
II.1. CONSOLIDATED STATEMENT OF COMPREHENSIVE INCOME FOR THE PERIOD ENDED DECEMBER 31 25
II.2. CONSOLIDATED STATEMENT OF FINANCIAL POSITION AS AT DECEMBER 31 26
II.3. CONSOLIDATED STATEMENT OF CASH FLOWS FOR THE PERIOD ENDED DECEMBER 31 27
II.4. CONSOLIDATED STATEMENT OF CHANGES IN EQUITY FOR THE YEAR ENDED DECEMBER 31 28
II.5. NOTES TO THE CONSOLIDATED FINANCIAL STATEMENTS 30
Note 1. Accounting policies 30Note 2. Critical accounting estimates and judgements 41Note 3. Reconciliation of non GAAP measures 43Note 4. Segment Reporting 44Note 5. Business combinations 44Note 6. Goodwill 47Note 7. Employee benefit expenses 48Note 8. Other income and expense 49Note 9. Depreciation/amortization 49Note 10. Integration and restructuring expenses 49Note 11. Finance expense 50Note 12. Income tax benefit / expense 51Note 13. Other Intangible assets 52Note 14. Property, plant and equipment 53Note 15. Deferred income tax assets and liabilities 54Note 16. Inventories 55Note 17. Trade and other receivables 56Note 18. Cash and cash equivalents 57Note 19. Share capital and share premium 57Note 20. Other comprehensive income 57Note 21. Retained earnings 58Note 22. Preferred Equity Certificates 59Note 23. Senior Secured Notes 59Note 24. Senior Term Loan Facility 60Note 25. Bank and other borrowings 60Note 26. Leases 62Note 27. Net Debt reconciliations 63Note 28. Additional disclosures on financial instruments 64Note 29. Financial risk management 64Note 30. Employee benefit obligations 69Note 31. Other payroll and social related payables 70Note 32. Provisions for other liabilities and charges 70Note 33. Trade and other payables 70Note 34. Government grants 71Note 35. Earnings per share 71Note 36. Dividends per share 72Note 37. Commitments 72Note 38. List of consolidated companies 72Note 39. Related party transactions 73Note 40. Fees paid to the Group’s auditors 74Note 41. Share based payments 74
II.6. AUDIT REPORT 76

BA
LTA
IS
SU
ER
A
NN
UA
L R
EPO
RT
2017
54
IMPORTANT NOTICEIn this report, the terms “Group,” “we,” “us” and “our” refer to the Company and its subsidiaries.
This report is not being made, and this report has not been approved, by an authorized person for the purposes of section 21 of the Financial Services and Markets Act 2000, as amended (the “FSMA”). This report is only being distributed to and is only directed at (i) persons who are outside the United Kingdom or (ii) to investment professionals falling within Article 19(5) of the Financial Services and Markets Act 2000 (Fi-nancial Promotion) Order 2005 (the “Order”), (iii) high net worth entities, and other persons to whom it may lawfully be communicated, falling within Article 49(2)(a) to (d) of the Order or (iv) any other person to whom it may otherwise lawfully be communicated without contravention of Section 21 of the FSMA (all such persons in (i), (ii), (iii) and (iv) above together being referred to as “relevant persons”). The securities referred to herein are only available to, and any invitation, offer or agreement to subscribe, purchase or otherwise acquire such securities will be engaged in only with, relevant persons. Any person who is not a relevant person should not act or rely on this report or any of its contents. Stabilization in respect of the Senior Secured Notes may be conducted in accordance with applicable laws.
This report may contain “forward looking state-ments” within the meaning of the U.S. federal securities laws and the securities laws of certain other jurisdictions. In some cases, these forward looking statements can be identified by the use of forward looking terminology, including the words “aims,” “anticipates,” “believes,” “contin-ue,” “could,” “estimates,” “expects,” “forecasts,” “future,” “guidance,” “intends,” “may,” “ongo-ing,” “plans,” “potential,” “predicts,” “projects,” “seek,” “should,” “target,” “will,” “would” or, in each case, their negative or other variations or comparable terminology or by discussions of strategies, plans, objectives, targets, goals, investments, future events, beliefs or intentions. These forward looking statements are based on
plans, estimates and projections as they are currently available to our management. Such forward looking statements are not guarantees of future performance and are subject to, or are based on, a number of factors, assumptions and uncertainties that could cause actual results to differ materially from those described in the forward looking statements. Due to such uncer-tainties and risks, readers are cautioned not to place undue reliance on such forward looking statements. Any forward looking statements are only made as at the date hereof and, ex-cept to the extent required by applicable law or regulation, we undertake no obligation to publicly update or publicly revise any forward looking statement, whether as a result of new information, future events or otherwise.
The financial information herein includes certain non-IFRS measures that we use to evaluate our economic and financial performance. These measures include, among others EBITDA, EBITDA Margin, Adjusted EBITDA, Adjusted EBITDA Margin and Operating Profit Before Exceptional Items. We present non-IFRS measures because we be-lieve that they and similar measures are widely used by certain investors, securities analysts and other interested parties as supplemental measures of performance and liquidity and are intended to assist in the analysis of our operating results, profitability and ability to service debt. EBITDA and Adjusted EBITDA are not measures of financial performance under IFRS and should not be considered in isolation or as an alter-native to any other measures of performance derived in accordance with IFRS. You are en-couraged to evaluate these adjustments and the reasons we consider them appropriate for supplemental analysis. In evaluating Adjusted EBITDA, you should be aware that in the future we may incur expenses that are the same as or similar to some of the adjustments in this pres-entation. Our presentation of Adjusted EBITDA should not be construed as an inference that our future results will be unaffected by unusual or non-recurring items.

BA
LTA
IS
SU
ER
A
NN
UA
L R
EPO
RT
2017
76
THE
GR
OU
P A
T A
GLA
NC
E
Modern face-fo-face weaving looms in Balta Waregem
THE GROUP at a glance
Balta is the largest producer of textile floor coverings in Europe.With a consolidated revenue of €689m (PF1 2017), its products are exported to more than 130 countries worldwide. In June 2017, Balta Group became a public company listed on Euronext Brussels
REPORTING SEGMENTS
carpet tiles
RUGS RESIDENTIAL COMMERCIAL NON-WOVEN
Balta has four distinct reporting segments:
• rugs: woven and tufted area rugs, known under the brand Balta home.
• residential: wall-to-wall carpet and carpet tiles for private use, with the brands Balta carpets, ITC and Balta carpet tiles.
• commercial: wall-to-wall carpet and carpet tiles for commercial use with the brands, mod-ulyss, Bentley and Arc Edition.
• non-woven: needle felt, carpet backing and technical non-wovens under the Captiqs brand.
Our traditional core markets include the United States, the United Kingdom, Germany, France, and an important presence in Central and Eastern Europe.
34%Residential
29%Commercial
4%Non-Woven
33%Rugs
R E V E N U E
PF1 Revenue 2017 per reporting segment
23%Residential
31%Commercial
3%Non-Woven
43%Rugs
A D J U S T E D E B I T D A
PF1 Adjusted EBITDA 2017 per reporting segment
1 see Glossary on page 112 for the definition of Pro Forma.
LSF9 Balta Issuer S.à r.l. (“The Com-pany”) is a private limited liability company (société à responsabilité limitée) incorporated on June 22 2015 under the laws of Luxembourg as a public limited liability company (so-ciété anonyme). The Company has its Registered Office in 5, rue Guil-laume Kroll, L-1882 Luxembourg and is registered in the R.C.S. Luxembourg with number B 198084. The compa-ny and its subsidiaries is referred as the “Group”. The sole shareholder of the Company, Balta Group NV, is publicly listed on Euronext as from June 14 2017.

BA
LTA
IS
SU
ER
A
NN
UA
L R
EPO
RT
2017
98
THE
GR
OU
P A
T A
GLA
NC
E
RUGSBalta homeMarket position: N° 1 in Europe, N° 2 worldwide and a market leader in the outdoor rugs seg-ment in the United States.Production plants: 3 in Belgium (Avelgem, Sint-Baafs-Vijve & Waregem) and 2 in Turkey (Uşak).Distribution centres: 2 in Belgium (Avelgem & Sint-Baafs-Vijve), 1 in Turkey (Uşak) and 1 in the USA (Rome, Georgia).Distribution channels: major international retailers (such as home improvement, furniture, specialist, discount and DIY stores) and wholesalers, with whom we have long-lasting relationships.Brands: Line A®, Berclon®
www.balta-home.com
Balta home is a global player in machine-woven and tufted rugs for indoor and outdoor use, exporting to more than 100 countries world-wide. Rugs serve a home decoration purpose and as such we believe the rugs market to be a non-cyclical, consumer and lifestyle driven market. An experienced development team is continuously developing new market-oriented collections, designs and colours to meet the re-quirements of all our customers. At Balta home, we are experts in creating rugs in all kinds of
different colours, designs and constructions: from flat-woven via low-pile to high-pile plush rugs, from soft, washable indoor to sustainable, reversible outdoor rugs. From the idea, via the production of raw materials, to the finished prod-ucts; at Balta, every step of the development and production process takes place in-house. This vertical integration enables us to control our high quality standards during every step of the production process. Balta home, with highly automated state-of-the-art production and distribution facilities in Belgium, Turkey and the USA, is well known throughout the world for its creativity, know-how, innovation, quality, service delivery and its broad product range.
RESIDENTIALBalta carpets & ITCMarket position: market leader in Europe with top positions in the UK (Balta carpets), Germany and CEE (ITC).Production plants: Sint-Baafs-Vijve, Tielt and Oudenaarde2 in Belgium.Distribution centres: Sint-Baafs-Vijve and Tielt in Belgium.Distribution channels: major retailers and whole-salers, such as specialized carpet, home im-provement and furniture chains, DIY stores,
independent retailers and carpet fitters.Brands Balta carpets: Stainsafe®, Leonis®, X-Tron®, Made in Heaven®, Woolmaster®
Brands ITC: Satino®, Imprel®, Odyssey®, Wild Luxury®, Amaize®
www.balta-carpets.com and www.itccarpets.com
Balta carpets is the European market leader in the production of tufted and woven broadloom carpet in polypropylene. The market as such is predominantly renovation-driven and to a lesser extent driven by new-build. Key market is the United Kingdom, one of the largest residential carpet markets globally, with a strong traditional preference for carpets as a flooring solution, where we believe we are market leader by volume.
ITC is the European market leader in the pro-duction of tufted broadloom polyamide carpet. ITC produces high-quality products for premi-um residential applications in which creativity, design, appearance, durability and resistance to wear are important. All quality and safety aspects are certified by independent bodies such as PRODIS, GUT and TUV.
Yarn processing at Balta Tielt
Outdoor rug by Balta home
2 November 2017: Balta announced its intention to move residential carpet tufting from Oudenaarde to Sint-Baafs-Vijve and Tielt, and the integration of the Sint-Niklaas warehouse in existing sites.
BA
LTA
IS
SU
ER
A
NN
UA
L R
EPO
RT
2017
1110
THE
GR
OU
P A
T A
GLA
NC
E
Balta carpet tilesProduction plant & distribution centre: Zele in BelgiumDistribution channels: major retailers and whole-salers, such as specialized carpet, home im-provement and furniture chains, DIY stores, independent retailers and carpet fitters.Brand: LCT First® (Luxury Carpet Tiles)
With balta carpet tiles, we can offer a wide range of multi-functional carpet tiles for use in homes. This modular application is clearly on the rise due to its advantages of being easy to transport, fit and replace. Unique laying patterns and exciting combinations are made possible through these carpet tiles.
COMMERCIALmodulyssMarket position: N° 3 in Europe.Production plant & distribution centre: Zele in Belgium.Distribution channels: architects, designers, contractors and distributors (offices, education, health care and hospitality).Brands: modulyss®, LCT Pro® www.modulyss-pureair100.comwww.modulyss.com
modulyss designs and manufactures modular carpet tiles for the international contract market and targets architects and designers looking for high-quality and trend-setting floor coverings. Thanks to the sophisticated manufacturing process, modulyss carpet tiles exceed the limits of performance and design, putting them in a class of their own. In 2017 modulyss invested in a completely new automatic tile-cutting and packaging line doubling capacity. Modulyss carpet tiles are available in a variety of colours, structures and patterns. With their endless cre-ative possibilities, modulyss carpet tiles are the ideal solution to give a floor style and exclusivity. The market as such is mainly renovation-driven and to a lesser extent driven by new-build.
BentleyMarket position: a market leader in the premium US commercial segment.Production plant & distribution centre: Los An-geles in the USA.Distribution channels: architects, designers and contractors (offices, education, health care and hospitality).Brand: Bentley®
www.bentleymills.com
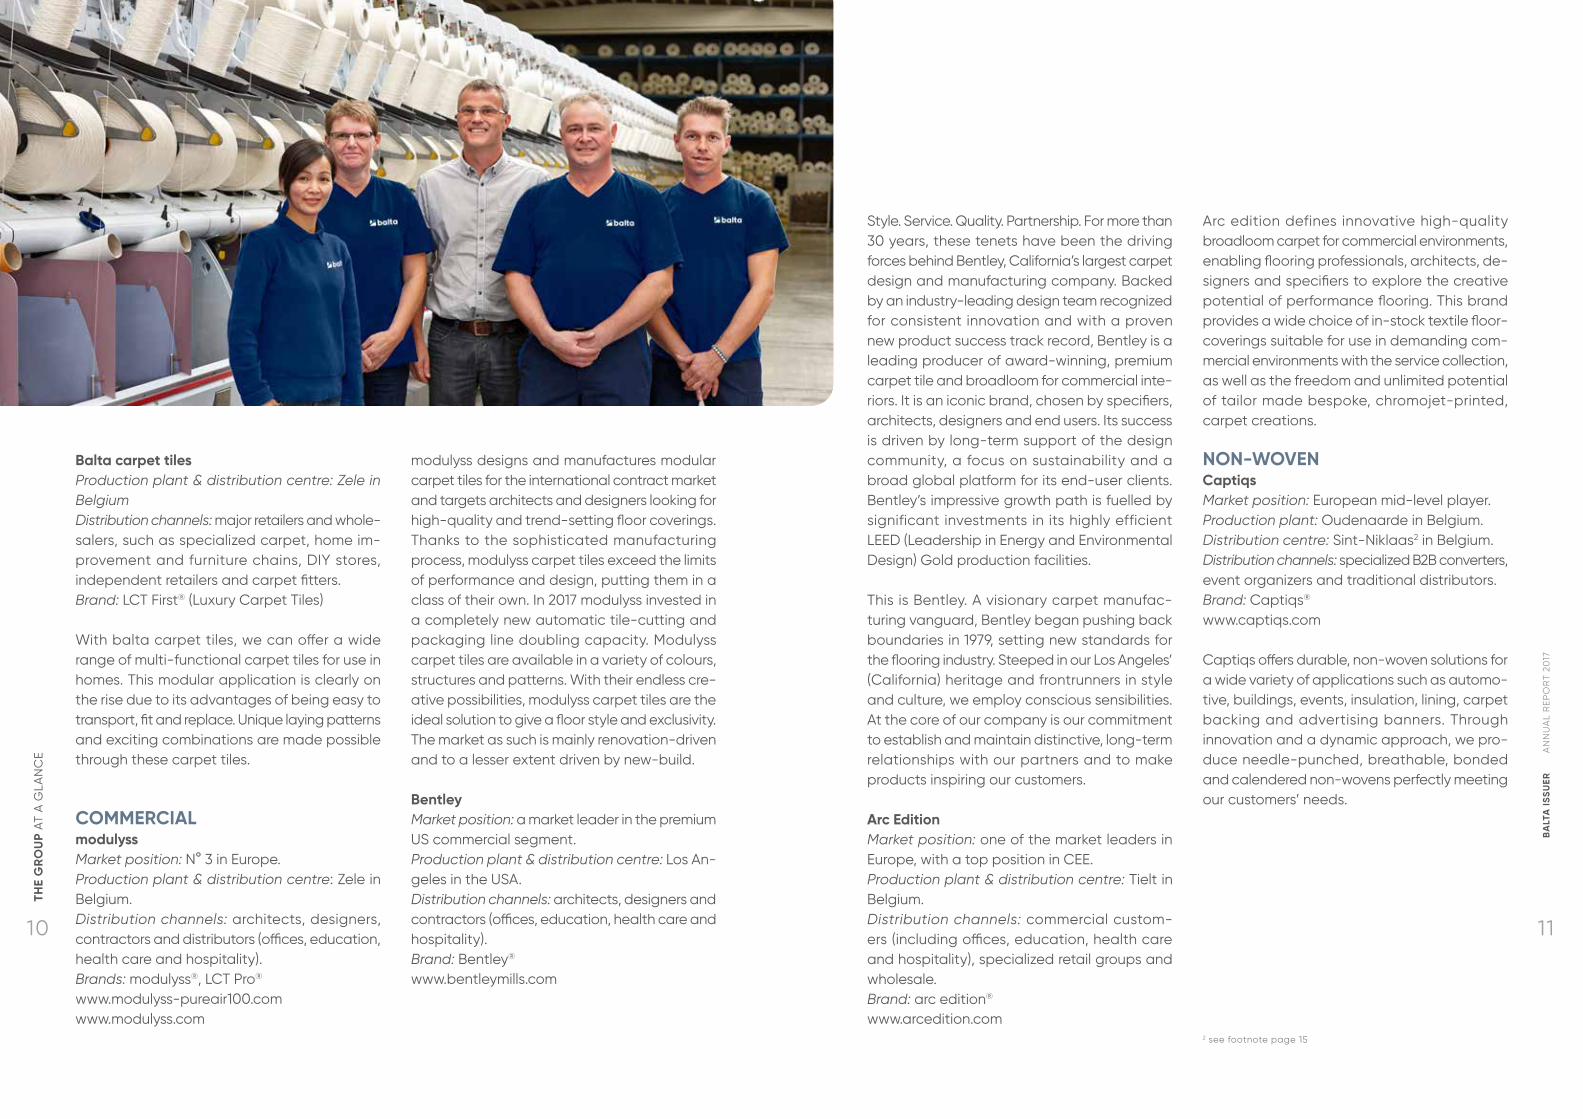
Style. Service. Quality. Partnership. For more than 30 years, these tenets have been the driving forces behind Bentley, California’s largest carpet design and manufacturing company. Backed by an industry-leading design team recognized for consistent innovation and with a proven new product success track record, Bentley is a leading producer of award-winning, premium carpet tile and broadloom for commercial inte-riors. It is an iconic brand, chosen by specifiers, architects, designers and end users. Its success is driven by long-term support of the design community, a focus on sustainability and a broad global platform for its end-user clients. Bentley’s impressive growth path is fuelled by significant investments in its highly efficient LEED (Leadership in Energy and Environmental Design) Gold production facilities.
This is Bentley. A visionary carpet manufac-turing vanguard, Bentley began pushing back boundaries in 1979, setting new standards for the flooring industry. Steeped in our Los Angeles’ (California) heritage and frontrunners in style and culture, we employ conscious sensibilities. At the core of our company is our commitment to establish and maintain distinctive, long-term relationships with our partners and to make products inspiring our customers.
Arc EditionMarket position: one of the market leaders in Europe, with a top position in CEE.Production plant & distribution centre: Tielt in Belgium.Distribution channels: commercial custom-ers (including offices, education, health care and hospitality), specialized retail groups and wholesale.Brand: arc edition®
www.arcedition.com
Arc edition defines innovative high-quality broadloom carpet for commercial environments, enabling flooring professionals, architects, de-signers and specifiers to explore the creative potential of performance flooring. This brand provides a wide choice of in-stock textile floor-coverings suitable for use in demanding com-mercial environments with the service collection, as well as the freedom and unlimited potential of tailor made bespoke, chromojet-printed, carpet creations.
NON-WOVENCaptiqsMarket position: European mid-level player.Production plant: Oudenaarde in Belgium.Distribution centre: Sint-Niklaas2 in Belgium.Distribution channels: specialized B2B converters, event organizers and traditional distributors.Brand: Captiqs®
www.captiqs.com
Captiqs offers durable, non-woven solutions for a wide variety of applications such as automo-tive, buildings, events, insulation, lining, carpet backing and advertising banners. Through innovation and a dynamic approach, we pro-duce needle-punched, breathable, bonded and calendered non-wovens perfectly meeting our customers’ needs.
2 see footnote page 15

BA
LTA
IS
SU
ER
A
NN
UA
L R
EPO
RT
2017
1312
THE
GR
OU
P A
T A
GLA
NC
E
USALOS ANGELES, CA
USAROME, GA
TURKEYUŞAK
AVELGEM OUDENAARDE ST.-NIKLAAS
TIELT WAREGEM ZELE
BELGIUMSINT-BAAFS-VIJVE
(head office)
61,150Solar panels on 5 factory roofs in Belgium
4,053Total number of employees (31/12/17)
more than 1.5 millionboxes of carpet tiles/year.
130+countries we sell into
70,000rugs / working day
33.7 haFactory roof
67Football fields
12.8 million kWh per yearThe electricity consumption of 4,600 Belgian families
-4.75 million kgCO2 per year
40Number of nationalities
752,000 m2
Total manufacturing footprint = 150 football pitches
€ 689 mPro Forma revenue 2017
Balta Avelgem Solar panels on the factory roof of Balta Sint-Baafs-Vijve

BA
LTA
IS
SU
ER
A
NN
UA
L R
EPO
RT
2017
15
We are pleased to report to you on the consolidated op-erations of LSF9 Balta Issuer S.à r.l. (“The company” or “Balta Issuer”) and its subsidiaries (“the Group”) with respect to the period ended on December 31 2017.
I.1. HISTORY OF THE COMPANY
LSF9 Balta Issuer S.à r.l. (“The Company”) is a private limited liability company (société à re-sponsabilité limitée) incorporated on June 22 2015 under the laws of Luxembourg as a public limited liability company (société anonyme). The Company has its Registered Office in 5, rue Guillaume Kroll, L-1882 Luxembourg and is registered in the R.C.S. Luxembourg with number B 198084. The Company was established for the principal purpose of financing the acquisition of Balta Finance, including the repayment of existing indebtedness and payment of fees and expenses for the purpose of facilitating the acquisition.
On June 14 2017, The Company’s corporate form changed from S.A. (société anonyme) to S.à r.l. (société à responsabilité limitée). All references to LSF9 Balta Issuer S.A. have been replaced by LSF9 Balta Issuer S.à r.l. in this document.
On June 14 2015, LSF9 Balta Investments S.à r.l., a subsidiary of the Company, entered into a sale and purchase agreement to purchase from Balta Luxembourg S.à r.l. (the “Seller”) all of the issued and outstanding share capital of Balta Finance S.à r.l. (“Balta Finance”), the former parent entity of the Balta Group and its subsidiaries, and certain intercompany loans between Balta Finance (as borrower) and the Seller (as lender). The closing of the acquisition of Balta Finance was reached on August 11 2015 (“completion Date”)
The Balta Group was founded in 1964 in Belgium. In more than 50 years since its foundation, it has grown into one of the largest European soft-flooring companies, producing rugs, res-idential broadloom, commercial broadloom and carpet tiles and non-woven fabrics for the European and international markets.
On March 22 2017, the Group acquired 98.39% of the Bentley Group of companies, a leader in premium commercial tiles and broadloom car-pets for commercial interiors in the US market. On May 31 2017, the Group acquired the remaining shares of Bentley and gained a 100% control over Bentley as of that moment.
LSF9 Balta Issuer S.à r.l. was a wholly-owned subsidiary of LSF9 Balta Midco S.à r.l., which was in turn controlled indirectly by Lone Star Fund IX.
On May 30 2017, LSF9 Balta Midco S.à r.l. through intermediate holdings, contributed the Group in a newly Belgian created company Balta Group NV which became the sole shareholder of the Company. The new Parent company, Balta Group NV, is publicly listed on Euronext as from June 14 2017.
I.2. HIGHLIGHTS AND KEY FIGURES
In 2017 Balta delivered group Consolidated Revenue of €661.3m, up 18.6% and Adjusted EBITDA of €84.4m up 3.7%, both versus last year. EBITDA margin of 12.8% was down 183bps, reflecting the impact to earnings from currency movements and raw material inflation which was not sufficiently offset by pricing and other compensating actions in the financial year. These results include the contribution from the Bentley Group of companies which was consolidated into the Group’s results as from March 22 2017.
On a Pro Forma basis, including Bentley for both the current and prior year, full year revenue grew 3.1% (organic 4.6%) to €689.0m and Adjusted EBITDA declined 10.3% (organic -3.9%) to €87.4m.
SECTION I: Management Report
15

BA
LTA
IS
SU
ER
A
NN
UA
L R
EPO
RT
2017
1716
SEC
TIO
N I
MA
NA
GEM
ENT
REP
OR
T
I.3. BUSINESS REVIEW
(€ million, unless otherwise stated) 2017 2016 % change Organic growth
FX M&A
Rugs 228.3 214.5 6.4% 8.1% (1.7)% 0.0%
Commercial 171.7 80.1 114.5% 8.0% (1.0)% 107.6%
Residential 234.8 236.8 (0.8)% 0.6% (1.4)% 0.0%
Non-Woven 26.5 26.3 0.6% 0.6% 0.0% 0.0%
Consolidated Revenue 661.3 557.7 18.6% 4.5% (1.4)% 15.4%
Pro Forma Adjustment Bentley 27.7 110.7
Pro Forma Revenue 689.0 668.4 3.1% 4.6% (1.5)%
Rugs 37.6 38.0 (0.8)% 0.3% (1.3)% 0.0%
Commercial 23.9 12.1 98.3% (7.9)% (5.5)% 111.9%
Residential 20.2 28.4 (28.7)% (12.6)% (16.2)% 0.0%
Non-Woven 2.6 2.9 (10.1)% (9.9)% 0.0% 0.0%
Consolidated Adjusted EBITDA 84.4 81.4 3.8% (5.8)% (7.1)% 16.6%
Pro Forma Adjustment Bentley 2.9 16.0
Pro Forma Adjusted EBITDA 87.4 97.4 (10.3)% (3.9)% (6.4)%
Rugs 16.5% 17.7%
Commercial 13.9% 15.1%
Residential 8.6% 12.0%
Non-Woven 9.9% 11.1%
Geconsolideerde Adjusted EBITDA marge 12.8% 14.6%
Pro Forma Adjustment Bentley 10.5% 14.5%
Pro Forma Adjusted EBITDA Marge 12.7% 14.6%
Note: Revenue and Adjusted EBITDA Bentley in Q1 2017 and YTD 2016 are not included in the consolidated figures but are included in the pro forma figures.
RugsThe Rugs division achieved full year organic revenue growth of 8.1%, spread across all three regions of Europe, North America and Rest of the World.
The very strong first half year organic growth of 12.9% was supported by a successful programme of new product developments launched with customers. We saw continued organic growth during the third quarter of 8.7%.
In the fourth quarter, organic revenue was down 2.4%. Some orders moved to January and we had a reduction in orders for our outdoor rugs collections with two US home improvement customers, which will impact revenue in the first half of 2018. A weakening US dollar to Euro, negatively impacted our Consolidated Revenue by 3.4%, leading to a decline of 5.9%.
During 2017, we have invested to strengthen our position for future growth by increasing our US sales and distribution infrastructure. This includes a new warehouse to better support existing customers and increase our reach to new customers and channels for both indoor and outdoor rugs. As a result we have increased our full year fixed costs by €1.7m.
Full year Consolidated Adjusted EBITDA declined by €0.4m to €37.6m with margins at 16.5% (Q4 margin 14.7%). The margin reduction from 17.7% in 2016, reflects the time delay between higher raw material prices and the actions required to compensate, including price increases. Full year EBITDA was impacted negatively by 1.3% from currency movements, which were higher in quarter four at 2.5%.
Growth
€m 2017 2016 Consolidated Organic(2)
Revenue 661.3 557.7 18.6% 4.5%
Adjusted EBITDA(1) 84.4 81.4 3.7% (5.8)%
Adjusted EBITDA Margin 12.8% 14.6% (183) bps
Adjusted Operating Profit(1) 51.9 52.7 (1.5)%
Operating Profit 30.8 49.2 (37.4)%
Profit (loss) for the period (2.9) 25.3 (111.4)%
(1) Adjusted EBITDA and Adjusted Operating Profit: adjustments include impact of purchase price allocation and integration and restructuring expenses.
(2) Organic growth is defined as growth at constant currency and excluding M&A
The net loss for the period in 2017 includes a net €19.7m impact from non-recurring items, com-prised of €18.2m integration and restructuring expenses, €9.3m incremental finance expenses, €1.8m net impact of purchase price accounting and offset by €9.6m of net tax benefits. In the absence of such events, the normalized profit for the period would have been €16.8m. Simi-larly, the profit for the period in 2016 includes a net non-recurring benefit of €8.3m resulting in a normalized net profit of €17.0m.
Net debt at the end of December 2017 is equal to €253.6m, €14.9m lower versus the end of 2016. Leverage has decreased from 3.3x Adjusted EBITDA at the end of 2016 to 2.9x Adjusted EBITDA at the end of 2017. The reduction in net debt has been achieved by reducing gross debt.
As further disclosed, a portion of the primary proceeds of the IPO of Balta Group NV which were subsequently contributed in LSF9 Balta Issuer S.à r.l. were used to redeem €21.2m of the Senior Secured Notes. An additional €33.9m of Senior Secured Notes were repaid in the course of the third quarter and replaced with a €35m Senior Term Loan Facility at a margin of 1.4%, reducing annual interest expenses by €2.1m. Following these transactions, gross debt at the end of 2017 is equal to €290.8m (excluding capitalized financing fees), of which €240.3m Senior Secured Notes, €35.0m Senior Term Loan Facility and €15.5m of finance leases.
December 31 2017 December 31 2016
(€ million) Non-current Current Total Non-current Current Total
Senior Secured Notes 228.1 3.4 231.6 279.3 4.2 283.5
Senior Term Loan Facility 34.8 (.1) 34.7 - - -
Bank and other borrowings 13.3 2.4 15.7 15.4 2.5 17.9
Less: Cash and cash equivalents - (37.2) (37.2) - (46.0) (46.0)
Adjusted for capitalized financing fees 7.0 1.9 8.9 10.7 2.4 13.1
Net debt 283.2 (29.6) 253.6 305.4 (36.9) 268.5
Adjusted EBITDA(1) 87.4 81.4
Leverage 2.9 3.3
(1) Leverage on December 31 2017 is determined as the ratio of net debt to pro forma Adjusted EBITDA.
1716

BA
LTA
IS
SU
ER
A
NN
UA
L R
EPO
RT
2017
1918
SEC
TIO
N I
MA
NA
GEM
ENT
REP
OR
T
I.4. FINANCIAL REVIEW2017 2016
(€ thousands) Adjusted Non-recurring
PPA Reported Adjusted Non-recurring
Reported
Revenue 661,320 - - 661,320 557,685 - 557,685
Raw material expenses (310,391) - - (310,391) (259,472) - (259,472)
Changes in inventories (351) - (3,008) (3,359) 6,055 - 6,055
Employee benefit expenses (151,343) - 10 (151,334) (130,054) - (130,054)
Other income 7,132 - - 7,132 8,171 - 8,171
Other expenses (122,010) - 96 (121,914) (101,017) - (101,017)
Adjusted EBITDA 84,357 - (2,902) 81,454 81,367 - 81,367
Depreciation/amortization (32,469) - (30) (32,499) (28,666) (28,666)
Adjusted Operating Profit 1 51,887 - (2,933) 48,954 52,701 - 52,701
Gains on asset disposals - - - - - 1,610 1,610
Integration and restructuring expenses
- (18,175) - (18,175) - (5,128) (5,128)
Operating profit / (loss) 51,887 (18,175) (2,933) 30,779 52,701 (3,518) 49,183
Finance income 41 - - 41 57 - 57
Finance expenses (28,019) (9,307) - (37,327) (28,608) - (28,608)
Net finance expenses (27,978) (9,307) - (37,285) (28,552) - (28,552)
Profit / (loss) before income taxes 23,909 (27,482) (2,933) (6,506) 24,150 (3,518) 20,632
Income tax benefit / (expense) (7,104) 9,577 1,149 3,622 (7,142) 11,855 4,713
Profit / (loss) for the period from continuing operations
16,805 (17,905) (1,784) (2,884) 17,007 8,338 25,345
(1) Adjusted Operating Profit and Adjusted EBITDA are non-GAAP measures as defined in Note 1.25.
Non-Recurring Items2017 was characterized by several one off events with a material impact on our P&L. The impact of these events on 2017 profit for the period is equal to a net expense of €19.7m. In contrast, the profit realized in 2016 was characterized by a net benefit of €8.3m, mainly as a result of the one-off recognition of deferred tax assets (€10.8m).
The non-recurring events of 2017 are:• Purchase price accounting adjustments fol-
lowing the acquisition of Bentley in March 2017. These adjustments have an impact of €2.9m on EBITDA and €1.8m on the profit for the year
• Integration and restructuring expenses of €18.2m impacting EBITDA, of which €8.2m is in connection with the optimization of the Residential operational footprint and €7.6m is related to strategic advisory services which mainly relate to costs which have been incurred in connection with the capital reorganization. The expected total one off cost for the Resi-dential optimization is €12.4m
• Finance expenses of €9.3m relating to (i) ex-penses of €5.4m in connection with the debt financed acquisition of Bentley, which was fully repaid in June 2017 from the IPO proceeds, and (ii) expenses in connection with the partial early redemption of the Senior Secured Notes (€3.9m)
• €9.6m tax benefit relating to events that are not reflective of Balta’s normal business op-erations, including the re-measurement of deferred tax assets and liabilities following changes in tax legislation.
Net Financing CostsThe net finance expense amounted to €28.0m, excluding €9.3m of financing expenses which related to the previous capital structure and one-off financing fees which are non-recurring. In addition, the full year financing cost does not reflect the run rate benefit of the repayment of €21.2m Senior Secured Notes in June 2017 using the proceeds of the capital increase and the refinancing of €35m of Senior Secured Notes executed in September 2017. These two
CommercialFull year Consolidated Revenue increased by 114.5% to €171.7m, driven by the acquisition of Bentley at the end of quarter one 2017 and the 8.0% organic growth of our European Commercial business. Quarter four organic revenue was up 14.8%, reflecting the return of full supply in our European tile business.
In the US, whilst integrating the Bentley business within the Balta group we have continued to take market share, enabled by our increased investment in sales resource. The acquisition has allowed us to reach a wider pool of customers in North America using Bentley’s customer rela-tionships and a differentiated product portfolio including both Balta’s modulyss products and Bentleys own premium tile range. In quarter four we won a national US retailer account for mod-ulyss tiles, which provides Balta with a platform to grow revenue and profit in a new channel.
Also in Europe, we have continued to invest in our commercial sales resource, and with the start-up issues we experienced in 2017 now resolved, the return will start being delivered in 2018.
Consolidated full year Adjusted EBITDA increased by 98.3% to €23.9m although organic EBITDA was lower by 7.9%. Quarter four organic EBITDA was lower by 38.4% due to negative product mix including the lower margins of our new customer in the US, and the incremental costs associated with resupplying our European customer base following the resolution of the supply issues.
ResidentialFull year Consolidated Revenue of €234.8m, declined by 0.8%, with organic growth of 0.6% impacted by negative currency of 1.4%. The performance reflected a challenging residen-tial market environment in continental Europe and stable total volumes in the UK. Quarter four revenue was a consolidated growth of 1.6%, with organic growth of 2.4% outweighing the negative currency impact of 0.8%.
Residential EBITDA margins continued to be under pressure with quarter four at 7.3% (full year: 8.6%). The drivers of this are the continued adverse effects of currency movements and raw material inflation which have not been fully offset with price increases.
Full year organic EBITDA reduction of 12.6% combined with a negative currency impact of 16.2% resulted in a consolidated Adjusted EBITDA of €20.2m, down €8.2m versus the prior year.
The strategy to grow sales of higher margin new broadloom products led to sales increasing by a third compared to last year, currently repre-senting about 20% of Residential sales versus 15% a year ago and 7% two years ago.
The benefits from the optimization of the Res-idential operational footprint are ahead of schedule and will deliver the full run rate benefits of €8.3m EBITDA in FY19, resulting in a recurring cash-flow improvement of €9.9m with excep-tional one off costs of €12.4m. As a result of the progress we have made, we now expect to finish the move ahead of schedule and expect the benefits to commence early in the second half of the 2018 financial year.
1918

BA
LTA
IS
SU
ER
A
NN
UA
L R
EPO
RT
2017
2120
SEC
TIO
N I
MA
NA
GEM
ENT
REP
OR
T
2018 PRIORITIESWe have laid out our six key priorities for deliv-ering improved performance with much of the benefits being realised in the second half of 2018 and the full run rate in 2019.
Grow profitable revenue1. Continue to grow rugs sales in North America,
by increasing our channel penetration and broadening our channel reach, underpinned by our 2017 investment in sales and distribution infrastructure, with benefits beginning in the second half of 2018
2. Continue sales growth in the Commercial division, leveraging the increased capacity of our new automated commercial manufac-turing line in Europe and our 2017 investment in increasing our sales force, both in Europe and the US. Acceleration of the cross selling of modulyss products through Bentley’s sales force, with new end market opportunities in national accounts
3. Further improve the Residential product mix by growing sales of higher margin products and by capturing the right value for our prod-ucts and services through a strategic pricing excellence project that we have recently launched.
Deliver increased level of cost savings4. Deliver the full benefits of the restructuring
of the operational footprint in Residential of €8.3m EBITDA in 2019, commencing early in the second half of 2018
5. Execute the already started expanded Op-erational Excellence programme, delivering an increased run rate of cost savings from the second half of 2018
6. Execute the planned operational and pro-curement synergies between our European and US Commercial business.
2018 OUTLOOKFollowing the adverse raw material and FX movements, we expect the trends of the second half of 2017 to continue in the first half of 2018. Due to the strong comparative in the first half of 2017 and the timing effect of gains and losses in customers’ ‘share of wallet’, we expect the Rugs division to have mid-teens revenue decline in the first half of 2018; followed by a return to growth in the second half of the year. Together with our growing Commercial division, both in Europe and the US, we are confident that the measures and actions we are taking will deliver a significantly stronger second half run rate.
As a result, with external factors remaining un-changed, we expect 2018 EBITDA to be between €82m and €87m.
Balta is a strong business with a track record of generating revenue growth at good margins, in which we have confidence this will continue.
Environmental and personnel mattersIn 2017, the Group employed an average of 3,714 employees (expressed in full-time equiv-alents) compared to 3,238 per 2016. All efforts are undertaken to ensure that all health and safety measures are in compliance with legal requirements, that appropriate training and career development opportunities are identified and that consultation with employees or their representatives continues at all levels when decisions are taken that are likely to affect employee’s interests.
Research and developmentOne of the competitive advantages of our business is our long history of creativity and innovation. We aim to leverage our research and development to continually optimize our production capacity and provide designs that appeal to our customers. We closely monitor trends in product design and innovation through continuous testing and analysis, with a focus on anticipating our customers’ preferences and market developments. The Group incurred €7.0m of research and development expenses during the 12 months ended in December 31
transactions have reduced our run rate finance expenses to approximately €23m.
TaxationThe reported income tax expense of the year is a credit of €3.6m which includes two items totaling €9.6m which we have treated as non-recurring.
Firstly, we have recognized a positive effect of €10.4m linked to tax reforms, of which €9.0m is linked to the Belgian tax reform which has been substantially enacted on December 22 2017. The highlight of the corporate tax reform is the reduction of the corporate tax rate from 33.99% to 29.58% in 2018 (including crisis contribution, lowered from 3% to 2%) and to 25% as from 2020 (abolishment of crisis contribution). As a conse-quence, deferred tax assets and liabilities have been adjusted to reflect the new tax rates that are expected to apply to the period when the asset is realized or the liability is settled.
Secondly, the deferred tax assets relating to tax credits and loss carryforwards have been adjusted to reflect changes in the probability that these can be used in the future.
When normalizing for all exceptional events of 2017, the Adjusted Effective Tax Rate is equal to approximately 30%. Following the enactment of the tax reform in Belgium, and based on the same scope of activity and financing structure, we anticipate that our future effective tax rate will be between 25% and 27% on a like for like basis.
Business combination accountingIn connection with our acquisition of Bentley Mills, accounting rules require us to adjust various balance sheet accounts, including inventory, to fair value at the time of acquisition. The fair value adjustment is mainly related to inven-tory and represents a one-off, non-recurring, expense of €2.9m on the operational result of 2017. The after-tax impact of business combi-nation accounting on the net result of 2017 is equal to €1.8m.
Following the completion of the purchase price
allocation, goodwill in connection with the Bent-ley acquisition has been reduced from €81.3m to €74.3m and annual depreciation charges will increase as from 2018 by an estimated €0.4m.
Financial risk managementThe Group is exposed to a variety of financial risks, including market risk (mainly foreign ex-change rate risk and commodity price risk), credit risk and liquidity risk. The Group’s overall risk management program focuses on the unpre-dictability of financial and commodity markets and seeks to minimize potential adverse effects on the Group’s financial performance. The Group’s financial risk management is described in Note 29 of the consolidated financial statements.
I.5. OTHER REVIEWCompany’s likely future developmentOUR STRATEGYOur vision is to bring beautiful design at afforda-ble prices to the mid-segment mass markets. As a manufacturer with extensive vertical integration, we leverage our innovation capabilities and operational excellence, to target large segments with attractive margin opportunities. Also, our Bentley brand caters to the top end of the US commercial market. We see ourselves as the preferred partner to our customers, providing leading innovation and great customer service.
In the Rugs division, our goal is to be the global innovation and design leader in machine-made rugs. In Commercial, Balta is the growing chal-lenger in the North American and European commercial carpet and tiles segment. Finally in Residential, we aim to be the leading carpet manufacturer in Europe.
The execution of these goals is based on a three pillar strategy:• strengthen our leading position across core
segments• continue to focus on Operational Excellence• selectively seek complementary acquisition
opportunities
2120

BA
LTA
IS
SU
ER
A
NN
UA
L R
EPO
RT
2017
2322
SEC
TIO
N I
MA
NA
GEM
ENT
REP
OR
T
Start of mandate: June 22 2015End of mandate: June 16 2017
Luca DestitoManagerStart of mandate: April 26 2016End of mandate: June 16 2017
Michael KolbeckManagerStart of mandate: April 26 2016End of mandate: June 16 2017
João Carlos Fernandes da Silva LoureiroManagerStart of mandate: February 10 2017End of mandate: June 16 2017
Delphine André ManagerStart of mandate: June 16 2017End of mandate: October 31 2017
Statutory auditorsThe statutory auditors are PricewaterhouseCoopers Société Coopérative, 2, Rue Gerhard Mercator, B.P. 1443, L-1014 Luxembourg.
2017 compared to the €5.5m of research and development expenses during the 12 months ended in December 31 2016 which are included in the income statement as other expenses.
Prospects and information regarding circum-stances that could material affect the devel-opment of the Group Our potential for future business success and operating profitability must be considered in light of the risks, uncertainties, expenses and difficulties typically encountered by recently organized or combined companies. If we fail to address these risks, uncertainties and difficulties or to manage these expenses adequately, our business, financial condition and operating re-sults may be materially adversely affected and may differ materially from your expectations based on the historical and pro forma financial information provided in this Annual Report.
Acquisition of own sharesThe Group or a direct subsidiary or a person, acting in its own name but on behalf of the Com-pany, has not acquired shares of the Company.
Events after reporting dateWe are not aware of any significant events since December 31 2017 which could be considered as having a material influence on the financial position, financial performance and cash flows of the Company.
DischargeThe Board of Managers requests the Partners of the Group to approve the consolidated financial statements as attached hereto and to grant discharge to the Board of Managers and to the statutory auditors for the exercise of their mandate during the last financial year.
The consolidated financial statements of the Group have been prepared in accordance with International Financial Reporting Standards as adopted by the European Union (IFRS). These Group consolidated financial statements were authorized for issue by the Board of Managers on April 17 2018. The amounts in this document are presented in thousands of Euro, unless otherwise stated. Rounding adjustments have been made in calculating some of the financial information included in this Financial Statements.
Board of ManagersThe Board of Managers of LSF9 Balta Issuer S.à r.l. is as follows:
Kairos Management BVBA, represented by Tom DebusschereManagerStart of mandate: June 16 2017
Tom Gysens BVBA, represented by Tom GysensManagerStart of mandate: June 16 2017
Jean-Philippe KuhnManagerStart of mandate: June 16 2017
Sara SpeedManagerStart of mandate: October 31 2017
Philippe JusseauManagerStart of mandate: June 22 2015End of Mandate: June 16 2017
Patrick SteinhauserManager
2322

BA
LTA
IS
SU
ER
A
NN
UA
L R
EPO
RT
2017
2524
SEC
TIO
N II
CO
NS
OLI
DA
TED
FIN
AN
CIA
L ST
ATE
MEN
TS
2524
II.1. Consolidated statement of comprehensive income for the period ended December 31
For the year ended December 31
(€ thousands) Note 2017 2016
I. CONSOLIDATED INCOME STATEMENT
Revenue Note 4 661,320 557,685
Raw material expenses (310,391) (259,472)
Changes in inventories Note 16 (3,359) 6,055
Employee benefit expenses Note 7 (151,334) (130,054)
Other income Note 8 7,132 8,171
Other expenses Note 8 (121,914) (101,017)
Depreciation / amortization Note 9 (32,499) (28,666)
Adjusted Operating Profit 1 48,954 52,701
Gains on asset disposals - 1,610
Integration and restructuring expenses Note 10 (18,175) (5,128)
Operating profit / (loss) 1 30,779 49,183
Finance income 41 57
Finance expenses Note 11 (37,327) (28,608)
Net finance expenses (37,285) (28,552)
Profit / (loss) before income taxes (6,506) 20,632
Income tax benefit / (expense) Note 12 3,622 4,713
Profit / (loss) for the period from continuing operations (2,884) 25,345
Profit / (loss) for the period from discontinued operations - -
Profit / (loss) for the period (2,884) 25,345
Attributable to:
Equity holders (2,919) -
Non-controlling interest 34 -
II. CONSOLIDATED OTHER COMPREHENSIVE INCOME
Items in other comprehensive income that may be subsequently reclassified to P&L
Exchange differences on translating foreign operations (13,522) (8,013)
Changes in fair value of hedging instruments qualifying for cash flow hedge accounting
123 (116)
Items in other comprehensive income that will not be reclassified to P&L
Changes in deferred taxes (457) 285
Changes in employee defined benefit obligations 1,005 (882)
Other comprehensive income for the period, net of tax (12,850) (8,727)
Total comprehensive income for the period (15,735) 16,618
Basic and diluted earnings per share from continuing operations attributable to the ordinary equity holders of the company
Note 35 (0.02) 1.48
(1) Adjusted Operating Profit / Operating profit/(loss) are non-GAAP measures as defined in Note 1.25 and include impact purchase price accounting in statement above.
The accompanying notes form an integral part of these consolidated financial statements.
SECTION II: Consolidated Financial Statements

BA
LTA
IS
SU
ER
A
NN
UA
L R
EPO
RT
2017
2726
SEC
TIO
N II
CO
NS
OLI
DA
TED
FIN
AN
CIA
L ST
ATE
MEN
TS
2726
II.3. Consolidated statement of cash flows for the period ended December 31
For the year ended December 31
(€ thousands) Note 2017 2016
I. CASH FLOW FROM OPERATING ACTIVITIES
Net profit / (loss) for the period (2,884) 25,345
Adjustments for:
Reclass of capital increase expenses to cashflow from financing activities (gross)
7,119 -
Income tax expense/(income) Note 12 (3,622) (4,713)
Finance income (41) (57)
Financial expense Note 11 37,327 28,608
Depreciation, amortization Note 9 32,500 28,666
Movement in provisions 7,252 -
(Gain) / loss on disposal of non-current assets (58) (1,610)
Fair value of derivatives 8 786
Non-cash impact of purchase price allocation Note 5 2,902 -
Cash generated before changes in working capital 80,503 77,025
Changes in working capital:
Inventories Note 16 (4,280) (5,883)
Trade receivables Note 17 1,747 (8,433)
Trade payables Note 33 (13,556) 10,485
Other working capital 1,545 (5,459)
Cash generated after changes in working capital 65,960 67,735
-
Net income tax (paid) (5,344) (1,478)
Net cash generated / (used) by operating activities 60,617 66,257
II. CASH FLOW FROM INVESTING ACTIVITIES
Acquisition & disposal of property, plant and equipment Note 14 (38,261) (36,483)
Acquisition of intangibles Note 13 (1,673) (1,494)
Proceeds from non-current assets 912 2,408
Acquisition of subsidiary Note 5 (68,752) -
Net cash used by investing activities (107,776) (35,569)
III. CASH FLOW FROM FINANCING ACTIVITIES
Interest and other finance charges paid, net (32,388) (27,814)
Proceeds from borrowings with third parties Note 25 110,000 -
Proceeds from capital increase Note 19 137,677 -
Capital increase expenses (net) (6,292) -
Repayments of borrowings with third parties Note 19, 25 (171,987) (2,349)
Proceeds from contribution in kind 1,343 -
Net cash generated / (used) by financing activities 38,354 (30,163)
NET INCREASE/ (DECREASE ) IN CASH AND BANK OVERDRAFTS (8,806) 526
Cash, cash equivalents and bank overdrafts at the beginning of the period
45,988 45,462
Cash, cash equivalents and bank overdrafts at the end of the period
Note 18 37,182 45,988
The accompanying notes form an integral part of these consolidated financial statements.
II.2. Consolidated statement of financial position as at December 31
For the year ended December 31
(€ thousands) Note 2017 2016
Property, plant and equipment
Land and buildings Note 14 162,103 169,203
Plant and machinery Note 14 130,977 115,016
Other fixtures and fittings, tools and equipment Note 14 18,080 15,019
Goodwill Note 6 198,814 124,673
Intangible assets Note 13 12,218 2,376
Deferred income tax asset Note 15 4,160 18,950
Trade and other receivables Note 17 1,165 138
Total non-current assets 527,517 445,375
Inventories Note 16 147,868 135,320
Derivative financial instruments Note 28 - 46
Trade and other receivables Note 17 62,760 54,930
Current income tax assets 3,914 34
Cash and cash equivalents Note 18 37,182 45,988
Total current assets 251,723 236,318
Total assets 779,240 681,693
Share capital Note 19 137,848 171
Share premium Note 19 155,486 1,260
Preferred Equity Certificates Note 22 - 138,600
Other comprehensive income Note 20 (19,913) (7,063)
Retained earnings Note 21 433 3,351
Other reserves (14,283) -
Total equity 259,571 136,319
Senior Secured Notes Note 23 228,130 279,277
Senior Term Loan Facility Note 24 34,782 -
Bank and Other Borrowings Note 25 13,310 15,388
Deferred income tax liabilities Note 15 54,471 69,775
Provisions for other liabilities and charges Note 32 2,335 -
Employee benefit obligations Note 30 4,127 5,079
Total non-current liabilities 337,156 369,519
Senior Secured Notes Note 23 3,425 4,234
Senior Term Loan Facility Note 24 (108) -
Bank and Other Borrowings Note 25 2,361 2,614
Provisions for other liabilities and charges Note 32 7,316 64
Derivative financial instruments Note 28 2 162
Other payroll and social related payables Note 31 33,359 31,246
Trade and other payables Note 33 132,414 131,562
Income tax liabilities 3,745 5,974
Dividends Payable - -
Total current liabilities 182,514 175,856
Total liabilities 519,668 545,374
Total equity and liabilities 779,240 681,693
The accompanying notes form an integral part of these consolidated financial statements.

BA
LTA
IS
SU
ER
A
NN
UA
L R
EPO
RT
2017
2928
SEC
TIO
N II
CO
NS
OLI
DA
TED
FIN
AN
CIA
L ST
ATE
MEN
TS
2928
(€ thousands)
Sha
re c
ap
ital
Sha
re p
rem
ium
Pref
ered
Eq
uity
C
erti
fica
tes
Oth
er
com
pre
hens
ive
inco
me
Reta
ined
ea
rnin
gs
Oth
er re
serv
es
Tota
l
Non
-con
trol
ling
in
tere
st
Tota
l eq
uity
Balance at January 1 2017 171 1,260 138,600 (7,063) 3,351 - 136,319 - 136,319
Profit / (loss) for the period - - - - (2,919) - (2,919) 34 (2,884)
Other comprehensive income
Exchange differences on translating foreign operations
- - - (13,522) - - (13,522) - (13,522)
Changes in fair value of hedging instruments qualifying for cash flow hedge accounting
- - - 123 - - 123 - 123
Cumulative changes in deferred taxes
- - - (457) - - (457) - (457)
Cumulative changes in employee defined benefit obligations
- - - 1,005 - - 1,005 - 1,005
Total comprehensive income for the period
- - - (12,850) (2,919) - (15,769) 34 (15,735)
Contribution of PEC's into equity - 152,883 (138,600) - - (14,283) - - -
Capital contribution Bentley Management Buy-out
- 1,343 - - - - 1,343 (34) 1,309
Capital contribution in cash 137,677 - - - - - 137,677 - 137,677
Total transactions with the owners 137,677 154,226 (138,600) - - (14,283) 139,020 (34) 138,986
Balance at December 31 2017 137,848 155,486 - (19,913) 433 (14,283) 259,571 - 259,571
The accompanying notes form an integral part of these consolidated financial statements.
II.4. Consolidated statement of changes in equity for the year ended December 31
(€ thousands)
Sha
re c
ap
ital
Sha
re p
rem
ium
Pref
erre
d E
qui
ty
Cer
tific
ate
s
Oth
er
com
pre
hens
ive
inco
me
Reta
ined
ea
rnin
gs
Oth
er re
serv
es
Tota
l
Non
-con
trol
ling
in
tere
st
Tota
l eq
uity
Balance at January 1 2016 171 1,260 - 1,664 (21,995) - (18,900) - (18,900)
Recognition of PECs as equity instrument
- - 138,600 - - - 138,600 138,600
Profit / (loss) for the period - - - - 25,345 - 25,345 - 25,345
Other comprehensive income -
Exchange differences on translating foreign operations
- - - (8,013) - - (8,013) - (8,013)
Changes in fair value of hedging instruments qualifying for cash flow hedge accounting
- - - (116) - - (116) - (116)
Cumulative changes in deferred taxes
- - - 285 - - 285 - 285
Cumulative changes in employee defined benefit obligations
- - - (882) - - (882) - (882)
Total comprehensive income for the period
- - - (8,727) 25,345 - 16,618 - 16,618
Balance at December 31 2016 171 1,260 138,600 (7,063) 3,351 - 136,319 - 136,319

BA
LTA
IS
SU
ER
A
NN
UA
L R
EPO
RT
2017
3130
SEC
TIO
N II
CO
NS
OLI
DA
TED
FIN
AN
CIA
L ST
ATE
MEN
TS
3130
IFRS 12 ‘Disclosure of interests in other entities regarding
clarification of the scope of the standard’.
The following new standards and amendments to standards
have been issued, but are not mandatory for the financial
year beginning January 1 2017 and have been endorsed
by the European Union:
• IFRS 16 ‘Leases’. This standard replaces the current
guidance in IAS 17 and is a far reaching change in ac-
counting by lessees in particular. Under IAS 17, lessees
were required to make a distinction between a finance
lease (on balance sheet) and an operating lease (off
balance sheet). IFRS 16 requires lessees to recognize a
lease liability reflecting future lease payments and a
‘right-of-use asset’ for virtually all lease contracts. For
lessors, the accounting stays almost the same. However,
as the IASB has updated the guidance on the definition
of a lease (as well as the guidance on the combination
and separation of contracts), lessors will also be affected
by the new standard. Under IFRS 16, a contract is, or
contains, a lease if the contract conveys the right to
control the use of an identified asset for a period of time
in exchange for consideration. The impact of changes
in IFRS 16 will be further analysed in the course of 2018.
• IFRS 9 ‘Financial instruments’, effective for annual periods
beginning on or after January 1 2018. The standard ad-
dresses the classification, measurement, de-recognition
of financial assets and financial liabilities and general
hedge accounting. On the classification and measure-
ment the Group’s current assessment did not indicate
any material impact. IFRS 9 requires the Group to record
expected credit losses on all of its debt securities, loans
and trade receivables either on a 12-month or lifetime
basis. While the Group has not yet undertaken a detailed
assessment of how its provisions would be affected by
the new model, it may result in an earlier recognition of
credit losses. Nevertheless the Group does not expect
any material impact since it uses credit insurances as a
means to transfer credit risk related to trade receivables
and the historical default rates for 2016 and 2017 are not
exceeding 0.1 % for 2016 and 2017. Moreover there are no
significant receivables due for more than 3 months for
which no provision has been set up. The Group is currently
only applying limited cash flow hedging for expected
cash flows. No significant changes are expected under
IFRS 9 for the current cash flow hedge documentation
and accounting treatment.
• IFRS 15 ‘Revenue from contracts with customers’. Com-
panies using IFRS will be required to apply the revenue
standard for annual periods beginning on or after
January 1 2018. IFRS 15 specifies how and when revenue
is recognized and is prescribing relevant disclosures.
The standard supersedes IAS 18 Revenue, IAS 11 Con-
struction Contracts and a number of revenue related
interpretations. The new standard provides a single,
principles-based five-step model to be applied to all
contracts with customers. Furthermore, it provides new
guidance on whether revenue should be recognized at
a point in time or over time.
The revenue is currently recognized when the goods are
delivered which is the point in time at which the customer
accepts the goods and the related legal title, i.e. when
risks and rewards of the ownership are transferred. Revenue
is only recognized at this moment and provide that the
other requirements are also met, such as, no continuing
management involvement with goods, the ability to reliably
measure revenue and costs and a sufficiently probable
recovery of the consideration. Under IFRS 15, revenue will
be recognized when a customer obtains control of the
goods. Based on the initial assessment, the Group did
not identify material differences between the transfer of
control and the current transfer of risk and rewards. As
such, at this stage the Group does not anticipate material
differences in the timing of revenue recognition for the sale
of products. Volume discounts and rebates are currently
accrued over the year based on the sales realized per
customer and taking into account the expected yearly
volumes per customer. There are no other significant
incremental contract costs. Consequently the Group
does not expect any material impact under IFRS 15. In
general, the Group does not have any material contracts
that include separate performance obligations nor any
special transactions such as consignment, bill and hold
arrangements, warranty programs, upfront payments or
any third party involvement.
• Amendments to IFRS 15 ‘Revenue from contracts with
customers’- Clarifications (effective January 1 2018).
These amendments compromise clarification guidance
on identifying performance obligations, accounting for
licenses of intellectual property and the principle versus
agent assessment.
The following new standards, amendments and interpreta-
tion to standards have been issued, but are not mandatory
II.5. Notes to the consolidated financial statements
Note 1. Accounting policiesThe principal accounting policies applied in the prepa-
ration of these consolidated financial statements are set
out below. These policies have been consistently applied
to the year presented, unless otherwise stated.
Note 1.1. Basis of preparation
Basis of preparation
These consolidated financial statements of LSF9 Balta
Issuer S.à r.l. (“the Company” or “Balta Issuer”), registered
at 5, Rue Guillaume Kroll, L-1882 Luxembourg (R.C.S. Lux-
embourg: B 198084) and its subsidiaries (“the Group”) have
been prepared in accordance with International Finan-
cial Reporting Standards as adopted by the European
Union (“IFRS”). These include all IFRS standards and IFRIC
interpretations issued and effective at December 31 2017.
The financial statements of the Company for the period
January 1 2017 to December 31 2017 comprise the Company
and its subsidiaries (together referred to as the “Group”
and individually as “Group entities”).
These consolidated financial statements are presented
in Euro, which is the Group’s presentation currency and
the functional currency of the Company. All amounts in
these consolidated financial statements are presented
in thousands of Euro, unless otherwise stated. Rounding
adjustments have been made in calculating some of
the financial information included in these consolidated
financial statements.
These financial statements are prepared on a going con-
cern basis, i.e. assuming that operations will continue in
the foreseeable future.
Any events and/or transactions significant to an under-
standing of the changes since December 31 2016 have
been included in these notes to the consolidated financial
statements and mainly relate to the capital reorganization
of the Group in 2017 and relate to the acquisition of the
Bentley Mills Group of companies which was completed
on March 22 2017.
The equity of the Group was reorganised in view of the IPO
of the parent company (Balta Group NV) which occurred
in the course of 2017. In preparation of this IPO, Balta
Group NV (parent company), which was established by
the same partners as those of LSF9 Balta Issuer S.à r.l.,
was incorporated on March 1 2017 for the purpose of ac-
quiring LSF9 Balta Issuer S.à r.l. and its subsidiaries. The
acquisition of LSF9 Balta Issuer S.à r.l. by Balta Group NV
occurred on May 30 2017 through a contribution in kind
in the Share Capital of Balta Group NV. We refer to note
19 for more information.
The preparation of financial statements in conformity with
IFRS requires the use of certain critical accounting estimates.
It also requires management to exercise its judgement in
the process of applying the Group’s accounting policies.
The areas involving a higher degree of judgement or
complexity, or areas where assumptions and estimates
are significant to the consolidated financial statements
are disclosed in Note 2.
New standards and amendments to standards
The following interpretations and amendments to stand-
ards are mandatory for the first time for the financial year
beginning January 1 2017 and have been endorsed by the
European Union. These have not had a material impact
on the 2017 financial statements of the Company.
• Amendments to IAS 7 Statement of Cash Flows-Disclosure
Initiative, effective for annual periods beginning on or
after January 1 2017. These amendments introduce an
additional disclosure that will enable users of financial
statements to evaluate changes in liabilities arising
from financing activities. The amendment is part of the
IASB’s Disclosure Initiative, which continues to explore
how financial statement disclosure can be improved.
We refer to Note 27 for disclosure.
• Amendments to IAS 12 Income Taxes – Recognition
of Deferred Tax Assets for Unrealized Losses, effective
January 1 2017. These amendments make clear how to
account for deferred tax assets related to debt instru-
ments measured at fair value.
The following interpretations and amendments to stand-
ards are mandatory for the first time for the financial year
beginning January 1 2017 (however not yet subjected to
EU endorsement). These have not had an impact on the
2017 financial statements of the Company:
• Annual improvements Cycle – 2014-2016, effective
January 1 2017. The amendment impacts the standard:

BA
LTA
IS
SU
ER
A
NN
UA
L R
EPO
RT
2017
3332
SEC
TIO
N II
CO
NS
OLI
DA
TED
FIN
AN
CIA
L ST
ATE
MEN
TS
3332
Segment reporting
Note 4 provides the Group’s segment information, in line
with IFRS 8. The Group operates its business through four
segments, which are organized by product and sales
channel. The Rugs segment designs, manufactures and
distributes a broad range of machine-made rugs to major
retailers (such as home improvement, furniture, specialist,
discount and DIY stores) and wholesalers. The Residential
segment designs, manufactures and distributes branded
broadloom carpets (Balta Broadloom and ITC brands) and
tiles to major retailers and wholesalers. The Commercial
segment designs, manufactures and distributes modular
carpet tiles mainly for offices and public projects through
the Group’s modulyss brand in Europe (Commercial Eu-
rope), the Bentley Brand in the US (Commercial US) and
broadloom carpets mainly for the hospitality sector through
its arc edition brand to architects, designers, contractors
and distributors. Finally, the Non-Woven segment designs,
manufactures and distributes soft flooring for events such
as fairs and expositions and specialized fabrics for insu-
lation, lining, cars, carpet backing and banners through
its Captiqs brand.
Operating segments are reported in a manner consistent
with the internal reporting provided to the Board and the
Management Committee. Items that are provided on a
monthly basis to the Management Committee are revenues,
Adjusted EBITDA, net inventory, accounts receivable and
capital expenditure. The segment information provided
in Note 4 has been selected on this basis. It follows that
other items such as total assets and liabilities per segment
are not reviewed internally and hence not disclosed. In-
terest income, interest expense and taxes are managed
centrally and accordingly such items are not presented
by segment as they are excluded from the measure of
segment profitability.
Note 1.3. Foreign currency translation
Functional and presentation currency
Items included in the financial statements of each of
the Group’s entities are measured using the currency of
the primary economic environment in which the entity
operates (“the functional currency”). The consolidated
financial statements are presented in Euro, which is the
Group’s functional and the Group’s presentational cur-
rency. All amounts are stated in thousands of Euro unless
otherwise stated.
Transactions and balances
Foreign currency transactions are translated into the
functional currency using the exchange rates prevailing
at the dates of the transactions or date of valuation, in
case of items that are re-measured at the reporting date.
Foreign exchange gains and losses resulting from the
settlement of such transactions and from the translation
at year-end exchange rates of monetary assets and lia-
bilities denominated in foreign currencies are recognized
in the income statement.
Foreign exchange gains and losses that relate to cash and
cash equivalents and borrowings, including borrowings,
payables and receivables between group companies that
do not qualify as a net investment in a foreign operation are
presented in income statement within “Finance income and
expense”. All other foreign exchange gains and losses are
presented in the income statement within “Other income”
or “Other expenses” which is part of the operating profit.
The principal exchange rates that have been used to
prepare these financial statements are as follows:
December 31 2017 December 31 2016
Closing Average Closing Average
USD 1.1993 1.1297 1.0541 1.1069
TRY 4.5155 4.1159 3.7099 3.3375
GBP 0.8872 0.8767 0.8562 0.8195
As the Bentley group of companies was only acquired as
from March 22 2017, the income statement was included
in the financial statements using the average USD/EUR
rate from March 22 2017 to December 31 2017. The Business
combination was included using the closing rate per March
31 2017. As a result the figures of the Bentley Mills group
are included using the following rates.
December 31 2017 March 31 2017
Closing Average Closing
USD 1.1993 1.1519 1.0691
Group companies
The results and financial position of all the Group’s entities
(none of which has the currency of a hyper-inflationary
economy) that have a functional currency different from
the presentation currency are translated into the pres-
entation currency as follows:
• Assets and liabilities for each statement of financial
position presented are translated at the closing or
year-end rate;
for the financial year beginning January 1 2017 and have
not been endorsed by the European Union:
• IFRS 17 ‘Insurance contracts’ (effective January 1 2021). This
standard replaces IFRS 4, which currently permits a wide
variety of practices in accounting for insurance contracts.
IFRS 17 will fundamentally change the accounting by all
entities that issue insurance contracts and investment
contracts with discretionary participation features. The
Group doesn’t expect any material impact of this change
in standard on the financial statements.
• Amendments to IFRS 2 ‘Share-based payments’ (effective
January 1 2018): The amendment clarifies the measurement
basis for cash-settled payments and the accounting for
modifications that change an award from cash settled
to equity settled. It also introduces an exception to the
principles in IFRS 2 that will require an award to be treated
as if it was wholly equity-settled, where an employer is
obliged to withhold an amount for the employee’s tax
obligation associated with a share-based payment and
pay the amount to the tax authorities. Note 41 Share
based payments for more information.
• IFRIC 22 ‘Foreign currency transactions and advance con-
sideration’ (effective January 1 2018). This IFRIC addresses
foreign currency transactions or parts of transactions
where there is consideration that is denominated or
priced in a foreign currency. The interpretation provides
guidance for when a single payment/receipt is made as
well as for situations where multiple payments/receipts
are made. The guidance aims to reduce diversity in
practice. This IFRIC will not result in any material impact
on the financial statements of the Group.
• IFRIC 23 ‘Uncertainty over income tax treatments’ (effective
January 1 2019). This interpretation clarifies the accounting
for uncertainties in income taxes. The interpretation is to
be applied to the determination of taxable profit (tax
loss), tax bases, unused tax losses, unused tax credits
and tax rates, when there is uncertainty over income tax
treatments under IAS 12.
Note 1.2. Consolidation
Subsidiaries
Subsidiaries are all entities for which the Group is exposed,
or has rights, to variable returns from its involvement
with an entity and has the ability to affect those returns
through its power over the entity. The existence and effect
of potential voting rights that are currently exercisable
or convertible are considered when assessing whether
the Group controls another entity. Subsidiaries are fully
consolidated from the date on which control is transferred
to the Group. They are de-consolidated from the date on
which control ceases.
The Group applies the acquisition method to account for
business combinations. The consideration paid reflects the
fair value of the assets transferred, the liabilities assumed
and the equity instruments issued. The consideration
transferred includes the fair value of any asset or liability
resulting from a contingent consideration agreement (for
example, variable consideration contingent on future
events such as achievement of post-acquisition earnings
targets or success of a significant project).
Identifiable assets acquired and liabilities and contingent
liabilities assumed in a business combination are measured
initially at their fair values at the acquisition date. On an
acquisition-by-acquisition basis, the Group recognizes
any non-controlling interest in the acquiree either at fair
value or at the non-controlling interest’s proportionate
share of the acquiree’s net assets.
Acquisition related costs are expensed in the income
statement. The cost of an acquisition is measured as the
aggregate of the consideration transferred, measured
at acquisition date fair value and the amount of any
non-controlling interest and previously held interest in
the entity acquired. For each business combination, the
Group measures the non-controlling interest in the ac-
quiree either at fair value or at the proportionate share
of the acquiree’s identifiable net assets. The excess of
the aggregate of the consideration transferred and the
amount recognized for non-controlling interest over the
net recognized amount (generally at fair value) of the
identifiable assets acquired and liabilities assumed is
recognized as goodwill. Negative goodwill is recognized
immediately in the income statement.
Inter-company transactions, balances and unrealized
gains on transactions between group companies are
eliminated on consolidation. Unrealized losses are also
eliminated unless the transaction provides evidence of an
impairment of the asset transferred in which case the asset
is impaired through the income statement. Accounting
policies of subsidiaries are changed where necessary to
ensure consistency with the policies adopted by the Group.

BA
LTA
IS
SU
ER
A
NN
UA
L R
EPO
RT
2017
3534
SEC
TIO
N II
CO
NS
OLI
DA
TED
FIN
AN
CIA
L ST
ATE
MEN
TS
3534
Note 1.6. Other Intangible assets
Trademarks
Trademarks acquired in a business combination are recog-
nized at fair value at the acquisition date. The fair market
value is determined on the basis of a net present value
calculation corrected for the cost to be taken to further
support the trademarks in the market. Trademarks have a
finite useful life and are carried at cost less accumulated
amortization. Amortization is calculated using the straight-
line method to allocate the cost of the trademarks over
the shortest of their estimated useful lives or the period
of the legal right.
Internally generated software and other development cost
Costs associated with maintaining computer software
programs are recognized as an expense as incurred. De-
velopment costs that are directly attributable to the design
and testing of identifiable and unique software products
controlled by the Group are recognized as intangible
assets when the following criteria are met:
• It is technically feasible to complete the software product
so that it will be available for use;
• Management intends to complete the software product
and use or sell it;
• There is an ability to use or sell the software product;
• It can be demonstrated how the software product will
generate probable future economic benefits;
• Adequate technical, financial and other resources to
complete the development and to use or sell the software
product are available; and
• The expenditure attributable to the software product
during its development can be reliably measured.
Directly attributable costs that are capitalized as part of
the software product include the software development
employee costs and an appropriate portion of directly
attributable overheads.
Other development expenditures that do not meet these
criteria are recognized as an expense as incurred. Devel-
opment costs previously recognized as an expense are
not recognized as an asset in a subsequent period.
Computer software development costs recognized as
assets are amortized over their estimated useful lives,
which in general is equal to 4 years.
Note 1.7. Impairment of assets
Goodwill and intangible assets that have an indefinite
useful life are not subject to amortization and are tested
annually for impairment, or more frequently if events or
changes in circumstances indicate that they might be
impaired. Other assets are tested for impairment when-
ever events or changes in circumstances indicate that the
carrying amount may not be recoverable. An impairment
loss is recognized for the amount by which the asset’s
carrying amount exceeds its recoverable amount. The
recoverable amount is the higher of an asset’s fair value
less costs of disposal and value in use. These values are
generally determined based on discounted cash flow
calculations. For the purposes of assessing impairment,
assets are grouped at the lowest levels for which there
are separately identifiable cash inflows which are largely
independent of the cash inflows from other assets or
groups of assets (cash-generating units). Non-financial
assets other than goodwill that suffered an impairment
are reviewed for possible reversal of the impairment at
the end of each reporting period.
Note 1.8. Derivative financial instruments
Derivatives are initially recognized at fair value on the date
a derivative contract is entered into and are subsequently
re-measured at their fair value. The Group records all gains
or losses resulting from changes in fair value of derivatives
in the income statement within “Other income” or “Other
expenses” to the extent that they relate to operating
activities and within “Finance income” or “Finance costs”
to the extent that they relate to the financing activities
of the Group.
Derivative financial instruments used to hedge the expo-
sure to variability in future cash flows are designated as
hedges under cash-flow hedge accounting. The effective
portion of changes in fair value as from the designation
date of the cash flow hedge are recorded in the cash flow
hedge reserve, part of “Other comprehensive income”.
Amounts recorded in the cash flow hedge reserve will be
recognized in the income statement in the same period
or periods during which the hedged forecast transaction
affects the income statement. In case of the hedge of a
forecast sales transaction, this coincides with the date
upon which the revenue and trade receivable is recognized.
When the underlying hedged transactions no longer meet
the criteria for hedge accounting, the cumulative gain or
loss on the hedging instrument that has been recognized
• Income and expenses for each income statement are
translated at average exchange rates (unless this aver-
age is not a reasonable approximation of the cumulative
effect of the rates prevailing on the transaction dates, in
which case income and expenses are translated at the
rate on the dates of the transactions); and
• All resulting exchange differences are recognized in “Other
comprehensive income”.
On consolidation, exchange differences arising from the
translation of the net investment in foreign operations, and
of borrowings and other currency instruments designated
as hedges of such investments (if any), are taken to “Oth-
er comprehensive income”. When a foreign operation is
partially disposed of or sold, exchange differences that
were recorded in equity are recognized in the income
statement as part of the gain or loss on sale.
Foreign exchange gains and losses that relate to bor-
rowings and transactions between group companies in
a different currency compared to the functional currency,
are presented in the income statement within “Finance
income and expense”, if these borrowings do not qualify
as a net investment in a foreign operation.
Goodwill and fair value adjustments arising on the acqui-
sition of a foreign entity are treated as assets and liabilities
of the foreign entity and translated at the closing rate.
Note 1.4. Property, plant and equipment
Property, plant and equipment are carried at acquisition
cost less any accumulated depreciation and less any
accumulated impairment loss. Cost of property, plant and
equipment also includes the estimated cost of dismantling
and removing the asset and restoring the site, to the extent
that the provision is recognized under IAS 37 “Provisions,
Contingent Liabilities and Contingent Assets”.
Subsequent costs are included in the asset’s carrying
amount or recognized as a separate asset, as appropriate,
only when it is probable that future economic benefits as-
sociated with the item will flow to the Group and the cost
of the item can be measured reliably. The carrying amount
of the replaced part is derecognized. All other repairs and
maintenance are charged to the income statement during
the financial period in which they are incurred.
Freehold land is not depreciated. Depreciation on other
assets is calculated using the straight-line method, to
allocate the costs over the estimated remaining useful
lives, as follows:
Industrial and administrative buildings
- Structural work 40-50 years
- Other elements 10-25 years
Machinery 10-33 years
Vehicles, transport equipment 5 years
Furniture, fittings and equipment 5-15 years
Cars are depreciated to a residual value of 20% of the
initial cost.
Spare parts purchased for particular items of plant are
capitalized and depreciated over the useful life not ex-
ceeding 4 years. Samples of products are capitalized and
depreciated over 2-3 years.
The assets’ residual values and useful lives are reviewed,
and adjusted if appropriate, at the end of each reporting
period. An asset’s carrying amount is written down imme-
diately to its recoverable amount if the asset’s carrying
amount is greater than its estimated recoverable amount.
Fair value adjustments as a result of Business Combinations
are depreciated over the estimated remaining useful life
of the applicable assets.
Gains and losses on disposals are determined by com-
paring the proceeds with the carrying amount and are
recognized within “Other income” or “Other expenses” in
the income statement.
Note 1.5. Goodwill
Goodwill on acquisitions of subsidiaries is allocated to those
cash-generating units or groups of cash-generating units
that are expected to benefit from the business combination
in which the goodwill arose. Goodwill is tested annually for
impairment and carried at cost in the underlying currency
less accumulated impairment losses. Impairment losses on
goodwill are not reversed. Gains and losses on the disposal
of a cash-generating unit include the carrying amount of
goodwill relating to the cash-generating unit sold.
BA
LTA
IS
SU
ER
A
NN
UA
L R
EPO
RT
2017
3736
SEC
TIO
N II
CO
NS
OLI
DA
TED
FIN
AN
CIA
L ST
ATE
MEN
TS
3736
Note 1.15. Financial liabilities measured at fair value
through profit or loss
Some instruments that have the legal form of a liability are,
in substance, equity. A financial instrument is classified as a
financial liability or an equity instrument depending on the
substance of the arrangement rather than the legal form.
Liabilities arise when the issuer is contractually obligated
to deliver cash or another financial asset to the holder.
An instrument is an equity instrument only if the issuer has
no such obligation, i.e. it has an unconditional right to
avoid settlement in cash or another financial asset. The
ability to defer payment is not enough to achieve equity
classification, unless payment can be deferred indefinitely.
Generally an obligation for the entity to deliver its own
shares is not a financial liability because an entity’s own
shares are not considered its financial assets. An exception
to this is where an entity is obliged to deliver a variable
number of its own equity instruments.
Note 1.16. Senior Secured Notes and Bank and other
borrowings
Senior Secured Notes, Bank and other borrowings are
recognized initially at fair value, net of transaction costs
incurred. They are subsequently carried at amortized cost;
any difference between the proceeds (net of transaction
costs) and the redemption value is recognized in the in-
come statement over the period of the borrowings using
the effective interest method.
Note 1.17. De-recognition of financial assets and liabilities
A financial asset (or, where applicable, a part of a finan-
cial asset or part of a group of similar financial assets) is
derecognized when:
• The rights to receive cash flows from the asset have
expired;
• The Group retains the right to receive cash flows from
the asset, but has assumed an obligation to pay them in
full without material delay to a third party under a “pass
through” arrangement; or
• The Group has transferred its rights to receive cash flows
from the asset and either (a) has transferred substantially
all the risks and rewards of the asset, or (b) has neither
transferred nor retained substantially all the risks and
rewards of the asset, but has transferred control of the
asset.
Where IAS 39 de-recognition criteria are not met, the
receivables continue to be recognized in the statement
of financial position, while the proceeds received by the
Group under any financing/factoring arrangements are
recognized as a financial liability.
A financial liability is de-recognized when the obligation
under the liability is discharged or cancelled or expires.
Where an existing financial liability is replaced by another
from the same lender on substantially different terms, or
when the existing liability is transferred to a different lend-
er and the Group obtains a legal release from the initial
lender, or the terms of an existing liability are substantially
modified, such an exchange or modification is treated as
a de-recognition of the original liability and the recogni-
tion of a new liability, and the difference in the respective
amounts is recognized in the income statement.
The terms are substantially different if the discounted pres-
ent value of the cash flows under the new terms, including
any fees paid net of any fees received and discounted
using the original effective interest rate, is at least ten
per cent different from the discounted present value of
the remaining cash flows of the original financial liability.
Note 1.18. Current and deferred income tax
The tax expense for the period comprises current and
deferred tax. Tax is recognized in the income statement,
except to the extent that it relates to items recognized in
“Other comprehensive income” or directly in equity. In this
case the tax is also recognized in “Other comprehensive
income” or directly in equity, respectively.
The current income tax charge is calculated on the ba-
sis of the tax laws enacted or substantively enacted at
the statement of financial position date in the countries
where the Company’s subsidiaries operate and generate
taxable income. In line with paragraph 46 of IAS 12 ‘income
taxes’, management periodically evaluates positions
taken in tax returns with respect to situations in which
applicable tax regulation is subject to interpretation. It
establishes provisions where appropriate on the basis of
amounts expected to be paid to the tax authorities. This
evaluation is made for tax periods open for audit by the
competent authorities.
Deferred income tax is recognized, using the liability
method, on temporary differences arising between the tax
bases of assets and liabilities and their carrying amounts
in the consolidated financial statements. However, the
deferred income tax is not accounted for if it arises from
in other comprehensive income from the period when the
hedge was effective shall be reclassified from equity to
profit or loss as a reclassification adjustment.
When the underlying hedged transaction is no longer
expected to occur, the cumulative gains or loss on the
hedging instrument that has been recognized in “Other
comprehensive income” from the period when the hedge
was effective shall be reclassified from equity to profit or
loss as a reclassification adjustment.
Note 1.9. Inventories
Inventories are stated at the lower of cost and net re-
alizable value. These net realizable value adjustments
are reviewed on a regular basis and updated to reflect
the estimated selling price less selling expenses, based
on historical data and expectations. Cost is determined
using the first-in, first-out (“FIFO”) method. The cost of
finished goods and work in progress comprises amongst
other design costs, raw materials, direct labor, other di-
rect costs and related production overheads (based on
normal operating capacity). Net realizable value is the
estimated selling price in the ordinary course of business,
less applicable variable selling expenses.
Based on a quantified methodology, provisions against
the carrying value of inventories are recorded taking qual-
itative aspects into account including the lower of cost
versus net realizable value assessment. These provisions
are reviewed by management.
Note 1.10. Trade receivables
Trade receivables are amounts due from customers for
goods sold or services performed in the ordinary course of
business. If collection is expected in one year or less, they
are classified as current assets. If not, they are presented
as non-current assets.
Trade receivables are recognized initially at fair value
and subsequently measured at amortized cost using the
effective interest method, less bad debt allowance.
Trade receivables are reviewed on a continuing basis. A
bad debt allowance is recorded when collectability of
the receivable is questionable. The bad debt allowance
covers the net estimated risk for the Group and is calcu-
lated by taking into account the coverage expected to
be received from credit insurance.
Note 1.11. Cash and cash equivalents
Cash and cash equivalents includes cash on hand, de-
posits held at call with banks, other short-term highly
liquid investments and bank overdrafts. Bank overdrafts
are shown within borrowings in current liabilities on the
statement of financial position.
Note 1.12. Share capital
Ordinary shares are classified as equity. Incremental costs
directly attributable to the issue of new shares or options
are shown in equity as a deduction, net of tax, from the
proceeds.
Note 1.13. Government grants
Government grants are recognized at their fair value
when there is a reasonable assurance that the grant will
be received and the Group will comply with all attached
conditions.
Government grants relating to costs are deferred and
recognized in the income statement within “Other income”
over the period necessary to match them with the costs
that they are intended to compensate.
Government grants relating to property, plant and equip-
ment are included in non-current liabilities as deferred
government grants and are credited to the income state-
ment on a straight-line basis over the expected useful
lives of the related assets.
Note 1.14. Trade payables
Trade payables are obligations to pay for goods or ser-
vices that have been acquired in the ordinary course of
business from suppliers. Trade payables are classified as
current liabilities if payment is due within one year or less
(or in the normal operating cycle of the business if longer).
If not, they are presented as non-current liabilities.
Trade payables are recognized initially at fair value and
subsequently measured at amortized cost using the ef-
fective interest method.
Supplier finance arrangements are recognized as a financial
liability unless the original trade payable is extinguished
or its terms are significantly modified to the extent that
it qualifies for de-recognition under IAS 39 (we refer to
de-recognition of financial assets and liabilities Note 1.17).

BA
LTA
IS
SU
ER
A
NN
UA
L R
EPO
RT
2017
3938
SEC
TIO
N II
CO
NS
OLI
DA
TED
FIN
AN
CIA
L ST
ATE
MEN
TS
3938
projected unit credit method has been used as the actu-
arial technique to measure the defined benefit obligation.
Note that for the bonus plans, a simplified approach is
applied as it is not possible to predict future bonuses
(which define future contributions). The fair value of the
plan assets is based on §113 of IAS 19 and is defined as
the present value of the retirement capitals guaranteed
by the insurance company (using the tariffs as set out by
the insurance company). The discount rate used takes
into account the investment risk of financial institutions
by referring to financial single A bonds. Therefore an ad-
ditional gap is added to the Defined Benefit Obligation
(“DBO”) discount rate which reflects the difference between
double AA corporate bonds and single A financial bonds.
At December 31 2017 this gap was 25 basis points.
Other post-employment obligations
The Group does not have other post-employment ob-
ligations.
Termination benefits
Termination benefits are payable when employment is
terminated by the Group before the normal retirement date,
or whenever an employee accepts voluntary redundancy
in exchange for these benefits. The Group recognizes a
liability and expense for termination benefits at the earlier
of the following dates: (a) when the Group can no longer
withdraw the offer of those benefits; and (b) when the
Group recognizes costs for a restructuring that is within
the scope of IAS 37 and involves the payment of termi-
nation benefits. Benefits falling due more than 12 months
after the end of the reporting period are discounted to
their present value.
In Belgium, the system of early retirement pensions ensures
that elderly people who are dismissed by their employer
or who are encouraged to terminate their employment
and who fulfill certain conditions, are eligible to receive
supplementary unemployment allowance and paid by their
former employer on top of the unemployment allowances
paid by social security. This benefit is generally paid until
normal retirement age, which is 65 years.
Within the Group, several former employees benefit from
the system of “early retirement fee or pension”, based
on several Belgian Collective Labor Agreements (CLAs)
in place for the sector (textielnijverheid en breiwerk/ in-
dustrie textile et de la bonneterie) or specifically for the
Group. These CLAs describe the different possibilities for
employees in the sector to benefit from “early retirement
fee or pension”, the creation of a sector fund (fonds voor
bestaanszekerheid/ fonds de sécurité d’existence), part-
time work, education and training etc. Certain CLAs exist
for blue collar workers and others for white collar workers.
For those early retirement fees or pensions which are
directly paid out by the employer, a provision should be
made under IAS 19. It has been determined as the pres-
ent value of the best estimate of future cash flows. The
discount rate used is based on the return on high quality
corporate bonds (AA rated) of a maturity equivalent to
the duration of the liabilities. The changes in pension li-
abilities are accounted for through other comprehensive
income when the changes relate to a change in actuarial
assumptions from one year to another.
Bonus plans
Bonuses received by company employees and management
are based on pre-defined Group and individual target
achievement. The estimated amount of the bonus is rec-
ognized as an expense in the period the bonus is earned.
Share Based payments
An equity-settled share-based payment transaction is
a transaction in which the Group receives services as
consideration for its own shares (or share options). The fair
value of the services received in exchange for the grant
of the shares (or share options) measured by reference to
the grant date fair value of the shares (or share options),
is recognized as an expense over the vesting period.
When share-based payment plans are cash-settled: the
goods or services acquired and the liability are measured
at the fair value of the liability. Until the liability is settled,
the fair value of the liability is re-measured at the end
of each reporting period and at the date of settlement
with any changes in fair value recognized in profit and
loss for the period.
Note 1.21. Revenue recognition
Revenue comprises the fair value of the consideration
received or receivable for the sale of goods and services
in the ordinary course of the Group’s activities. Revenue
is shown net of value-added tax, returns, rebates and
discounts and after eliminating sales within the Group.
The Group recognizes revenue when the amount of rev-
enue can be reliably measured, it is probable that future
initial recognition of an asset or liability in a transaction
other than a business combination that at the time of the
transaction affects neither accounting nor taxable profit
nor loss. Deferred income tax is determined using tax
rates (and laws) that have been enacted or substantially
enacted by the “Statement of financial position” date
and are expected to apply when the related deferred
income tax asset is realized or the deferred income tax
liability is settled.
Deferred income tax assets are recognized only to the
extent that it is probable that future taxable profit will
be available against which the temporary differences
can be utilized.
Deferred income tax is provided on temporary differenc-
es arising on investments in subsidiaries and associates,
except where the timing of the reversal of the temporary
difference is controlled by the Group and it is probable
that the temporary difference will not reverse in the fore-
seeable future.
Deferred income tax assets and liabilities are offset when
there is a legally enforceable right to offset current tax
assets against current tax liabilities and when the deferred
income taxes assets and liabilities relate to income taxes
levied by the same taxation authority on either the tax-
able entity or different taxable entities where there is an
intention to settle the balances on a net basis. Deferred
tax is not discounted.
Note 1.19. Provisions
Provisions for restructuring expenses, legal claims, service
warranties and make good obligations are recognized when
the group has a present legal or constructive obligation
as a result of past events, it is probable that an outflow
of resources will be required to settle the obligation and
the amount can be reliably estimated. Provisions are not
recognized for future operating losses.
Where there are a number of similar obligations, the
likelihood that an outflow will be required in settlement is
determined by considering the class of obligations as a
whole. A provision is recognized even if the likelihood of
an outflow with respect to any one item included in the
same class of obligations may be small.
Provisions are measured at the present value of manage-
ment’s best estimate of the expenditure required to settle
the present obligation at the end of the reporting period.
The discount rate used to determine the present value is
a pre-tax rate that reflects current market assessments
of the time value of money and the risks specific to the
liability. The increase in the provision due to the passage
of time is recognized as interest expense.
Note 1.20. Employee benefits
Pension obligations
IAS 19 distinguishes two types of post-employment ben-
efit plans:
• Defined contribution plans (DC plans) are post-employ-
ment benefit plans under which an enterprise pays fixed
contributions into a separate entity (a fund or group
insurance contract) and will have no legal or constructive
obligation to pay further contributions if the fund does
not hold sufficient assets to pay all employee benefits
relating to employee service in the current or prior periods;
• Defined benefit plans (DB plans) are post-employment
benefit plans other than defined contribution plans.
Group companies operate one defined benefit plan for a
group of managers and various pension schemes funded
through payments to insurance companies. Because of the
Belgian legislation applicable to 2nd pillar pension plans
(so-called “Law Vandenbroucke”), all Belgian Defined
Contribution plans have to be considered under IFRS as
Defined Benefit plans. Law Vandenbroucke states that in
the context of defined contribution plans, the employers
must guarantee a minimum return of 3.75% on employ-
ee contributions and 3.25% on employer contributions.
However, shortly before year-end 2015, a change in the
Belgian Law was enacted resulting in a decrease of the
guaranteed return from 3.25 % to a minimum interest rate
defined based upon the Belgian 10-year interest rate but
within the range 1.75% - 3.25%. The new rate (1.75% per
December 31 2017 and per December 31 2016) applies for
the years after 2015 on future contributions and also on
the accumulated past contributions as from December 31
2015 if the financing organization does not guarantee a
certain result on contributions until retirement age. If the
organization does guarantee such a result, the historical
rates still apply.
Because of this minimum guaranteed return, the employer
is exposed to a financial risk: further contributions could
be required if the return on the assets is not sufficient to
reach the minimum benefits to be paid. The Group has
plans that are financed through insurance contracts. The

BA
LTA
IS
SU
ER
A
NN
UA
L R
EPO
RT
2017
4140
SEC
TIO
N II
CO
NS
OLI
DA
TED
FIN
AN
CIA
L ST
ATE
MEN
TS
4140
asset disposals, (iii) integration and restructuring expenses
and (iv) impairment and write-off.
Adjusted EBITDA is defined as operating profit / (loss)
adjusted for (i) the impact of the purchase price allocation
mainly on change in inventories, (ii) gains on asset disposals,
(iii) integration and restructuring expenses, (iv) depreciation
/ amortization and (v) impairment and write-off.
Adjusted Earnings per Share is defined as profit / (loss)
for the period adjusted for (i) the impact of the purchase
price allocation mainly on changes in inventory, (ii) gains
on asset disposals, (iii) integration and restructuring
expenses, (iv) non-recurring finance expenses and (v)
non-recurring tax effects, divided by the number of shares
of Balta Issuer S.à r.l..
Net Debt is defined as (i) Senior Secured Notes adjusted
for the financing fees included in the carrying amount, (ii)
Senior Term Loan Facility adjusted for capitalized financing
fees, (iii) Bank and other borrowings adjusted for capital-
ized financing fees and (iv) cash and cash equivalents.
Leverage is defined as the ratio of Net Debt to Pro Forma
Adjusted EBITDA.
Pro Forma Adjusted EBITDA is included, for illustrative
purposes. The figure incorporates the acquisition effect
of Bentley under the assumption that the transaction
took place as of the start of the prior financial year. This
information is intended to help investors to analyse and
compare historical financial information. It is important
to note that the acquisition of Bentley was completed
on March 22 2017 and consolidated in the Group’s results
from the April 1 2017.
Adjusted Effective Tax Rate is defined as the ratio of
income tax expenses, plus or minus the tax effect of
integration and restructuring expenses, the tax effect
of exceptional items within the finance charges, the tax
effect attributable to the re-measurement of deferred tax
assets and liabilities and the tax effect of the purchase
price accounting adjustments, divided by earnings from
continuing operations before income taxes plus integra-
tion and restructuring expenses plus exceptional finance
expenses and excluding the impact of purchase price
accounting adjustments.
Note 2. Critical accounting estimates and judgementsThe amounts presented in the financial statements involve
the use of estimates and assumptions about the future.
Estimates and judgements are continually evaluated and
are based on historical experience and other factors,
including expectations of future events that are believed
to be reasonable under the circumstances. The estimates
and assumptions will seldom equal the related actual re-
sults. The estimates and assumptions that could have an
impact on the financial statements are discussed below.
Determination of fair values in business combinations
The Group has applied estimates and judgements in
order to determine the fair value of assets acquired and
liabilities assumed by way of a business combination.
The value of assets, liabilities and contingent liabilities
recognized at the acquisition date are recognized at fair
value. In determining the fair value, the Group has utilized
valuation methodologies including discounted cash flow
analysis. The Group’s estimates are based upon assump-
tions believed to be reasonable, but which are inherently
uncertain and unpredictable. These valuations require
the use of management’s assumptions, which would not
reflect unanticipated events and circumstances that may
occur. Any significant change in key assumptions may
cause the acquisition accounting to be revised including
the recognition of additional goodwill or a discount on
acquisition. All significant changes in key assumptions
have been considered when completing the fair value
analysis of the assets and liabilities acquired from the
Bentley group of companies.
Goodwill
The amount of goodwill initially recognized as a result of a
business combination is dependent on the allocation of the
purchase price to the fair value of the identifiable assets
acquired and the liabilities assumed. The determination
of the fair value of the assets and liabilities is based, to
a considerable extent, on management’s judgement.
Allocation of the purchase price affects the results of the
Group as finite life intangible assets are amortized, where-
as indefinite life intangible assets, including goodwill, are
not amortized and could result in differing amortization
charges based on the allocation to indefinite life and finite
life intangible assets.
economic benefits will flow to the entity and when specific
criteria have been met for each of the Group’s activities as
described below. When estimating the rebates payable,
the Group uses all available information, including historical
and forecast results and takes into consideration the type
of customer, the type of transaction and the specifics of
each arrangement.
Sales of goods
Sales of goods are recognized when the risks and rewards
are transferred to the customers, in most cases when the
goods are made available for collection at the Group’s
premises (factory, warehouse) on the date agreed upon
with the customer and the customer accepted the goods
in accordance with the sales contract.
Amounts billed to the customer in respect of transporta-
tion of product to the customer’s premises are included
in revenue. Associated transportation costs incurred by
the Group are included in other expenses.
Interest income
Interest income is recognized using the effective inter-
est method. When a receivable is impaired, the Group
reduces the carrying amount to its recoverable amount,
being the estimated future cash flow discounted at the
original effective interest rate, and continues unwinding the
discount as interest income. Interest income on impaired
loans and receivables are recognized using the original
effective interest rate.
Dividend income
Dividend income is recognized when the right to receive
payment is established.
Note 1.22. Leases
The Group leases certain property, plant and equipment.
Leases in which a significant portion of the risks and rewards
of ownership are retained by the lessor are classified as
operating leases. Payments made under operating leases
(net of any incentives received from the lessor) are charged
to the income statement on a straight-line basis over the
period of the lease.
Leases of property, plant and equipment where the Group
has substantially all the risks and rewards of ownership are
classified as finance leases. Finance leases are capitalized
at the lease’s commencement at the lower of the fair value
of the leased asset and the present value of the minimum
lease payments.
Each lease payment is allocated between the liability
and finance charges. The corresponding rental obliga-
tions, net of finance charges, purchase option (when
there is reasonable certainty that the lessee will obtain
ownership by the end of the lease term), are included in
“Borrowings”. The interest element of the finance cost is
charged to the income statement over the lease period
so as to produce a constant periodic rate of interest on
the remaining balance of the liability for each period. The
property, plant and equipment acquired under finance
leases are depreciated over the useful life of the asset
or if there is no reasonable certainty that the lessee will
obtain ownership by the end of the lease term, the asset
shall be fully depreciated over the shorter of the lease
term and its useful life.
Note 1.23. Dividend distribution
Dividend distribution to the Company’s partners is rec-
ognized as a liability in the Group’s financial statements
in the period in which the dividends are approved by the
Company’s partners.
Note 1.24. Cash flow statement
The cash flows of the Group are presented using the
indirect method. This method reconciles the movement
in cash for the reporting period by adjusting net profit for
the year for any non-cash items and changes in working
capital, and identifying investing and financing cash flows
for the reporting period.
Note 1.25. Non-GAAP measures
The following alternative performance measures (non-IFRS)
have been used as management believes that they are
widely used by certain investors, securities analysts and
other interested parties as supplemental measures of
performance and liquidity. The alternative performance
measures are unaudited and may not be comparable to
similarly titled measures of other companies, have limi-
tations as analytical tools and should not be considered
in isolation or as a substitute for analysis of our operating
results, our performance or our liquidity under IFRS.
Adjusted Operating Profit is defined as operating profit
/ (loss) adjusted for (i) the impact of the purchase price
allocation mainly on changes in inventories, (ii) gains on

BA
LTA
IS
SU
ER
A
NN
UA
L R
EPO
RT
2017
4342
SEC
TIO
N II
CO
NS
OLI
DA
TED
FIN
AN
CIA
L ST
ATE
MEN
TS
4342
Note 3. Reconciliation of non GAAP measuresThe table below shows the impact of the purchase price allocation and non-recurring items on profit/ (loss) of the
period and provides a reconciliation between the reported information and the non-GAAP measures as presented in
these financial statements.
2017 2016
(€ thousands)Adjusted Non-recurring PPA 1 Reported Adjusted Non-recurring Reported
Revenue 661,320 - - 661,320 557,685 - 557,685
Raw material expenses (310,391) - - (310,391) (259,472) - (259,472)
Changes in inventories (351) - (3,008) (3,359) 6,055 - 6,055
Employee benefit expenses (151,343) - 10 (151,334) (130,054) - (130,054)
Other income 7,132 - - 7,132 8,171 - 8,171
Other expenses (122,010) - 96 (121,914) (101,017) - (101,017)
Adjusted EBITDA 84,357 - (2,902) 81,454 81,367 - 81,367
Depreciation/amortization (32,469) - (30) (32,499) (28,666) (28,666)
Adjusted Operating Profit 2 51,887 - (2,933) 48,954 52,701 - 52,701
Gains on asset disposals - - - - - 1,610 1,610
Integration and restructuring expenses
- (18,175) - (18,175) - (5,128) (5,128)
Operating profit / (loss) 51,887 (18,175) (2,933) 30,779 52,701 (3,518) 49,183
Finance income 41 - - 41 57 - 57
Finance expenses (28,019) (9,307) - (37,327) (28,608) - (28,608)
Net finance expenses (27,978) (9,307) - (37,285) (28,552) - (28,552)
Profit / (loss) before income taxes 23,909 (27,482) (2,933) (6,506) 24,150 (3,518) 20,632
Income tax benefit / (expense) (7,104) 9,577 1,149 3,622 (7,142) 11,855 4,713
Profit / (loss) for the period from continuing operations
16,805 (17,905) (1,784) (2,884) 17,007 8,338 25,345
(1) Impact of purchase price accounting following the acquisition of Bentley group of companies.
(2) Adjusted Operating Profit and Adjusted EBITDA are non-GAAP measures as defined in Note 1.25.
The non-recurring events of 2017 are:
• Purchase price accounting adjustments following the acquisition of Bentley in March 2017. These adjustments have an
impact of €2.9m on EBITDA and €1.8m on the profit for the year.
• Integration and restructuring expenses of €18.2m impacting EBITDA, of which €8.2m is in connection with the optimi-
zation of the Residential operational footprint and €7.6m is related to strategic advisory services which mainly relate
to costs which have been incurred in connection with the capital reorganization. The expected total one off cost for
the Residential optimization is €12.4m.
• Finance expenses of €9.3m relating to (i) expenses of €5.4m in connection with the debt financed acquisition of Bentley,
which debt was fully repaid in June 2017 from the IPO proceeds, and (ii) expenses in connection with the partial early
redemption of the Senior Secured Notes (€3.9m).
• €9.6m tax benefit relating to events that are not reflective of the Group’s normal business operations, including the
re-measurement of deferred tax assets and liabilities following changes in tax legislation.
Impairment testing
IFRS requires management to undertake an annual test for
impairment of indefinite life assets and, for finite life assets,
to test for impairment if events or changes in circumstances
indicate that the carrying amount of an asset may not
be recoverable. Impairment testing is an area involving
management judgement, requiring assessment as to
whether the carrying value of assets can be supported
by the net present value of future cash flows derived from
such assets using cash flow projections which have been
discounted at an appropriate rate. In calculating the net
present value of the future cash flows, certain assumptions
are required to be made in respect of highly uncertain
matters including management’s expectations of:
• growth in EBITDA, calculated as adjusted operating profit
before depreciation and amortization;
• timing and quantum of future capital expenditure;
• long-term growth rates; and
• the selection of discount rates to reflect the risks involved.
Changing the assumptions selected by management, in
particular the discount rate and growth rate assumptions
used in the cash flow projections, could significantly affect
the Group’s impairment evaluation and hence results.
The Group’s review includes the key assumptions related
to sensitivity in the cash flow projections. Further details
are provided in Note 6.
Income taxes
The Group operates in various tax jurisdictions and therefore
has to determine tax positions under respective local tax
laws and tax authorities’ views which can be complex and
subject to different interpretations of tax payers and local
tax authorities. The Group incurs costs centrally which are
allocated to subsidiaries in different jurisdictions and which
exposes the Group to inherent tax risks, as is the case for
all companies operating in an international context. Based
on these tax risks, management performed a detailed
assessment for uncertain tax positions which resulted in
provisions recorded for these uncertainties.
The Group has tax credits in respect of losses carried
forward, Dividend Received Deduction (relief for dividend
payments by qualifying EU subsidiaries to qualifying EU
parent companies, to avoid double taxation of dividend
income), and Notional Interest Deduction (“NID”). These
tax credits can be used to offset against future taxable
profits. The valuation of this asset depends on a number
of judgemental assumptions regarding the future taxable
profits of different Group subsidiaries in different juris-
dictions and on the outcome of tax planning strategies.
These estimates are made prudently based on current
knowledge and reasonable long-term projections. Where
circumstances to change and the final tax outcome would
be different from the amounts that were initially recorded,
such differences will impact the income tax and deferred
tax provisions in the period in which such determination
is made.
Trade receivables
The Group makes significant judgements in determining
the bad debt allowance with respect to trade receivables
when there is objective evidence that the Group will not be
able to collect all amounts due according to the original
terms of receivables. The assessment is performed on an
individual basis in consideration of various factors such as
historical experience, credit quality, age of the accounts
receivables and economic conditions that may affect a
customer’s ability to pay.
The amount of the bad debt allowance is the difference
between the asset’s carrying amount and the present
value of estimated future cash flows, discounted at the
original effective interest rate. The estimated future cash
flow is determined based upon the significant financial
difficulties of the debtor, probability that the debtor will
enter bankruptcy or financial reorganization, and default
or delinquency in payments are considered indicators that
the trade receivable is impaired.
Customer rebates
The Group also needs to make some judgements in deter-
mining accruals for customer rebates as presented in the
“Other payables” section. When estimating the rebates
payable, the Group uses all available information, including
historical and forecast results and takes into consideration
the type of customer, the type of transaction and the
specifics of each arrangement. We also refer to revenue
recognition, Note 1.21.

BA
LTA
IS
SU
ER
A
NN
UA
L R
EPO
RT
2017
4544
SEC
TIO
N II
CO
NS
OLI
DA
TED
FIN
AN
CIA
L ST
ATE
MEN
TS
4544
rights from Bentley Management on May 31 2017 which
results in a 100% ownership as per May 31 2017.
The consideration paid to the original share and option
holders was equal to €88.3m ($94.3m). In order to finance
(i) the consideration paid, (ii) the repayment in full of leg-
acy debt at the level of Bentley and (iii) the payment of
transaction fees and expenses, the following sources of
financing were raised:
• an equity contribution of €68.8m ($74m) by LSF9 Renais-
sance Super Holdings LP;
• a management contribution of €1.1m ($1.2m) in equity;
• the issuance of a term loan of €30.9m ($33.0m) at the
level of BPS Parent Inc;
• a drawdown of €10.4m ($11.1m) on a revolving credit
facility of €16.8m ($18.0m) at the level of BPS Parent Inc.
On March 22 2017, LSF9 Balta Issuer S.à r.l. acquired from
LSF9 Renaissance Super Holdings, L.P. its interests in LSF9
Renaissance Holdings LLC and LSF9 Renaissance Acqui-
sitions LLC. This acquisition was originally financed by the
issuance of a Senior Term Loan Facility for an amount of
€75.0m at the level of LSF9 Balta Issuer S.à r.l. (see Note 25
for a description hereof). Subsequently, on March 23 2017,
Balta NV replaced LSF9 Balta Issuer S.à r.l. and acquired
the interest in LSF9 Renaissance Holdings LLC. As a result
of these transactions, Balta NV currently controls Bentley.
On May 31 2017, Balta NV acquired the remaining class A
unit voting shares of the Bentley group of companies from
LSF9 Balta Holdco S.à r.l. which indirectly acquired the
minority stake from Bentley’s management. The related
party debt which resulted from this transaction was sub-
sequently contributed in the capital of LSF9 Balta Issuer
S.à r.l. As a result of this transaction, Balta NV gained a
100% control over Bentley.
Balta will continue to support the Bentley brand, and will
make use of Bentley’s sale force and market access to ac-
celerate the growth of its European carpet tiles in the USA.
Transaction overview and allocation of purchase price paid
The acquisition made by LSF9 Balta Issuer S.à r.l. is a
transaction under a common control, and the accounting
policy election was made to account for such a transac-
tion in accordance with IFRS 3, Business Combinations.
We refer to Note 39 in which we provide an overview of
the related party transactions of the Group during the
year. As a result, previous goodwill was reversed in order
to calculate the net assets, and the final goodwill was
recognized as the difference between the consideration
paid and such net assets.
The purchase price allocation required under IFRS 3 Busi-
ness Combinations has been reflected in the consolidated
financial statements per December 31 2017. As a result,
the purchase price has been allocated to the identifiable
assets and liabilities acquired, based on the estimated
fair values at the date of acquisition.
The total purchase price paid in cash was equal to €68.8m,
as compared to a net asset value of Bentley Mills of (€12.5m)
at completion date before purchase price allocation. There
is no contingent consideration outstanding in relation to
the acquisition as of December 31 2017. Consequently, the
preliminary goodwill – before purchase price allocation
- was equal to €81.3m. As a result of the purchase price
allocation, €7.0m of the preliminary goodwill was allocat-
ed to identifiable assets and liabilities resulting in a final
goodwill of €74.3m.
The final purchase price paid of €68.8m and correspond-
ing goodwill before purchase price allocation of €81.3m is
determined as follows:
The initial purchase price paid in cash was equal to
€68.3m, as compared to a net asset value of Bentley of
€12.5m at March 22 2017 (the “Acquisition Date”), of which
€13.3m attributable to LSF9 Balta Issuer S.à r.l. and €1.0m
attributable to the non-controlling interest held by Bentley
management. Consequently, the provisional goodwill –
before purchase price allocation - was equal to €82.0m
on March 22 2017.
The non-controlling interest held by Bentley management
was acquired on May 31 2017 for an amount of €1.3m
having a corresponding net asset value at that time of
€1.2m. Consequently the provisional goodwill paid for
the Bentley Group of companies – before purchase price
allocation – increased by €0.2m as from May 31 2017 and
was equal to €82.2m at that time.
On July 20 2017, a final agreement on the purchase price
was agreed with Dominus Capital, L.P. resulting in a de-
crease of the original purchase price paid of €0.9m ($1.1m)
through the final release of the escrow account resulting in
a decrease in goodwill of €0.9m to finally become €81.3m
before purchase price allocation.
Note 4. Segment ReportingSegment information is presented in respect of the Group’s business segments as defined earlier. The performances of
the segments is reviewed by the Group’s chief operational decision making body, which is the Management Committee.
(€ thousands) 2017 2016
Revenue by segment 661,320 557,685
Rugs 228,331 214,545
Commercial 171,683 80,050
Residential 234,818 236,758
Non-Woven 26,488 26,332
Revenue by geography 661,320 557,685
Europe 431,899 429,580
North America 170,506 73,843
Rest of World 58,915 54,262
Adjusted EBITDA by segment (1) 84,357 81,367
Rugs 37,548 37,969
Commercial 23,924 12,067
Residential 20,258 28,411
Non-Woven 2,627 2,920
Capital expenditure by segment 39,023 35,569
Rugs 14,566 16,119
Commercial 10,455 6,259
Residential 13,050 12,460
Non-Woven 952 732
Net inventory by segment 147,868 135,320
Rugs 65,898 63,642
Commercial 31,162 15,346
Residential 46,818 52,718
Non-Woven 3,989 3,614
Trade receivables by segment 49,649 41,326
Rugs 11,946 17,263
Commercial 16,048 6,149
Residential 20,404 16,502
Non-Woven 1,251 1,411
(1) We refer to the Note 1.25 of which we provide a glossary of the non-GAAP measures.
Bentley is reported as part of our Commercial segment.
Given the acquisition date of March 22 2017, Bentley
contributes to the consolidated earnings of the Group
as from Q2 2017.
Note 5. Business combinationsFor the purpose of this disclosure, amounts in USD have
been converted to EUR at a rate of 1.0691 USD/EUR which
is the closing rate per March 31 2017. Where used herein
“Bentley” refers to Bentley Mills, Inc. or where the context
requires, the Bentley group of companies.
Details of the business combination
On December 1 2016, Lone Star Fund IX agreed to acquire
Bentley, a leader in premium commercial tiles and broad-
loom carpets for commercial interiors in the US market,
from Dominus Capital, L.P. The acquisition was completed
on February 1 2017. Lone Star Fund IX acquired 98.39% of
the class A unit voting rights whilst Bentley Management
acquired the remaining 1.61% of the class A unit voting
rights. On March 22 2017 LSF9 Balta Issuer S.à r.l. acquired
98.39% from Lone Star Fund IX.
Balta NV, a member of the Balta Group subsequently
acquired the remaining 1.61% of the Class A unit voting

BA
LTA
IS
SU
ER
A
NN
UA
L R
EPO
RT
2017
4746
SEC
TIO
N II
CO
NS
OLI
DA
TED
FIN
AN
CIA
L ST
ATE
MEN
TS
4746
The fair value correction on inventory was based on com-
putations which considered many factors, including the
estimated average selling price of the inventory and the
sales effort required to bring the products to the market.
In addition the fair value of the work in progress (“WIP”)
has been determined by allocating the margin taking
into account the percentage of completion of the related
product. The total net fair value correction of inventory
amounted to €2.3m and has been fully reversed over a
period of 3 months in the income statement which corre-
sponds with the expected rotation rate of the inventory.
The carrying amount of the current trade receivables
was reduced by €0.3m in order to reflect the probability
that certain trade receivables may not be fully collected
in later periods.
Bentley has recognized an additional provision for other
liabilities and charges for €0.9m which mainly relates to an
estimation of the asset retirement obligation which exists
for the buildings which are currently leased. The asset
retirement obligation reflects the net present value of the
expected costs to be made to bring the leased property
in its original condition when the lease agreements are
ended in the future.
The net fair value step up of the assets and liabilities will
result in an adjustment of the pre-tax income in future
periods. As a result, the related deferred tax effect of
the fair value adjustments needs to be reflected in the
opening balance and results in an increase of deferred
tax liabilities of €4.5m.
The excess of the purchase price over the amounts allocated
to identifiable assets and liabilities is equal to €74.3m and
has been included in goodwill. Goodwill will be tested for
impairment on an annual basis, as described in Note 6.
Details of acquired receivables
The non-current and current trade and other receivables
acquired from Bentley in March 2017 amounted to €14.5m
and relate to trade receivables (€13.2m), other receivables
(€0.9m), accruals (€0.2m) and deferrals (€0.3m). The trade
receivables included a bad debt provision of €0.6m to cover
for receivables that are assumed to be difficult to collect.
Details of non-controlling interests
The amount of non-controlling interest recognized amount-
ed to €1.0m at the acquisition date and represented the
1.61% stake management owned in the net assets of Bentley.
The non-controlling interest disappeared as a result of
the acquisition of the remaining share portion on May 31
2017 by the Balta Group. The Profit / (Loss) for the period
which was attributed to the Non-controlling interest for the
period March 23 2017 until May 31 2017 amounted to €34k.
Impact of acquisition on amounts reported in the state-
ment of comprehensive income
The acquisition of Bentley by Balta was completed on
March 22 2017. Because the closing date was near the
end of the first quarter, management believes that the
amount of revenue and profit or loss since the acquisition
date to be included in the consolidated statement of
comprehensive income for the period to the end of March
2017 is not material. As a result, the comprehensive income
of Bentley was taken into account as of April 1 2017 and
only included for 9 months in the twelve months ended
December 31 2017 figures.
If Bentley had been consolidated from January 1 2017,
Bentley would have contributed €113.6m of revenue from
January 1 2017 to December 31 2017. The profit of the year
from continuing operations would have been equal to €6.2m
on a pro forma basis, i.e. taking into account the effects
of the new capitalization structure of the Group, after
elimination of transaction expenses incurred by Bentley
and after elimination of the purchase price adjustment
effect on inventories.
Note 6. GoodwillThe goodwill represents, amongst other things, the value
of the longstanding customer relationships, the Group’s
market position, brand and reputation, as well as the value
of the Group’s workforce.
The goodwill impairment test is performed at the level of
a cash-generating unit (“CGUs”) or a group of cash-gen-
erating units, which is the lowest level at which goodwill is
monitored for internal management purposes. Our CGUs
are generally in line with our segments, with our Residential
segment broken down into two CGUs, Balta Broadloom
(polypropylene broadloom) and ITC (polyamide broadloom)
whilst our commercial segment is broken down into our
European activity and our US activity.
The table below provides an overview of the net assets recognized as a result of the acquisition before and after the
allocation of goodwill.
(€ thousands) Net assets at Completion Date before allocation goodwill
Fair value adjustments Net assets at Completion Date after allocation goodwill
Assets acquired 50,726 12,412 63,138
Property, plant & equipment 14,267 1,807 16,074
Intangible assets 2,726 8,453 11,179
Trade and other receivables 744 164 908
Total non-current assets 17,737 10,425 28,162
Inventories 15,935 2,281 18,216
Trade and other receivables 13,874 (294) 13,580
Current income tax asset 3,180 - 3,180
Total current assets 32,989 1,987 34,976
Liabilities assumed (63,270) (5,396) (68,666)
Bank and other borrowings (38,471) - (38,471)
Deferred income tax liabilities (1,842) (4,460) (6,302)
Provisions for other liabilities and charges
(2,045) (935) (2,980)
Employee Benefit Obligations (347) - (347)
Total non-current liabilities (42,705) (5,396) (48,100)
Bank and Other Borrowings (1,325) - (1,325)
Employee Benefit Obligations (1,695) - (1,695)
Trade and other payables (17,545) - (17,545)
Total current liabilities (20,565) - (20,565)
Purchase Price Paid in Cash 68,752 - 68,752
Identifiable assets and liabilities (12,544) 7,016 (5,528)
Goodwill 81,296 (7,016) 74,280
Purchase price allocation
The original goodwill of €81.3m has been allocated over the
assets acquired and liabilities assumed leading to a fair
value adjustment of the identifiable assets and liabilities of
€7.0m. The remaining goodwill arising from the acquisition
will mainly consist of the synergies and the economies of
scale expected from combining the operations of Bentley
and the Balta Group.
None of the remaining goodwill recognized is expected
to be deductible for income tax purposes.
The main fair value adjustments can be summarized as
follows:
The fair value adjustment of property, plant and equipment
of €1.8m is mainly driven by a revaluation of the existing
machinery, installations and equipment. This fair value
adjustment was determined on the basis of valuation
reports and market appraisals on the valuation of the
machines. As a result of this exercise, remaining useful lives
of the property, plant and equipment were updated and
depreciation rules were aligned with the Group policies.
The fair value step up is amortized over the remaining
useful life of the machines.
The fair value adjustment of the intangible assets mainly
relates to an adjustment of the value of the trade name
of Bentley (€8.4m). The Bentley trade name is well known
in the US market and provides additional support in sell-
ing the products to the market. The “relief from royalty”
method has been used to determine the fair value of the
trade name using level 3 valuation techniques. As a result,
the fair value of the trade name was determined based
on the estimated present value of the future net returns
increased by a tax amortization benefit. The trade names
are further amortized over a period of 10 years.
The carrying amount of the “Non-current trade and other
receivables” has been increased by €0.2m and reflects the
fair value of the existing operating lease contracts which
mainly relate to the leasing of some land and buildings.

BA
LTA
IS
SU
ER
A
NN
UA
L R
EPO
RT
2017
4948
SEC
TIO
N II
CO
NS
OLI
DA
TED
FIN
AN
CIA
L ST
ATE
MEN
TS
4948
Note 8. Other income and expense(€ thousands) 2017 2016
Other income 7,132 8,171
Foreign exchange gains 1,087 1,493
Foreign exchange forward contracts 1,295 2,307
Rental income from solar rooftop installations 1,383 1,410
Sales of energy certificates 961 -
Grants 454 602
Recharge of costs 328 755
Other 1,624 1,603
Other expenses 121,914 101,017
Services and other goods 79,039 67,772
Selling expenses 39,587 28,824
Foreign exchange losses 712 2,253
Real estate tax 2,524 2,156
Other 52 12
Other income includes gains realized on the settlement of
FX forward hedge agreements (see Note 20 on cash flow
hedge accounting), rental payments received from third
parties who lease the space to install solar panels, and the
sales of green energy certificates to which we are eligible
thanks to the combined generation of heat and power.
Some costs can be recharged to external parties for which
the income was presented under “Other income”. As a re-
sult of some changes in rental agreements, the recharges
to external parties decreased in comparison to last year.
The increase of “Other expenses” mainly relates to the
acquisition of Bentley (€18.3m). The main component of
other expenses is services and other goods which mainly
includes electricity and gas, maintenance and repair and
interim blue collars. Selling expenses mainly include freight
and commissions.
The costs of research and development are also included
within “Other expenses”.
The Group incurred €7.0m of research and development
expenses during the 12 months ended in December 31 2017
compared to the €5.5m of research and development
expenses during the 12 months ended December 31 2016.
One of the competitive advantages of our business is our
long history of creativity and innovation. The Group aims
to leverage research and development to continually
optimize the production capacity and provide designs
that appeal to our customers. Trends in product design
and innovation are closely monitored through continuous
testing and analysis, with a focus on anticipating customers’
preferences and market developments.
Note 9. Depreciation/amortizationThe components of depreciations and amortizations can
be summarized as follows:
(€ thousands) 2017 2016
Depreciation/amortization 32,499 28,666
Amortization of intangible assets 1,923 785
Depreciation property, plant and equipment
31,972 29,276
Release deferred revenu sale & lease back
(1,395) (1,395)
Depreciation/amortization increased by €3.8m as com-
pared to December 31 2016, mainly driven by the acqui-
sition of Bentley. Excluding the impact of Bentley, the
depreciation/amortization for December 31 2017, would
have been €28.8m.
The release of deferred revenue sale and lease back
relates to the gradual recognition of the capital gain
realized on the sale and lease back of one of the Group’s
manufacturing facilities in 2014. This deferred revenue is
recognized on a straight line basis over a 12 year period
as partial offset to depreciation charges over the period
of the lease. The annual amount recognized in the income
statement is €1.4m, with the balance of deferred income
equal to €11.5m as at December 31 2017.
Note 10. Integration and restructuring expensesThe total integration and restructuring expenses incurred
in 2017 amount to €18.2m (2016: €5.1m). This comprises
For the purpose of impairment testing, goodwill acquired
in a business combination is allocated to the cash-gen-
erating units that are expected to benefit most from the
business combination. Consequently, the goodwill arising
from the acquisition of Balta Finance (€124.7m) has been
solely allocated to Rugs (€94.3m) and Commercial Europe
(€30.4m), whilst the goodwill arising from the acquisition
of Bentley has been allocated to Commercial US (€74.3m).
Whilst no goodwill has been allocated to Residential, the
assets of this CGU have been tested for impairment using
the same approach as the impairment testing for goodwill.
The impairment testing has been performed on September
30 2017. The assets and liabilities comprising the CGU have
not changed significantly since the most recent calculation.
Based on the comparison of the “value in use” (derived using
discounted cash flow analysis) and the carrying amount
(book value of capital employed) per CGU at September
30 2017, the Group has been able to demonstrate that
the recoverable amount exceeds the carrying amount
and hence the goodwill is not impaired. The “value in
use” calculations use cash flow projections (which include
EBITDA, working capital movements, capital expenditure
and taxes) and are based on financial projections covering
a three-year period. Estimates beyond this three-year
period are calculated with a growth rate that reflects the
long-term growth rate applicable to the CGU, moderat-
ed to reflect management’s view of long-term earnings
across the cycle.
Key assumptions on which management has based its
determinations of the “value in use” include terminal value
growth rates of 2% for Rugs, 1% for Commercial Europe and
Commercial US (2016: 2% for all CGU’s) and an after-tax
discount rate of 7.9% (2016: 7.9%).
The “value in use” is mainly driven by the terminal value
which is particularly sensitive to changes in the assump-
tions on the terminal value growth rate and discount
rate. Discount rates are based on the weighted average
cost of capital. Terminal value growth rates take into
consideration external macroeconomic sources of data
and industry specific trends. The table below includes the
CGUs to which goodwill has been allocated and presents
the extent in which these two assumptions would need to
change in absolute terms in order to reduce the “value in
use” to the carrying amount.
Decrease in growth rate
Increase in discount rate
Rugs 1,3% 1,1%
Commercial Europe 6,7% 5,3%
Commercial US 3,8% 3,1%
Note 7. Employee benefit expensesThe following table sets forth employee benefit expenses for the years ended December 31 2016 and 2017:
(€ thousands) 2017 2016
Total employee benefit expenses 151,334 130,054
Wages and salaries 105,682 92,289
Social security costs 32,180 29,974
Pension costs 4,026 1,603
Other employee benefit expenses 9,445 6,188
Employee benefit expenses increased by €21.3m as compared to December 31 2016 of which €19.4m is driven by the
acquisition of Bentley.
The average number of employees in 2017 and 2016 was equal to 3,714 (in full time equivalents and of which 376 full
time equivalents relate to Bentley) and 3,238 respectively. Part-time employees are included on a proportionate basis.
2017 2016
Average number of total employees 3,714 3,238
Average number of employees - blue collar 3,045 2,694
Average number of employees - white collar 669 544

BA
LTA
IS
SU
ER
A
NN
UA
L R
EPO
RT
2017
5150
SEC
TIO
N II
CO
NS
OLI
DA
TED
FIN
AN
CIA
L ST
ATE
MEN
TS
5150
Note 12. Income tax benefit / expense(€ thousands) 2017 2016
Income tax benefit / (expense) 3,622 4,713
Current tax (2,615) (3,014)
Deferred tax 6,236 7,727
(€ thousands) 2017 2016
Income tax benefit / (expense) 3,622 4,713
Income tax calculated at Luxembourg tax rate (27,08%) 1,762 (6,495)
Rate differential due to transactions with foreign entities 1,151 1,000
Disallowed expenses (1,943) (730)
Tax-exempted revenues 738 323
Deferred tax assets recognized - 10,789
Tax losses for which no deferred tax asset is recognized (1,940) (2,878)
Deferred tax asset derecognized (10,671) -
Impact tax reforms 10,439 -
Utilization of previously not recognized tax assets - 3,153
Impact intercompany financing 3,234 -
Other 851 (449)
Income taxes represent a ‘benefit’ in both 2017 and 2016,
driven by the net positive deferred tax income.
The reported income tax expense of the year is a credit
of €3.6m which includes two items which we have treated
as non-recurring.
Firstly, we have recognized a positive effect of €10.4m
linked to tax reforms, of which €9.0m is linked to the Belgian
tax reform which has been substantially enacted on De-
cember 22 2017. The highlight of the corporate tax reform
is the reduction of the corporate tax rate from 33.99% to
29.58% in 2018 (including crisis contribution, lowered from
3% to 2%) and to 25% as from 2020 (abolishment of crisis
contribution). As a consequence, deferred tax assets and
liabilities have been adjusted to reflect the new tax rates
that are expected to apply to the period when the asset
is realized or the liability is settled.
Secondly, the deferred tax assets relating to tax credits
and loss carryforwards have been adjusted by €10.7m to
reflect changes in the probability that these can be used in
the future as a result of the restructuring of the operational
infrastructure in Belgium within the Residential business,
by the consolidation of the Oudenaarde facility into the
Group’s two fully vertically integrated factories in the region.
When normalizing for all exceptional events of 2017, the
Adjusted Effective Tax Rate1 is equal to approximately 30%.
In 2016 the income tax benefit is driven by the recognition
of a deferred tax asset of €10.8m in relation to tax cred-
its for which the recognition criteria were previously not
met. This benefit was offset by certain tax losses subject
to significant limitations (tax losses for which no deferred
tax asset is recognized). For those losses, deferred tax
assets have not been recognized, as it is not probable
that taxable profit will be generated to offset those losses.
In assessing whether deferred tax assets should be rec-
ognized, management considers the extent to which it is
probable that the deferred tax asset will be realized. The
ultimate realization of deferred tax assets is dependent
upon the generation of future taxable profits during the
periods in which those temporary differences and tax losses
carried forward become deductible. Management con-
siders the expected reversal of deferred tax liabilities and
projected future taxable income in making this assessment.
1 We refer to note 1.25 where we provide a glossary of the non-GAAP measures and note 3.
various items which are considered by management as
non-recurring or unusual by nature.
(€ thousands) 2017 2016
Integration and restructuring expenses 18,175 5,128
Corporate restructuring - 1,920
Business restructuring 8,248 670
Acquistion related expenses 1,334 -
Idle IT costs 776 703
Strategic advisory services 7,582 1,324
Other 234 512
The main component of the integration and restructuring
expenses is the €8.2m provision in relation to the optimization
of the Residential operational footprint. The acquisition-re-
lated expenses of €1.3m have been incurred in relation to
the acquisition of Bentley in March 2017. Incremental (idle) IT
costs in relation to a legacy IT system amounted to €0.8m.
The replacement of the legacy system was completed in
the course of 2017 and therefore these costs will no longer
be incurred. The strategic advisory services amount to
€7.6m and mainly relate to the costs which have been
incurred in connection with the capital reorganization.
The other expenses mainly relate to accrued expenses
in connection with the phantom share bonus scheme.
The bonus is only payable if the managers still provide
services to the Group on the second anniversary of the
IPO of Balta Group NV which was completed on June 14
2017. If services cease to be provided for any reason prior
to the second anniversary, the bonus arrangement for
that manager is forfeited.
In 2016, €1.9m of corporate restructuring expenses were
incurred in relation to changes in the senior management
team. The business restructuring expenses of €0.7m related
to a fee paid to terminate an agency agreement in the
UK, as part of the strategy to further develop our modulyss
brand in Europe through a direct sales approach. In ad-
dition, given the minor share of wool in our raw material
mix, the decision was taken to close the wool spinning
department and, going forward, to buy wool yarns from
third party suppliers.
Strategic advisory fees amounted to €1.3m in relation to
non-recurring tax, legal and financial advisory services.
Note 11. Finance expense(€ thousands) 2017 2016
Total finance expenses 37,327 28,608
Interest expense on Senior Secured Notes
26,783 24,897
Interest expense on Senior Term Loan Facility (€35m)
204 -
Interest expense on Senior Term Loan Facility (€75m)
3,289 -
Interest expense on Senior Term Loan Facility Bentley
2,025 -
Interest expense on Bank borrowings (including leasing)
425 504
Other finance costs 2,521 2,244
Foreign exchange result on interco transactions
2,080 962
The Group’s finance expenses increased from €28.6m
in 2016 to €37.3m in 2017. This increase is mainly driven
by €9.3m of non-recurring finance expenses, of which (i)
€5.4m in connection with the debt financed acquisition of
Bentley, which was fully repaid in June 2017 from the IPO
proceeds and (ii) €3.9m expenses in connection with the
early redemption of the Senior Secured Notes.
The remaining finance expenses are driven by interest
charges on the Senior Secured Notes, the Senior Term
Loan Facility of €35m, the Super Senior Revolving Credit
Facility, the other Revolving Credit Facilities and on the
finance leasing obligations. We refer to Notes 23, 24 and
25 for a description of these facilities. Other finance costs
mainly relate to factoring, commitment fees and other
bank related charges. The effective interest expense
of the Senior Secured Notes comprises a cash interest
of €20.7m (€22.5m in 2016), an early redemption fee of
€1.7m and the amortization of capitalized financing fees
of €4.4m (€2.4m in 2016).

BA
LTA
IS
SU
ER
A
NN
UA
L R
EPO
RT
2017
5352
SEC
TIO
N II
CO
NS
OLI
DA
TED
FIN
AN
CIA
L ST
ATE
MEN
TS
5352
Note 14. Property, plant and equipment
(€ thousands) Land and buildings Plant and machinery Other Equipment Total
Opening net book value 175,734 108,584 15,012 299,332
Additions 1,446 23,787 11,249 36,483
Revaluation surplus - - - -
Disposals - (1,543) (234) (1,777)
Transfers - - - -
Depreciation charge (5,854) (12,499) (10,923) (29,276)
Impairment charge - - - -
Exchange differences (2,124) (3,314) (86) (5,523)
Closing net book value 169,203 115,016 15,019 299,237
At December 31 2016
Cost or valuation 232,628 528,504 46,983 808,115
Accumulated depreciation, impairment and other adjustments
(63,426) (413,488) (31,964) (508,877)
Closing net book value 169,203 115,016 15,019 299,237
Opening net book value 169,203 115,016 15,019 299,237
Business combinations 700 10,740 4,634 16,074
Additions 665 23,138 14,458 38,261
Disposals (0) (463) (391) (854)
Transfers 284 2,375 (2,659) 0
Depreciation charge (5,977) (13,736) (12,258) (31,972)
Exchange differences (2,771) (6,093) (724) (9,587)
Closing net book value 162,103 130,977 18,080 311,160
At December 31 2017
Cost or valuation 231,256 516,930 47,446 795,633
Accumulated depreciation, impairment and other adjustments
(69,153) (385,953) (29,367) (484,474)
Closing net book value 162,103 130,977 18,080 311,160
A total of €16.1m of property, plant and equipment was
acquired in the context of the business combination with
Bentley. Refer to Note 5 for further details.
A total of €38.3m (€36.5m in 2016) has been invested, in
particular in plant, machinery and equipment.
The total depreciation expense of €32.0m (€29.3m in 2016)
has been charged in the line “Depreciation and amorti-
zation” in the income statement.
The Group’s assets which are pledged as security for the
borrowings are described in Note 23 and 25.
Exchange differences (2017: €9.6m and 2016: €5.5m) relate
to fluctuations in the closing exchange rate of our Turkish
entities and US entities which have a significant amount of
Property Plant and Equipment recorded on the statement
of financial position.
Note 13. Other Intangible assets
(€ thousands) Trademarks Software and licences
Internally generated intangible assets
Total
Opening net book value - 534 1,132 1,667
Additions - 829 665 1,494
Transfers (1) - 15 (15) -
Amortization charge - (257) (528) (785)
Closing net book value - 1,121 1,255 2,376
At December 31 2016
Cost or valuation - 5,206 8,080 13,286
Accumulated amortization, impairment and other adjustments
- (4,085) (6,825) (10,910)
Closing net book value - 1,121 1,255 2,376
(1) The transfer of €15 thousands consists of €676 thousands cost or valuation and €661 thousands depreciations.
Opening net book value - 1,121 1,255 2,376
Business combinations 10,913 266 - 11,179
Additions - 799 875 1,673
Disposals - - - -
Transfers - - - -
Amortization charge (730) (619) (598) (1,923)
Exchange differences (1,184) 97 - (1,087)
Closing net book value 8,999 1,663 1,532 12,218
At December 31 2017
Cost or valuation 9,728 9,292 8,955 29,922
Accumulated amortization, impairment and other adjustments
(730) (7,604) (7,423) (17,704)
Closing net book value 8,999 1,688 1,532 12,218
The trademark of €9.0m relates to the acquisition of Bentley.
More information can be found in the note regarding busi-
ness combinations. We refer to Note 5 for further details.
The internal and external software development costs are
capitalized under internally generated intangible assets.
These projects are mainly related to SAP implementation,
SAP upgrades and the automation of production processes.
The total amortization expense of €1.9m (2016: €0.8m) is
included in the line “Depreciation, amortization and im-
pairment” in the income statement and mainly increased
as a result of the acquisition of Bentley.

BA
LTA
IS
SU
ER
A
NN
UA
L R
EPO
RT
2017
5554
SEC
TIO
N II
CO
NS
OLI
DA
TED
FIN
AN
CIA
L ST
ATE
MEN
TS
5554
generation of future taxable profits during the periods in
which those temporary differences and tax loss carryfor-
wards become deductible. Management considers the
expected reversal of deferred tax liabilities and projected
future taxable income in making this assessment. Based
upon the level of historical taxable income and projections
for future taxable income over the periods in which the
deferred tax assets are deductible, management believes
it is probable the Group will realize the benefits of these
deductible differences. As of December 31 2017, the Group
has certain tax losses subject to significant limitations. For
those losses, deferred tax assets are not recognized, as
it is not probable that gains will be generated to offset
those losses. Uncertain tax positions, as described in Note
2, are taken into account when recognizing deferred tax
assets and liabilities.
As of December 31 2017 total tax credits amounted to
€494.8m, resulting in a potential deferred tax asset of
€123.1m of which the Group only recognized €9.1m in 2017.
As of December 31 2016 total tax credits amounted to
€453.6m, resulting in a potential deferred tax asset of
€151m of which the Group only recognized €18.9m.
The decrease in potential deferred tax assets mainly relates
to the decrease of corporate income tax rates in Belgium
and US as a result of the tax reforms enacted before year
end 2017 and also reflects changes in the probability that
tax losses can be further used in the future as a result of the
restructuring of the operational infrastructure in Belgium
within the Residential business, by the consolidation of the
Oudenaarde facility into the Group’s two fully vertically
integrated factories in the region. The majority of the tax
credits in 2016 and 2017 are incurred at the level of the
Belgian legal entities where - with the exception of the
tax credits in relation to the Notional Interest Deduction
- there is no expiry date regarding the tax credits.
Deferred tax liabilities
(€ thousands) Property, plant and equipment
Inventory Income tax liability
Intangible assets
Other Total
January 1 2016 (76,430) (2,394) (1,404) (420) (1,040) (81,689)
Charged/(credited) to the income statement
(1,636) (388) 1,404 (31) 1,041 390
Exchange differences 457 - - - - 457
December 31 2016 (77,610) (2,782) - (451) 1 (80,843)
January 1 2017 (77,610) (2,782) - (451) 1 (80,843)
Business combinations (4,664) (549) - (2,628) - (7,841)
Charged/(credited) to the income statement
17,652 870 - 1,123 (3) 19,642
Exchange differences 1,201 - - - - 1,201
December 31 2017 (63,420) (2,461) - (1,956) (2) (67,841)
Deferred income tax liabilities have not been recognized
for the withholding tax and other taxes that would be
payable on the unremitted earnings of certain subsidiaries.
Such amounts are permanently reinvested. Aggregate
unremitted earnings are equal to €158.8m as of Decem-
ber 31 2017 (as compared to €150.1m as of December 31
2016). The deferred tax liabilities resulting from property,
plant and equipment mainly decreased as a result of a
decrease in tax rates driven by the tax reforms enacted
in Belgium before December 31 2017.
When we add up the gross amounts of deferred tax assets
(€17.5m) and gross amount of deferred tax liabilities (€67.8m)
we arrive at a net deferred tax position per December 31
2017 of €50.3m.
Note 16. InventoriesThe table below provides a breakdown of total inventories
as of December 31 2017 and December 31 2016:
(€ thousands) December 31 2017
December 31 2016
Total inventories 147,868 135,320
Raw materials and consumables 64,948 60,564
Work in progress 22,892 19,087
Finished goods 60,029 55,670
Inventories increased by €12.5m to €147.9m for the year
ended December 31 2017 from €135.3m for the year ended
December 31 2016. The increase is mainly driven by the
acquisition of Bentley (€14.8m) and a decrease of inventory
by the rest of the Group (€2.3m).
Note 15. Deferred income tax assets and lia-bilitiesIFRS requires the deferred taxes for each jurisdiction to be
presented as a net asset or liability. Offsetting of deferred
tax liabilities from one jurisdiction against deferred tax as-
sets of another jurisdiction is not allowed. The table below
presents the net deferred tax position in accordance with
these presentation principles
(€ thousands) 2017 2016
Deferred tax assets: 4,160 18,950
Deferred tax assets to be reversed after more than 12 months 3,628 18,111
Deferred tax assets to be reversed within 12 months 532 839
Deferred tax liabilities: (54,471) (69,775)
Deferred tax liabilities to be reversed after more than 12 months (51,048) (64,491)
Deferred tax liabilities to be reversed within 12 months (3,423) (5,283)
Net deferred tax liabilities (50,311) (50,825)
The movement in the net deferred tax liabilities can be summarized as follows:
(€ thousands) 2017 2016
Beginning of period (50,825) (59,306)
Business combination (6,302) -
Income statement charge 6,236 7,727
Other comprehensive income (457) 285
Exchange differences 1,037 469
December 31 (50,311) (50,825)
In contrast to the table above, the table below shows the
movement in deferred taxes on a gross basis, i.e. without
netting deferred tax liabilities and deferred tax assets
within the same jurisdiction.
Deferred tax assets
(€ thousands)
Tax
loss
es c
arr
ied
forw
ard
Def
erre
d in
com
e sa
le a
nd
lea
seb
ack
Inta
ngib
le a
sset
s
Borr
owin
gs
Emp
loye
e b
enefi
ts
Inve
ntor
y
Oth
er
Ca
pita
l gra
nts
Tota
l
January 1 2016 9,416 4,859 2,867 1,903 1,612 683 1,044 - 22,384
(Charged)/credited to the income statement 9,451 (474) (956) - (22) 325 (987) - 7,338
Other comprehensive income - - - - 285 - - - 285
Exchange differences 12 - - - - - - - 12
December 31 2016 18,879 4,385 1,911 1,903 1,875 1,007 57 - 30,018
January 1 2017 18,879 4,385 1,911 1,903 1,875 1,007 57 - 30,018
Business combinations 193 - - - 248 - 1,098 - 1,539
(Charged)/credited to the income statement (9,814) (1,381) (1,080) (515) (232) 52 (433) - (13,404)
Exchange differences (166) - - - - - - - (166)
Other comprehensive income - - - - (457) - - - (457)
December 31 2017 9,091 3,004 832 1,388 1,434 1,059 722 - 17,530
In assessing the realizability of deferred tax assets, man-
agement considers the extent to which it is probable
that the deferred tax asset will be realized. The ultimate
realization of deferred tax assets is dependent upon the

BA
LTA
IS
SU
ER
A
NN
UA
L R
EPO
RT
2017
5756
SEC
TIO
N II
CO
NS
OLI
DA
TED
FIN
AN
CIA
L ST
ATE
MEN
TS
5756
Movements in the Group’s bad debt allowance with respect
to trade receivables are as follows:
2017 2016
As at January 1 (1,333) (2,535)
Business combination (547) -
Impairment loss recognized (42) (39)
Receivables written off during the year as uncollectible
383 761
Unused amounts reversed 516 479
Fx difference 58 -
As at 31 December (965) (1,333)
The creation and release of allowances for impaired
receivables has been included in “Other income/ex-
penses” in the income statement. Amounts charged to
the allowance account are generally written off when
there is no expectation of recovering additional cash.
As a result of the acquisition of Bentley, the allowance
for bad debt increased with €0.6m on March 31 2017 to
reflect the probability that certain trade receivables may
not be fully collected.
The other classes within trade and other receivables do
not contain impaired assets.
The maximum exposure to credit risk at the reporting
date is the carrying value of each class of receivable
mentioned above. As per December 31 2017 the Group
holds collateral (letters of credit and corporate or bank
guarantees) for an amount of €0.5m (as compared to
€0.3m as of December 31 2016).
Note 18. Cash and cash equivalents
(€ thousands) December 31 2017
December 31 2016
Total cash and cash equivalents 37,182 45,988
Cash at bank and on hands 26,876 38,553
Short-term bank deposits 3,127 2,035
Cash from local financing 7,179 5,400
The cash from local financing relates to cash and cash
equivalent balances held by subsidiaries that operate in
countries where legal restrictions apply and as such the
cash and cash equivalents are not directly available for
general use by the parent or other subsidiaries.
The credit quality of the banks and financial institutions
is disclosed in Note 29. The Group’s assets which are
pledged as security for the borrowings are described in
Notes 23 to 25.
Note 19. Share capital and share premiumShare capital and share premium have increased from
€1.4m to €293.3m as a result of the following events:
• Capital increase in cash by Balta Group NV: The part-
ners of the Company have issued 137,677,446 new shares
at a price of €1 per share for a total amount of €137.7
million and have allocated €0.9 (ninety cents) per the
share premium account of the company. This has been
allocated to capital through the issuance of new shares.
• Capital increase by means of a contribution in kind:
Contribution of the PECs, owned by LSF9 Balta Holdco
S.à r.l., into share premium for an amount of €152.9 million
without the issuance of new shares. This contribution took
place on the face value of the PECs, i.e. €138.6 million
initial principal amount plus €14.3 million accrued interest.
• Bentley Management Buy-Out: Prior to the equity
contribution, Bentley Management owned a minority
equity stake (of less than 2% of the total interest) in the
Bentley group of companies. This minority equity stake
has been acquired by LSF9 Balta Midco S.à r.l., who in
turn has rolled-down the stake into Balta NV, such that
the full ownership in Bentley is centralized in Balta NV.
This integration of the Bentley management equity
stake has resulted in an equity increase at the level of
the Group of €1.3 million.
Note 20. Other comprehensive incomeComponents of “Other comprehensive income” (“OCI”) are
items of income and expenses (including reclassification
adjustments) that are not recognized in the profit or loss
as required or permitted by other IFRSs. The Group has
other comprehensive income which mainly relates to the
re-measurements of post-employee defined benefit ob-
ligations, the gains and losses arising from translating the
financial statements of foreign entities and the changes
in the fair value of hedging instruments.
The movement in ‘Work in progress’ and ‘Finished goods’
is detailed as follows:
(€ thousands) December 31 2017
December 31 2016
Beginning of period 74,757 68,701
Business combinations 11,523 -
Income statement (3,359) 6,055
Of which: impact purchase price allocation
(3,008) -
Of which: actual movements in inventory
(351) 6,055
December 31 82,921 74,757
The Group decreased the provision for obsolete inventory
in 2017 with €1.4m compared to a decrease of €0.3m in 2016
which is included in “Raw materials used” and “Changes
in inventories of finished goods and work in progress”
respectively related to raw materials and finished goods
(including work in progress). The impact of the Bentley
acquistion on the year-end provision for obsolete inventory
is equal to €3.8m.
The sum of the raw material expenses and the changes
in inventories recognized as expenses in 2017 amounts to
€313.8m as compared to €253.4m in 2016.
The Group’s assets which are pledged as security for the
borrowings and senior secured notes are described in
Notes 23 to 25.
Note 17. Trade and other receivables
(€ thousands) December 31 2017
December 31 2016
Total Trade and other receivables 63,925 55,068
Trade and other receivables (non-current)
1,165 138
Other amounts receivable 1,165 138
Trade and other receivables (current) 62,760 54,930
Net trade receivables 49,649 41,325
Trade receivables 50,614 42,658
Less: Bad debt allowance (965) (1,333)
Prepayments and accrued income 1,026 1,945
Other amounts receivable 12,085 11,661
The fair value of the trade and other receivables approxi-
mates their carrying amount as the impact of discounting
is not significant.
As part of its normal course of business, the Group has
entered into non-recourse factoring agreements with fi-
nancial parties. The Group has derecognized the accounts
receivable for which substantially all risk and rewards of
ownership have been transferred.
Current trade and other receivables increased by €7.8m
to €62.8m as of December 31 2017, compared to €54.9m
as of December 31 2016. This increase is mainly driven
by the acquisition of Bentley. The net trade receivables
owned by Bentley amount to €15.5m. Excluding the impact
of the acquisition, current trade and other receivables
decreased by €7.6m.
As of December 31 2017 trade receivables that were past
due amounted to €5.2m compared to €3.2m at December
31 2016. The increase is driven by the acquisition of Bentley
and some customers having surpassed the due date of
their invoices at December 31 2017 compared to 2016. The
increase in past due receivables did not impact the bad
debt allowance because the majority of overdue invoices
were settled shortly after year end.
The Group has one external customer representing just
more than 10% of the Group’s revenue.
The Group uses credit insurance as a means to transfer
the credit risk related to trade receivables. Furthermore,
our trade receivables portfolio is very diversified, in terms
of both segmentation and client base, which mitigates
the credit risk. The credit quality of the trade receivables
that are neither past due nor impaired is good.
The assessment to set up a bad debt allowance is per-
formed on an individual basis in consideration of various
factors such as historical experience, credit quality, age of
the accounts receivables and economic conditions that
may affect a customer’s ability to pay. For the year ended
December 31 2017 there are some receivables past due
more than 3 months for which provision has been set up.
The carrying amounts of the Group’s trade and other
receivables are denominated in the following currencies:
(€ thousands) December 31 2017
December 31 2016
Total trade and other receivables 63,925 55,068
EUR 29,686 32,650
USD 19,306 9,723
GBP 5,697 2,352
TRY 9,236 10,344
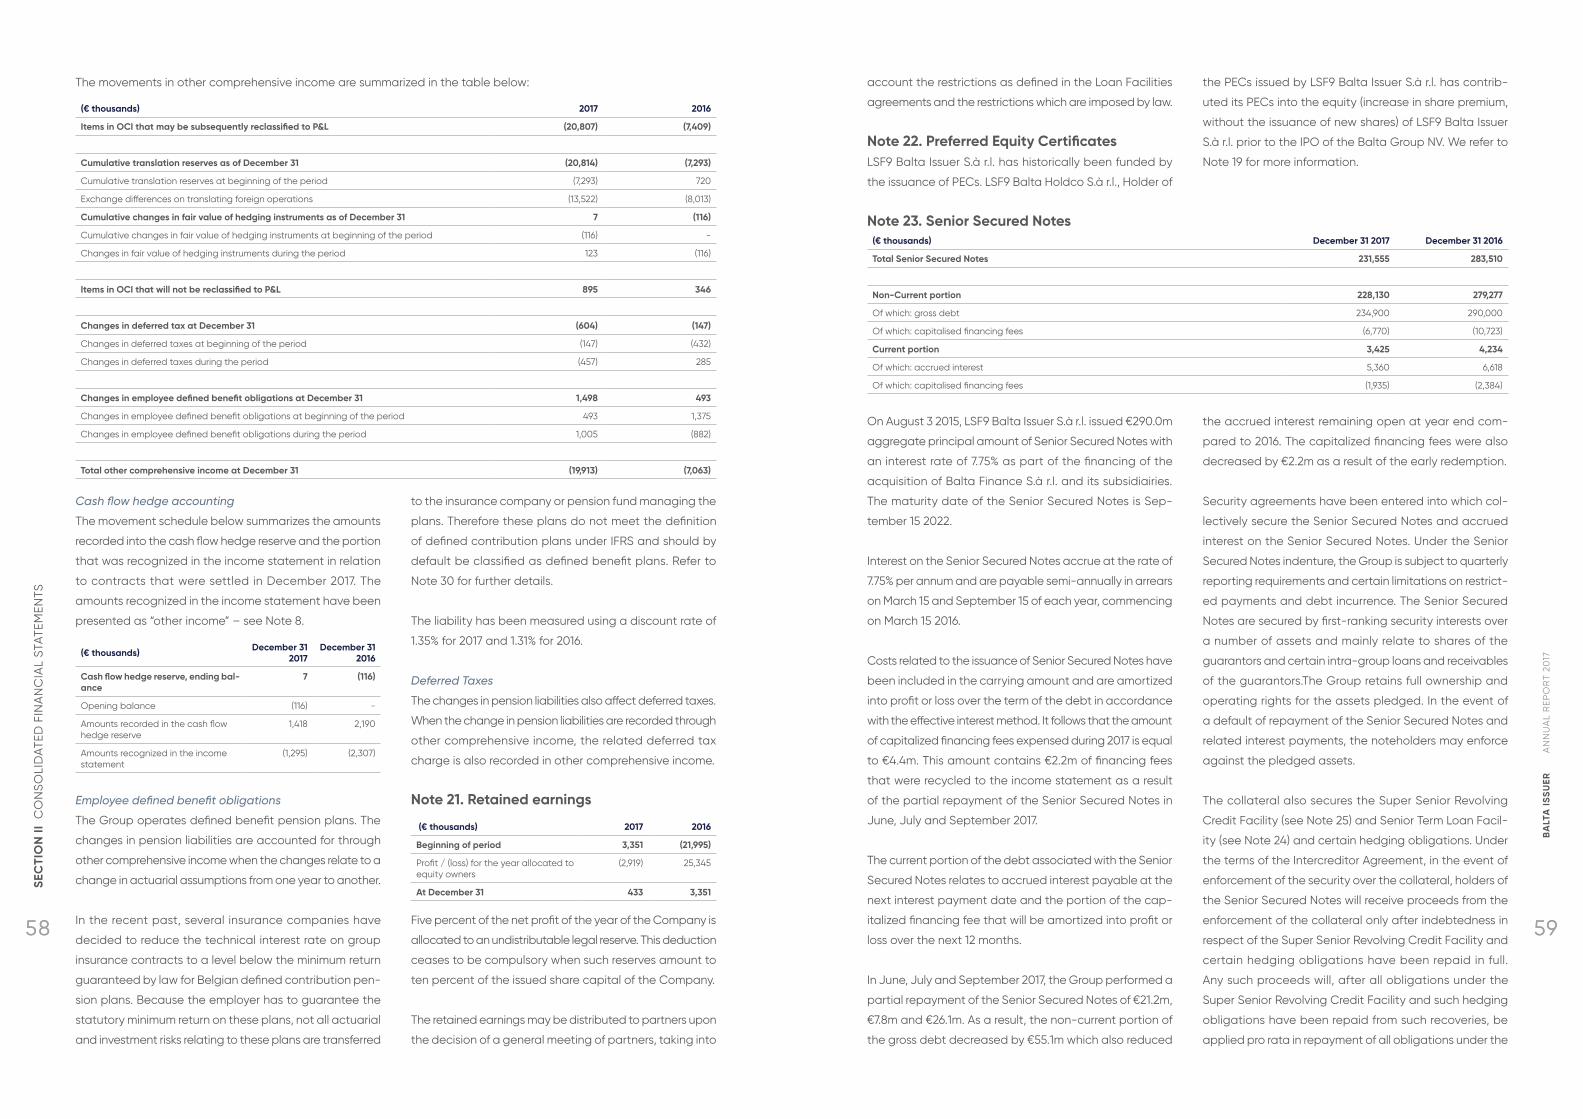
BA
LTA
IS
SU
ER
A
NN
UA
L R
EPO
RT
2017
5958
SEC
TIO
N II
CO
NS
OLI
DA
TED
FIN
AN
CIA
L ST
ATE
MEN
TS
5958
account the restrictions as defined in the Loan Facilities
agreements and the restrictions which are imposed by law.
Note 22. Preferred Equity CertificatesLSF9 Balta Issuer S.à r.l. has historically been funded by
the issuance of PECs. LSF9 Balta Holdco S.à r.l., Holder of
the PECs issued by LSF9 Balta Issuer S.à r.l. has contrib-
uted its PECs into the equity (increase in share premium,
without the issuance of new shares) of LSF9 Balta Issuer
S.à r.l. prior to the IPO of the Balta Group NV. We refer to
Note 19 for more information.
Note 23. Senior Secured Notes(€ thousands) December 31 2017 December 31 2016
Total Senior Secured Notes 231,555 283,510
Non-Current portion 228,130 279,277
Of which: gross debt 234,900 290,000
Of which: capitalised financing fees (6,770) (10,723)
Current portion 3,425 4,234
Of which: accrued interest 5,360 6,618
Of which: capitalised financing fees (1,935) (2,384)
On August 3 2015, LSF9 Balta Issuer S.à r.l. issued €290.0m
aggregate principal amount of Senior Secured Notes with
an interest rate of 7.75% as part of the financing of the
acquisition of Balta Finance S.à r.l. and its subsidiairies.
The maturity date of the Senior Secured Notes is Sep-
tember 15 2022.
Interest on the Senior Secured Notes accrue at the rate of
7.75% per annum and are payable semi-annually in arrears
on March 15 and September 15 of each year, commencing
on March 15 2016.
Costs related to the issuance of Senior Secured Notes have
been included in the carrying amount and are amortized
into profit or loss over the term of the debt in accordance
with the effective interest method. It follows that the amount
of capitalized financing fees expensed during 2017 is equal
to €4.4m. This amount contains €2.2m of financing fees
that were recycled to the income statement as a result
of the partial repayment of the Senior Secured Notes in
June, July and September 2017.
The current portion of the debt associated with the Senior
Secured Notes relates to accrued interest payable at the
next interest payment date and the portion of the cap-
italized financing fee that will be amortized into profit or
loss over the next 12 months.
In June, July and September 2017, the Group performed a
partial repayment of the Senior Secured Notes of €21.2m,
€7.8m and €26.1m. As a result, the non-current portion of
the gross debt decreased by €55.1m which also reduced
the accrued interest remaining open at year end com-
pared to 2016. The capitalized financing fees were also
decreased by €2.2m as a result of the early redemption.
Security agreements have been entered into which col-
lectively secure the Senior Secured Notes and accrued
interest on the Senior Secured Notes. Under the Senior
Secured Notes indenture, the Group is subject to quarterly
reporting requirements and certain limitations on restrict-
ed payments and debt incurrence. The Senior Secured
Notes are secured by first-ranking security interests over
a number of assets and mainly relate to shares of the
guarantors and certain intra-group loans and receivables
of the guarantors.The Group retains full ownership and
operating rights for the assets pledged. In the event of
a default of repayment of the Senior Secured Notes and
related interest payments, the noteholders may enforce
against the pledged assets.
The collateral also secures the Super Senior Revolving
Credit Facility (see Note 25) and Senior Term Loan Facil-
ity (see Note 24) and certain hedging obligations. Under
the terms of the Intercreditor Agreement, in the event of
enforcement of the security over the collateral, holders of
the Senior Secured Notes will receive proceeds from the
enforcement of the collateral only after indebtedness in
respect of the Super Senior Revolving Credit Facility and
certain hedging obligations have been repaid in full.
Any such proceeds will, after all obligations under the
Super Senior Revolving Credit Facility and such hedging
obligations have been repaid from such recoveries, be
applied pro rata in repayment of all obligations under the
The movements in other comprehensive income are summarized in the table below:
(€ thousands) 2017 2016
Items in OCI that may be subsequently reclassified to P&L (20,807) (7,409)
Cumulative translation reserves as of December 31 (20,814) (7,293)
Cumulative translation reserves at beginning of the period (7,293) 720
Exchange differences on translating foreign operations (13,522) (8,013)
Cumulative changes in fair value of hedging instruments as of December 31 7 (116)
Cumulative changes in fair value of hedging instruments at beginning of the period (116) -
Changes in fair value of hedging instruments during the period 123 (116)
Items in OCI that will not be reclassified to P&L 895 346
Changes in deferred tax at December 31 (604) (147)
Changes in deferred taxes at beginning of the period (147) (432)
Changes in deferred taxes during the period (457) 285
Changes in employee defined benefit obligations at December 31 1,498 493
Changes in employee defined benefit obligations at beginning of the period 493 1,375
Changes in employee defined benefit obligations during the period 1,005 (882)
Total other comprehensive income at December 31 (19,913) (7,063)
Cash flow hedge accounting
The movement schedule below summarizes the amounts
recorded into the cash flow hedge reserve and the portion
that was recognized in the income statement in relation
to contracts that were settled in December 2017. The
amounts recognized in the income statement have been
presented as “other income” – see Note 8.
(€ thousands) December 31 2017
December 31 2016
Cash flow hedge reserve, ending bal-ance
7 (116)
Opening balance (116) -
Amounts recorded in the cash flow hedge reserve
1,418 2,190
Amounts recognized in the income statement
(1,295) (2,307)
Employee defined benefit obligations
The Group operates defined benefit pension plans. The
changes in pension liabilities are accounted for through
other comprehensive income when the changes relate to a
change in actuarial assumptions from one year to another.
In the recent past, several insurance companies have
decided to reduce the technical interest rate on group
insurance contracts to a level below the minimum return
guaranteed by law for Belgian defined contribution pen-
sion plans. Because the employer has to guarantee the
statutory minimum return on these plans, not all actuarial
and investment risks relating to these plans are transferred
to the insurance company or pension fund managing the
plans. Therefore these plans do not meet the definition
of defined contribution plans under IFRS and should by
default be classified as defined benefit plans. Refer to
Note 30 for further details.
The liability has been measured using a discount rate of
1.35% for 2017 and 1.31% for 2016.
Deferred Taxes
The changes in pension liabilities also affect deferred taxes.
When the change in pension liabilities are recorded through
other comprehensive income, the related deferred tax
charge is also recorded in other comprehensive income.
Note 21. Retained earnings
(€ thousands) 2017 2016
Beginning of period 3,351 (21,995)
Profit / (loss) for the year allocated to equity owners
(2,919) 25,345
At December 31 433 3,351
Five percent of the net profit of the year of the Company is
allocated to an undistributable legal reserve. This deduction
ceases to be compulsory when such reserves amount to
ten percent of the issued share capital of the Company.
The retained earnings may be distributed to partners upon
the decision of a general meeting of partners, taking into

BA
LTA
IS
SU
ER
A
NN
UA
L R
EPO
RT
2017
6160
SEC
TIO
N II
CO
NS
OLI
DA
TED
FIN
AN
CIA
L ST
ATE
MEN
TS
6160
overdrafts, guarantees, short-term loan facilities, derivatives
or foreign exchange facilities subject to the satisfaction of
certain conditions precedent, to a Borrower or an Affiliate
of a Borrower in place of all or part of its unutilized com-
mitment under the Super Senior Revolving Credit Facility.
Amounts drawn under the Super Senior Revolving Credit
Facility may be used for working capital and other general
corporate purposes of the Restricted Group, operational
restructurings or permitted reorganizations of the Group.
The Revolving Credit Facility Agreement contains customary
and certain deal specific affirmative loan style covenants
and restrictive covenants such as a springing financial
covenant (based on total net leverage ratio) and an an-
nual guarantor coverage test. The Super Senior Revolving
Credit Facility is also guaranteed by each Guarantor. Under
the terms of the Intercreditor Agreement, in the event of
enforcement of the security over the collateral, holders of
the Senior Secured Notes and Senior Term Loan Facility will
receive proceeds from the enforcement of the collateral
only after indebtedness in respect of the Super Senior
Revolving Credit Facility and certain hedging obligations
have been repaid in full.
We confirm that we have complied with all covenants
over the reporting period.
Bentley Financing Arrangements
BPS Parent, Inc. and other subsidiaries entered into a $51.0m
syndicated credit facility (the “Fifth Third Credit Agreement”)
with Fifth Third Bank and other financial institutions (the
“Lenders”) on February 1 2017. The credit facilities under
the Fifth Third Credit Agreement consist of: (i) a five year
revolving credit facility of $18.0m which will be due and
payable on January 31 2022, and availability is governed
by a borrowing base, and (ii) a five year senior term loan
facility of $33.0m (“Bentley Term Loan”), also scheduled to
mature on January 31 2022, requiring quarterly payments.
Obligations under the Fifth Third Credit Agreement are
secured by a security interest on substantially all assets of
BPS Parent, Inc. and its subsidiaries in favor of the Lenders.
The Fifth Third Credit Agreement contains affirmative and
negative covenants with respect to BPS Parent, Inc. and
its subsidiaries and other payment restrictions. Certain of
the covenants limit indebtedness and investments of BPS
Parent, Inc. and its subsidiaries and require the mainte-
nance of certain financial ratios defined in the Fifth Third
Credit Agreement.
In June 2017, a portion of the proceeds of the capital
contribution were used to (i) fully repay the five year term
loan facility, and (ii) to partially reduce the amounts drawn
under the revolving credit facility. In August 2017 the re-
maining amount of the five year revolving credit facility
was repaid and no amounts have been drawn since then.
A portion of the capital contribution received from Balta
Group has been used to perform a partial repayment of
the Bentley debt of €39 million. The capitalized financing
fees relating to this debt have been completely released
through the consolidated statement of comprehensive
income via finance expenses.
Factoring
As part of its normal course of business, The Group has en-
tered into non-recourse receivables factoring agreements,
whereby it may sell trade receivables arising from the normal
course of business at face value less certain reserves and
fees. The insolvency risk related to the factored receivables
has been transferred to the factoring company, who in turn
has transferred this risk to a credit insurance company.
Under the non-recourse agreements, the Group collects
payments from its customers on behalf of the factoring
company to which it has factored its receivables. Given
that substantially all of the risks and rewards of ownership
has been transferred, the trade receivables assigned to
the factoring companies have been derecognized from
the statement of financial position.
Whilst the factoring program described above relates to a
portfolio of credit insured trade receivables, the Group has
also entered into a forfaiting agreement where a financial
institution agrees to purchase (forfait) on a revolving basis
the receivables from individually identified debtors. The
credit risk related to these receivables is fully transferred
from the Group to the financial institution and as a result
thereof, the financial institution bears the risk of non-pay-
ment by the debtor. The Group has been mandated to
collect the forfeited receivables for the account of and
on behalf of the financial institution. The eligible portion
of the trade receivables that have been transferred and
financed under this agreement have been derecognized
from the Group’s statement of financial position. The Group
continues to recognize a portion of the receivables to the
extent of its continuing involvement, in accordance with IAS
39 “Financial instruments: recognition and measurement”.
Indenture and any other obligations that are permitted
to be secured over the Collateral under the Indenture on
an equal and ratable basis.
We confirm that we have complied with all covenants
over the reporting period.
Note 24. Senior Term Loan Facility
(€ thousands) December 31 2017
December 31 2016
Total Senior Term Loan Facility 34,674 -
Non-Current portion 34,782 -
Of which: gross debt 35,000 -
Of which: capitalised financing fees (218) -
Current portion (108) -
Of which: acrrued interests 23 -
Of which: capitalized financing fees (131) -
Senior Term Loan Facility of €75m
On March 16 2017, LSF9 Balta Issuer S.à r.l. and certain of
its subsidiaries entered into a senior term loan agreement
(the “Senior Term Loan Agreement of €75m”), which pro-
vided for a €75.0m senior term loan facility (the “Senior
Term Loan of 75m”). The proceeds of the initial drawings
of the Senior Term Loan Facility of €75m were used to
repay certain subordinated loans incurred by LSF9 Balta
Issuer S.à r.l. to finance the acquisition of Bentley and to
pay related fees and expenses.
The Senior Term Loan Facility of €75m was repaid in full
in June 2017 using a portion of the capital contribution
received from Balta Group NV.
Senior Term Loan Facility of €35m
LSF9 Balta Issuer S.à r.l. entered into a €35.0m Senior
Term Loan Facility (the “Senior Term Loan agreement”)
maturing September 15 2020, at Euribor + 1.40% margin
per annum. The facility ranks pari passu with the Senior
Secured Notes. The net proceeds were used to finance a
partial redemption of the Senior Secured Notes in July and
September 2017. The Senior Term Loan Facility agreement
is dated August 29 2017 and the principal amount was
released at completion date which was September 5 2017.
Similar to the Super Senior Revolving Credit Facility, The
Group is subject to quarterly reporting requirements and
an annual guarantor coverage test.
Interest on the Senior Term Loan Facility accrues at the
rate of Euribor + 1.40% margin per annum and is payable
quarterly in arrears on March 15, June 15, September 15
and December 15 of each year, commencing on Sep-
tember 15 2017.
Costs related to the issuance of Senior Term Loan Facil-
ity have been included in the carrying amount and are
amortized into profit or loss over the term of the debt in
accordance with the effective interest method.
The current portion of the debt associated with the Senior
Term Loan Facility relates to accrued interest payables
at the next interest payment date and the portion of the
capitalized financing fee that will be amortized into profit
or loss over the next 12 months.
Note 25. Bank and other borrowings The table below provides an overview of the bank and
other borrowings that continue to exist on December 31
2016 and 2017:
(€ thousands) December 31 2017
December 31 2016
Total Bank and other borrowings 15,670 18,002
Non-current portion 13,310 15,388
Finance lease liabilities 13,310 15,388
Current portion 2,361 2,614
Finance lease liabilities 2,225 2,494
Commitment fees 136 120
Bank borrowings
On August 3 2015, LSF9 Balta Issuer S.à r.l. and LSF9 Balta
Investments S.à r.l. entered into a six-year Revolving Credit
Facility Agreement providing for a €40.0m European Super
Senior Revolving Credit Facility; which was increased to
€45.0m in 2016 and to €68.0m in 2017.
On July 18 2017, Balta has also renegotiated and obtained
more favorable commercial terms in respect of its European
Super Senior Revolving Credit Facility, including a reduction
of the margin from the original 3.75% p.a. in August 2015 to
an average margin below 1.80% p.a. at current leverage.
The Super Senior Revolving Credit Facility is secured by
first-ranking security interests over the collateral, which
also secures the Senior Secured Notes and the Guaran-
tees. Under the Super Senior Revolving Credit Facility, a
lender may make available an ancillary facility, such as

BA
LTA
IS
SU
ER
A
NN
UA
L R
EPO
RT
2017
6362
SEC
TIO
N II
CO
NS
OLI
DA
TED
FIN
AN
CIA
L ST
ATE
MEN
TS
6362
The operating lease commitments increased by €36.4m
as at December 31 2017, mainly due to the commitment
of €17.0m of operating leases at the level of Bentley which
mainly relate to the lease of buildings and new lease
contracts entered into by Balta Home USA (€20.8m), which
moved to a new 330,000 square feet distribution facility
in Rome, Georgia, to provide more capacity for its North
American business.
Note 27. Net Debt reconciliationsThe following table sets out an analysis of net debt and the movements in net debt:
Other assets
Liabilities from financing activities Total
(€ thousands)
Cash and Cash
equiva-lents
Senior Secured
Notes due after 1
year
Senior Secured
Notes due
within 1 year
Senior Term Loan
Facility (€75m)
due after 1 year
Senior Term Loan
Facility due after
1 year
Senior Term
Loan Fa-cility due
within 1 year
Bentley Financ-
ing arrange-
ments due after
1 year
Bentley Financ-
ing arrange-
ments due
within 1 year
Finance Lease
liabilities due after
1 year
Finance Lease
liabili-ties due within 1
year
Net debt as at January 1 2017
45,988 (290,000) (6,618) - - - - - (15,388) (2,494) (268,511)
Cashflows (8,806) - 1,258 - - (23) - - - 6 (7,565)
Proceeds of borrow-ings with third parties
- - - (75,000) (35,000) - - - - - (110,000)
Business combinations - - - - - - (40,030) (1,325) - - (41,355)
Foreign exchange adjustments
- - - - - - 1,741 68 - - 1,809
Repayments of bor-rowings with third parties
- 55,100 - 75,000 - - 38,289 1,257 - 2,341 171,987
O t h e r n o n - c a s h movements
- - - - - - - - 2,078 (2,078) -
Net debt as at December 31 2017
37,182 (234,900) (5,360) - (35,000) (23) - - (13,310) (2,225) (253,636)
The Group is also party to an Accounts Receivables Purchase
Agreement with a financial institution, in the framework
of a supply chain financing program offered by a large
customer. Under the agreement, the Group offers to sell
some or all of its accounts receivable due from this cus-
tomer to the financial institution. Given the non-recourse
nature of the agreement, the accounts receivables are
derecognized on the moment the cash is received.
Note 26. LeasesFinance lease liabilities
The table below shows the net book amount of the “land
and buildings” and “plant and machinery” which are subject
to a finance lease agreement:
(€ thousands) December 31 2017 December 31 2016
Net book value - Land and Buildings 12,658 14,193
Cost - Capitalised finance leases 18,412 18,412
Accumulated depreciation (5,754) (4,219)
Net book value - Plant and machinery 5,227 5,558
Cost - Capitalised finance leases 6,608 6,608
Accumulated depreciation (1,381) (1,050)
Net book value - Total leased Property, Plant & Equipment 17,886 19,751
Cost - Capitalised finance leases 25,020 25,020
Accumulated depreciation (7,134) (5,270)
The finance lease liabilities have decreased from €17.8m as
of December 31 2016 to €15.5m as of December 31 2017. No
material new financial lease contracts have been signed
during the period.
The gross investment in leases and the present value of
minimum future lease payments are due as follows:
(€ thousands) December 31 2017 December 31 2016
Gross finance lease liabilities - minimum lease payments 17,468 20,293
No later than 1 year 2,430 2,824
Later than 1 year and no later than 5 years 5,336 6,479
Later than 5 years 9,703 10,990
(€ thousands) December 31 2017 December 31 2016
Total present value of finance lease liabilities 15,447 17,787
No later than 1 year 2,137 2,399
Later than 1 year and no later than 5 years 4,235 5,263
Later than 5 years 9,075 10,125
Operating leases
The Group leases various buildings, equipment, machinery
and vehicles under operating lease agreements. The lease
terms are between 1 and 12 years.
The future aggregate minimum lease payments under
non-cancellable operating leases are as follows:
(€ thousands) December 31 2017 December 31 2016
Total present value of operating lease commitments 46,855 10,460
No later than 1 year 7,157 3,358
Later than 1 year and no later than 5 years 21,845 5,595
Later than 5 years 17,853 1,507

BA
LTA
IS
SU
ER
A
NN
UA
L R
EPO
RT
2017
6564
SEC
TIO
N II
CO
NS
OLI
DA
TED
FIN
AN
CIA
L ST
ATE
MEN
TS
6564
monitor events or actions that could lead to financial
losses. Derivative financial instruments are used to hedge
certain risk exposures at Group level.
The Group applied hedge accounting on the derivative
financial instruments relating to foreign exchange risk for
the periods covered in these financial statements starting
from June 1 2016.
Qualitative and quantitative disclosures about market risk
Foreign Exchange Risk
We have significant exposure to the value of the British
pound, the U.S. dollar and the Turkish lira. Consequently,
our financial results have been, and in the future will likely
continue to be, subject to currency transaction and trans-
lation effects resulting from fluctuations in exchange rates,
primarily the EUR/USD, EUR/GBP and EUR/TRY exchange
rates. The proportion of our revenue recognized in each
currency does not exactly correspond with the revenue
derived from each geography, as we sometimes invoice
customers in currencies other than their local currency. For
instance, a portion of our sales in the UK are invoiced in Euro.
Our consolidated financial statements are prepared in
Euro. We are therefore exposed to translation risk on the
preparation of our consolidated financial statements when
we translate the financial statements of our subsidiaries
which have a functional currency other than Euro. A portion
of our assets, liabilities, revenue and costs are denomi-
nated in various currencies other than Euro, principally
GBP, USD and TRY. As a result, our consolidated results
of operations, which are reported in Euro, are affected by
currency exchange rate fluctuations.
Transaction risk arises when our subsidiaries execute trans-
actions in a currency other than their functional currency.
We mitigate this risk through three primary methods. We
have entered into commercial arrangements with some
key customers to automatically adjust the impact of EUR/
GBP and EUR/TRY fluctuations through our prices. Second,
we use forward exchange contracts to hedge our residual
exposure to GBP and to hedge our USD exposure on an
ad hoc basis. Finally, even with respect to commercial
arrangements that do not provide for exchange rate-
based price-adjustment mechanisms, our established
relationships with our customers allow that both positive
and negative currency fluctuations are generally passed
on through price revisions over the medium term. Fluctua-
tions in the value of the USD and TRY relative to the Euro
typically have an impact on our gross margin.
Changes in foreign exchange rates may have a long-term
impact on our sales volumes. For example, if there is a
long-term depreciation of the Euro, our sales volumes may
increase as we become more competitive in non-Eurozone
markets. In contrast, a long-term strengthening of the Euro
may decrease our volumes and price competitiveness in
non-European markets.
The following table presents the main statement of financial
position items affected by foreign exchange risk.
(€ thousands) EUR GBP USD TRY TOTAL
December 31 2017 Net exposure (53,131) 4,177 6,198 11,448 (31,307)
Trade and other receivables 29,686 5,697 19,306 9,236 63,925
Cash and cash equivalents 20,496 4,406 10,043 2,236 37,182
Trade and other payables (103,312) (5,926) (23,151) (24) (132,414)
(€ thousands) EUR GBP USD TRY TOTAL
December 31 2016 Net exposure (42,328) (795) 5,028 7,589 (30,506)
Trade and other receivables 32,650 2,352 9,723 10,344 55,068
Cash and cash equivalents 38,436 3,237 2,227 2,088 45,988
Trade and other payables (113,414) (6,384) (6,922) (4,843) (131,562)
Note 28. Additional disclosures on financial instrumentsThe following table presents the carrying amounts and fair
values of each category of financial assets and financial
liabilities:
(€ thousands) Fair value hierarchy
December 31 2017
December 31 2017
December 31 2016
December 31 2016
Carrying amount
Fair value Carrying amount
Fair value
ASSETS AS PER STATEMENT OF FINANCIAL POSITIONS 101,107 101,107 101,102 101,102
Loans and receivables 101,107 101,107 101,056 101,056
Trade and other receivables 63,925 63,925 55,068 55,068
Cash and cash equivalents Level 1 37,182 37,182 45,988 45,988
Assets at fair value through profit or loss - - - -
Foreign exchange derivative financial instruments Level 2
Fixed price elect ricity purchase commitments Level 2
Assets at fair value through OCI - - 46 46
Foreign exchange derivative financial instruments Level 2 - - 46 46
LIABILITIES AS PER STATEMENT OF FINANCIAL POSITIONS 414,315 434,625 433,237 468,726
Financial liabilities measured at amortised cost 414,313 434,623 433,075 468,564
Senior Secured Notes Level 1 231,555 251,864 283,511 319,000
Senior Term Loan Facility Level 1 34,674 34,674 - -
Bank and other borrowings Level 2 15,671 15,671 18,002 18,002
Trade and other payables 132,414 132,414 131,562 131,562
Financial liabilities measured at fair value through profit or loss
Preferred equity certificates
Financial liabilities measured at fair value through OCI 2 2 162 162
Foreign exchange derivative financial instruments Level 2 2 2 162 162
The different levels of valuation method have been de-
fined as follows:
• Level 1: are valuations derived from quoted prices (unad-
justed) in active markets for identical assets or liabilities;
• Level 2: are valuations derived from inputs other than
quoted prices included within level 1 that are observable
for the asset or liability, either directly (that is, as prices)
or indirectly (that is, derived from prices);
• Level 3: are valuations derived from inputs for the asset
or liability that are not based on observable market data
(that is, unobservable inputs).
The fair value of the Senior Secured Notes is based on a
Level 1 estimate. The fair value of all other financial instru-
ments, with the exception of cash- and cash equivalents,
has been determined using Level 2 estimates. The fair
value of the forward foreign exchange contracts have
been determined using forward exchange rates that are
quoted in an active market. The effects of discounting are
generally insignificant for Level 2 derivatives. For trade and
other receivables, as well as trade and other payables, the
carrying amount is considered to be a good estimate of
the fair value, given the short term nature of these items.
There were no changes in valuation techniques during
the period.
Note 29. Financial risk managementThe Group’s activities expose it to a variety of financial
risks: market risk (including foreign exchange risk, fair value
interest rate risk, cash flow interest rate risk and commodity
price risk), credit risk and liquidity risk. The Group’s overall
risk management program focuses on the unpredictabil-
ity of financial markets and seeks to minimize potential
adverse effects on the Group’s financial performance.
The objective is to identify, quantify, manage and then

BA
LTA
IS
SU
ER
A
NN
UA
L R
EPO
RT
2017
6766
SEC
TIO
N II
CO
NS
OLI
DA
TED
FIN
AN
CIA
L ST
ATE
MEN
TS
6766
Loan and use under our factoring and forfaiting arrange-
ments are subject to variable interest rates, as the Senior
Secured Notes carry interest at a fixed rate. We therefore
did not use interest rate swaps in respect of our financing
during the current reporting period. The following table
presents the sensitivity analysis of the interest expenses
and income when there is an 25% shift in the € yield curve.
(€ thousands)
25 bps downward
shift in EUR yield curve
"25 bps upward
Total impact on interest expenses/income
63 (63)
Non-derivative floating rate financial liabilities
63 (63)
Qualitative and quantitative disclosures about credit risk
Our credit risk is managed on a Group-wide basis. We
assess the credit quality of the customer, taking into
account its financial position, past experience and other
factors. Individual credit limits are set based on historical
experience, in-depth knowledge of the customer and in
close cooperation with the business unit manager. These
credit limits are regularly reviewed by the business unit
managers and by finance management. In addition, we
have obtained credit insurance to cover a large portion of
the credit default risk. Finally, credit risk is also mitigated
through non-recourse factoring and forfaiting of the trade
receivables where the insolvency risk has been transferred
to the counterparty. Trade receivables are spread over a
number of countries and counterparties. There is no large
concentration of trade receivables. For derivative financial
assets, credit quality has been assessed based on the
Fitch rating of the counterparty. All our forward exchange
contracts are over the counter with a financial institution
as counterparty. Our fixed price purchase commitments
are entered into with the counterparty of our long term
procurement contracts.
Historical default rates did not exceed 0.1% for 2016 and 2017.
Excess liquidities are invested for very short periods and
are spread over a limited number of banks, all enjoying
a satisfactory credit rating. For cash at bank and short-
term bank deposits, the table below gives an overview of
credit ratings for banks used by the Group.
(€ thousands) December 31 2017
December 31 2016
Total cash and cash equivalents 37,182 45,988
A rating 32,704 42,493
BBB Rating 1,199 3,495
BB Rating 3,278 -
Qualitative and quantitative disclosures about liquidity risk
We monitor cash flow forecasts and liquidity requirements
centrally, ensuring that we have sufficient cash to meet
operational needs while maintaining sufficient headroom
on our undrawn committed borrowing facilities at all times
so that we do not breach borrowing limits or covenants
on any of our borrowing facilities.
The operating activities of our subsidiaries and their cash
inflows are our main source of liquidity. Our cash pooling
system enables us to benefit from the surplus funds of
certain subsidiaries to cover the financial requirements of
other subsidiaries. We invest surplus cash in interest-bearing
current accounts and short-term cash deposits, select-
ing instruments with appropriate maturities or sufficient
liquidity to provide sufficient headroom as determined by
the above-mentioned forecasts.
In order to meet our cash outflow obligations, we use
cash flows generated from operating activities and credit
facilities with financial institutions if necessary. In addition,
we have entered into factoring agreements with financial
institutions where cash is made available to us in con-
sideration for certain trade receivables generated by us.
The principal financing arrangements that are in place
at December 31 2017 and at December 31 2016 are the
Senior Secured Notes, the Senior Term Loan Facility, the
Super Senior Revolving Credit Facility, the Bentley Mills
Revolving Credit Facility and capital lease agreements.
The following table reflects all contractually fixed pay-offs
for settlement, repayments and interest resulting from
recognized financial liabilities. The amounts disclosed are
undiscounted net cash outflows, based on the market
conditions existing at December 31 2017.
The following table presents the sensitivity analysis of the
year-end statement of financial position in GBP, USD and
TRY in case the Euro would weaken by 10%.
(€ thousands) 2017 2016
GBP denominated (1,092) (1,710)
Changes in fair value derivative financial instruments (1,556) (1,622)
Changes in carrying amount of monetary assets and liabilities 464 (88)
USD denominated 689 712
Changes in fair value derivative financial instruments - 153
Changes in carrying amount of monetary assets and liabilities 689 559
TRY denominated 1,272 843
Changes in fair value derivative financial instruments - -
Changes in carrying amount of monetary assets and liabilities 1,272 843
The following table presents the sensitivity analysis of the
year-end statement of financial position in GBP, USD and
TRY in case the Euro would strengthen by 10%.
(€ thousands) 2017 2016
GBP denominated 893 1,399
Changes in fair value derivative financial instruments 1,273 1,327
Changes in carrying amount of monetary assets and liabilities (380) 72
USD denominated (563) (582)
Changes in fair value derivative financial instruments - (125)
Changes in carrying amount of monetary assets and liabilities (563) (457)
TRY denominated (1,041) (690)
Changes in fair value derivative financial instruments - -
Changes in carrying amount of monetary assets and liabilities (1,041) (690)
Commodity Price Risk
We are exposed to fluctuations in the price of major raw
material used in the manufacturing process. Our key raw
materials are polypropylene granulates, yarn, latex and
polyamide granulates.
In 2017, raw materials expenses represented 46.9% of
the Group’s revenue compared to 46.5% per last year.
As there is typically a time delay in the Group’s ability
to pass through raw materials price increases, changes
in the cost of raw materials typically have an impact on
the Group’s gross margin. During 2017, raw material cost
prices increased and put pressure on the Group’s margins.
Price increases and other compensating actions were not
sufficient to fully offset the adverse effect from increased
raw material prices.
If the commodity prices of polypropylene and polyamide
had been 10% higher (lower), profit after tax would have
been €4.6m lower (higher) in the absence of any mitigat-
ing actions taken by management. This impact has been
determined by multiplying the volumes of both granulates
and yarns purchased on an annual basis with a 10% vari-
ance on the average purchase price of polypropylene and
polyamide for the year. The sensitivity calculation takes
into account the typical time lag between purchasing
polypropylene and polyamide and recognizing the raw
material expenses against sales.
When we hedge, we might do so by entering into fixed
price contracts with our suppliers. No such arrangements
were entered into in 2017 or 2016.
Interest Rate Risk
Our interest rate risk principally relates to external indebted-
ness that bears interest at variable rates. Only the amounts
that we borrow under the (Super Senior) Revolving Credit
Facilities, our capital leases of buildings, our Senior Term

BA
LTA
IS
SU
ER
A
NN
UA
L R
EPO
RT
2017
6968
SEC
TIO
N II
CO
NS
OLI
DA
TED
FIN
AN
CIA
L ST
ATE
MEN
TS
6968
Brexit
The United Kingdom held a referendum on June 23 2016,
to determine whether the United Kingdom should leave
the European Union (the “EU”) or remain as a member
state, and the outcome of that referendum was in favor
of leaving the EU (commonly referred to as “Brexit”). The
effects of Brexit will depend on any agreements the United
Kingdom makes to retain access to EU markets, and, while
such impacts are difficult to predict, Belgian exports may
be negatively affected. In the year ended December 31
2017, our sales in the United Kingdom represented €147.9
m, or 22.4% of our revenue, of which €126.1m was in our
Residential segment where the United Kingdom represents
just above half of sales. Any reduction in consumers’ will-
ingness or ability to spend due to Brexit-related changes
in the economic environments of the United Kingdom and
Europe could materially affect our revenue. In addition,
lack of clarity about future UK laws and regulations, as
the United Kingdom determines which EU laws to replace
or replicate in the event of a withdrawal, may increase
costs associated with operating in either or both of the
United Kingdom and Europe.
Note 30. Employee benefit obligationsThe Group operates a pension plan and provides for
pension liabilities. These benefits have been measured in
compliance with IAS 19 revised and in accordance with
the Group accounting policies described in Note 1.20. The
liability was measured using a discount rate of 1.35% and
1.31% in 2017 and 2016, respectively. The annual pension
cost, relating to the pension plan is disclosed in Note 7.
The Group foresees termination benefits (including early
retirement) for its working and retired personnel. The lia-
bility was measured using a discount rate of 0.83% in 2017
and 0.62% in 2016.
The employee benefit obligations recognized in the fi-
nancial statements are detailed below:
(€ thousands) December 31 2017
December 31 2016
Total employee benefit obligations 4,127 5,079
Pension plans 1,810 2,815
Provisions early retirement pension 1,710 2,071
Provision for pensions 608 193
Pension plans: overview
A pension plan has been put in place for management
and is financed through employer contributions which in-
crease depending on seniority (base contribution of 3.75%
of pensionable salary, increasing by 0.5% for every 5 years
of service rendered within the Group up to a maximum
contribution rate of 5.75%). This plan also includes a “death
in service” benefit amounting to twice pensionable salary.
Several pension plans are in place for white collar workers
and are financed through fixed employer contributions.
In addition, as part of the bonus policy for members of
management, a portion of the bonus is awarded via em-
ployer contributions to a pension plan scheme.
The liability recognized in the balance sheet in respect
of defined benefit pension plans is the present value of
the defined benefit obligation at the end of the reporting
period less the fair value of plan assets.
Pension plans: valuation methodology
The pension and bonus plans as described above have
been classified as defined benefit. The valuation of the
pension and bonus plans have been performed in ac-
cordance with IAS 19.
We refer to Note 1.20 concerning the valuation method-
ology which has been used. The liability is based on the
difference between the present value of the “defined benefit
obligation”, taking into account the minimum return and
a discount factor, less the fair value of any plan assets at
date of closing.
Pension plans: main valuation assumptions
The main assumptions used to perform the valuation are
described below:
December 31 2017
December 31 2016
Discount rate 1.35% 1.31%
Retirement age 65 years 65 years
Mortality MR/FR-5 MR/FR-5
Pension plans: reported figures
For the year ended December 31 2017, the defined benefit
obligation taking into account the tax effect amounts to
€15.6m (December 31 2016: €10.1m), offset by plan assets of
€13.8m (December 31 2016: €7.3m) as at December 31 2017.
(€ thousands)Less than 6
monthsBetween 6
months and 1 year
Between 1 and 2 years
Between 2 and 5 years
Over 5 years
Total as of December 31 2017 (143,148) (10,421) (20,100) (328,826) (9,703)
Senior Secured Notes (9,102) (9,102) (18,205) (289,514) -
Senior Term Loan Facility (248) (249) (497) (35,374) -
Finance lease liabilities (1,360) (1,069) (1,398) (3,938) (9,703)
Trade and other payables (132,414) - - - -
Gross settled derivative financial instruments - outflows (14,004) - - - -
Gross settled derivative financial instruments - inflows 13,981 - - - -
The following table reflects all contractually fixed pay-offs
for settlement, repayments and interest resulting from
recognized financial liabilities. The amounts disclosed are
undiscounted net cash outflows, based on the market
conditions existing at December 31 2016.
(€ thousands)Less than 6
monthsBetween 6
months and 1 year
Between 1 year and 2
years
Between 2 and 5 years
Over 5 years
Total as of December 31 2016 (144,357) (12,647) (24,905) (71,474) (323,465)
Senior Secured Notes (11,238) (11,238) (22,475) (67,425) (312,475)
Finance lease liabilities (1,414) (1,409) (2,430) (4,049) (10,990)
Trade and other payables (131,562) - - - -
Gross settled derivative financial instruments - outflows (15,925) - - - -
Gross settled derivative financial instruments - inflows 15,782 - - - -
A key factor in maintaining a strong financial profile is our
credit rating which is affected by, among other factors,
our capital structure, profitability, ability to generate cash
flows, geographic and customer diversification and our
competitive position. Our current corporate credit ratings
from Moody’s Investor Service (Moody’s) and Standard &
Poor’s Ratings Services (S&P) are noted as follows:
December 31 2017 December 31 2017 December 31 2016 December 31 2016
Moody's S&P Moody's S&P
Long-term issue rating Senior Secured Notes B1 B+ B2 B
Corporate rating B1 B+ B2 B
On August 10 2015, Moody’s assigned a B2 rating to the
€290m Senior Secured Notes issued by LSF9 Balta Issuer
S.à r.l., the previous parent holding company of the Group,
following a review of the final bond documentation. In
June 2017, following the IPO, the ratings were upgraded
to B1 to reflect the strengthening of the Group’s financial
profile, increased transparency as a public company,
strengtherend corporate governance arrangements and
enhanced access to equity capital markets.
On September 14 2015, S&P assigned its ‘B’ long-term
corporate credit rating to LSF9 Balta Investments S.à r.l. At
the same time, S&P assigned its ‘B’ long-term issue rating
to LSF9 Balta Issuer S.à r.l.’s €290m Senior Secured Notes
and its ‘BB-’ long-term issue rating to the €68m Super
Senior Revolving Credit Facility. In July 2017, the corporate
rating was increased to B+ to reflect the improvements in
the Group’s financial credit metrics following the use of net
proceeds from the IPO to repay part of the Group’s debt.
Capital risk management
The Group’s objectives when managing capital are to
safeguard the Group’s ability to continue as a going con-
cern in order to provide returns for partners and benefits
for other stakeholders and to maintain an optimal capital
structure to reduce the cost of capital.
In order to maintain or adjust the capital structure, the
Group may adjust the amount of dividends paid to Part-
ners, issue new shares or sell assets to reduce debt. The
Group is closely monitoring its financial performance to
comply with financial covenants. Refer to Notes 23 to 25
for further details.

BA
LTA
IS
SU
ER
A
NN
UA
L R
EPO
RT
2017
7170
SEC
TIO
N II
CO
NS
OLI
DA
TED
FIN
AN
CIA
L ST
ATE
MEN
TS
7170
Accrued charges and deferred income mainly relate to:
• Deferred revenue relating to the sale and lease back of
one of the facilities which is recognized in profit over the
leasing period of the facilities (€11.5m, as compared to
€13.0m as of December 31 2016);
• Deferred revenue relating to advance payments on
rental agreements (€3.2m, as compared to €3.7m as of
December 31 2016);
• Accrued charges for customer discounts (€14.0m as of
December 31 2017 and €16.0m as of December 31 2016).
The increase in other payables mainly relates to payables
open at year-end in relation to strategic advisory charges
concerning financing activities.
Note 34. Government grantsThe Group’s government grants relate to incentives given
by Belgian authorities based on the Group’s investment,
environmental and employment policies.
The main incentives received comprise:
• Environmental grants: The Group receives governmental
allowances on a yearly basis in the framework of legislative
measures put into place in order to ascertain the compet-
itiveness of industries covered by the EU Emission Trading
System (the allowances for “carbon leakage”). At December
31 2017, €0.4m has been received in this framework. As per
December 31 2016 the amount was equal to €0.6m.
• Investment grants: The Group has concluded a cooperation
agreement with external parties for the development of
hybrid structures made with blended (preferential airlaid)
technology containing waste streams of polypropylene and of
polyurethane. At December 31 2017, €0.02m has been received
in this framework (which is the same amount as last year).
Note 35. Earnings per share Basic and diluted earnings per share
December 31 2017 December 31 2016
BASIC EARNINGS PER SHARE
Net result from continuing operations (2,884) 25,345
Percentage of net result from continuing operations attributable to holders of ordinary shares 100% 1%
Net result from continuing operations attributable to holders of ordinary shares (2,884) 253
Net result from discontinuing operations attributable to holders of ordinary shares - -
Weighted average number of ordinary shares oustanding (in thousands) 137,848 171
Net result per share attributable to holders of ordinary shares (in Euro) (0.02) 1.48
In accordance with IAS33, the basic earnings per share
amounts are calculated by dividing net profit for the year
attributable to ordinary equity holders of the parent by the
weighted average number of ordinary shares outstanding
during the year.
All earnings per share for 201 7 are calculated based on
the number of shares and the percentage of net results
attributable to the holders of ordinary shares at the date
of the capital reorganization which resulted respectively
in a total of 137.848 thousands of shares and 100 % of net
result attributable to the holders of ordinary shares.
Adjusted earnings per share
The result of 2017 and 2016 included some non-recurring
items which affected the earnings per share calculation.
From a management perspective we calculated an ad-
justed earnings per share which excluded the impact of
non-recurring items.
December 31 2017 December 31 2016
ADJUSTED EARNINGS PER SHARE 1
Net result from continuing operations (2,884) 25,345
Normalization adjustments: 19,689 8,338
Adjusted Net Result from continuing operations 16,805 17,008
Percentage of net result from continuing operations attributable to holders of ordinary shares 100% 1%
Net result from continuing operations attributable to holders of ordinary shares 16,805 170
Net result from discontinuing operations attributable to holders of ordinary shares - -
Weighted average number of ordinary shares oustanding (in thousands) 137,848 171
Net result per share attributable to holders of ordinary shares (in Euro) 0.12 1.0
(1) We refer to the Note 1.25 in which we provide a glossary of the non-GAAP measures and Note 3.
Note 31. Other payroll and social related payables
(€ thousands) December 31 2017 December 31 2016
Total other payroll and social related payables 33,359 31,246
Holiday pay 15,302 14,136
Social security taxes 7,499 7,365
Salaries and wages payable 5,421 5,137
Early retirement provision 636 628
Group insurance 586 557
Withholding taxes 868 886
Other 3,046 2,539
Other payroll and social related payables increased from
€31.2m as of December 31 2016 to €33.4m at December
31 2017.
The increase mainly relates to other payroll and social
related payables in relation to the acquisition of Bentley
(€3.8m).
Note 32. Provisions for other liabilities and charges
(€ thousands) Asset Retirement Obligation
Restructuring Warranty Other Total
At January 1 2017 - - - 64 64
Business combinations 935 - 2,045 - 2,980
Additional provisions made and increases to existing provisions
- 7,252 - - 7,252
Unused amounts reversed - - (111) - (111)
Exchange differences (102) - (209) - (310)
Amounts used - - (223) - (223)
At December 31 2017 834 7,252 1,502 64 9,652
Analysis of total provisions: 31 Dec 2017
Non-current 2,335
Current 7,316
9,652
The provision for other liabilities and charges increased
by €9.6m to €9.7m for the year ended December 31 2017.
The Group has announced the restructuring of the op-
erational infrastructure in Belgium within the Residential
business, by consolidating the Oudenaarde facility into
our two fully vertically integrated factories in the region.
The Group completed the consultation and negotiation
stages, has activated a full project management office to
deliver an increased run rate EBITDA benefit as from 2019.
A provision for restructuring was set up in accordance with
IAS 37 for an amount of €7.3m as at December 31 2017.
The acquisition of Bentley resulted in the increase of a
warranty provision by €2.0m on March 31 2017 which further
decreased to a provision of €1.5m at the end of the year.
Moreover, Bentley also rents some buildings for which an
asset retirement obligation of €0.8m was recognized.
Note 33. Trade and other payables
(€ thousands) December 31 2017
December 31 2016
Trade and other payables 132,414 131,562
Trade payables 91,445 96,620
Accrued charges and deferred income
31,776 33,369
Other payables 9,193 1,573
The outstanding trade and other payables increased
slightly from €131.6m as of December 31 2016 to €132.4m
as of December 31 2017.
Trade payables as of December 31 2017 include the amounts
for outstanding invoices (€74.9m, as compared to €81m as
of December 31 2016) and invoices to be received in relation
to goods and services received during the current period
(€16.5m), as compared to €16m as of December 31 2016).
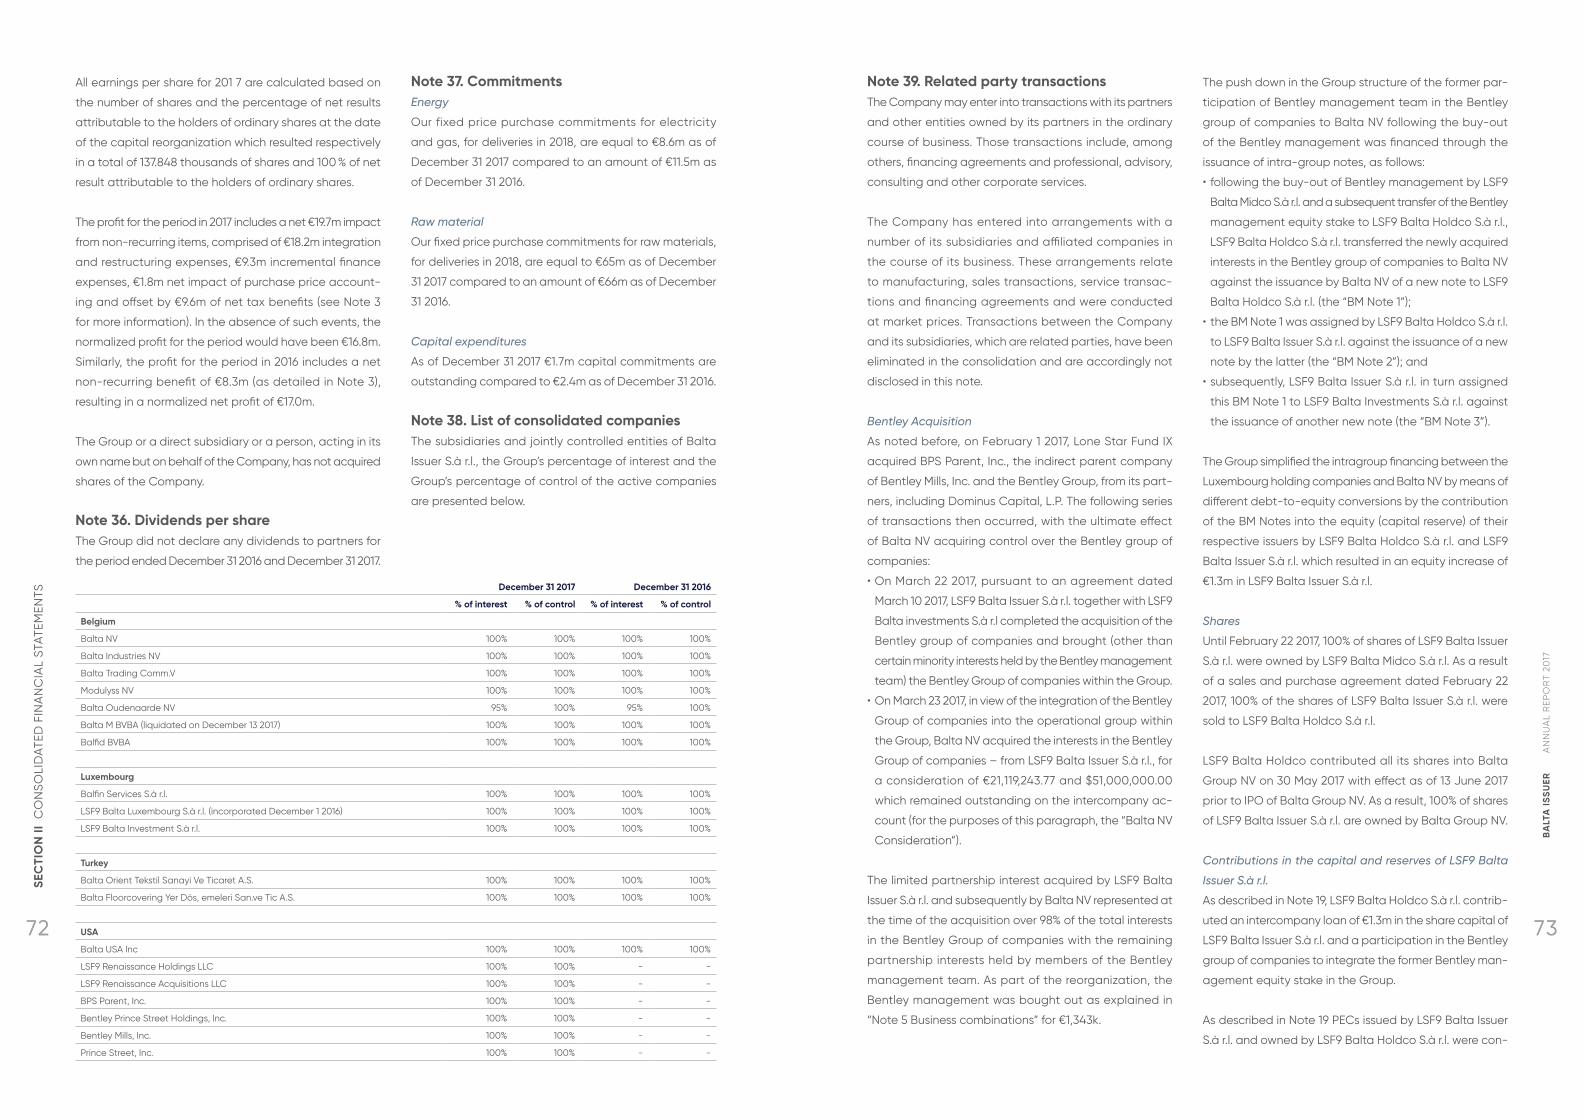
BA
LTA
IS
SU
ER
A
NN
UA
L R
EPO
RT
2017
7372
SEC
TIO
N II
CO
NS
OLI
DA
TED
FIN
AN
CIA
L ST
ATE
MEN
TS
7372
Note 39. Related party transactionsThe Company may enter into transactions with its partners
and other entities owned by its partners in the ordinary
course of business. Those transactions include, among
others, financing agreements and professional, advisory,
consulting and other corporate services.
The Company has entered into arrangements with a
number of its subsidiaries and affiliated companies in
the course of its business. These arrangements relate
to manufacturing, sales transactions, service transac-
tions and financing agreements and were conducted
at market prices. Transactions between the Company
and its subsidiaries, which are related parties, have been
eliminated in the consolidation and are accordingly not
disclosed in this note.
Bentley Acquisition
As noted before, on February 1 2017, Lone Star Fund IX
acquired BPS Parent, Inc., the indirect parent company
of Bentley Mills, Inc. and the Bentley Group, from its part-
ners, including Dominus Capital, L.P. The following series
of transactions then occurred, with the ultimate effect
of Balta NV acquiring control over the Bentley group of
companies:
• On March 22 2017, pursuant to an agreement dated
March 10 2017, LSF9 Balta Issuer S.à r.l. together with LSF9
Balta investments S.à r.l completed the acquisition of the
Bentley group of companies and brought (other than
certain minority interests held by the Bentley management
team) the Bentley Group of companies within the Group.
• On March 23 2017, in view of the integration of the Bentley
Group of companies into the operational group within
the Group, Balta NV acquired the interests in the Bentley
Group of companies – from LSF9 Balta Issuer S.à r.l., for
a consideration of €21,119,243.77 and $51,000,000.00
which remained outstanding on the intercompany ac-
count (for the purposes of this paragraph, the “Balta NV
Consideration”).
The limited partnership interest acquired by LSF9 Balta
Issuer S.à r.l. and subsequently by Balta NV represented at
the time of the acquisition over 98% of the total interests
in the Bentley Group of companies with the remaining
partnership interests held by members of the Bentley
management team. As part of the reorganization, the
Bentley management was bought out as explained in
“Note 5 Business combinations” for €1,343k.
The push down in the Group structure of the former par-
ticipation of Bentley management team in the Bentley
group of companies to Balta NV following the buy-out
of the Bentley management was financed through the
issuance of intra-group notes, as follows:
• following the buy-out of Bentley management by LSF9
Balta Midco S.à r.l. and a subsequent transfer of the Bentley
management equity stake to LSF9 Balta Holdco S.à r.l.,
LSF9 Balta Holdco S.à r.l. transferred the newly acquired
interests in the Bentley group of companies to Balta NV
against the issuance by Balta NV of a new note to LSF9
Balta Holdco S.à r.l. (the “BM Note 1”);
• the BM Note 1 was assigned by LSF9 Balta Holdco S.à r.l.
to LSF9 Balta Issuer S.à r.l. against the issuance of a new
note by the latter (the “BM Note 2”); and
• subsequently, LSF9 Balta Issuer S.à r.l. in turn assigned
this BM Note 1 to LSF9 Balta Investments S.à r.l. against
the issuance of another new note (the “BM Note 3”).
The Group simplified the intragroup financing between the
Luxembourg holding companies and Balta NV by means of
different debt-to-equity conversions by the contribution
of the BM Notes into the equity (capital reserve) of their
respective issuers by LSF9 Balta Holdco S.à r.l. and LSF9
Balta Issuer S.à r.l. which resulted in an equity increase of
€1.3m in LSF9 Balta Issuer S.à r.l.
Shares
Until February 22 2017, 100% of shares of LSF9 Balta Issuer
S.à r.l. were owned by LSF9 Balta Midco S.à r.l. As a result
of a sales and purchase agreement dated February 22
2017, 100% of the shares of LSF9 Balta Issuer S.à r.l. were
sold to LSF9 Balta Holdco S.à r.l.
LSF9 Balta Holdco contributed all its shares into Balta
Group NV on 30 May 2017 with effect as of 13 June 2017
prior to IPO of Balta Group NV. As a result, 100% of shares
of LSF9 Balta Issuer S.à r.l. are owned by Balta Group NV.
Contributions in the capital and reserves of LSF9 Balta
Issuer S.à r.l.
As described in Note 19, LSF9 Balta Holdco S.à r.l. contrib-
uted an intercompany loan of €1.3m in the share capital of
LSF9 Balta Issuer S.à r.l. and a participation in the Bentley
group of companies to integrate the former Bentley man-
agement equity stake in the Group.
As described in Note 19 PECs issued by LSF9 Balta Issuer
S.à r.l. and owned by LSF9 Balta Holdco S.à r.l. were con-
All earnings per share for 201 7 are calculated based on
the number of shares and the percentage of net results
attributable to the holders of ordinary shares at the date
of the capital reorganization which resulted respectively
in a total of 137.848 thousands of shares and 100 % of net
result attributable to the holders of ordinary shares.
The profit for the period in 2017 includes a net €19.7m impact
from non-recurring items, comprised of €18.2m integration
and restructuring expenses, €9.3m incremental finance
expenses, €1.8m net impact of purchase price account-
ing and offset by €9.6m of net tax benefits (see Note 3
for more information). In the absence of such events, the
normalized profit for the period would have been €16.8m.
Similarly, the profit for the period in 2016 includes a net
non-recurring benefit of €8.3m (as detailed in Note 3),
resulting in a normalized net profit of €17.0m.
The Group or a direct subsidiary or a person, acting in its
own name but on behalf of the Company, has not acquired
shares of the Company.
Note 36. Dividends per shareThe Group did not declare any dividends to partners for
the period ended December 31 2016 and December 31 2017.
Note 37. CommitmentsEnergy
Our fixed price purchase commitments for electricity
and gas, for deliveries in 2018, are equal to €8.6m as of
December 31 2017 compared to an amount of €11.5m as
of December 31 2016.
Raw material
Our fixed price purchase commitments for raw materials,
for deliveries in 2018, are equal to €65m as of December
31 2017 compared to an amount of €66m as of December
31 2016.
Capital expenditures
As of December 31 2017 €1.7m capital commitments are
outstanding compared to €2.4m as of December 31 2016.
Note 38. List of consolidated companiesThe subsidiaries and jointly controlled entities of Balta
Issuer S.à r.l., the Group’s percentage of interest and the
Group’s percentage of control of the active companies
are presented below.
December 31 2017 December 31 2016
% of interest % of control % of interest % of control
Belgium
Balta NV 100% 100% 100% 100%
Balta Industries NV 100% 100% 100% 100%
Balta Trading Comm.V 100% 100% 100% 100%
Modulyss NV 100% 100% 100% 100%
Balta Oudenaarde NV 95% 100% 95% 100%
Balta M BVBA (liquidated on December 13 2017) 100% 100% 100% 100%
Balfid BVBA 100% 100% 100% 100%
Luxembourg
Balfin Services S.à r.l. 100% 100% 100% 100%
LSF9 Balta Luxembourg S.à r.l. (incorporated December 1 2016) 100% 100% 100% 100%
LSF9 Balta Investment S.à r.l. 100% 100% 100% 100%
Turkey
Balta Orient Tekstil Sanayi Ve Ticaret A.S. 100% 100% 100% 100%
Balta Floorcovering Yer Dös, emeleri San.ve Tic A.S. 100% 100% 100% 100%
USA
Balta USA Inc 100% 100% 100% 100%
LSF9 Renaissance Holdings LLC 100% 100% - -
LSF9 Renaissance Acquisitions LLC 100% 100% - -
BPS Parent, Inc. 100% 100% - -
Bentley Prince Street Holdings, Inc. 100% 100% - -
Bentley Mills, Inc. 100% 100% - -
Prince Street, Inc. 100% 100% - -

BA
LTA
IS
SU
ER
A
NN
UA
L R
EPO
RT
2017
7574
SEC
TIO
N II
CO
NS
OLI
DA
TED
FIN
AN
CIA
L ST
ATE
MEN
TS
7574
of the phantom share bonus schemes was directly con-
nected to the IPO.
In the context of the IPO, certain managers received
shares and a cash bonus from LSF9 Balta Midco S.à r.l.
pursuant to existing management incentive schemes with
Lone Star entities.
The number of shares granted to the members of the
Management Committee and the current general manager
of Bentley is 1,127,362 shares in total. 232,284 shares were
acquired upon completion of the IPO and of the remaining,
50% (447,541 shares) would vest on the first anniversary of
the IPO and 50% (447,537 shares) on its second anniversary.
A manager who leaves the Group voluntarily or is dismissed
for cause prior to a vesting date will lose his entitlement
to unvested shares.
The Group has not granted any stock options or other
rights to acquire shares to members of the Management
Committee.
tributed in the share premium of LSF9 Balta Issuer S.à r.l.
for an amount of €152.9m.
Key management compensation
Key management means the Group’s Management Com-
mittee, which consists of people having authority and
responsibility for planning, directing and controlling the
activities of the Group. Key management compensation
includes all fixed and variable remuneration and other
benefits which are presented in other expenses and long-
term employee benefits which are presented in integration
and restructuring.
(€ thousands) December 31 2017 December 31 2016
Total key management compensation
2,937 4,098
Short-term employee benefits
2,410 2,785
Long-term employee benefits
403 -
Board compensation 125 -
Termination benefits - 1,313
Share-based payments
- -
Other transactions with related parties
Year-end balances arising from daily operations:
(€ thousands) December 31 2017 December 31 2016
Trade and Other receivables from related parties
1,027 54
Trade and Other Payables to related parties
(7,750) -
Other income with Related parties
18 -
Other expenses with Related parties
(6,823) -
The year-end balances mainly arise from current account
positions as a result of payments which have been per-
formed on behalf of Group entities. These current accounts
are respectively reflected in “Trade and other receivables”
and in “Trade and other payables”.
Note 40. Fees paid to the Group’s auditors(€ thousands) 2017 2016
Audit services 1,306 354
Audit of the Group pursuant to legislation 300 300
Other audit-related services 1,007 54
Non-audit services 394 798
Tax services 184 798
Other services 210 -
Total fees paid to the Group's auditor 1,700 1,152
Note 41. Share based paymentsOn June 16 2017, Balta NV, a member of the Balta Group,
provided a share related bonus payment pursuant to a
phantom share bonus scheme with Balta NV to certain
members of the Management Committee.
The Chief Executive Officer is entitled to a share-related
bonus payment pursuant to a phantom share bonus
scheme with Balta NV representing the value of 84,544
shares at payout date. The bonus is only payable if the
Chief Executive Officer still provides services to the Group
on the second anniversary of the IPO. If services cease
to be provided for any reason prior to the second anni-
versary, the bonus arrangement for the Chief Executive
Officer is forfeited.
The other members of the Management Committee (ex-
cluding the CEO) are entitled to a share related bonus
payment pursuant to a phantom share bonus scheme
with Balta NV, collectively representing the value of 86,361
shares at payout date. The bonus is only payable if the
manager still provides services to the Group on the second
anniversary of the IPO. If services cease to be provided
for any reason prior to the second anniversary, the bonus
arrangement for that manager is forfeited.
The actual cost of these share related bonus payment
are recognized in the income statement over the vesting
period of the schemes and have been recognized in in-
tegration and restructuring expenses as the installation

BA
LTA
IS
SU
ER
A
NN
UA
L R
EPO
RT
2017
7776
SEC
TIO
N II
CO
NS
OLI
DA
TED
FIN
AN
CIA
L ST
ATE
MEN
TS
7776
Responsibilities of the “Réviseur d’entreprises agréé” for
the audit of the consolidated financial statements
The objectives of our audit are to obtain reasonable
assurance about whether the consolidated financial
statements as a whole are free from material misstate-
ment, whether due to fraud or error, and to issue an audit
report that includes our opinion. Reasonable assurance is
a high level of assurance, but is not a guarantee that an
audit conducted in accordance with the Law of 23 July
2016 and with ISAs as adopted for Luxembourg by the
CSSF will always detect a material misstatement when it
exists. Misstatements can arise from fraud or error and are
considered material if, individually or in the aggregate, they
could reasonably be expected to influence the economic
decisions of users taken on the basis of these consolidated
financial statements.
As part of an audit in accordance with the Law of 23 July
2016 and with ISAs as adopted for Luxembourg by the
CSSF, we exercise professional judgment and maintain
professional scepticism throughout the audit. We also:
• identify and assess the risks of material misstatement
of the consolidated financial statements, whether due
to fraud or error, design and perform audit procedures
responsive to those risks, and obtain audit evidence that
is sufficient and appropriate to provide a basis for our
opinion. The risk of not detecting a material misstatement
resulting from fraud is higher than for one resulting from
error, as fraud may involve collusion, forgery, intentional
omissions, misrepresentations, or the override of internal
control;
• obtain an understanding of internal control relevant
to the audit in order to design audit procedures that
are appropriate in the circumstances, but not for the
purpose of expressing an opinion on the effectiveness
of the Group’s internal control;
• evaluate the appropriateness of accounting policies
used and the reasonableness of accounting estimates
and related disclosures made by the Board of Managers;
• conclude on the appropriateness of the Board of Man-
agers’ use of the going concern basis of accounting
and, based on the audit evidence obtained, whether
a material uncertainty exists related to events or con-
ditions that may cast significant doubt on the Group’s
ability to continue as a going concern. If we conclude
that a material uncertainty exists, we are required to
draw attention in our audit report to the related disclo-
sures in the consolidated financial statements or, if such
disclosures are inadequate, to modify our opinion. Our
conclusions are based on the audit evidence obtained
up to the date of our audit report. However, future events
or conditions may cause the Group to cease to continue
as a going concern;
• evaluate the overall presentation, structure and content
of the consolidated financial statements, including the
disclosures, and whether the consolidated financial
statements represent the underlying transactions and
events in a manner that achieves fair presentation;
• obtain sufficient appropriate audit evidence regarding
the financial information of the entities and business
activities within the Group to express an opinion on the
consolidated financial statements. We are responsible for
the direction, supervision and performance of the Group
audit. We remain solely responsible for our audit opinion.
We communicate with those charged with governance
regarding, among other matters, the planned scope and
timing of the audit and significant audit findings, includ-
ing any significant deficiencies in internal control that we
identify during our audit.
Report on other legal and regulatory requirements
The consolidated Management report is consistent with
the consolidated financial statements and has been pre-
pared in accordance with applicable legal requirements.
Luxembourg, 18 April 2018
PricewaterhouseCoopers, Société coopérative
Represented by
Véronique Lefebvre
II.6. Audit report
To the Partner of
LSF9 Balta Issuer S.à r.l.
Report on the audit of the consolidated financial statementsOur opinion
In our opinion, the accompanying consolidated financial
statements give a true and fair view of the consolidated
financial position of LSF9 Balta Issuer S.à r.l. (the “Compa-
ny”) and its subsidiaries (the “Group”) as at 31 December
2017, and of its consolidated financial performance and
its consolidated cash flows for the year then ended in ac-
cordance with International Financial Reporting Standards
(IFRSs) as adopted by the European Union.
What we have audited
The Group’s consolidated financial statements comprise:
• the consolidated statement of financial position as at
31 December 2017;
• the consolidated statement of comprehensive income
for the year then ended;
• the consolidated statement of changes in equity for the
year then ended;
• the consolidated statement of cash flows for the year
then ended; and
• the notes to the consolidated financial statements, which
include a summary of significant accounting policies.
Basis for opinion
We conducted our audit in accordance with the Law of
23 July 2016 on the audit profession (Law of 23 July 2016)
and with International Standards on Auditing (ISAs) as
adopted for Luxembourg by the “Commission de Surveil-
lance du Secteur Financier” (CSSF). Our responsibilities
under those Law and standards are further described in
the “Responsibilities of the “Réviseur d’entreprises agréé”
for the audit of the consolidated financial statements”
section of our report.
We believe that the audit evidence we have obtained is
sufficient and appropriate to provide a basis for our opinion.
We are independent of the Group in accordance with
the International Ethics Standards Board for Accountants’
Code of Ethics for Professional Accountants (IESBA Code)
as adopted for Luxembourg by the CSSF together with
the ethical requirements that are relevant to our audit of
the consolidated financial statements. We have fulfilled
our other ethical responsibilities under those ethical re-
quirements.
Other information
The Board of Managers is responsible for the other infor-
mation. The other information comprises the information
stated in the consolidated Management report but does
not include the consolidated financial statements and our
audit report thereon.
Our opinion on the consolidated financial statements does
not cover the other information and we do not express
any form of assurance conclusion thereon.
In connection with our audit of the consolidated financial
statements, our responsibility is to read the other informa-
tion identified above and, in doing so, consider whether
the other information is materially inconsistent with the
consolidated financial statements or our knowledge ob-
tained in the audit, or otherwise appears to be materially
misstated. If, based on the work we have performed, we
conclude that there is a material misstatement of this
other information, we are required to report that fact. We
have nothing to report in this regard.
Responsibilities of the Board of Managers for the consol-
idated financial statements
The Board of Managers is responsible for the prepara-
tion and fair presentation of the consolidated financial
statements in accordance with IFRSs as adopted by the
European Union, and for such internal control as the Board
of Managers determines is necessary to enable the prepa-
ration of consolidated financial statements that are free
from material misstatement, whether due to fraud or error.
In preparing the consolidated financial statements, the
Board of Managers is responsible for assessing the Group’s
ability to continue as a going concern, disclosing, as ap-
plicable, matters related to going concern and using the
going concern basis of accounting unless the Board of
Managers either intends to liquidate the Group or to cease
operations, or has no realistic alternative but to do so.

LSF9 Balta Isuer S.à r.l. 5, Rue Guillaume Kroll L-1882 Luxembourg Luxembourg [email protected] www.baltagroup.com
Indoor & Outdoor Rugs Commercial Carpets & Tiles Residential Carpets & Tiles