LPPT-VMT: A Simulation Tool for Measuring Transportation ... · LPPT-VMT: A Simulation Tool for...
23
LPPT-VMT: A Simulation Tool for Measuring Transportation Use in an Aging City Simon Choi, Derek Hung, Tom Vo, Jung H. Seo, Frank Wen, and Hsi-Hwa Hu Southern California Association of Governments 2016 TRB Summer Conference on Transportation Planning & Air Quality, August 4-5, 2016, Minneapolis, MN
Transcript of LPPT-VMT: A Simulation Tool for Measuring Transportation ... · LPPT-VMT: A Simulation Tool for...

LPPT-VMT: A Simulation Tool for Measuring Transportation Use in
an Aging City
Simon Choi, Derek Hung, Tom Vo, Jung H. Seo, Frank Wen, and Hsi-Hwa Hu
Southern California Association of Governments
2016 TRB Summer Conference on Transportation Planning & Air Quality, August 4-5, 2016, Minneapolis, MN

Presentation Outline
SCAG Introduction Research Background & Past Studies Research Purpose Modeling Framework & Data LPPT-VMT Demonstration:
City of Palm Springs Conclusion

SCAG Overview

Nation’s largest Metropolitan Planning Organization (MPO)
6 counties and 191 cities 19 million people 16th-largest regional
economy in the world 38,000 square miles
SCAG Quick Facts

• The population of the United States is rapidly expanding and growing older.
• By 2035, the proportion of people over the age of 65 will be over 21 percent of the population.
• This trend is a global one, directly affecting planning practice worldwide (WHO 2007).
Source: U.S. Census Bureau, “U.S. Population Projections,” 2014.
Research Background

• With the aging of population in local communities, local jurisdictions will experience a change in community service needs in the future.• e.g. services for poor people• e.g. schools• e.g. housing• e.g. energy use• e.g. hospitals• e.g. police• e.g. transportation
• Metropolitan Planning Organizations (MPO) in the State of California are required to quantify the vehicle miles traveled (VMT) to address transportation-related greenhouse emissions.
Research Background
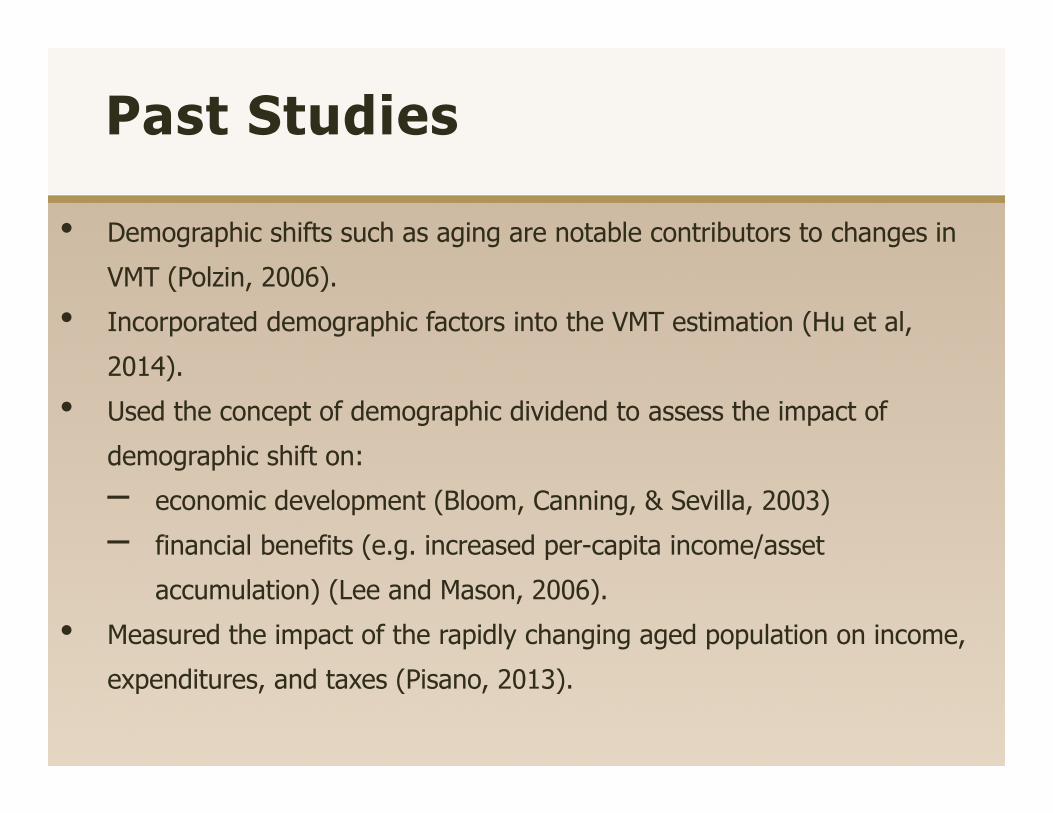
• Demographic shifts such as aging are notable contributors to changes in VMT (Polzin, 2006).
• Incorporated demographic factors into the VMT estimation (Hu et al, 2014).
• Used the concept of demographic dividend to assess the impact of demographic shift on:– economic development (Bloom, Canning, & Sevilla, 2003)– financial benefits (e.g. increased per-capita income/asset
accumulation) (Lee and Mason, 2006).• Measured the impact of the rapidly changing aged population on income,
expenditures, and taxes (Pisano, 2013).
Past Studies

• Projections of city’s population size has played an important role in determining the future housing and transportation needs of local communities. Although the population characteristics (e.g., age) are more relevant for policy and planning, demographic approach was of limited application due to the lack of the demographic rates data and resources.
• LPPT (Local Population Projection Tool), a planning/scenario-demographic approach, was developed to generate the age composition of projected populations at the local jurisdiction level in the regional plan framework.
• This study presents LPPT-VMT to project local VMT by using LPPT outcomes (local population by age and sex) and the average daily VMT per person by age and sex (NHTS 2009).
Research Purpose

Modeling Framework: LPPT
Residential population
(+) Group Quarters
Population
Total Population
Household Size
Housing Unit Method
Cohort-Component
Method
(+) Births (-) Deaths(+/-) Net Migration (Residual)
Age-specific fertility
rate
Age-sex specific
mortality rate
Age-sex specific net migration
rate
% Group Quarters
Population
Households (Occupied
Units)

Modeling Framework: LPPT-VMT
Population by Age and
Sex
Total Daily VMT by
Age
Average Daily VMT per Person
Age-sex specific
VMT

US Average Daily VMT per Person by Age and Sex, 2009

• Develop local housing growth scenario• Produce local population projections with key demographic
characteristics:− components of population growth− demographic rates− age and sex breakdown
• Calculate the average daily VMT per person applying the VMT per person by age and sex (NHTS 2009) to the projected population by age and sex.
Modeling Framework: LPPT-VMT Outcome
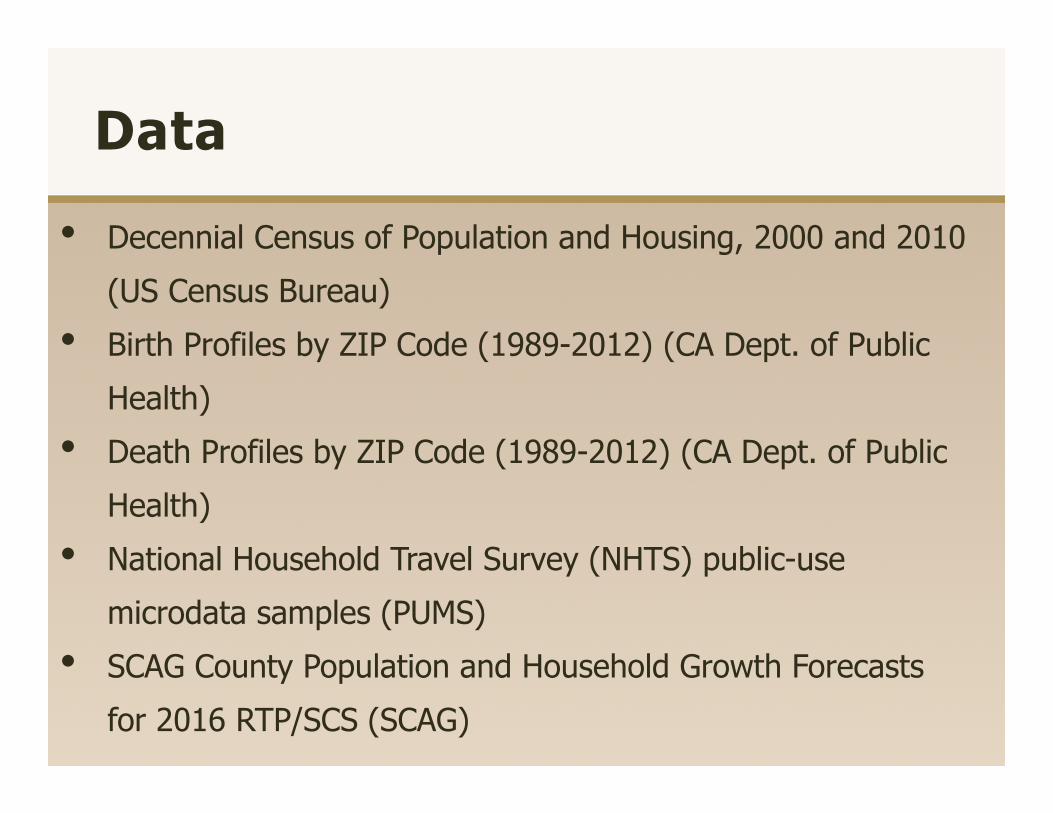
• Decennial Census of Population and Housing, 2000 and 2010 (US Census Bureau)
• Birth Profiles by ZIP Code (1989-2012) (CA Dept. of Public Health)
• Death Profiles by ZIP Code (1989-2012) (CA Dept. of Public Health)
• National Household Travel Survey (NHTS) public-use microdata samples (PUMS)
• SCAG County Population and Household Growth Forecasts for 2016 RTP/SCS (SCAG)
Data
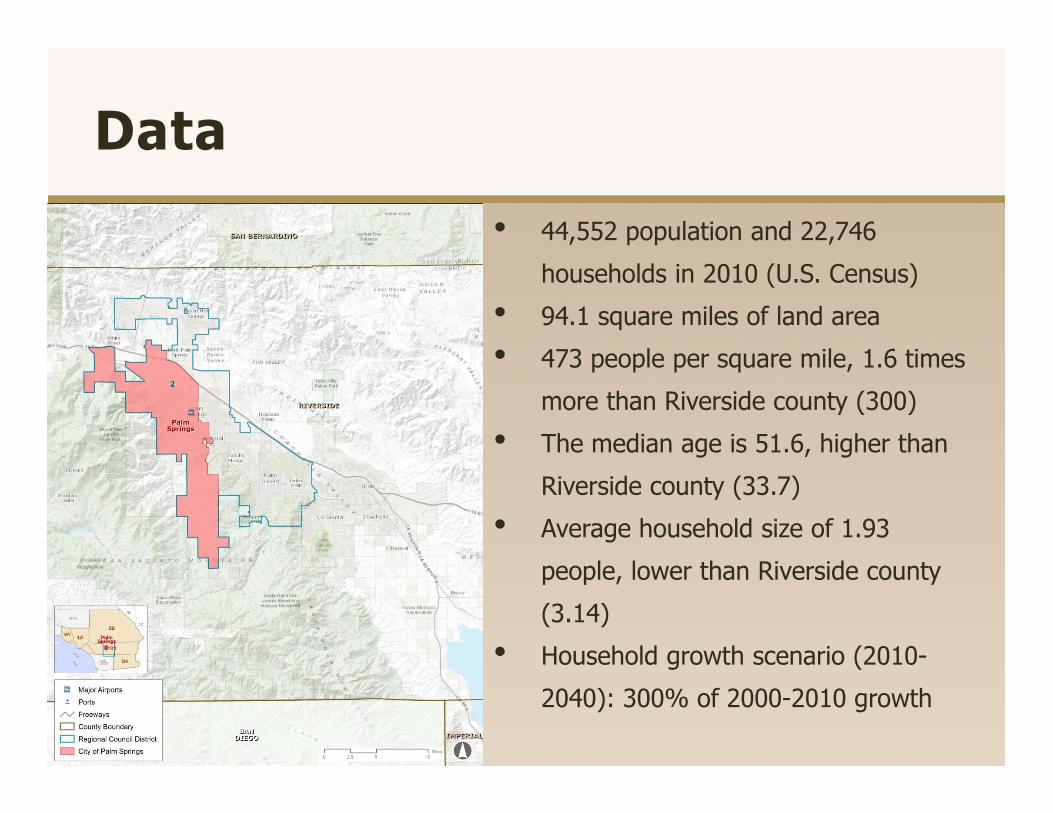
• 44,552 population and 22,746 households in 2010 (U.S. Census)
• 94.1 square miles of land area• 473 people per square mile, 1.6 times
more than Riverside county (300) • The median age is 51.6, higher than
Riverside county (33.7)• Average household size of 1.93
people, lower than Riverside county (3.14)
• Household growth scenario (2010-2040): 300% of 2000-2010 growth
Data
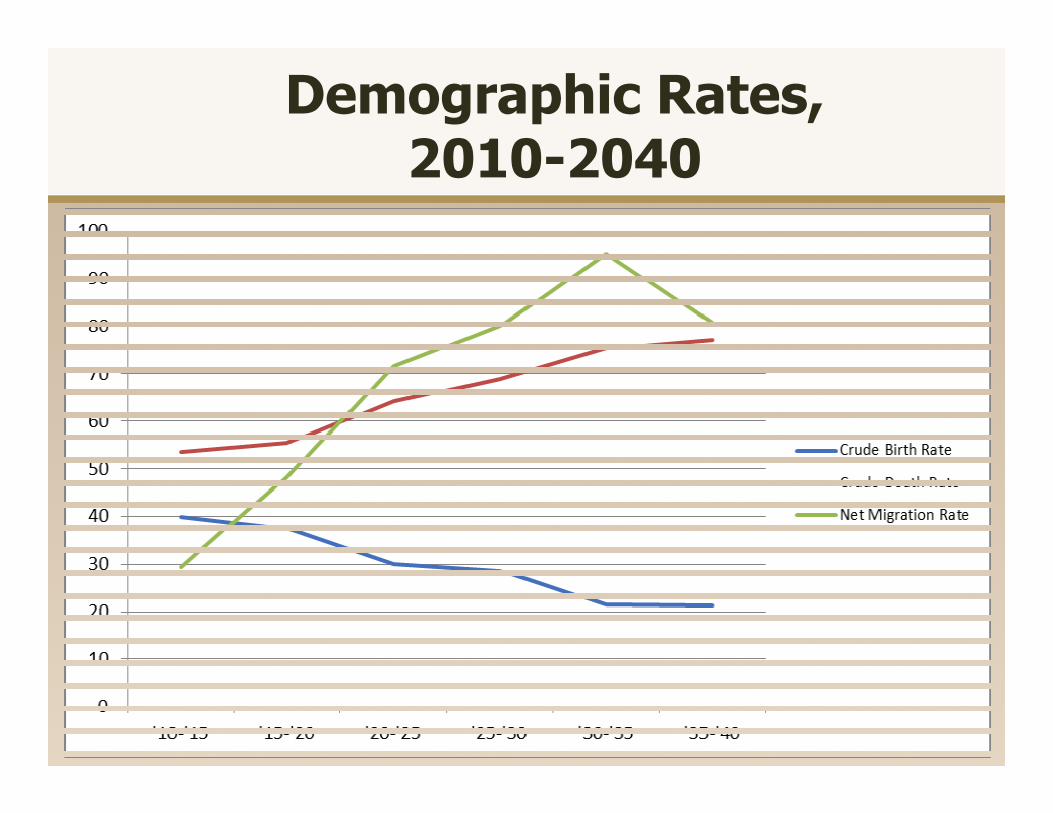
Demographic Rates, 2010-2040
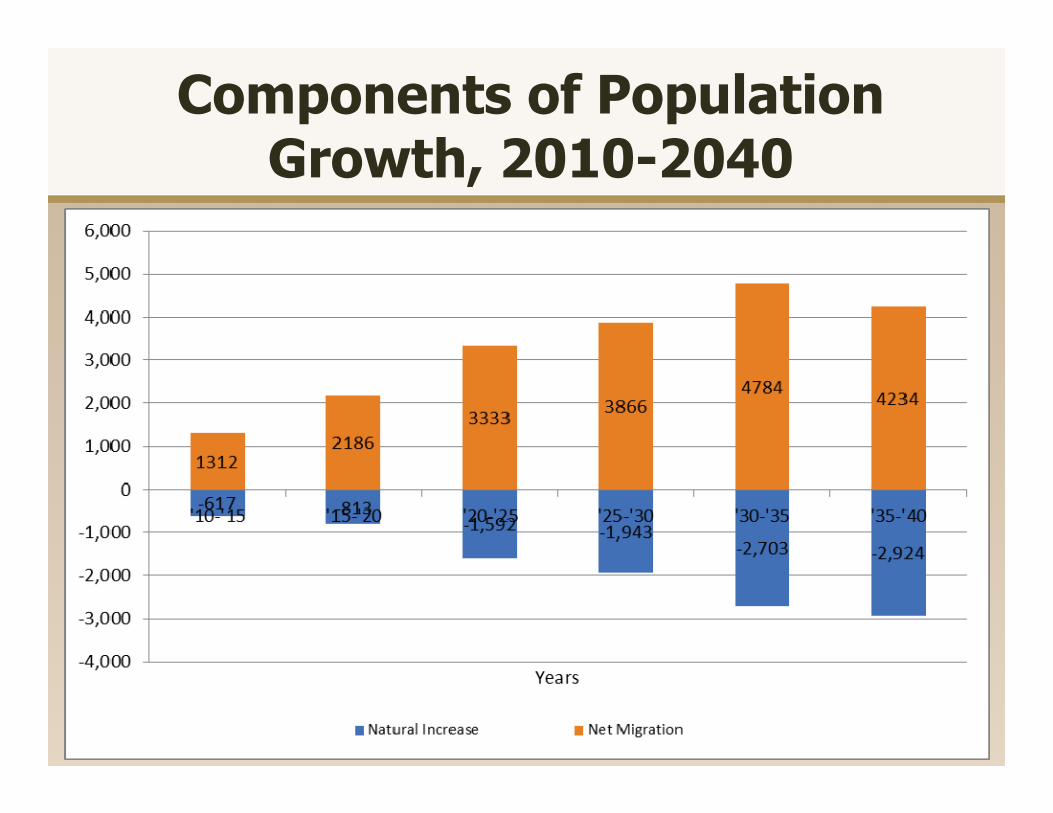
Components of Population Growth, 2010-2040

Population Age Pyramids, 2010 & 2040

Population by Age Group, 2010-2040

Total Daily VMT by Age Group, 2010-2040

Average Daily VMT per Person, 2010-2040

• Use detailed demographic characteristics of projected populations at the city level to produce local VMT projections.
• Is consistent with the metropolitan (county) demographic assumptions (fertility rate, survival rate, net migration rate) over time.
• Scenario approach is useful to reflect the uncertainty of the projections.
• Can be implemented in a collaborative planning environment. • A useful scenario testing and educational tool for urban and
regional planners.
Conclusion:Opportunities
• Difficult to project the population characteristics (of 18 age categories) of some cities (e.g., small size, retirement) due to the limited age data. May need to aggregate several age categories.
• Difficult to work on the cities experiencing the change of city boundaries (e.g., annexation of adjoining areas).
• Ethnic diversity may also influence the city’s VMT, and may be included in the LPPT-VMT tool to reflect the impact of ethnic diversity on VMT in the future.
• VMT projections from the LPPT-VMT tool may be validated using SCAG NHTS model results (Hu et al, 2012), TAZ based traditional transportation model results, or advanced Activity-Based Model results.
• The LPPT-VMT tool may consider additional fleet characteristics with respect to changing demographics (e.g., older drivers at consistently lower speeds, or driving older vehicles).
Conclusion:Challenges and Future Research

Thank you!
For more informationplease contact
Simon Choi, Ph.D, AICP CTPChief of Research & Forecasting