LP ESEARCH MARKET INSIGHT FEBRUARY 2016 IN...
14
MARKET LPL RESEARCH INSIGHT MONTHLY 01 Member FINRA/SIPC INITIAL JOBLESS CLAIMS CONTINUE TO RESIDE IN THE 260 – 285 THOUSAND RANGE Source: LPL Research, U.S. Employment and Training Administration 02/29/16 3 7 0 3 5 0 3 3 0 3 1 0 2 9 0 2 7 0 2 5 0 Jan ‘14 Apr ‘14 Jul ‘14 Oct ‘14 Jan ‘15 Apr ‘15 Jul ‘15 Oct ‘15 Jan ‘16 Initial Claims, Thousands FEBRUARY 2016 IN REVIEW March Update | As of February 29, 2016 ECONOMY: STRONG LABOR MARKET SUPPORTS ECONOMIC EXPANSION, BUT RECESSION ODDS ARE MODESTLY HIGHER Economic Data Although the odds of a recession have doubled since the start of the year, to around 25 – 30% from 10 – 15%, we do not expect a recession to occur in 2016. U.S. economic data released in February, which largely capture economic activity in January, continue the recent narrative of a healthy labor market and a stable U.S. consumer, offset in part by continued contraction in manufacturing. On the positive side of the ledger are employment figures, which support the case the U.S. economy is not likely to enter a recession in the short run. Weekly initial jobless claims continue to reside in the range of 260,000 – 285,000, which is near recent lows. Further, the unemployment rate was reported at 4.9%, comfortably within the Federal Reserve’s (Fed) target range. Given the strong labor market backdrop, personal income and personal spending continue to expand, albeit at a moderate pace, registering a 0.5% increase in both categories. The manufacturing sector of the economy continues to face headwinds from constrained business spending and lower demand for U.S. goods due to the stronger U.S. dollar. Manufacturing activity, as measured by the Institute for Supply Management (ISM) Manufacturing Index, was 48.2, a level indicative of contractionary conditions but above recent lows. However, the services sector of the economy, which is a bigger relative driver of the broad economy, continues to show evidence of health. The ISM Non-Manufacturing Index registered 53.5, a level that indicates expansion, although it fell below recent levels and consensus expectations. Late in the month, the revised estimate of fourth quarter 2015 gross domestic product (GDP) growth
Transcript of LP ESEARCH MARKET INSIGHT FEBRUARY 2016 IN...
M A R K E TLPL RESE ARCH
I N S I G H TMON T HLY
01Member FINRA/SIPC
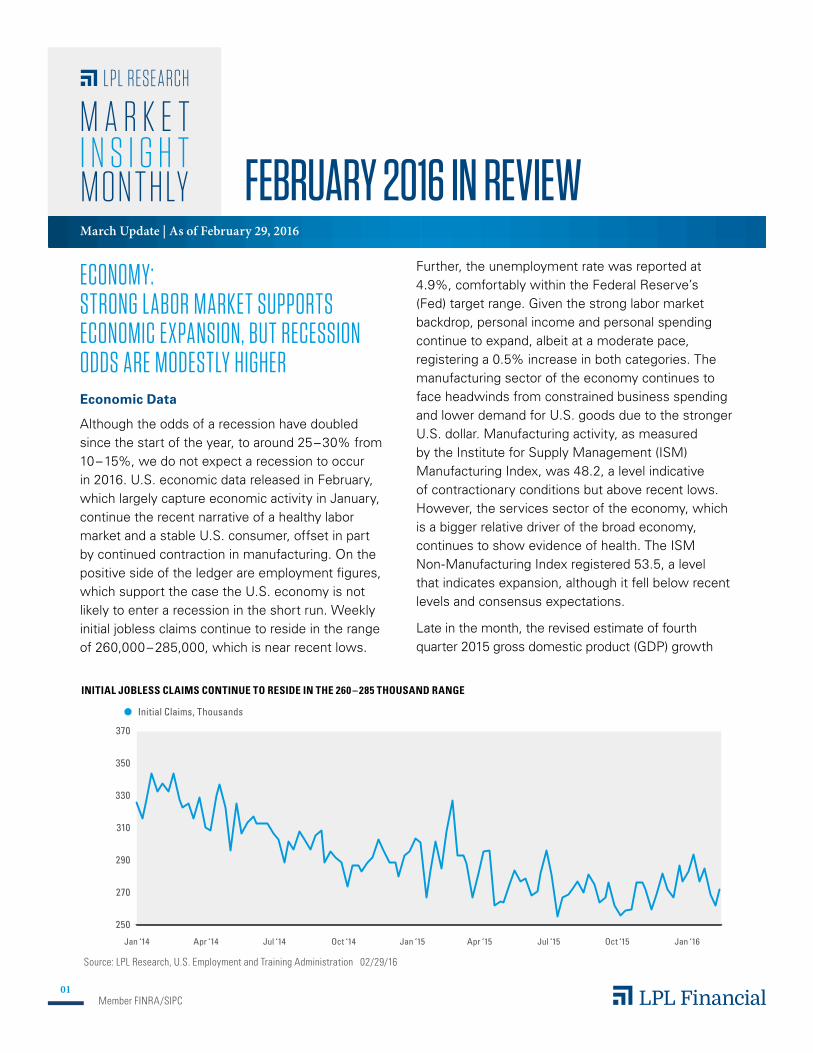
INITIAL JOBLESS CLAIMS CONTINUE TO RESIDE IN THE 260 – 285 THOUSAND RANGE
Source: LPL Research, U.S. Employment and Training Administration 02/29/16
370
350
330
310
290
270
250
Jan ‘14 Apr ‘14 Jul ‘14 Oct ‘14 Jan ‘15 Apr ‘15 Jul ‘15 Oct ‘15 Jan ‘16
Initial Claims, Thousands
FEBRUARY 2016 IN REVIEW
March Update | As of February 29, 2016
ECONOMY: STRONG LABOR MARKET SUPPORTS ECONOMIC EXPANSION, BUT RECESSION ODDS ARE MODESTLY HIGHEREconomic Data
Although the odds of a recession have doubled since the start of the year, to around 25 – 30% from 10 – 15%, we do not expect a recession to occur in 2016. U.S. economic data released in February, which largely capture economic activity in January, continue the recent narrative of a healthy labor market and a stable U.S. consumer, offset in part by continued contraction in manufacturing. On the positive side of the ledger are employment figures, which support the case the U.S. economy is not likely to enter a recession in the short run. Weekly initial jobless claims continue to reside in the range of 260,000 – 285,000, which is near recent lows.
Further, the unemployment rate was reported at 4.9%, comfortably within the Federal Reserve’s (Fed) target range. Given the strong labor market backdrop, personal income and personal spending continue to expand, albeit at a moderate pace, registering a 0.5% increase in both categories. The manufacturing sector of the economy continues to face headwinds from constrained business spending and lower demand for U.S. goods due to the stronger U.S. dollar. Manufacturing activity, as measured by the Institute for Supply Management (ISM) Manufacturing Index, was 48.2, a level indicative of contractionary conditions but above recent lows. However, the services sector of the economy, which is a bigger relative driver of the broad economy, continues to show evidence of health. The ISM Non-Manufacturing Index registered 53.5, a level that indicates expansion, although it fell below recent levels and consensus expectations.
Late in the month, the revised estimate of fourth quarter 2015 gross domestic product (GDP) growth
MIM
02Member FINRA/SIPC
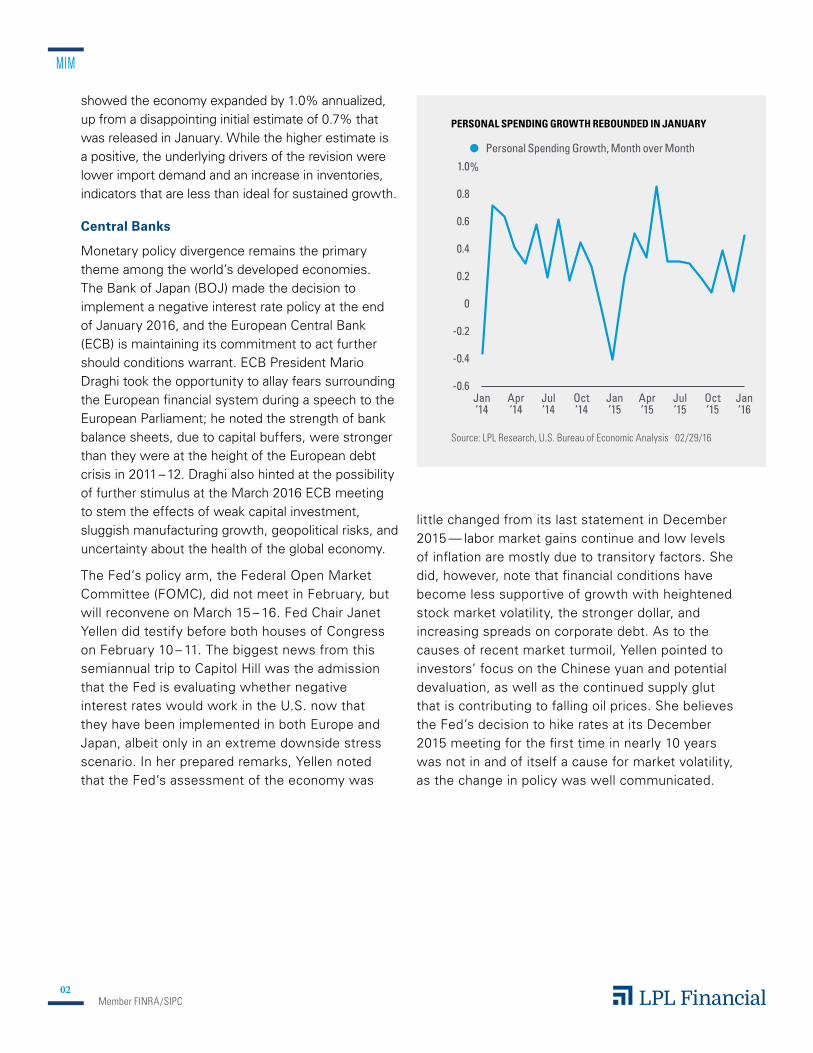
PERSONAL SPENDING GROWTH REBOUNDED IN JANUARY
Source: LPL Research, U.S. Bureau of Economic Analysis 02/29/16
1.0
0.8
0.6
0.4
0.2
0
-0.2
-0.4
-0.6
%
Jan‘14
Apr‘14
Jul‘14
Oct‘14
Jan‘15
Apr‘15
Jul‘15
Oct‘15
Jan‘16
Personal Spending Growth, Month over Month
showed the economy expanded by 1.0% annualized, up from a disappointing initial estimate of 0.7% that was released in January. While the higher estimate is a positive, the underlying drivers of the revision were lower import demand and an increase in inventories, indicators that are less than ideal for sustained growth.
Central Banks
Monetary policy divergence remains the primary theme among the world’s developed economies. The Bank of Japan (BOJ) made the decision to implement a negative interest rate policy at the end of January 2016, and the European Central Bank (ECB) is maintaining its commitment to act further should conditions warrant. ECB President Mario Draghi took the opportunity to allay fears surrounding the European financial system during a speech to the European Parliament; he noted the strength of bank balance sheets, due to capital buffers, were stronger than they were at the height of the European debt crisis in 2011 – 12. Draghi also hinted at the possibility of further stimulus at the March 2016 ECB meeting to stem the effects of weak capital investment, sluggish manufacturing growth, geopolitical risks, and uncertainty about the health of the global economy.
The Fed’s policy arm, the Federal Open Market Committee (FOMC), did not meet in February, but will reconvene on March 15 – 16. Fed Chair Janet Yellen did testify before both houses of Congress on February 10 – 11. The biggest news from this semiannual trip to Capitol Hill was the admission that the Fed is evaluating whether negative interest rates would work in the U.S. now that they have been implemented in both Europe and Japan, albeit only in an extreme downside stress scenario. In her prepared remarks, Yellen noted that the Fed’s assessment of the economy was
little changed from its last statement in December 2015 — labor market gains continue and low levels of inflation are mostly due to transitory factors. She did, however, note that financial conditions have become less supportive of growth with heightened stock market volatility, the stronger dollar, and increasing spreads on corporate debt. As to the causes of recent market turmoil, Yellen pointed to investors’ focus on the Chinese yuan and potential devaluation, as well as the continued supply glut that is contributing to falling oil prices. She believes the Fed’s decision to hike rates at its December 2015 meeting for the first time in nearly 10 years was not in and of itself a cause for market volatility, as the change in policy was well communicated.
MIM
03Member FINRA/SIPC
Source: LPL Research, FactSet 02/29/16
Indexes are unmanaged and cannot be invested into directly. Past performance is no guarantee of future results.
Stock investing involves risk, including loss of principal.
International and emerging markets investing involves special risks, such as currency fluctuation and political instability, and may not be suitable for all investors.
0%-2%-4%-6%-8%-10% 2%
Int’l SMID(EAFE SMID)
Europe(MSCI)
Global(ACWI)
International(EAFE)
Emerging Markets(MSCI)
US Small-Mid Cap (Russell 2500)
US Large Cap (Russell 1000) 0.0%
-1.7%
-1.8%
-0.2%
-0.4%
-5.4%
-7.3%
-6.6%
-8.2%
-8.9%
-6.6%
-7.8%
0.7%
-0.6%
-2% 0% 2%-10% -6%-14%
Russell 1000Growth
Russell Midcap
Russell 2500
Russell 2000Growth
Russell 1000
Russell 3000
S&P 500
Russell 2000
Russell 1000Value
Russell Microcap
Russell 2000Value 0.7%
-6.1%
0.0%
0.0%
-0.1%
0.0%
0.0%
-0.7%
0.7%
1.1%
-11.7% -1.5%
-5.2%
-8.8%
-5.1%
-5.7%
-5.4%
-11.5%
-7.3%
-5.5%
-5.6%0.0%
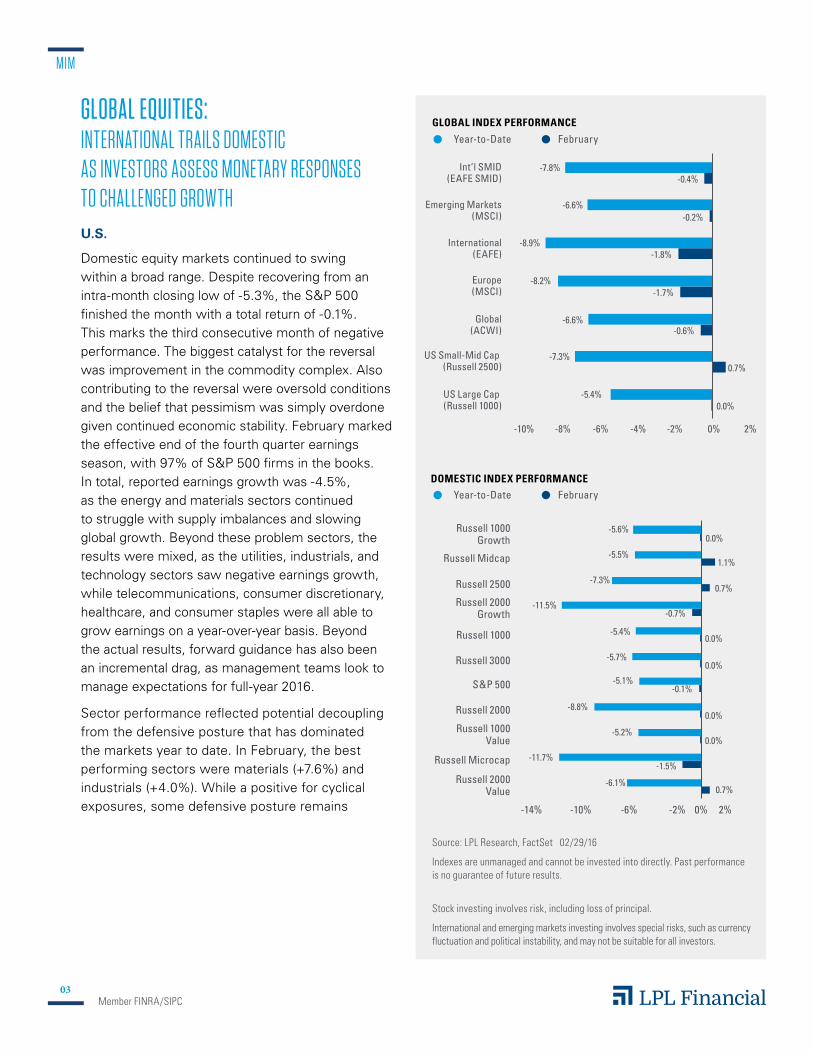
GLOBAL INDEX PERFORMANCE
Year-to-Date
Year-to-Date
February
FebruaryDOMESTIC INDEX PERFORMANCE
GLOBAL EQUITIES: INTERNATIONAL TRAILS DOMESTIC AS INVESTORS ASSESS MONETARY RESPONSES TO CHALLENGED GROWTHU.S.
Domestic equity markets continued to swing within a broad range. Despite recovering from an intra-month closing low of -5.3%, the S&P 500 finished the month with a total return of -0.1%. This marks the third consecutive month of negative performance. The biggest catalyst for the reversal was improvement in the commodity complex. Also contributing to the reversal were oversold conditions and the belief that pessimism was simply overdone given continued economic stability. February marked the effective end of the fourth quarter earnings season, with 97% of S&P 500 firms in the books. In total, reported earnings growth was -4.5%, as the energy and materials sectors continued to struggle with supply imbalances and slowing global growth. Beyond these problem sectors, the results were mixed, as the utilities, industrials, and technology sectors saw negative earnings growth, while telecommunications, consumer discretionary, healthcare, and consumer staples were all able to grow earnings on a year-over-year basis. Beyond the actual results, forward guidance has also been an incremental drag, as management teams look to manage expectations for full-year 2016.
Sector performance reflected potential decoupling from the defensive posture that has dominated the markets year to date. In February, the best performing sectors were materials (+7.6%) and industrials (+4.0%). While a positive for cyclical exposures, some defensive posture remains

MIM
04Member FINRA/SIPC
-15% -10% -5% 0% 10% 15%5%
Utilities
Healthcare
Telecom Services
ConsumerStaples
Materials
ConsumerDiscretionary
InformationTechnology
Industrials
Energy
Financials -2.9%
-1.9%
4.0%
-1.2%
0.4%
7.6%
0.1%
2.7%
-0.5%
1.9%
-11.5%
-4.8%
-2.0%
-6.0%
-4.7%
-3.8%
0.8%
9.6%
-8.0%
7.0%
S&P 500 SECTOR PERFORMANCE
Source: LPL Research, Bloomberg, FactSet 02/29/16
Indexes are unmanaged and cannot be invested into directly. Past performance is no guarantee of future results.
Because of its narrow focus, sector investing will be subject to greater volatility than investing more broadly across many sectors and companies.
Year-to-Date February
apparent, as telecommunications (+2.7%) and utilities (+1.9%) were next in total performance. After posting a strong relative performance in January on the back of the oil rally, the energy sector trailed the market by nearly 175 basis points (1.75%). The remaining five GICS sectors were mixed, with financials posting the worst total performance at -2.9% on profitability concerns from the path of monetary policy and fears of systemic stress emanating from European counterparts.
International
International stocks, as represented by the MSCI EAFE Index (foreign developed) and MSCI Emerging Markets Index, both posted losses in February and continued their underperformance relative to the S&P 500 on a trailing one-year and three-year basis. Foreign developed stocks trailed their domestic counterparts on the month by 167 basis points (1.67%), as investors struggle with the prospect of negative interest rate monetary policies amid a challenging growth environment. Emerging markets were relatively flat to domestic equities as pressure from the commodities complex has abated and the U.S. dollar finished the month weaker.
MIM
05Member FINRA/SIPC
0%-2% 2% 4% 6% 8% 10%
BarCap US Tsy Long(Long US Treasury)
BarCap US TIPS(Infl. Protected Securities)
BarCap US Agg(Barclays Aggregate)
ML Preferred Hybrid(Preferred Stock)
BarCap HY Muni(High Yield Muni)
BarCap 1-10 Muni(Intermediate Muni)
ML US HY BB/B Rated(BB/B Rated High Yield)
JPM EMBI+ Composite(EM USD Bonds)
BarCap US HY Loans(Bank Loans)
JPM GBI-EM Global Div(EM Local Currency Bonds) 1.4%
-0.5% -1.3%
2.0%
0.8%
0.2%
1.1%
0.3%
0.7%
1.1%
3.0%
1.8%
2.6%
-0.4%
1.3%
1.7%
0.5%
2.1%
2.6%
8.2%
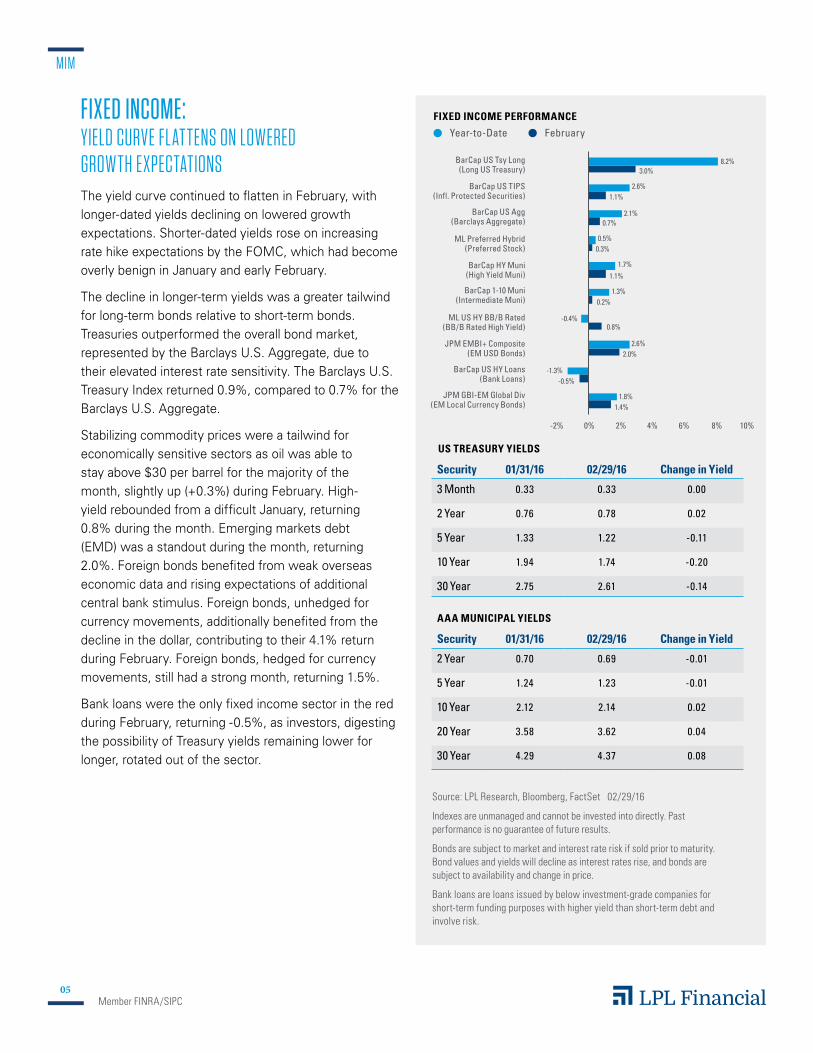
FIXED INCOME PERFORMANCE
Source: LPL Research, Bloomberg, FactSet 02/29/16
Indexes are unmanaged and cannot be invested into directly. Past performance is no guarantee of future results.
Bonds are subject to market and interest rate risk if sold prior to maturity. Bond values and yields will decline as interest rates rise, and bonds are subject to availability and change in price.
Bank loans are loans issued by below investment-grade companies for short-term funding purposes with higher yield than short-term debt and involve risk.
Security 01/31/16 02/29/16 Change in Yield
3 Month 0.33 0.33 0.00
2 Year 0.76 0.78 0.02
5 Year 1.33 1.22 -0.11
10 Year 1.94 1.74 -0.20
30 Year 2.75 2.61 -0.14
US TREASURY YIELDS
Security 01/31/16 02/29/16 Change in Yield
2 Year 0.70 0.69 -0.01
5 Year 1.24 1.23 -0.01
10 Year 2.12 2.14 0.02
20 Year 3.58 3.62 0.04
30 Year 4.29 4.37 0.08
AAA MUNICIPAL YIELDS
Year-to-Date February
FIXED INCOME: YIELD CURVE FLAT TENS ON LOWERED GROWTH EXPECTATIONSThe yield curve continued to flatten in February, with longer-dated yields declining on lowered growth expectations. Shorter-dated yields rose on increasing rate hike expectations by the FOMC, which had become overly benign in January and early February.
The decline in longer-term yields was a greater tailwind for long-term bonds relative to short-term bonds. Treasuries outperformed the overall bond market, represented by the Barclays U.S. Aggregate, due to their elevated interest rate sensitivity. The Barclays U.S. Treasury Index returned 0.9%, compared to 0.7% for the Barclays U.S. Aggregate.
Stabilizing commodity prices were a tailwind for economically sensitive sectors as oil was able to stay above $30 per barrel for the majority of the month, slightly up (+0.3%) during February. High-yield rebounded from a difficult January, returning 0.8% during the month. Emerging markets debt (EMD) was a standout during the month, returning 2.0%. Foreign bonds benefited from weak overseas economic data and rising expectations of additional central bank stimulus. Foreign bonds, unhedged for currency movements, additionally benefited from the decline in the dollar, contributing to their 4.1% return during February. Foreign bonds, hedged for currency movements, still had a strong month, returning 1.5%.
Bank loans were the only fixed income sector in the red during February, returning -0.5%, as investors, digesting the possibility of Treasury yields remaining lower for longer, rotated out of the sector.
MIM
06Member FINRA/SIPC
-6% -4% -2% 0% 2% 4% 6%
ManagedFutures
Currency
Multialternative
Market Neutral
NontraditionalBond
Long/ShortEquity -0.5%
-0.6%
0.0%
-0.4%
1.8%
-3.8%
-1.7%
-0.2%
-2.0%
0.0% 0.0%
4.2%
HFRX INDEX PERFORMANCE
Source: LPL Research, FactSet 02/29/16
Indexes are unmanaged and cannot be invested into directly. Past performance is no guarantee of future results.
Alternative strategies may not be suitable for all investors and should be considered as an investment for the risk capital portion of the investor’s portfolio. The strategies employed in the management of alternative investments may accelerate the velocity of potential losses.
MORNINGSTAR INDEX PERFORMANCE
Year-to-Date
Year-to-Date
February
February
-4% 0%-12% -8% 8%4%
HFRX SystematicDiversified
HFRX Macro
HFRX Merger Arb.
HFRX Absolute Return
HFRX MarketDirectional
HFRX Market Neutral
HFRX Relative Value
HFRX GlobalHedge Fund
HFRX Convertible Arb.
HFRX Equity Hedge
HFRX Event Driven
HFRX Distressed-2.4%
0.1%
0.5%
-0.3%
-1.3%
-0.3%
-1.5%
-0.3%
0.0%
-5.6%
-3.8%
-5.6% -1.1%
-3.1%
-2.8%
-1.8% -1.5%
-9.8%
-0.3%
1.2%
1.2% 0.3%
5.2% 2.7%
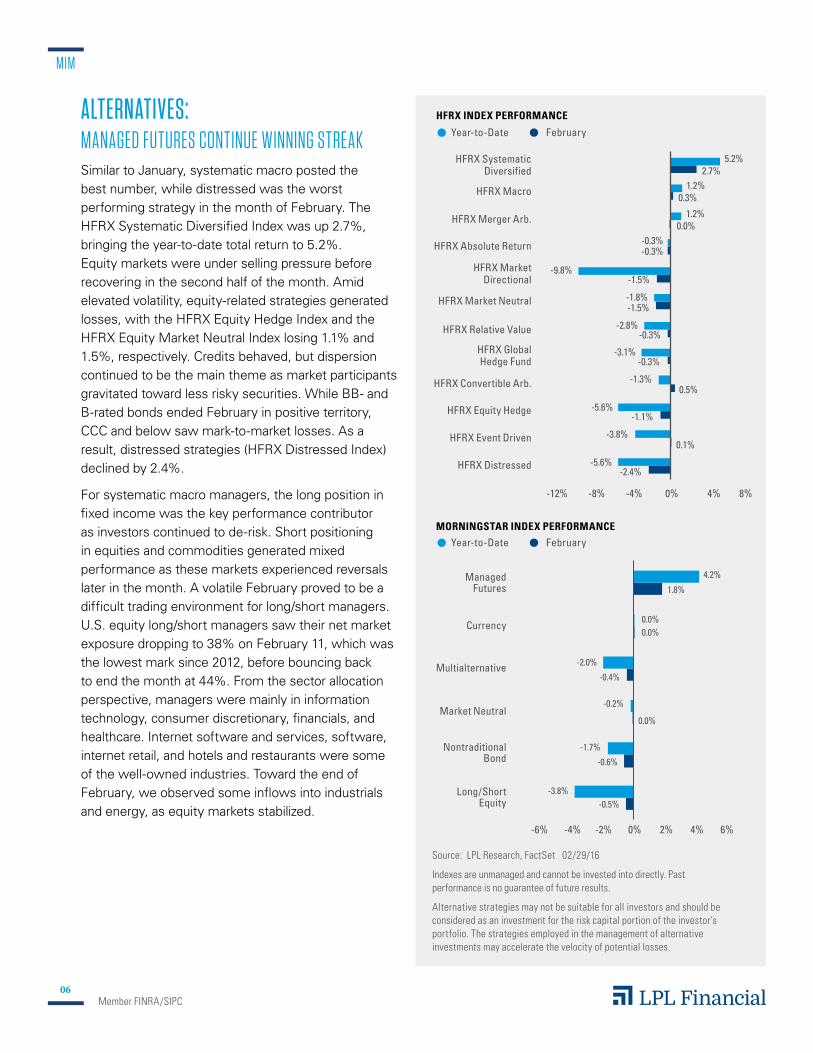
ALTERNATIVES: MANAGED FUTURES CONTINUE WINNING STREAKSimilar to January, systematic macro posted the best number, while distressed was the worst performing strategy in the month of February. The HFRX Systematic Diversified Index was up 2.7%, bringing the year-to-date total return to 5.2%. Equity markets were under selling pressure before recovering in the second half of the month. Amid elevated volatility, equity-related strategies generated losses, with the HFRX Equity Hedge Index and the HFRX Equity Market Neutral Index losing 1.1% and 1.5%, respectively. Credits behaved, but dispersion continued to be the main theme as market participants gravitated toward less risky securities. While BB- and B-rated bonds ended February in positive territory, CCC and below saw mark-to-market losses. As a result, distressed strategies (HFRX Distressed Index) declined by 2.4%.
For systematic macro managers, the long position in fixed income was the key performance contributor as investors continued to de-risk. Short positioning in equities and commodities generated mixed performance as these markets experienced reversals later in the month. A volatile February proved to be a difficult trading environment for long/short managers. U.S. equity long/short managers saw their net market exposure dropping to 38% on February 11, which was the lowest mark since 2012, before bouncing back to end the month at 44%. From the sector allocation perspective, managers were mainly in information technology, consumer discretionary, financials, and healthcare. Internet software and services, software, internet retail, and hotels and restaurants were some of the well-owned industries. Toward the end of February, we observed some inflows into industrials and energy, as equity markets stabilized.
MIM
07Member FINRA/SIPC
-12% -8% -4% 0% 4%
S&P Developed
Property ex-US
S&P Global
Infrastructure
S&P 500
MSCI US
REIT
Alerian MLP
Bloomberg
Commodity -1.6%
-0.5%
1.0%
-0.1%
-3.3%
-11.5%
-5.1%
1.8%
0.2%
-3.4%
-3.7% -0.4%
Source: LPL Research, FactSet 02/29/16
LIQUID REAL ASSET PERFORMANCE
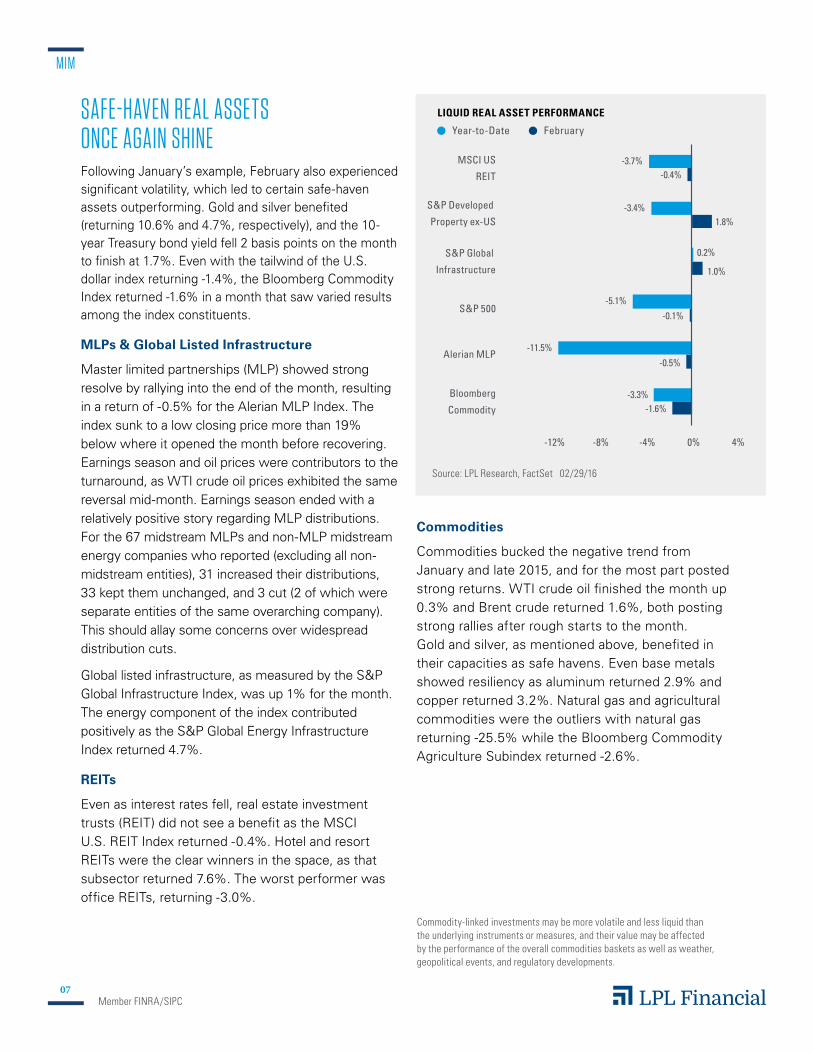
Year-to-Date FebruarySAFE-HAVEN REAL ASSETS ONCE AGAIN SHINEFollowing January’s example, February also experienced significant volatility, which led to certain safe-haven assets outperforming. Gold and silver benefited (returning 10.6% and 4.7%, respectively), and the 10-year Treasury bond yield fell 2 basis points on the month to finish at 1.7%. Even with the tailwind of the U.S. dollar index returning -1.4%, the Bloomberg Commodity Index returned -1.6% in a month that saw varied results among the index constituents.
MLPs & Global Listed Infrastructure
Master limited partnerships (MLP) showed strong resolve by rallying into the end of the month, resulting in a return of -0.5% for the Alerian MLP Index. The index sunk to a low closing price more than 19% below where it opened the month before recovering. Earnings season and oil prices were contributors to the turnaround, as WTI crude oil prices exhibited the same reversal mid-month. Earnings season ended with a relatively positive story regarding MLP distributions. For the 67 midstream MLPs and non-MLP midstream energy companies who reported (excluding all non-midstream entities), 31 increased their distributions, 33 kept them unchanged, and 3 cut (2 of which were separate entities of the same overarching company). This should allay some concerns over widespread distribution cuts.
Global listed infrastructure, as measured by the S&P Global Infrastructure Index, was up 1% for the month. The energy component of the index contributed positively as the S&P Global Energy Infrastructure Index returned 4.7%.
REITs
Even as interest rates fell, real estate investment trusts (REIT) did not see a benefit as the MSCI U.S. REIT Index returned -0.4%. Hotel and resort REITs were the clear winners in the space, as that subsector returned 7.6%. The worst performer was office REITs, returning -3.0%.
Commodities
Commodities bucked the negative trend from January and late 2015, and for the most part posted strong returns. WTI crude oil finished the month up 0.3% and Brent crude returned 1.6%, both posting strong rallies after rough starts to the month. Gold and silver, as mentioned above, benefited in their capacities as safe havens. Even base metals showed resiliency as aluminum returned 2.9% and copper returned 3.2%. Natural gas and agricultural commodities were the outliers with natural gas returning -25.5% while the Bloomberg Commodity Agriculture Subindex returned -2.6%.
Commodity-linked investments may be more volatile and less liquid than the underlying instruments or measures, and their value may be affected by the performance of the overall commodities baskets as well as weather, geopolitical events, and regulatory developments.
MIM
08Member FINRA/SIPC
3.5
3.0
2.5
2.0
1.5
1.0
0.5
0.03 Mo 5 Yr 10 Yr 20 Yr 30 Yr
AAA Muni Curve(2/28/15)
US Treasury Curve(2/29/16) AAA Muni Curve
(2/29/16)
US Treasury Curve(2/28/15)
1 Month 3 Months YTD 12 Months
Russell 1000Russell 2000
MSCI ACWI ex-USMSCI Emerging Markets
0
-5
-10
-15
-20
-25
1 Mo 3 Mos YTD 12 Mos
Larg
e Ca
p
S&P 500 -0.13 -6.59 -5.09 -6.19
DJIA 0.75 -6.13 -4.68 -6.55
Russell 1000 -0.03 -7.12 -5.41 -7.12
Russell 1000 Value -0.03 -7.23 -5.19 -9.41
Russell 1000 Growth -0.04 -7.01 -5.62 -5.05
Smal
l/Mid
Cap
Russell 2000 -0.00 -13.38 -8.80 -14.97
Russell 2000 Value 0.68 -11.03 -6.08 -13.35
Russell 2000 Growth -0.71 -15.69 -11.47 -16.65
Russell Microcap -1.51 -16.25 -11.69 -17.08
Russell Midcap 1.13 -8.03 -5.50 -11.25
Russell Midcap Value 0.70 -7.81 -4.86 -11.72
Russell Midcap Growth 1.57 -8.24 -6.12 -10.84
All
Cap Russell 3000 -0.03 -7.61 -5.67 -7.84
Russell 3000 Value 0.03 -7.54 -5.26 -9.73
Russell 3000 Growth -0.09 -7.68 -6.06 -5.98
Inte
rnat
iona
l Mar
kets
MSCI EAFE -1.80 -10.10 -8.89 -14.80
MSCI ACWI ex-US -1.11 -9.54 -7.83 -17.00
MSCI Europe -1.74 -10.56 -8.21 -15.67
MSCI Japan -2.74 -10.43 -10.74 -9.63
MSCI AC Asia Pacific ex-Japan -0.88 -8.33 -8.65 -20.74
MSCI EAFE SMID -0.44 -7.97 -7.84 -7.94
1 Mo 3 Mos YTD 12 Mos
Int’l
-Con
tinue
d MSCI ACWI ex-US SMID 0.11 -7.69 -7.03 -11.26
MSCI Emerging Mkts -0.15 -8.65 -6.62 -23.13
MSCI EMEA 1.99 -9.27 -2.29 -25.25
MSCI Latin America 3.79 -5.15 -0.97 -29.94
MSCI Frontier Markets 3.50 -3.86 -3.58 -16.09
Sect
ors
-S&
P500
GIC
S
Consumer Discretionary 0.38 -7.40 -4.75 -0.39
Consumer Staples 0.13 3.66 0.78 4.20
Energy -1.88 -14.23 -4.84 -24.21
Financials -2.94 -13.41 -11.53 -11.60
Healthcare -0.49 -6.41 -8.05 -6.93
Industrials 3.99 -3.94 -1.98 -6.14
Information Technology -1.23 -8.15 -6.00 -4.27
Materials 7.60 -7.78 -3.77 -16.83
Telecom Services 2.69 11.55 9.64 7.56
Utilities 1.94 9.29 6.97 6.22
Source: LPL Research, Bloomberg, FactSet 02/29/16
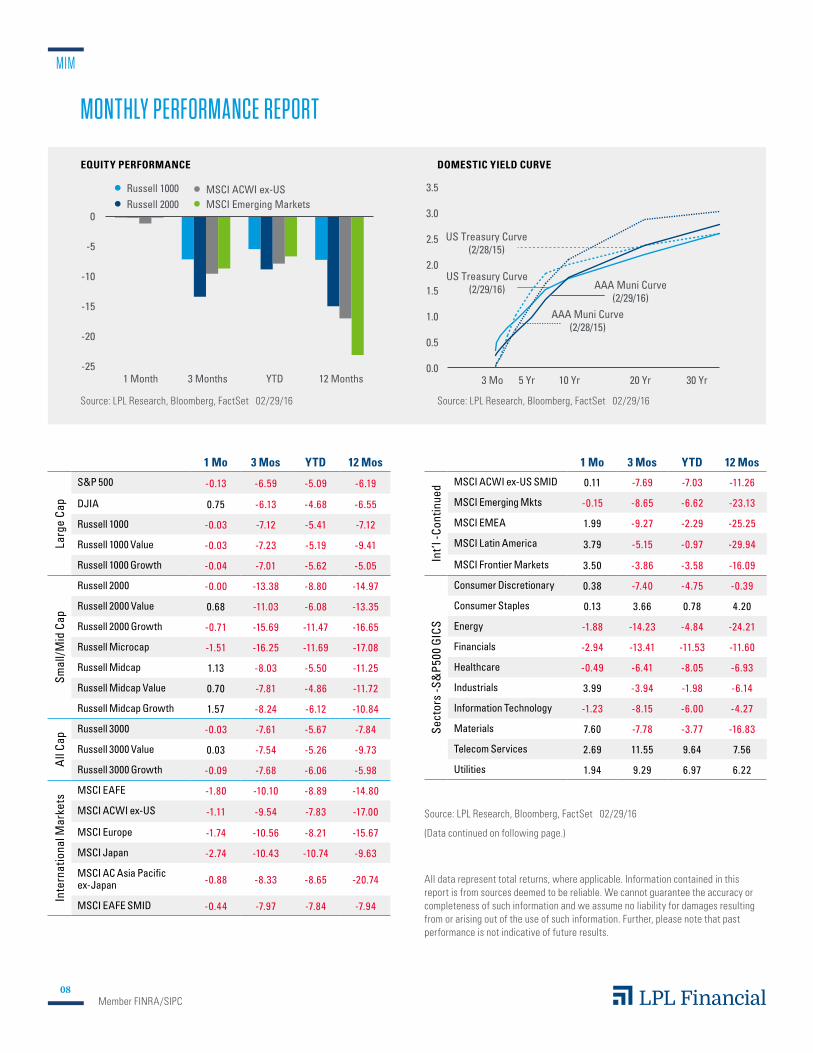
EQUITY PERFORMANCE
Source: LPL Research, Bloomberg, FactSet 02/29/16
DOMESTIC YIELD CURVE
MONTHLY PERFORMANCE REPORT
Source: LPL Research, Bloomberg, FactSet 02/29/16
(Data continued on following page.)
All data represent total returns, where applicable. Information contained in this report is from sources deemed to be reliable. We cannot guarantee the accuracy or completeness of such information and we assume no liability for damages resulting from or arising out of the use of such information. Further, please note that past performance is not indicative of future results.
MIM
09Member FINRA/SIPC
1 Mo 3 Mos YTD 12 Mos
Fixe
d In
com
e
BarCap US Agg 0.71 1.77 2.10 1.50
BarCap 1-10 Muni 0.27 1.52 1.27 2.79
BarCap HY Muni 1.10 1.83 1.67 2.11
BarCap Inv. Grade Credit 0.81 0.38 1.17 -1.49
BarCap Muni Long Bond -22+ 0.18 2.46 1.35 4.80
BarCap US Agg Securitized MBS 0.37 1.64 1.68 2.51
BarCap US TIPS 1.11 1.80 2.61 -0.75
BarCap US Treasury Interm 0.52 1.96 2.15 2.61
BarCap US Treasury Long 2.98 8.14 8.15 3.98
BarCap US High Yield Loans -0.54 -2.38 -1.31 -4.01
ML Preferred Stock Hybrid 0.26 1.47 0.45 5.62
ML US High Yield BB/B Rated 0.81 -2.64 -0.44 -6.20
ML US Convert ex-Mandatory 0.02 -8.77 -6.80 -12.17
JPM GBI Global ex-US Hedged 1.49 3.34 3.57 3.90
JPM GBI Global ex-US Unhedged 4.17 6.84 5.22 2.51
JPM GBI-EM Global Div 1.44 -0.47 1.80 -12.50
JPM ELMI+ 0.58 -1.69 -0.58 -6.45
JPM EMBI+ Composite 1.97 1.31 2.63 3.16
1 Mo 3 Mos YTD 12 Mos
Alte
rnat
ives
HFRX Absolute Return -0.35 -0.71 -0.29 1.25
HFRX Market Directional -1.50 -13.32 -9.83 -19.17
HFRX Convertible Arb. 0.50 -2.32 -1.32 -2.75
HFRX Distressed -2.35 -8.72 -5.60 -16.47
HFRX Equity Hedge -1.12 -6.61 -5.57 -9.22
HFRX Market Neutral -1.55 -1.43 -1.76 2.94
HFRX Event Driven 0.06 -4.66 -3.76 -11.40
HFRX Merger Arb. -0.01 2.18 1.18 7.62
HFRX Relative Value Arb. -0.30 -4.67 -2.80 -7.51
HFRX Global Hedge Fund -0.32 -4.36 -3.08 -8.19
HFRX Macro Index 0.30 -0.21 1.21 -3.37
HFRX Systematic Diversified 2.75 4.08 5.25 0.95
Bloomberg Commodity -1.63 -6.26 -3.28 -26.50
DJ Wilshire REIT -0.90 -2.73 -4.81 -3.32
Alerian MLP -0.48 -14.69 -11.53 -39.74
Latest Mo End
(02/29/16)
3 Mos Ago
(11/30/15)
Latest Yr End
(12/31/15)
12 Mos Ago
(02/28/15)
Curr
ency
US Dollar Index Value 98.15 100.20 98.69 95.25
USD vs. Yen112.43 123.22 120.66 119.63
Euro vs. USD1.09 1.06 1.09 1.12
Cmdt
ys
Gold ($ per Troy Ounce) 1238.30 1064.50 1061.00 1213.70
Crude Oil ($ per Barrel) 33.75 41.65 37.04 49.76
MIM
10Member FINRA/SIPC
IMPORTANT DISCLOSURES
The economic forecasts set forth in the presentation may not develop as predicted. The opinions voiced in this material are for general information only and are not intended to provide or be construed as providing specific investment advice or recommendations for any individual security. There is no assurance that the techniques and strategies discussed are suitable for all investors or will yield positive outcomes. The purchase of certain securities may be required to affect some of the strategies.
Stock and Pooled Investment Risks
There is no guarantee that a diversified portfolio will enhance overall returns or outperform a non-diversified portfolio. Diversification does not ensure against market risk.
Investments in specialized industry sectors have additional risks, which are outlined in the prospectus. Please read the fund’s prospectus for more information onrisks, fees, and other important information.
Bond and Debt Equity Risks
Government bonds and Treasury bills are guaranteed by the U.S. government as to the timely payment of principal and interest and, if held to maturity, offer a fixed rate of return and fixed principal value. However, the value of fund shares is not guaranteed and will fluctuate.
High-yield/junk bonds are not investment-grade securities, involve substantial risks, and generally should be part of the diversified portfolio of sophisticated investors.
Investing in foreign and emerging markets debt securities involves special additional risks. These risks include, but are not limited to, currency risk, geopolitical and regulatory risk, and risk associated with varying settlement standards.
Municipal bonds are subject to availability, price, and to market and interest rate risk if sold prior to maturity. Bond values will decline as interest rate rise. Interest income may be subject to the alternative minimum tax. Federally tax-free but other state and local taxes may apply.
Treasury Inflation-Protected Securities (TIPS) help eliminate inflation risk to your portfolio, as the principal is adjusted semiannually for inflation based on the Consumer Price Index (CPI)— while providing a real rate of return guaranteed by the U.S. government. However, a few things you need to be aware of is that the CPI might not accurately match the general inflation rate; so the principal balance on TIPS may not keep pace with the actual rate of inflation. The real interest yields on TIPS may rise, especially if there is a sharp spike in interest rates. If so, the rate of return on TIPS could lag behind other types of inflation-protected securities, like floating rate notes and T-bills. TIPS do not pay the inflation-adjusted balance until maturity, and the accrued principal on TIPS could decline, if there is deflation.
Alternative Risks
Currency risk is a form of risk that arises from the change in price of one currency against another. Whenever investors or companies have assets or business operations across national borders, they face currency risk if their positions are not hedged.
Investing in real estate/REITs involves special risks such as potential illiquidity and may not be suitable for all investors. There is no assurance that the investment objectives of this program will be attained.
Investing in MLPs involves additional risks as compared with the risks of investing in common stock, including risks related to cash flow, dilution, and voting rights.
MLPs may trade less frequently than larger companies due to their smaller capitalizations, which may result in erratic price movement or difficulty in buying or selling. MLPs are subject to significant regulation and may be adversely affected by changes in the regulatory environment, including the risk that an MLP could lose its tax status as a partnership. Additional management fees and other expenses are associated with investing in MLP funds.
Currency risk is a form of risk that arises from the change in price of one currency against another. Whenever investors or companies have assets or business operations across national borders, they face currency risk if their positions are not hedged.
Long/short equity funds are subject to normal alternative investment risks, including potentially higher fees; while there is additional management risk, as the manager is attempting to accurately anticipate the likely movement of both their long and short holdings. There is also the risk of “beta-mismatch,” in which long positions could lose more than short positions during falling markets.
Global macro strategies attempt to profit from anticipated price movements in stock markets, interest rates, foreign exchange and physical commodities. Global macro risks include but are not limited to imperfect knowledge of macro events, divergent movement from macro events, loss of principal, and related geopolitical risks.
Event driven strategies, such as merger arbitrage, consist of buying shares of the target company in a proposed merger and fully or partially hedging the exposure to the acquirer by shorting the stock of the acquiring company or other means. This strategy involves significant risk as events may not occur as planned and disruptions to a planned merger may result in significant loss to a hedged position.
The small business optimism index is compiled from a survey that is conducted each month by the National Federation of Independent Business (NFIB) of its members. The index is a composite of ten seasonally adjusted components based on questions on the following: plans to increase employment, plans to make capital outlays, plans to increase inventories, expect economy to improve, expect real sales higher, current inventory, current job openings, expected credit conditions, now a good time to expand, and earnings trend.
Monetary policy is the process through which the monetary authority (central bank, currency board, or other regulatory committee) of a country controls the size and rate of growth of the money supply, which in turn affects interest rates.
Global Industry Classification Standard (GICS): A standardized classification system for equities developed jointly by Morgan Stanley Capital International (MSCI) and Standard & Poor’s. The GICS methodology is used by the MSCI indexes, which include domestic and international stocks, as well as by a large portion of the professional investment management community. The GICS hierarchy begins with 10 sectors and is followed by 24 industry groups, 67 industries and 147 sub-industries. Each stock that is classified will have a coding at all four of these levels. The 10 GIC Sectors are as follows: Energy, Materials, Industrials, Consumer Discretionary, Consumer Staples, Health Care, Financials, Information Technology, Telecommunication Services, and Utilities.

MIM
11Member FINRA/SIPC
DEFINITIONS
Different agencies employ different rating scales for credit quality. Standard & Poor’s (S&P) and Fitch both use scales from AAA (highest) through AA, A, BBB, BB, B, CCC, CC, C to D(lowest). Moody’s uses a scale from Aaa (highest) through Aa, A, Baa, Ba, B, Caa, Ca to C (lowest).
A leading economic indicator is a commonly used signal of economic change. Examples of leading indicators include production workweek, building permits, unemployment insurance claims, money supply, inventory changes, and stock prices. The Fed watches many of these indicators as it decides what to do about interest rates.
The U.S. Institute for Supply Managers (ISM) manufacturing index is an economic indicator derived from monthly surveys of private sector companies, and is intended to show the economic health of the U.S. manufacturing sector. A PMI of more than 50 indicates expansion in the manufacturing sector, a reading below 50 indicates contraction, and a reading of 50 indicates no change.
Purchasing Managers’ Indexes (PMI) are economic indicators derived from monthly surveys of private sector companies, and are intended to show the economic health of the manufacturing sector. A PMI of more than 50 indicates expansion in the manufacturing sector, a reading below 50 indicates contraction, and a reading of 50 indicates no change. The two principal producers of PMIs are Markit Group, which conducts PMIs for over 30 countries worldwide, and the Institute for Supply Management (ISM), which conducts PMIs for the US.
INDEX DEFINITIONS
The Alerian MLP Index is a composite of the 50 most prominent energy master limited partnerships that provides investors with an unbiased, comprehensive benchmark for this emerging asset class. The index, which is calculated using a float-adjusted, capitalization-weighted methodology, is disseminated in real time on a price-return basis (NYSE: AMZ) and on a total-return basis (NYSE: AMZX).
The Barclays U.S. Aggregate Bond Index is a broad-based flagship benchmark that measures the investment-grade, U.S. dollar-denominated, fixed-rate taxable bond market. The index includes Treasuries, government-related and corporate securities, MBS (agency fixed-rate and hybrid ARM pass-throughs), ABS, and CMBS (agency and non-agency).
The Barclays U.S. Aggregate Securitized MBS Index tracks agency mortgage backed pass-through securities (both fixed-rate and hybrid (ARM) guaranteed by Ginnie Mae (GNMA), Fannie Mae (FNMA), and Freddie Mac (FHLMC).
The Barclays Capital High Yield Index covers the universe of publicly issued debt obligations rated below investment grade. Bonds must be rated below investment grade or high yield (Ba1/BB+ or lower), by at least two of the following ratings agencies: Moody’s, S&P, and Fitch. Bonds must also have at least one year to maturity, have at least $150 million in par value outstanding, and must be U.S. dollar denominated and nonconvertible. Bonds issued by countries designated as emerging markets are excluded.
The Barclays 7-year Municipal Bond Index is the 7 Year (6 -8 year) component of the Barclays Municipal Bond, which is a rules-based, market-value-weighted index engineered for the long-term tax-exempt bond market.
The Barclays Corporate Investment Grade Credit Index is a broad-based benchmark that measures the investment-grade, U.S. dollar-denominated, fixedrate, taxable corporate bond market. It includes USD-denominated securities publicly issued by U.S. and non-U.S. industrial, utility, and financial issuers that meet specified maturity, liquidity, and quality requirements.
The Barclays U.S. High-Yield Loan Index tracks the market for dollar-denominated floating-rate leveraged loans. Instead of individual securities, the U.S. High- Yield Loan Index is composed of loan tranches that may contain multiple contracts at the borrower level.
The Barclays Municipal High Yield Bond Index is comprised of bonds with maturities greater than one year, having a par value of at least $3 million issued as part of a transaction size greater than $20 million, and rated no higher than ‘BB+’ or equivalent by any of the three principal rating agencies. (The long and the short are subindexes of the Municipal Bond Index, based on duration length.)
The Barclays U.S. TIPS Index is a rules-based, market value-weighted index that tracks Inflation-Protected Securities issued by the U.S. Treasury. The U.S. TIPS Index is a subset of the Global Inflation-Linked Index, with a 36% market value weight in the index (as of December 2007), but is not eligible for other nominal treasury or aggregate indexes In order to prevent the erosion of purchasing power, TIPS are indexed to the nonseasonally adjusted Consumer Price Index for All Urban Consumers, or the CPI-U (CPI).
The Barclays U.S. Treasury Index is an unmanaged index of public debt obligations of the U.S. Treasury with a remaining maturity of one year or more. The index does not include T-bills (due to the maturity constraint), zero coupon bonds (strips), or Treasury Inflation-Protected Securities (TIPS). (The long and the intermediate are subindexes of the U.S. Treasury Index, based on duration length.)
The Bloomberg Commodity Index is calculated on an excess return basis and composed of futures contracts on 22 physical commodities. It reflects the return of underlying commodity futures price movements.
The BofA Merrill Lynch BB-B U.S. High Yield Constrained Index contains all securities in the BofA Merrill Lynch US High Yield Index rated BB+ through B- by S&P (or equivalent as rated by Moody’s or Fitch), but caps issuer exposure at 2%. Index constituents are capitalization-weighted, based on their current amount outstanding, provided the total allocation to an individual issuer does not exceed 2%.
The BofA Merrill Lynch U.S. Convertibles Ex-Mandatory Index is a rule-driven Index designed to capture the organic evolution of the U.S. convertible market and adjust automatically based on any changes in the market such as size of the market, industry skew, structure popularity, issuer size or equity sensitivity. The index rules include issues: U.S. dollar denominated greater than $50M in aggregate market value that are publicly traded (including 144A) in the U.S. market but are not currently in bankruptcy. Exclusions are synthetic convertibles and mandatory convertibles.
The Dow Jones Industrial Average Index is comprised of U.S.-listed stocks of companies that produce other (non-transportation and non-utility) goods and services. The Dow Jones industrial averages are maintained by editors of The Wall Street Journal. While the stock selection process is somewhat subjective, a stock typically is added only if the company has an excellent reputation, demonstrates sustained growth, is of interest to a large number of investors, and accurately
MIM
12Member FINRA/SIPC
represents the market sectors covered by the average. The Dow Jones averages are unique in that they are price weighted; therefore, their component weightings are affected only by changes in the stocks’ prices.
The Dow Jones U.S. Select REIT Index (formerly the DJ Wilshire REIT) intends to measure the performance of publicly traded REITs and REIT-like securities. The index is a subset of the Dow Jones U.S. Select Real Estate Securities Index (RESI), which represents equity REITs and real estate operating companies (REOCs) traded in the U.S. The indices are designed to serve as proxies for direct real estate investment, in part by excluding companies whose performance may be driven by factors other than the value of real estate.
The HFRX Absolute Return Index is designed to be representative of the overall composition of the hedge fund universe. It is comprised of all eligible hedge fund strategies; including but not limited to convertible arbitrage, distressed securities, equity hedge, equity market neutral, event driven, macro, merger arbitrage, and relative value arbitrage.
The HFRX Distressed Restructuring Index strategies employ an investment process focused on corporate fixed income instruments, primarily on corporate credit instruments of companies trading at significant discounts to their value at issuance or obliged (par value) at maturity as a result of either formal bankruptcy proceeding or financial market perception of near term proceedings. Managers are typically actively involved with the management of these companies, frequently involved on creditors’ committees in negotiating the exchange of securities for alternative obligations, either swaps of debt, equity, or hybrid securities. Managers employ fundamental credit processes focused on valuation and asset coverage of securities of distressed firms; in most cases portfolio exposures are concentrated in instruments that are publicly traded, in some cases actively and in others under reduced liquidity, but in general for which a reasonable public market exists. In contrast to special situations, distressed strategies employ primarily debt (greater than 60%) but also may maintain related equity exposure.
The HFRX Equity Hedge Index, also known as long/short equity, combines core long holdings of equities with short sales of stock or stock index options. Equity hedge portfolios may be anywhere from net long to net short, depending on market conditions. Equity hedge managers generally increase net long exposure in bull markets and decrease net long exposure (or even are net short) in a bear market. Generally, the short exposure is intended to generate an ongoing positive return in addition to acting as a hedge against a general stock market decline. Stock index put options are also often used as a hedge against market risk. Profits are made when long positions appreciate and stocks sold short depreciate. Conversely, losses are incurred when long positions depreciate or the value of stocks sold short appreciates. Equity hedge managers’ source of return is similar to that of traditional stock pickers on the upside, but they use short selling and hedging to attempt to outperform the market on the downside.
The HFRX Equity Market Neutral Index strategies employ sophisticated quantitative techniques of analyzing price data to ascertain information about future price movement and relationships between securities, select securities for purchase and sale. These can include both factor-based and statistical arbitrage/trading strategies. Factor-based investment strategies include strategies in which the investment thesis is predicated on the systematic analysis of common relationships between securities. In many but not all cases, portfolios are constructed to be neutral to one or multiple variables, such as broader equity markets in dollar or beta terms, and leverage is frequently employed to enhance the return profile of the positions identified. Statistical arbitrage/trading strategies consist of strategies in which the investment thesis is predicated on exploiting pricing anomalies that may occur as a function of expected mean reversion inherent in security prices; high frequency techniques may be employed and trading strategies may also be employed on the basis on technical analysis or opportunistically to exploit new information the investment manager believes has not been fully, completely, or accurately discounted into current security prices. Equity market neutral strategies typically maintain characteristic net equity market exposure no greater than 10% long or short.
The HFRX Event Driven Index managers maintain positions in companies currently or prospectively involved in corporate transactions of a wide variety, including but not limited to mergers, restructurings, financial distress, tender offers, shareholder buybacks, debt exchanges, security issuance, or other capital structure adjustments. Security types can range from most senior in the capital structure to most junior or subordinated, and frequently involve additional derivative securities. Event driven exposure includes a combination of sensitivities to equity markets, credit markets and idiosyncratic, company-specific developments. Investment theses are typically predicated on fundamental characteristics (as opposed to quantitative), with the realization of the thesis predicated on a specific development exogenous to the existing capital structure.
The HFRX Global Hedge Fund Index is designed to be representative of the overall composition of the hedge fund universe. It is comprised of all eligible hedge fund strategies, including but not limited to convertible arbitrage, distressed securities, equity hedge, equity market neutral, event driven, macro, merger arbitrage, and relative value arbitrage. The strategies are asset weighted based on the distribution of assets in the hedge fund industry.
The HFRX Macro Index strategy managers trade a broad range of strategies in which the investment process is predicated on movements in underlying economic variables and the impact these have on equity, fixed income, hard currency, and commodity markets. Managers employ a variety of techniques, both discretionary and systematic analysis, combinations of top-down and bottom-up theses, quantitative and fundamental approaches, and long- and short-term holding periods. Although some strategies employ RV techniques, macro strategies are distinct from RV strategies in that the primary investment thesis is predicated on predicted or future movements in the underlying instruments, rather than realization of a valuation discrepancy between securities. In a similar way, while both macro and equity hedge managers may hold equity securities, the overriding investment thesis is predicated on the impact movements in underlying macroeconomic variables may have on security prices, as opposed to EH, in which the fundamental characteristics on the company are the most significant and integral to investment thesis.
The HFRX Macro: Systematic Diversified CTA Index strategies have investment processes typically as function of mathematical, algorithmic, and technical models, with little or no influence of individuals over the portfolio positioning. Strategies employ an investment process designed to identify opportunities in markets exhibiting trending or momentum characteristics across individual instruments or asset classes. Strategies typically employ a quantitative process that focuses on statistically robust or technical patterns in the return series of the asset, and they typically focus on highly liquid instruments and maintain shorter holding periods than either discretionary or mean reverting strategies. Although some strategies seek to employ counter trend models, strategies benefit most from an environment characterized by persistent, discernible trending behavior. Systematic diversified strategies typically would expect to have no greater than 35% of the portfolio in either dedicated currency or commodity exposures over a given market cycle.
The HFRX Market Directional Index is comprised of all eligible hedge fund strategies, including but not limited to convertible arbitrage, distressed securities, equity hedge, equity market neutral, event driven, macro, merger arbitrage, and relative value arbitrage. As a component of the optimization process, the index

MIM
13Member FINRA/SIPC
selects constituents which characteristically exhibit higher volatilities and higher correlations to standard directional benchmarks of equity, bond market, and hedge fund industry.
The HFRX Merger Arbitrage Index strategies employ an investment process primarily focused on opportunities in equity and equity-related instruments of companies that are currently engaged in a corporate transaction. Merger arbitrage involves primarily announced transactions, typically with limited or no exposure to situations that pre- or post-date, or situations in which no formal announcement is expected to occur. Opportunities are frequently presented in cross border, collared, and international transactions that incorporate multiple geographic regulatory institutions, with typically involve minimal exposure to corporate credits.Merger arbitrage strategies typically have over 75% of positions in announced transactions over a given market cycle.
The HFRX Relative Value Arbitrage Index includes managers who maintain positions in which the investment thesis is predicated on the realization of a valuation discrepancy in the relationship between multiple securities. Managers employ a variety of fundamental and quantitative techniques to establish investment theses, and security types range broadly across equity, fixed income, derivative, or other security types. Fixed income strategies are typically quantitatively driven to measure the existing relationship between instruments and, in some cases, identify attractive positions in which the risk adjusted spread between these instruments represents an attractive opportunity for the investment manager. RV position may be involved in corporate transactions also, but as opposed to ED exposures, the investment thesis is predicated on the realization of a pricing discrepancy between related securities, as opposed to the outcome of the corporate transaction.
The HFRX RV: FI-Convertible Arbitrage Index includes strategies in which the investment thesis is predicated on realization of a spread between related instruments in which one or multiple components of the spread is a convertible fixed income instrument. Strategies employ an investment process designed to isolate attractive opportunities between the price of a convertible security and the price of a non-convertible security, typically of the same issuer. Convertible arbitrage positions maintain characteristic sensitivities to credit quality the issuer, implied and realized volatility of the underlying instruments, levels of interest rates and the valuation of the issuer’s equity, among other more general market and idiosyncratic sensitivities.
The J.P. Morgan GBI Global ex-U.S. Hedged Index tracks fixed rate issuances from high-income countries spanning the globe, launched in 1989.
The JPM GBI Global ex-U.S. Unhedged Index generally tracks fixed rate issuances form high-income countries spanning North America, Europe, and Asia, not including the United States.
The JPM GBI-EM Global Diversified Index limits the weights of those index countries with larger debt stocks by only including a specified portion of these countries as eligible, current face amounts of debt outstanding.
The JPM ELMI+ and JPM ELMI+ Composite Indexes measure the performance of debt issued by emerging markets in the local currency.
The Merrill Lynch Preferred Stock Hybrid Securities Index is an unmanaged index consisting of a set of investment-grade, exchange-traded preferred stocks with outstanding market values of at least $50 million that are covered by Merrill Lynch Fixed Income Research.
The MSCI AC Asia Pacific ex-Japan Index captures large and mid cap representation across four of five developed markets countries (excluding Japan) and eight emerging markets countries in the Asia Pacific region. With 682 constituents, the index covers approximately 85% of the free float-adjusted market capitalization in each country.
The MSCI ACWI ex-U.S. Index captures large and mid cap representation across 22 of 23 developed markets (DM) countries (excluding the U.S.) and 23 emerging markets (EM) countries. With 1,839 constituents, the index covers approximately 85% of the global equity opportunity set outside the U.S.
The MSCI ACWI ex-U.S. SMID Cap Index captures mid and small cap representation across 22 of 23 developed market (DM) countries (excluding the U.S.) and 23 emerging markets countries. With 5,164 constituents, the index covers approximately 28% of the free float-adjusted market capitalization in each country.
The MSCI EAFE Index is recognized as the pre-eminent benchmark in the United States to measure international equity performance. It comprises the MSCI country indexes that represent developed markets outside of North America: Europe, Australasia, and the Far East.
The MSCI EAFE SMID Cap Index captures mid and small cap representation across developed market countries around the world, excluding the U.S. and Canada. With 2,695 constituents, the index covers approximately 28% of the free float-adjusted market capitalization in each country.
The MSCI Emerging Markets Index captures large and mid cap representation across 23 emerging markets (EM) countries. With 822 constituents, the index covers approximately 85% of the free float-adjusted market capitalization in each country.
The MSCI Emerging Markets EMEA Index captures large and mid cap representation across eight emerging markets (EM) countries in Europe, the Middle East and Africa (EMEA). With 162 constituents, the index covers approximately 85% of the free float-adjusted market capitalization in each country.
The MSCI Emerging Markets (EM) Latin America Index captures large and mid cap representation across five emerging markets (EM) countries in Latin America. With 137 constituents, the index covers approximately 85% of the free float-adjusted market capitalization in each country.
The MSCI Europe Index is a free float-adjusted, market capitalization-weighted index that is designed to measure the equity market performance of the developed markets in Europe.
The MSCI Frontier Markets Index captures large and mid cap representation across 24 frontier markets (FM) countries. The index includes 127 constituents, covering about 85% of the free float-adjusted market capitalization in each country.
The MSCI Japan Index is a free float-adjusted, market capitalization-weighted index that is designed to track the equity market performance of Japanese securities listed on Tokyo Stock Exchange, Osaka Stock Exchange, JASDAQ, and Nagoya Stock Exchange.
The MSCI U.S. REIT Index is a free float-adjusted market capitalization index that is comprised of equity REITs. The index is based on MSCI USA Investable Market Index (IMI), its parent index that captures large, mid, and small caps securities. With 139 constituents, it represents about 99% of the U.S. REIT universe and securities are classified in the REIT sector according to the Global Industry Classification Standard (GICS). It, however, excludes mortgage REITs and selected specialized REITs.
RES 5404 0316 | Tracking #1-474679 (Exp. 03/17)
Not FDIC or NCUA/NCUSIF Insured | No Bank or Credit Union Guarantee | May Lose Value | Not Guaranteed by Any Government Agency | Not a Bank/Credit Union Deposit
This research material has been prepared by LPL Financial LLC.
To the extent you are receiving investment advice from a separately registered independent investment advisor, please note that LPL Financial LLC is not an affiliate of and makes no representation with respect to such entity.
14Member FINRA/SIPC
MIM
The Russell 1000 Index measures the performance of the large cap segment of the U.S. equity universe. It is a subset of the Russell 3000 Index and includes approximately 1000 of the largest securities based on a combination of their market cap and current index membership. The Russell 1000 represents approximately 92% of the U.S. market.
The Russell 1000 Value Index measures the performance of the large cap value segment of the U.S. equity universe.
The Russell 1000 Growth Index measures the performance of the large cap growth segment of the U.S. equity universe.
The Russell 2000 Index measures the performance of the small cap segment of the U.S. equity universe. The Russell 2000 Index is a subset of the Russell 3000 Index representing approximately 10% of the total market capitalization of that index.
The Russell 2000 Growth Index measures the performance of those Russell 2000 companies with higher price-to-book ratios and higher forecasted growth values.
The Russell 2000 Value Index measures the performance of those Russell 2000 companies with lower price-to-book ratios and lower forecasted growth values.
The Russell 2500 Index is a broad index featuring 2,500 stocks that cover the small and mid cap market capitalizations. The Russell 2500 is a market capitalization-weighted index that includes the smallest 2,500 companies covered in the Russell 3000 universe of U.S.-based listed equities.
The Russell 3000 Index measures the performance of the largest 3,000 U.S. companies representing approximately 98% of the investable U.S. equity market.
The Russell 3000 Growth Index measures the performance of the broad growth segment of the U.S. equity universe. It includes those Russell 3000 companies with higher price-to-book ratios and higher forecasted growth values.
The Russell 3000 Value Index measures the performance of the broad value segment of U.S. equity value universe. It includes those Russell 3000 companies with lower price-to-book ratios and lower forecasted growth values.
The Russell Microcap Index measures the performance of the microcap segment of the U.S. equity market. Microcap stocks make up less than 3% of the U.S. equity market (by market cap) and consist of the smallest 1,000 securities in the small-cap Russell 2000 Index, plus the next 1,000 smallest eligible securities by market cap.
The Russell Midcap Index offers investors access to the mid cap segment of the U.S. equity universe. The Russell Midcap Index is constructed to provide a comprehensive and unbiased barometer for the mid cap segment and is completely reconstituted annually to ensure that larger stocks do not distort the performance and characteristics of the true mid cap opportunity set. The Russell Midcap Index includes the smallest 800 securities in the Russell 1000.
The Russell Midcap Growth Index offers investors access to the mid cap growth segment of the U.S. equity universe. The Russell Midcap Growth Index is constructed to provide a comprehensive and unbiased barometer of the mid cap growth market. Based on ongoing empirical research of investment manager behavior, the methodology used to determine growth probability approximates the aggregate mid cap growth manager’s opportunity set.
The Russell Midcap Value Index offers investors access to the mid cap value segment of the U.S. equity universe. The Russell Midcap Value Index is constructed to provide a comprehensive and unbiased barometer of the mid cap value market. Based on ongoing empirical research of investment manager behavior, the methodology used to determine value probability approximates the aggregate mid cap value manager’s opportunity set.
The S&P 500 Index is a capitalization-weighted index of 500 stocks designed to measure performance of the broad domestic economy through changes in the aggregate market value of 500 stocks representing all major industries.
The S&P Global Infrastructure Index is comprised of 75 of the largest publicly listed infrastructure companies that meet specific investability requirements. The index is designed to provide liquid exposure to the leading publicly listed companies in the global infrastructure industry, from both developed markets and emerging markets.
The S&P Utilities Index is comprised primarily of companies involved in water and electrical power and natural gas distribution industries.
The S&P Developed Ex-U.S. Property defines and measures the investable universe of publicly traded property companies domiciled in developed countries outside of the U.S. The companies included are engaged in real estate related activities, such as property ownership, management, development, rental and investment.
The USD Index measures the performance of the U.S. dollar against a basket of foreign currencies: EUR, JPY, GBP, CAD, CHF and SEK. The U.S. Dollar Index goes up when the dollar gains “strength” compared to other currencies.