LOWER SAN DIEGO RIVER WATER QUALITY · LOWER SAN DIEGO RIVER WATER QUALITY WY16 Supplemental Water...
31
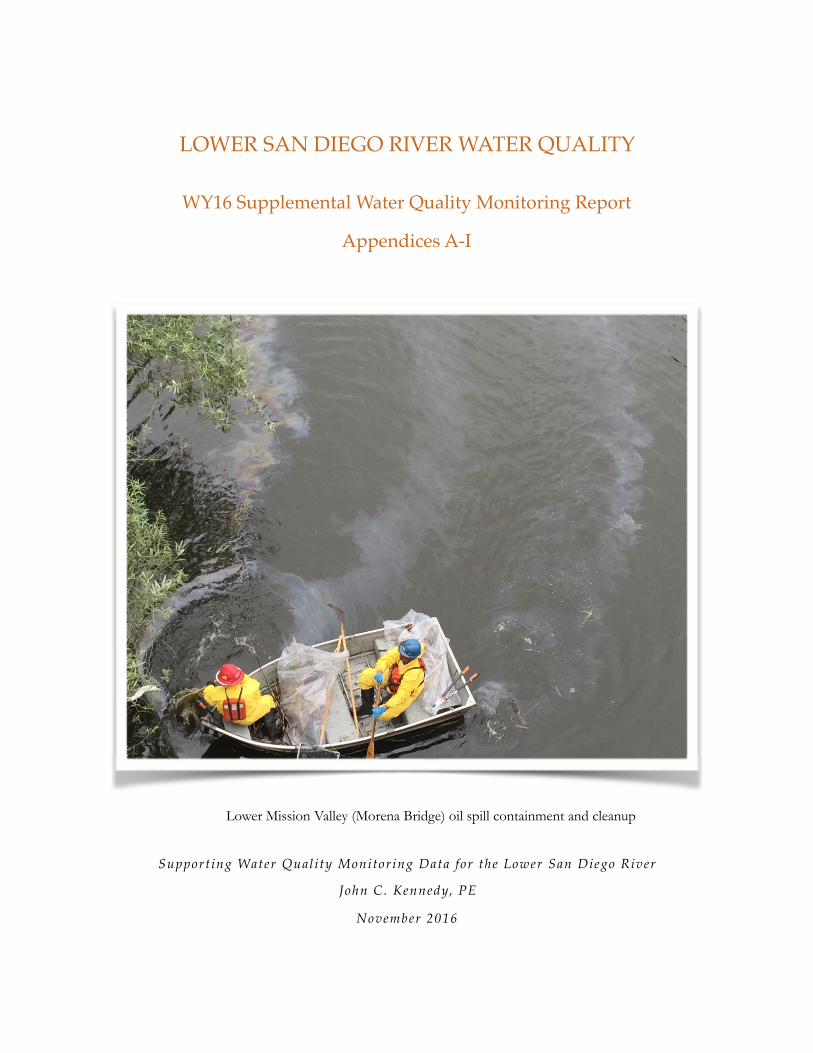
LOWER SAN DIEGO RIVER WATER QUALITY WY16 Supplemental Water Quality Monitoring Report Appendices A-I Lower Mission Valley (Morena Bridge) oil spill containment and cleanup Supporting Water Quality Monitoring Data for the Lower San Diego River John C. Kennedy, PE November 2016
Transcript of LOWER SAN DIEGO RIVER WATER QUALITY · LOWER SAN DIEGO RIVER WATER QUALITY WY16 Supplemental Water...
LOWER SAN DIEGO RIVER WATER QUALITY
WY16 Supplemental Water Quality Monitoring Report
Appendices A-I
Lower Mission Valley (Morena Bridge) oil spill containment and cleanup
Support ing Water Qual i ty Monitoring Data for the Lower San Diego River
John C. Kennedy, PE
November 2016
Lower San Diego River WY16 Water Quality Monitoring Report Appendices
LOWER SAN DIEGO RIVER WATER QUALITY WY16 SUPPLEMENTAL WQM REPORT
Appendices A-ITable of Contents
PageA. Glossary of Abbreviations and Formulas …………………………….…………… 1B. References…………………………… ………………………………………………… 2-3C. SDRPF RiverWatch Water Quality Monitoring Team ……………………………. 4D. LSDR WQM Metrics 12-Year Summary (WY05-WY16) ………………………….. 5-7
Table D.1 WQM Data Summary (Annual & Seasonal Averages)Table D.2 WQM Data Summary (12-Yr Spatial Averages)
E. SD RiverWatch WQ Monitoring Program ……………………………………….… 8-12Table E.1 LSDR Sections, Reaches and Monitoring SitesTable E.2 - LSDR WQM Site InformationTable E.3 - LSDR Water Quality Monitoring ParametersFigure E.1 - Lower San Diego River Catchment and WQM Sites
F. LSD River Hydrology and Water Quality …………………………………………… 13-16Table F.1 - Lower SDR Average Daily Flows (WY05-WY16) Table F.2 - Rainfall and Long-Term Average Daily Flows (1914-2016)Table F.3 - Annual Rainfall and Average Daily Flows (WY05-WY16)Charts F.1 - F.4 LSDR Hydrologic Data
G. 2016 Monthly WQM Data by Site …………………………………………………… 17-23Table G.1 West, Mid & East Section Water TemperaturesTable G.2 West, Mid & East Section pHTable G.3 West, Mid & East Section Specific ConductivityTable G.4 West, Mid & East Section Dissolved Oxygen ConcentrationsTable G.5 West, Mid & East Section DO as Percent of Saturation
H. 2016 Monthly WQ Data (by Others) ………………………………………………… 24-25Table H.1 USGS San Diego River Stream Flows Table H.2 SDCW San Diego River Coliform Bacteria Counts
I. Water Quality Indexing ………………………………………………………………. 26-29 Table I.1 WY16 WQI Values by WQM Site - West Section
Table I.2 WY16 WQI Values by LSDR WQM Site - Mid & East Sections Chart I.1 LSDR Running Average WQI by Reach (WY05-WY16) Chart I.2 LSDR Streamflow and WQI Running Averages (WY05-WY16) Chart I.3 LSDR Temporal WQI Profiles and Streamflow Chart I.4 LSDR Spacial WQI Profiles
Questions regarding the San Diego River WQM database or interpretation of results expressed in this document can be directed to the attention of the author, John C. Kennedy, through contacting SDRPF at [email protected], or the RiverWatch Coordinator at 619-297-7380.
SDRPF - RiverWatch i November 2016

S A N D I E G O R I V E R P A R K F O U N D A T I O N
Appendix A - Glossary Abbreviations:
AADF - Average Annual Daily Flow ACC - Average Coliform Count (arithmetic mean of fecal coliform, e-Coli & total coliform in MPN/100mL) ADF – Average Daily (stream) Flow or discharge AFY - acre-foot per year Avg– Average cfs - cubic feet per second (flow/discharge) Ck – Creek CY - Calendar Year (Jan 1 - Dec 31) DO – Dissolved Oxygen DOD- Dissolved Oxygen Deficit (level below minimum) DO%Sat – Dissolved Oxygen expressed as percentage of DO level at saturation point d/s – downstream // {u/s – upstream} E – East // {W –West} FSDRIP – First San Diego River Improvement Project ft. – feet // {mi. - mile} gal – gallon Ln(x) - natural logarithm of (x) to base-e (2.718) log(x) - common logarithm of (x) to base-10 L//U – lower//upper (as in river reaches) LSDR – Lower San Diego River max//min – maximum//minimum MCC - Mean Coliform Count (geometric mean of fecal coliform, e-Coli & total coliform in MPN/100mL) mg/L – milligrams per litre mi. - mile mS/cm – milliSeimens per centimetre (1 mS/cm = 1000 uS/cm) MG – Mission Gorge (mid-section of LSDR) MV – Mission Valley (West section of LSDR) MPN - Most Probable Number (of coliform organisms) SB – Santee Basin (East section of LSDR) PDMWD – Padre Dam Municipal Water District pH – measure of acidity or basicity (decimal logarithm of hydrogen ion activity) ppm – parts per million Q - stream flow or discharge SB – Santee Basin SpC – Specific Conductivity (also Conductivity or Conductance; sometimes abbreviated SC) SD – Standard Deviation (also San Diego) SDRPF – San Diego River Park Foundation TDS – Total Dissolved Solids Temp. – Temperature TN/TP – Total Nitrogen/ Total Phosphorus (nutrients) USGS – U.S. Geological Survey uS/cm –microSeimens per centimetre (1 uS/cm = 0.001 mS/cm) u/s - upstream // {d/s - downstream} W - West // {E - East} WQI – Water Quality Index (WQIa) WQI(4) - WQI using 4 parameters WQI(6) - WQI using 6 parameters WY – Water Year (Oct 1 – Sept 31) % - percent %Sat - percent of DO saturation value oC – degrees Celsius oF – degrees Fahrenheit
Formulas:
oC = (oF-32) x 5/9 oF = (oC*9/5) + 32
Flow (cfs) = Velocity (ft/sec)*Cross-sectional area (sq ft)
Constituent Load (lbs/day) = Q (mgd)*Concentration (ppm)*8.34; or Q (cfs)*Concentration (mg/L)*5.39 where Q is streamflow/discharge.
Total Dissolved Solids (TDS in mg/L) = 670*Specific Conductivity, (where SpC is in mS/cm). An approximate relationship for Lower SDR watershed; other variables (e.g., temperature, pressure, specific ions) are considered negligible.
DO - DO%Sat relationship is defined by the following polynomial equation: DO(mg/L)=DO%Sat*[0.004*T2-0.343*T+14.2]/100; DO%Sat = DO(mg/L)*100/[0.004* T2-0.343T+14.2], where T = temperature is in oC. Other variables, incl. barometric pressure, elevation and conductivity (SpC), have negligible impact on the DO-DO%Sat relationship within the LSDR watershed.
SDR Water Quality Index (WQI) is calculated using the following set of equations:
WQI4 = DO%Sat*2.5*T factor*Q factor/log(SpC);
where SpC is expressed in uS/cm; the T factor = 0.0055T3-0.163T2+1.37T-2.5, and the Q
factor = 0.56+0.173LnQ-0.002LnQ2-0.0033LnQ3 (M Valley); 0.72+0.15LnQ-0.0051LnQ2-0.004LnQ3 (M Gorge); 0.87+0.107LnQ-0.018LnQ2-0.003LnQ3 (Santee); 0.1+0.05LnQ-0.042LnQ2-0.0011LnQ3 (Tributaries) WQI6 = Avg.[DO%f*wt(DO), SpCf*wt(SC), pHf*wt(pH), MCCf*wt(MCC), Qf*wt(Q), Tempf*wt(T)]^1.75 where wt(DO) = 3, wt(SC) = 2, wt(pH) = 1, wt(MCC) = 1, wt(Q) = 2 and wt(T) = 1 The SDR WQI is developed specifically for the SDRPF RiverWatch Monitoring Program, however, the equations have also be applied to water quality and hydrologic data for other coastal area watercourses where comparable metrics are monitored and recorded.
Water Equivalents: 1 cf = 7.48 gal = 62.4 lbs of water 1 AF = 43,560 cf = 325,900 gal 1 psi = 2.31 ft of water (head) 1 mg/L = 1 ppm (in water) 1 cfs = 450 gpm = 0.646 mgd =1.98 AF/day = 724 AFY 1 mgd = 694 gpm =1.547 cfs = 3.06 AF/day = 1,120 AFY 1,000 gpm = 1.436 mgd = 2.23 cfs = 4.42 AF/day = 1,614 AFY 1 inch (rainfall) = 25.4 mm
! !1

Lower San Diego River WY16 Water Quality Monitoring Report Appendices
Appendix B - References
1. The Role of the San Diego River in Development of Mission Valley, Nan Papageorge, The Journal of San Diego History (Vol. 17, No. 2), Spring 1971
2. Evaluation of the Mission, Santee, and Tijuana Hydrologic Subareas for Reclaimed-Water Use, San Diego County, CA, John Izbicki, USGS Water Resources Investigations Report 85-4032, 1985
3. Water Quality Control Plan for the San Diego Basin, San Diego RWQCB, 1994
4. Waste Discharge and Water Recycling Requirements for the Production and Purveyance of Recycled Water, Padre Dam Municipal Water District (PDMWD), San Diego County, San Diego RWQCB, 1997
5. Groundwater Report, San Diego County Water Authority (SDCWA), 1997
6. Waste Discharge Requirements for PDMWD Padre Dam Water Recycling Facility, Discharge to Sycamore Creek and the San Diego River, San Diego County, San Diego RWQCB Order No. 98-60 (NPDES No. CA010749), 1998
7. Modification of Water Quality Order 99-08-DWQ State Water Resources Control Board (SWRCB) National Pollutant Discharge Elimination System (NPDES) General Permit for Stormwater Discharges Associated with Construction Activity, San Diego RWQCB Resolution No. 2001-046, 2001
8. General Waste Discharge Requirements for Groundwater Extraction Waste Discharges from Construction, Remediation, and Permanent Groundwater Extraction Projects to Surface Water within the San Diego Region except for San Diego Bay. San Diego RWQCB, Order No 2001-96 (NPDES No. CAG919002), 2001
9. .Waste Discharge Requirements for Discharge of Urban Runoff from Municipal Separate Storm Sewer Systems (MS4) Draining the Watersheds of the County of San Diego, the Incorporated Cities of San Diego County, and the San Diego Unified Port District, San Diego Regional Water Quality Control Board (RWQCB) Order No 2001-01 (NPDES No. CAS0108758), 2001
10. San Diego River Watershed Urban Runoff Management Plan, City of San Diego in conjunction with Cities of El Cajon, La Mesa, Santee, Poway and County of San Diego, 2001
note: all references are available on-line.
11. General Waste Discharge Requirements for Discharges of Hydrostatic Test Water and
Potable Water to Surface Waters and Storm Drains or Other Conveyance Systems, San Diego Region, San Diego RWQCB, 2002
12. San Diego River Watershed Urban Runoff Management Plan, City of San Diego Lead Agency, City of Santee, City of Poway, County of San Diego, Jan 2003
13. Watershed Sanitary Survey, City of San Diego Water Department, Jan 2001, rev. May 2003
14 . Clean Water Action Plan and Status Report, County San Diego Project Clean Water, June 2003
15. San Diego River Watershed Water Quality Report, Anchor Environmental & others, Oct 2003
16. San Diego River Watershed Management Plan Final WMPlan, Anchor Environmental and others, SDR Watershed Work Group, March 2005
17. 2005 Watershed Sanitary Survey - Volume 2 San Diego River System, City of San Diego Water Department, Water Quality Laboratory, Aug 2005
18. San Diego River Baseline Sediment Investigation Final Report, City of San Diego, Weston Solutions, Oct. 2005
19. Monitoring Workplan for the Assessment of Trash in San Diego County Watersheds, (Weston Solutions, Brown & Caldwell), County of San Diego, Aug 2007
20. San Diego Integrated Regional Water Management Plan, San Diego County Water Authority, City of San Diego and County of San Diego, Oct 2007
21. San Diego Regional Urban Runoff Management Plan Draft, County of San Diego, Dec 2007
22. Allopathic potential of two invasive alien Ludwig spp, Dandelot et. al., Elsevier Aquatic Botany 88 (4):311-316, Dec 8, 2007
23. Surface Water Ambient Monitoring Program (SWAMP) Report on the San Diego Hydrologic Unit, Final Technical Report 2007, Southern California Coastal Water Research Project, San Diego RWQCB, Jan 2008
SDRPF - RiverWatch ! November 2016 2

Lower San Diego River WY16 Water Quality Monitoring Report Appendices
Appendix B - References (continued)
24. San Diego River Watershed Urban Runoff Management Plan, City of San Diego, Storm Water Pollution Prevention Division, TRC, March 2008
25. There is No San Diego River, Bill Manson, San Diego Weekly Reader, Oct 22, 2008
26. The Ecological and Hydrological Significance of Ephemeral and Intermittent Streams in the Arid and Semi-arid American Southwest, EPA/660/R-08/134, Nov. 2008
27. Water, The Epic Struggle for Wealth, Power, and Civilization, Steven Solomon, Harper, 2010
28. San Diego River FY 2008-2009 WURMP Annual Report, TRC, January 2010
29. San Diego River Tributary Canyons Project Final Feasibility Report, April 2010
30. The invasive water primrose Ludwigia grandiflora in Germany: First record and ecological risk assessment, Nehring & Kolthoff, Agency for Nature Conservation, Germany, Aquatic Invasions 2011 REABIC (Vol 6, i1: 83-89) Dec 16, 2010
31. Guidelines for Citizen Monitors, SWAMP Clean Water Team Citizen Monitoring Program Guidance Compendium, SWRCB website (10/5/11 update)
32. 2011 Long-Term Effectiveness Assessment, San Diego Stormwater Co-permittees Urban Runoff Management Programs, Final Report, Walker Assoc. Weston Solutions, June 2011
33. San Diego River Conservancy 2012 Work Plan, Governing Board, March, 2012
34. The Day the San Diego River Was Saved: The History of Floods and Floodplain Planning in Mission Valley, Philip R. Pryde, Journal of San Diego History, (Vol. 57, No. 3) 2012
35. San Diego River Watershed Bioassessment and Fish Tissue Analysis, RWQCB, Feb. 2013
36. San Diego River Park Master Plan, City of San Diego, April 18, 2013
37. Watershed Asset Management Plan, Final Report, Storm Water Division, Transportation and Storm Water Department, City of San Diego, July 19, 2013
38. San Diego River Watershed Comprehensive Load Reduction Plan - Phase II, Tetra Tech Inc, Final July 24, 2013
39. Aquatic Conservation: Marine and Freshwater Ecosystems, A success story: water primroses, aquatic pests, Thouvenot, Haury & Thiebaut, (Vol 23, i5: 790-803) Oct. 2013
40. San Diego River Restoration Involves Clearing Homeless, And Their Trash, Susan Murphy, KPBS, Jan. 16, 2014
41. San Diego River Watershed Monitoring and Assessment Program, B. Bernstein (SWAMP-MR-RB9-2014-0001), RWQCB, Jan. 20, 2014
42. Nonstructural Non-Modeled Activity Pollutant Load Reduction Research - Addendum Final, HDR, City of San Diego, Nov. 5, 2014
43. Lower San Diego River Monthly and Annual Water Quality Monitoring Reports, SDRPF RiverWatch, 2005-2016
44. San Diego River Watershed Management Area Water Quality Improvement Plan, Walker Assoc. & AMEC, San Diego RWQCB, September 2015
45. Lower San Diego River Dissolved Oxygen Levels, John Kennedy, San Diego River Coalition presentation, June 19, 2015
46. Lower San Diego River Streamflow and Water Quality Metrics Monitored by RiverWatch, John Kennedy, SDR Coalition presentation, Aug. 21, 2015
47. Analysis of Anionic Contribution to Total Dissolved Solids in the Lower San Diego River, Janae Fried, SDSU Thesis (Geological Sciences), Fall 2015
48. San Diego River Watershed Management Area Water Quality Improvement Plan, L. Walker & Assoc., January 2016
49. A Brief Walk Along the San Diego River - A Field Guide, Marly Nicole Isler, Francis Parker School
50. Ludwigia hexapetala (Uruguay water-primrose), California Invasive Plant Council, <Cal-IPC/Invasive Plant/profiles/Ludwigia hexapetala>
note: all references are available on-line.
SDRPF - RiverWatch ! November 2016 3

Lower San Diego River WY16 Water Quality Monitoring Report Appendices
Appendix C - SDRPF RiverWatch WQM Team
Supervision/Coordination: Rob Hutsel (2004 - 2005), Kym Hunter (2006 - 2007),Shannon Quigley-Raymond (2008 - 2016)
Volunteers: (3+ times):Aidan KennedyAlan RamirezAlexandra ShaloskyAmethyst CrusperoAmy CookAng NguyenBarbara OwenBill MartinBirgit KnorrBob Stafford**Brent ReddCalvin Vine** Cameron BradleyCarl AbulenciaCelena CuiChandler HoodChris PeterClint WilliamsConrad Brennen**Craig McCartneyDani TranDavid LapotaDemitrio DuranDonna ZollDoug TaylorEbony QuilteretEdward GarrittyErin BabichFred Ward Gabriel Martinez MercadoGary Strawn**George Liddle**Gina MartinJack Greco
Jalil Ahmad Janae FriedJason AndresJim ThornleyJoan SemlerJohn Kennedy**Joyce NowerKatharyn MorganKathryn StanawayKaty RobinsonKelly BrownKenneth SantosKevin BernaldezKrissy LoveringKrystal TronbollLaqueta StrawnLinda KingLinda TarkeLindsey DornesLindsey TeunisLois DornLucas SalazarMadison McLaughlinMaesa Hanhan Marcus KingMark CarpenterMark Dreiling**Mark HammerMarlene BakerMartin Offenhauer** Mary HansenMatt OlsonMelissa Garret Melissa Maigler
Michael MikulakMichael SowadskiMike Hanna**Mike HunterMitchell Manners Mitzi Quizon Mojisola OgunleyeNatelie Rodriguez Nicole BeelerNorrie RobbinsPaul Hormick**Paul NguyenRaymond NgoReggie AgarmaRussell BurnetteSami CollinsSamuel MartinSandra PentneyShelia-Ann JacquesSilvana ProcopioTim TooleTina DavisTom Younghusband**Toni NguyenTony de GarateTrish NarwoldValerie RawlingsVeronika ShevchenkoVidhya NagarajanWendy KwongYang JiaoYvette Navarro
** Team Leaders, 3x+ WY16 volunteers are listed in blue
SDRPF - RiverWatch ! November 2016 4

Lower San Diego River WY16 Water Quality Monitoring Report Appendices
Appendix D - LSDR Water Quality Monitoring Metrics 12-yr Summary
(a) Values in red are below 12-yr norms; values above norms are in blue.
Table D.1 WQM Metrics Summary (Annual & Seasonal Averages)
WY5 WY6 WY7 WY8 WY9 WY10 WY11 WY12 WY13 WY14 WY15 WY1612-yr Norm
Annual (October-September):
ADF, cfs 65 12 8 16 18 29 42 13 8 4 9 15 20.0Temp, oC 17.7 18.3 17.7 17.7 17.7 18.1 17.8 18.0 17.3 17.9 18.7 18.2 17.9
SpC, uS/cm 2.13 2.19 2.42 2.32 2.49 2.36 2.21 2.39 2.50 2.58 2.19 2.30 2.342DO, mg/L 6.96 5.96 5.94 6.24 6.15 5.43 5.80 5.47 5.58 3.92 4.53 4.91 5.67
DO%Sat, 68 59 60 64 64 57 60 57 57 40 48 51 58pH 7.63 7.44 7.53 7.89 7.66 7.85 7.85 7.67 7.77 7.67 7.78 7.49 7.68
WQI 41 37 36 38 37 35 38 33 32 22 29 29 34
Grade C D+ D+ C- D+ D C- D D E+ D D D
Summer (June-September) Period:
ADF, cfs 2.9 2.0 1.2 1.3 1.0 1.6 2.2 1.4 1.0 0.8 6.1 0.6 1.8Temp, oC 21.8 23.7 21.8 22.9 22.8 21.9 21.7 22.9 21.7 22.7 22.9 21.9 22.4
SpC, uS/cm 2.62 2.48 2.78 3.07 3.25 3.04 2.86 3.13 3.09 3.02 2.18 3.16 2.86DO, mg/L 5.28 5.07 4.86 5.30 4.82 3.95 3.94 3.79 3.32 2.33 3.56 3.19 4.12
DO%Sat, % 55 57 52 61 55 46 45 45 38 39 42 37 48pH 7.56 7.52 7.48 7.94 7.49 7.84 7.90 7.95 7.71 7.98 7.84 7.14 7.70
WQIa 25 26 22 25 22 22 22 19 16 11 21 13 20
Grade D- D- E D- E E E E E F E E- EWinter (December-March) Period:
ADF, cfs 150 20 18 44 46 73 105 20 19 9 17 33 46.2Temp, oC 13.5 12.8 13.8 12.4 13.3 14.2 13.7 12.4 12.4 13.4 15.3 14.1 13.5
SpC, uS/cm 1.45 1.99 2.04 1.57 1.55 1.38 1.33 1.69 2.02 2.24 1.89 1.73 1.74DO, mg/L 9.61 6.85 7.01 7.18 7.49 6.37 7.74 7.16 8.09 5.27 5.44 6.50 7.06
DO%Sat 90 61 67 68 74 64 75 67 76 50 54 63 67pH 7.66 7.40 7.75 8.05 7.80 7.65 7.84 7.35 7.77 7.52 7.84 7.51 7.68
WQIa 58 46 50 53 55 52 52 43 50 32 36 41 47
Grade B C B- B- B B- B- C B- D D+ C C
SDRPF - RiverWatch ! November 2016 5

Lower San Diego River WY16 Water Quality Monitoring Report Appendices
Table D.2 WQM Metrics Summary by Section and Reach (WY16/WY15 & 12-yr Norms)
Section Mission Valley Mission Gorge Santee Basin Watershed
Sites 1-4 5-7 8-10 11,12T &15T 13&14 all (1-15T)
Reach LMV UMV MG LSB USB LSDR (a)
Annual (Oct-Sept):
ADF, cfs 15/6 (31) 10/4 (28) 8/5 (20) (b) 7/4 (17) 4/2 (8) 11/5 (24)
Temp, oC20.0/19.8
(19.3)18.2/18.6
(17.8)17.4/17.8
(17.1)17.9/19.0
(17.4)17.6/18.3
(18.0)18.2/17.7
(17.9)
SpC, mS/cm 2.015/2.781 (2.550)
2.247/2.935 (2.549)
2.326/2.413 (2.259)
2.367/2.315 (2.245)
1.990/2.081 (1.795)
2.192/2.582 (2.345)
DO, mg/L 2.89/2.68 (5.07)
3.09/3.03 (4.60)
7.98/7.21 (7.82)
7.27/5.06 (6.75)
2.05/2.08 (3.38)
4.70/4.09 (5.67)
DO %of Sat, % 31/28 (54) 33/32 (47) 73/80 52/65 22/35 50/42 (58)
pH 7.56/7.70 7.53/7.55 7.65/7.69 7.73/7.76 7.77/7.70 7.77/7.68
WQIa 35/23 (36) 22/22 (30) 40/44 (48) 37/43 (38) 8/10 (18) 29/29 (34)
Grade D/E (D+) E/E (D) C/C (C) D+/C (C-) F/F (E) D/D (D)
WY16 Rating Marginal Poor Fair Marginal Very Poor Marginal
WY15 Rating Poor Fair Very Poor Marginal
WY14 Rating Poor Marginal Very Poor Poor
12-yr Norm Marginal Marginal Fair Poor Marginal
Summer (June-Sept) Period:
ADF, cfs 13.6/1.3 (3.3) 10/1 (2.5) 6.2/0.8(2.1) (c) 4.4/0.6(1.8) 2.0/0.2(0.8) 7.6/0.8 (2.1)
Temp, oC 24.5/24.0 (24.2)
21.2/23.1 (21.7)
21.3/22.2 (21.7)
20.8/22.9 (21.7)
21.7/22.3 (22.7)
21.9/22.9 (22.4)
SpC, mS/cm 1.743/3.150 (3.178)
2.260/3.445 (3.159)
2.318/3.080 (2.816)
2.614/2.539 (2.595)
1.972/2.300 (2.011)
2.178/3.024 (2.864)
DO, mg/L 1.82/1.11 (3.57)
1.79/2.17 (2.95)
7.13/4.51 (6.42)
6.98/3.35 (5.73)
1.94/2.03 (2.59)
3.87/2.63 (4.30)
DO % of Sat, % 22/13 (42) 21/25 (34) 81/51 (73) 38/59 22/24 (29) 45/41 (49)
WQI 17/15 (21) 6/11 (15) 18/31 (30) 20/37 (26) 5/9 (10) 13/21 (20)
Grade E/E (E) F/F (E) E/D (D) E/D+ (D-) F/F (F) E-/E (E)
WY16 Rating Poor Very Poor Poor Very Poor Poor
WY15 Rating Poor Very Poor Marginal Very Poor PoorWY14 Rating Very Poor Poor Very Poor
12-yr Norm Poor Marginal Very Poor Poor
SDRPF - RiverWatch ! November 2016 6

Lower San Diego River WY16 Water Quality Monitoring Report Appendices
WY16/15 WQ metrics below (less than) 12-yr Norms shown in red; values above norms are shown in blue. (a) Weighted average of all reaches within the Lower SDR watershed. (b) Stream flow based on river channel gains and losses averaged between Santee Basin and Mission Valley.
Table D.2 WQM Metrics by Section and Season (Continued)
Reach LMV UMV MG LSB USB LSDR (a)
Winter (Dec-March) Period:
ADF, cfs 26/13 (72) 24/11 (70) 16/10 (46) 14/9 (39) 7/4 (20) 17/9 (47)
Temp, oC 15.3/16.4 (14.4)
14.7/15.5 (13.6)
12.8/14.2 (12.6)
14.8/15.7 (13.2)
13.0/14.8 (13.4)
14.1/15.3 (13.5)
SpC, mS/cm1.941/2.528
(1.887)1.608/2.608
(1.798)2.048/1.963
(1.619)2.069/2.006
(1.832)1.861/1.923
(1.485)1.890/2.241
(1.741)
DO, mg/L4.02/3.71
(6.73)3.69/4.23
(6.41)8.97/8.89
(9.01)8.20/6.47
(7.94)1.77/2.56
(4.32)5.50/5.32
(7.09)
DO % of Sat, % 41/36 (66) 37/40 (62) 87/83 (86) 84/62 (72) 18/25 (40) 55/50 (68)
WQI 44/33 (50) 38/28 (46) 58/58 (63) 52/52 (50) 14/11 (28) 41/36 (47)
Grade C/D (B-) C-/D (C) B/B (B) B/B (B-) E/F (D) C/D+ (C)
WY16 Rating Fair Good Poor Fair
WY15 Rating Marginal Good Very Poor Marginal
WY14 Rating Marginal Good Fair Poor Marginal
12-yr Norm Good Fair Good Marginal Fair
SDRPF - RiverWatch ! November 2016 7
Lower San Diego River WY16 Water Quality Monitoring Report Appendices
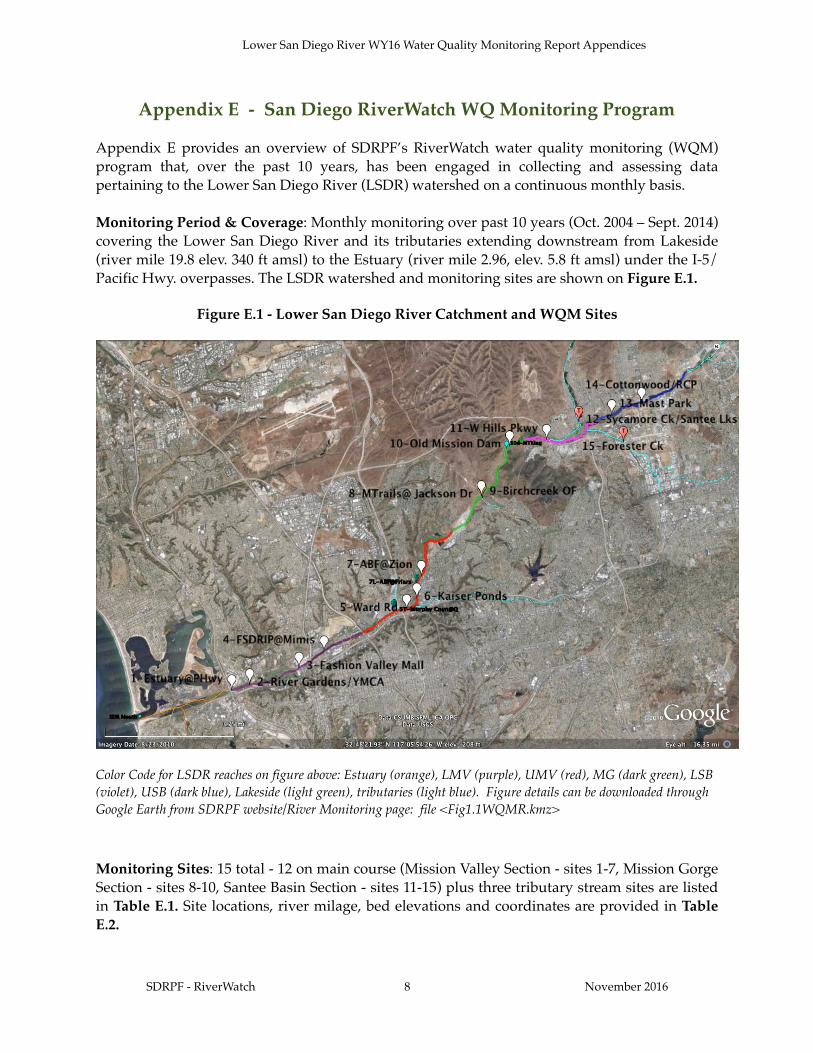
Appendix E - San Diego RiverWatch WQ Monitoring Program
Appendix E provides an overview of SDRPF’s RiverWatch water quality monitoring (WQM) program that, over the past 10 years, has been engaged in collecting and assessing data pertaining to the Lower San Diego River (LSDR) watershed on a continuous monthly basis.
Monitoring Period & Coverage: Monthly monitoring over past 10 years (Oct. 2004 – Sept. 2014) covering the Lower San Diego River and its tributaries extending downstream from Lakeside (river mile 19.8 elev. 340 ft amsl) to the Estuary (river mile 2.96, elev. 5.8 ft amsl) under the I-5/Pacific Hwy. overpasses. The LSDR watershed and monitoring sites are shown on Figure E.1.
Figure E.1 - Lower San Diego River Catchment and WQM Sites
Color Code for LSDR reaches on figure above: Estuary (orange), LMV (purple), UMV (red), MG (dark green), LSB (violet), USB (dark blue), Lakeside (light green), tributaries (light blue). Figure details can be downloaded through Google Earth from SDRPF website/River Monitoring page: file <Fig1.1WQMR.kmz>
Monitoring Sites: 15 total - 12 on main course (Mission Valley Section - sites 1-7, Mission Gorge Section - sites 8-10, Santee Basin Section - sites 11-15) plus three tributary stream sites are listed in Table E.1. Site locations, river milage, bed elevations and coordinates are provided in Table E.2.
SDRPF - RiverWatch ! November 2016 8

Lower San Diego River WY16 Water Quality Monitoring Report Appendices
Table E.1 LSDR Sections, Reaches and Monitoring Sites
(a) Monthly monitoring discontinued in WY07; nearby Ward Rd Bridge site renumbered as 5. (b) Monthly monitoring initiated in 2008; site also termed Jackson Dr. Outfall (OF). (c) Monthly monitoring initiated in 2007 with adjusted site location in 2009.
WQ Parameters: Seven measured and recorded parameters (Temp, pH, SpC, DO, DO%Sat, NO3 & PO4) plus subjective field observations re: environs and characteristics are listed in Table E.3. As nutrient testing for NO3 and PO4 is carried out at five selected sites; two in West (2 & 6) and three in East (11,14 & 15T), respectively, results are not used in performing statistical analyses regarding reaches/sections of the river. Number of datum for each of the five physical-chemical parameters monitored monthly at each site over the 11-yr period (Oct. 04 - Sept. 15) are in the range of 100 to 120. Two other water quality parameters monitored by others at several sites, streamflow from USGS (Poway Office) and coliform counts from SDCoastKeeper, are also recorded for purposes of determining the water quality index.
Protocol: East Side – (Santee Basin & Mission Gorge Sections). The 8 sites within upper three reaches (MG, LSB & USB) typically monitored 3rd Fri. or Sat. of month. West Side - (Mission Valley Section). Seven sites within the lower two reaches (LMV & UMV) monitored monthly, typically 3rd Sun. of month.
Section/Reach/Tributary Site #s Comments
Estuary Entrance 1E/1W Tidal influence at transition from river to estuary
Lower Mission Valley (LMV) 2E/W, 3 & 4 4 miles of lower river extending to I-805
Upper Mission Valley (UMV) 5,6 & 7 4-mile stretch from I-805 to Princes View Dr
Mission Valley (West Sites) 1-7 8-mile western portion through Mission Valley
Mid-Section : Mission Gorge (MG) 8,9T & 10 5-mile mid-section, Princess View Dr to Kumeyaay Lk
Lower Santee Basin (LSB) 11,12T&15T 2-mile stretch from Kumeyaay Lk to Carlton Hills Blvd
Upper Santee Basin (USB) 13 & 14 3-mile stretch from Carlton Hills Blvd to Riverford Rd
Santee Basin (SB) 11-15T 5-mile eastern section from Kumeyaay Lk to Lakeside
Eastern Sections (East Sites) 8 -15T 10-mile eastern/upper 3 reaches (2 sections)Tributaries:
Murphy Canyon/Qualcom a) 5a Enters LSDR southwest of Qualcom Stadium
Jackson Dr/Birchcreek Drain b) 9T Enters LSDR at Sycott Wash (d/s of Site 8)
Santee Lakes/E. Sycamore Cnyn Ck 12T Enters LSDR at Carlton Oaks GC (u/s of 15T)
Forester Creek c) 15T Enters LSDR at Carlton Oaks GC (d/s of 12T)
Lower SDR Watershed (LSDR) 1-15T Weighted average of all 5 reaches or all 3 sections
SDRPF - RiverWatch ! November 2016 9

Lower San Diego River WY16 Water Quality Monitoring Report Appendices
Table E.2 - LSDR WQM Site Information
(Table E.2 footnotes located top of next page)
SDRPF - RiverWatch ! November 2016 10
Site #
Site Name u/s mi.
Elev. ft. Location
GIS Coordinates
Lat. Long.
LMV - Lower Reach W Mission Valley: I-5 Bridge to I-805 Bridge (Sites 1-4)1 Estuary W/E 2.96 6 between PCH & I-5 on encased sewer main 32.76131 -117.20373
2 River Gardens E/W 3.5 11 W of YMCA, d/s of Trolly at riffle 32.7623 -117.1944
3 Fashion Valley Mall W 5.08 22 below Town & Country Pedestrian Bridge 32.76517 -117.16869
4 FSDRIP 5.98 36 N of Mimi’s on Mission Center Rd Bridge 32.76986 -117.15482
UMV - Upper Reach E Mission Valley: I-805 Bridge to N end of Admiral Baker Field (Sites 5-7)5 Ward Rd Bridge 8.89 50 S. of Trolly overpass at Del Rio S
intersection32.78024 -117.11029
6 Kaiser Ponds 9.46 56 E. of Mission SD de Acala at SD Mission Rd
32.78406 -117.10419
7Admiral Baker Field ABF - Zion Rd
9.98 10.2
58 L - Lower (below Friars Rd bridge) 32.79038 -117.10314
62 Z - Terminus of Zion Ave at Riverdale St 32.79304 -117.09984
West (MV) - Mission Valley Section: Estuary to Admiral Baker Field (Sites 1-7) [LMV+UMV]
MG - Mission Gorge Reach: Quarry Area to Old Mission Dam (Sites 8-10)
8 Mission Trails @ Jackson Dr
13.82 159 SDCWA downstream of Scycott Crossing 32.82124 -117.06205
9T Jackson Dr/Birchcreek OF
13.86 198 San Marcos area tributary by Jackson Dr. Trail
32.82268 -117.06224
10 Old Mission Dam W/E 15.65 265 Downstream side of Old Mission Dam 32.83977 -117.04332
Mid-Section (MG) -Mission Gorge Section: Quarry Area to Old Mission Dam (Sites 8-10)
LSB - Lower Reach Santee Basin: W Hills Pkwy to Carlton Hills Bridge (Sites 11,12 &15)11 West Hills
Pkwy17.03 300 at/below West Hills Pkwy Bridge 32.83936 -117.02436
12T Carlton Oaks Dr/Santee 18.23 320 W Sycamore Ck/Santee Lakes @ Carlton Oaks Dr.
32.84431 -117.00635
15T Forester Creek 18.86 336 Forester Ck (tributary) at Prospect Ave. 32.83221 -116.98658
USB - Upper Reach Santee Basin: Carlton Hills Bridge to Riverford Rd (Sites 13-14) 13 Mast Park 18.50 330 Pedestrian Bridge behind (N of) Walmart 32.84696 -116.97335
14 Cottonwood Ave/RCP 19.84 340 W of RCP plant at Chubb Ln/Cottonwood 32.84434 -116.98947
East (SB) - Santee Basin Section: West Hills Parkway to Lakeside (Sites 11-15 above) [LSB+USB]
LSDR - Lower San Diego River Watershed: SD Estuary to Lakeside (Sites 1-15 above) [MV2+MG+SB]

Lower San Diego River WY16 Water Quality Monitoring Report Appendices
(Table E.2 footnotes:) Reaches (5) - averaged values for combination of adjacent sites excluding tributaries within identified portions of river (LMV, UMV, MG, LSB, USB) . Sections (3) - averaged values for adjacent reaches (MV = LMV+UMV, MG = MG, SB = LSB+USB) Tributaries (3) – sites located on small creeks/drainages tributary to main stream watercourse. LSDR – computed values for entire lower watershed (distance-weighted average of all 5 reaches or all 3 sections); average (LMV+UMV+MG+LSB+USB) or average (MV+MG+SB).
Table E.3 - LSDR Water Quality Monitoring Parameters
Team Leaders and multiple citizen volunteers (commonly 3-8 persons) meet at an appointed location, organize field equipment/transportation, drive to sites, measure physical-chemical water quality using the Sonde meter, note special conditions/observations, collect samples for subsequent testing, return to office, perform nutrient (NO3 & PO4) tests, store samples for subsequent laboratory analyses and clean/check-in/store field equipment.
WQ Parameter unit Comments
Measured monthly at all sites:1. Temperature (Temp) oC Basic characteristic and WQ driver (see Table G.1)
2. pH - Degree of acidity (<7.0) or alkalinity (>7.0) (see Table G.3)
3. Specific Conductivity (SpC) mS/cm Measure of ionic content or dissolved solids (see Table G.2)
4. Dissolved Oxygen (DO) mg/L Good indicator of relative water quality (see Table G.4)
5. Percent of DO Saturation (DO%Sat) % Good indicator of general water quality (see Table G.5)
Sampled/tested monthly at selected sites: (typically 5 - 3 East & 2 West)6. Nitrate (NO3-N) mg/L Important nutrient for biological activity
7. Phosphate (PO4-P) mg/L Key nutrient for biological activity
Discontinued on regular basis in 2006:
8. Turbidity NTU Discontinued due to probe replacement
9. Barometric Pressure mBars Suspended readings as external data readily available
Environmental Observations recorded at all sites:Atypical or notable conditions (scum, discoloration, odors, etc.), trash/debris, homeless encampments, biological activity (aquatic, avian, terrestrial), expansion of invasive species, erosion, scouring, other noteworthy comments re: watercourse, shoreline and adjacent environs. Special note as to invasive aquatic plant growth on water surface.
General WQ Conditions observed at all sites: (numerical coding added in 2010)Weather Condition, Presence of Algae, Clarity, Color, Odor, Flow, Foam, Litter, Odor, Oil and Grease (O&G), e
Parameters measured by others at selected sites10. Stream Flows cfs USGS gauging stations at Fashion Valley and Mast Rd near
Santee (see Table H.1)
11. Coliform counts: (Escheria-coli, Enterococcus, Total Coliform bacteria)
MPN/100mL
SD CoastKeeper data taken at Fashion Valley Rd and Old Mission Historic Dam monitoring sites (see Table H.2)
SDRPF - RiverWatch ! November 2016 11

Lower San Diego River WY16 Water Quality Monitoring Report Appendices
Data Management: Water quality data are typically managed in a three-step process. 1. Raw (source) data - each site, several of which have two monitoring locations (e.g. upstream/downstream of dam, riffle or crossing), date/time, measured WQ parameters, and non-quantifiable supporting observations and comments. 2. Compiled (vetted/proofed) data - provided on Ecolayers w/date, site location, parameter value and additional observations of interest.3. Processed (formatted/aggregated) data - with statistical computations associated with LSDR sites, reaches, sections and tributaries for each WQ parameter of interest including those monitored by others.
Statistical Computations: Various basic statistical values have been calculated from the data.
Mean – average of a series (sum of values divided by number of values)Median – middle value of an ordered series (50% larger - 50% smaller)Minimum – lowest or smallest value measuredMaximum – highest or greatest value measuredRange – Difference between maximum and minimum values1st Quartile (Q1) – 25% of values smaller - 75% larger2nd Quartile (Q2) – 50% of values larger - 50% smaller (same as median value)3rd Quartile (Q3) – 75% of values smaller - 25% largerVariance – sum of the squares of deviation from the mean or average valueStandard Deviation (SD) – square root of the varianceSkew – third moment about the mean divided by the standard deviation (SD)Coefficient of Variance (CoV)– Variance divided by the meanTrend line - Moving average values taken over 12-month period
SDRPF - RiverWatch ! November 2016 12
Lower San Diego River WY16 Water Quality Monitoring Report Appendices
Appendix F - LSDR Hydrology and Water Quality
Stream flow or discharge, is the volume of water moving past a designated location over a fixed period of time. It constitutes a primary driver of changes in water quality. Often expressed as cubic feet per second (cfs) or million gallons per day (mgd), flow is the amount of water moving off a watershed into a watercourse, as affected by weather (increasing during rainstorms and decreasing during dry spells) and changing during each season. Flow rapidly decreases during summer months when rainfall is minimal, evaporation rates high and actively growing riparian vegetation extracts water from the ground. August and September are typically months of lowest flow. A function of both volume and velocity, stream flow has a major impact on living organisms, riparian habitat, benthic conditions and overall water quality. Velocity of flow, typically increasing as volume increases, determines the kinds of organisms that live in the system and also affects the amount of silt and sediment transported. Fast moving waters usually contain higher levels of DO than sluggish flows, as they are better aerated.
LSDR average daily flow (ADF) values as recorded at the two USGS gauging stations in the lower watershed are expressed in Table F.1 for both the 12-yr monitoring period (Oct 2004 - Sept 2016) and over the past 52 years (1965-2016) of official record. The average daily flow values are in close accord for both stations; river discharge over the past 12 years has run about 16 percent below the 52-year norm in Mission Valley and 20% below the Santee norm. WY16 discharge is 33% below the 52-yr norm at the Fashion Valley Site and 35% below the norm at Santee. On average river discharge for WY16 is 40 percent below the long-range (50+ year) norm and 19 percent below the past 12 year norm.
Correlations between total annual rainfall and ADF considered over the past 53 years of hydrologic record and during the period of SDRPF RiverWatch monitoring for the two lower SDR gauging stations are presented in Tables F.2 and F.3, respectively. WY05 was a “Very Wet” (>20”) hydrologic year, whereas WY07 was “Very Dry”(<5”). WY11 and WY15 were both “Above Normal” rainfall years (12-15”) while WY09 and WY10 (8-12”) were considered “Normal” in terms of total annual rainfall. The 12-yr ADF in the East and West are 18 and 30 cfs, respectively; the values are 15 to 20 percent below the long-range LSDR average daily discharges.
Monthly discharge data (min, max and average daily flow) at the two gauging stations extending from Oct 2004 through Oct 2016 are presented in Chart F.1. Average daily flow (ADF) for the Lower San Diego River varies from less than 0.2 cfs (0.1 mgd) during the summer (dry) months to nearly 220 cfs (142 mgd) during some winter (wet) periods in the East (Santee Basin) and up to 390 cfs (252 mgd) in the West (Mission Valley) section. Running average ADF values, trending downward in WY12-WY14 increased in WY15 and fell in WY16 as shown in Charts F.1 and F.3.
SDRPF - RiverWatch ! November 2016 13

Lower San Diego River WY16 Water Quality Monitoring Report Appendices
Table F.1 - Lower SDR Average Daily Flows (WY05-WY16)
(a) Lower San Diego River average daily flow represents a mean hydrologic condition based on averaging the two USGS gauging station flow values. (b) ADF values are expressed in both cubic feet per second (cfs) and million gallons per day (mgd); 1 cfs = 0.646 mgd. (c) Annual discharge volume expressed in acre-feet (1 AF = 325,900 gallons); WY16 and 53-Yr averages.
Table F.2 - Rainfall and Long-Term Average Daily Flow (1914-2016)
a) Total annual rainfall from 1 October through September 31. b) Santee Basin USGS Stream Gauge Station #11022480 at Mast Road in Santee. c) Mission Valley USGS Stream Gauge Station #11023000 at Fashion Valley Mall; incomplete data prior to 1968. d) Above normal annual rainfall (12-15 in/yr) resulting in LSDR average daily flows in the 25-50 mgd range.
Type # of
YearsPercent of Total Years
Total Annual Rainfall (a) Average Daily Stream Flow, mgd
inches mm Avg., mm East (b) West (c) LSDR
Very Wet 3 3%
31%
>20 >500 580 68 113 92
Wet 10 10% 15-20 380-499 430 48 81 66
Above Norm (d) 18 18% 12-15 300-379 340 26 44 35
Normal 40 38% 38% 8-12 200-299 250 10 18 15
Dry 26 26%31%
5-8 125-199 160 7 12 10
Very Dry 6 6% <5 <125 100 5 9 7
Total/An. Avg 102 100% 9.85 250 16 25 21
SDRPF - RiverWatch ! November 2016 14
Season West - Mission Valley East - Santee Basin LSDR (a)
Units (b) cfs mgd cfs mgd cfs mgd
Fall (Oct-Nov) 12.2 7.9 4.7 3.0 6.6 4.3
Winter (Dec-Mar) 28.1 18.2 47.5 30.7 31.5 20.3
Spring (April-May) 10.8 7.0 10.3 6.7 8.75 5.7
Summer (June-Sept) 0.8 (0.5) 0.9 0.6 1.9 1.2
Annual Avg. (WY16) 19.9 12.9 12.2 7.9 13.3 8.6
12-Yr Annual Avg. (2005-2016) 29.9 19.3 17.4 11.2 19.8 12.8
52-Yr Annual Avg. (1965-2016) 36.0 23.3 22.0 14.2 27.0 17.4
Annual Discharge, AFY (c) 14,490/26,095 8,850/15,920 9,630/19,530

Lower San Diego River WY16 Water Quality Monitoring Report Appendices
Table F.3 - Annual Rainfall and Average Daily Flow (WY05-WY16)
a) Percent difference from 103-Yr average annual rainfall (252 mm/yr or 9.92in/yr); black-above, red-below average.b) Santee Basin USGS Stream Gauge Station at Mast Rd., Santee c) USGS Stream Gauge Station at Fashion Valley Mall; incomplete data prior to 1965. d) Percent difference from average annual daily flow (i.e., 32 cfs (21 mgd)).
Monthly and seasonal average annual flows and rainfall over the monitoring period for both stations are shown in Chart F.2. The seasonal flow patterns express range, variance and correlation in monthly ADF and rainfall over the last 12 years. Winter season streamflow within the lower watershed is several hundred times greater than summer, dry-season flow. Average annual, winter and summer stream flow and rainfall for each of the past 12 water years are presented in Chart F.3. Highest flows during the monitoring period at both gauging stations were recorded in WY05 (very wet year); the lowest in WY14 (very dry year). Water years ‘06, ’07, ‘08, ‘12, ’13, ‘14 and ’16 were all below normal, witnessing both below average rainfall and runoff/streamflow. WY09 witnessed near normal rainfall and river discharge. Water years 2010 and 2011 were slightly above normal years in terms of total annual rainfall and average daily streamflow. Lowest total annual rainfall occurred in WY05, whereas lowest average annual streamflow, both upstream at Santee and downstream in Mission Valley occurred in WY14. In WY15, total annual rainfall amounting to 10.4 inches was 11% above the norm (9.3 inches) while average annual streamflow remained 52% below the 12-yr norm and 74% below the 52-year average.
(Type of Year)Annual Rainfall
Variance (a)ADF, cfs/(mgd)
Variance (d)East (b) West (c) LSDRmm inches
WY05 (Very Wet) 574 22.60 129% 50.9 (33) 100 (65) 71.5 (46) 119%
WY06 (Dry) 152 6.00 -39% 10.7 (7) 17.5 (11) 13.6 (9) -57%
WY07 (Very Dry) 98 3.85 -61% 7.2 (5) 12.8 (8) 9.5 (6) -71%
WY08 (Dry) 183 7.20 -27% 13.3 (9) 25.0 (16) 18.2 (12) -43%
WY09 (Below Normal) 232 9.15 -7% 15.0 (10) 27.2 (18) 20.1 (13) -38%
WY10 (Normal) 282 11.1 13% 25.1 (16) 42.5 (27) 32.4 (21) 0%
WY11 (Above Normal) 323 12.7 29% 43.3 (28) 61.9 (40) 46.9 (30) 52%
WY12 (Dry) 201 7.91 -20% 11.9 (8) 18.9 (12) 14.9 (10) -52%
WY13 (Very Dry) 166 6.55 -33% 8.1 (5) 10.7 (7) 9.1 (6) -71%
WY14 (Very Dry) 129 5.06 -49% 4.3 (3) 6.1 (4) 5.1 (3) -84%
WY15 (Above Normal) 302 11.91 21% 7.1 (5) 15.2 (10) 10.5 (7) -67%
WY16 (Dry) 200 7.88 -20% 14.3 ( ) 24.2 ( ) 18.5 ( ) -%
12-yr Average (05-16) 237 9.33 -2% 18.0 (12) 30.2 (20) 22.5 (15) -23%
103-yr Average 252 9.92 0% 25/(16) 39/(25) 32/(21) 0%
SDRPF - RiverWatch ! November 2016 15

Lower San Diego River WY16 Water Quality Monitoring Report Appendices
SDRPF - RiverWatch ! November 201616
22.6
6.0
3.9
7.2
9.2
10.6
12.7
7.9
6.6
5.1
11.9
8.2
9.3
0
2
4
6
8
10
12
14
16
18
20
22
24
0
1
10
100
1000
WY05 WY06 WY07 WY08 WY09 WY10 WY11 WY12 WY13 WY14 WY15 WY16 12-Yr Norms
An
nu
al R
ain
fall,
inch
es
Avera
ge D
aily F
low
, cf
s
Chart F.3 - LSDR Streamflow and Rainfall by Water Year
Total Annual Rainfall
West(MV) AADF
East(SB) AADF
Winter ADF (west)
Winter ADF (east)
Summer ADF (west)
Summer ADF (east)
23 25
54
37 41
24
13 11
0.4
3.9
0.2
4.0
24
39
12
2
20
6
38
12
0
25 33
13
2
22 17
7
0.5
11
0
1
10
100
0
1
10
100
Oct Nov Dec Jan Feb Mar Apr May Jun Jul Aug Sep Fall Winter Spring Summer Annual Average
Mo
nth
ly R
ain
fall,
mm
Avera
ge D
aily F
low
, cf
s
Chart F.2 - LSDR Monthly Streamflow and Monthly Rainfall (WY16, WY14, WY05 & 12-yr Norms)
Mo Rainfall (WY05)
Mo Rainfall (12-Yr)
WY16 Mo Rainfall
Mo Rainfall (WY14)
WY16 ADF
Lo ADF (WY14)
Hi ADF (WY05)
12-Yr AADF
0
20
40
60
80
100
120
140
160
0
0
1
10
100
1,000
10,000
O D F A J A O D F A J A O D F A J A O D F A J A O D F A J A O D F A J A O D F A J A O D F A J A O D F A J A O D F A J A O D F A J A O D F A J A
WY05 WY06 WY07 WY08 WY09 WY10 WY11 WY12 WY13 WY14 WY15 WY16
Rain
fall,
mm
/m
o
Avera
ge D
aily F
low
, cf
s Chart F.1 - LSDR Average Daily Flow and Monthly Rainfall (Oct 2004 - Present)
Rainfall, mm/mo Mission Valley ADF, cfs Santee Basin ADF, cfs Max Day Min Day MV Trendline (12 mo Mov Avg) SB Trendline (12mo Mov Avg)
Lower San Diego River WY16 Water Quality Monitoring Report Appendices
Appendix G - LSDR Monthly WQM Site Data
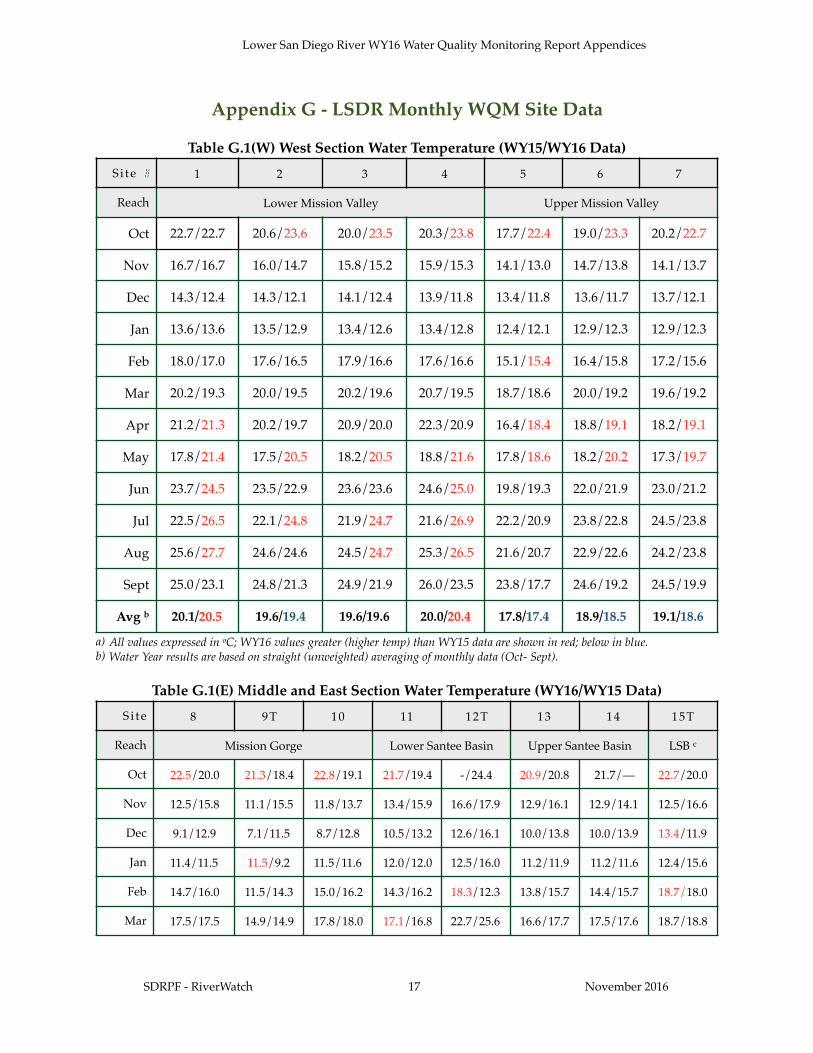
Table G.1(W) West Section Water Temperature (WY15/WY16 Data)
a) All values expressed in oC; WY16 values greater (higher temp) than WY15 data are shown in red; below in blue.b) Water Year results are based on straight (unweighted) averaging of monthly data (Oct- Sept).
Table G.1(E) Middle and East Section Water Temperature (WY16/WY15 Data)
Si te # 1 2 3 4 5 6 7
Reach Lower Mission Valley Upper Mission Valley
Oct 22.7/22.7 20.6/23.6 20.0/23.5 20.3/23.8 17.7/22.4 19.0/23.3 20.2/22.7
Nov 16.7/16.7 16.0/14.7 15.8/15.2 15.9/15.3 14.1/13.0 14.7/13.8 14.1/13.7
Dec 14.3/12.4 14.3/12.1 14.1/12.4 13.9/11.8 13.4/11.8 13.6/11.7 13.7/12.1
Jan 13.6/13.6 13.5/12.9 13.4/12.6 13.4/12.8 12.4/12.1 12.9/12.3 12.9/12.3
Feb 18.0/17.0 17.6/16.5 17.9/16.6 17.6/16.6 15.1/15.4 16.4/15.8 17.2/15.6
Mar 20.2/19.3 20.0/19.5 20.2/19.6 20.7/19.5 18.7/18.6 20.0/19.2 19.6/19.2
Apr 21.2/21.3 20.2/19.7 20.9/20.0 22.3/20.9 16.4/18.4 18.8/19.1 18.2/19.1
May 17.8/21.4 17.5/20.5 18.2/20.5 18.8/21.6 17.8/18.6 18.2/20.2 17.3/19.7
Jun 23.7/24.5 23.5/22.9 23.6/23.6 24.6/25.0 19.8/19.3 22.0/21.9 23.0/21.2
Jul 22.5/26.5 22.1/24.8 21.9/24.7 21.6/26.9 22.2/20.9 23.8/22.8 24.5/23.8
Aug 25.6/27.7 24.6/24.6 24.5/24.7 25.3/26.5 21.6/20.7 22.9/22.6 24.2/23.8
Sept 25.0/23.1 24.8/21.3 24.9/21.9 26.0/23.5 23.8/17.7 24.6/19.2 24.5/19.9
Avg b 20.1/20.5 19.6/19.4 19.6/19.6 20.0/20.4 17.8/17.4 18.9/18.5 19.1/18.6
Si te 8 9T 10 11 12T 13 14 15T
Reach Mission Gorge Lower Santee Basin Upper Santee Basin LSB c
Oct 22.5/20.0 21.3/18.4 22.8/19.1 21.7/19.4 -/24.4 20.9/20.8 21.7/— 22.7/20.0
Nov 12.5/15.8 11.1/15.5 11.8/13.7 13.4/15.9 16.6/17.9 12.9/16.1 12.9/14.1 12.5/16.6
Dec 9.1/12.9 7.1/11.5 8.7/12.8 10.5/13.2 12.6/16.1 10.0/13.8 10.0/13.9 13.4/11.9
Jan 11.4/11.5 11.5/9.2 11.5/11.6 12.0/12.0 12.5/16.0 11.2/11.9 11.2/11.6 12.4/15.6
Feb 14.7/16.0 11.5/14.3 15.0/16.2 14.3/16.2 18.3/12.3 13.8/15.7 14.4/15.7 18.7/18.0
Mar 17.5/17.5 14.9/14.9 17.8/18.0 17.1/16.8 22.7/25.6 16.6/17.7 17.5/17.6 18.7/18.8
SDRPF - RiverWatch ! November 201617

Lower San Diego River WY16 Water Quality Monitoring Report Appendices
a) All values expressed in oC; WY16 values greater (higher) than WY15 data are shown in red; below in blue.b) Water year (WY16/WY15) average values are based on straight (unweighted) averaging monthly data (Oct-Sept).c) Forester Creek discharges within the Lower Santee Basin reach downstream of Carlton Hills Golf course.
Table G.2(W) West Section Specific Conductivity (WY16/WY15 Data)
a) All values expressed in milli-Siemens/cm; WY16 values greater than WY15 results are in red.b) Water Year 2016/2015 values are based on averaging monthly data (Oct-Sept).
Apr 18.0/16.6 14.2/12.4 18.7/17.6 16.6/15.6 -/- 18.7/17.7 18.0/14.6 19.1/19.5
May 19.6/18.0 17.4/15.6 20.8/18.3 18.5/17.5 -/22.9 19.7/18.6 19.2/18.9 20.2/17.7
Jun 20.0/21.0 16.2/17.3 21.6/22.8 18.3/19.6 -/- 21.4/22.4 18.9/19.0 21.0/23.1
Jul 22.4/22.5 20.9/19.9 24.9/23.8 20.7/20.3 -/27.7 24.2/23.3 20.1/18.7 26.3/26.3
Aug 23.5/23.6 20.6/21.1 25.5/24.4 20.9/21.4 -/27.0 23.3/24.6 -/20.4 24.5/26.7
Sep 20.0/22.6 13.8/18.7 19.7/22.6 19.2/21.3 -/- 19.9/22.7 -/23.3 20.1/26.5
Avg b 17.6/18.2 15.0/15.7 18.2/18.4 16.9/17.4 16.5/21.1 17.7/18.8 16.3/17.1 19.1/20.1
Si te 8 9T 10 11 12T 13 14 15T
Si te # 1 2 3 4 5 6 7
Reach Lower Mission Valley Upper Mission Valley
Oct 15.4/24.0 2.06/3.27 1.85/2.63 1.78/2.30 2.81/3.83 2.10/4.47 2.39/3.17
Nov 10.3/21.4 2.24/2.76 2.13/2.33 2.26/2.43 2.24/2.73 1.80/3.86 1.73/3.13
Dec 2.26/2.57 1.63/1.26 1.68/1.23 1.82/1.23 1.61/1.18 2.19/0.82 1.91/0.86
Jan 1.57/2.22 1.51/1.93 1.48/1.97 1.54/2.02 1.48/1.89 1.47/1.70 1.59/1.60
Feb 7.70/5.97 2.21/2.79 2.15/2.73 2.12/2.66 2.10/0.81 2.12/2.22 2.15/2.64
Mar 1.80/6.25 1.67/1.84 1.65/1.75 1.69/1.75 1.67/1.95 1.52/1.67 1.56/1.95
Apr 1.88/22.8 1.80/2.74 1.83/2.65 1.89/2.66 1.77/2.97 1.57/2.45 1.48/2.65
May 3.22/0.86 2.31/0.94 2.24/1.41 2.29/1.84 2.36/1.54 2.04/1.45 2.01/1.02
Jun 10.2/5.43 3.04/2.63 2.94/2.53 2.99/2.44 3.07/3.13 2.41/2.02 3.13/2.69
Jul 12.3/1.18 3.58/1.09 3.54/0.78 3.67/0.53 3.75/2.00 2.89/2.23 3.35/2.47
Aug 32.0/8.01 3.84/2.63 3.77/2.44 3.85/2.30 4.07/3.05 3.42/1.78 3.09/2.98
Sep 44.3/1.22 4.07/0.98 4.16/1.04 3.80/1.09 4.17/2.29 3.81/2.10 3.09/1.58
Avg b 11.9/8.50 2.50/2.07 2.45/1.96 2.48/1.94 2.59/2.28 2.28/2.23 2.29/2.23
SDRPF - RiverWatch ! November 201618
Lower San Diego River WY16 Water Quality Monitoring Report Appendices
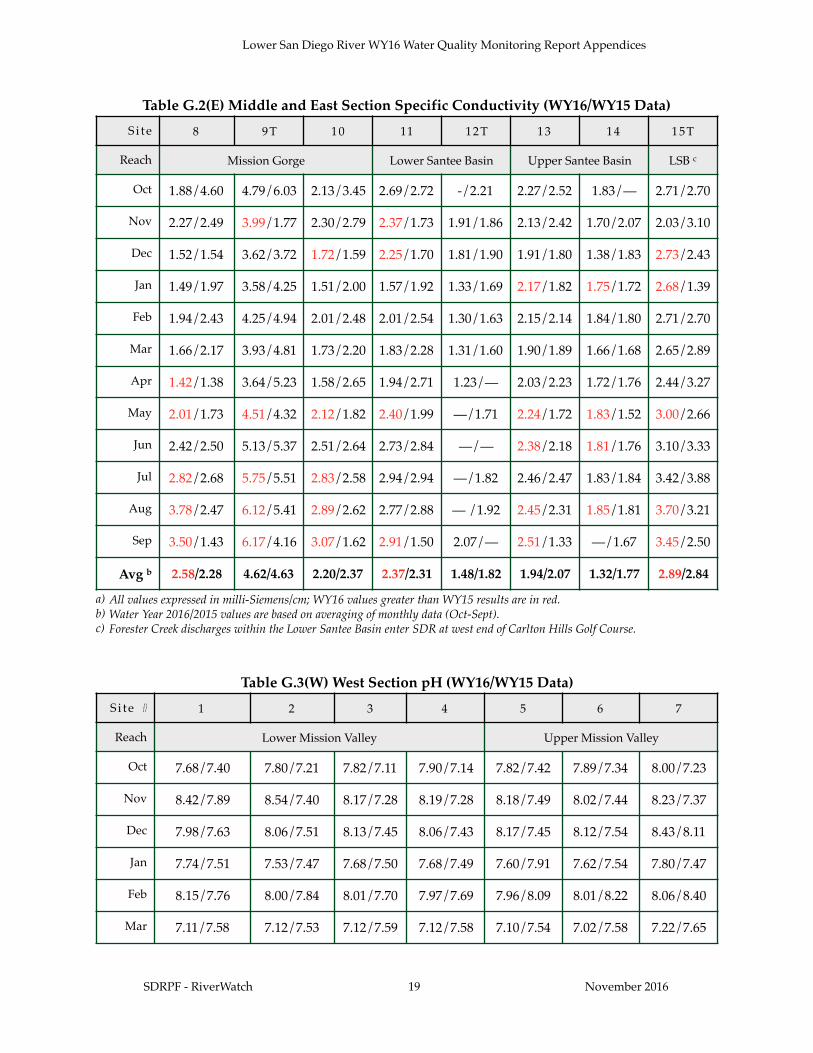
Table G.2(E) Middle and East Section Specific Conductivity (WY16/WY15 Data)
a) All values expressed in milli-Siemens/cm; WY16 values greater than WY15 results are in red.b) Water Year 2016/2015 values are based on averaging of monthly data (Oct-Sept).c) Forester Creek discharges within the Lower Santee Basin enter SDR at west end of Carlton Hills Golf Course.
Table G.3(W) West Section pH (WY16/WY15 Data)
Si te 8 9T 10 11 12T 13 14 15T
Reach Mission Gorge Lower Santee Basin Upper Santee Basin LSB c
Oct 1.88/4.60 4.79/6.03 2.13/3.45 2.69/2.72 -/2.21 2.27/2.52 1.83/— 2.71/2.70
Nov 2.27/2.49 3.99/1.77 2.30/2.79 2.37/1.73 1.91/1.86 2.13/2.42 1.70/2.07 2.03/3.10
Dec 1.52/1.54 3.62/3.72 1.72/1.59 2.25/1.70 1.81/1.90 1.91/1.80 1.38/1.83 2.73/2.43
Jan 1.49/1.97 3.58/4.25 1.51/2.00 1.57/1.92 1.33/1.69 2.17/1.82 1.75/1.72 2.68/1.39
Feb 1.94/2.43 4.25/4.94 2.01/2.48 2.01/2.54 1.30/1.63 2.15/2.14 1.84/1.80 2.71/2.70
Mar 1.66/2.17 3.93/4.81 1.73/2.20 1.83/2.28 1.31/1.60 1.90/1.89 1.66/1.68 2.65/2.89
Apr 1.42/1.38 3.64/5.23 1.58/2.65 1.94/2.71 1.23/— 2.03/2.23 1.72/1.76 2.44/3.27
May 2.01/1.73 4.51/4.32 2.12/1.82 2.40/1.99 —/1.71 2.24/1.72 1.83/1.52 3.00/2.66
Jun 2.42/2.50 5.13/5.37 2.51/2.64 2.73/2.84 —/— 2.38/2.18 1.81/1.76 3.10/3.33
Jul 2.82/2.68 5.75/5.51 2.83/2.58 2.94/2.94 —/1.82 2.46/2.47 1.83/1.84 3.42/3.88
Aug 3.78/2.47 6.12/5.41 2.89/2.62 2.77/2.88 — /1.92 2.45/2.31 1.85/1.81 3.70/3.21
Sep 3.50/1.43 6.17/4.16 3.07/1.62 2.91/1.50 2.07/— 2.51/1.33 —/1.67 3.45/2.50
Avg b 2.58/2.28 4.62/4.63 2.20/2.37 2.37/2.31 1.48/1.82 1.94/2.07 1.32/1.77 2.89/2.84
Si te # 1 2 3 4 5 6 7
Reach Lower Mission Valley Upper Mission Valley
Oct 7.68/7.40 7.80/7.21 7.82/7.11 7.90/7.14 7.82/7.42 7.89/7.34 8.00/7.23
Nov 8.42/7.89 8.54/7.40 8.17/7.28 8.19/7.28 8.18/7.49 8.02/7.44 8.23/7.37
Dec 7.98/7.63 8.06/7.51 8.13/7.45 8.06/7.43 8.17/7.45 8.12/7.54 8.43/8.11
Jan 7.74/7.51 7.53/7.47 7.68/7.50 7.68/7.49 7.60/7.91 7.62/7.54 7.80/7.47
Feb 8.15/7.76 8.00/7.84 8.01/7.70 7.97/7.69 7.96/8.09 8.01/8.22 8.06/8.40
Mar 7.11/7.58 7.12/7.53 7.12/7.59 7.12/7.58 7.10/7.54 7.02/7.58 7.22/7.65
SDRPF - RiverWatch ! November 201619

Lower San Diego River WY16 Water Quality Monitoring Report Appendices
a) All values are unit-less. b) Water Year 2016/2015 based on averaging monthly results (Oct-Sept).
Table G.3(E) Middle and East Section pH (WY16/WY15 Data)
a) All values are unit-less.b) Water Year 2016/2015 values are based on averaging of monthly data (Oct-Sept).c) Forester Creek discharges within the Lower Santee Basin reach just upstream of Carlton Oaks Golf course.
Apr 7.40/7.62 7.42/7.89 7.57/7.92 7.78/7.82 7.19/7.73 7.21/7.79 7.23/7.45
May 8.39/8.03 7.76/7.92 7.97/8.08 8.23/7.78 7.48/7.79 7.56/7.84 7.44/8.02
Jun 7.91/7.94 7.63/8.02 7.77/8.03 7.82/7.92 7.47/7.73 7.49/7.86 7.34/8.23
Jul 7.97/7.87 7.61/7.56 7.71/7.86 7.78/8.21 7.36/7.75 7.40/7.59 7.27/7.64
Aug 7.97/7.55 7.94/7.64 7.75/7.70 7.94/7.63 7.97/7.52 7.51/7.67 7.63/7.41
Sep 7.64/7.54 7.51/7.58 7.78/7.51 7.93/7.59 7.36/7.52 7.43/7.30 7.12/7.37
Avg b 7.86/7.69 7.74/7.63 7.79/7.64 7.87/7.63 7.64/7.66 7.61/7.64 7.65/7.70
Si te # 1 2 3 4 5 6 7
Si te 8 9T 10 11 12T 13 14 15T
Reach Mission Gorge Lower Santee Basin Upper Santee Basin LSB c
Oct 7.84/7.20 7.77/7.91 7.85/7.04 7.01/7.20 -/7.34 7.89/7.36 8.13/— 8.02/7.47
Nov 7.90/7.44 8.03/8.14 8.56/7.52 7.75/7.44 8.16/7.76 8.87/7.54 8.36/— 8.65/8.20
Dec 8.22/7.98 8.04/8.24 8.33/7.88 8.73/7.63 -/8.38 7.99/7.52 8.20/— 8.10/8.03
Jan 7.56/7.90 7.81/8.02 7.69/8.09 6.97/7.43 7.83/8.18 7.79/7.77 7.82/8.10 7.89/8.20
Feb 8.01/7.98 8.20/8.06 8.02/7.98 7.63/7.81 8.59/8.41 7.92/7.88 8.37/7.91 8.00/8.28
Mar 7.75/7.88 8.09/8.02 7.38/7.98 7.33/7.52 7.60/8.19 7.11/7.85 7.14/8.03 7.62/7.99
Apr 7.71/7.65 8.08/7.78 7.33/7.96 7.70/7.93 7.42/— 7.03/7.65 7.16/7.91 7.52/8.29
May 7.92/8.31 8.12/8.07 7.80/8.26 7.58/8.33 —/8.41 7.27/8.06 7.62/8.21 7.70/8.08
Jun 7.70/8.04 8.06/8.01 7.96/8.13 7.55/8.37 —/— 7.49/8.10 7.73/8.34 7.60/8.19
Jul 7.04/7.66 7.90/7.55 7.89/8.02 7.46/7.33 —/8.30 7.31/7.84 7.61/8.09 7.59/8.01
Aug 7.46/7.31 7.57/7.38 8.13/7.76 7.39/7.29 —/8.03 7.39/7.71 -/7.96 7.50/7.77
Sep 7.50/7.77 7.95/7.64 8.13/7.92 7.12/7.77 —/— 7.38/7.76 --/7.82 8.02/7.90
Avg b 7.72/7.76 7.97/7.90 7.92/7.88 7.52/7.67 8.00/8.11 7.62/7.75 7.81/8.04 7.85/8.03
SDRPF - RiverWatch ! November 201620

Lower San Diego River WY16 Water Quality Monitoring Report Appendices
Table G.4(W) West Section Dissolved Oxygen (WY16/WY15 Data)
a) All values expressed in milligrams/liter; WY16 /WY15 values less than 4 mg/L shown in red.
Table G.4(E) Middle and East Section Dissolved Oxygen (WY16/WY15 Data)
Si te # 1 2 3 4 5 6 7
Reach Lower Mission Valley Upper Mission Valley
Oct 1.93/3.23 0.62/1.29 0.78/0.41 0.57/0.09 0.38/2.29 0.08/0.81 0.99/2.79
Nov 6.70/3.55 6.87/2.57 2.74/0.10 4.31/0.08 4.35/2.88 0.56/0.33 4.14/4.45
Dec 5.94/6.23 5.88/4.30 6.19/3.32 6.75/4.35 5.34/4.06 2.37/3.19 7.62/5.98
Jan 7.53/6.28 7.42/5.51 7.34/4.36 6.69/4.99 7.75/5.20 6.02/3.61 8.68/6.31
Feb 5.95/5.44 5.87/5.00 6.34/3.29 5.96/3.29 4.51/4.80 2.68/0.71 6.59/3.13
Mar 3.86/5.26 4.19/4.33 4.30/2.32 4.76/3.14 3.47/2.99 2.30/1.19 4.98/3.17
Apr 10.10/6.62 9.28/3.36 7.93/2.46 11.51/4.97 4.63/3.19 5.44/1.45 6.19/3.72
May 10.57/4.73 6.75/6.87 4.49/5.78 9.25/6.11 2.20/6.84 3.15/5.41 2.35/11.14
Jun 6.26/6.82 2.84/1.70 1.70/3.27 3.91/6.51 1.15/1.02 0.11/3.71 2.69/6.05
Jul 9.56/1.85 3.34/1.74 1.99/1.64 3.51/1.37 1.14/1.60 0.67/0.13 2.00/4.12
Aug 5.49/4.25 1.88/0.64 3.26/1.23 3.88/1.01 1.06/0.47 0.74/0.33 1.41/2.19
Sep 3.90/2.13 1.77/1.70 2.35/0.18 6.36/0.91 1.18/0.44 0.14/0.25 2.32/1.22
Avg b 6.48/4.70 4.73/3.25 4.12/2.36 5.62/3.07 3.10/2.98 2.02/1.76 4.16/4.52
Si te 8 9T 10 11 12T 13 14 15T
Reach Mission Gorge Lower Santee Basin Upper Santee Basin LSB c
Oct 4.75/4.72 7.19/8.05 4.89/0.07 3.00/2.89 -/3.37 0.14/3.06 5.88/— 4.31/1.86
Nov 9.29/3.87 12.5/9.77 9.43/8.68 6.34/6.36 8.42/5.81 0.07/0.14 2.98/4.23 6.77/6.00
Dec 11.0/9.83 11.6/10.58 8.94/7.73 7.65/6.50 8.05/10.58 1.36/0.33 4.27/2.58 7.47/9.59
Jan 11.3/10.17 11.7/11.03 8.63/9.30 7.71/7.67 9.52/9,08 3.54/1.45 3.13/4.04 7.66/13.04
Feb 7.69/7.32 11.3/9.20 6.85/7.66 7.00/5.97 9.89/9.12 2.58/2.52 2.58/1.87 6.35/11.56
Mar 8.29/7.32 10.13/9.04 6.22/7.83 5.63/5.46 5.79/7.62 0.36/1.04 1.55/2.03 5.37/9.48
Apr 8.75/6.98 11.6/11.72 6.06/8.43 5.92/5.75 6.21/— 1.39/2.80 0.66/3.20 5.73/11.40
May 7.38/11.24 8.42/8.96 6.25/9.21 8.92/11.39 —/10.93 0.15/2.15 1.92/2.44 5.51/6.01
SDRPF - RiverWatch ! November 201621

Lower San Diego River WY16 Water Quality Monitoring Report Appendices
a) All values expressed in milligrams/liter; WY14/WY15 values less than 4 mg/L are expressed in red.b) WY16/15 values are based on averaging of monthly data (Oct-Sept).c) Tributary discharges within the Lower Santee Basin reach enter at west end of Carlton Oaks Golf Course.
Table G.5(W) West Section DO Percent Saturation (WY15/WY16 Data)
a) All values expressed in percent; WY16/15 values less than 12-yr monthly norms (in parentheses) are expressed in red.b) Water Year values are based on averaging of monthly data (Oct- Sept).
Jun 5.57/6.41 9.28/13.55 7.95/8.19 4.37/7.54 —/— 4.73/3.24 0.97/2.50 5.48/9.44
Jul 1.17/2.13 8.18/8.15 5.69/5.33 3.96/3.31 —/6.56 1.79/1.60 1.09/3.15 3.64/8.72
Aug 0.80/0.36 7.92/8.46 4.25/5.08 2.88/3.43 —/8.20 0.14/1.16 -/3.24 3.20/9.42
Sep 2.12/5.68 10.18/8.15 2.29/7.14 3.76/7.49 —/— 0.18/0.33 —/1.77 3.70/9.52
Avg b 6.51/6.34 10.0/9.72 6.45/7.06 5.59/6.15 7.98/7.92 1.37/1.65 2.50/2.82 5.43/5.64
Si te 8 9T 10 11 12T 13 14 15T
Si te # 1 2 3 4 5 6 7
Reach Lower Mission Valley Upper Mission Valley
Oct 38/23 15/7 5/9 1/7 24/4 9/1 31/12
Nov 37/70 26/69 1/28 1/44 28/42 3/5 44/40
Dec 62/56 43/55 33/59 43/63 39/50 31/22 58/72
Jan 61/73 54/71 42/70 48/64 49/73 35/57 60/82
Feb 58/62 53/61 35/66 35/62 48/46 7/27 33/67
Mar 59/42 48/46 26/48 35/53 32/38 13/25 35/55
Apr 76/116 38/103 28/89 58/131 33/50 16/60 40/68
May 50/121 73/76 62/51 67/106 73/24 58/35 118/26
Jun 82/76 20/33 39/20 79/48 11/13 43/1 71/31
Jul 22/120 20/41 19/24 16/44 19/13 2/8 50/24
Aug 52/70 8/23 15/40 12/49 5/12 4/9 26/17
Sep 26/46 21/20 2/27 11/76 5/13 3/2 15/26
Avg b 52/73 (66) 35/50 (48) 26/44 (49) 34/62 (67) 31/33 (49) 19/21 (38) 49/43 (51)
SDRPF - RiverWatch ! November 201622

Lower San Diego River WY16 Water Quality Monitoring Report Appendices
Table G.5(E) Middle and East Section DO Percent Saturation (WY16/WY15)
a) All values expressed as percent; WY15/WY16 values less than 12-yr norms are shown in red.b) Water Year 2016/2015 values are based on averaging of monthly (Oct-Sept) data.c) Tributary discharges within the Lower Santee Basin enter SDR at west end of Carlton Oaks golf course.
Si te 8 9T 10 11 12T 13 14 15T
Reach Mission Gorge Lower Santee Basin Upper Santee Basin LSB c
Oct 56/53 82/87 58/1 35/32 -/41 2/35 68/- 72/21
Nov 88/40 115/99 88/85 61/65 88/62 1/1 28/42 84/62
Dec 97/94 97/98 78/74 69/63 77/109 12/3 38/25 123/90
Jan 105/94 108/97 80/86 72/72 90/93 33/14 29/38 104/133
Feb 77/75 105/91 69/79 69/62 107/86 26/26 26/19 114/124
Mar 88/78 102/91 66/84 59/57 68/94 4/11 16/22 103/103
Apr 94/73 115/111 66/90 62/58 69/- 15/30 7/32 87/126
May 82/120 89/91 71/99 96/121 -/129 2/23 21/27 85/64
Jun 62/73 96/143 92/96 47/83 -/- 54/38 11/27 72/112
Jul 14/25 93/91 70/64 45/37 -/84 21/19 12/34 103/109
Aug 10/4 89/96 52/62 33/39 -/104 2/14 -/36 79/119
Sep 24/67 100/89 25/84 41/86 -/- 2/4 -/21 129/119
Avg b 66/66(78) 99/99(92) 68/75(75) 58/65(61) 83/89(72) 14/18(33) 26/29(33) 96/97(75)
SDRPF - RiverWatch ! November 201623
Lower San Diego River WY16 Water Quality Monitoring Report Appendices
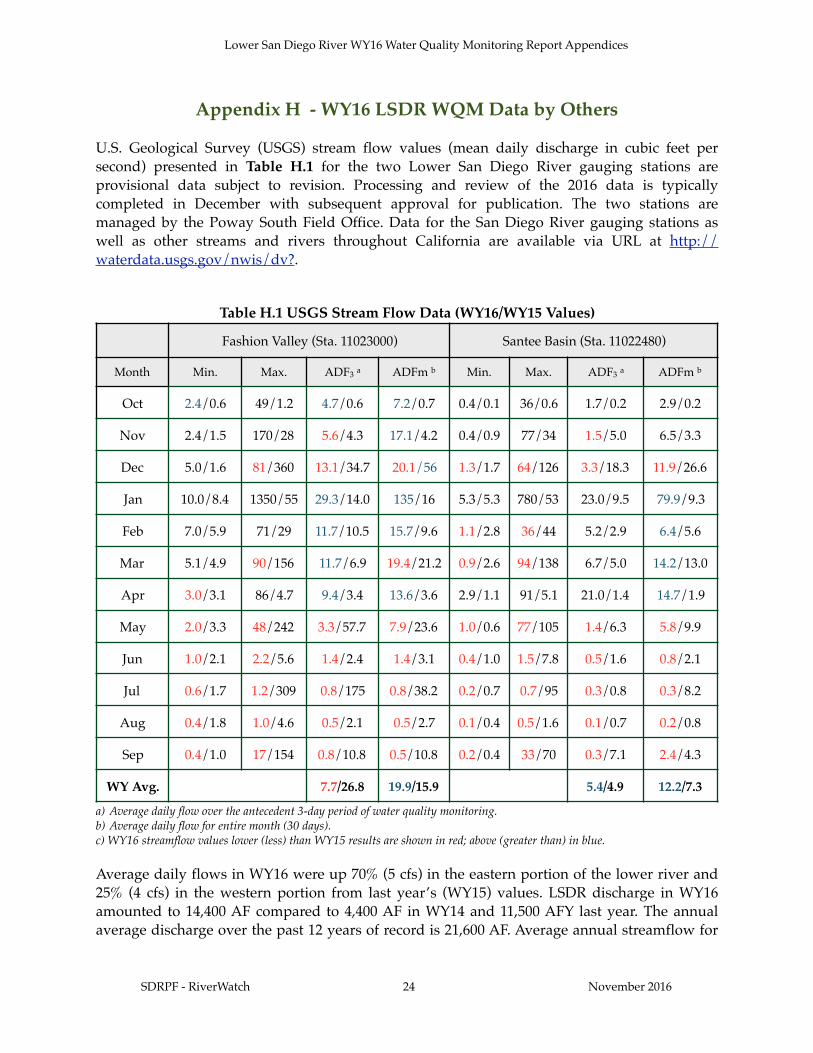
Appendix H - WY16 LSDR WQM Data by Others
U.S. Geological Survey (USGS) stream flow values (mean daily discharge in cubic feet per second) presented in Table H.1 for the two Lower San Diego River gauging stations are provisional data subject to revision. Processing and review of the 2016 data is typically completed in December with subsequent approval for publication. The two stations are managed by the Poway South Field Office. Data for the San Diego River gauging stations as well as other streams and rivers throughout California are available via URL at http://waterdata.usgs.gov/nwis/dv?.
Table H.1 USGS Stream Flow Data (WY16/WY15 Values)
a) Average daily flow over the antecedent 3-day period of water quality monitoring.b) Average daily flow for entire month (30 days).c) WY16 streamflow values lower (less) than WY15 results are shown in red; above (greater than) in blue.
Average daily flows in WY16 were up 70% (5 cfs) in the eastern portion of the lower river and 25% (4 cfs) in the western portion from last year’s (WY15) values. LSDR discharge in WY16 amounted to 14,400 AF compared to 4,400 AF in WY14 and 11,500 AFY last year. The annual average discharge over the past 12 years of record is 21,600 AF. Average annual streamflow for
Fashion Valley (Sta. 11023000) Santee Basin (Sta. 11022480)
Month Min. Max. ADF3 a ADFm b Min. Max. ADF3 a ADFm b
Oct 2.4/0.6 49/1.2 4.7/0.6 7.2/0.7 0.4/0.1 36/0.6 1.7/0.2 2.9/0.2
Nov 2.4/1.5 170/28 5.6/4.3 17.1/4.2 0.4/0.9 77/34 1.5/5.0 6.5/3.3
Dec 5.0/1.6 81/360 13.1/34.7 20.1/56 1.3/1.7 64/126 3.3/18.3 11.9/26.6
Jan 10.0/8.4 1350/55 29.3/14.0 135/16 5.3/5.3 780/53 23.0/9.5 79.9/9.3
Feb 7.0/5.9 71/29 11.7/10.5 15.7/9.6 1.1/2.8 36/44 5.2/2.9 6.4/5.6
Mar 5.1/4.9 90/156 11.7/6.9 19.4/21.2 0.9/2.6 94/138 6.7/5.0 14.2/13.0
Apr 3.0/3.1 86/4.7 9.4/3.4 13.6/3.6 2.9/1.1 91/5.1 21.0/1.4 14.7/1.9
May 2.0/3.3 48/242 3.3/57.7 7.9/23.6 1.0/0.6 77/105 1.4/6.3 5.8/9.9
Jun 1.0/2.1 2.2/5.6 1.4/2.4 1.4/3.1 0.4/1.0 1.5/7.8 0.5/1.6 0.8/2.1
Jul 0.6/1.7 1.2/309 0.8/175 0.8/38.2 0.2/0.7 0.7/95 0.3/0.8 0.3/8.2
Aug 0.4/1.8 1.0/4.6 0.5/2.1 0.5/2.7 0.1/0.4 0.5/1.6 0.1/0.7 0.2/0.8
Sep 0.4/1.0 17/154 0.8/10.8 0.5/10.8 0.2/0.4 33/70 0.3/7.1 2.4/4.3
WY Avg. 7.7/26.8 19.9/15.9 5.4/4.9 12.2/7.3
SDRPF - RiverWatch ! November 201624

Lower San Diego River WY16 Water Quality Monitoring Report Appendices
WY16 amounted to 42% of the 52-year mean flow for LSDR. The summer season (June-Sept) of this year represented one of the lowest periods of continuous dry weather flow recorded at Fashion Valley in the past several decades.
San Diego CoastKeeper (SDCK) coliform count values (in MPN/100 mL) from the organization’s two San Diego River monitoring stations for WY16 and WY15 are presented in Table H.2. Sampling results from 2009 through April 2016 for seven San Diego area watersheds, including the lower San Diego River (HSU 907.1), can be accessed via the organization’s URL website at http://www.sdcoastkeeper.org/learn/swimmable/san-diego-water-quality.html.
Table H.2 San Diego CoastKeeper Coliform Count Data (WY16/WY15 Values)
a) Escherichia-coli (E.coli) bacteria expressed in MPN/100mLb) Enterococcus (faecalis) bacteria expressed in MPN/100mLc) Total Coliform bacteria (common) expressed in MPN/100mL.d) WY16 values greater than WY15 counts are shown in red; less in blue.e) May through September 2016 coliform count data for SDR sites unavailable.
Fashion Valley Road (SDG-010) Old Mission Historical Dam (SDG-020)
Month EColi (a) Enterocc (b) TCB (c) EColi (a) Enterocc (b) TCB (c)
Oct 109/213 95/108 1565/1423 30/10 305/132 708/301
Nov 41/1236 146/345 496/19863 31/98 31/52 288/3076
Dec 1017/4352 3555/6488 24192/24192 12033/4352 14136/6488 24192/24192
Jan 134/4350 52/2750 1850/120331 86/10 109/52 2035/2310
Feb 20/20 20/63 2489/3130 20/31 30/63 3255/836
Mar 10/41 10/41 1137/867 31/41 20/63 504/980
Apr 85/253 386/52 7215/1515 41/52 20/30 2310/784
May -/1850 -/2909 -/3448 -/20 -/74 -/657
June -/134 -/160 -/3654 -/1130 -/3076 -/24192
July -/- -/- -/- -/20 -/31 -/2142
Aug -/63 -/20 -/2014 -/20 -/10 -/1067
Sept -/318 -/805 -/9804 -/134 -/51 -/2310
WY Avg. -/1361 -/1496 -/7295 -/537 -/915 -/5503
Summer -/172 -/328 -/5157 -/326 -/792 -/7428
Winter 295/2191 909/2336 7417/37130 3574/1109 3574/1667 7497/7080
SDRPF - RiverWatch ! November 201625

Lower San Diego River WY16 Water Quality Monitoring Report Appendices
Appendix I - Water Quality Indexing Decision-makers, many water managers, vested watershed stakeholders as well as the general public often have neither the time nor training to thoroughly study and fully understand detailed technical assessments of water quality data. Over the decades numerous indexes have been developed to summarize water quality data in an easily expressed and readily understood format. Although water quality professionals are often resistant to automated, uncritical summaries represented by such indexes; there are good reasons to use such results with caution. Scientists and water resource professionals sometimes prefer to provide no answer rather than an imperfect response that can lead to misunderstanding. Layman and many decision makers, however, would prefer an imperfect answer to no answer at all. Using an index may not be the optimal way to fully understand large-scale water quality issues, but it does provide a reasonable tool for gaining insight. Many experts appreciate the need for imperfect answers and conversely others recognize and accept an answer’s limitations.
Water quality indexing was first proposed and demonstrated in the 1970s, however, prior to the personal computer, calculations were fairly labor-intensive so the technique was not widely used or accepted by many monitoring agencies. As use and limitations were commonly misunderstood, the potential of using an index for communicating water quality status and trends was often overlooked. Evaluation of water quality in terms of raw data can be very misleading and confusing not only for the layman but also to stakeholders with diverse and sometimes conflicting perspectives. It is typically difficult for individuals interested in water quality to interpret reams of raw data in order to gain a better understanding of water quality conditions. This quest often results in faulty conclusions regarding water quality status and watershed management practices. An index is simply an attempt to integrate complex analytical data and generate a single number (or letter) expressing the relative degree of impairment of a water body at a given point in time or given locale. The underlying objective of the exercise is to enhance communications with the general public, interested stakeholders, public agencies and increase citizen awareness of water quality conditions.
By design indexes contain less information than the raw data they summarize; many uses of water quality data cannot be met with an index. An index is generally most useful for comparative purposes (e.g., what river sites or reaches have particularly poor water quality?) and for temporal questions (e.g., how is the water quality at present relative to what is has been in the past?). Indexes are less suited to specific questions. Site-specific decisions need to be based on analysis of original water quality data. Basically, an index can be a useful tool for “communicating water quality information to the lay public and to legislative decision makers,” it is not, however “a complex predictive model for technical and scientific application”. This index was developed as a mechanism to summarize and report routine monitoring data to interested parties. SDRPF’s RiverWatch team does not monitor biological constituents or toxic substances, thus issues related to public health, body contact recreation and aquatic life are not effectively addressed by the index.
Besides being general in nature (i.e., imprecise), there are several reasons that an index may fail to accurately communicate water quality information. First, most indexes are based on pre-identified sets of water quality constituents. For example, a specific site may show a good. WQI score, and yet have water quality impaired by other constituents not included in the
SDRPF - RiverWatch ! November 201626

Lower San Diego River WY16 Water Quality Monitoring Report Appendices
indexAnother reason, data aggregation can mask, normalize or over-emphasize short-term water quality issues. A satisfactory WQI at a particular site or reach does not necessarily mean that water quality is or always was satisfactory. A good score, however, does at least indicate that inferior water quality for those constituents evaluated is not chronic during the period included for the index.
The index has been developed for the purpose of providing a simple and concise expression of regularly monitored physical-chemical and bacteriological water quality data compiled by the SDRPF RiverWatch Team as well as several other monitoring groups; it is intended to aid in assessment of the Lower San Diego River watershed primarily for non-body contact recreational uses and environmental enhancement. It constitutes a mechanism to compare averages, variances and trends in normalized values over time (temporally) and by relative location (spatially) within the watershed. The index allows anyone to easily interpret large amounts of aggregated data and relate overall water quality variation to changes, be they from natural causes or man-made impairments. The WQI is used to identify general water quality trends over the past 8 years of monitoring and potential problem areas within the SDR watershed. Such patterns and locations can then be screened and evaluated in greater detail through direct observation of pertinent site-specific data by public agencies and water quality professionals entrusted with protection and enhancement. Used in this manner, the index provides a supplemental metric for evaluating effectiveness of the many San Diego River water quality improvement programs and also assist responsible agencies and organizations in establishing priorities for watershed management.
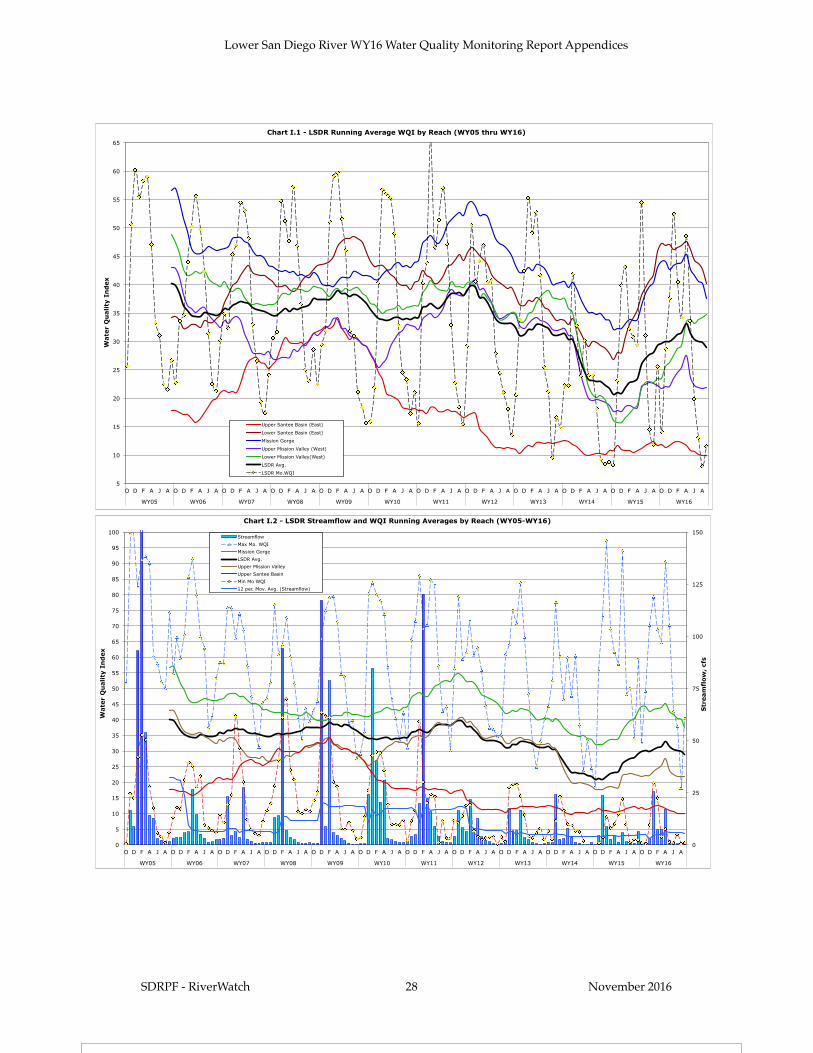
Running average LSDR WQI values from WY05 through WY16 are expressed by river reach and river section on Charts I.1 and I.2, respectively. Chart I.1 specifically presents overall LSDR monthly WQI values over the 12-year period. Cyclic seasonal patterns expressed in monthly results and trends described by running averages in WQI values are apparent for each reach of the river. Chart I.2 provides the range (max-min) in monthly WQI values, the running averages by river section as well as monthly streamflows over the 12 year monitoring period. The water quality fluctuations over time in individual reaches, sections and the overall (average) Lower San Diego River expressed on both running average and seasonal cycle bases can be observed. The Upper Santee Basin reach (Sites 13&14) demonstrates the lowest index values since March of 2010, whereas the Mission Gorge (middle section) reach consistently shows the highest index values. It can also be noted (in both charts) that there has been an overall decline in water quality of the river, as evidenced by the WQI values, beginning in 2012. The overall LSDR running (12-mo) average index value fell 19 points from a high of 40 (20% above the 12-yr norm) to 21 over a 24-month period. The current (Sept 31, 2016) running average WQI of 29, down one point from the start of the water year, is 13% below the 12-yr norm of 33 and trending downward.
Chart I.3 presents a temporal summary of variances in the water quality index values profiled on a monthly, seasonal and average annual water year basis for the five river reaches and the overall LSDR average. These variances can be visually compared to changes in streamflow on the same basis. The positive correlations are evident, i.e., increased average daily flow results in improved water quality. Low flow throughout the summer period results in poorest water quality. This year’s below average dry-weather flows extending from mid-May through mid-November resulted in a slight decline in overall water quality from WY15.
SDRPF - RiverWatch ! November 201627
Lower San Diego River WY16 Water Quality Monitoring Report Appendices
SDRPF - RiverWatch ! November 201628
Chart I.3 LSDR Temporal WQI Profiles and Streamflow
2
8
26 25
63
21
13
63 2 1 1
5
34
10
2
37
8 7
14
2016
23
106
14
4
69
12 12
97
10
12
10 9
1110
50
56
50
54
65
58
6563
626363
55
53
2727
32
39
36
32
47 46 47
4948
46
43
27
33
5151
21
191920
35 3533
32
22
38
41
38
363637
30
39
49
45
49
45
35
25
19
15
17
30
32
26
20
17
21
30
25
29
36
31
24
18
13
0
5
10
15
20
25
30
35
40
45
50
55
60
65
70
O N D J F M A M J J A S Fall Winter SpringSummer WY05 WY06 WY07 WY08 WY09 WY10 WY11 WY12 WY13 WY14
Wat
er Q
ual
ity
Index
0
10
20
30
40
50
60
70
80
90
100
Str
eam
flo
w,
cfs
Streamflow
Mission Gorge
Lower Santee Basin
Lower Mission Valley
LSDR
Upper Mission Valley
Upper Santee Basin
Chart I.4 LSDR Spatial WQI Profiles
38
34
39
28
1819
38
32
363434
32
47
44
52
88
5052
59
52
68
61
50 51
28
1516
22
16
24
17
12
17
24
19
13
28
26
14 15
31 3130
42
26
16
40
45
34
45
39 38
29
46
38
29
36
32
26
48 4847
2930
46
49
12
9 10
28
3332
27 28
0
5
10
15
20
25
30
35
40
45
50
55
60
65
70
75
1 2 3 4 5 6 7 8 9T 10 11 12T 15T 13 14
Est YMCA FVM FSDRIP Ward Kaiser ABF MT BC Seep OMD W.Hills CO/SLks ForCk Mast Pk RCP
Wate
r Q
uality
In
dex
10Yr Annual Norm
WY14 Annual Avg.
WY13 Annual Avg.
10Yr Winter Norm
10Yr Summer Norm
Very Good 75> 0Good 50-74 25Fair 38-49 26
Marginal 25-37 24Poor 13-24 25
Very Poor 0-12 0
100
5
10
15
20
25
30
35
40
45
50
55
60
65
O D F A J A O D F A J A O D F A J A O D F A J A O D F A J A O D F A J A O D F A J A O D F A J A O D F A J A O D F A J A O D F A J A O D F A J A
WY05 WY06 WY07 WY08 WY09 WY10 WY11 WY12 WY13 WY14 WY15 WY16
Wate
r Q
uality
In
dex
Chart I.1 - LSDR Running Average WQI by Reach (WY05 thru WY16)
Upper Santee Basin (East)
Lower Santee Basin (East)
Mission Gorge
Upper Mission Valley (West)
Lower Mission Valley(West)
LSDR Avg.
LSDR Mo.WQI
0
25
50
75
100
125
150
0
5
10
15
20
25
30
35
40
45
50
55
60
65
70
75
80
85
90
95
100
O D F A J A O D F A J A O D F A J A O D F A J A O D F A J A O D F A J A O D F A J A O D F A J A O D F A J A O D F A J A O D F A J A O D F A J A
WY05 WY06 WY07 WY08 WY09 WY10 WY11 WY12 WY13 WY14 WY15 WY16
Str
eam
flo
w,
cfs
Wate
r Q
uality
In
dex
Chart I.2 - LSDR Streamflow and WQI Running Averages by Reach (WY05-WY16)
Streamflow
Max Mo. WQI
Mission Gorge
LSDR Avg.
Upper Mission Valley
Upper Santee Basin
Min Mo WQI
12 per. Mov. Avg. (Streamflow)

Lower San Diego River WY16 Water Quality Monitoring Report Appendices
Chart I.4 provides a spatial profile of average annual WQI by river monitoring site, reach and section for this year (WY16), compared to the best year (WY05), the worst (WY14) and the 12-yr winter, summer and annual norms. The sites are in chronological order ascending upstream. The current (WY16) average annual WQI values for each site shown in black are above annual norms at two sites (15T and 12T) and considerably below the norms at ten other sites. The sites with poorest water quality for WY16 include Kaiser Ponds (6), Mast Park (13) and Cottonwood/RCP (14). For the fifth consecutive year, the Upper Santee Basin reach (Sites 13 & 14) has experienced the poorest water quality in the Lower SDR watershed. The Mission Gorge reach (sites 8, 9T and 10) continues to demonstrate best overall water quality.
SDRPF - RiverWatch ! November 201629
Very Good 75> 0Good 50-74 25Fair 38-49 26
Marginal 25-37 24Poor 13-24 25
Very Poor 0-12 0
100
5
10
15
20
25
30
35
40
45
50
55
60
65
O D F A J A O D F A J A O D F A J A O D F A J A O D F A J A O D F A J A O D F A J A O D F A J A O D F A J A O D F A J A O D F A J A
WY05 WY06 WY07 WY08 WY09 WY10 WY11 WY12 WY13 WY14 WY15
Wate
r Q
uality
In
dex
Chart I.1 - LSDR Running Average WQI by Reach (WY05 thru WY15)
Upper Santee Basin (East)
Lower Santee Basin (East)
Mission Gorge
Upper Mission Valley (West)
Lower Mission Valley(West)
LSDR Avg.
LSDR Mo.WQI
0
25
50
75
100
125
150
0
5
10
15
20
25
30
35
40
45
50
55
60
65
70
75
80
85
90
95
100
O D F A J A O D F A J A O D F A J A O D F A J A O D F A J A O D F A J A O D F A J A O D F A J A O D F A J A O D F A J A O D F A J A
WY05 WY06 WY07 WY08 WY09 WY10 WY11 WY12 WY13 WY14 WY15
Str
eam
flo
w,
cfs
Wate
r Q
uality
In
dex
Chart I.2 - LSDR Streamflow and WQI Running Averages by Reach (WY05-WY15)
Streamflow Max Mo. WQI Mission Gorge LSDR Avg. Upper Mission Valley Upper Santee Basin Min Mo WQI 12 per. Mov. Avg. (Streamflow)
1 5
23 23
47
15 12
4 2 1 1 1 3
27
8 1
32
6 6 12
19 18 17
7 5 4 5 6
11
34
53
62 63
60
66
62
54
42
27
23
28
43
63
58
30
64
54
50
45 45
48
54
48
44
36
44
40
22
33
44
51
47 48
44
35
26
18 17
19
28
47
40
20
41
37 36 38 37
35
38
33 32
22
29 29
34
12 12
22
30
33
27
23
18
14
9 7
9
12
28
20
10
18
22
27
34
32
18
15
9 11
10 10
8
0
10
20
30
40
50
60
70
80
90
100
0
5
10
15
20
25
30
35
40
45
50
55
60
65
70
O N D J F M A M J J A S Fall Winter Spring Summer WY05 WY06 WY07 WY08 WY09 WY10 WY11 WY12 WY13 WY14 WY15 WY16 S
tream
flo
w,
cfs
Wate
r Q
uality
In
dex
Chart I.3 LSDR Temporal WQI and Streamflow Profiles
Streamflow Mission Gorge Lower Santee Basin Lower Mission Valley LSDR Upper Mission Valley Upper Santee Basin
38
31 32
42
32
25
33
50
36
45
39 40
35
18 18
49 47
49
56
46
42
51
67
48
59
50
54
47
28 28
49
43 45
58
49
43
37
72
42
56
33 35
22
18 17
26
17
14 15
19
13
24
31
28
42
30
26
33
9
12
27
14 15
27
19
11
16
29
24
31
27 29
18
10 10
0
5
10
15
20
25
30
35
40
45
50
55
60
65
70
75
1 2 3 4 5 6 7 8 9T 10 11 15T 12T 13 14
Est YMCA FVM FSDRIP Ward Kaiser ABF MT BC Seep OMD W.Hills ForCk CO/SLks Mast Pk RCP
Wate
r Q
uality
In
dex
Chart I.4 LSDR Spatial WQI Profile (WY05-WY16)
12-Yr Annual Norm
12-Yr Winter Norm
WY05 Annual Avg. (Best Yr)
WY14 Annual Avg. (Poorest Yr)
12-Yr Summer Norm
WY16 Annual Avg.