LOWER DIR DISTRICT - ppaf.org.pk Analysis Report of PPR... · Analysis and Baseline Surveys for...
34
Situation Analysis & Baseline Surveys For Poverty Reduction through Rural Development in KPK, FATA & Balochistan DEVELOPMENT PROFILE OF LOWER DIR DISTRICT January 3, 2015 Empowerment Performance Result Submitted by: In Association with:
Transcript of LOWER DIR DISTRICT - ppaf.org.pk Analysis Report of PPR... · Analysis and Baseline Surveys for...

Situation Analysis & Baseline Surveys For Poverty
Reduction through Rural Development in KPK,
FATA & Balochistan
DEVELOPMENT PROFILE OF
LOWER DIR DISTRICT
January 3, 2015
Empowerment Performance Result
Submitted by:
In Association with:

District Profile Lower Dir
Table of Contents
LIST OF EXHIBITS ........................................................................................................................................... 1
ACRONYMS .................................................................................................................................................... 2
FOREWORD .................................................................................................................................................... 4
DISTRICT LOWER DIR– AT A GLANCE ............................................................................................................. 5
1.0 DISTRICT GEOGRAPHY ........................................................................................................................... 7 1.1 LOCATION AND BOUNDARY ............................................................................................................. 7 1.2 TOPOGRAPHY ................................................................................................................................ 7 1.3 TRIBES ETHNIC GROUPS AND LANGUAGES ...................................................................................... 8 1.4 CLIMATE ........................................................................................................................................ 8
2.0 SOCIO-ECONOMIC PROFILE OF THE DISTRICT .......................................................................................... 9 2.1 EDUCATION AND LITERACY ............................................................................................................. 9 2.2 HEALTH ....................................................................................................................................... 11 2.3 HOUSING QUALITY AND HOUSING SERVICES ................................................................................. 13 2.4 TRANSPORT AND COMMUNICATION ............................................................................................... 15 2.5 POPULATION AND EMPLOYED LABOR FORCE ................................................................................. 15 2.6 LIVELIHOOD SOURCES ................................................................................................................. 17
3.0 LAW AND ORDER ................................................................................................................................. 20 3.1 BACKGROUND OF PEACE AND SECURITY ....................................................................................... 20 3.2 LAW ENFORCEMENT AGENCIES (LEAS) ........................................................................................ 20 3.3 JUDICIAL INFRASTRUCTURE IN LOWER DIR .................................................................................... 20 3.4 MAIN CRIMES IN 2014 .................................................................................................................. 21 3.5 LAW AND ORDER REFORMS.......................................................................................................... 22 3.6 PRISONS ..................................................................................................................................... 22
4.0 CONFLICT MANAGEMENT ...................................................................................................................... 23 4.1 TRIBAL CONFLICT AND THEIR IMPACT ON THE LOCAL COMMUNITY AND ECONOMY ........................... 23 4.2 LOCAL DISPUTE RESOLUTION MECHANISMS .................................................................................. 23 4.3 CONFLICT BACKGROUND .............................................................................................................. 23 4.4 OTHER CONFLICTS AND DISPUTES ................................................................................................ 24 4.5 CONFLICTS RESOLUTION SYSTEM ................................................................................................ 24 4.6 DISPLACEMENT ............................................................................................................................ 24
5.0 THE ROLE OF WOMEN .......................................................................................................................... 25 5.1. STATUS OF WOMEN ..................................................................................................................... 25 5.2. EDUCATION AND HEALTH FACILITIES FOR WOMEN ......................................................................... 25 5.3. MATERNAL HEALTH CARE ............................................................................................................ 25 5.4. GENDER BASED VIOLENCE ........................................................................................................... 25 5.5. EDUCATION RATIO ....................................................................................................................... 25 5.6. SOURCE OF INCOME .................................................................................................................... 26
6.0 ENVIRONMENTAL ANALYSIS.................................................................................................................. 27 6.1 CLIMATE, LAND AND WATER ......................................................................................................... 27 6.2 AGRICULTURE.............................................................................................................................. 28 6.3 ENVIRONMENTAL HAZARDS .......................................................................................................... 28
7.0 SOCIAL MOBILIZATION ......................................................................................................................... 29 7.1 ROLE OF PPAF ........................................................................................................................... 29 7.2 LOCAL NGOS .............................................................................................................................. 29 7.3 FOCUS OF DONOR COMMUNITY .................................................................................................... 29
8.0 IMPORTANT INSTITUTIONS ..................................................................................................................... 32 8.1 INSTITUTIONS AND STAKEHOLDERS ............................................................................................... 32 8.2 FINANCIAL INSTITUTIONS IN THE DISTRICT ..................................................................................... 32

District Profile Lower Dir
1
List of Exhibits
Exhibit 2.1.1 - Educational Status of Children of 5-9 Years Age Group [percentage Distribution, 2012-13]
9
Exhibit 2.1.2 - Educational Status of Children of 10-14 Years Age Group 1 [Percentage Distribution, 2012-13]
9
Exhibit 2.1.3 - Gender Parity Index in Primary and Secondary Enrollment [2012-13] 10
Exhibit 2.1.4 - Teaching Institutions and Staff – Numbers [2011] 10
Exhibit 2.1.5 - School Facilities and Physical Characteristics–2011 [Percentage of Schools] 11
Exhibit 2.1.6 - Adult Literacy Rate (%) - [2012-13] 11
Exhibit 2.2.1 - Status of Child Health –- Percentages [2012-13] 12
Exhibit 2.2.2 - Status of Maternal Health – Percentage of Pertinent Women [2012-13] 12
Exhibit 2.2.3 - Health Institutions – Numbers [2013] 12
Exhibit 2.2.4 - Health Staffs – Numbers [2013] 13
Exhibit 2.3.1 - Material Used in Roof - Percentage of Household [2012-13] 13
Exhibit 2.3.2 - Wall Structure – Percentage of Households [2012-13] 13
Exhibit 2.3.3 - Type of Toilet – Percentage of Households [2012-13] 14
Exhibit 2.3.4 - Source of Lighting – Percentage of Households [2012-13] 14
Exhibit 2.3.5 - Cooking Fuel – Percentage of Households [2012-13] 14
Exhibit 2.3.6 - Source of Drinking Water – Percentage of Households [2012-13] 14
Exhibit 2.4.1 - Indicators of Communication [2012-13] 15
Exhibit 2.5.1 - Estimated Population - [Number in Thousand] 15
Exhibit 2.5.2 - Percentage of Employed Labor Force by Major Sectors [2012-13] 16
Exhibit 2.5.3 - Percentage of Employed Labor Force by Major Occupational Group [2012-13] 16
Exhibit 2.5.4 - Employment Status [2012-13] [Percentage of Employed Persons] 16
Exhibit 2.6.1 - Land Utilization Statistics – [2012-13] 17
Exhibit 2.6.2 - Area and Production of Major Crops [2011-12] 17
Exhibit 2.6.3 - Agriculture Machinery – [2011-12] 18
Exhibit 2.6.4 - Population of Livestock - [2006] 18
Exhibit 2.6.5 - Mineral Production - [2012-13] 18
Exhibit 2.6.6 - Area Under the Control of Forest Department – [2012-13] 18
Exhibit 2.6.7 - Fish Production– [2012-13] 19
Exhibit 3.2.1 - Strength of the Law Enforcement Agencies (LEAs) 20
Exhibit 3.3.1 - Justice System in Lower Dir 21
Exhibit 3.3.2 - Alternate Dispute Resolution (ADR) Mechanism 21
Exhibit 3.4.1 - Crimes Rate 21
Exhibit 4.1.1 - Tribal Orientation in Lower Dir 23
Exhibit 5.3.1 - Socio-Economic Situation of the Lower Dir District 25
Exhibit 5.5.1 - Education Facilities Available For Women in Lower Dir 26
Exhibit 7.3.1 - Donor Projects 29

District Profile Lower Dir
2
Acronyms
ABL Allied Bank Limited
ACF Action Contre la Faim (Action Against Hunger)
AKBT Association for Behavior and Knowledge Transformation
AKRSP Aga Khan Rural Support Program
ASF Agribusiness Support Fund
CO Community Organization
CPI Community Physical Infrastructure
DC Deputy Commissioner
DGDC Directorate General for Development Cooperation
DIG Deputy Inspector General
DoE Department of Energy
DPO District Police Officer
DRC Dispute Resolution Council
DRC District Reconciliation Committee
DSP Deputy Superintendents of Police
DTCE Devolution Trust for Community Empowerment
EPS Environmental Protection Society
FATA Federally Administered Tribal Areas
FHA Frontier Highways Authority
FIR First Information Record
GBV Gender Based Violence
GIZ Deutsche Gesellschaft für Internationale Zusammenarbeit (GIZ) GmbH
GoI Government of Italy
GPI Gender Parity Indices
GRHO Gender Reproductive Health Organization
GTTTC Government Technical Teachers Training Centre
HSRU Health Sector Reform Unit
IDA International Development Association
IDP Internally displaced persons
KP Khyber Pakhtunkhwa
LEAs Law Enforcement Agencies
LEP Livelihood Enhancement and Protection
MCB Muslim Commercial Bank
MDTF Multi-Donor Trust Fund
MICS Multiple Indicators Cluster Survey
MPAs Member Provincial Assembly
NDMA National Disaster Management Authority
NRSP National Rural Support Program
PATA Provincially Administered Tribal Areas
PBS Pakistan Bureau of Statistics
PDMA Provincial Disaster Management Authority
PEI Poverty Eradication Initiative
PHC Peshawar High Court
PHED Public Health Engineering Department
PPAF Pakistan Poverty Alleviation Fund
PS&JP Public Safety and Justice Program
PSLM Pakistan Social and Living Standard Measurement
RDO Regional Development Organization

District Profile Lower Dir
3
SDC Swiss Development Cooperation
SIDO Social Integrated Development Organization
SRLMP Strengthening Rule of Law in Malakand Program
SRSP Sarhad Rural Support Program
SWWS Support With Working Solutions
TAF The Asia Foundation
TDEA Trust for Democratic Education and Accountability
TMA Town Municipal Administration
TNSM Tehreek-e-Nifaz-e-Shariat-e-Mohammadi
TTP Tehreek-e-Taliban Pakistan
UBL United Bank Limited
UCs Union Council
UNDP United Nations Development Program
USAID United States Agency for International Development
WB World Bank
ZTBL Zarai Taraqiati Bank Limited
District Profile Lower Dir
4
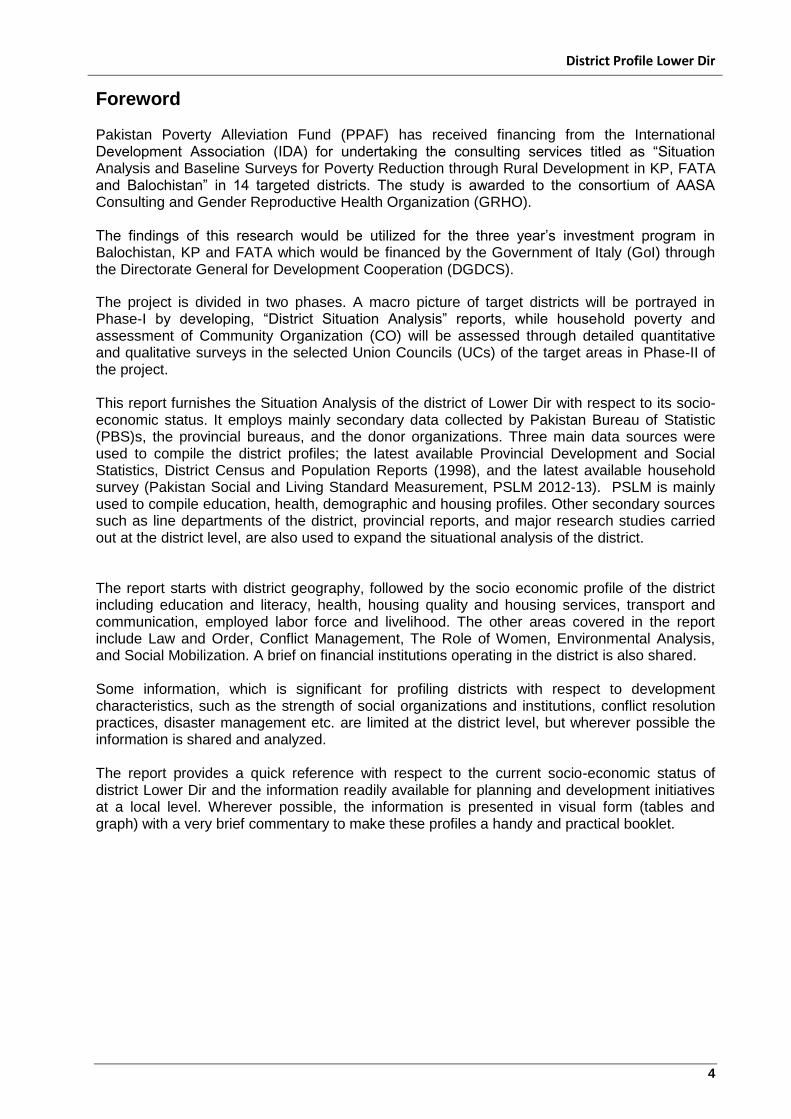
Foreword Pakistan Poverty Alleviation Fund (PPAF) has received financing from the International Development Association (IDA) for undertaking the consulting services titled as “Situation Analysis and Baseline Surveys for Poverty Reduction through Rural Development in KP, FATA and Balochistan” in 14 targeted districts. The study is awarded to the consortium of AASA Consulting and Gender Reproductive Health Organization (GRHO). The findings of this research would be utilized for the three year‟s investment program in Balochistan, KP and FATA which would be financed by the Government of Italy (GoI) through the Directorate General for Development Cooperation (DGDCS).
The project is divided in two phases. A macro picture of target districts will be portrayed in Phase-I by developing, “District Situation Analysis” reports, while household poverty and assessment of Community Organization (CO) will be assessed through detailed quantitative and qualitative surveys in the selected Union Councils (UCs) of the target areas in Phase-II of the project. This report furnishes the Situation Analysis of the district of Lower Dir with respect to its socio-economic status. It employs mainly secondary data collected by Pakistan Bureau of Statistic (PBS)s, the provincial bureaus, and the donor organizations. Three main data sources were used to compile the district profiles; the latest available Provincial Development and Social Statistics, District Census and Population Reports (1998), and the latest available household survey (Pakistan Social and Living Standard Measurement, PSLM 2012-13). PSLM is mainly used to compile education, health, demographic and housing profiles. Other secondary sources such as line departments of the district, provincial reports, and major research studies carried out at the district level, are also used to expand the situational analysis of the district. The report starts with district geography, followed by the socio economic profile of the district including education and literacy, health, housing quality and housing services, transport and communication, employed labor force and livelihood. The other areas covered in the report include Law and Order, Conflict Management, The Role of Women, Environmental Analysis, and Social Mobilization. A brief on financial institutions operating in the district is also shared. Some information, which is significant for profiling districts with respect to development characteristics, such as the strength of social organizations and institutions, conflict resolution practices, disaster management etc. are limited at the district level, but wherever possible the information is shared and analyzed. The report provides a quick reference with respect to the current socio-economic status of district Lower Dir and the information readily available for planning and development initiatives at a local level. Wherever possible, the information is presented in visual form (tables and graph) with a very brief commentary to make these profiles a handy and practical booklet.

District Profile Lower Dir
5
District Lower Dir– At a Glance
District Headquarter: Timergara
Tehsils and UCs
Samar Bagh Khazana, Mian Kali, Munda, Drangal, Mayar, Maskini, Samarbagh, Asbanr, Chakdara
Timergara
Khadakzai, Khan Pur, Ouch, Balambat, Koto, Laj Book, Munjai, Rabat, Beshi Gram, Gal Maidan, Kotkai, LalQilla, Zimdara, BaghDushkhel, NooraKhail, ShahiKhail, Khall, Shalfalam, Toormang, Badwan, Khungi, Tazagram, Kotigram, Timergara, Hayaserai, Bandagai, SadbarKalay, Kambat
Area 1582 Square Kilometer
Climate
The summer season is hot and winter is extremely cold. A steep rise in temperature occurs from May to June, and then it gets very hot during July to the end of August, but during September weather turns normal, especially at nights. A rapid fall of temperature occurs from October onwards. The coldest months are December and January. Towards the end of cold weather there are occasional thunderstorms and hailstorms.
Major Ethnic Groups Isazai, Ismailzai
Demography
Projected Population – 2014 (thousand) 1229
Population Density (Persons per Square Kilometer) 776
Percentage of Rural Population 95%
Percentage of Female Population 50%
Sex Ratio (Males per 100 Females - Percentage) 100
Percentage of Children (0-5 years) 17%
Percentage of Active Population (15-64 years) 51%
Dependency Ratio (Percentage) 97%
Household Size 8
Livelihood Sources
Total Cropped Area (Hectares) 46701
Total Irrigated Area (Hectares) 43140
Major Crops Wheat, Maize, Rice, Canola
Livestock Head Per thousand Rural Population 2016
Major Minerals Granite, Limestone
Head of Household Work Status (Percentages):
Wage Employed 40
Self Employed 13
Employer 1
Agriculture 43
Livestock 2

District Profile Lower Dir
6
Education
Percentage of Population that Ever Attended School 53
Primary Enrollment Rate (Gross) 92
Middle Enrollment Rate (Gross) 54
Matric Enrollment Rate (Gross) 42
Percentage of Literate Persons (10 years and above) 51
Percentage of Literate Persons (15 years and above) 44
Health
Health Institutions (numbers):
Hospitals 3
Dispensary 19
Rural Health Centre 4
Basic Health Centre 33
Health Staff per One Hundred Thousand Population
Doctors 17
Nurses 18
Paramedics 36
Housing
Percentage of Households
Inadequate Roof Structure (Wood, Bamboo) 67
Un-electrified Households 3
Households with No-Toilet 7
Inadequate Fuel for Cooking 96
Inadequate Source of Drinking Water 43
Sources:
Development Statistics of Khyber Pakhtunkhwa, 2014, Bureau of Statistics, Government of KP
Important district-wise socio-economic indicators of Khyber Pakhtunkhwa, 2014
Pakistan Social and Living Standard Measurement Survey, 2012-13, Government of Pakistan
District Census Report, 1998

District Profile Lower Dir
7
1.0 District Geography
1.1 Location and Boundary
Lower Dir is the lower part of the old District Dir. At the time of independence, Dir was a state ruled by Nawab Shah Jehan Khan. It was merged in Pakistan in 1969 and later on declared a district in 1970. In 1996, it was bifurcated into Upper and Lower Dir districts. District Lower Dir is located in the north-western part of Khyber Pakhtunkhwa province and is spread over an area of 1583 square kilometers. Apart from small areas in the south-west, the District is mostly a rugged mountainous terrain. The District borders with swat District on its East, Afghanistan on its West, Upper Dir and Chitral on its North & north-west respectively and Malakand & Bajaur Agency on its South. The district is administratively subdivided into two Tehsils which contain a total of 37 UCs. The district is represented in the provincial assembly by four elected MPAs. The short route that links District Lower Dir to the provincial capital is the one that passes through District Charsadda and Malakand Districts. For the people coming from down country, however, the more convenient approach is through the Mardan and Malakand Districts. There is no railway tract leading to the District1.
Map of Lower Dir District
Sources: ACTED Pakistan, Rapid Need Assessment Project
1.2 Topography The topography of the district is dominated by the mountains and hills which are part of the ranges/branches of southern Hindukush with the highest peaks in the northern part of Dir. The major valleys of Lower Dir include; Timergara, Jandool Maidan, Samarbagh, and Asban.
1This section is largely benefited from “Health Facility Assessment –Khyber Pakhtunkhwa, District
LowerDir”, http://pspu.punjab.gov.pk/system/files/HFA-Lower-Dir.pdf , 2012
District Profile Lower Dir
8
1.3 Tribes Ethnic Groups and Languages Pushto is the main language of Dir, while Gugro, and Kohistani are the languages of Kohistanis and Gugars. A few people speak Hindko (a variant of Punjabi,Gujari and Khowar Chitrali). The majority of the population in this area belongs to Isazai and Ismailzai tribes.
1.4 Climate The summer season is hot and winter is extremely cold. A steep rise of temperature occurs from May to June, and then very hot during July to the end of August but during September weather turns normal, especially at nights. A rapid fall in temperature occurs from October onwards. The coldest months are December and January. The mean minimum temperature recorded for the month of January is -8 °C. Most of the rainfall occurs in the months of July, August, December, January and February. Towards the end of the cold weather, there are occasional thunderstorms and hailstorms.

District Profile Lower Dir
9
2.0 Socio-Economic Profile of the District
2.1 Education and Literacy This section highlights the major characteristics of schooling in the district by providing a situation analysis in terms of access, equality and quality of primary and secondary education. Moreover, besides providing the level of adult literacy, school facilities and physical characteristics are collated to provide an idea of the quality of education in the district. Access to education is generally gauged with reference to the gross and net enrolment rates, based on the relevant age group. Traditionally in Pakistan, enrolment rates are calculated on the basis of age group, 5-9 years, and 10-14 years, for primary and secondary levels of education respectively. Therefore, following the tradition, these age groups are preferred for documentation of the educational status of children in terms of out-of-schooling and enrolments in public, private or religious institutions. Access and equality indicators are derived from Pakistan Social and Living Standard Measurement (PSLM) surveys, while the available physical facilities in primary and secondary schools are ascertained from the Development Statistics of the province. Exhibit 2.1.1 displays the educational status of children for the 5-9 years age group. Overall, about 37 percent of children (30 percent boys and 45 percent girls) of the primary age group were out of school in the year 2013. The private school phenomenon is not widespread in the district. About 9 percent of boys and 7 percent of girls were enrolled in private institutions according to the estimates from household survey (PSLM, 2013). Moreover, the enrolments in religious schools are not observed in the district, while insignificant (0.28 percent) girls‟ enrollments in schools run by NGOs are evident in the exhibit.
Exhibit 2.1.1 Educational Status of Children of 5-9 Years Age Group
[percentage Distribution, 2012-13]
Overall% Boys% Girls%
Out of School 36.97 30.08 44.72
Enrolled in Public Schools 54.50 60.41 47.85
Enrolled in Private Schools 8.40 9.51 7.15
Enrolled in Religious Schools (Madrasa) 0.00 0.00 0.00
Enrolled in Schools Run by NGOs 0.13 0.00 0.28
Source: Estimated from Household Level Data of PSLM, 2012-13
Exhibit 2.1.2 documents the educational status of children in the 10-14 age year group. Overall, about 9 percent of boys and 41 percent of girls of the 10-14 age year cohort were not attending school during 2013. The majority (about 69 percent out of 77 percent) of students were enrolled in government schools. Moreover, about 2 percent boys‟ enrollment in religious school is also estimated from the PSLM 2013 data.
Exhibit 2.1.2
Educational Status of Children of 10-14 Years Age Group [Percentage Distribution, 2012-13]
Overall% Boys% Girls%
Out of School 23.27 9.18 40.75
Enrolled in Public Schools 69.36 80.64 55.35
Enrolled in Private Schools 5.91 8.02 3.30
Enrolled in Religious Schools (Madrasa) 1.46 2.16 0.60
Enrolled in Schools Run by NGOs 0.00 0.00 0.00
Source: Estimated from Household Level Data of PSLM, 2012-13

District Profile Lower Dir
10
A summary index “Gender Parity Index (GPI)” is commonly used to assess gender differences. It is the value of an indicator for girls divided by that for boys. A value of less than one indicates differences in favor of boys, whereas a value near one indicates that parity has been more or less achieved. Exhibit 2.1.3 is developed to document the prevalence in gender disparities in school enrolment for the children in primary and secondary age groups respectively. Relatively higher gender disparity is observed in the district as compared with the province for the school enrolment in the 5-9 years age cohort (0.70 versus 0.76). A similar trend is observed in secondary school enrolment where the district magnitude of GPI is low as compared with that estimated for the province (0.53 versus 0.69).
Exhibit – 2.1.3 Gender Parity Index in Primary and Secondary Enrollment
[2012-13]
Source: Estimated from Household Level Data of PSLM, 2012-13
Exhibit 2.1.4 furnishes information regarding number and type of education institutions as well as the number of teachers. This supply-side information is obtained from the provincial Development Statistics. Due to data constraints in terms of various indicators of quality inputs, this section only describes the available physical facilities in schools, which is the most important pillar of quality input to education. School buildings, drinking water, boundary walls, electricity and toilets for students are considered basic facilities.
Exhibit 2.1.4 Teaching Institutions and Staff - Numbers
[2011]
Schools Teachers
Total Male Female
Primary School 1272 4077 2590 1487
Middle School 143 732 477 255
High School 105 1126 831 295
Higher Secondary 29 640 510 130
Community School 12 80 - 80
Private School 80 1487
Intermediate/Degree College 5 171 125 46
Source: Development Statistics of Khyber Pakhtunkhwa, 2014
Exhibit 2.1.5 summarizes the extent of available facilities across various levels (primary, middle and high) of education. Electricity is available in about 61 percent of primary schools, while only 46 percent of primary schools reported the drinking water facility in school. Although, almost all primary schools reported the availability of buildings, about 26 percent of schools run without boundary walls. The situation in middle and high schools is however comparatively better. Electricity and drinking water are available in 83 percent and 75 percent of high schools
0.70
0.53
0.76 0.69
0.00
0.20
0.40
0.60
0.80
1.00
5-9 Age Cohort 10-14 Age Cohort
Lower Dir KPK

District Profile Lower Dir
11
respectively. About 89-99 percent of school buildings have „pacca‟ structure in high and middle schools respectively, while about 86 to 97 percent schools buildings are in satisfactory condition.
Exhibit 2.1.5 School Facilities and Physical Characteristics – 2011
[Percentage of Schools]
Primary% Middle% High% Total%
Boundary Wall Exists 73.98 84.62 77.14 76.58
Building Availability 99.14 103.50 93.33 100.59
'Pacca' Structure of Schools 84.20 98.60 88.57 87.30
Satisfactory Building Condition 75.63 97.20 85.71 79.54
Electricity Availability 61.48 83.22 82.86 66.38
Drinking Water Availability 45.83 73.43 75.24 51.78
Latrine Availability 77.12 96.50 84.76 80.66
Source: Development Statistics of Khyber Pakhtunkhwa, 2014
Exhibit 2.1.6 documents the adult (15 plus age cohort) literacy rates for the district. According to the table, literacy rates in the district are 44 percent for the overall population, with 67 percent for males and 25 percent for females during the year 2012-13. The estimated corresponding literacy rates for the province are; 48 percent, 67 percent and 30 percent for overall, male and female population respectively.
Exhibit 2.1.6 Adult Literacy Rate (%) - [2012-13]
Source: Estimated from Household Level Data of PSLM, 2012-13
According to UNDP Human Development Report (2014), Pakistan has been placed 146th out of 187 countries in terms of the Human Development Index with an overall adult literacy rate of 54.9%. Over the years, several non-formal literacy programs were launched but these suffered from lack of political commitment, inadequate financial support, weak implementation structures and the absence of effective supervision and monitoring.
2.2 Health Health is the factor which plays the key role in determining the human capital. Better health improves the efficiency and the productivity of the labor force and thus ultimately contributes to the economic growth, and leads to human welfare. On the other hand, there is a strong correlation between poverty and the health of the poor. The health status of a region may be evaluated in terms of either input indicators (doctors, institutions etc.) or output indicators (Infant Mortality, Maternal Mortality, Life Expectancy etc.). Unfortunately, district-wise data on output indicators are not available in Pakistan from either published or unpublished materials. The latest Multiple Indicators Cluster Survey (MICS) which was conducted in 2008 in the province, reports various district-wise indicators, but the data on district-wise morality rates and life expectancy are not provided. Therefore, to gage an idea
44
67
25
0
20
40
60
80
Overall Male Female

District Profile Lower Dir
12
about the health status in the target districts, data on the maximum possible input indicators is collated in the following tables. A rough sketch on child health is furnished in Exhibit 2.2.1. About 94 percent of children in the 12-23 months age cohort reported fully immunized according to the recall and record method, while the corresponding percentage is low (74 percent) in household which provided records of immunization. About 79 percent of children reported the use of ORS for the treatment of diarrhea, however the percentage who consulted physicians in case of diarrhea is quite high (95 percent). No gender discrimination is evident from the table.
Exhibit 2.2.1 Status of Child Health –- Percentages[2012-13]
Overall% Boys% Girls%
Children (12-23 Months) – Fully Immunized
Record Only 74 68 79
Recall and Record 94 93 94
Diarrhea in Children Under 5
Physician Consulted 95 100 92
Treatment of Diarrhea – ORS 79 80 78
Source: PSLM, 2012-13
Some indicators of maternal health care are compiled in Exhibit 2.2.2. The information in the table reveals that only 54 percent of pertinent women reported having Tetanus Toxoid Injection, while this percentage is quite high (85 percent) in urban areas. About 54 percent and 42 percent of pertinent women confirmed pre-natal and post-natal consultation respectively in the district. The situation in terms of child delivery is miserable. Child delivery at home is reported by about 55 percent of households in rural areas. The corresponding percentage for the urban population is about 39 percent.
Exhibit 2.2.2 Status of Maternal Health – Percentage of Pertinent Women
[2012-13]
Overall% Urban% Rural%
Have Received Tetanus Toxoid Injection 54 85 53
Pre-Natal Consultations 54 66 54
Child Delivery at Home 54 39 55
Post-Natal Consultations 42 25 43
Source: PSLM, 2012-13
Numbers of health institutions in the district during the year 2012-13 are collated in Exhibit 2.2.3, while the strength of health staff in the district is depicted in Exhibit 2.2.4. A gloomy picture is evident in terms of the strength of the district in providing health facilities. Only 17 doctors and 18 nurses are available for one hundred thousand („lakh‟) population, according to the statistics provided by the provincial official publications.
Exhibit 2.2.3 Health Institutions – Numbers [2013]
Hospital 3
Dispensary 19
Rural Health Centre 4
Basic Health Units 33
Maternal and Child Health Centre 9
Leprosy Clinic 2
S.H.C. 2
Source: Development Statistics of Khyber Pakhtunkhwa, 2014

District Profile Lower Dir
13
Exhibit 2.2.4 Health Staffs – Numbers [2013]
Numbers
Per One Hundred Thousand population
Doctors 204 17
Nurses 227 18
Paramedics 442 36
Source: Development Statistics of Khyber Pakhtunkhwa, 2014
2.3 Housing Quality and Housing Services It is of interest to assess the means and standards of living directly provided by the government, and that which is acquired by standard households. Shelter is one of the basic needs, and housing conditions are one of the key determinants of the quality of life. To observe the access to housing facilities, three indicators are used vis a vis, proportion of households using electricity, cooking gas and tap water, while the quality of housing stock is evaluated in terms of the material used in walls, roofs and the type of toilet in the house. All this information is obtained at the household level from the household survey (PSLM) and thus truly reflects the conditions of living standards in the district. Information regarding the type of material used in roofs is displayed in Exhibit 2.3.1. The exhibit reveals that about 67 percent of households (39 percent urban and 68 percent rural) reported inadequate (wood) roof material. Iron and cement are used in about 6 percent of urban households, while 54 percent and 30 percent of urban and rural households respectively reported RCC/RBC roofing.
Exhibit 2.3.1 Material Used in Roof - Percentage of Household
[2012-13]
Overall% Urban% Rural%
RCC, RBC 31.54 54.21 30.44
Iron, Cement 1.5 6.05 1.28
Garder, T-Iron 0.44 1 0.41
Wood etc. 66.52 38.74 67.87
Source: PSLM, 2012-13
In terms of material used in the wall, the majority (58 percent rural and 39 percent urban) households reported the use of wood or other materials (Exhibit 2.3.2). Burnt bricks or blocks are used in about 39 percent and 60 percent of rural and urban households respectively.
Exhibit 2.3.2 Wall Structure – Percentage of Households
[2012-13]
Overall% Urban% Rural%
Burnt Brick- Blocks 39.84 60.25 38.84
Mud Bricks/ MUD 2.76 1.06 2.84
Wood and Other Materials 57.40 38.69 58.32
Source: PSLM, 2012-13
Information regarding the type of toilet used by the household is furnished in Exhibit 2.3.3. About 8 percent of rural households reported unavailability of toilet facilities in the house. The table also reveals that bulk of households reported the use of a lush toilet. About 76 percent and 97 percent of households reported the use of a flush toilet in rural and urban areas respectively.

District Profile Lower Dir
14
Exhibit 2.3.3 Type of Toilet – Percentage of Households
[2012-13]
Overall% Urban% Rural%
Flush 77 97 76
Non-Flush 16 0.00 16
No Toilet 7 3 8
Source: PSLM, 2012-13
Almost all households are connected with the grid and use electricity for lighting purposes as evident from Exhibit 2.3.4. The percentages of households who reported the use of electricity are 100 percent and 97 percent in urban and rural areas respectively.
Exhibit 2.3.4 Source of Lighting – Percentage of Households
[2012-13]
Overall% Urban% Rural%
Electricity 97.22 100 97.08
Oil 2.25 0.00 2.37
Candle 0.52 0.00 0.55
Source: PSLM, 2012-13
Exhibit 2.3.5 furnishes information regarding the sources of cooking fuel. Wood and charcoal are the main sources of cooking fuel according to the table. About 67 percent and 97 percent of urban and rural households use either wood or charcoal, whereas about 33 percent of urban households reported use of oil/gas for cooking purposes.
Exhibit 2.3.5 Cooking Fuel – Percentage of Households
[2012-13]
Overall% Urban% Rural%
Gas/Oil 4.18 32.77 2.78
Wood/Charcoal 95.82 67.23 97.22
Source: PSLM, 2012-13
The provision of safe drinking water is an important part of planning for a healthy population. Exhibit 2.3.6 displays sources of drinking water in the district with an urban-rural division. About 44 percent of rural households fetch water from unsafe sources (uncovered water reservoirs and dug well). The corresponding percentage for urban areas is about 22 percent. A tap water source is reported by 37 percent of households; 56 percent and 36 percent in urban and rural areas respectively.
Exhibit 2.3.6 Source of Drinking Water – Percentage of Households
[2012-13]
Overall% Urban% Rural%
Tap Water 37 56 36
Hand Pump 1 1 1
Motor Pump 19 20 19
Dug Well 6 4 6
Other (Uncovered) 37 18 38
Source: PSLM, 2012-13

District Profile Lower Dir
15
2.4 Transport and Communication
Roads, transportation and telecommunication networks have a significant impact on socialization and modernization. Three indicators have been utilized to portray the level of development of the transport and communication sector in a district; road mileage per 100 square kilometers of geographical area, availability of public and private transport and vehicles, and the number of telephone and internet connections per one hundred thousand persons. These indicators (depicted in Exhibit 2.4.1) are estimated from the latest published data of the provincial Development Statistics.
Exhibit 2.4.1 Indicators of Communication[2012-13]
Numbers Per one Hundred Thousand
Population
Number of Connections
Landline 11175 910
Broadband Data is not available
Road Kilometers Per ’000’
Square Kilometer
Black Topped 679 429
Shingle 64 40
Total 743 469
Motor Vehicles Registered
Public Service Vehicles 5163
Private Vehicles 7118
Government Goods Vehicles -
Private Goods Vehicles 2206
Others 8754
Total Vehicles 23241
Source: PSLM, 2012-13
The table reveals that about 910 persons out of one lakh (one hundred thousand) population were connected with PTCL landlines during the year 2012-13. The data on broadband connections in the district is not available.
About 429 kilometers and 40 kilometers of mettled (black topped) and Shingle road is available for every one thousand kilometers of geographical area respectively, with about 23 thousand registered vehicles.
2.5 Population and Employed Labor Force
The characteristics of the employed labor force are important to understand the economic structure and potential of any region. This section provides information with respect to the distribution of the labor force into sectors, occupational group and working status.
According to the Exhibit 2.5.1, the estimated current population of the district is about 12 lakh (1.229 million) with an average growth rate of 3.37 percent per annum. These population projections are taken from “Development Statistics of Khyber Pakhtunkhwa, -2014”. About 0.45 million people are estimated as active labor force members by applying the crude activity rate of KP.
Exhibit 2.5.1 Estimated Population - [Number in Thousand]
Overall Urban Rural
1998 – Census 717 44 673
2010 – Projected 1074 66 1008
2014 – Projected 1229 76 1153
Growth Rate [1998-2014] 3.37% 3.42% 3.36%
Sources: Development Statistics of Khyber Pakhtunkhwa, 2014 District Census Report, 1998

District Profile Lower Dir
16
The distribution of the employed labor force by major economic sectors is furnished in Exhibit 2.5.2. The exhibit reveals that the agriculture sector absorbs the bulk of the labor force. About 48 percent of rural employment was recorded in this sector during 2012-13 (PSLM survey), whereas about 14 percent of the urban employed labor force also reported work in the agriculture sector. The construction sector provides employment to about 19 percent (8 percent in urban and 20 percent in rural) of labor force. About 4 percent of the urban employed labor force is absorbed in the manufacturing sector, while the service sector provides employment to about 22 percent (48 percent and 21 percent in urban and rural areas respectively).
Exhibit 2.5.2 Percentage of Employed Labor Force by Major Sectors[2012-13]
Overall% Urban% Rural%
Agriculture 46.65 14.40 47.97
Mining - - -
Manufacturing 1.39 4.01 1.28
Construction 19.36 7.97 19.83
Trade 10.37 25.66 9.75
Other Service Sectors 22.22 47.97 21.17
Source: Estimated from Household Level Data of PSLM, 2012-13
Exhibit 2.5.3 reports the distribution of the labor force into the major occupational groups. About 48 percent of the rural labor force is working in the occupational group „Skilled Agriculture and Fisheries Workers‟, while about 11 percent of the urban labor force is also reported employed as skilled agriculture and fisheries workers. About 6 percent of labor is employed as craft and related trade workers.
Exhibit 2.5.3 Percentage of Employed Labor Force by Major Occupational Group[2012-13]
Overall% Urban% Rural%
Elementary (Non-Skilled) 14.31 29.98 13.67
Clerks/Sales Workers 6.66 25.93 5.88
Skilled Agriculture and Fisheries Workers 46.23 10.76 47.68
Craft and Related Trade Workers 6.49 16.05 6.10
Other 26.32 17.29 26.69
Source: Estimated from Household Level Data of PSLM, 2012-13
Wage employees constitute the largest group with respect to the work status of the employed labor force. According to Exhibit 2.5.4, about 52 percent and 40 percent of the urban and rural labor force respectively is working as employees. About 39 percent of owner cultivators in rural areas are evident in the table, while the percentage of the labor force working as sharecroppers is about 2 percent. The table also reveals that only 2 percent of the employed labor force is linked with the livestock profession. The percentages of self-employed (own-account workers) groups are 37 percent and 12 percent in urban and rural areas respectively.
Exhibit 2.5.4 Employment Status [2012-13]
[Percentage of Employed Persons]
Overall% Urban% Rural%
Employer 0.52 - 0.54
Self Employed 12.92 37.33 11.93
Wage Employee 40.33 51.91 39.86
Un-Paid Family Worker 1.58 - 1.64
Owner cultivator 37.49 5.32 38.80
Sharecropper 1.85 1.75 1.86
Contract cultivator 3.53 1.57 3.61
Livestock 1.79 2.12 1.78
Source: Estimated from Household Level Data of PSLM, 2012-13
District Profile Lower Dir
17
2.6 Livelihood Sources
Sources of livelihood represent the economic base of the district. Various features of agriculture, livestock, mining and forestry are compiled in this section, while district-wise manufacturing and fisheries data is not available.
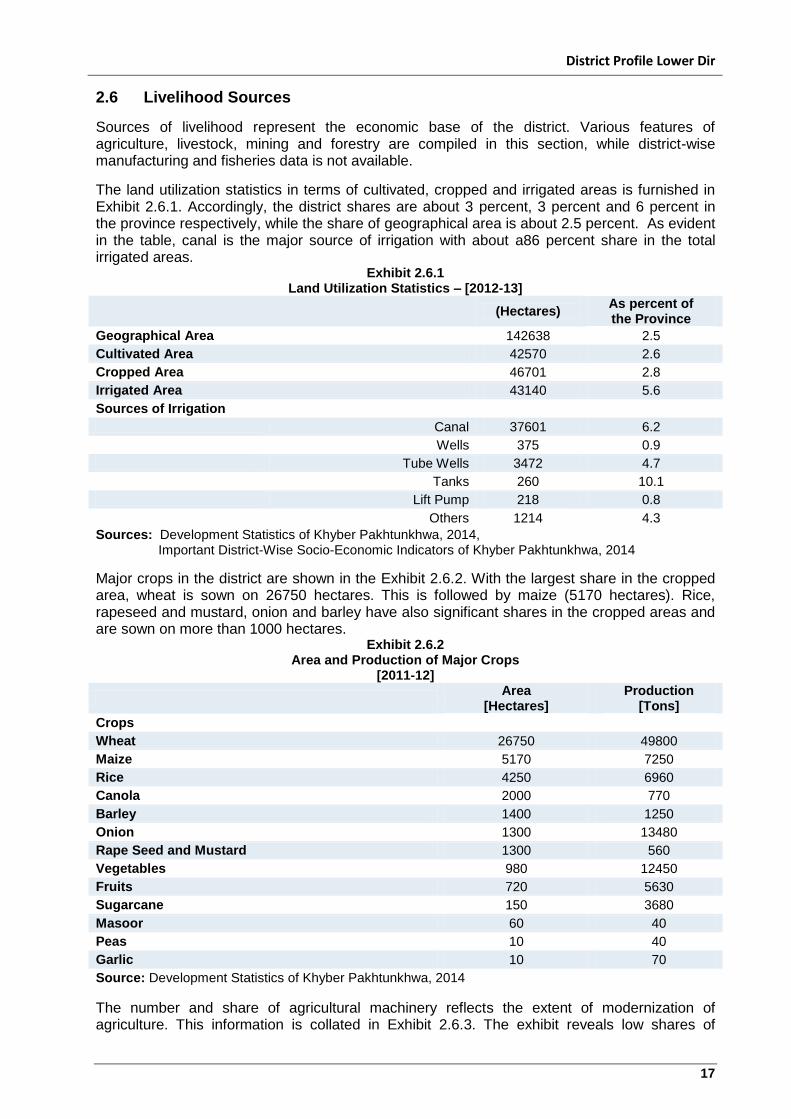
The land utilization statistics in terms of cultivated, cropped and irrigated areas is furnished in Exhibit 2.6.1. Accordingly, the district shares are about 3 percent, 3 percent and 6 percent in the province respectively, while the share of geographical area is about 2.5 percent. As evident in the table, canal is the major source of irrigation with about a86 percent share in the total irrigated areas.
Exhibit 2.6.1 Land Utilization Statistics – [2012-13]
(Hectares)
As percent of the Province
Geographical Area 142638 2.5
Cultivated Area 42570 2.6
Cropped Area 46701 2.8
Irrigated Area 43140 5.6
Sources of Irrigation
Canal 37601 6.2
Wells 375 0.9
Tube Wells 3472 4.7
Tanks 260 10.1
Lift Pump 218 0.8
Others 1214 4.3
Sources: Development Statistics of Khyber Pakhtunkhwa, 2014, Important District-Wise Socio-Economic Indicators of Khyber Pakhtunkhwa, 2014
Major crops in the district are shown in the Exhibit 2.6.2. With the largest share in the cropped area, wheat is sown on 26750 hectares. This is followed by maize (5170 hectares). Rice, rapeseed and mustard, onion and barley have also significant shares in the cropped areas and are sown on more than 1000 hectares.
Exhibit 2.6.2 Area and Production of Major Crops
[2011-12]
Area
[Hectares] Production
[Tons]
Crops
Wheat 26750 49800
Maize 5170 7250
Rice 4250 6960
Canola 2000 770
Barley 1400 1250
Onion 1300 13480
Rape Seed and Mustard 1300 560
Vegetables 980 12450
Fruits 720 5630
Sugarcane 150 3680
Masoor 60 40
Peas 10 40
Garlic 10 70
Source: Development Statistics of Khyber Pakhtunkhwa, 2014
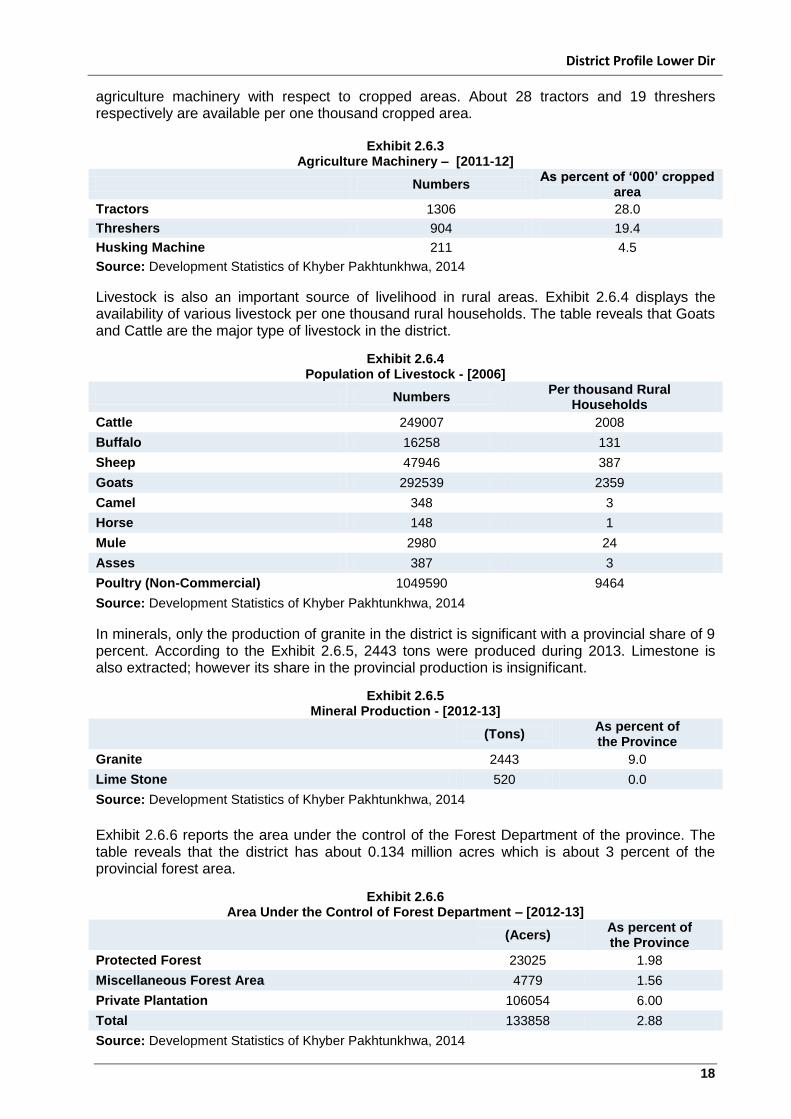
The number and share of agricultural machinery reflects the extent of modernization of agriculture. This information is collated in Exhibit 2.6.3. The exhibit reveals low shares of
District Profile Lower Dir
18
agriculture machinery with respect to cropped areas. About 28 tractors and 19 threshers respectively are available per one thousand cropped area.
Exhibit 2.6.3 Agriculture Machinery – [2011-12]
Numbers As percent of ‘000’ cropped
area
Tractors 1306 28.0
Threshers 904 19.4
Husking Machine 211 4.5
Source: Development Statistics of Khyber Pakhtunkhwa, 2014
Livestock is also an important source of livelihood in rural areas. Exhibit 2.6.4 displays the availability of various livestock per one thousand rural households. The table reveals that Goats and Cattle are the major type of livestock in the district.
Exhibit 2.6.4 Population of Livestock - [2006]
Numbers Per thousand Rural
Households
Cattle 249007 2008
Buffalo 16258 131
Sheep 47946 387
Goats 292539 2359
Camel 348 3
Horse 148 1
Mule 2980 24
Asses 387 3
Poultry (Non-Commercial) 1049590 9464
Source: Development Statistics of Khyber Pakhtunkhwa, 2014
In minerals, only the production of granite in the district is significant with a provincial share of 9 percent. According to the Exhibit 2.6.5, 2443 tons were produced during 2013. Limestone is also extracted; however its share in the provincial production is insignificant.
Exhibit 2.6.5 Mineral Production - [2012-13]
(Tons)
As percent of the Province
Granite 2443 9.0
Lime Stone 520 0.0
Source: Development Statistics of Khyber Pakhtunkhwa, 2014
Exhibit 2.6.6 reports the area under the control of the Forest Department of the province. The table reveals that the district has about 0.134 million acres which is about 3 percent of the provincial forest area.
Exhibit 2.6.6 Area Under the Control of Forest Department – [2012-13]
(Acers)
As percent of the Province
Protected Forest 23025 1.98
Miscellaneous Forest Area 4779 1.56
Private Plantation 106054 6.00
Total 133858 2.88
Source: Development Statistics of Khyber Pakhtunkhwa, 2014

District Profile Lower Dir
19
Information regarding the fish production in the district is furnished in Exhibit 2.6.7. According to the table the district share in the province is small. About 5 percent of the total fish production of KP belongs to the district Lower Dir.
Exhibit 2.6.7 Fish Production– [2012-13]
(Tons)
As percent of the Province
Trout - -
Non-trout 276 9.72
Total 276 4.96
Source: Development Statistics of Khyber Pakhtunkhwa, 2014

District Profile Lower Dir
20
3.0 Law and Order The biggest problem prevailing is that of the Internally Displaced People. Lower Dir is part of FATA which comprises of seven agencies. Home to 3.5 million Pashtuns, the area has been consistently unstable for various political reasons. Moreover, the area is in desperate need of development work. But most importantly, the district has been in continuous distress for the past decade due to the rise in militancy. The effects of these political and social issues are widespread in the district. The natives are neither left with homes nor a source of income and thus have to move. There are 250,000 people from Bajaur agency and 180,000 from Mohammad Agency registered as IDPs in Lower Dir and Nowshera.
3.1 Background of Peace and Security Timergara is the district Headquarter of Lower Dir. The overall chief executive of the district is the Deputy Commissioner (DC). He has to maintain the law and order situation in the area and give leadership to civilian forces. In the wake of militancy and trouble on western border area, the DC has also got operational support of the FC and one brigade of the Pakistan Army. The Dir Scouts of FC and one brigade of Pak Army have the joint duty of security in both lower and Upper Dir districts2. The DC has a localized force of levies, which works under his direct command. They mainly provide security to government buildings and functionaries working in the district. They also provide security services at some check posts3.
3.2 Law Enforcement Agencies (LEAs) Currently there are four types of LEAs operating in the district. The prime responsibility of maintaining law and order in the district lies on the shoulders of Police. The Police are led by the District Police Officer (DPO). Then there are levies, Dir Scouts and Pakistan Army, responsible for law and order maintenance.
Exhibit 3.2.1 Strength of the Law Enforcement Agencies (LEAs)
# Agency/
Department
Number of Personnel Deployed Details
Male Female
1 Police (Regular) 2763 Nil 12 Police Station (PS)
2 Special Police Force (SPF)
1050 Nil Two years contract
2 Levies 709 Nil Levies Lane
3 Frontier Corps (Dir Scouts)
3000+ Nil 1 wing at Benshahi 1 Wing at Head Quarter Timergara
4 Pak Army 1 Brigade deployed in both Upper and Lower Dir Districts with a strength
of some 3500 personnel
Source: Interviews with Police and Levies Officials.
3.3 Judicial Infrastructure in Lower Dir Lower Dir is part of the Provincial Administration for Tribal Areas (PATA) under Khyber Pakhtunkhwa Provincial Government. The Justice system in district Lower Dir comes under the Peshawar High Court, while lower courts are working like other districts in the province.
2Interview with Head of law Department of a University in Malakand.
3 Interview with a local journalist

District Profile Lower Dir
21
Exhibit 3.3.1 Justice System in Lower Dir
# Court (Formal
Justice) Justice System Regulation
1 District and Session Court
1 District and Session Judge
3 Additional District and Session Judges
1 Senior Civil Judge
4 Civil Judges (1 each at Timergara, Samar Bagh, Chakdara, Maidan)
Regular Pakistan Justice Regulations/
Laws
2 Tehsil Courts or Sub-Divisions
Each Tehsil is comprising of 1 Additional and District Judge and 2 Civil Judges
Regular Pakistan Justice Regulations/
Laws Source: Interviews with an Advocate of the District Bar and the Head of Law Department of the University of Malakand
Exhibit 3.3.2
Alternate Dispute Resolution (ADR) Mechanism
# ADR Tool Level of Working Achievement
1 Jirga
People refer to local elders of the area for dispute resolution at household, community or tribal levels.
Jirga decides matters on Riwaj and brings people together and creates reconciliation among parties. This is the oldest and most successful tool for conflict resolution in the area.
2
Dispute Resolution Council (DRC)
Currently in Dir (Lower) there is only one DRC active.
DRC is established at district level for solving district level disputes. It has a valuable role in fighting bigger issues, like it has played a role in fighting militancy and keeping the district safe.
3 Musalihati Committee
Established at every Police Station level.
It has a membership of around 18-20 members. Every dispute is first referred to this committee before registration.
Source: Interviews with an Advocate of the District Bar and a Local Journalist
3.4 Main Crimes in 2014 The number of murders and attempted murders shows a very high ratio among the major crimes in the district. This is more related to the militancy and the volatile situation in the bordering areas with Afghanistan. However, other crimes ratios are quite low. The main dispute in the district is over land and its related issues.
Exhibit 3.4.1 Crimes Rate
# Crime
(Description) Main Reasons
Incidents/ Losses in 2014
Police Action
1 Murders Hilly area land disputes, female disputes,
family enmities, tribal enmities 56 Arrests: 96
2 Murder Attempt Hilly area land disputes, female disputes,
family enmities, tribal enmities 45 Arrests: 129
3 Hurt Cases Firing, personal quarrels and accidents
etc. 193 Arrest: 525
4 Dacoits Road side robberies 8
- 6
Anti-Terrorism Act
Those registered under the anti-terrorism act, were allegedly involved in terror acts
3
Total 305
Source: Interview with a Police Official

District Profile Lower Dir
22
3.5 Law and Order Reforms
Online FIRs are in operation but not effective due to the low level of education/ literacy.
DIG Darbar takes place once a year, providing a good platform to local people for resolving their issues on the spot.
Musalihati Committee at the Police Station level is very effective in decreasing the burden on the Police
Established a Dispute Resolution Committee at the district and local Level.
Established a Tribal Militia (Lashkars) for protection of militant attacks.
3.6 Prisons There is only one central jail located at Timergara. This prison facility is in use for Swat and Dir (Upper) districts as well.

District Profile Lower Dir
23
4.0 Conflict Management
4.1 Tribal Conflict and their Impact on the Local Community and Economy Like other districts there are tribes in Lower Dir as well. They are, Yousufzais, Iman Khel, Muhamadi, Sultan Khel, etc. According to the natives of Lower Dir, the strongest of them are Yousufzai followed by Iman Khel. Mostly conflicts among tribes are on inheritance issues followed by politics, poverty, land and water. The strongest tribe has more political influence than the rest and is often found exploiting it. A plausible reason is because they have a higher population and most of them are associated with government. Some stated that they mostly use their power to occupy land illegally considering the fact they have a higher population in the political parties.
Exhibit 4.1.1 Tribal Orientation in Lower Dir
Tribes Percentage of Total Population
Yusufzai 35%
Utmankhel 25%
Roghani 12%
Akhunzadagan 10%
Kattanian 18%
Source: Research by Fata Research Center
4.2 Local Dispute Resolution Mechanisms Two forms of justice systems prevail in this district as in the others; Jirga and the court system. The Jirga system is often divided into two categories, the formal system and the informal. The formal system is when two individuals solve their dispute themselves. The informal is when the Jirga solves the dispute between two individuals. As far as rights of women are concerned, women are more or less acquainted with them and some even visit the court if required. Given the strong cultural values, those who go to court only go out with families. The issues at this level are very tedious. Mostly conflicts among families are over the fact that the husband or his mother wants a son in their family which is out of the hands of the wife or daughter in law. Sometimes they are based on religious aspects, the females are strongly asked to take the hijab and parda. The remaining issue arises because the husband wants a second marriage or there is excessive poverty in the house. Other various reasons include, business, land ownership, distribution of wealth etc. Most of the in-house conflicts are solved among the family members themselves. With conflicts related to religious ties, mothers of the women sit and talk to them about it.
4.3 Conflict Background Decades‟ long deprivation and low human development created a sense of disparity among common people, especially the youth in the people living on the Pak-Afghan border. This situation was coopted by the religious leaders, creating a supply line of warriors to fight in Afghanistan and then in Kashmir was created. Passion and the divine cause of Jihad combined with training, money and a battlefield has radicalized the society in some areas of Lower Dir to the extent that they first announced the movement of bringing Shariat i.e. Tehreek-e-Nifaz-e-Shariat-e-Mohammadi (TNSM) and then “Tehreek-e-Taliban Pakistan (TTP)” in the area. Both of these movements were initiated by militant organizations that had their roots mainly from Lower Dir. For almost two and half decades, the area of Dir has remained unstable and lagged behind in the run for development and prosperity. The major conflict of the area is militancy and radicalization of youth4.
4 Interview with a Development Professional, Lower Dir

District Profile Lower Dir
24
4.4 Other Conflicts and Disputes
Most of the land in district Lower Dir is not clearly divided or demarcated due to the absence of a proper organized system of Patwaris in the district. This leaves people fighting among themselves and often creates big problems. Main issues regarding land are,
a) Division among family members
b) Water distribution
c) Shamilaat (it is a piece of land that remained undivided like Jungle, hills, graveyards etc.)5.
Recently, there have been many conflicts due to the women‟s share in inheritance. This is one of the local issues, where traditionally women have not been given share in the inherited land but with spread in education, most of the deprived women, now take the lead to acquire their own share in inheritance6.
4.5 Conflicts Resolution System
4.5.1 Jirga
Jirga is the main source of conflict resolution in the Pakhtoon dominant areas. People mostly refer their issues on for mediation to some elders and influential people from their families or local communities. Religious scholars also play a very active role in the Jirga in the area. Major issues dealt with by the Jirga are regarding land disputes, female related family issues, inheritance, honor issues and others.
4.5.2 District Reconciliation Committee
There is one major District Reconciliation Committee (DRC) with a membership of more than 20 senior citizens; it works with office of the deputy commissioner in maintaining law and order and dealing with issues of collective interests.
4.5.3 Musalihati Committee
This is a Police Station level set-up, recently established to resolve disputes outside Police Stations. This Committee has a membership of some 18-21 senior persons. This committee speaks to both disputing parties and they try to mediate issues and resolve these outside before lodging First Information Record (FIR). Recently these committees have been trained in dispute resolution mechanisms by UNDP7.
4.6 Displacement
No one is currently displaced within or outside the district. The people living in bordering areas have been facing frequent attacks from across the border but there have been gallant responses from local militia leaders. The cross border attacks pose a threat to the stability of the district and a possible displacement from the area. During the military operation against TTP in Malakand division some 3 million persons were displaced from Swat, Bunair and Dir (Lower) in 20098.
5 Interview with the head of law department of University of Malakand
6 Interview with an advocate of the district bar
7 The entire section 4.5 is hugely benefited by interviews with local journalists and advocates.
8 Interview with Ph. D scholar on IDPs, Peshawar

District Profile Lower Dir
25
5.0 The Role of Women
5.1. Status of Women Most of the women in the Lower Dir district are not aware of their rights. In most cases they are not allowed to visit police stations or the court of law to fight for their rights. It is primarily because of strong cultural and social norms that women are not allowed to exercise their rights. Those who do are not welcomed in their family and often alienated. They are not even allowed to use the local justice system because according to them, the elder of the family has the right to decide whether or not she should be considered for legal advisory.
5.2. Education and Health Facilities for Women Women in the district have low access to education and health resources. Only 46 percent of the women actually deliver in a hospital and 42 percent of the women have access to postnatal care. The adult female literacy rate in the district is only 25 percent. . These statistics reflect the limited access of resources and public space for women.
Exhibit 5.2.1
Socio-Economic Situation of the Lower Dir District
Indicator Adult Literacy Rate Child Delivery
Hospitalized Post-Natal Care
Male Female Total Home Private Hospital
Government Hospital
Percentage 67 % 25 % 44 % 54 % 10 % 36 % 42 %
Source: PSLM, 2012-13
5.3. Maternal Health Care Only 54 percent of the pertinent women reported having Tetanus Toxoid Injections, while this
percentage is quite high (85%) in the case of urban areas9. About 42 percent to 54 percent of
pertinent women confirmed pre-natal and post-natal consultation respectively in the district. The situation in terms of child delivery in the district is miserable. Child delivery at home is reported by about 55 percent households of the rural areas whereas in the urban areas the figure is about 39 percent.
5.4. Gender Based Violence The floods of July 2010 were a disaster of an enormous magnitude, effectively submerging one
fifth of the country10. During the disaster and post disaster situation in Khyber Pakhtunkhwa,
high levels of Gender Based Violence (GBV) resulted from the disruption of social structures, men‟s loss of traditional roles, increase poverty, food insecurity etc. Women became vulnerable to gender based crimes as they lost their homes which resulted in the displacement and lack of protection. The victims do not have access to female professionals in reporting crimes, seeking
medical attention or shelter11. The cultural restrictions on the women in the districts mean that
the women do not feel safe or comfortable in accessing GBV related services.
5.5. Education Ratio In Lower Dir District the education ratio is very low (29.51%) for both sexes in the area due to
lack of educational facilities.12
Most of the areas have not yet established girl‟s primary schools. The female education ratio is about 12 percent but the trend has now been changed and their
9 Situation Analysis, ibid
10 ibid
11 Final Report on Assessment and Mapping of Services, ibid
12 Profile of Dir Area Support Program (DASP)

District Profile Lower Dir
26
awareness about the importance of female education is increased. The females are now working in female institutions as well as private institutions. But they are still strictly following their customs and traditions.
Exhibit 5.5.1 Education Facilities Available For Women in Lower Dir
# Institution Total No.
1 Govt.Primary Schools 858
2 Govt.Girls Primary Schools 414
3 Govt.Middle Schools 92
4 Govt.Girls Middle Schools 51
5 Govt.High Schools 79
6 Govt.Girls High Schools 26
7 Govt.Higher Secondary Schools 21
8 Govt.Girls Higher Secondary Schools 8
9 Colleges(Boys) 3
10 College (Girls) 2
11 University 1
5.6. Source of Income In Lower Dir and Upper Dir, around 30 percent to 40 percent of the population has to go out of
their villages to earn their livelihoods13 at the domestic level; women produce handicrafts and
also work in the fields with the men. In the villages women‟s main source of income is livestock products, poultry and grain from the fields. Except for a few flour mills, no major industries exist in the area and about 70 percent of people are living below the poverty line.
13
ibid

District Profile Lower Dir
27
6.0 Environmental Analysis
The district was formed in 1996, when the district of Dir was divided into Upper Dir and Lower Dir. District Dir Lower is located in the province of Khyber Pakhtoonkhwa in Pakistan. It lies in Hindu Kush range and the area occupied is 5,284 km². This now forms two districts of Pakistan - Upper Dir and Lower Dir (1,585 km). These two districts are the part of Malakand Division. Panjkora River rises in the Hindu Kush Mountains and joins the Swat River near Chakdara. In the North of Dir lower there are rugged mountainous peaks rising from 1100 to 3119 meters. Swat is located in the East while Afghanistan lies in the West14.
The district is 1,582 square kilometers in area and formed part of the Malakand Division until divisions were abolished in 2000. Almost all of it lies in the valley of the Panjkora which rises high in the Hindu Kush at Lat. 35.45 and joins the Swat River near Chakdara, where the district is usually entered, at Lat. 34.40.
Apart from the tehsils of Adenzai round Chakdara and Munda in the south-west, Lower Dir is rugged and mountainous.
The district is bounded by Swat District to the East, Bajaur Agency to the West, Upper Dir to the North, and Malakand District to the South15.
District Dir Lower is situated in the Khyber Pakhtoonkhwa at a Distance of 124 KM from Peshawar. The District starts from ”Chakdara” just on the left turn of the main road from Malakand Pass at 15KM distance, just crossing the bridge on river Swat (Chakdara is the gate way to District Dir Lower and Upper. Dir Lower is bounded in the North by Dir Upper, in the South Malakand Agency in the East Swat and Bajawar Linked at we stem edges. The higher peaks of Afghanistan join the north-west hilly tracts.16
6.1 Climate, Land and Water
The elevation of district ranges from 1200m to 2800m above sea level. The climate of the District largely depends on altitude. July is the hottest month (15.67 to 32.52°C), while January and February are the coldest months and the temperature generally falls below freezing point. The mean maximum and minimum temperature are 11.22°C and 2.39°C. The winter season is from mid- November to March.
Relative humidity is higher in January, February, August and December. It receives the highest amount of rainfall in March (242.22 mm) and lowest in July, October, and November. Snowfall starts from December to March and remains up to June and July on high mountains, adding to the beauty of the valley17.
The climate can be described as mild temperate. It is characterized by cold frosty winters with occasional snow fall and warm to hot summers, mostly hot during May and June and warm to hot with increased humidity during the monsoon season. The northern parts are generally colder and receive more precipitation. Semi-dry condition prevails in its southern parts. Annual average rainfall varies from 700 mm to 1200 mm. Generally 55% of the rain fall occurs from December to April and 35% from July to September. The mean maximum temperature rises to 38 degree centigrade while mean minimum temperature falls to 0 degrees18.
Apart from small areas in the south-west, Dir is a rugged, mountainous zone with peaks rising to 5,000 meters (16,000 ft.) in the north-east and to 3,000 meters (9,800 ft.) along the
14
District Lower Dir, Pakistan, 2010, Nasrullah khan, http://www.pakbs.org/pjbot/pdfs/42(5)/pjb42(5)3029.pdf 15
Dir Valley, http://visitorsheaven.com/dir.php 16
Welcome to Dir State the Land of Peace and Hospitality, Lower Dir District, by Shafiq-ur Rehman, Executive District officer, http://dirbeauty.webs.com/dirlower.htm 17
District Lower Dir, Pakistan, 2010, Nasrullah khan, ibid. 18
Welcome to Dir State The Land of Peace and Hospitality, Lower Dir District, by Shafiq Ur Rehman, EXECUTIVE DISTRICT OFFICER AGRICLTURE, DIR LOWER AT TIMERGARA , http://dirbeauty.webs.com/dirlower.htm

District Profile Lower Dir
28
watersheds, with Swat to the east and Afghanistan and Chitral to the West and North respectively19. There was an acute shortage of drinking water in villages in Dir Lower due to closed water supply schemes. Residents of various areas were finding it hard to get potable water because the water supply schemes had been out of order due to some reason. A total of 125 water supply schemes had been supplying water to more than 800,000 people. They said 85 schemes were still working well20.
6.2 Agriculture
Agriculture is the main stay of the people of the District, more than 85%of the population is directly or indirectly dependent on Agriculture. The main source of revenue is from the people working abroad and Agricultural crops like Onion and seasonal Tomato which are the major crops, but due to price instability in the local market, the land owners are facing acute problems in Agriculture marketing. Tobacco is also grown on a small area in the lower parts of the District i.e. Chakdara and supplements the revenue of the farmers of that specific locality. Main crops are wheat, rice, maize, oil crops. Vegetable is also grown on limited area, water being the limiting factor. Citrus fruit is also attractive farm income source of the farmers of the area but the decline has not been noticed either due to mismanagement which leads to disease and insects attack21.
6.3 Environmental Hazards
Floods: Heavy snow on the northern mountains of the province starts melting with rising temperatures during summer, thus causing a rise in the water level of River Kabul and Swat22. During the same period the monsoon patterns also develop in the region. Heavy precipitation of monsoon, results in disproportionate water flow in these rivers which ultimately generate floods around the banks of rivers.
Physical configuration of the northern and north-eastern portion of the province is excessively mountainous, spanning from Chitral up in the North to districts of Upper and Lower Dir, Shangla, Swat and Mansehra which are prone to flash flooding, cloud bursts and sliding activities23. Therefore, depending on the intensity of monsoon precipitation and ice melt, Khyber Pakhtunkhwa is vulnerable to both sudden and expected hydro-meteorological disasters which require integrated surge and quick response.
The impact caused by the floods in 2010 was severe. After the floods 70 water supply schemes (i.e. 89 percent of the total water schemes) were reported as damaged by the floods, out of which, 60 are no longer functional
24. Only 48 percent of water supply
schemes were providing drinkable water according to community leaders after the floods.30 water tanks were reported with a medium capacity of 8.000 gallons out of which 7 water tanks have been damaged by the floods.
Earthquakes: A moderate earthquake of 4.1 magnitudes jolted some parts of Lower Dir and Chitral and other parts of the country in 201325. According to the meteorological department, the epicenter of the quake was 43 kilometers North of Mengora at a depth of 10 kilometer. People came out of their houses, but no loss of life and property was reported as a result of the quake.
19
The Khyber Pakhtunkhwa Tribune, Lower DirDistrict,http://KPtribune.com/index.php/en/lower-dir 20
Dir News, Lower Dir Most of the Water Supply Schemes are Out of Order, http://www.dirnews.net/lower-dir-water-supply-schemes-order/ 21
Welcome to Dir State The Land of Peace and Hospitality, Lower Dir District, by Shafiq Ur Rehman, Executive District Officer Agriclture, Dir Lower At Timergara , http://dirbeauty.webs.com/dirlower.htm 22
Monsoon Contingency Plan 2014, PDMA, Government of Khyber Pakhtunkhwa 23
ibid 24
Agency for Technical Cooperation and Development, Rapid Need Assessment, Lower Dir District 25
4.1 magnitude earthquake hits Lower Dir, Chitral, AAJ News, 29th
June 2013

District Profile Lower Dir
29
7.0 Social Mobilization Numerous government and non-government programs and approaches have been used to promote rural development and poverty alleviation. Among these have been initiatives designed to build rural infrastructure, mobilize communities, enhance access to rural finance, and provide a social safety net.
7.1 Role of PPAF
PPAF has facilitated its partner organization Poverty Eradication Initiative (PEI) in completing 3 projects in the health sector that are providing health care services to 70,809 community members. Mainly, PPAF has been providing support for two models namely: (a) Establishing community managed health centers, and (b) Strengthening government health centers, operating them for a period of up to 3 years and handing them back to the government. The objective of PPAF health program has been to provide access to quality, basic health services with a special focus on maternal and child health to the poor and marginalized rural communities by focusing on all aspects required in this regard. These aspects include hiring of qualified and trained health care staff and paramedics, availability of proper building, standardized equipment, furniture and medicine and following WHO guidelines in terms of infection prevention practices.
7.2 Local NGOs There are various NGOs working in the district namely:
SIDO
AKBT
SRSP
RDO
7.3 Focus of Donor Community In order to gain a better understanding of the programmatic focus of the various donor agencies operating in the area, the following table summarizes various projects operated in different sectors distinguished by donor and executing agencies in the district.
Exhibit 7.3.1 Donor Projects
Project Name Sector Donor Executing Agency
Agribusiness Project Agriculture USAID Agribusiness Support
Fund (ASF)
Small Grants Ambassador's Fund Program
Wildlife Conservation,
Women Issues, Cultural
Preservation, Entrepreneurship, Water Sanitation
and Hygiene
USAID NRSP
Strengthening Citizen Voice and Public Accountability Program
Democracy and Governance
USAID
Trust for Democratic Education and
Accountability (TDEA) and The Asia
Foundation (TAF) NGO Development and
Empowerment Women Association
Economic Revitalization of KP
Multi-Donor Trust Fund (MDTF)
GOP KP

District Profile Lower Dir
30
Exhibit 7.3.1 Donor Projects
Project Name Sector Donor Executing Agency
Governance Support Project
Governance Multi-Donor Trust
Fund (MDTF) GOP KP
Strengthening Health Services in Crisis-affected Districts of KP
Health Multi-Donor Trust
Fund (MDTF) GOP KP
Revitalizing Health in KP Health World Bank GOP KP
KP Emergency Roads Recovery
Disaster / Emergency
World Bank GoP Pakistan
Strengthening Health Services in Crisis-affected Districts of KP
Health The Netherlands Health Sector Reform
Unit (HSRU) Department of Health
Public Safety and Justice Program (PS&JP)
Disaster / Emergency
The Netherlands DTCE
Community Policing - Under Strengthening Rule of Law in Malakand Program (SRLMP)
Governance / Security
UNDP
Government of Khyber Pakhtunkhwa, Judiciary, BAR
Associations, Informal Justice Sector Actors,
Civil Society Organizations
Government Officials Survey on Administrative, Tax and Gender Reforms in Khyber Pakhtunkhwa
Deutsche Gesellschaft für Internationale
Zusammenarbeit (GIZ) GmbH
Elementary and Secondary Education
Department KP; Directorate of
Education FATA
Reducing vulnerability through DRM in KP
Governance / Security
Norway ACF International
Dev Swap V: Health Infrastructure
Health - Infrastructure
German Development Cooperation
Government of Khyber Pakhtunkhwa
Edu Swap II: School-Infrastructure KP
Education - Infratsrcture
German Development Cooperation
Government of Khyber Pakhtunkhwa
Dev Swap III: Housing Reconstruction KP
Infrastructure German
Development Cooperation
Government of Khyber Pakhtunkhwa
Dev Swap IV: Rehabilitation of Schools KP
Education German
Development Cooperation
Government of Khyber Pakhtunkhwa
Refugee Affected and Hosting Areas Program
Refugees / Host Communities
European Union; Government of
Japan; Government of
Germany; US State
Department; and Ministry of States
and Frontier Regions,
Government of Pakistan
UNDP- Planning and Development
Department of, Government of Khyber
Pakhtunkhwa; and Department of Planning
and Development, Federally Administered
Tribal Areas (FATA)

District Profile Lower Dir
31
Exhibit 7.3.1 Donor Projects
Project Name Sector Donor Executing Agency
Education sector development program in Khyber Pakhtunkhwa and in the Federally Administered Tribal Areas (FATA)
Education
German Federal Ministry for Economic
Cooperation and Development (BMZ
Elementary and Secondary Education
Department KP; Directorate of
Education FATA
Livelihoods Program Hindukush Pakistan
Livelihood Swiss Development Cooperation (SDC)
Inter corporation, Government of Khyber
Pakhtunkhwa
Rehabilitation of Drinking Water Supply in KP after the Floods 2010
Water Swiss Development Cooperation (SDC)
PHED, TMA, PDMA, WMC, DoE, DOH,
WAP, WB
Reconstruction of Schools Education -
Infrastructure Swiss Development Cooperation (SDC)
AKRSP

District Profile Lower Dir
32
8.0 Important Institutions
8.1 Institutions and Stakeholders The district is administratively subdivided into two Tehsils which contain a total of 37 UCs and is represented in the provincial assembly by four elected MPAs.26
8.2 Financial Institutions in the District Most of the people living in Lower Dir are poor. The economy is highly influenced by the remittances that are sent by family members of the local residents. Except for a few manufacturing plants that include cement block manufacturing units and flour mills, there are hardly any manufacturing units in the district. The main source of revenue comes from the people living abroad, and agricultural activities. Both fruits and vegetables are grown in the district. Commercial banks play an important role in complimenting these economic activities. Commercial banks operating in the district include Muslim Commercial Bank (MCB), United Bank Limited (UBL), Bank of Khyber, Allied Bank Limited (ABL), Bank Islami and Alfalah Bank Limited. Zarai Taraqiati Bank Limited (ZTBL)‟s role is encouraging in promoting agricultural activities in the district. Poverty Eradication Initiative (PEI) is one of the welfare institutes that work in Lower Dir.
26
Lower Dir District Wikipedia the free encyclopedia http://en.wikipedia.org/wiki/Lower_Dir_District