LOWER CLARK FORK RIVER FISHERY ASSESSMENT Project ... · LOWER CLARK FORK RIVER FISHERY ASSESSMENT...
21
LOWER CLARK FORK RIVER FISHERY ASSESSMENT Project Completion Report Idaho Tributary Habitat Acquisition and Enhancement Program Prepared by: Robert Ryan Regional Fisheries Biologist Idaho Department of Fish and Game and Robert Jakubowski Natural Resources Technician Avista Corporation May, 2012
Transcript of LOWER CLARK FORK RIVER FISHERY ASSESSMENT Project ... · LOWER CLARK FORK RIVER FISHERY ASSESSMENT...

LOWER CLARK FORK RIVER
FISHERY ASSESSMENT
Project Completion Report
Idaho Tributary Habitat Acquisition and Enhancement
Program
Prepared by:
Robert Ryan
Regional Fisheries Biologist
Idaho Department of Fish and Game
and
Robert Jakubowski
Natural Resources Technician
Avista Corporation
May, 2012

i
Lower Clark Fork River Fishery Assessment
Lower Clark Fork River Fishery Assessment ................................................................................................ i
ABSTRACT .................................................................................................................................................. ii
INTRODUCTION ........................................................................................................................................ 1
STUDY AREA ............................................................................................................................................. 2
METHODS ................................................................................................................................................... 4
RESULTS ..................................................................................................................................................... 6
DISCUSSION ............................................................................................................................................. 13
RECOMMENDATIONS ............................................................................................................................ 15
ACKNOWLEDGEMENTS ........................................................................................................................ 15
LITERATURE CITED ............................................................................................................................... 16

ii
ABSTRACT
A new minimum flow in the Clark Fork River below Cabinet Gorge Dam in Idaho was
negotiated in 1999 as part of Avista Corporation’s relicensing agreement for Cabinet Gorge
Dam. Minimum instream flow was increased from 84.9 cms to 141.5 cms. Increased minimum
flows were hypothesized to increase the availability of rearing habitat for fish and improve
foraging conditions by providing more stable habitat conditions for aquatic invertebrates.
Subsequent effects of these changes were expected to include increased abundance of target fish,
increased proportion of younger age classes of target species, and improved condition of all age
classes. To describe the effects of increased minimum flows, fish populations were monitored
between 1999 and 2008 in a 6.6 km reach of the lower Clark Fork River. Targeted species in the
monitoring program included brown trout Salmo trutta, mountain whitefish Prosopium
williamsoni, rainbow trout Oncorhynchus mykiss, and westslope cutthroat trout O. clarkii lewisi.
Assessment focused on monitoring changes in abundance, size structure, and condition of fish
populations in the affected area. Abundance of target species was estimated during annual
monitoring efforts using mark recapture techniques. Relative abundance (catch per unit effort
(CPUE)) of all species was estimated during fall sampling events. Size structure of sampled
target species was compared by sample year using structural indices including proportional stock
density and quality stock density. Physical condition of target species was evaluated by
estimating mean relative weights. Estimated abundance of mountain whitefish ranged from
3,717 to 9,029 over the study period. Brown trout, rainbow trout (includes rainbow trout
hybrids), and westslope cutthroat trout abundance estimates ranged from 76 to 356 fish per
species, in the study area over the ten year period. No significant changes or trends in relative
abundance were detected for any of the target species. Native non-game fishes including
northern pikeminnow Ptychocheilus oregonensis, redside shiner Richardsonius balteatus,
peamouth Mylocheilus caurinus, and largescale sucker Catostomus macrocheilus were the most
common fishes sampled. Trends in structural indices were generally positive except brown trout
quality stock density. Significant trends were only observed in mountain whitefish proportional
stock densities and rainbow trout quality stock densities. Mean relative weights of westslope
cutthroat trout, rainbow trout, and mountain whitefish were consistently above 80 while brown
trout were consistently near or below 80. No significant linear relationships were observed
between year and relative weight. Results suggested abundance, size structure, and condition of
fish populations in the lower Clark Fork River were largely unchanged following increases in
minimum flow below Cabinet Gorge Dam.

1
INTRODUCTION
An agreement reached with Idaho Department of Fish and Game (IDFG) in 1973 provided for a
3,000 cfs minimum flow below Cabinet Gorge Dam. That agreement was based on field
assessments of the river at varying flows, electrical generating requirements, a review of historic
low-flow records, and the earlier recommendation for a minimum flow of the same amount made
by the U.S. Fish and Wildlife Service (Service). However, minimum flow in the Clark Fork
River below Cabinet Gorge Dam was still one issue of concern to the local stakeholders involved
in a collaborative relicensing process conducted by Avista Corporation (Avista; formerly
Washington Water Power (WWP)) for Cabinet Gorge and Noxon Rapids dams. Avista
relicensed these two hydroelectric facilities on the Clark Fork River in Idaho and Montana in
1999 and the Clark Fork Settlement Agreement (CFSA) was the product of the collaborative
relicensing process (Avista 1999). Cabinet Gorge Dam is located just inside the Idaho border
and Noxon Rapids Dam is located approximately 32 km upstream in Montana (Figure 1). A new
minimum flow was negotiated for Cabinet Gorge Dam as part of the relicensing agreement,
which increased the base flow from 84.9 cms (3,000 cfs) to 141.5 cms (5,000 cfs) (Avista 1999,
see Appendix T). The objective of the increased minimum flow was to increase the amount of
permanently wetted river habitat to benefit the aquatic resources of the Clark Fork River. More
specifically, the objectives were to reduce the range of depth and velocity fluctuations in the
river, and reduce varial zone and bar dewatering to increase stability of shoreline rearing areas
for fish and enhance microinvertebrate production. Photo documentation was used to estimate
the minimum flow needed to provide a meaningful increase in permanently wetted perimeter of
the Clark Fork River (Beak 1997). Cabinet Gorge Dam is operated as a load following facility,
with daily flow fluctuations ranging from 84.9 cms (3,000 cfs) to 1,010.3 cms (35,700 cfs) prior
to the increased minimum discharge. Following the increase of minimum flow, generation
capabilities were increased and daily flow fluctuations ranged from 141.5 cms (5,000 cfs) to
1076 cms (38,000 cfs).
In addition to increasing minimum flows in the Clark Fork River, Avista and IDFG completed a
restoration project in 2001 to provide perennial flow through the approximately 2 km-long Foster
Bar side-channel to enhance fish habitat. This involved lowering several hydraulic control points
within the side-channel so that water would flow through the side-channel over the range of
discharges from Cabinet Gorge Dam. Prior to relicensing, when discharge from Cabinet Gorge
Dam dropped below approximately 311.3 cms (11,000 cfs), the side-channel would become a
series of un-connected pools. This reconnection was anticipated to provide valuable off-channel
spawning and rearing habitat for salmonids, which is in limited supply in the Idaho reach of the
Clark Fork River.
To assess the effectiveness of changes in minimum flow and channel alteration, a ten-year
monitoring program was conducted from 1999 through 2008. Increasing minimum flows from
84.9 cms to 141.5 cms was hypothesized to increase the availability of rearing habitat for fish
and improve foraging conditions by providing more stable conditions for aquatic invertebrates.
In addition, consistent flow and channel improvements in the Foster side-channel were expected
to provide additional spawning and rearing habitat for salmonids. Subsequent impacts of these
changes were hypothesized to increase abundance of target fish, increase the proportion of
younger age classes of target species, and improve condition of all age classes. Assessment of

2
these two possible actions focused on monitoring changes in abundance, size structure, and
condition of fish populations in the affected area.
Limited quantitative information existed relative to the fishery resources of the Clark Fork River
in Idaho prior to this study and prior to influences of hydropower facilities on the lower Clark
Fork River. Several studies have investigated river use by adfluvial fish from Lake Pend Oreille
(LPO), as well as the fish community composition (Heimer 1965, Anderson 1978, WWP 1995
and 1996). Avista, in preparation for their hydropower license renewal, conducted investigations
into relative abundance of fish species present in the Clark Fork River in Idaho (WWP 1995 and
1996). The information contained in these Avista reports adds to our baseline knowledge of fish
populations in the Clark Fork River. In combination, the earlier Avista work and the first several
years of this investigation formed the baseline from which the effects of the increased minimum
flow were judged.
Required monitoring of the impacts of increased minimum flow below Cabinet Gorge Dam on
native fishes was also included in the new operating license for the Clark Fork Project (FERC
2000, License Article 429). Also, term and condition (b) of reasonable and prudent measure #4
within the incidental take statement filed by Service on August 23, 1999, included in the new
project license, indicated the benefit of increased minimum flow to bull trout and other species
should be evaluated for a ten year period at which time or earlier a recommendation to the
Service should be made for continuation or change of the minimum flow (McMaster 1999). The
completion of this report was intended to provide a summary of monitoring results and
recommendations from this required monitoring therefore satisfying these two license
requirements.
STUDY AREA
The Clark Fork River is the largest tributary to LPO, contributing an estimated 92% of the
annual inflow (Frenzel 1991) and draining approximately 59,324 km2
of western Montana (Lee
and Lunetta 1990). Four tributaries enter the Clark Fork River downstream of Cabinet Gorge
Dam: Twin, Mosquito, Lightning, and Johnson creeks (Figure 1). Peak flows in the Clark Fork
River typically occur as a result of snow melt in May or June (PBTAT 1998).
The study area encompasses approximately 6.6 km of river habitat from the USGS gauging
station below Cabinet Gorge Dam downstream to the inlet of Foster Bar side-channel
(approximately river km 234 – 241, Figure 1). There is approximately 17 km of river habitat
between Cabinet Gorge Dam and LPO during winter lake draw downs. Approximately 6 km of
the lower river is impacted by elevated LPO water levels during late spring through early fall.
Physical habitat in the Clark Fork River below Cabinet Gorge Dam can be characterized as
primarily low gradient laminar flow, with three major riffles and several deep pools (to 23 m in
depth) (WWP 1995). Riffles are located near the mouths of Twin and Lightning creeks, as well
as at Foster Bar side-channel. Substrate composition in the river has been described as gravel
(26.3%), fines (22.2%), boulder (17.9%) and cobble (16.2%) (WWP 1995).

3
Figure 1. Fishery evaluation study area on the lower Clark Fork River, the major tributary to
Lake Pend Oreille, Idaho.

4
Distances and river kilometers were initially estimated from previous Avista GIS work
(Parametrix 2000a). Total surface area of the study reach was estimated at 120.7 ha (Downs and
Jakubowski 2003). We validated this estimated area by measuring twenty-five wetted widths
along the estimate section, as well as the total length of the section (25 sub-section lengths for a
total estimated length of 6.61 km), using a laser range-finder. Using this method, we estimated
the surface area at 114.8 ha at approximately 906 cms (32,000 cfs) discharge from Cabinet
Gorge Dam. We estimated the surface area at this discharge because it is close to the upper
generation limit of the project (approximately 1076 cms (38,000 cfs)), and flows often fluctuated
between 141.5 cms and 990.5 cms during these field studies.
Foster Bar side-channel is located approximately 1.9 km downstream of the confluence of Twin
Creek with the Clark Fork River (Figure 1). The side-channel is approximately 2.45 km in
length. During periods of winter drawdown of LPO, the side-channel functions as a lotic system.
During periods of high summer lake levels, about half of the side-channel is influenced by a
backwater effect from LPO, and stream flow through the side-channel is greatly slowed.
METHODS
The effects of increasing minimum flows at Cabinet Gorge dam to 141.5 cms and
implementation of the Foster side-channel alteration in the lower Clark Fork River on local fish
populations were monitored from 1999 to 2008. Monitoring focused on those characteristics of
the local fish populations that had potential to benefit from increased wetted channel width and
total habitat availability. Monitoring indices included abundance, size structure, and condition of
fish populations in the affected area. Targeted species in the assessment included brown trout
Salmo trutta, mountain whitefish Prosopium williamsoni, rainbow trout Oncorhynchus mykiss,
and westslope cutthroat trout O. clarkii lewisi. Alternating sample seasons (spring and fall) were
used to avoid spawning migration periods of fish from LPO. Spring sample periods were
utilized for fall spawning salmonids and fall sampling periods were used for spring spawning
salmonids. Two sample periods, spring and fall, were completed in 2000. In subsequent years,
spring and fall sample periods were alternated. Spring samples were consistently collected in
even numbered years between March 27 and April 10. Fall sample periods were completed on
odd numbered years between October 18 and November 9. Brown trout and mountain whitefish
were targeted in the spring while rainbow and westslope cutthroat trout were targeted in the fall.
Rainbow x westslope cutthroat trout hybrids were evaluated as rainbow trout for the purpose of
this study.
Boat mounted boom-type electrofishing equipment was used to sample fish. Fish sampling was
conducted at night, typically using two crews in 6 m-long jet boats. The electrofishing setup in
each boat consisted of a Coffelt VVP-15 electroshocker powered by a 5000 watt Honda
generator. Smooth DC current was employed to minimize risk of injury to trout (Dalbey et al.
1996). Electrofishing settings were generally set to generate 5 to 8 amps at 200-220 volts.
Electrofishing boats floated in fast flow areas, or motored slowly in areas of very slow flow
downstream, parallel with the shoreline. While electrofishing, we attempted to keep the anode
closest to shore in approximately 0.6 m of water depth. Each boat typically made a single pass
down each shoreline, and multiple passes along the shorelines in the Whitehorse Rapids area (to

5
increase sample size in productive areas) each night.
Fish stunned in the electrofishing field were netted and placed into a live well for recovery.
Captured fish were anesthetized and checked for fin clips. All target species in the marking runs
were measured (TL, mm). Only a subset of target fish caught in the recapture runs were
measured (TL, mm). All fish were measured during collections used in estimating catch per unit
effort (CPUE). Larger fish were weighed to the nearest 10 g on a top loading spring scale and
smaller fish to the nearest 1 g on a digital scale. Target fish were marked with a fin clip, and
released. Scales were collected in some years for estimation of age if desired.
Abundance of target fish species greater than or equal to 200 mm total length (TL) was estimated
using mark recapture techniques. Typically, the “marking” period was conducted over a three-
night period in the first week of sampling and the “recapture” period was conducted over a three-
night period the following week. We continued with recapture runs until we captured at least
three previously marked fish of each target species to reduce probability of statistical bias in our
estimates. Population estimates were calculated using the modified Petersen method for
sampling without replacement (any individual was only counted once) (Krebs 1989) as:
N = ((M+1) (C+1)/(R+1)) – 1
Where N = Estimated population
M = Number of individuals marked in the first sample
C = Total number of individuals captured in the second sample
R = Number of individuals in second sample that are previously marked
Confidence intervals (95%) around population estimates were estimated using a Poisson
distribution to account for small recapture sample size (Chapman 1948, Seber 1982) and were
calculated using tabled values provided in Hayes et al. (2007). Confidence intervals were
examined between years to evaluate significant differences between surveyed years.
Relative abundance (CPUE) of all species was estimated only during fall sampling events by
netting all fish encountered on one complete pass down each bank of the river during the
recapture run. Fall sampling periods reflected the highest overall catch rates and greatest variety
of fish species. Trends in relative abundance were used primarily to determine if significant
changes (α ≤ 0.05) in abundance or proportion of non-target species resulted from increased
minimum flows. CPUE was estimated as fish captured per minute of electrofishing. Trends in
relative abundance were evaluated using linear regression analysis. CPUE data from 1994
(WWP 1996) was included in the evaluation to provide pre-treatment perspective.
Size structure of sampled target species was compared by sample year using structural indices
including proportional stock density (PSD) and quality stock density (QSD) (Anderson and
Neumann 1996). PSD was defined as the proportion of fish sampled ≥ 305 mm relative to all
sampled fish stock length (200 mm, TL) or greater (Schill 1991). QSD were defined as the
proportion of fish sampled ≥ 406 mm relative to all sampled fish stock length (200 mm, TL) or
greater (Schill 1991). Linear regression was used to evaluate the presence, direction, and

6
significance of trends in structural indices. Evaluation of trends in structural indices included
only sample years during which a given species was targeted.
Relative weight (Wr) was calculated to assess the condition of target species (Anderson and
Neumann 1996). Mean relative weights and associated 95% confidence intervals were
calculated by species to evaluate differences between sample years. Linear regression analysis
was used to determine if significant trends in fish condition were present (α ≤ 0.05). Trend
analysis included an evaluation of mean relative weights by year.
A post hoc evaluation of mountain whitefish growth rate was completed to further evaluate
observed trends in size structure of the sampled population. Whitefish were the most abundant
species captured and arguably the most likely to maintain residency in the lower river. Changes
in growth were evaluated by comparing mean total length at age four. Age four was selected
because it corresponded to the approximate size at which mountain whitefish appeared to be
fully recruited to the sampling gear and sufficient scale samples were available in three sample
years for comparison. Length at age comparisons included data from years 2000, 2003, and
2007. Scales were collected in fall samples. Scale samples were pressed to acetate slides and
viewed on a microfiche. No back calculations were applied to age estimates. Change in length
at age between years was evaluated using one-way analysis of variance (ANOVA, α ≤ 0.05).
RESULTS
Abundance of targeted fishes described by population estimates was dominated by mountain
whitefish with brown trout, rainbow trout, and westslope cutthroat trout present in considerably
lower proportions (Table 1). Estimated abundance of mountain whitefish ranged from 3,717 to
9,029 fish within the study area. Brown trout and rainbow trout (includes rainbow trout hybrids)
abundance estimates ranged from 113 to 282 fish and 76 to 356 fish, respectively. Westslope
cutthroat trout cumulatively were the least abundant target species, with abundance estimates
ranging from 89 to 170 fish. Rainbow trout x westslope cutthroat trout hybrids were included in
rainbow trout abundance estimates to increase sample sizes and specifically recapture events for
valid abundance estimates.
No trends in abundance were identified in any target species during the study period. Estimated
abundances of target species did not vary considerably among most years for either spring or fall
sample periods (Figure 2). Examination of confidence intervals provided no strong evidence that
significant changes in abundance occurred during the study period for any target species.
Observed shifts in estimated abundance of mountain whitefish between 2000 and 2001 were the
most dramatic noted, although overlapping confidence intervals suggested abundance likely did
not differ significantly. Whitefish abundance was estimated from only three recaptures in 2000
suggesting variability in that estimate may have been high. Recaptures in subsequent years
ranged from eight to 47. Observations from sampling crews indicated their effectiveness of
finding and sampling more and larger whitefish increased following early sampling effort, due to
the discovery of a mid-river concentration of fish. Resulting abundance estimates and population
indices likely demonstrated variation resulting from this inconsistency in sampling protocol.
A variety of target and non-target species were collected in efforts to describe relative

7
abundances of all fishes (Table 2). Species collected also included some of those exhibiting fall
spawning behaviors. A total of 15 fish species were collected during fall sampling periods: bull
trout Salvelinus confluentus, brown bullhead Ictalurus nebulosus, brown trout, kokanee
Oncorhynchus nerka, northern pikeminnow Ptychocheilus oregonensis, lake whitefish
Coregonus clupeaformis, largemouth bass Micropterus salmoides, largescale sucker Catostomus
macrocheilus, longnose sucker Catostomus catostomus, mountain whitefish, pumpkinseed
Lepomis gibbosus, peamouth Mylocheilus caurinus, rainbow trout, redside shiner Richardsonius
balteatus, smallmouth bass Micropterus dolomieui, tench Tinca tinca, walleye Sander vitreus,
westslope cutthroat trout, yellow perch Perca flavescenes, and rainbow x westslope cutthroat
trout hybrids. Native non-game fishes including northern pikeminnow, redside shiner,
peamouth, and largescale sucker were the most common fishes sampled on a regular basis.
Kokanee also demonstrated a high CPUE and were abundant in fall sampling efforts in some
years, but were absent in three of six sample years.
No significant correlation was identified between year and CPUE for any species sampled in fall
CPUE evaluations (Table 2; WWP 1996, Downs and Jakubowski 2006, Downs and Jakubowski
2005a, Downs et al. 2003). Annual variation explained less than 30% of the variability in
CPUE in the majority of species sampled. Trends in CPUE by year were weakly present (α ≤
0.10) in bull trout, longnose sucker, northern pikeminnow, and pumpkinseed, suggesting some
shift in population density in these species may have occurred since 1994. Of those species
indicating weak trends in relative abundance, most demonstrated positive trends and overall low
abundance with the exception of northern pikeminnow, which demonstrated a negative trend and
high abundance.
Table 1. Population estimates by year and species including rainbow trout and hybrids
(RBT/HYB), westslope cutthroat trout (WCT), brown trout (BRN), and mountain
whitefish (MWF) from the approximately 6.6 km study area in the lower Clark Fork
River, Idaho. Sample sizes for marked (M), captured (C), and recaptured (R) groups as
well as associated 95% confidence intervals were included.
Year Species M C R Estimate Lower 95% CI Upper 95% CI
1999 RBT/HYB 46 37 4 356 117 1,256
2000 RBT/HYB 86 38 16 199 114 333
2001 RBT/HYB 17 29 6 76 30 191
2003 RBT/HYB 36 13 5 85 30 240
2005 RBT/HYB 37 36 7 175 75 412
2007 RBT/HYB 33 26 5 152 55 440
1999 WCT 18 20 3 99 26 443
2000 WCT 29 13 3 104 28 464
2001 WCT 18 18 3 89 24 399
2003 WCT 25 25 4 134 43 461
2005 WCT 30 21 3 170 46 775
2007 WCT 29 18 3 142 38 642
2000 BRN 30 25 4 160 52 554

8
Table 1. Continued
Year Species M C R Estimate Lower 95% CI Upper 95% CI
2002 BRN 58 30 15 113 64 193
2004 BRN 128 73 38 244 172 336
2006 BRN 75 44 22 148 93 227
2008 BRN 133 60 28 281 187 412
2000 MWF 142 103 3 3,717 1,076 17,990
2002 MWF 757 547 45 9,029 6,650 12,282
2004 MWF 610 644 47 8,209 6,089 11,086
2006 MWF 653 322 24 8,449 5,534 13,036
2008 MWF 261 219 8 6,404 3,007 14,633
Figure 2. Estimated abundance of target species >200 mm by study year captured in the 6.6 km
study reach of the lower Clark Fork River, Idaho. Error bars represent 95%
confidence intervals. Note difference in scale for that portion of the figure
representing mountain whitefish.
Collected fish samples generally represented age classes of two years and greater as estimated
from lengths of sampled fish. Minimum total lengths of all target species were skewed toward
lengths greater than 150mm (Table 3). Sampled rainbow trout and westslope cutthroat trout
were primarily longer than 200mm. Mean total length of all fish species among all years was
greater than 300mm indicating samples were skewed toward larger fish.
0
200
400
600
800
1000
1200
1400
2000 2002 2004 2006 2008
Est
imat
ed A
bund
ance
Brown Trout
0
5000
10000
15000
20000
2000 2002 2004 2006 2008
Est
imat
ed A
bundan
ce
Mountain Whitefish
0
200
400
600
800
1000
1200
1400
1999 2000 2001 2003 2005 2007
Est
imat
ed A
bund
ance
Rainbow Trout and Hybrids
0
200
400
600
800
1000
1200
1400
1999 2000 2001 2003 2005 2007
Est
imat
ed A
bund
ance
Westslope Cutthroat Trout

9
Table 2. Results of regression analysis between year (1994, 1999, 2001, 2003, 2005, and 2007)
and CPUE for fish species collected in the lower Clark Fork River, Idaho including;
Average CPUE, the square of Pearson’s correlation coefficient (r2), slope of regression
line through the data, and the P-value indicating significance of the relationship.
Species Average CPUE r2 Slope P-value
Northern Pikeminnow 0.89 0.60 -0.06 0.07
Redside Shiner 0.56 0.42 -0.10 0.16
Kokanee 0.54 0.32 -0.11 0.24
Peamouth 0.45 0.00 < 0.01 0.94
Largescale sucker 0.43 0.09 -0.02 0.57
Mountain whitefish 0.18 0.04 0.01 0.72
Brown Trout 0.07 0.45 0.01 0.15
Rainbow trout and Hybrids 0.05 0.14 < 0.01 0.47
Lake whitefish 0.04 0.31 0.01 0.26
Westslope Cutthroat Trout 0.03 0.09 < 0.01 0.57
Yellow Perch 0.01 0.39 < 0.01 0.18
Largemouth bass 0.01 0.13 < 0.01 0.48
Smallmouth bass < 0.01 0.16 < 0.01 0.44
Pumpkinseed < 0.01 0.61 < 0.01 0.07
Bull Trout < 0.01 0.53 < 0.01 0.10
Longnose Sucker < 0.01 0.61 < 0.01 0.07
Walleye < 0.01 0.03 < 0.01 0.76
Tench < 0.01 0.03 < 0.01 0.76
Brown bullhead < 0.01 0.03 < 0.01 0.76
Table 3. Number sampled (n) and minimum, maximum, mean, and standard deviation of total
length for target species collected in the lower Clark Fork River, Idaho during mark
recapture surveys between 1999 and 2008.
Year Species n Min TL Max TL Mean TL STD
2000 Brown trout 52 205 705 387 107
2002 Brown trout 70 260 592 387 71
2004 Brown trout 167 127 700 359 85
2006 Brown trout 100 109 780 384 97
2008 Brown trout 171 150 560 356 58
2000 Mountain whitefish 296 148 428 316 50
2002 Mountain whitefish 177 215 466 329 41
2004 Mountain whitefish 1,245 128 470 330 45
2006 Mountain whitefish 907 157 454 340 39
2008 Mountain whitefish 477 141 436 348 35
1999 Rainbow trout 79 146 575 339 70

10
Table 3. Continued
Year Species n Min TL Max TL Mean TL STD
2000 Rainbow trout 108 221 785 354 67
2001 Rainbow trout 37 241 470 364 58
2003 Rainbow trout 44 255 482 350 45
2005 Rainbow trout 65 223 746 349 96
2007 Rainbow trout 53 224 590 373 81
1999 Westslope cutthroat 36 258 375 319 30
2000 Westslope cutthroat 31 259 411 308 41
2001 Westslope cutthroat 26 255 387 322 42
2003 Westslope cutthroat 46 255 421 319 40
2005 Westslope cutthroat 49 247 412 327 37
2007 Westslope cutthroat 48 266 427 327 42
1999 Rainbow Hybrids 7 248 432 341 59
2000 Rainbow Hybrids 0
2001 Rainbow Hybrids 0
2003 Rainbow Hybrids 0
2005 Rainbow Hybrids 16 187 473 323 63
2007 Rainbow Hybrids 6 281 408 333 48
Structural indices demonstrated variability across the ten-year study period in all target species.
Observed PSD values for all target species ranged between 61 and 89 except in 2000 in which
the proportion of sampled westslope cutthroat trout greater than 305 mm was considerably less
as represented by a PSD of 29 (Figure 3). Observed QSD values for all target species ranged
from 0 to 43 and were more variable by species. Proportionally, few mountain whitefish or
westslope cutthroat trout over 406 mm were sampled in contrast to catches of rainbow trout and
brown trout (Figure 3). Trends in structural indices by year were generally positive except
brown trout QSD (Table 4). However significant trends were only observed in mountain
whitefish (PSD) and rainbow trout (QSD) populations. PSD values for mountain whitefish
increased from 67 to 89 and QSD values for rainbow trout increased from 10 to 32. Shifts in size
structure associated with these significant trends represented proportional increases in catch of
mountain whitefish between 305 mm to 406 mm and in catch of rainbow trout ≥ 406 mm.

11
Figure 3. Stock density indices including proportional stock density and quality stock density by
year for target species sampled in the lower Clark Fork River, Idaho from 1999 to
2008.
Table 4. Results of regression analysis between year and relative stock density indices (PSD and
QSD) for target species sampled in the lower Clark Fork River, Idaho including the
square of Pearson’s correlation coefficient (r2), slope of regression line through the
data, and the P-value indicating significance of the relationship.
Species Indice Slope r2 P-value
Brown trout PSD 0.56 0.10 0.61
Brown trout QSD -2.23 0.43 0.23
Mountain whitefish PSD 2.62 0.90 0.01
Mountain whitefish QSD 0.08 0.16 0.51
Westslope cutthroat trout PSD 1.46 0.10 0.55
Westslope cutthroat trout QSD 0.13 0.05 0.68
Rainbow trout PSD 0.88 0.09 0.57
Rainbow trout QSD 2.53 0.69 0.04
0
20
40
60
80
100
2000 2002 2004 2006 2008
Sto
ck D
ensi
ty I
nd
ex
Brown Trout
PSD
QSD
0
20
40
60
80
100
2000 2002 2004 2006 2008
Sto
ck D
ensi
tyIn
dex
Mountain Whitefish
PSD
QSD
0
20
40
60
80
100
1999 2000 2001 2003 2005 2007
Sto
ck D
ensi
ty I
nd
ex
Rainbow Trout
PSD
QSD
0
20
40
60
80
100
1999 2000 2001 2003 2005 2007
Sto
ck D
ensi
ty I
nd
ex
Westslope Cutthroat Trout
PSD
QSD
12
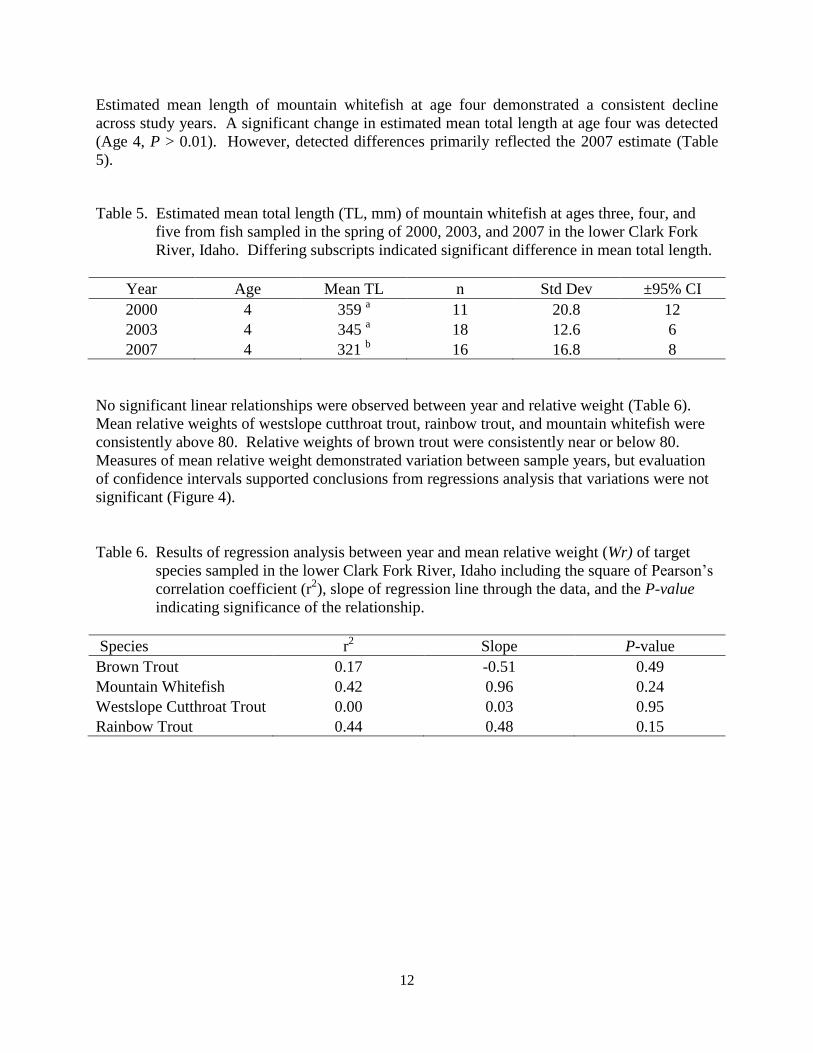
Estimated mean length of mountain whitefish at age four demonstrated a consistent decline
across study years. A significant change in estimated mean total length at age four was detected
(Age 4, P > 0.01). However, detected differences primarily reflected the 2007 estimate (Table
5).
Table 5. Estimated mean total length (TL, mm) of mountain whitefish at ages three, four, and
five from fish sampled in the spring of 2000, 2003, and 2007 in the lower Clark Fork
River, Idaho. Differing subscripts indicated significant difference in mean total length.
Year Age Mean TL n Std Dev ±95% CI
2000 4 359 a 11 20.8 12
2003 4 345 a 18 12.6 6
2007 4 321 b 16 16.8 8
No significant linear relationships were observed between year and relative weight (Table 6).
Mean relative weights of westslope cutthroat trout, rainbow trout, and mountain whitefish were
consistently above 80. Relative weights of brown trout were consistently near or below 80.
Measures of mean relative weight demonstrated variation between sample years, but evaluation
of confidence intervals supported conclusions from regressions analysis that variations were not
significant (Figure 4).
Table 6. Results of regression analysis between year and mean relative weight (Wr) of target
species sampled in the lower Clark Fork River, Idaho including the square of Pearson’s
correlation coefficient (r2), slope of regression line through the data, and the P-value
indicating significance of the relationship.
Species r2 Slope P-value
Brown Trout 0.17 -0.51 0.49
Mountain Whitefish 0.42 0.96 0.24
Westslope Cutthroat Trout 0.00 0.03 0.95
Rainbow Trout 0.44 0.48 0.15

13
Figure 4. Mean relative weight (Wr) by study year estimated for target species captured in the
lower Clark Fork River, Idaho. Error bars represent 95% confidence intervals.
DISCUSSION
Results suggested abundance, size structure, and condition of fish populations in the lower Clark
Fork River were largely unchanged following increases in minimum flow below Cabinet Gorge
Dam and in-channel improvements to the Foster Bar side-channel. No significant change in
abundance of target and non-target fish species sampled in the study reach was detected. Size
structures of brown and westslope cutthroat trout populations remained stable. Mountain
whitefish and rainbow trout demonstrated detectable increases in the proportions of larger fish
present. However, different segments of the mountain whitefish and rainbow trout populations
were affected. Rainbow trout demonstrated increased presence of fish greater than 405 mm,
while mountain whitefish demonstrated increases in fish greater than 302 mm. Notably few
whitefish greater than or equal to 400 mm were collected. The physical condition of all target
species was stable throughout the study period. Although significant shifts in estimated metrics
were not observed, high variability within and or between estimates suggested testing power may
have been limited and likely reflects the challenges associated with sampling the lower Clark
Fork River. This condition was notably evident in abundance estimates and structural indices.
The increase in the proportional size structure of mountain whitefish was likely independent of
change in growth rate and occurred in the absence of detectable changes in abundance,
suggesting other factors may have contributed to the observed trend. Length at age, the
surrogate of growth, for sampled mountain whitefish demonstrated a significant decline across
70
80
90
100
110
1999 2000 2001 2003 2005 2007
Wr
Westslope Cutthroat Trout
70
80
90
100
110
1999 2000 2001 2003 2005 2007
Wr
Rainbow Trout
60
70
80
90
100
2000 2002 2004 2006 2008
Wr
Brown Trout
60
70
80
90
100
2000 2002 2004 2006 2008
Wr
Mountain Whitefish

14
sample years. A reduction in growth contradicted observations of increased proportions of
quality size fish sampled over the study period. Growth of mountain whitefish in the lower
Clark Fork River based on mean length at age (range 321 to 359 mm at age four) was
comparable to other whitefish populations. For example, length at age four of Kootenai River
whitefish downstream of Libby Dam immediately post impoundment ranged between 296 and
349 mm in spring samples (Partridge 1983), while modeled length of whitefish at age four from
representative sites across Idaho was approximately 314 mm (Meyer et al. 2009). Abundance
monitoring failed to detect changes in mountain whitefish abundance, suggesting increased
proportions of quality size fish were not representative of increased numbers of larger fish due to
increased recruitment or survival. However, analysis of abundance by specified length group
was not feasible due to limited recaptures and therefore limited the ability of detecting length
specific increases. The majority of recaptured whitefish were between 300 mm and 400 mm,
and likely represented largely three to five year old fish. Recaptures were further limited in
collections of rainbow trout, precluding their evaluation.
The observed increase in the proportional size structure of sampled rainbow trout and mountain
whitefish may have resulted from changes in sampling protocol. As noted, sampling crews
indicated the effectiveness of finding and sampling whitefish increased following early sampling
efforts, potentially resulting in a collection of more and larger fish. This change was in large part
reflective of including a new portion of the river (mid channel) in the sampled area.
Results also suggested foraging conditions were not improved by increased minimum flow as
intended. Increased minimum flow was intended to provide additional wetted habitat that would
benefit the fish community in part by enhancing habitat for aquatic invertebrate fauna and
subsequently promoting foraging conditions. Conditional indices demonstrated stability across
target species suggesting no changes in invertebrate fauna occurred. Stable relative weights
below 100 suggested less than optimum foraging conditions existed in the Clark Fork River
(Anderson and Neumann 1996). However, caution should be used when comparing relative
weights against an optimal condition (i.e. 100) as environmental limitations may vary
considerably and subsequently impact resulting conclusions (Murphy et al. 1991, Willis et al.
1991). Short term flow alterations similar to those of the lower Clark Fork River have been
demonstrated to effect invertebrate fauna density and distribution (Gislason 1985) and may have
contributed to the inability to detect changes in fish condition. However, the response of aquatic
invertebrates to increased minimum flow is unknown as no monitoring of invertebrate fauna was
included in this study.
Fish populations in the lower Clark Fork River in Idaho may be affected regardless of minimum
flow increases by low habitat variability in the study reach. Only three main riffle sections exist
during low LPO lake levels. Normal summer pool levels in LPO inundate the lower most riffle
at the mouth of Lightning Creek and impact the lower end of the Foster Bar side-channel, further
limiting habitat complexity. Limited complexity likely includes a lack of in-river spawning
habitat. The absence of smaller size classes of all target species sampled suggested spawning
and early rearing of target species largely takes place outside of the main river, likely in adjacent
tributary streams. Prior to isolation by Cabinet Gorge, Noxon Rapids, and Thompson Falls
(located upstream of Noxon Rapids) dams it is likely native fish populations in the lower Clark
Fork River, Idaho were influenced to a larger extent by connectivity to abundant spawning and

15
rearing habitats upstream in Montana.
After 10 years of evaluating an increase in minimum flow from 84.9 cms (3,000 cfs) to 141.5
cms (5,000 cfs), no significant trend in fish abundance, size structure, or condition of target
species was detectable. A number of factors acting in combination likely continue to regulate
salmonid abundance and condition in the lower Clark Fork River below Cabinet Gorge Dam
outside of the affects of minimum flows. Limiting factors may have included large daily flow
fluctuations, low habitat diversity, availability of spawning and early rearing habitat, high
summer water temperatures, and elevated total dissolved gas below Cabinet Gorge Dam (Land
and Water Consulting 2001, PBTAT 1998, Parametrics 2000 a, Parametrics 2000b). However,
these factors were not included in this study and where appropriate are being studied/mitigated
through other CFSA programs.
RECOMMENDATIONS
Based on this evaluation the 5,000 cfs minimum flow does not appear to be warranted. In
accordance with the CSFA Appendix T, and within one year of this report, the MC
should review the resource benefits and economic value of power peaking between the
minimum flow of 3,000 and 5,000 cfs and if warranted renegotiate the minimum flow
below Cabinet Gorge.
Continue working within the Clark Fork Settlement Agreement to insure facilitation of
passage programs for migratory native fish is continued and that decision making relative
to minimum flows consider impacts to this program.
Continue to monitor fish populations in the lower Clark Fork River at a reduced
frequency to enable continued long term evaluation of population changes relative to
future water management.
ACKNOWLEDGEMENTS
Thanks to Shaun Wilkenson, John Suhfras, Jeremy Stover, Sherryl Skaggs, Sean Moran,
Ryan Weltz, Kevin Duffy, Shana Bernall, Josh Storaasli, Meggin Weinandt and Tyler Long
of Avista, for assistance with field work. We would also like to thank Chip Corsi, Jim
Fredericks of IDFG, Ryan Kriener of Montana Fish, Wildlife, and Parks, Joe DosSantos of
Avista, and Wade Fredenberg of the U.S. Fish and Wildlife Service for their review of this
report.

16
LITERATURE CITED
Anderson, R.O. and R.M. Neumann. 1996. Length, weight, and associated structural indices.
Pages 447-482 in Fisheries Techniques, 2nd
Edition, American Fisheries Society,
Bethesda, Maryland.
Anderson, R. 1978. Age and growth of Pend Oreille Lake Kamloops. Idaho Department of
Fish and Game. Federal aid to Fish and Wildlife Restoration. Lake and Reservoir
Investigations Project F-53-R-12 and 13. Boise.
Avista Corporation. 1999. Volume III, Clark Fork Settlement Agreement. Spokane,
Washington.
Beak Consultants, Inc. 1997. Photo documentation of flows in the lower Clark Fork River.
Report to Washington Water Power. Portland, Oregon.
Chapman, D.G. 1948. A mathematical study of confidence limits of salmon populations
calculated from sample tag ratios. International Pacific Salmon Fisheries Commission
Bulletin 2:69-85.
Dalbey, S.R., T.E. McMahon, and W. Fredenberg. 1996. Effect of electrofishing pulse shape
and electrofishing induced spinal injury on long-term growth and survival of wild
rainbow trout. North American Journal of Fisheries Management 16:560-569.
Downs C., and R. Jakubowski. 2003. Lake Pend Oreille/Clark Fork River Fishery Research and
Monitoring 2002 Progress Report. Project 2, 2002 bull trout redd counts; Project 3, 2002
Clark Fork River fishery assessment progress report; Project 5, 2000-2002 Trestle and
Twin creeks bull trout outmigration and Lake Pend Oreille survival study; Project 6, 2002
Johnson and Granite creeks bull trout trapping; Project 7, 2002 Twin Creek restoration
monitoring progress report. Avista Corporation. Spokane, Washington.
Downs C., and R. Jakubowski. 2005a. Lake Pend Oreille/Clark Fork River Fishery Research
and Monitoring 2003 Progress Report. Lake Pend Oreille bull trout redd counts; Clark
Fork River fishery assessment; Trestle and Twin creeks bull trout outmigration and Lake
Pend Oreille survival study; Johnson and Granite creeks bull trout trapping; Twin Creek
restoration monitoring. Avista Corporation, Spokane, Washington.
Downs C., and R. Jakubowski. 2005b. Lake Pend Oreille/Clark Fork River Fishery Research
and Monitoring 2004 Progress Report. Lake Pend Oreille bull trout redd counts; Clark
Fork River fishery assessment; Trestle and Twin creeks bull trout outmigration and Lake
Pend Oreille survival study; Johnson and Granite creeks bull trout trapping; Twin Creek
restoration monitoring; tributary fish population monitoring. Report number IDFG 05-51
to Avista Corporation from the Idaho Department of Fish and Game. Boise.
Downs C., and R. Jakubowski. 2006. Lake Pend Oreille/Clark Fork River Fishery Research and

17
Monitoring 2005 Progress Report. Lake Pend Oreille bull trout redd counts; Clark Fork
River fishery assessment; Trestle and Twin creeks bull trout outmigration and Lake Pend
Oreille survival study; Johnson and Granite creeks bull trout trapping; Twin Creek
restoration monitoring; tributary fish population monitoring; lower Clark Fork River
westslope cutthroat trout radio-telemetry and genetic study progress report. Report
number IDFG 06-41 to Avista Corporation from the Idaho Department of Fish and Game.
Boise.
Downs, C.C., R. Jakubowski, and S. Moran. 2003. Lake Pend Oreille/Clark Fork River Fishery
Research and Monitoring 1999-2001 Progress Report. Project 1, Johnson and Rattle
creeks bull trout trapping; Project 2, Bull trout redd counts and escapement estimates
1999-2001; Project 3, Clark Fork River fishery assessment 1999-2001; Project 4, Lake
Pend Oreille tributary in stream flow evaluation. Avista Corporation. Spokane,
Washington.
Federal Energy Regulatory Commission. 2000. Order issuing new license for Clark Fork River
Projects. Federal Energy Regulatory Commission, Washington, D.C.
Frenzel, S.A. 1991. Hydrologic budgets, Pend Oreille Lake, Idaho 1989-90. U.S. Geological
Survey. Boise, Idaho.
Gislason, J. C. 1985. Aquatic insect abundance in a regulated stream under fluctuating and
stable diel flow patterns. North American Journal of Fisheries Management 5:39-46.
Hayes, D. B., J. R. Bence, T. J. Kwak, and B. E. Thompson. 2007. Abundance, biomass, and
production in Analysis and interpretation of freshwater fisheries data, C. S. Guy and M.
L. Brown, editors. American Fisheries Society, Bethesda, Maryland.
Heimer, J.T., 1965. A supplemental Dolly Varden spawning area. M.S. Thesis, University of
Idaho. Moscow.
Krebs, C.J. 1989. Ecological Methodology. Harper-Collins Publishers, Inc. New York, New
York.
Land and Water Consulting, Inc. 2001. Water Quality Status and Trend Monitoring System for
the Clark Fork-Pend Oreille Watershed. Summary Monitoring Report (2000) to the Tri-
State Water Quality Council, Sandpoint, Idaho.
Lee, K.H., and R.S. Lunetta. 1990. Watershed characterization using Landsat Thermatic
Mapper ™ satellite imagery, Lake Pend Oreille, Idaho. U.S. EPA Environmental
Monitoring Systems Lab. Las Vegas, Nevada.
McMaster, K.M. 1999. Biological opinion for relicensing of Cabinet Gorge and Noxon Rapids
Hydroelectric Projects on the Clark Fork River. U.S. Fish and Wildlife Service, Montana
Field Office, Helena, Montana.

18
Meyer, K. A., F.S. Elle, and J. A. Lamansky, Jr. 2009. Environmental factors related to the
distribution, abundance, and life history characteristics of mountain whitefish in Idaho.
North American Journal of Fisheries Management 29:753-767.
Murphy, B. R., D. W. Willis, and T. A. Springer. 1991. The relative weight index in fisheries
management: status and needs. Fisheries 16(2): 30-38.
Normandeau Associates. 2001. Movement and Behavior of Adfluvial Bull Trout Downstream
of the Cabinet Gorge Dam, Clark Fork River, Idaho. Prepared for Avista Corporation,
Spokane, Washington.
Panhandle Bull Trout Technical Advisory Team (PBTAT). 1998. Lake Pend Oreille Key
Watershed Bull Trout Problem Assessment. Idaho Department of Environmental
Quality. Boise.
Parametrix, Inc. 2000a. Gas bubble disease lower Clark Fork River. Final Report to Avista
Corporation, Spokane, Washington
Parametrix, Inc. 2000b. Total dissolved gas monitoring Cabinet Gorge and Noxon Rapids
hydroelectric projects, 2000. Final Report to Avista Corporation, Spokane, Washington.
Partridge, F. E. 1983. Subproject IV River and stream investigations, Study VI Kootenai River
Fisheries Investigations. Job Completion Report. Project F-73-R-5. Idaho Department
of Fish and Game, Boise.
Schill, D.J. 1991. River and stream investigations. Sub project 2. Study 4: Wild trout
investigations. Job 1: Statewide data summary. Job 2: Bull trout ageing and
enumeration. Job 3: Bait hooking mortality. Job 4: Electrophoresis sampling. Job
Performance Report. Project F-73-R-13. Idaho Department of Fish and Game. Boise.
Seber, G.A.F. 1982. The estimation of animal abundance and related parameters, 2nd
edition.
Griffin, London.
Washington Water Power. 1995. Evaluation of Fish Communities on the Lower Clark Fork
River, Idaho. Spokane, Washington
Washington Water Power. 1996. 1994-1995 Evaluation of Fish Communities on the Lower
Clark Fork River, Idaho: A Supplemental Report. Spokane, Washington.
Weitkamp, D.E., R.D. Sullivan, T. Swant and J. DosSantos. 2003. Gas Bubble Disease in
Resident Fish of the Lower Clark Fork River. Transactions of the American Fisheries
Society 132(5): 865-876.
Willis, D. W., C. S. Guy, and B. R. Murphy. 1991. Development and evaluation of a standard
weight (Ws) equation for yellow perch. North American Journal of Fisheries
Management 11:374-380.