Low Temperature Automotive Diesel Combustion · Low Temperature Automotive Diesel Combustion...
16
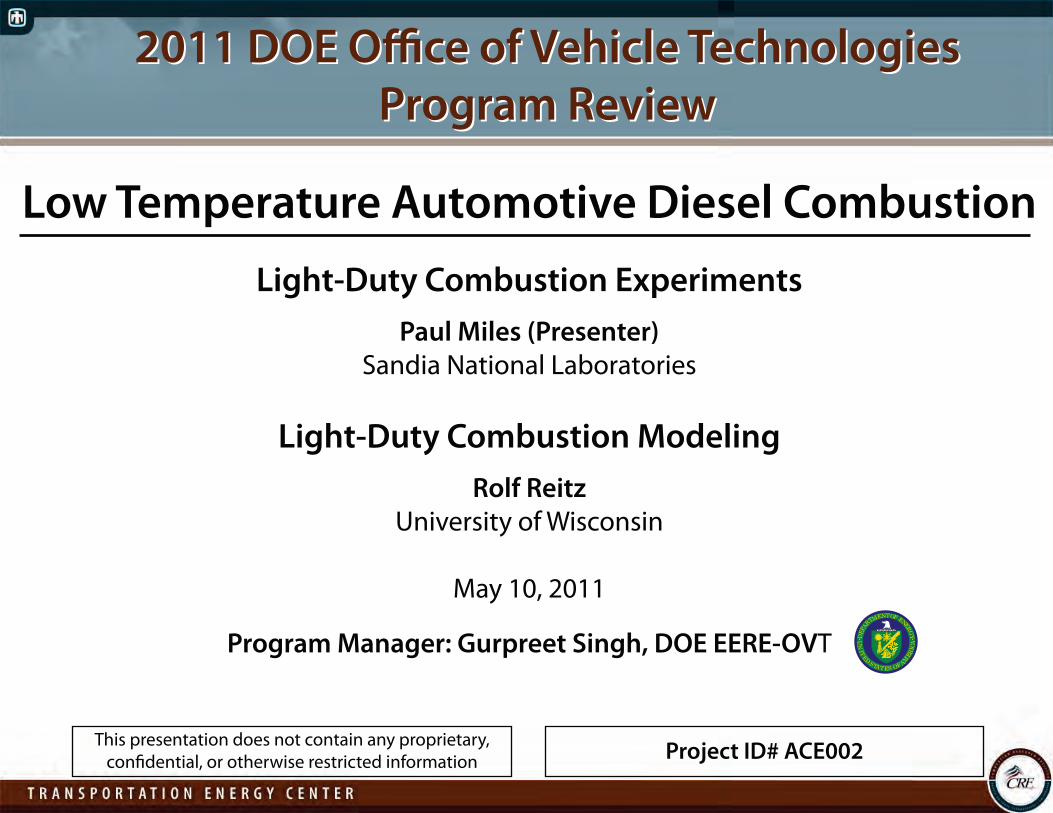
Low Temperature Automotive Diesel Combustion Light-Duty Combustion Experiments Paul Miles (Presenter) Sandia National Laboratories Light-Duty Combustion Modeling Rolf Reitz University of Wisconsin May 10, 2011 Program Manager: Gurpreet Singh, DOE EERE-OVT M O F E Y D P A R T E N T N E E R G E A U N I D O F M R C T S T S E T A I A E 2011 DOE Ofce of Vehicle Technologies Program Review 2011 DOE Ofce of Vehicle Technologies Program Review This presentation does not contain any proprietary, confdential, or otherwise restricted information Project ID# ACE002
Transcript of Low Temperature Automotive Diesel Combustion · Low Temperature Automotive Diesel Combustion...
Low Temperature Automotive Diesel Combustion
Light-Duty Combustion Experiments
Paul Miles (Presenter)
Sandia National Laboratories
Light-Duty Combustion Modeling
Rolf Reitz
University of Wisconsin
May 10, 2011
Program Manager: Gurpreet Singh, DOE EERE-OVT M OF
E YD PAR
T ENT NE ERG
E
AUNI
D OF
MR C
T
ST S
E
TA
I
A
E
2011 DOE Office of Vehicle Technologies
Program Review
2011 DOE Office of Vehicle Technologies
Program Review
This presentation does not contain any proprietary, confidential, or otherwise restricted information Project ID# ACE002

OverviewOverview
Timeline:
t� 1SPKFDU�IBT�TVQQPSUFE�%0&�JOEVTUSZ�BEWBODFE� FOHJOF�EFWFMPQNFOU�QSPKFDUT�TJODF�����
t� %JSFDUJPO�BOE�DPOUJOVBUJPO�FWBMVBUFE�ZFBSMZ
Barriers addressed:
A� -BDL�PG�GVOEBNFOUBM�LOPXMFEHF
B, G� -BDL�PG�DPTU�FòFDUJWF�FNJTTJPO�DPOUSPM
C� -BDL�PG�NPEFMJOH�DBQBCJMJUZ
Technical targets addressed:
t� ����EJFTFM�GVFM�FDPOPNZ�JNQSPWFNFOU
t� 5JFS�� �CJO���FNJTTJPOT
t� &NJTTJPO�DPOUSPM�FóDJFODZ�QFOBMUZ�����
t� �����L8�QPXFS�TQFDJöD�DPTU
#BSSJFST�5 BSHFUT�GSPN�&&3&�75���������.VMUJ�ZFBS�QSPHSBN�QMBO
Budget:
%0&�GVOEFE�PO�B�ZFBS�CZ�ZFBS�CBTJT
t� 4/-�����L�':�� �����L�':��
t� 68������L�':�� �����L�':��
Partners:
t� ���JOEVTUSZ�OBUJPOBM�MBCPSBUPSZ� QBSUOFST�JO�UIF�"EWBODFE�&OHJOF� $PNCVTUJPO�.06
t� $MPTF�DPMMBCPSBUJPO�XJUI�(.� GVOEFE�SFTFBSDI�BU�68�'PTUFS
t� "EEJUJPOBM�QPTU�EPD�GVOEFE�CZ� (.

Relevance of Sandia’s major technical
accomplishments (May 2010 – March 2011)
Relevance of Sandia’s major technical
accomplishments (May 2010 – March 2011)
1 Varied ignition quality and volatility independently in an orthogonal matrix to
examine the impact of these fuel properties on LTC CO and UHC emissions Barriers/Targets: Improved fundamental understanding of the role of fuel properties on enabling LTC combustion; fuel property parameter sweeps for modeling validation & sensitivity studies; Tier 2, bin 2 emissions target; 40% diesel fuel economy improvement (links to UW 1)
2 Assessed accuracy and implementation of RNG turbulence models Barriers/Targets: Improved modeling of in-cylinder processes (UW 2)
3 Examined asymmetries and mean flow structure in the induction flow via Par
ticle Image Velocimetry Barriers/Targets: Improved understanding and improved modeling of in-cylinder processes (UW 3)
4 Investigated wall-wetting by post-injections for PM trap regeneration for vari
ous injection timings and diesel/biodiesel fuel blends Barriers/Targets: Improved understanding of in-cylinder processes (penetration, spray disruption by exhaust flows); efficiency penalty of PM trap regeneration; 30 $/kW cost target
5 Consolidated measurements and simulations to provide a phenomenological
picture of light-load LTC combustion Barriers/Targets: Improved understanding and improved modeling of in-cylinder processes; Tier 2, bin 2 emissions target; 40% diesel fuel economy improvement (links to past UW work)

Relevance of UW’s major technical
accomplishments (May 2010 – March 2011)
Relevance of UW’s major technical
accomplishments (May 2010 – March 2011)
1 Examined sources of discrepancy in UHC and CO distributions between model
and experiment & identified spray/entrainment model as a dominant source Barriers/Targets: Improved understanding and improved modeling of in-cylinder processes; Tier 2, bin 2 emissions target; 40% diesel fuel economy improvement (links to SNL 1)
2 Evaluated variable density gas jets and engine flows with RNG turbulence clo
sure; derived alternative model dependent on the ‘dimensionality’ of the strain Barriers/Targets: Improved modeling of in-cylinder processes (SNL 2)
3 Examined intake flow modeling with detailed port, valve, and combustion
chamber mesh; examine impact of flow-field non-uniformities on UHC and CO Barriers/Targets: Improved understanding and improved modeling of in-cylinder processes; Tier 2, bin 2 emissions target; 40% diesel fuel economy improvement (SNL 3)
4 Examined light-duty RCCI combustion; upgraded engine fuel system(s) Barriers/Targets: Improved understanding and improved modeling of in-cylinder processes; Tier 2, bin 2 emissions target; 40% diesel fuel economy improvements
5 Improved soot model based on PAH kinetics; compared results to conventional,
PCCI, and RCCI combustion in light- and heavy-duty engines Barriers/Targets: Improved understanding and improved modeling of in-cylinder processes; Tier 2, bin 2 emissions target; 40% diesel fuel economy improvement; cost-effective emission control
Technical/Programmatic ApproachTechnical/Programmatic Approach
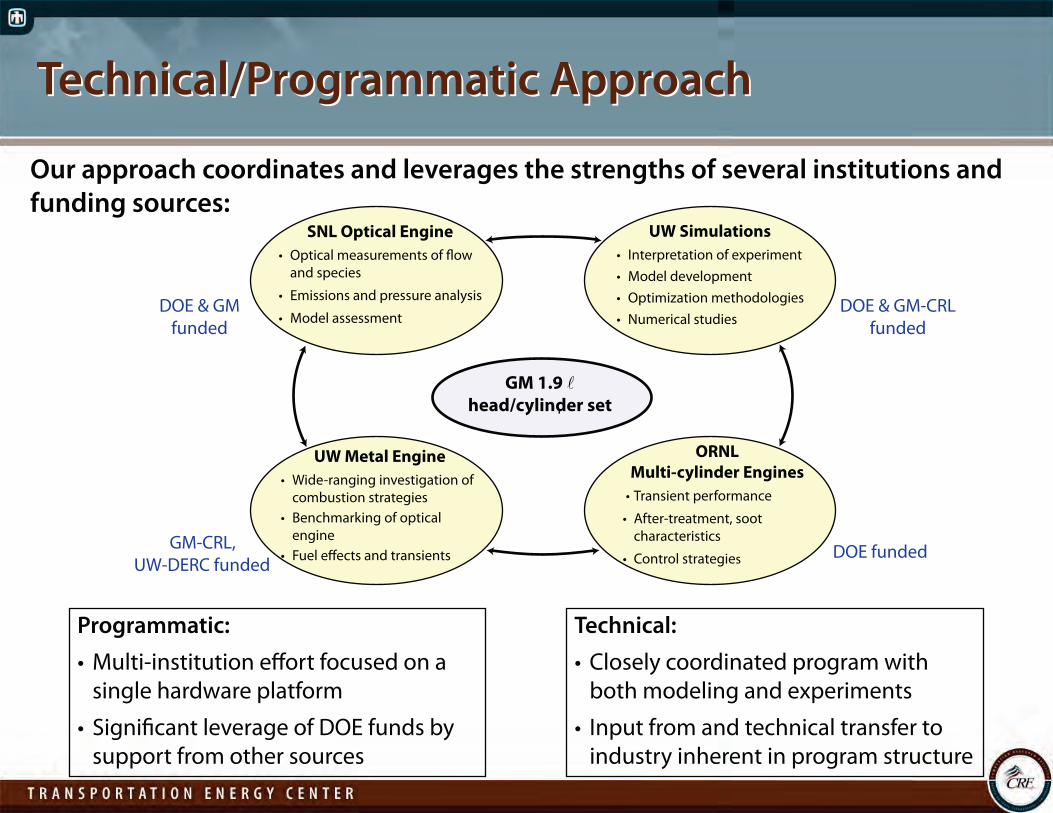
GM 1.9 l head/cylinder set
GM-CRL, UW-DERC funded
DOE funded
DOE & GM funded
DOE & GM-CRL funded
SNL Optical Engine �t� 0QUJDBM�NFBTVSFNFOUT�PG�øPX� BOE�TQFDJFT
�t� &NJTTJPOT�BOE�QSFTTVSF�BOBMZTJT
�t� .PEFM�BTTFTTNFOU
UW Metal Engine �t� 8JEF�SBOHJOH�JOWFTUJHBUJPO�PG� DPNCVTUJPO�TUSBUFHJFT
�t� #FODINBSLJOH�PG�PQUJDBM� FOHJOF�
�t� 'VFM�FòFDUT�BOE�USBOTJFOUT
ORNL Multi-cylinder Engines �t�5SBOTJFOU�QFSGPSNBODF
t� "GUFS�USFBUNFOU �TPPU� DIBSBDUFSJTUJDT
t� $POUSPM�TUSBUFHJFT
UW Simulations �t� *OUFSQSFUBUJPO�PG�FYQFSJNFOU �t� .PEFM�EFWFMPQNFOU �t� 0QUJNJ[BUJPO�NFUIPEPMPHJFT �t� /VNFSJDBM�TUVEJFT
Our approach coordinates and leverages the strengths of several institutions and
funding sources:
Programmatic:
t� .VMUJ�JOTUJUVUJPO�FòPSU�GPDVTFE�PO�B � TJOHMF�IBSEXBSF�QMBUGPSN
t� 4JHOJöDBOU�MFWFSBHF�PG�%0&�GVOET�CZ � TVQQPSU�GSPN�PUIFS�TPVSDFT
Technical:
t� $MPTFMZ�DPPSEJOBUFE�QSPHSBN�XJUI� CPUI�NPEFMJOH�BOE�FYQFSJNFOUT
t� *OQVU�GSPN�BOE�UFDIOJDBM�USBOTGFS�UP� JOEVTUSZ�JOIFSFOU�JO�QSPHSBN�TUSVDUVSF�
Accomplishments: In-cylinder sources of UHC/COAccomplishments: In-cylinder sources of UHC/CO
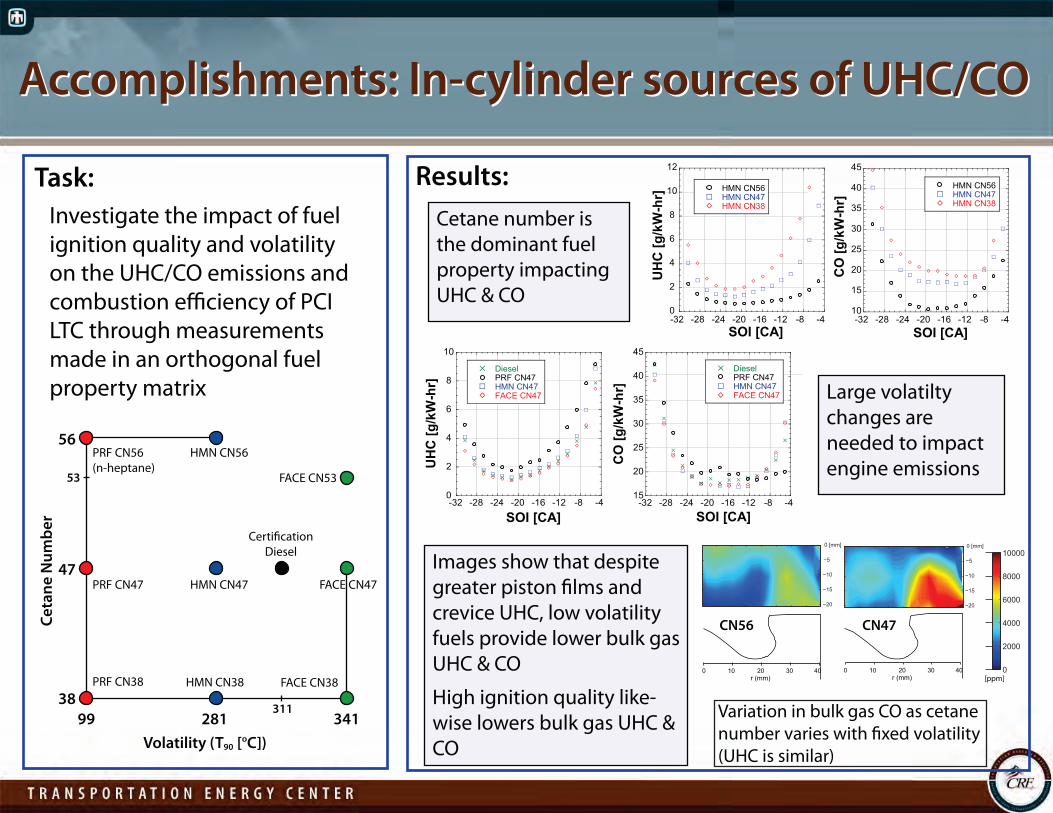
Task:
Investigate the impact of fuel ignition quality and volatility on the UHC/CO emissions and combustion efficiency of PCI LTC through measurements made in an orthogonal fuel property matrix
Volatility (T90 [oC])
99 281 341
Ce
tan
e N
um
be
r
PRF CN38 HMN CN38
PRF CN47 HMN CN47
Diesel
PRF CN56 (n-heptane)
HMN CN56
FACE CN53
FACE CN38
FACE CN47
31138
47
56
53
Results:
Cetane number is the dominant fuel property impacting UHC & CO
Large volatilty changes are needed to impact engine emissions
Images show that despite greater piston films and crevice UHC, low volatility fuels provide lower bulk gas UHC & CO
High ignition quality likewise lowers bulk gas UHC & CO
Variation in bulk gas CO as cetane number varies with fixed volatility (UHC is similar)
10
15
20
25
30
35
40
45
-32 -28 -24 -20 -16 -12 -8 -4
CO
[g/k
W-h
r]
SOI [CA]
0
2
4
6
8
10
12
-32 -28 -24 -20 -16 -12 -8 -4
HMN CN56 HMN CN47 HMN CN38
UH
C [g
/kW
-hr]
SOI [CA]
HMN CN56 HMN CN47 HMN CN38
0
2
4
6
8
10
-32 -28 -24 -20 -16 -12 -8 -4
Diesel PRF CN47 HMN CN47 FACE CN47
UH
C [g
/kW
-hr]
SOI [CA]
15
20
25
30
35
40
45
-32 -28 -24 -20 -16 -12 -8 -4
CO
[g/k
W-h
r]
SOI [CA]
Diesel PRF CN47 HMN CN47 FACE CN47
0
2000
4000
6000
8000
10000
[ppm]
−20
−15
−10
−5
0 [mm]
−20
−15
−10
−5
0 [mm]
0 10 20 30 40 r (mm)
0 10 20 30 40 r (mm)
CN56 CN47

Accomplishments: In-cylinder sources of UHC/COAccomplishments: In-cylinder sources of UHC/CO
Task:
Identify the source of the discrepancy between the experiments and regarding the dominant in-cylinder source of UHC and CO emissions
Results:
Previous work demonstrated that:
� t� *NQSPWFNFOUT�UP�SFEVDFE�LJOFUJD�NFDIBOJTN�IFMQFE �CVU�EJE� OPU�GVMMZ�SFTPMWF�UIF�EJTDSFQBODZ
� t� *OWFTUJHBUFE�TFOTJUJWJUZ�UP�5in �HSJE�SFTPMVUJPO �02 �CPXM�WPMVNF �$d
� t� 3FNBJOJOH�EJTDSFQBODZ�BTTPDJBUFE�XJUI�NJYJOH�QSPDFTTFT
This year have investigated model sensitivity to:
� t� 3 s �iTXJQSPw �1inj ��5wall �40* �Nfuel �UVSC����XBMM�JNQJOHFNFOU�NPEFMT
But the most promising improvement was associated with
the new gas jet spray modeling:
6OEFSNJYFE�QMVNF�MFBWJOH�UIF� bowl is not seen experimentally
CO
C2 (partiallyburned)
0
0.5
1
0
0.5
1
white isotherm = 1200 K
green isotherm = 1500 K
Mole Fraction
5.0 x 10⁻³
0.0UHC
CO Mole
Fraction
0.00
0.01
Experiment Simulation
3FTVMUT�IBWF�UIF� HSFBUFTU�TFOTJUJWJUZ�UP� 3 s and 1inj
'VUVSF�XPSL�XJMM�GPDVT� on model tuning to predict a range of 3 s � 1inj �BOE�Enozzle

Accomplishments: Turbulence model assessmentAccomplishments: Turbulence model assessment
Background:
Standard k-ε turbulence modeling cannot predict both compression and expansion with a single set of constants
Task:
Investigate the performance of the (variable constant) RNG k-ε model
Results:
The RNG closure severely overestimates k and l, due to the underestimation of ε
The penetration of variable density gas jets is underpredicted for the same reasons
The flow and turbulence
modeling underpins the
simulation of the mixing
and combustion pro
cesses
Turbulent
kinetic
energy
k [
Sp2
] ε
[S p2
/s]
Dissipation
Experiment
Experiment
Experiment
RNG
RNG
RNG
Std. k-ε model
Std. k-ε model
-60 -40 -20 0 20 40 60 Crank Angle
-0.01
0
0.01
0.02
0.03
0.04
0.05 0
0.5
1
1.5
l [m
m] Length
scale
0
2
4
6
8
10
12
14
-60 -40 -20 0 20 40 60 Crank Angle
Std. k-ε model
Time [ms]
He
tip p
enet
ratio
n [m
m]
0 0
10
20
30
40
50
60
1 2 3 4 5 6
Experiment
RNG
Std. k-ε model

Accomplishments: Turbulence model short-
comings: causes and redress
Accomplishments: Turbulence model short
comings: causes and redress
Redress:
An alternative compressible RNG closure based on the ‘dimensionality’ of the flow field has been developed and is being tested
As implemented, C3 is computed as strain rate (Sij) dependent – it is not evaluated in the rapid distortion limit
KIVA RNG k-ε coding:
if(diverg(i4).gt.0.0) then ce3=0.41333+0.06899*reta*retaeq
else ce3=0.41333-0.06899*reta*retaeq
endif
)1(3 6
1 )(
1 3 2– 4 1
3
δ μ
ν ν
−+
⋅∇ +
+ =
C
dt dCC
U} ( ) 3
2 0
1 1
ηβηηη
+ −
)) ijS ijS2=η k ε
In this case, the RNG-specific terms are:
In this implementation, the model behaves considerably better (similar to k-ε), though it has no physical/mathematical basis
Future work will focus on more thorough model testing against engine measurements and DNS calculations
Difference between the characteristic strain rate and the characteristic rate associated with pure spherical distortion, S11 = S22 = S33 = ( )/3
} ( ) ⎥ ⎦
⎤ ⎢ ⎣
⎡ ⋅∇−
+ −
U
⋅∇ U
3 62
1 1
3 0
2
ijij SSC
ηβεηηημ( )U⋅∇+ =εη,3CR
Time [ms]
He
tip p
enet
ratio
n [m
m]
0 0
10
20
30
40
50
60
1 2 3 4 5 6
Experiment
RNG
Generalized RNG

AAccccomplishments:omplishments:
IInn--ccylinder floylinder flow charw characactterizaerizationtion
Task:
Characterize in-cylinder flow structure to:
i) Validate induction stroke calculations
ii) Clarify flow structure for closed-cycle simulations
iii)
Evaluate asymmetry of the pre-combustion flow(need for 360° grid)
Method: Horizontal Plane PIV with distortion correction
Results: 50° b TDC h = 3 mm h = 10 mm h = 18 mm
Exhaust Exhaust
Intake Intake
30 m/s Black circle identifies center of swirl structure
15 (4.5) Numbers in parenthesis repreh = 3 mm (2.2)h = 10 mm10 sent swirl ratio, circles representh = 18 mm
1-σ deviation (3.5)5
Laser Sheet
(2.2)
Sw
irl Center Tilt
Swirl center tilt (and precessional motion) is:
0
y [m
m]
(3.5)-5Raw (4.5)
Image - Insensitive to swirl ratio -10 (4.5)
- Present in individual cycles(2.2) -15
(3.5) - Less variable at high Rs -20Piston Mirror Corrected -15 -10 -5 0 5 10 15 20
Image x [mm]
AAccccomplishments:omplishments:
IInn--ccylinder floylinder flow charw characactterizaerizationtion
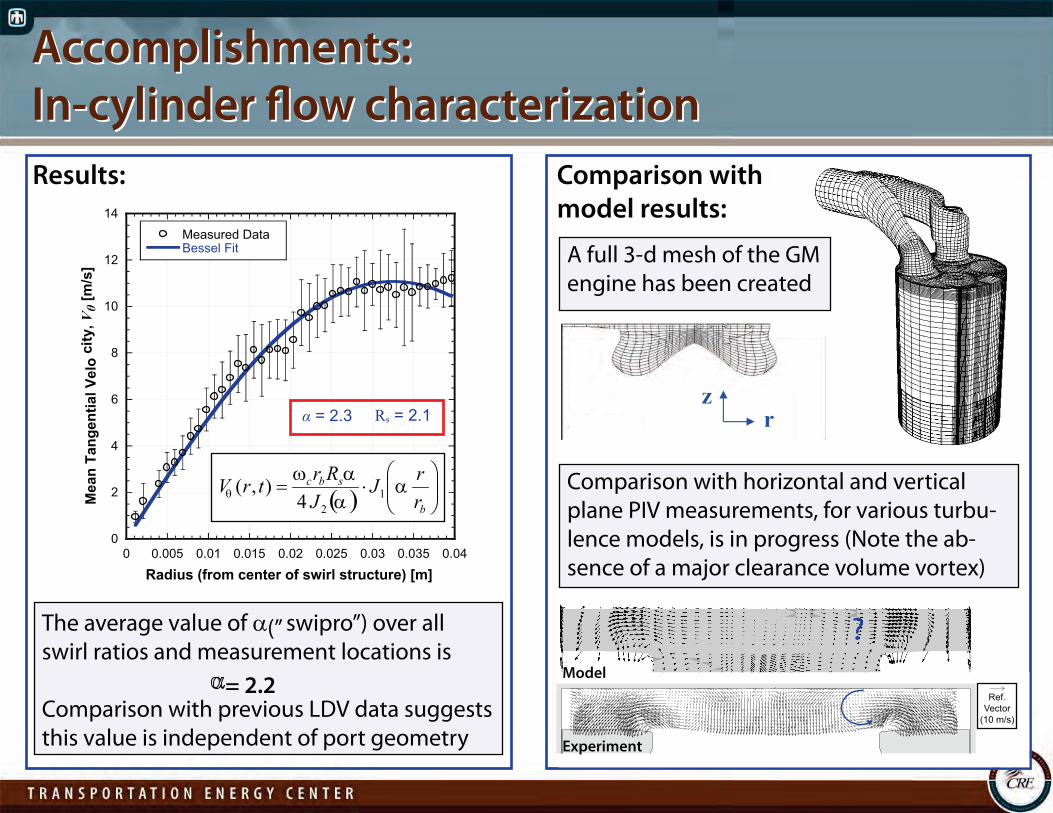
Results:
14
Measured Data Bessel Fit
12
10
8
6 α = 2.3 Rs = 2.1
Mea
n Ta
ngen
tial V
elo
city
, Vθ
[m/s
]
4
ω r R α ⎛ c b sVθ (r, t) = ⋅ J1 α2 4 J2 ( )α ⎝⎜⎜
0
r ⎞⎟⎟rb ⎠
0 0.005 0.01 0.015 0.02 0.025 0.03 0.035 0.04
Radius (from center of swirl structure) [m]
The average value of α(” swipro”) over all swirl ratios and measurement locations is
α
= 2.2 Comparison with previous LDV data suggests this value is independent of port geometry
Comparison with
model results:
A full 3-d mesh of the GM engine has been created
z r
Comparison with horizontal and vertical plane PIV measurements, for various turbulence models, is in progress (Note the absence of a major clearance volume vortex)
? Model
Ref. Vector
(10 m/s)
Experiment
Supe
rcha
rgin
g ai
r coo
ler
Accomplishments:
Post-injection wall wetting with biofuel blends
Accomplishments:
Post-injection wall wetting with biofuel blends
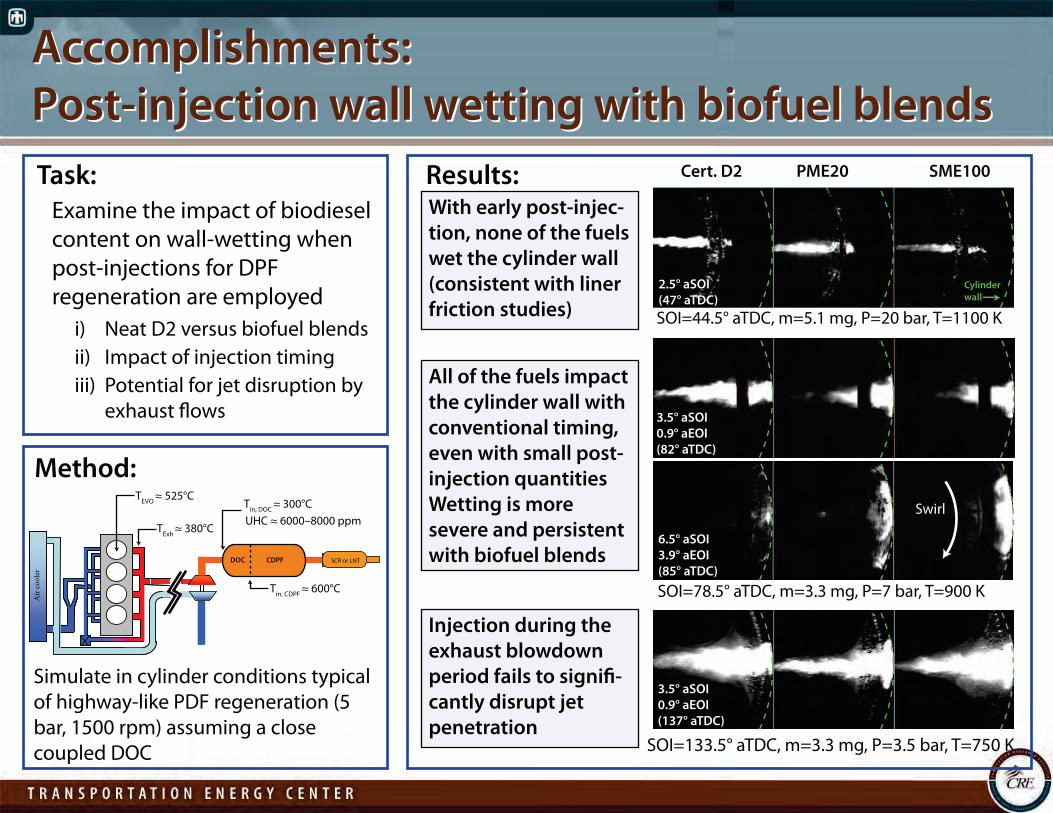
Task:
Examine the impact of biodiesel content on wall-wetting when post-injections for DPF regeneration are employed
i) Neat D2 versus biofuel blends ii) Impact of injection timing iii) Potential for jet disruption by
exhaust flows
Method:
Results:
Air
cool
er
SCR or LNTDOC CDPF
Tin, CDPF ≈ 600°C
Tin, DOC ≈ 300°C
TExh ≈ 380°C
TEVO ≈ 525°C
UHC ≈ 6000–8000 ppm
Simulate in cylinder conditions typical of highway-like PDF regeneration (5 bar, 1500 rpm) assuming a close coupled DOC
Cylinder
wall
Cert. D2 PME20 SME100
With early post-injec
tion, none of the fuels
wet the cylinder wall
(consistent with liner
friction studies) SOI=44.5° aTDC, m=5.1 mg, P=20 bar, T=1100 K
All of the fuels impact
the cylinder wall with
conventional timing,
even with small post
injection quantities
Wetting is more
severe and persistent
with biofuel blends
SOI=78.5° aTDC, m=3.3 mg, P=7 bar, T=900 K
Injection during the
exhaust blowdown
period fails to signifi
cantly disrupt jet
penetration SOI=133.5° aTDC, m=3.3 mg, P=3.5 bar, T=750 K
2.5° aSOI
(47° aTDC)
3.5° aSOI
0.9° aEOI
(82° aTDC)
6.5° aSOI
3.9° aEOI
(85° aTDC)
Swirl
3.5° aSOI
0.9° aEOI
(137° aTDC)
AAccccomplishments: Daomplishments: Data cta consolidaonsolidation andtion and
phenomenological picphenomenological picturture of light-e of light-dutduty Ly LTTCC
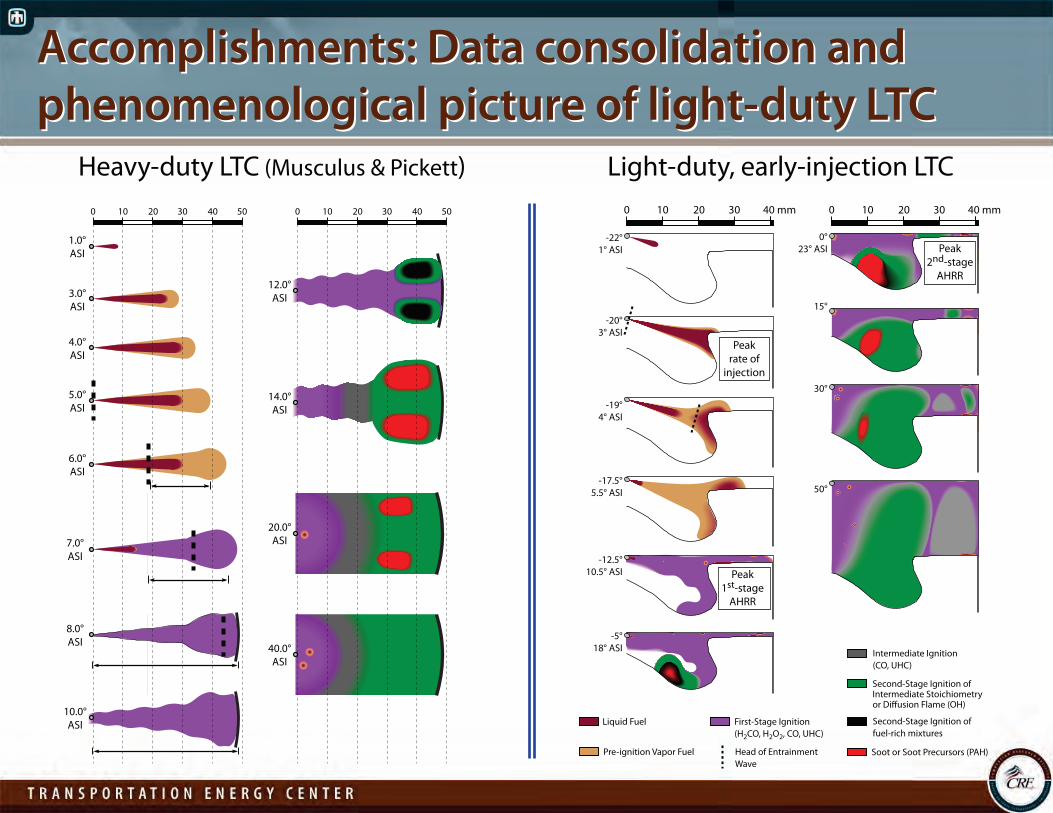
Heavy-duty LTC (Musculus & Pickett) 0 10 20 30 40 50 0 10 20 30 40 50
1.0° ASI
12.0° 3.0° ASI ASI
4.0° ASI
5.0° 14.0° ASI ASI
6.0° ASI
20.0° 7.0° ASI ASI
8.0° ASI 40.0°
ASI
10.0° ASI
Light-duty, early-injection LTC 0 10 20 30 40 mm 0 10 20 30 40 mm
-22° 0° 1° ASI 23° ASI Peak
2nd-stage AHRR
15° -20°
3° ASI Peak
rate of injection
30°
-19° 4° ASI
-17.5° 50°5.5° ASI
-12.5° 10.5° ASI Peak
1st-stage AHRR
-5° 18° ASI Intermediate Ignition
(CO, UHC)
Second-Stage Ignition of Intermediate Stoichiometry or Diffusion Flame (OH)
Second-Stage Ignition of (H2CO, H2O2, CO, UHC) fuel-rich mixtures
Liquid Fuel First-Stage Ignition
Pre-ignition Vapor Fuel Head of Entrainment Soot or Soot Precursors (PAH) Wave

CollaborationsCollaborations
17
Within Vehicle Technologies program:
t� Formal�collaboration� between�SNL-UW-ORNL t� Participation�in�Advanced�Engine�Combustion�group,�including�presentations�anE�
discussion�with�20�industrial/national� laboratory�partners:
Ex-Vehicle Technologies program:
t� $MPTF�UJFT�XJUI�(.�� �� (.�GVOEFE�QPTU�EPDUPSBM�SFTFBSDIFS
� � �� .POUIMZ�UFMFDPOGFSFODFT�%JFTFM�BOE�-&4�XPSLJOH�HSPVQT
t� 4USPOH�UJFT�UP�-VOE�6OJWFSTJUZ�� �� &YDIBOHF�TUVEFOUT�QFSGPSN�SFTFBSDI�BU�4BOEJa � � �� 4/-�TUBò�QBSUJDJQBUFT�JO�-6�SFTFBSDI�QSPKFDUT�
Future work – SNL/UWFuture work – SNL/UW
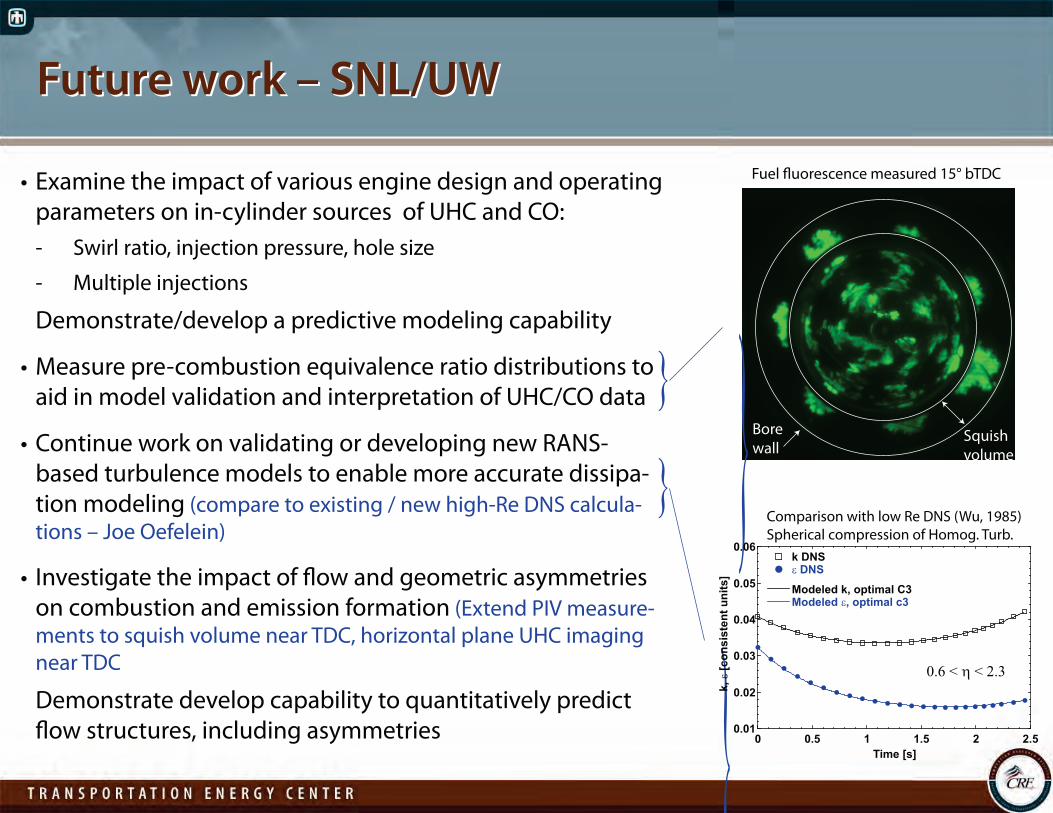
t�&YBNJOF�UIF�JNQBDU�PG�WBSJPVT�FOHJOF�EFTJHO�BOE�PQFSBUJOH� QBSBNFUFST�PO�JO�DZMJOEFS�TPVSDFT��PG�6)$�BOE�$0� � �� 4XJSM�SBUJP �JOKFDUJPO�QSFTTVSF �IPMF�TJ[F
� �� .VMUJQMF�JOKFDUJPOT
� %FNPOTUSBUF�EFWFMPQ�B�QSFEJDUJWF�NPEFMJOH�DBQBCJMJUZ
t�.FBTVSF�QSF�DPNCVTUJPO�FRVJWBMFODF�SBUJP�EJTUSJCVUJPOT�UP� BJE�JO�NPEFM�WBMJEBUJPO�BOE�JOUFSQSFUBUJPO�PG�6)$�$0�EBUB
t�$POUJOVF�XPSL�PO�WBMJEBUJOH�PS�EFWFMPQJOH�OFX�3"/4� CBTFE�UVSCVMFODF�NPEFMT�UP�FOBCMF�NPSF�BDDVSBUF�EJTTJQB� UJPO�NPEFMJOH�DPNQBSF�UP�FYJTUJOH���OFX�IJHI�3F�%/4�DBMDVMB� UJPOT�o�+PF�0FGFMFJO
t� *OWFTUJHBUF�UIF�JNQBDU�PG�øPX�BOE�HFPNFUSJD�BTZNNFUSJFT� PO�DPNCVTUJPO�BOE�FNJTTJPO�GPSNBUJPO�&YUFOE�1*7�NFBTVSF� NFOUT�UP�TRVJTI�WPMVNF�OFBS�5%$ �IPSJ[POUBM�QMBOF�6)$�JNBHJOH� OFBS�5%$
� %FNPOTUSBUF�EFWFMPQ�DBQBCJMJUZ�UP�RVBOUJUBUJWFMZ�QSFEJDU� øPX�TUSVDUVSFT �JODMVEJOH�BTZNNFUSJFT�
#PSF XBMM
'VFM�øVPSFTDFODF�NFBTVSFE���¡�C5%$
$PNQBSJTPO�XJUI�MPX�3F�%/4� 8V ����� 4QIFSJDBM�DPNQSFTTJPO�PG�)PNPH��5VSC�
} }
} }
4RVJTI WPMVNF
0.01
0.02
0.03
0.04
0.05
0.06
0 0.5 1 1.5 2 2.5
k DNS ε DNS
Modeled k, optimal C3Modeled ε, optimal c3
Time [s]
k, ε
[con
sist
ent u
nits
]
0.6 < η < 2.3

SummarySummary
t� 1SPKFDU�GPDVTFT�PO�TFWFSBM�CBSSJFST�UBSHFUT�JEFOUJöFE�JO�UIF�&&3&�75�QSPHSBN�QMBO� - Lack of fundamental knowledge - Lack of cost effective emission controls - Lack of modeling capability - Emission control efficiency penalty - 30$/kW specific cost; Tier 2, Bin 2 emissions - 40% diesel fuel economy improvement
t� 5FDIOJDBM�BDDPNQMJTINFOUT�UIJT�SFQPSUJOH�QFSJPE�JODMVEF� - Understanding of the impact of fuel properties on LTC UHC/CO in-cylinder emission sources - Improved modeling of LTC combustion and UHC/CO emissions - Identification of problems with compressible RNG turbulence model and implementations - New compressible RNG closure model dependent on mean flow ‘dimensionality’ - Measurement of swirl flow structure and asymmetries; full 360° grid and initial simulations - Imaging study of post-injections spray wall impingement for neat diesel and biofuels - Consolidation of data and development of phenomenological picture of light-duty LTC to
complement heavy-duty work
t� 'VUVSF�XPSL�XJMM�JODMVEF�� - Continuation of UHC/CO imaging and modeling, with emphasis on capturing the influence of
engine design and operating parameter dependence; measurement of pre-combustion φ-dist. - Continued efforts to improve compressible RANS flow modeling – which underpins the modeling - Continuation of flow (and horizontal plane UHC distributions), with an emphasis on
understanding asymmetries and the necessity of modeling them