Low Returns and Optimal Retirement Savings · Retirement Savings $ From Portfolio to Fund Spending...
31
Title Goes Here David Blanchett, Morningstar Michael Finke, The American College Wade Pfau, The American College Low Returns and Optimal Retirement Savings
Transcript of Low Returns and Optimal Retirement Savings · Retirement Savings $ From Portfolio to Fund Spending...

Title Goes Here
David Blanchett, Morningstar
Michael Finke, The American College
Wade Pfau, The American College
Low Returns and Optimal
Retirement Savings
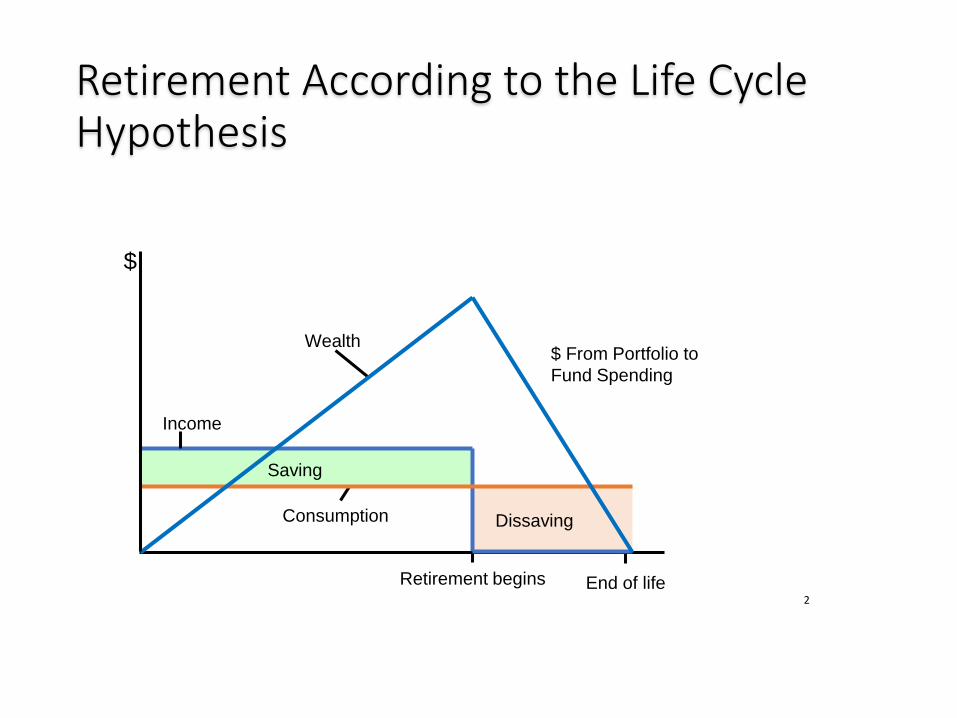
$ From Portfolio to
Fund Spending
$
Wealth
Income
Saving
Consumption Dissaving
Retirement begins End of life
Retirement According to the Life Cycle Hypothesis
2


Wealthier People Tend to Live LongerChange in average additional life expectancy (in years) at age 55, by wealth, between cohorts born in 1920 and 1940
5.9
5.3
4.9
4.6
4.2
3.9
3.6
3.3
2.7
1.7
3.1
2.4
1.8
1.4
1
0.5
-0.2
-1
-1.6
-2.1
-3 -2 -1 0 1 2 3 4 5 6 7
Richest 10%
81%-90%
71%-80%
61%-70%
51%-60%
41%-50%
31%-40%
21%-30%
11%-20%
Poorest 10%
Change (in Years)
Women
Men
Source: Barry Bosworth, Brookings Institution4
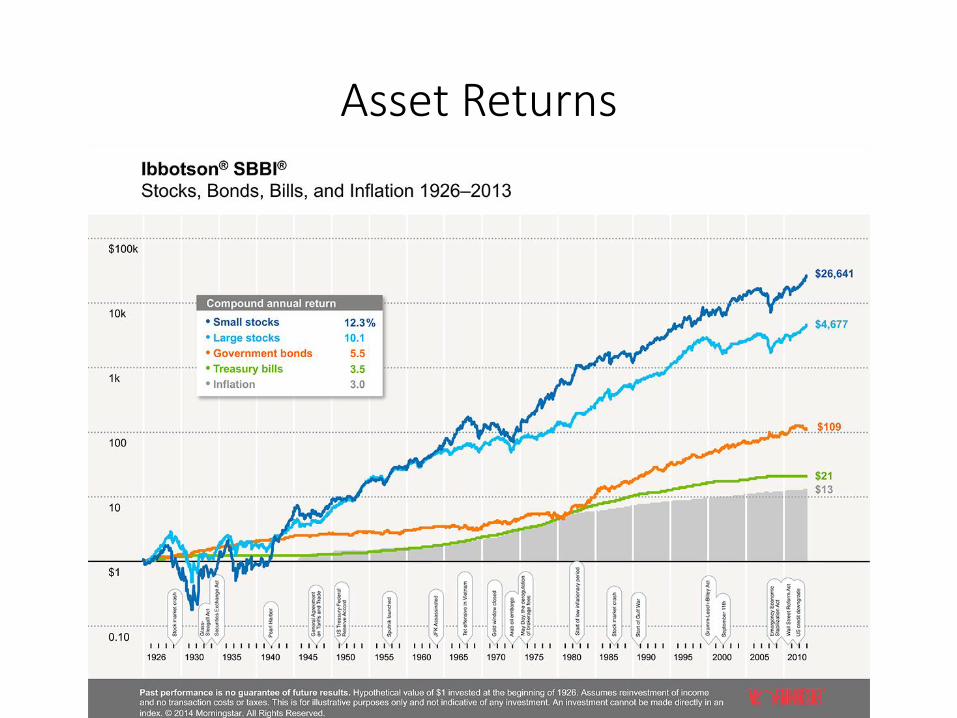
Asset Returns
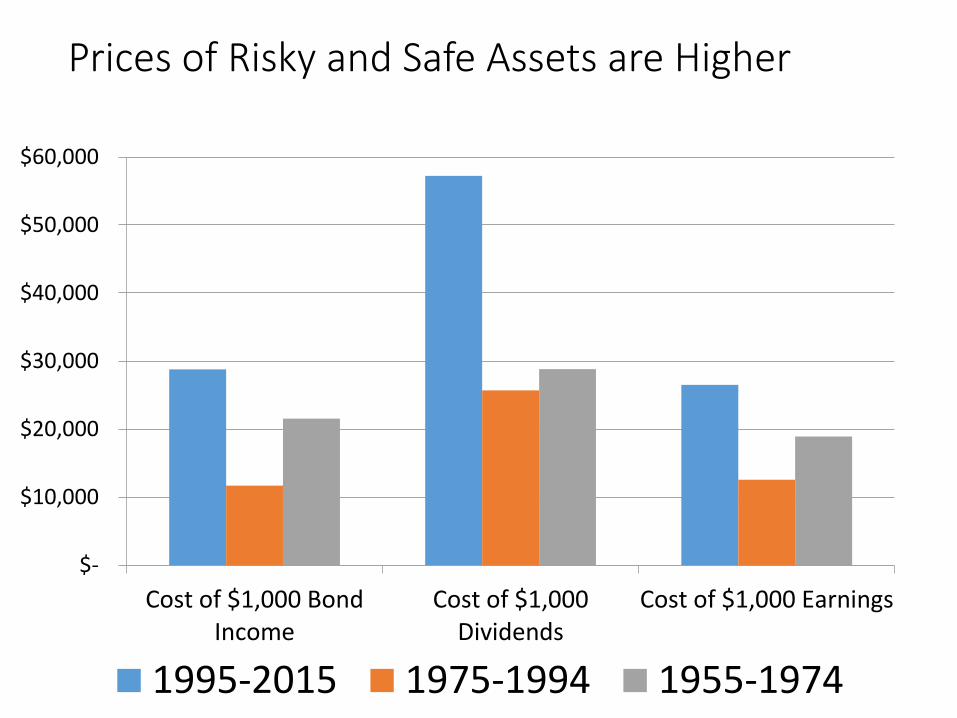
Prices of Risky and Safe Assets are Higher
$-
$10,000
$20,000
$30,000
$40,000
$50,000
$60,000
Cost of $1,000 BondIncome
Cost of $1,000Dividends
Cost of $1,000 Earnings
1995-2015 1975-1994 1955-1974
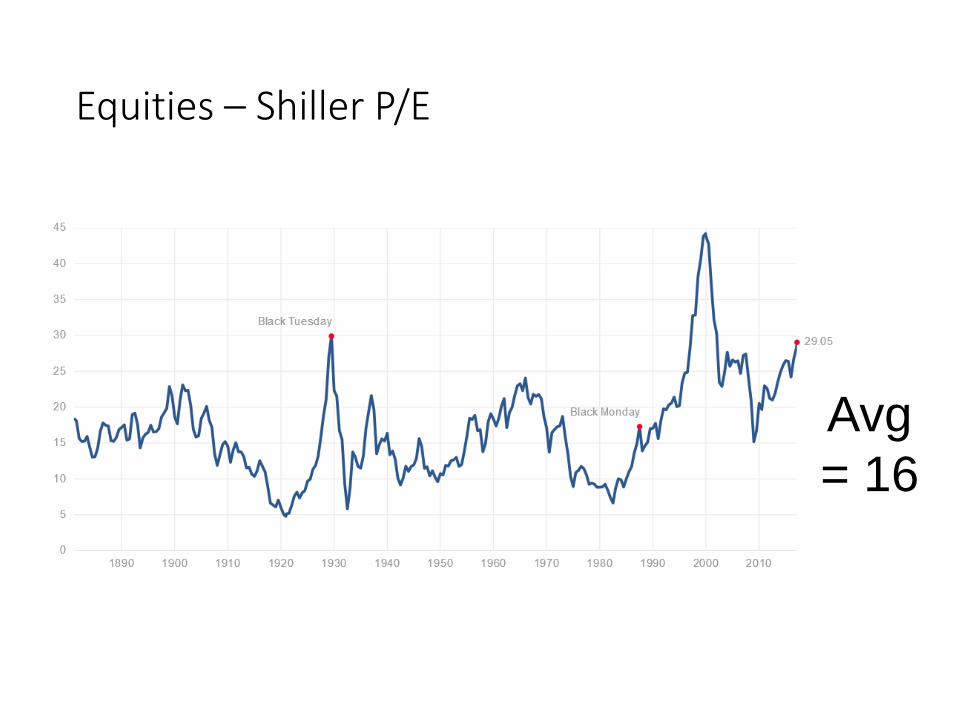
Equities – Shiller P/E
Avg
= 16
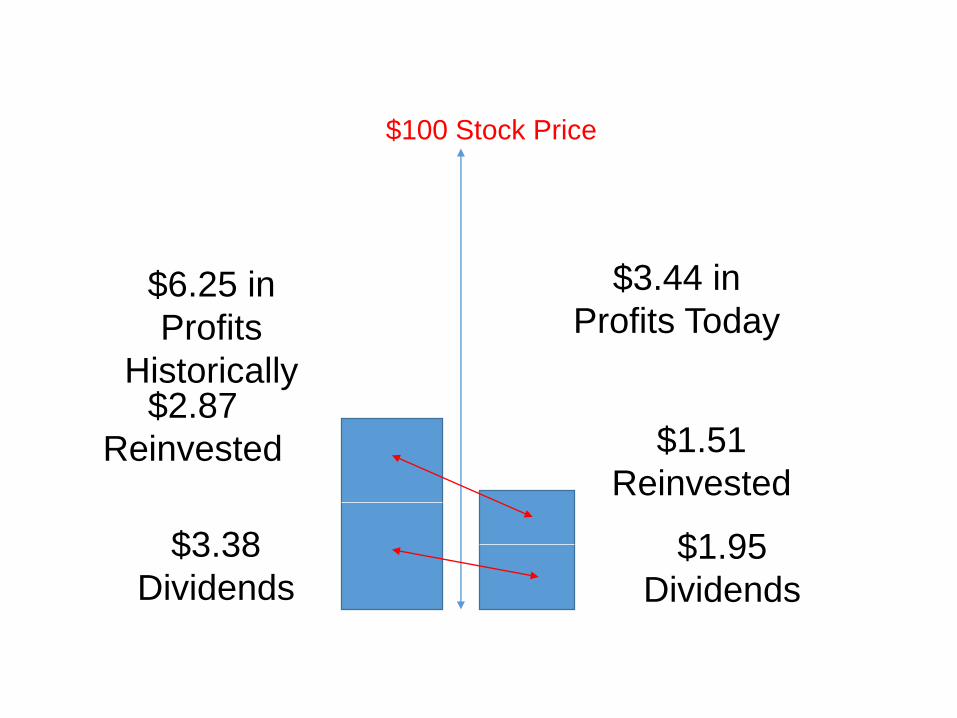
$100 Stock Price
$6.25 in
Profits
Historically
$3.44 in
Profits Today
$1.95
Dividends
$1.51
Reinvested
$2.87
Reinvested
$3.38
Dividends

What Does Current P/E Imply?
Source: Asness, 2012
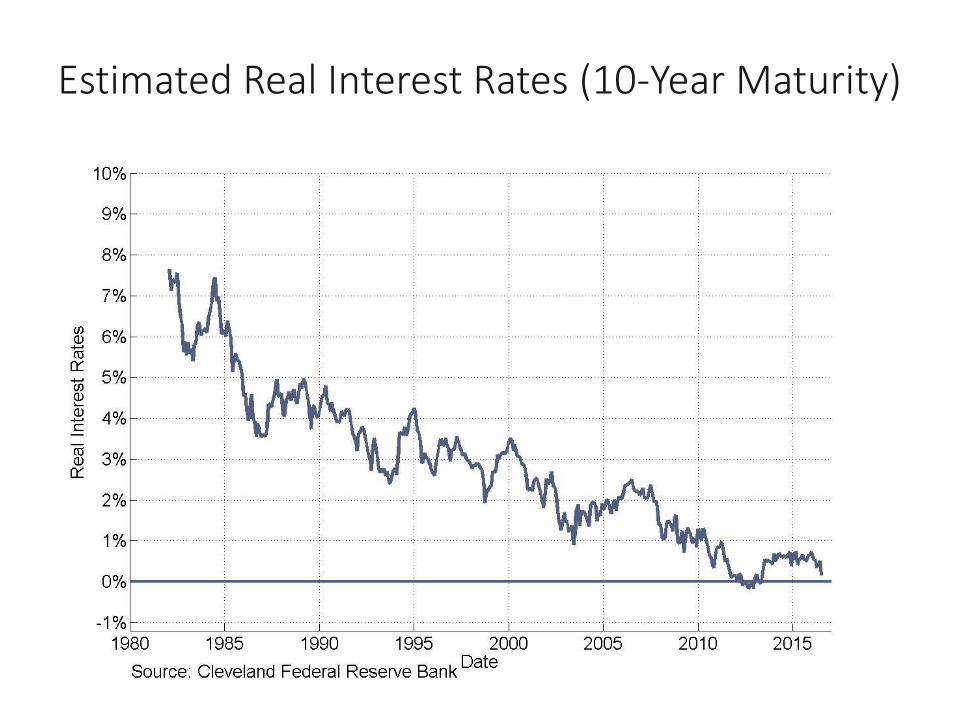
Estimated Real Interest Rates (10-Year Maturity)
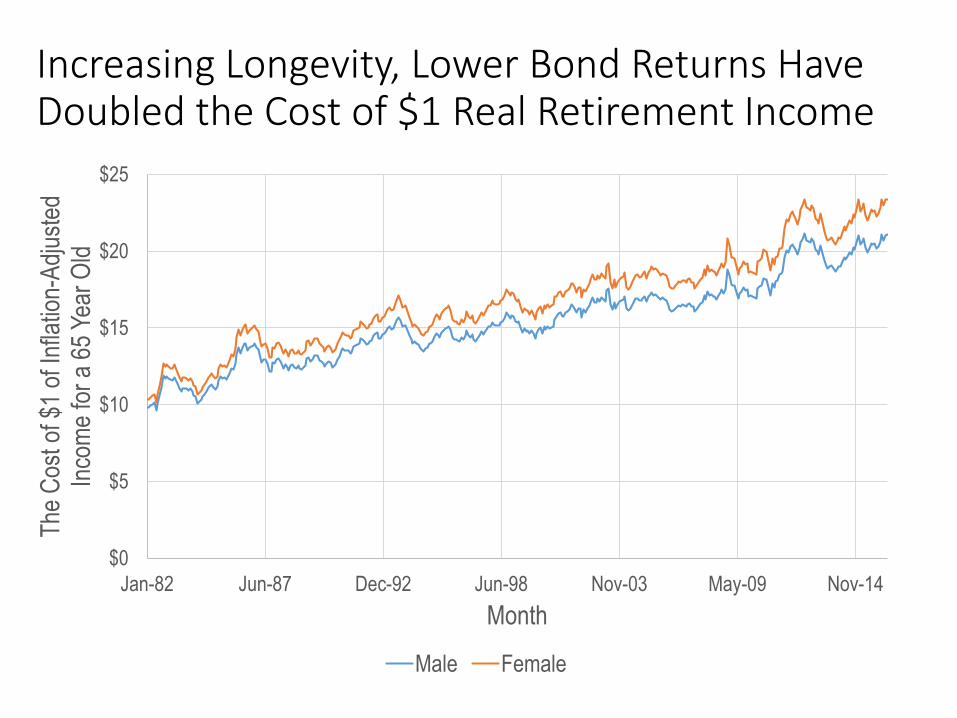
Increasing Longevity, Lower Bond Returns Have Doubled the Cost of $1 Real Retirement Income
$0
$5
$10
$15
$20
$25
Jan-82 Jun-87 Dec-92 Jun-98 Nov-03 May-09 Nov-14
The
Cos
t of $
1 of
Infla
tion-
Adj
uste
d In
com
e fo
r a
65 Y
ear
Old
Month
Male Female

Simple Life Cycle Illustrations
• 35-Year Old Worker
• $50,000 income 1% real wage growth for 30-year career
• 30-year retirement
• Estimate optimal saving to smooth lifetime spending
• Include legacy goal
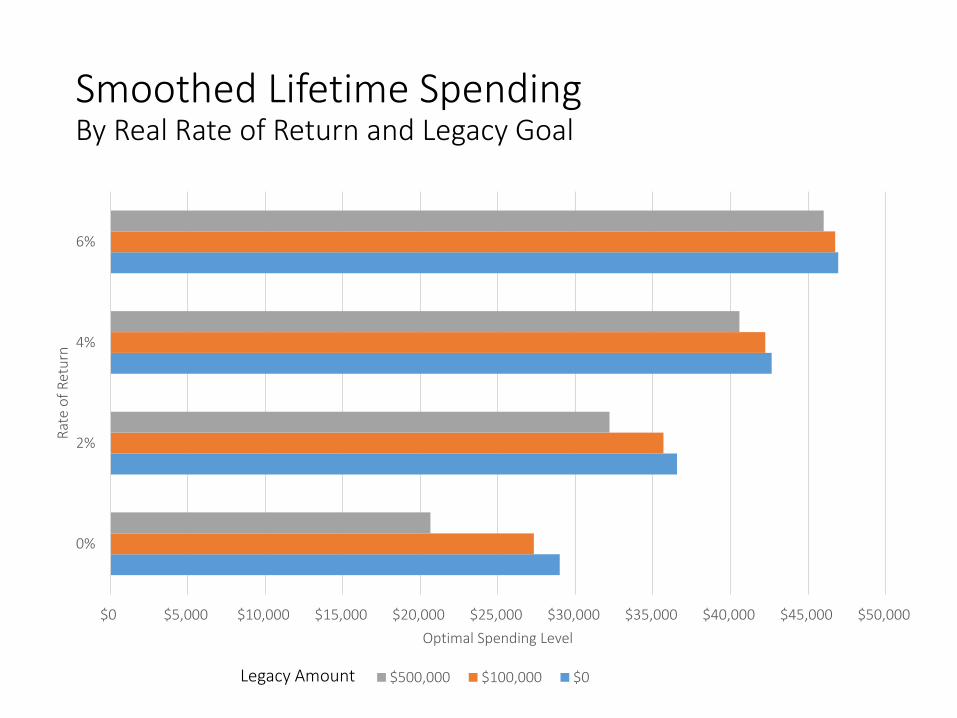
Smoothed Lifetime SpendingBy Real Rate of Return and Legacy Goal
$0 $5,000 $10,000 $15,000 $20,000 $25,000 $30,000 $35,000 $40,000 $45,000 $50,000
0%
2%
4%
6%
Optimal Spending Level
Rat
e o
f R
etu
rn
$500,000 $100,000 $0Legacy Amount
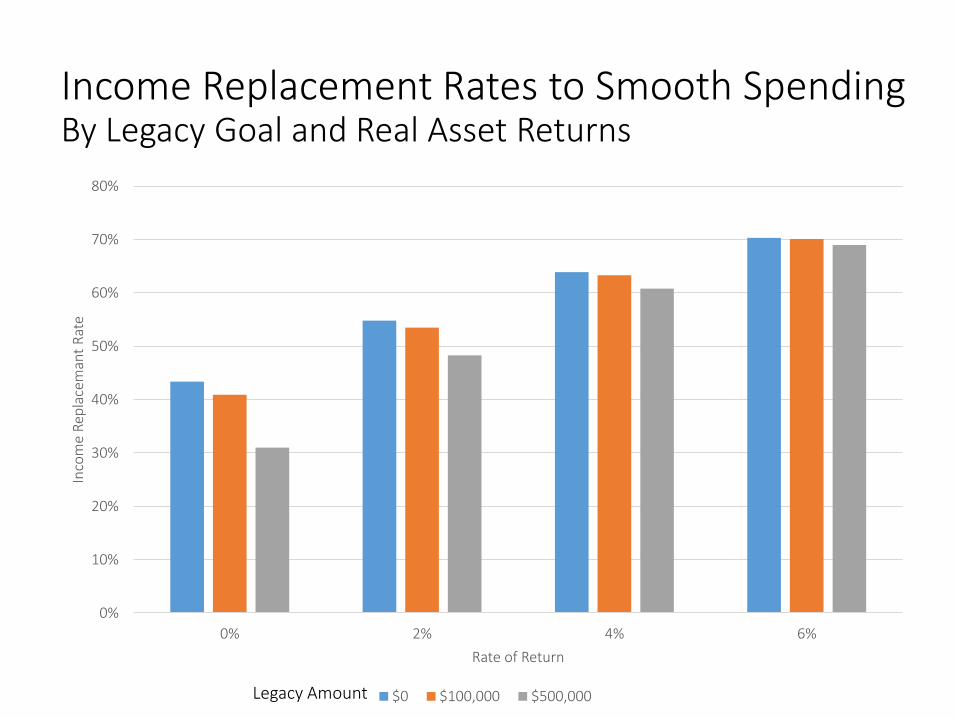
Income Replacement Rates to Smooth SpendingBy Legacy Goal and Real Asset Returns
0%
10%
20%
30%
40%
50%
60%
70%
80%
0% 2% 4% 6%
Inco
me
Rep
lace
man
t R
ate
Rate of Return
$0 $100,000 $500,000Legacy Amount
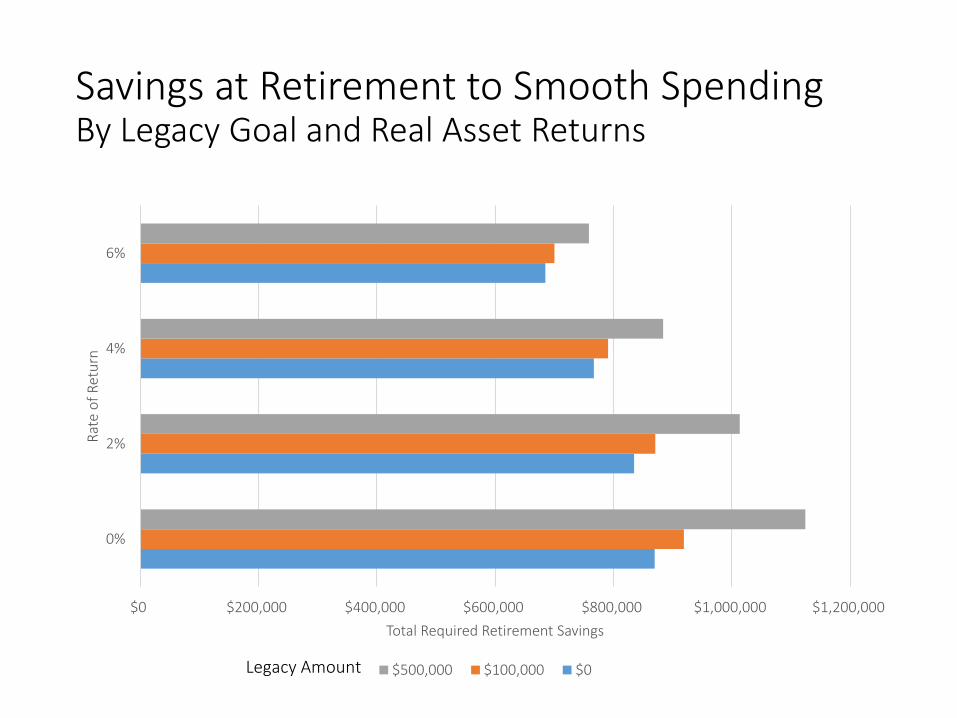
Savings at Retirement to Smooth SpendingBy Legacy Goal and Real Asset Returns
$0 $200,000 $400,000 $600,000 $800,000 $1,000,000 $1,200,000
0%
2%
4%
6%
Total Required Retirement Savings
Rat
e o
f R
etu
rn
$500,000 $100,000 $0Legacy Amount
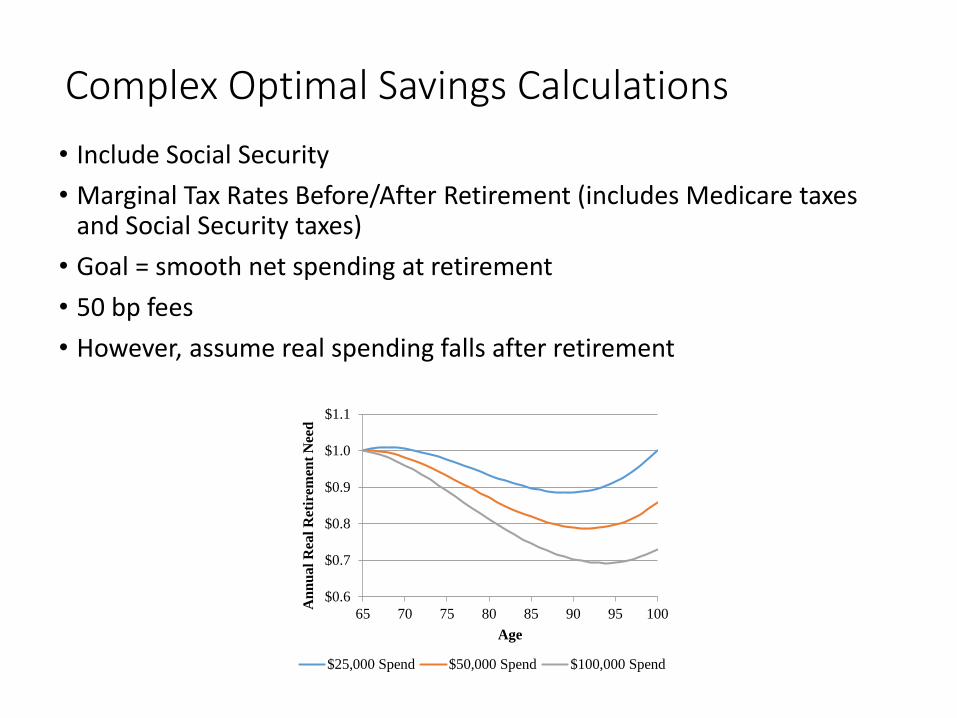
Complex Optimal Savings Calculations
• Include Social Security
• Marginal Tax Rates Before/After Retirement (includes Medicare taxes and Social Security taxes)
• Goal = smooth net spending at retirement
• 50 bp fees
• However, assume real spending falls after retirement
$0.6
$0.7
$0.8
$0.9
$1.0
$1.1
65 70 75 80 85 90 95 100
An
nu
al
Rea
l R
etir
emen
t N
eed
Age
$25,000 Spend $50,000 Spend $100,000 Spend
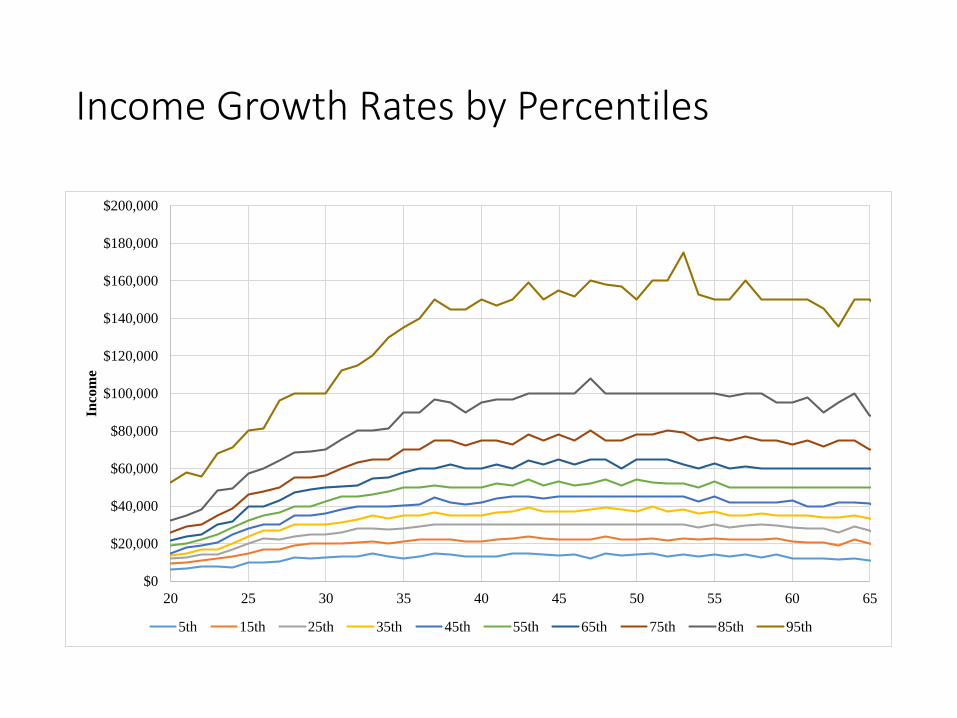
Income Growth Rates by Percentiles
$0
$20,000
$40,000
$60,000
$80,000
$100,000
$120,000
$140,000
$160,000
$180,000
$200,000
20 25 30 35 40 45 50 55 60 65
Inco
me
5th 15th 25th 35th 45th 55th 65th 75th 85th 95th

Asset Returns
• Bonds assume to begin at todays rates and follow a process that
• A) reverts to return slightly above today
• B) reverts to return slightly below historical average
• C) reverts to historical average
• Equity Risk Premium
• Low – 3.5%
• Medium – 4.5%
• High – 5.5%
• Standard Deviation = 20%
• Stock and bond returns are random and optimal savings estimated using lifetime return simulations
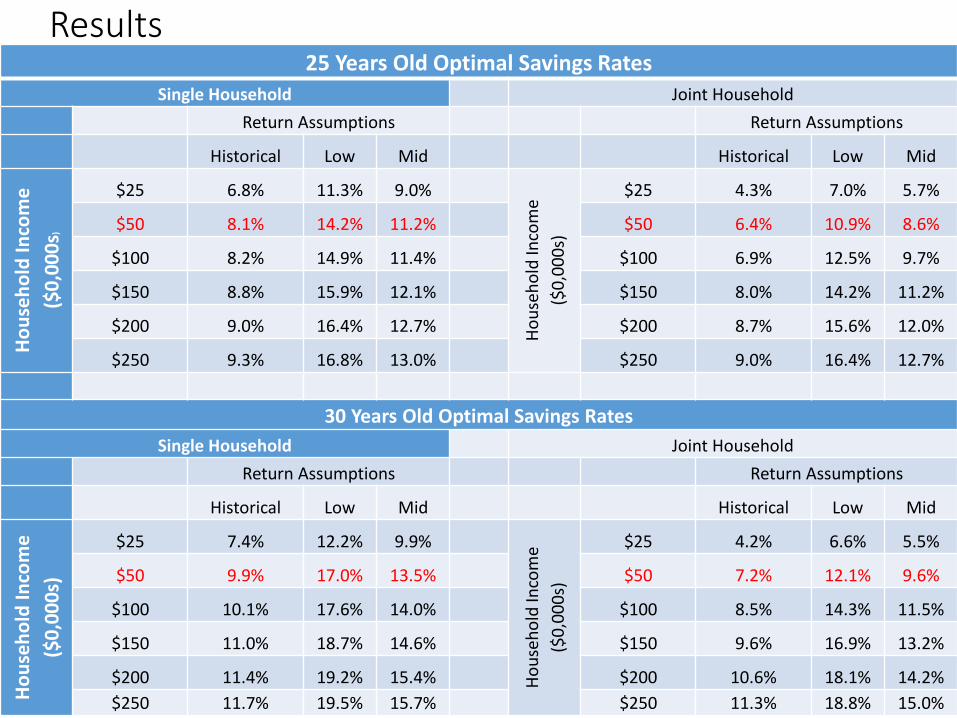
Results25 Years Old Optimal Savings Rates
Single Household Joint Household
Return Assumptions Return Assumptions
Historical Low Mid Historical Low Mid
Ho
use
ho
ld I
nco
me
($0
,00
0s)
$25 6.8% 11.3% 9.0%
Ho
use
ho
ld In
com
e
($0
,00
0s)
$25 4.3% 7.0% 5.7%
$50 8.1% 14.2% 11.2% $50 6.4% 10.9% 8.6%
$100 8.2% 14.9% 11.4% $100 6.9% 12.5% 9.7%
$150 8.8% 15.9% 12.1% $150 8.0% 14.2% 11.2%
$200 9.0% 16.4% 12.7% $200 8.7% 15.6% 12.0%
$250 9.3% 16.8% 13.0% $250 9.0% 16.4% 12.7%
30 Years Old Optimal Savings Rates
Single Household Joint Household
Return Assumptions Return Assumptions
Historical Low Mid Historical Low Mid
Ho
use
ho
ld I
nco
me
($0
,00
0s)
$25 7.4% 12.2% 9.9%H
ou
seh
old
Inco
me
($0
,00
0s)
$25 4.2% 6.6% 5.5%
$50 9.9% 17.0% 13.5% $50 7.2% 12.1% 9.6%
$100 10.1% 17.6% 14.0% $100 8.5% 14.3% 11.5%
$150 11.0% 18.7% 14.6% $150 9.6% 16.9% 13.2%
$200 11.4% 19.2% 15.4% $200 10.6% 18.1% 14.2%
$250 11.7% 19.5% 15.7% $250 11.3% 18.8% 15.0%

Don’t Wait Until Age 40
40 Years Old Optimal Savings Rates
Single Household Joint Household
Return Assumptions Return Assumptions
Historical Low Mid Historical Low Mid
Ho
use
ho
ld I
nco
me
($
0,0
00
s)
$25 10.4% 14.8% 12.8%
Ho
use
ho
ld In
com
e ($
0,0
00
s)
$25 4.3% 6.3% 4.9%
$50 13.9% 19.4% 17.5% $50 9.4% 12.4% 11.2%
$100 16.5% 25.6% 20.4% $100 12.6% 19.0% 16.5%
$150 17.6% 26.4% 22.8% $150 14.5% 23.8% 18.6%
$200 18.1% 27.3% 24.3% $200 16.4% 25.5% 20.1%
$250 18.5% 27.5% 24.8% $250 17.6% 26.4% 22.8%
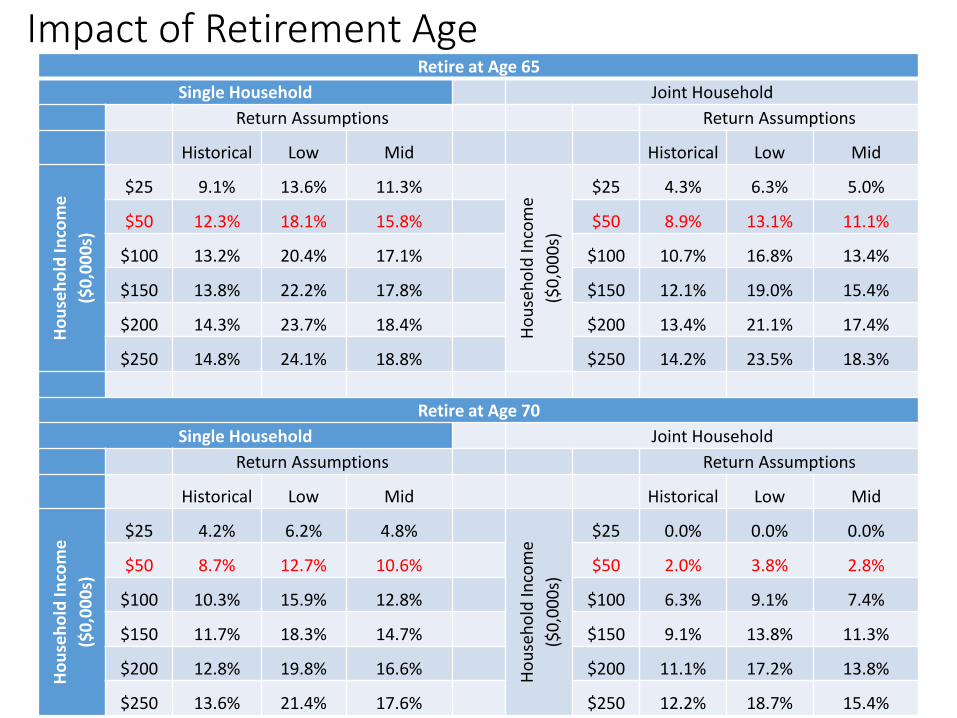
Impact of Retirement AgeRetire at Age 65
Single Household Joint Household
Return Assumptions Return Assumptions
Historical Low Mid Historical Low Mid
Ho
use
ho
ld In
com
e
($0
,00
0s)
$25 9.1% 13.6% 11.3%
Ho
use
ho
ld In
com
e
($0
,00
0s)
$25 4.3% 6.3% 5.0%
$50 12.3% 18.1% 15.8% $50 8.9% 13.1% 11.1%
$100 13.2% 20.4% 17.1% $100 10.7% 16.8% 13.4%
$150 13.8% 22.2% 17.8% $150 12.1% 19.0% 15.4%
$200 14.3% 23.7% 18.4% $200 13.4% 21.1% 17.4%
$250 14.8% 24.1% 18.8% $250 14.2% 23.5% 18.3%
Retire at Age 70
Single Household Joint Household
Return Assumptions Return Assumptions
Historical Low Mid Historical Low Mid
Ho
use
ho
ld In
com
e
($0
,00
0s)
$25 4.2% 6.2% 4.8%H
ou
seh
old
Inco
me
($0
,00
0s)
$25 0.0% 0.0% 0.0%
$50 8.7% 12.7% 10.6% $50 2.0% 3.8% 2.8%
$100 10.3% 15.9% 12.8% $100 6.3% 9.1% 7.4%
$150 11.7% 18.3% 14.7% $150 9.1% 13.8% 11.3%
$200 12.8% 19.8% 16.6% $200 11.1% 17.2% 13.8%
$250 13.6% 21.4% 17.6% $250 12.2% 18.7% 15.4%
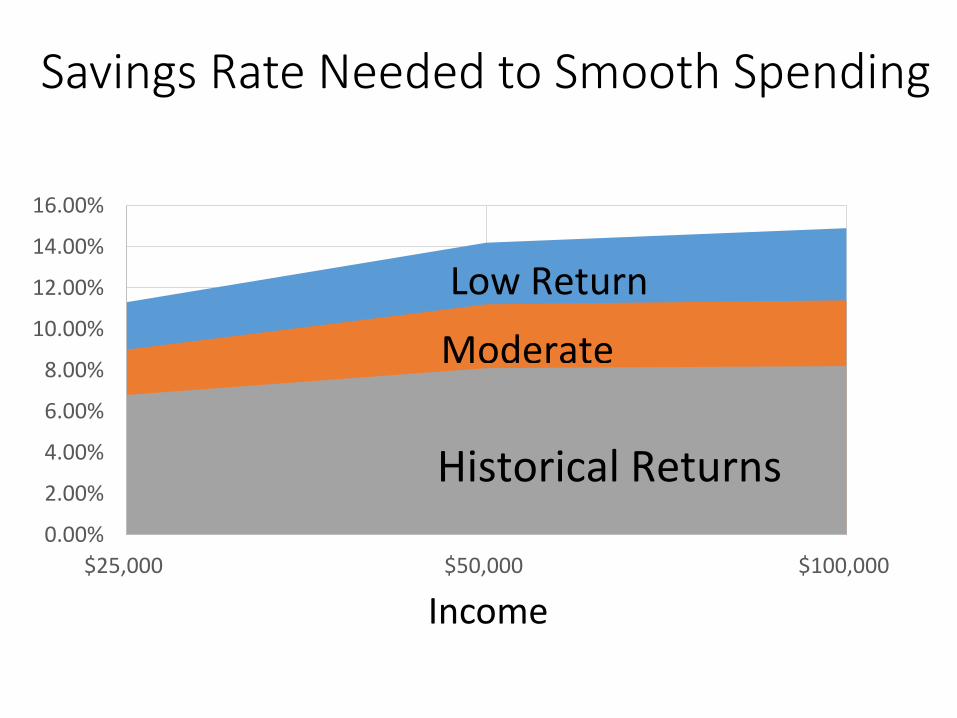
Savings Rate Needed to Smooth Spending
0.00%
2.00%
4.00%
6.00%
8.00%
10.00%
12.00%
14.00%
16.00%
$25,000 $50,000 $100,000
Historical Returns
Moderate
Low Return
Income

Can Workers Handle the Truth?
Ideal retirement = 70% likelihood by 9% of salary30% of the time will spend less than retirement goal
Would you save 14% of income to have a 100% likelihood of meeting your spending goal?
This will mean you'll need to reduce your spending today by 5%.
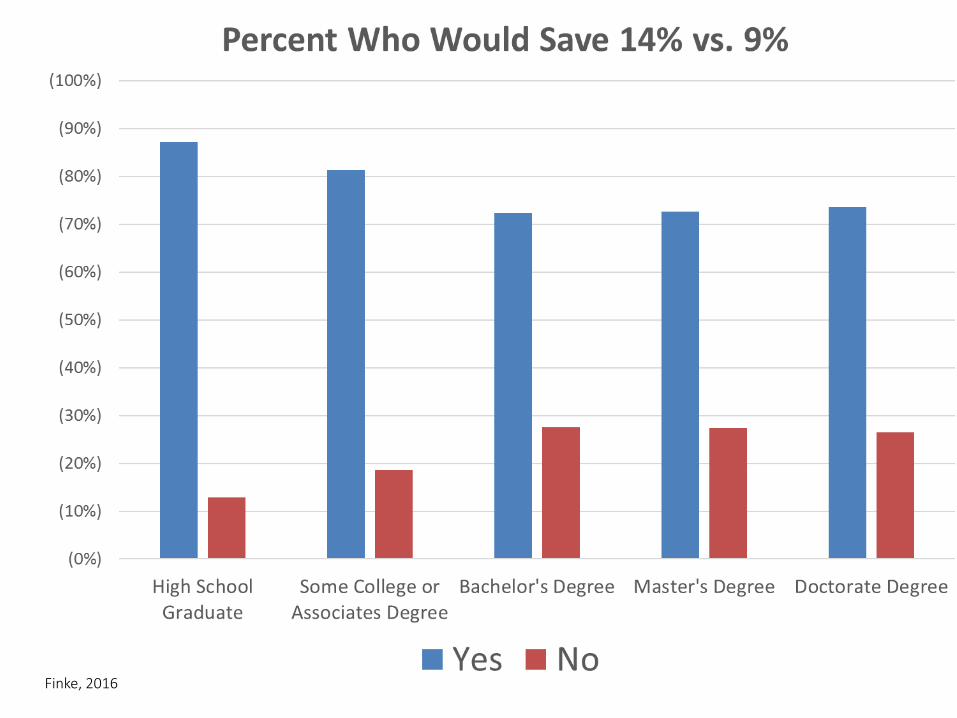
Finke, 2016
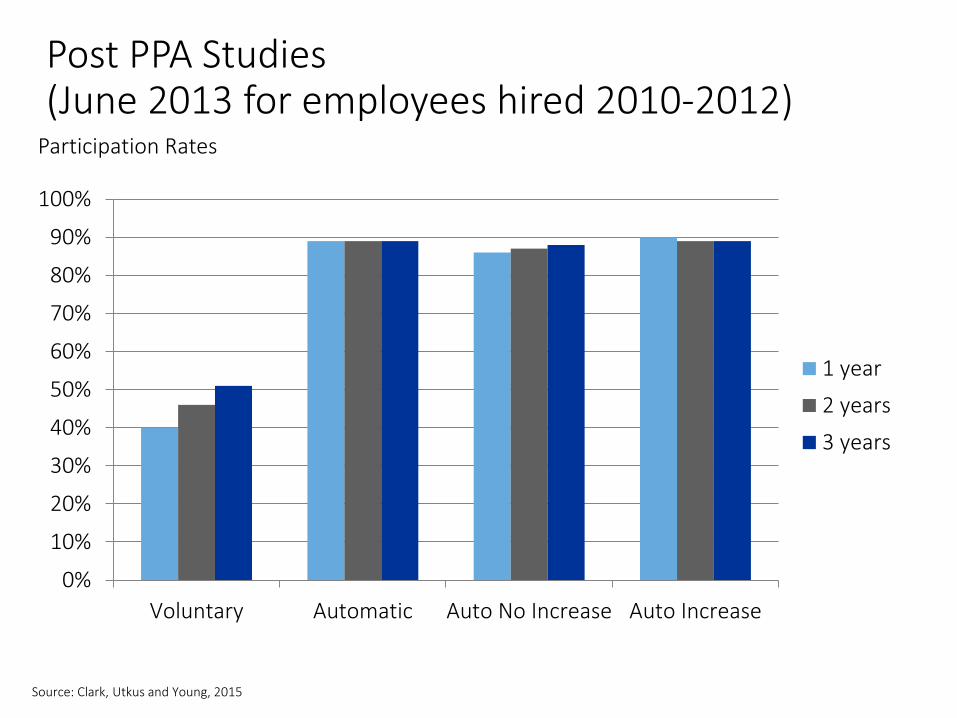
Post PPA Studies(June 2013 for employees hired 2010-2012)
0%
10%
20%
30%
40%
50%
60%
70%
80%
90%
100%
Voluntary Automatic Auto No Increase Auto Increase
1 year
2 years
3 years
Source: Clark, Utkus and Young, 2015
Participation Rates
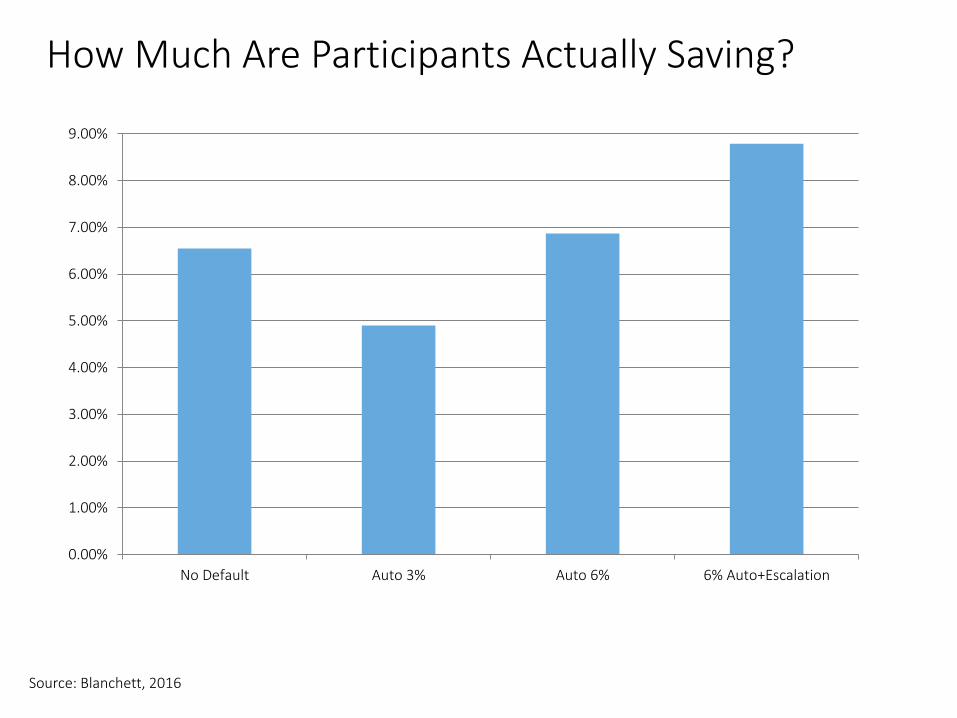
How Much Are Participants Actually Saving?
0.00%
1.00%
2.00%
3.00%
4.00%
5.00%
6.00%
7.00%
8.00%
9.00%
No Default Auto 3% Auto 6% 6% Auto+Escalation
Source: Blanchett, 2016
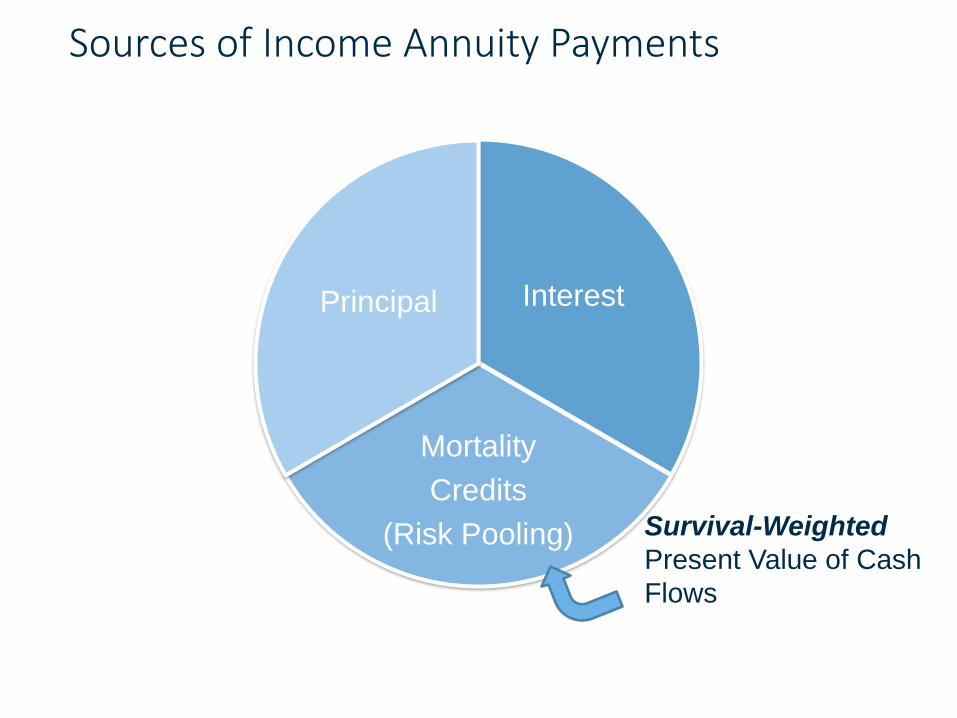
Sources of Income Annuity Payments
Interest
Mortality
Credits
(Risk Pooling)
Principal
Survival-Weighted
Present Value of Cash
Flows
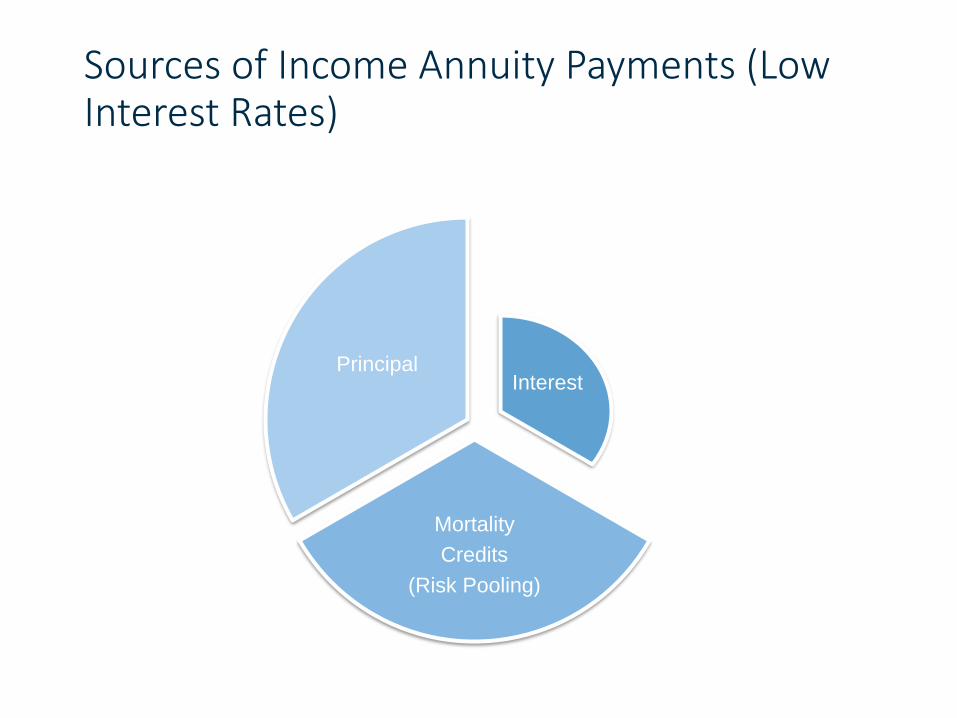
Sources of Income Annuity Payments (Low Interest Rates)
Interest
Mortality
Credits
(Risk Pooling)
Principal
Cost of Funding a Real $10,000 Income Stream
Assumptions:
65-Year Old Female
Planning Age: 100
Fixed real yield curve
at Interest Rate
Society of Actuaries
Individual Annuitant
Mortality Table
41%
34%
28%
23%

Conclusions
• Retirement will be more expensive
• Workers/clients need to be aware of
consequences of persistent low returns
• Save earlier, save more
• Retiring later only way to preserve lifestyle