
Low-resolution screening of early stage acquisition simulation ...
88
Calhoun: The NPS Institutional Archive DSpace Repository Theses and Dissertations 1. Thesis and Dissertation Collection, all items 2012-12 Low-resolution screening of early stage acquisition simulation scenario development decisions Price, Shane A. Monterey, California. Naval Postgraduate School http://hdl.handle.net/10945/27892 Downloaded from NPS Archive: Calhoun
Transcript of Low-resolution screening of early stage acquisition simulation ...

Calhoun: The NPS Institutional Archive
DSpace Repository
Theses and Dissertations 1. Thesis and Dissertation Collection, all items
2012-12
Low-resolution screening of early stage
acquisition simulation scenario development decisions
Price, Shane A.
Monterey, California. Naval Postgraduate School
http://hdl.handle.net/10945/27892
Downloaded from NPS Archive: Calhoun

NAVAL
POSTGRADUATE
SCHOOL
MONTEREY, CALIFORNIA
THESIS
This thesis was performed at the MOVES Institute
Approved for public release; distribution is unlimited
LOW-RESOLUTION SCREENING OF EARLY STAGE ACQUISITION SIMULATION SCENARIO
DEVELOPMENT DECISIONS
by
Shane A. Price
December 2012
Thesis Co-Advisors: Arnold Buss Imre Balogh

THIS PAGE INTENTIONALLY LEFT BLANK

i
REPORT DOCUMENTATION PAGE Form Approved OMB No. 0704-0188 Public reporting burden for this collection of information is estimated to average 1 hour per response, including the time for reviewing instruction, searching existing data sources, gathering and maintaining the data needed, and completing and reviewing the collection of information. Send comments regarding this burden estimate or any other aspect of this collection of information, including suggestions for reducing this burden, to Washington headquarters Services, Directorate for Information Operations and Reports, 1215 Jefferson Davis Highway, Suite 1204, Arlington, VA 22202-4302, and to the Office of Management and Budget, Paperwork Reduction Project (0704-0188) Washington DC 20503. 1. AGENCY USE ONLY (Leave blank)
2. REPORT DATE December 2012
3. REPORT TYPE AND DATES COVERED Master’s Thesis
4. TITLE AND SUBTITLE Low-Resolution Screening of Early Stage Acquisition Simulation Scenario Development Decisions
5. FUNDING NUMBERS
6. AUTHOR(S) Shane A. Price 7. PERFORMING ORGANIZATION NAME(S) AND ADDRESS(ES)
Naval Postgraduate School Monterey, CA 93943-5000
8. PERFORMING ORGANIZATION REPORT NUMBER
9. SPONSORING /MONITORING AGENCY NAME(S) AND ADDRESS(ES) N/A
10. SPONSORING/MONITORING AGENCY REPORT NUMBER
11. SUPPLEMENTARY NOTES The views expressed in this thesis are those of the author and do not reflect the official policy or position of the Department of Defense or the U.S. Government. IRB Protocol number ______N/A______.
12a. DISTRIBUTION / AVAILABILITY STATEMENT Approved for public release; distribution is unlimited
12b. DISTRIBUTION CODE A
13. ABSTRACT (maximum 200 words)
The United States Army and the United States Marine Corps currently use Combat XXI as their premier computer simulation for estimating the effects of the introduction of changes to unit composition and equipment on the battlefield. It is a time consuming model to produce and run, in that it represents very detailed and intricate interactions.
Another similar, but less detailed computer simulation is the Dynamic Allocation of Fires and Sensors (DAFS). Instead of modeling the explicit interactions between every soldier and Marine, scenarios can be designed to focus on the effects of combat between groups of combatants. Scenarios can be developed and run faster, but with less insight into the mechanism of interactions.
This thesis explores the possibility of using a low-resolution simulation as a rapid prototyping device for more arduous (and expensive) simulations to gain limited insight and assist in scenario development by contrasting a scenario developed in COMBATXXI with a similar scenario developed in DAFS.
14. SUBJECT TERMS COMBATXXI, JDAFS, DAFS, Simulation, Combat Modeling, Constructive, Discrete Event, Acquisition, Prototyping, Variable Resolution
15. NUMBER OF PAGES
87 16. PRICE CODE
17. SECURITY CLASSIFICATION OF REPORT
Unclassified
18. SECURITY CLASSIFICATION OF THIS PAGE
Unclassified
19. SECURITY CLASSIFICATION OF ABSTRACT
Unclassified
20. LIMITATION OF ABSTRACT
UU NSN 7540-01-280-5500 Standard Form 298 (Rev. 2-89) Prescribed by ANSI Std. 239-18

ii
THIS PAGE INTENTIONALLY LEFT BLANK

iii
Approved for public release; distribution is unlimited
LOW-RESOLUTION SCREENING OF EARLY STAGE ACQUISITION SIMULATION SCENARIO DEVELOPMENT DECISIONS
Shane A. Price Major, United States Marine Corps
B.S. Environmental Science, Slippery Rock University, 1998
Submitted in partial fulfillment of the requirements for the degree of
MASTER OF SCIENCE IN MODELING, VIRTUAL ENVIRONMENTS, AND SIMULATION (MOVES)
from the
NAVAL POSTGRADUATE SCHOOL December 2012
Author: Shane A. Price
Approved by: Arnold Buss Thesis Co-Advisor Imre Balogh Thesis Co-Advisor
Christian Darken Chair, MOVES Academic Committee Peter J. Denning Chair, Department of Computer Science

iv
THIS PAGE INTENTIONALLY LEFT BLANK

v
ABSTRACT
The United States Army and the United States Marine Corps currently use
COMBATXXI as their premier computer simulation for estimating the effects of the
introduction of changes to unit composition and equipment on the battlefield. It is a time
consuming model to develop and run, in that it represents very detailed and intricate
interactions.
Another similar, but less detailed computer simulation is the Dynamic Allocation
of Fires and Sensors (DAFS). Instead of modeling the explicit interactions between
every soldier and Marine, scenarios can be designed to focus on the effects of combat
between groups of combatants. Scenarios can be developed and run faster, but allow for
less insight into the mechanism of interactions.
This thesis explores the possibility of using a low-resolution simulation as a rapid
prototyping device for more arduous (and expensive) simulations to gain limited insight
and assist in scenario development by contrasting a scenario developed in COMBATXXI
with a similar scenario developed in DAFS.

vi
THIS PAGE INTENTIONALLY LEFT BLANK

vii
TABLE OF CONTENTS
I. INTRODUCTION........................................................................................................1 A. BACKGROUND ..............................................................................................1 B. PROBLEM DEFFINITION ............................................................................5 C. THESIS ORGANIZATION ............................................................................5
II. CONCEPTS AND PREVIOUS WORK ....................................................................7 A. SIMULATION RESOLUTION ......................................................................7
1. Contrasting High and Low Resolution in Simulation ......................8 2. Simulation Resolution by General Purpose .....................................10 3. Abstraction: Aggregation and Disaggregation ...............................11
B. COMPUTATIONAL COMPLEXITY IN SIMULATION ........................13 C. PROTOTYPING ............................................................................................15 D. ESTABLISHING SIMULATION INITIAL CONDITIONS ....................16 E. COMBATXXI ................................................................................................17
1. Model Description ..............................................................................17 2. Scenario Development .......................................................................18 3. Data Analysis ......................................................................................19
F. DAFS ...............................................................................................................20 1. Model Description ..............................................................................20 2. Scenario Development .......................................................................20 3. Data Analysis ......................................................................................21
III. PRELIMINARY EXPLORATION INTO THE EFFECTS OF UNIT AGGREGATION .......................................................................................................23
1. The Model ...........................................................................................23 2. Exploration in Development of Alternative Courses of Action .....25 3. Exploration of Increasing Complexity .............................................26
IV. METHODOLOGY ....................................................................................................31 A. MODEL DEVELOPMENT ..........................................................................31
1. Scenario Description ..........................................................................31 2. Scoping the Scenario ..........................................................................32 3. Performance Measures and Metrics ................................................35
B. MODEL PARAMETER ESTIMATION AND TRANSLATION .............36 1. Aggregation Translation ...................................................................36 2. Position Translation ...........................................................................37 3. Movement Speed Translation ...........................................................39 4. Sensor Translation .............................................................................39 5. Weapon Capabilities Translation .....................................................46
C. ASSUMPTIONS .............................................................................................50 D. DESIGN OF EXPERIMENT........................................................................50
V. RESULTS ...................................................................................................................51 A. OBJECTIVE OPINION ................................................................................51

viii
1. Ease of Use: COMBATXXI .............................................................51 2. Ease of Use: DAFS ............................................................................53 3. Lessons Learned .................................................................................54
C. STATISTICAL COMPARISON ..................................................................55 1. Battle Metrics .....................................................................................56 2. Computational Demands ...................................................................58
D. SCENARIO AOA EXPLORATION ............................................................59 E. CONCLUSION AND RECOMMENDATIONS .........................................61
1. Regarding Ease of Use .......................................................................61 2. Regarding Statistical Comparison....................................................62 3. Regarding AOA Exploration ............................................................63
VI. FUTURE WORK .......................................................................................................65
LIST OF REFERENCES ......................................................................................................67
INITIAL DISTRIBUTION LIST .........................................................................................69

ix
LIST OF FIGURES
Figure 1. Resource Impacts Associated with Increasing Unit Size (from N. Hinojosa, personal communication, August 9, 2012). .......................................2
Figure 2. Effects of Resolution on Line of Sight Calculations .........................................7 Figure 3. Resources required as a factor of simulated unit size (from N. Hinojosa,
personal communication, August 9, 2012). .....................................................14 Figure 4. Representation of the historical force disposition prior to the Battle of
Agincourt. The results of the battle (right pane) mimic historical records. ....25 Figure 5. Testing a modification to the force disposition at the Battle of Agincourt.
Had French cavalry been able to flank the English, the result may have been a significant French victory over the English. .........................................26
Figure 6. Battle survivors were statistically similar, as with Lanchester models ...........27 Figure 7. Duration of combat was statistically similar, as with Lanchester models. ......28 Figure 8. Model run time as a factor of agent count. ......................................................28 Figure 9. COMBATXXI preprocessor view of ACV Phase 0. .......................................32 Figure 10. Unit disposition in COMBATXXI scenario. ...................................................33 Figure 11. DAFS scenario translation (eastern route). ......................................................34 Figure 12. DAFS scenario translation, variant 1 (central route). ......................................34 Figure 13. DAFS scenario translation, variant 2 (western route). .....................................35 Figure 14. COMBATXXI and DAFS representation of the same units. The inverted
triangle on the left and the green square on the right represent the same waypoint. ..........................................................................................................37
Figure 15. Relational test case translated to latitude and longitude. .................................38 Figure 16. Route 1 coordinates translated to relational coordinates. ................................38 Figure 17. DAFS sensing methodology (from DAFS User Guide, September 2012). .....40 Figure 18. Human eye sensing acquisitions by acquisition levels from 5 sample
COMBATXXI scenario runs. ..........................................................................41 Figure 19. Binocular sensing acquisitions from 5 sample COMBATXXI scenario
runs. Note the concentrated area of identifications. ........................................42 Figure 20. Total relative identification level acquisitions from 5 sample
COMBATXXI scenario runs. ..........................................................................42 Figure 21. Contrasting an exponential distribution with the actual distribution of
human eye identifications. ...............................................................................44 Figure 22. Contrasting a gamma distribution with the actual distribution of binocular
identifications. ..................................................................................................45 Figure 23. Contrasting the combined gamma binocular approximation and
exponential human eye approximation with the actual COMBATXXI distribution. ......................................................................................................46
Figure 24. Sample of options associated with log file creation. Those log files selected were those used in the final analysis. .................................................52
Figure 25. Sample DAFS input through Access spreadsheets ..........................................53 Figure 26. COMBATXXI experimental rates of acquisition to the level of
identification in Phase 0 scenario. ...................................................................57

x
Figure 27. DAFS experimental rates of detection in Phase 0 scenario. ............................57 Figure 28. A contrast between COMBATXXI and DAFS rates of target acquisition
based on COMBATXXI acquisition to level of identification and DAFS detection. ..........................................................................................................58
Figure 29. DAFS AOA of Phase 0 battle time based on different routing for Marines. The eastern route was the same routing as the COMBATXXI scenario. ........60

xi
LIST OF TABLES
Table 1. Simulation resolution based on general purpose (after Davis, 1995) ..............10 Table 2. Force structure used for simulation of the Battle of Agincourt. ......................24 Table 3. Performance metrics. .......................................................................................35 Table 4. Translation of locations....................................................................................39 Table 5. Weapons effectiveness data for DAFS scenario (from T. Roofner, personal
communication, 14 September 2012). * The XM29 and FGM148 data provided were already in the format of probability to hit and kill a target ......48
Table 6. Linear Pkill per time unit (6 seconds) incorporating reload times and assumptions. Phit for min range is assumed to be 100% (excepting FGM-148, which was estimated for a single shot). ...................................................49
Table 7. Battle metrics contrasting COMBATXXI and DAFS results. .........................56 Table 8. Casualty comparison based of DAFS Phase 0 AOA based on various
routing ..............................................................................................................60

xii
THIS PAGE INTENTIONALLY LEFT BLANK

xiii
LIST OF ACRONYMS AND ABBREVIATIONS
AOA Analysis of Alternatives
ACV Amphibious Combat Vehicle
CAS Close Air Support
COA Course of Action
COMBATXXI Combined Arms Analysis Tool for the 21st Century
CVO Constrained Value Optimizer
DAFS Dynamic Allocation of Fires and Sensors model
GCV Ground Combat Vehicle
GUI Graphical User Interface
HTN Hierarchical Task Network
MCCDC Marine Corps Combat Development Command
Phit Probability to hit the intended target
Pkill Probability to kill the intended target
SITS Scenario Integration Tool Suite
USMC United States Marine Corps
WSMR White Sands Missile Range

xiv
THIS PAGE INTENTIONALLY LEFT BLANK

xv
ACKNOWLEDGMENTS
There were many people that helped me personally in my efforts to complete this
thesis. Though my name may be prominent on the title page, it was certainly a team
effort.
I would first like to thank my entire family for their support. My wife Heidi was
especially supportive, even though the topic is a foreign language to her ears. Her gentle
urgings helped me through the frustrations.
My two advisors, Dr. Buss and Dr. Balogh were patient and helpful throughout.
Regardless of the naivety of my questions, they were willing to work with me through to
completion. I recognize that the efforts I asked of them were in addition to their normal
requirements and thank them whole-heartedly for their frequent meetings and
discussions. I easily learned as much from their insight as from any of the associated
research.
The topic was the compilation of several ideas, not least of which came from the
folks working at TRAC-MONTEREY. LTCs John Alt and Jason Caldwell both
described difficulties they had perceived in working with COMBATXXI and how
JDAFS might be used in a similar manner. MAJ Kevin Bolke was kind enough to share
some of his experiences working with COMBATXXI while stationed at WSMR, Dr.
Tom Anderson was able to help me find a contact at WSMR, Ms. Hinojosa, for some
initial data exploration. Ms. Hinojosa then provided me with a fantastic collection of data
directly applicable to the study.
In execution, staff at MCCDC OAD helped me immeasurably. Maj Chris
Fitzpatrick went through the trouble of helping me acquire the scenario used in this study
to include trouble-shooting and modifying it, all on his own time. He patiently helped me
through the initial stages of getting a running copy of the scenario on a local machine,
without which the study would not have happened. Mr. Al Sawyer advised me in my
efforts, while Mr. Ted Roofner provided me with the unclassified weapons data necessary
for the contrasting scenario.

xvi
Lastly, I would like to thank my classmate, sometimes opponent, but always my
friend, MAJ Brian Vogt. He acted as a sounding board for many of my ideas. His
experiences in Army simulation often offered a background for him to critique and
debate that helped me develop my concepts.

1
I. INTRODUCTION
A. BACKGROUND
Simulation has many uses, one of which is analysis for acquisitions decisions.
When assessing the value of adding a new weapon system to the existing infrastructure,
live-fire field tests are expensive and dangerous to conduct and usually cannot cover the
full range of potential operational scenarios. Researching emerging combat technologies
and tactics through simulation provides a critical component for conducting a thorough
and diverse analysis of alternatives (AOA) prior to committing to large expenditures of
taxpayer dollars in acquisitions programs.
Acquisitions analysis through simulation is both difficult and potentially very
costly in both time and money. One tool used for such analysis is the simulation
COMBATXXI (COMBATXXI), which is used by both the Army and the Marine Corps.
The 2012 Analysis of Alternatives (AOA) conducted by the Marine Corps Combat
Development Command (MCCDC) on the Amphibious Combat Vehicle (ACV) cost an
estimate of $1,281,000 (part of which was the cost of COMBATXXI development and
analysis) (Sawyers, personal communication, July 13, 2012). Army personnel at White
Sands Missile Range (WSMR) estimated the scenario development time in
COMBATXXI for the 2010 study of the new Ground Combat Vehicle (GCV) at 7
months for 9 trained analysts (Figure 1).

2
Figure 1. Resource Impacts Associated with Increasing Unit Size (from N. Hinojosa, personal communication, August 9, 2012).
One approach to scenario development and modification in COMBATXXI is
achieved through a monolithic development process. This technique implies that
scenarios are developed to near completion without much incremental testing. This
technique is used because development teams assume there is insufficient time for
incremental development (I. Balogh, personal communication, September 5, 2012). One
drawback of this technique is that systemic errors are not likely to be discovered until late
in the development cycle. With integration issues tightly coupled during late stage
development, errors can require retooling on a large scale. Redesigning a simulation
scenario with complex behaviors and interactions late in the development cycle costs
time and money.
Another technique is evolutionary prototyping. Using this technique, scenarios
are developed through a process of creating simple versions, and then continuously
expanding from a working model. This is very effective, especially when the model
lacks complexity. As the model is developed, however, interactions become
progressively more difficult to troubleshoot. This translates into delays in development

3
associated with trial run testing. The incremental runs take longer based on complexity,
even when making low-level changes to the scenario. The effects of seemingly minor
changes can take hours to assess.
Rapid, throw-away prototyping techniques can be borrowed from other industries
in order to address some of these issues. An example of the utility of this technique
occurs in the auto industry. Clay, computer, and wooden models are built of cars before
the design team even attempts to make a working prototype. The mock-up of the finished
product gives the developers insights that eliminate development errors that would
otherwise be more costly to correct at later stages of product development. An
application of this approach to simulation development is the use of a simplified model to
construct a scenario (or portion thereof) as a concept test-bed. The throw-away aspect
implies that the model can be used to gain insights, without any expectation of being used
in the final solution. Properly implemented, a simplified model can be developed at
several points along the model development cycle to rapidly troubleshoot interactions
without the difficulties of exploratory development in the actual model.
A simulation must be designed to fill a specific need; there is no one simulation
that will be optimal for all tasks. In practice though, simulations are not always used to
address the task for which they were designed. Much as a wrench can be used effectively
as a hammer, simulations are often called on to perform tasks that are possible, yet not
optimal. The results of using the wrong tool for the wrong job manifest in simulations as
they do elsewhere. Less than optimal tasking can lead to inefficiencies and disparity in
results.
The level of detail modeled in a simulation should be dependent on the problem
being addressed. When the results of an interaction are likely to affect the outcome of the
experimental metrics, the interactions need to be modeled. Building a model with a
greater level of detail is more difficult, and sometimes not related to the experimental
question. For example, estimating the number of infantry companies required to take an
objective requires one level of detail, while estimating the number and type of munitions
required for a specific assault requires a whole additional level of detail.

4
Simulations can be roughly categorized along a continuum from high-resolution
to low-resolution. In high-resolution combat models, interactions and agents are
individually described. Explicitly modeling many contributing facet of a system allows
for the development of a deeper understanding of that system, especially when dealing
with complexity. Interactions, once recognized in analysis, can then be further explored.
In attempting to represent many interactions in a complex system, high-resolution
simulations, such as COMBATXXI, can be slow to develop, trouble-shoot, execute, and
analyze.
In low-resolution models, effects and or agents are abstracted such that many
interactions are simplified or covered by assumption. The effects of interactions can be
recognized and effectively modeled in a low-resolution context without modeling the
mechanism of such interactions, especially when the purpose of the simulation does not
require the investigation of such a level of detail. Low-resolution models use relatively
simple mathematical models to represent interactions, making calculation simpler.
Troubleshooting errors and running such a simulation takes significantly less time and
effort. Thus scenarios can be rapidly developed and produce sufficient results for usable
statistical analysis. It can be an especially helpful technique to use when the effects are
historically well documented. One such simulation is the Dynamic Allocation of Fires
and Sensors (DAFS) model. “DAFS is an entity-level simulation framework that adopts
a ‘low-resolution’ world view. It is intended for situations requiring fast turnaround
analysis and those requiring much flexibility and customization on the part of the model.”
(DAFS User Guide, September 2012).
When a situation arises that requires simulation experimentation in a short time
span, a low-resolution simulation such as DAFS can quickly produce results. These
results lack the details inherit in the higher resolution models, but the results of low-
resolution analysis often complement the more deliberate research associated with more
complex modeling efforts.
5
B. PROBLEM DEFFINITION
Scenario development in COMBATXXI can be time consuming and expensive.
Complex modeling of interactions often generates initial erroneous results that are
difficult to troubleshoot. Running the model can take long periods of time, even when
troubleshooting. It can postpone the development of final analysis products and reduce
the time available to perform run-time variations for different courses of action (COAs).
Recognizing that COMBATXXI is one of the models currently used for developing the
AOAs critical to multi-million or billion dollar acquisitions choices, can the use of DAFS
provide a low overhead method to decrease scenario production cycle times and costs as
a rapid, throw-away, prototype? What are the potential pitfalls associated with
attempting to translate data from one model to another?
Though the results of a low-resolution simulation are less detailed concerning
interactions, can the results of a low-resolution simulation such as DAFS provide an
adequate rapid turn-around “quick look” into the potential outcome for a high-resolution
simulation such as COMBATXXI?
C. THESIS ORGANIZATION
The remainder of this thesis is organized as follows:
• An exploration of concepts, previous work and the models used in this
study.
• A preliminary exploration into low-resolution unit aggregation
phenomenon.
• An explaination of the methodologies used in conducting the study.
• The results of the study including conclusions.
• Potential areas for future study.

6
THIS PAGE INTENTIONALLY LEFT BLANK
7
II. CONCEPTS AND PREVIOUS WORK
This section discusses concepts integral to the study as well as related work in the
area. It also highlights the simulations used to conduct this study.
A. SIMULATION RESOLUTION
Consider resolution with respect to simulations as a means of describing the
amount of detail explicitly described by a model. Different models can represent the
same phenomenon at different levels of detail. Lack of detail does not necessarily imply
lack of accuracy. Some very complex interactions can be described by relatively simple
models. Differences in representation due to level of detail can lead to dissimilar results,
however. As a simple case for comparison, deviation in altitude may be represented at
different intervals (i.e. 5m terrain vs. 50m terrain). This disparity can lead to confusing
or confounding results. Agents in one model of lower resolution can establish line of
sight and engage enemy units, while these same agents would not do so in a higher
resolution model due to terrain interference that simply was not represented in the lower
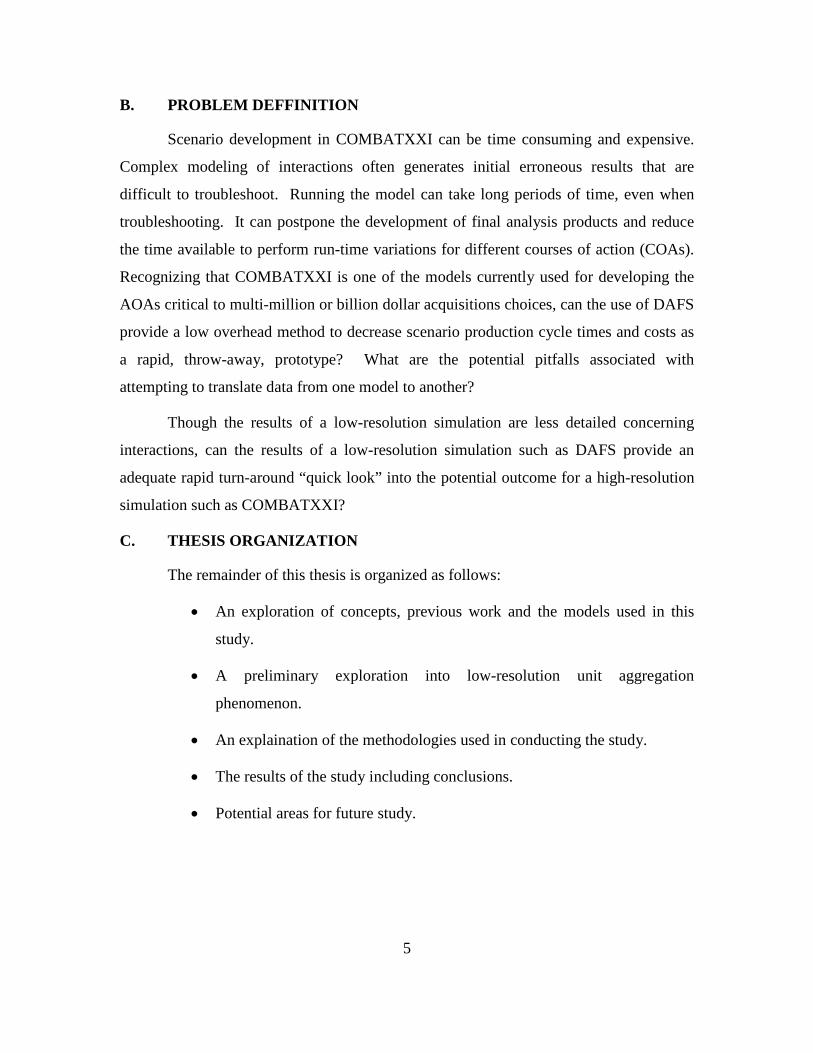
resolution model (Figure 2).
Figure 2. Effects of Resolution on Line of Sight Calculations

8
This concept of variable levels of detail used in the depiction of entities and
phenomenon in simulation extends well beyond terrain. The probability of events is
modeled in different ways as well. Much as modeling terrain at high levels of detail is
similar to recognizing deviations at small intervals, event probabilities can be estimated
by assessing the likelihood of all of the required subtasks occurring in the proper order at
the proper time. Events can likewise be defined in a low-resolution manner by simply
estimating the probability of occurrence (without decomposing them into subtasks).
1. Contrasting High and Low Resolution in Simulation
Simulation resolution decisions are integral to the problem being studied through
simulation. For example, if we assess that terrain data for individual ground combat is
significant at a level such that vertical deviations at every 4 inches need to be modeled
accurately in order to represent the micro terrain that infantrymen seek for cover from
enemy fire, analysts may successfully gain significant insight in modeling a small unit of
infantry in a firefight. That same technique could not be used as effectively in modeling
campaign size elements in a specific mountainous terrain that spanned hundreds of square
miles. The cost (both in computation and storage space) associated with accurately
modeling the real world to that level would be prohibitively expensive. Depending on
the purpose of the research, modeling such detail may not necessarily provide any
additional insight or benefits. The effects of terrain on campaign size elements could
possibly be estimated and applied without a significant difference in results. Given a
sufficiently large sample of measurements, deviations can be represented by an average
or representative distribution.
Higher resolution models can explore the effects associated with interactions,
because details of interactions of interest are explicitly modeled. By collecting the data
necessary to develop situations adequately, unique and emergent behaviors manifest that
allow analysts to develop insight into poorly understood processes. Without the effort to
understand complex interactions, we cannot otherwise anticipate how systemic changes
will manifest. Sometimes it is impossible to initially determine which factors affect
changes in the targeted metrics of consideration due to the complexity of interactions.

9
Therefore, high-resolution agent-based modeling often trends toward modeling the
human cognitive process with the goal of developing agents who act correctly in the
presence of a variety of stimuli. Based on the type and amount of data collection
necessary to span the problem space, model development can be both extremely complex
and time consuming.
Lower resolution models tend to explore relationships through effects-based
modeling of more abstract concepts. For example, a low-resolution model may portray a
group of Marines as an individual agent such that the goals, abilities, and fate of the
group is extended to be that of all the members of the group. In a higher-resolution
model, that same group of Marines could be modeled individually with each individual
having specific qualities, even to the degree that each agent could have different goals or
personalities. Some data is collected at a lower resolution as well, making high-
resolution analysis either more difficult or even impossible. For example, historical
reports focus on easily defined metrics such as the winner or loser, the casualties, and the
time of the event without capturing the high-resolution focus on individual traits or
motives.
Below is a paraphrasing of how Paul Davis of RAND discussed the concept of
resolution (Davis, 1995). Resolution can be a factor of:
• More fine-grained entities (companies rather than battalions as the
individual agents)
• Richness of the attributes associated with each entity
• Relationships and logical dependencies
• How changes in state are managed for entities (damage may be evenly
apportioned to all units involved in a battle, or explicitly apportioned
based on position)
• Spatial grid and time step, or the discrete-event equivalent (as a measure
of complexity in the state change process)

10
2. Simulation Resolution by General Purpose
Though simulation resolution can vary within a model based on the purpose of the
model (higher resolution details in some aspects and lower resolution details in others), a
simplistic general differentiation by model purpose can be made (Davis, 1995).
Low-Resolution High-Resolution
Initial exploration Understanding phenomena
Comprehension (forest rather than the
trees)
Representing knowledge (or skill sets)
System analysis Simulating reality
Decision support Calibrating lower-resolution models
Rapid, low cost analysis When high resolution data is available
When only low-resolution data is available
Table 1. Simulation resolution based on general purpose (after Davis, 1995)
An important possible characteristic of these generalities is that low-resolution
model results can be more easily understood (high transparency). High-resolution
models tend to focus on the vagaries of complex interactions, which can produce
complex results that may be difficult to understand or explain in the frame of root cause
(low transparency). For example, a simplistic model may recognize that an infantryman
can detect a tank, without modeling the “how”. The detection can be easily traced to a
moment in time and results flow naturally from there. In a higher resolution model that
represents aural, visual, and networked communication cuing, recognizing that hearing a
tank leads to detection but not identification can be an interesting focus that leads to
further investigation. How those mechanisms are connected to the results of a conflict
may not be easy to understand or explain.

11
3. Abstraction: Aggregation and Disaggregation
Logically, data must usually be abstracted in some manner to make useful, timely
analysis. It would be unreasonable to create a molecular level model that detailed each
mote of dust for an operational combat analysis. The level to which data is abstracted
affects the results in different ways and every simulation makes assumptions at some
level. The information necessary to develop a model of increasingly finer resolution is
more expensive to collect in time and money, and never completely correct. At some
atomic level of detail, components cannot reasonably be broken down into further sub
components. Assumptions exist in every model (i.e. every human has two arms and legs,
all aircraft are full mission capable at the start of a sortie, the weather is the same for the
entire battlefield, etc.) at different levels of detail. Where low-resolution models make
clear and explicit assumptions, the assumptions made at finer points in high-resolution
simulations are just as systemic and critical to model success. Those assumptions do not
necessarily degrade the value of the insight that can be gained, but must be considered
lest some artifacts of these assumptions be taken as fact. “…All models are wrong, but
some are useful” (Box, 1987).
The use of assumptions of homogeneity, or the application of a single distribution
of characteristics, is a basis for simplifications found in lower resolution models. A
classic model for combat is the Lanchester equations. Lanchester’s basic models for
combat are mathematical equations for determining the outcome of battle based on the
size and quality of the forces involved (very low-resolution). One assumption in the
original models was that of homogeneity; all of the units of a particular force are assumed
to be identical. The basic model was later enriched to account for heterogeneous forces,
but the original models develop an interesting concept. Homogeneity is never the case in
reality, though at some point the individual differences in each soldier or Marine become
less significant to the outcome of the conflict. The average performance of the individuals
involved is essentially equal to that of individuals in similar units when viewed on a large
enough scale. This is reflected in the concept of the central limit theorem in statistics;
that the average value of multiple samples from the same population will be normally
distributed about a mean (regardless of the distribution of the population value). These

12
basic combat models were deterministic, which produced a mean value without the
associated distribution of values. The distribution of those values about the mean is a
necessary component of any sensitivity analysis. Through the use of stochastic modeling
(implying an element of chance), the distributions become evident. By accurately
reflecting the probabilistic tendencies in events, models can also answer questions
concerning the likely magnitude of deviation from the expected mean results.
With an assumption of homogeneity, similar units or effects can be aggregated,
but aggregation is a controversial subject. Historically, numerical superiority references
of forces were sometimes the only available data, leading to coarser analysis with many
assumptions and without due consideration to the individual capabilities of different
units. Understanding of cause and effect at the individual combatant level was either
unknown or not well recorded. Although a mostly homogeneous force can be more
easily assessed and assigned some value representing the collective combat power, forces
have become more heterogeneous with units having particular strengths and weaknesses
associated with particulars of situations and the opponents they face (Hillestad &
Juncosa, 1995). For example, how do you assess the aggregated value of a special
operations team? If the team is caught in the open in conflict with an infantry company,
they may not fare much better than an experienced fire team. That same force could
account for a strategic level of impact given the right opportunities. The controversy
over combat power assignment can be decomposed and demystified when disaggregated
in a high-resolution model.
Likewise, disaggregation (or decomposition) is not always possible or desired.
Though effects may be clearly evident and well understood, data concerning the root
cause of effects may not be available (or easily attainable). Determining all of the factors
that produce a given set of effects is complicated. Even though individual, lower level
interactions may be verified against real world data, the sum of the parts must likewise be
so validated. With the integration of complex interactions explicitly designed, it can be
difficult to “tune” a model to reflect reality.
13
B. COMPUTATIONAL COMPLEXITY IN SIMULATION
As the mechanics of interactions between entities are further decomposed in more
complex simulations, more variables and intermediate computations are added to the
calculation of the results of interactions. Thus, increased complexity requires more
computing power. As each additional agent is explicitly represented, so more agents are
able to interact. This results in a compounding of scenario creation, run-time, data
collection, and analysis computational requirements.
More complex models are more difficult to analyze as well. The term
“transparency” is used to describe how easily a model’s inner workings can be described
for troubleshooting or analysis. As complexity increases, model transparency goes down.
“Beware of general purpose, grandiose models that try to incorporate practically
everything. Such models are difficult to validate, to interpret, to calibrate statistically and,
most importantly to explain,” (Raiffa, 1982). This can introduce a host of difficulties not
present in more simplistic models.
Where more simplistic models offer transparency to the analysts and developers,
complex models may offer a sense of false security to decision makers. Complex models
are more believable, especially to the uninitiated. If based on the proper theories and
data, simple and complex models of the same system should provide similar results.
Though the data may reflect similar results, it is assumed that the additional factors
available for consideration in the complex models make the results somehow more
accurate or better reflections of reality. This is not necessarily the case. “A complex
model when shown to managers has more impact than a simpler one, even if they both
could perform the same job. Furthermore since it is more complex it has a connotation
that it was more difficult to build, valorizing in some sense the modeler’s job,” (Chwif,
Paul, & Pereira-Barretto, 2000).
A good example of the effects of complexity on development and analysis
requirements can be seen in Figure 3. Past experience in building scenarios in
COMBATXXI has shown that the model can becomes intractable if brigade or large units
are modeled. As units of increasing command structures are added to a simulation in

14
COMBATXXI, additional control measures need to be considered. For example, the
communications, route, and behaviors required to describe a platoon element are
simplistic when compared to that of a battalion, which requires artillery, air support, and
advanced communications networks to be modeled (K. Bolke, personal communication,
July 31, 2012). An important point of note is that though every interaction previously
included in smaller units is still modeled in the larger unit scenario, the number of metrics
analyzed is smaller: from 69 to 34 (likely as a factor of the increased amount of time
necessary to process the data).
Figure 3. Resources required as a factor of simulated unit size (from N. Hinojosa, personal communication, August 9, 2012)
When running a model during development, undesired interaction effects become
more difficult to diagnose (from Figure 3, “why is X happening”). It becomes
increasingly difficult to troubleshoot simulations as the complexity is increased. It may
seem that adding more analysts would decrease development and analysis times, which is
true to a point. Much as the interactions between agents slow a simulation when more
agents are added, the addition of more analysts or simulation developers eventually
becomes counter-productive in that additional cross coordination will outweigh the
benefit of additional manpower. This effect was well documented with regards to

15
addition of programmers when developing computer code (Brooks, F. P., 1995). This
also affects the number of alternative COAs that can be analyzed in a given amount of
time.
C. PROTOTYPING
One of the most common prototyping methods in use in software and simulation
development is that of evolutionary prototyping. This refers to the creation of a robust,
working prototype based on well understood requirements that is to become the finished
product through gradual improvement (Davis, A. M., 1992). Evolutionary prototyping
with regards to simulation refers to the technique of developing a large, complex model
from a simple working model by increasingly adding features while incorporating
incremental testing. Though not specifically titled as such, Pidd comments on this
technique in reference to effective model development techniques, “Be parsimonious,
start small, then add,” (Pidd, M., 1996).
A contrasting technique is known as throw-away prototyping. When developing
through the use of throw-away prototyping, poorly understood requirements are modeled
separately, with no intent to include the results into the finished results. The models are
built solely to gain insight into a portion of the problem, without attempting to integrate
any design points directly. “Throwaway prototypes work very well in isolation to verify
relatively small parts of complex problems,” (Davis, 1992). Throw-away prototyping is
especially useful in exploring poorly understood requirements. This allows for the
exploration of the problem space without corruption of the final study development effort
and the benefit of timely sidebar analysis.
Acknowledging that scenario development is an incremental art and also that
many scenarios offer degrees of reuse, there is some potential for using a simplified
simulation or “sand-table” to wargame scenarios to increase efficiency. Much as an artist
might sketch ideas separate from the canvas on which he intends his final work,
simulation scenarios can be developed separately from the modeling platform on which
they are intended to be used. Simplistic, but valuable insight gained through quickly
developed models can potentially decrease development cycle times, save effort

16
previously allocated to troubleshooting, and increase overall efficiency. In such a case
where the intent is to develop a large, complex constructive situation to evaluate the
effects of a new combat system (such as the ACV AOA recently conducted at MCCDC),
using a greatly simplified model to gain limited insight into developmental problems may
allow more COAs to receive the benefit of early feasibility testing for potential inclusion
in the final model evaluation with only a fractional allocation of effort.
D. ESTABLISHING SIMULATION INITIAL CONDITIONS
One avenue previously considered is that of development of simulation initial
conditions. Initial conditions in a simulation are those conditions on the battlefield when
the simulation begins. Scenarios rarely begin prior to contact; there is usually some sense
of how the battlefield was prepared. There might be generated intelligence reports,
damage to enemy positions due to preparatory fires, or the assumption that the
amphibious force makes landfall prior to the simulation beginning. In practice, subject
matter experts are called upon to estimate these conditions. Even the best available
experts may have a shallow or dated knowledge on extremely infrequent events. For
example, the United States has not taken part in a large-scale, opposed amphibious
landing since World War II. There is effectively no first-hand experience with current
systems interactions available to support expert evaluations in that realm and many
others. Low-resolution simulations may offer a partial answer to fill such gaps.
Similarly, initial conditions are a critical component of mission decomposition.
When a mission can effectively be broken into steps or phases, then each phase
effectively has different initial conditions. JDAFS (a joint version of DAFS) was
proposed as a means for exploring various settings for starting conditions (Ahner, Buss,
& Ruck, 2007), but no attempt was made to implement DAFS in such a capacity. If
nothing else, initial fuel loads, velocities, orientations, preliminary attrition, and initial
sensor targets could be run through a low-resolution trial to confirm not only their
validity, but also their possibility. Subject matter expert opinions can thereby be given
some level of additional rigorous examination.

17
E. COMBATXXI
The United States Army and the United States Marine Corps (USMC) use
computer based simulations to develop their respective needs in current and future
acquisition programs. One simulation currently in use is COMBATXXI. It is an agent
based, discrete event, stochastic simulation that can be configured to capture many details
associated with modern combat. It can take a significant amount of time to thoroughly
develop, run, and analyze a scenario in COMBATXXI.
1. Model Description
The COMBATXXI users’ guide available through the WSMR Confluence site
(https://COMBATXXI.wsmr.army.mil/confluence/display/COMBATXXIDOC)
describes the simulation as follows:
Combined Arms Analysis Tool for the 21st Century (COMBATXXI) is:
• A Joint, high-resolution, closed-form, stochastic, discrete event, entity level
structure analytical combat simulation.
• Developed and supported by the TRADOC Analysis Center-White Sands Missile
Range (TRAC-WSMR) and other collaborating/partnering organizations.
• Designed for simulation of operations at the brigade level or lower with
appropriate representation of Joint/higher echelon assets.
• Used for land and amphibious warfare analyses in the Research, Development and
Acquisition (RDA) and Advanced Concepts and Requirements (ACR) Modeling
and Simulation (M&S) domains.
Major Model Function includes:
• Ground Combat: Light and Heavy forces.
• Air mobile forces.
• Future forces.
• Fixed-wing and Rotary-wing: CAS, Armed recon, Detailed communications
modeling, Rotary-wing, and Direct/indirect fire.
• Amphibious operations.

18
• Urban operations.
• CSS – logistics and casualty handling.
The Goal of COMBATXXI is to provide:
• A simulation with the needed resolution to model the complex, diverse elements
of the operational space of the future.
• A simulation that can represent information flow in a way that allows the analysis
of its impact on operational effectiveness.
• USMC with organic analysis tool, with Amphibious and Aviation warfare.
• Large force representations (context) for other models.
2. Scenario Development
Scenario development in COMBATXXI can be very time consuming. Though
scenario libraries are available through local servers and on the cloud at sites such as that
hosted by WSMR, each scenario must be reviewed in its entirety prior to use as an
analysis tool. Debugging complex interactions takes time.
COMBATXXI offers a scenario creation graphical user interface (GUI) for
scenario generation. This allows for step-by-step scenario creation and attribution of
behaviors to each entity or entity group. The process is work-flow oriented in that
developers are intended to follow a logical order of events to efficiently create scenarios
(https://COMBATXXI.wsmr.army.mil/confluence/display/ COMBATXXIDOC) by
proceeding through the steps in order:
• Designate Resources – performance data, maps, comms, etc.
• Designate Meta Data – properties and parameters of the scenario (study
name, terrain, weather, etc.)
• Assign Force Structure – sides, hierarchy of command, entities, etc.
• Design Map/Play board – assign start positions, waypoints, and insert
structures.
• Communications – networks and assignments.

19
• Orders – coordinating maneuvers and assigning behaviors/triggers
This allows for scripting of behaviors similar to a finite state automata where
simple rules govern the condition of each entity and act as triggers to change the
condition of the entity. In describing the behaviors of the agents, the modelers attempt to
represent key decision points for these agents. These decision points represent the
interactions in the model. Through the scripting of particular behaviors, modelers
attempt to mirror the decision making abilities of entities on the battlefield. In order to
correctly design behaviors, the modeler must have available a consummate understanding
of the task at hand. COMBATXXI has a large existing library of basic behaviors, but
more complex or unique behaviors can be created through creative scripting.
A second methodology for defining behaviors has been developed at NPS that is
based on hierarchical task networks (HTNs) (Fitzpatrick, Balogh, and Reeves, 2012).
HTNs are best described as tasks decomposed and ordered according to their triggers and
frequency. “A plan is then formulated by repeatedly decomposing tasks into smaller and
smaller subtasks until primitive, executable tasks are reached. A primary reason behind
HTN’s success is that its task networks capture useful procedural control
knowledge...described in terms of a decomposition of subtasks. Such control knowledge
can significantly reduce the search space for a plan while also ensuring that the plans
follow one of the stipulated courses of action,” (Sohrabi, Baier, McIlraith, 2009). This
new methodology promises to provide a more structured way to build behaviors in the
future that may ease some of the difficulties with the scenario construction process.
3. Data Analysis
Data analysis for a detailed scenario in COMBATXXI is no trivial task. Through
the use of post-processing software, initial analysis is streamlined. The sheer volume of
data potentially available following successful runs is daunting (12 GB in figure 3 post-
processing complete for a battalion), but because COMBATXXI has different data
logging functions for different interactions, the data can more easily be parsed to different
analysts.

20
F. DAFS
Similar to COMBATXXI, DAFS is an agent based, discrete event, stochastic
simulation. Both models were developed using the SimKit discrete event methodology.
DAFS was designed to allow for lower resolution, rapid model development.
1. Model Description
DAFS is an entity-level simulation framework that adopts a “low-resolution” world view. It is intended for situations requiring fast turnaround analysis and those requiring much flexibility and customization on the part of the model. DAFS was not intended as a substitute for high-resolution simulations, but rather as a complement to such models. One envisioned use for DAFS that was is to use it as a platform for initial tests and exploration of scenarios. Its ability to rapidly create and modify new scenarios makes it ideal for this task. Its low-resolution approach leads to fast execution times, which enable the analyst to quickly explore the parameter space for the desired situation before investing the non-trivial amount of effort required to develop a higher resolution model. (https://soteria.nps.navy.mil/jdafs/docs/ DAFSUserGuide.doc)
2. Scenario Development
Lacking some of the elegance associated with COMBATXXI’s development
GUI, DAFS potentially requires some degree of computer coding in order to completely
develop a scenario. Individual entities are created, and all are basically the same type of
entity to which attributes are attached, such as name, type, sensors, munitions, speed, etc.
Unlike COMBATXXI, where the internal makeup of units must be explicitly represented,
DAFS does not enforce explicit representation. Representation in DAFS can be defined
by the scenario developer. Thus the aggregation of units in number and effects can more
easily be represented in DAFS. To attempt to model a large number of different units
with different behaviors would be difficult in DAFS and require a significant amount of
imagination.
DAFS models behavior relatively simplistically in contrast to COMBATXXI. It
has the functionality available to compile a low-resolution acquire algorithm associated
with the probability to detect enemy units based on scenario variables. DAFS is dynamic
in the use of a constrained value optimizer (CVO). This allows agents to find the near-

21
term solution that offers the best local chance of success. In essence, the CVO solves a
linear program for each side involved in a battle, so that the fires are directed toward
optimal targets while giving credence to the defender’s ability to destroy the attacker.
This technique is applied to both sensors and fires. One parameter available for
adjustment is the rate at which the CVO executes optimization (and reallocates sensors
and fires).
3. Data Analysis
The graphical and data output from DAFS are somewhat limited, though simple
enough that with some basic Java experience, modifications are possible based on the
study design requirements. There is no innate data analysis capability associated with the
suite, though the output is easily imported to commercial data analysis programs such as
Excel, R, or JMP.

22
THIS PAGE INTENTIONALLY LEFT BLANK

23
III. PRELIMINARY EXPLORATION INTO THE EFFECTS OF UNIT AGGREGATION
As part of an initial exploration into the concept of aggregation, a model was
created based on the same basic construct of both COMBATXXI and DAFS:
constructive, agent based, stochastic, discrete event, and built based on SimKit. The
Battle of Agincourt that occurred on 25 October, 1415 was modeled due to the interesting
nature of the results. French forces with an apparent overwhelming advantage were
almost completely destroyed or captured by a smaller English force (which suffered
almost no casualties). The English were tired, sick, and hungry while the French were
fighting close to home.
The battle took place on a wide field in France. The English were able to displace
from their defenses and re-establish a position close to the enemy lines, putting the
French within the extreme range of the English Longbow. This prompted the French to
advance on the English position. The French were not able to flank the English ranks
with their cavalry, and the French infantry was unable to close ranks with the English fast
enough to avoid significant attrition. The end result was that as few as 450 English died
during the battle with the French forces left in shambles.
1. The Model
The model was developed as a low resolution model with both units and effects
aggregated to expedite analysis and enable various COAs to be analyzed. The force
structure was estimated due to some disparity between accounts of the forces present. As
the model was designed, the French forces numbered 13,200 while the English forces
numbered 8,500 with a proposed force structure as indicated in Table 2 (most of which
were long-bowmen) (http://en.wikipedia.org/wiki/Battle_of_Agincourt).

24
Unit English French
Foot Soldiers 1,500 8,000
Calvary 0 1,200
Bowmen 7,000 4,000
Total 8,500 13,200
Table 2. Force structure used for simulation of the Battle of Agincourt.
The model was aggregated in three primary ways:
• The force structures were represented by the greatest common divisor
(1 agent representing 100 people).
• Detection and attack were combined into a singular “time to kill”
calculation such that enemies in range of each other would schedule a
time to kill each other that could only be canceled if one or the other
died prior to reaching a scheduled time to kill.
• The terrain was not specifically modeled.
Theories about the battle consider that the French lost through a combination of
factors (including a freshly plowed field separating the forces), not the least of which was
a lack of respect for massed, aimed fires. The battle was modeled to represent two
different COAs based on force deployment options. The first force deployment
attempted to describe the historical situation as it was described to have happened. Most
notably, the English bowmen were just out of their effective range and the French cavalry
began the battle in such a position that they were targeted without the hope of immediate
support from the French infantry. This was to simulate a situation where the cavalry was
unable to be used as a flanking force. In the first half of Figure 4, the forces to the left
represent the massed forces of the French (with range rings prevalent as the range of the
French archers) and rightmost forces as the English (note the longer range rings of the
flanking wings of long bowmen). The small group of agents separate from the main body

25
represents the French cavalry. The second half of the figure describes the results of the
conflict, with smaller dots representing mostly fallen French agents.
Figure 4. Representation of the historical force disposition prior to the Battle of
Agincourt. The results of the battle (right pane) mimic historical records.
2. Exploration in Development of Alternative Courses of Action
The previous situation was contrasted with that illustrated in Figure 5. The
alternative COA in this situation focused on the initial disposition of the cavalry force,
which was adjusted to represent a flanking maneuver. In order to represent a flanking
behavior, the cavalry was offset from the front lines, allowing the infantry to become
decisively engaged prior to cavalry agents crossing into the range of the English archers
(yet another abstraction or aggregation in the form of tactical simplification). This action
restricted the rate at which the cavalry could be engaged at range, and resulted in quite a
different set of results. Though the English occasionally prevailed in this situation, the
typical outcome is described in Figure 5.

26
Figure 5. Testing a modification to the force disposition at the Battle of Agincourt. Had French cavalry been able to flank the English, the result may have been a
significant French victory over the English.
The previous scenarios illustrate the value of low-resolution simulation in
developing concepts for deeper exploration. Through the use of a relatively simple
model, many courses of action could be evaluated. Using a more rigorous, complex
model may prohibit extensive problem-space exploration due to increased data collection,
run-time, and analysis requirements.
The problem space can be explored using effects rather than the mechanisms for
those effects. For example: a combat simulation focusing on survivability could be
abstracted to the level of effects. Using a simple model for sensitivity analysis,
breakpoints and goals for effects can be determined (i.e. 5% additional sensor range
equates to 40% increased survivability). With effects-based goal metrics as a guide, high
resolution models can be used to determine how those goals might be achieved (explore
the phenomenon). Translating the concept of goal metrics to the previous scenario, the
French would have benefited from such an initial low-resolution study. They could have
explored a high-resolution model to develop tactics or equipment that would contribute to
success against the English, while also recognizing that failure to somehow close the gap
between the forces would be catastrophic.
3. Exploration of Increasing Complexity
The same model was reinitialized to perform 20 run batches of a very simplistic
version of combat, allowing two equally sized forces of archers to run against one

27
another in a fight to the finish. The English archers held the same advantage from the
previous scenario with an effective range of 107% that of the French. In each batch, the
number of agents on each side was increased, while the ratio of French to English was
held constant/equal. As the agents on each side were completely homogeneous and
mimicking aimed-fire, a contrast between this model and the classic Lanchester models
could be explored (the assumptions were met). Assuming that this model should behave
similar to Lanchester models, the expectation was that time of battle and the percent of
English forces surviving would be relatively constant if the ratio of forces was held
constant. This was in fact the case that surviving English forces (Figure 6) and battle
duration were similar, though there was variation in the surviving English forces.
Figure 6. Battle survivors were statistically similar, as with Lanchester models

28
Figure 7. Duration of combat was statistically similar, as with Lanchester models.
More interesting was the processing time (as measured by system clock time)
associated with arbitrarily increasing the model complexity (higher resolution) by
increasing the number of agents modeled. As more agents were added with a constant
ratio between both competing sides, the system load increased and processing time went
up. Though the trend followed a polynomial rate of increase initially, higher numbers of
entities exceeded the prediciton significantly (predicted processing time of 321 seconds
for 1000 agents on each side, actual time of 1,324 seconds).
Figure 8. Model run time as a factor of agent count.

29
This was done to explore the concept that more detailed, complex models are not
necessarily more accurate when assessing metrics that could be associated with a lower
resolution model; specifically that increasing details does not necessarily affect results. It
may seem overly simplistic to contrast such a measure of complexity, but models often
include factors that do not affect the metrics being measured. As agents are enriched
with more properties to better reflect reality, they become more complex (and thereby
increase the complexity of the simulation). As additional control measures and additonal
potential interactions and triggers are added, complexity also increases. In the previous
example, the net effect was merely longer processing times for the same results.
Extrapolating these results to a real-world complex modeling situation, the
addition of additional properties, interactions, and agents increases complexity quickly.
Optimally, only relevant factors and agents would be represented in a model. That is
almost never the case:
• Many models provide a schema for scenario creation and innate behaviors
that must be addressed entirely (all the blanks must be filled in). In
allowing for a spectrum of behaviors, the mechanisms for those behaviors
need to be addressed, even when not utilized.
• Determining which agents and interactions “matter” is not necessarily easy
or obvious. This lack of knowledge may be the purpose of the model.
• Though reusability is a valuable property in a model, artifacts from previous
renditions may be present and difficult to remove, while still increasing
model complexity.

30
THIS PAGE INTENTIONALLY LEFT BLANK

31
IV. METHODOLOGY
This section discusses the methodology used to implement the COMBATXXI
scenario in DAFS for comparison through experiment.
A. MODEL DEVELOPMENT
The initial intent of this research was to contrast the development, execution, and
results of a DAFS model built to mirror a current study being conducted through either
WSMR or MCCDC using COMBATXXI. As a step toward this long-term goal, this
study was conducted with consideration to limitations based on information classification
restrictions, scenario complexity, and the process of developing relational parameters. A
COMBATXXI scenario developed by MCCDC proved to be most amenable to the
application of simplified analysis and the testing of comparable metrics. In particular, a
portion of the Phase 0 of one of the scenarios used as part of the ACV AOA was
explored.
1. Scenario Description
The MCCDC COMBATXXI scenario described a reinforced Marine rifle
company (as a portion of a MEU) coming ashore in the general location of MCB Camp
Pendleton, California. From there, the company was set to embark on ACVs and travel
south along the coast to eventually move inland through an urban area. The scenario was
designed to thoroughly represent the facets of an amphibious landing on a foreign shore,
including communication networks, entrenched enemy forces, numerous different combat
platforms including aviation assets, and 5 meter resolution terrain (pictured in Figure 9
without terrain overlay to enhance visibility of unit control measures).

32
Figure 9. COMBATXXI preprocessor view of ACV Phase 0.
In partnership with Major Chris Fitzpatrick, a MCCDC simulation developer and
analyst whom had worked intimately with the original scenario creation, the scenario was
modified slightly to enhance compatibility with DAFS. In the original form and in
conjunction with the purpose of the study, the units came into contact with enemy forces
while aboard the proposed model of the ACV. Major Fitzpatrick was able to modify the
behaviors such that the ground forces moved southward dismounted, which made the
conflict between the Marines and enemy forces more dynamic and somewhat less
favorable for the Marine entities.
2. Scoping the Scenario
One vignette of the larger MCCDC Phase 0 was modeled in DAFS as an example
of how this methodology might be implemented on a larger scale. In contrast with the
purpose of the COMBATXXI scenario, the DAFS scenario was developed as a prototype
representing the initial conflict between friendly and enemy forces. As the
COMBATXXI model can be stopped at arbitrary points, it was set to conclude data
collection after a reasonably short portion of execution. This allowed for more
expeditious data collection and simplified analysis in both models. Over the course of a
route composed of four waypoints (approximately 2 km), the Marine unit was designed to
come into direct contact with an enemy rifle company.

33
Artifacts of the original design are still present in the focus vignette (i.e. the
ACVs, three routes, many units not pictured here, etc.). Though removing other aspects
not related to both models would make for a more even comparison in execution times,
many of the behaviors associated with entities in COMBATXXI are tightly coupled;
removal of seemingly non-essential entities may cause systemic problems due to
referenced hierarchies in command structures and behaviors. Though only the rightmost
route is used by the COMBATXXI model agents, the remaining two routes allowed for a
rapid AOA in tactics based on changes in routing with the DAFS model by using the
other two pictured routes as alternatives. In Figure 10, dismounted infantry has not yet
begun their movement toward the first waypoint (top right inverted triangle).
Figure 10. Unit disposition in COMBATXXI scenario.
The DAFS model does not explicitly display waypoints through the GUI, so
points were added as visual control measures for comparison (green squares). Three
different scenarios were developed in DAFS to represent three different alternatives. In
the COMBATXXI scenario, the Marine agents move via waypoints represented by the
blue line with inverted triangles representing waypoints along the easternmost (rightmost)
route (Figure 10). By referencing the COMBATXXI scenario, three different DAFS
scenarios were created corresponding the the three distinct routes portrayed in the

34
COMBATXXI scenario. The first DAFS scenario corresponds to the COMBATXXI
scenario, while the other two are variants represent the central and westernmost routes
respectively.
Figure 11. DAFS scenario translation (eastern route).
Figure 12. DAFS scenario translation, variant 1 (central route).
35
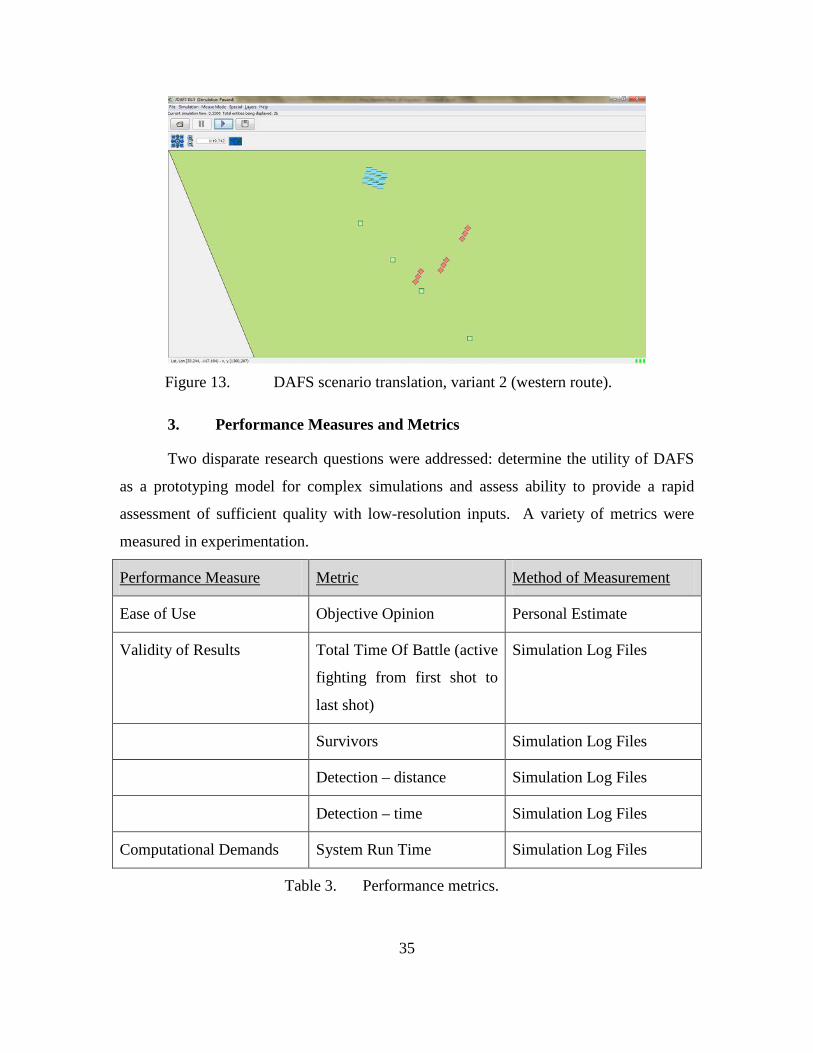
Figure 13. DAFS scenario translation, variant 2 (western route).
3. Performance Measures and Metrics
Two disparate research questions were addressed: determine the utility of DAFS
as a prototyping model for complex simulations and assess ability to provide a rapid
assessment of sufficient quality with low-resolution inputs. A variety of metrics were
measured in experimentation.
Performance Measure Metric Method of Measurement
Ease of Use Objective Opinion Personal Estimate
Validity of Results Total Time Of Battle (active
fighting from first shot to
last shot)
Simulation Log Files
Survivors Simulation Log Files
Detection – distance Simulation Log Files
Detection – time Simulation Log Files
Computational Demands System Run Time Simulation Log Files
Table 3. Performance metrics.
36
B. MODEL PARAMETER ESTIMATION AND TRANSLATION
In order to create a scenario similar to the one provided from MCCDC, it was
necessary to translate the COMBATXXI model parameters into DAFS. This posed some
challenges. COMBATXXI focuses on modeling scenarios by describing details such as
terrain, logistics, communications, complex target acquisition, etc. Many of these details
are not specifically modeled in DAFS. In order to do so, the DAFS construct would need
to be made as complex as that of COMBATXXI. Though DAFS can be modified to
enrich scenarios, modifying it to the point that it accepted all of the details available in
the COMBATXXI scenario would be counter-productive and eliminate any of the
potential value inherit in DAFS simplicity.
It was necessary to abstract some parameters in order to develop a model in the
DAFS framework. In an effort to make the data simple, keep the run times low, and
reduce the effort to analyze the results, some fidelity is lost in the translation process. In
the following section, the data was translated to represent the effects present in
COMBATXXI closely, but not exactly. The research question of this thesis probes the
efficacy of the techniques attempted here.
1. Aggregation Translation
One such modification was unit aggregation. In COMBATXXI, each entity was
uniquely represented by an individual simulated agent. By contrast, the choice was made
to represent multiple entities per agent in DAFS. Generally, each squad (group of
approximately 11–13 plus commanders) was counted as a single agent in DAFS. For
example, an enemy platoon is represented in COMBATXXI by 34 individual agents. In
the DAFS version of that same unit, it was represented by 3 agents. There were 287
discrete agents represented in COMBATXXI. The 185 agents of the reinforced rifle
company were represented with 12 aggregate agents in DAFS while the 102 enemy
agents were represented by 9 aggregate agents. Therefore the model was scaled to an
approximate agent representation of 13.7 to 1.

37
Figure 14. COMBATXXI and DAFS representation of the same units. The inverted triangle on the left and the green square on the right represent the same waypoint.
Though the threat units were armed rather simply with small arms (AK-47), the
Marine units were augmented with heavy weapons in the form of 60mm mortars and
JAVELIN missiles. The mortars were not directed against the enemy units in this portion
of the scenario. The JAVELIN missiles are an anti-armor weapon, but were employed in
this scenario as an anti-personnel weapon and were subsequently represented as such in
DAFS. The Marine individual weapons were the XM-29 assault rifle variant with 5.56
mm standard rounds plus programmable, air-burst munitions and the M-249 Squad
Automatic Weapon (SAW).
2. Position Translation
Though DAFS uses OpenMap in conjunction with the GUI, the model represents
its entities locally over a flat earth. These local coordinates are correlated to latitudes and
longitudes, but at an increasing error as they project from the center of the model focus
point. DAFS performs well without specific relation to latitude and longitude, relying on
distance in meters in relation to the other agents of the simulation. As terrain is not
modeled in DAFS, a simulation can be run anywhere without regards to global location,
and have similar results. In order to model the COMBATXXI as closely as possible, the
map was re-centered (the relational center was moved), and each point was translated by
linear forecast related to a test case of five points. The test case error was insignificant

38
with regards to the y-axis (latitude), as lines of latitude are evenly spaced. At the extreme
edges of the test case (10,000 meters from the center), the translation error was less than
14 meters in longitude.
Figure 15. Relational test case translated to latitude and longitude.
Figure 16. Route 1 coordinates translated to relational coordinates.

39
Waypoint Long DAFS xLoc Lat DAFS yLoc Start -117.2215 -633.44078 33.247 144.124169 wp1_Route 1 -117.2175 -260.82855 33.2483 288.248337 wp2_Route 1 -117.2147 0 33.2457 0 wp3_Route 1 -117.212 251.513249 33.2426 -343.68071 wp4_Route 1 -117.2041 987.422385 33.2366 -1008.8692 wp1_Route 2 -117.2200 -496.5327 33.2455 -20.662762 wp2_Route 2 -117.2173 -239.9399 33.2436 -236.1254 wp3_Route 2 -117.2141 59.4183 33.2407 -558.47108 wp4_Route 2 -117.2077 651.0072 33.2350 -1189.59 wp1_Route 3 -117.2229 -762.4461 33.2437 -218.37681 wp2_Route 3 -117.2196 -460.6755 33.2409 -527.80256 wp3_Route 3 -117.2167 -189.8276 33.2386 -788.02819 wp4_Route 3 -117.2119 262.7187 33.2342 -1273.5043
Table 4. Translation of locations.
3. Movement Speed Translation
Unit movement speeds for DAFS units were based on observed speeds for units in
COMBATXXI. The average speed of the infantry units to complete the scenario was
179.8 meters per minute, with a maximum speed of 201 meters per minute. The DAFS
units were attributed the maximum speed of 201 m/min, as the parameter in DAFS is
referred to only as the maximum speed.
4. Sensor Translation
COMBATXXI sensors relate the detection of a target to a stepwise conceptual
model. In COMBATXXI, a target goes through levels of acquisition. At each level of
acquisition, more information is determined about the target until enough information is
available to the sensing agent to make an appropriate action decision. Targets may be
acquired multiple times per agent. The agents in this scenario were not eligible to attack
enemy units until a level of acquisition of identification had been achieved. Achieving
acquisition is based on many scenario parameters such as line-of-sight calculations
(including entity orientation/heading), agent observing, agent being observed, field of

40
view, etc. In order of representative fidelity of the sensor in question, the levels of
acquisition are as follows:
• Detection: ground, air, or sea entity or life form
• Classification: basic type of entity (i.e. human, wheeled vehicle, rotary
wing aircraft)
• Recognition: general category of entity (i.e. attack helicopter, tank,
military personnel)
• Identification: specific description (enemy T72, friendly UH-60)
The detection algorithm for COMBATXXI is potentially very complex
(depending on how the scenario was developed and what features have been activated)
and relatively computationally intense. The DAFS approach to determining detection
involves estimating a time until detection. An enemy agent is assigned a time to detect
once it enters the range of an active sensor. If that agent leaves the range of the sensor
before detection, it is not detected. Once an agent is detected, it remains detected until it
exits the maximum range of the sensor platform. As DAFS does not represent terrain, it
does not explicitly model line-of-sight.
Figure 17. DAFS sensing methodology (from DAFS User Guide, September 2012).
StartMove
EndMove
EnterRange
ExitRange
Detection
Sensor
Target
Undetection

41
As the COMBATXXI scenario is part of a larger study, the data provided in the
observer log following a simulation run included the detections of units outside of the
scope of the focus area. The COMBATXXI data included data on all four levels of
acquisition. With these points in mind, the data in the COMBATXXI logging file was
sorted by distance to the target area as well as by the identification acquisition level,
decreasing the number of detections to be analyzed from 691,743 to 81,237. The human
eye sensing data related a relatively exponentially distributed rate of detections
throughout the 13 minutes of simulation time required to run the scenario. The binocular
sensing data revealed some interesting peaks as part of the distribution, as well as the fact
that binoculars did not involve a detection level of acquisition. Within the secondary
peak of the data, 20517 of the 27309 binocular identification acquisitions occurred (more
than 25% of the total of both sensors).
Figure 18. Human eye sensing acquisitions by acquisition levels from 5 sample COMBATXXI scenario runs.
0
0.002
0.004
0.006
0.008
0.01
0.012
0.014
0 1 2 3 4 5 6 7 8 9 10 11 12
Acqu
istio
ns a
s a
Perc
ent o
f Tot
al A
cqui
stio
ns
Simulation Time (minutes)
Human Eye Sensing Acquisitions
Eye-ID
Eye-Rec
Eye-Class
Eye-Det

42
Figure 19. Binocular sensing acquisitions from 5 sample COMBATXXI scenario runs. Note the concentrated area of identifications.
Figure 20. Total relative identification level acquisitions from 5 sample COMBATXXI scenario runs.
0
0.002
0.004
0.006
0.008
0.01
0.012
0.014
0.016
0.018
0 1 2 3 4 5 6 7 8 9 10 11 12
Acqu
istio
ns a
s a
Perc
ent o
f Tot
al
Acqu
istio
ns
Simulation Time (minutes)
Binocular Sensing Acquitions
Binoc-ID
Binoc-Rec
Binoc-Class
0
0.005
0.01
0.015
0.02
0.025
0.03
0 1 2 3 4 5 6 7 8 9 10 11 12Iden
tific
atio
n Ac
quis
ition
s as
a P
erce
ntag
e of
To
tal A
cqui
sitio
ns
Simulation Time (minutes)
Total Identification (Binoculars and Eyes)
Total ID
25.3% of all identifications
within this portion.
43
Once a sensor in DAFS registers detection, it is approximately equivalent to the
same agent achieving the identification acquisition level in COMBATXXI. The DAFS
agent can immediately engage enemy targets upon detection. A simplistic method of
representing detection is through the comparison of random number draws to a
distribution of sensor detections. In DAFS, a combination of distributions was used to
represent the detection of enemy agents. Five of the COMBATXXI experimental runs
were analyzed. A distribution was built based approximate relation of human eyes and
binoculars sensing in the COMBATXXI scenarios.
Initially, an attempt was made to mirror the cognitive process of sensor
acquisition in DAFS similar to the process described in COMBATXXI. The
COMBATXXI output files provided times to detect related to each level of acquisition.
It seemed that a combined distribution of exponentially distributed rates of detection
would be representative, but in practice the results did not nearly reflect the results of
sensing in COMBATXXI. Other aspects of the COMBATXXI acquire algorithm
apparently contributed to detection time in a ways that were not explored. Alternatively,
the rate at which agents achieved an acquisition level of identification in COMBATXXI
was used to develop the DAFS model.
In order to represent the identification phenomenon from COMBATXXI in DAFS
associated with human eyes, a probability distribution was fit to approximate the rate of
detections. The sensor distribution associated with human eyes was aproximate to that of
an exponential distribution with the same mean value of the identification acquisition
level derived from the COMBATXXI scenarios (5.13 minutes). When contrasted with
the actual data, it is obvious this is a rough approximation.
44
Figure 21. Contrasting an exponential distribution with the actual distribution of human eye identifications.
Similarly, a distribution was fit to the data representing the binocular
identifications in the COMBATXXI scenarios. The actual data was separate as discrete
peaks through the simulation time. Initially a normal distribution was applied to capture
the majority of the identifications located in the second peak of the actual distribution.
This normal distribution was based on the mean (3.64 minutes) and standard deviation
(.648) of only those identification acquisitions from the COMBATXXI scenario found
within that region and disregarding the identifications without. As the normal
distribution could allow for negative values at extreme deviations from the mean, it was
approximated with a gamma approximation of the normal where Gamma (α,β) is
represented with α = μ2/θ2 and β = θ2/ μ.
00.0020.0040.0060.008
0.010.0120.0140.0160.018
0 1 2 3 4 5 6 7 8 9 10 11 12
Acqu
istio
ns a
s a
Perc
ent o
f Tot
al
Acqu
istio
ns
Simulation Time (minutes)
Exponential Distribuiton Representing Human Eye Sensing
Eye-ID
Exp Eye ID

45
Figure 22. Contrasting a gamma distribution with the actual distribution of binocular identifications.
When the two distributions were combined, the approximation of the
identification sensing parameter was complete. DAFS allows for one platform to
maintain more than one sensor. By attaching two sensors with different capabilities to
one platform, two detections are possible. The first DAFS detection allows the entities to
interact (attack) if within range of an equipped weapon. The combined sensing
distributions were thus represented in the translation of the COMBATXXI scenario.
0
0.005
0.01
0.015
0.02
0.025
0 1 2 3 4 5 6 7 8 9 10 11 12
Acqu
istio
ns a
s a
Perc
ent o
f Tot
al
Acqu
istio
ns
Simulation Time (minutes)
Gamma Distribution Representing Binocular Identification
Binoc-ID
Gamma

46
Figure 23. Contrasting the combined gamma binocular approximation and exponential human eye approximation with the actual COMBATXXI distribution.
This technique of mimicking distributions worked sufficiently well in this
scenario and under these starting conditions, namely that all units were within sensor
range. To apply these techniques to a more general case involving initial entry into
sensor ranges by searching entities may require an entirely different approach.
Unfortunately, this analysis is well beyond the scope of this study.
5. Weapon Capabilities Translation
COMBATXXI develops situation probabilities to hit (Phit) and probabilities to kill
(Pkill) based on weapon capability, range, and other environmental variables. First, a
weapon must hit the target in order to do any damage. Once a hit is determined, then
damage is assessed. COMBATXXI assess damage systemically. This can lead to a
complex set of possible conditions for the target of weapon effects such as target
suppression, partial damage and capability kills (mobility, communications, firepower,
etc.).
DAFS describes weapon effects differently. One schema available when
developing a DAFS scenario involves using a linear Pkill that equates to the possibility of
a killing a target given some portion of time to shoot at that target linearly distributed
0
0.005
0.01
0.015
0.02
0.025
0.03
0 1 2 3 4 5 6 7 8 9 10 11 12
Iden
tific
atio
n Ac
quis
ition
s as
a
Perc
enta
ge o
f Tot
al A
cqui
sitio
ns
Simulation Time (minutes)
Combined Distribution Representation of COMBATXXI Sensing
Total ID
Probability Distribution

47
between the minimum range and maximum range Pkill values. The portion of time is
derived from the frequency with which DAFS is set to re-evaluate the local optimal firing
solutions for targets through the CVO. As weapons capabilities are given in rounds per
minute, a convenient setting for the DAFS CVO evaluation periods was .1 or 1/10th of a
minute or 6 seconds. By deriving the chance for each round to both hit and kill a target
for each weapon-target mix and calculating the probability of a kill per 6 second time
period (by subtracting the probability of missing every shot in that time period from
100%) based on weapon fire rates and reload times, the DAFS model weapons
capabilities were able to be populated.
The weapons capabilities were translated from unclassified weapons data
provided from MCCDC (T. Roofner, personal communication, 14 September 2012). The
data provided included accuracy data based on the standard deviations in angular error
for the associated weapon system given in mils. By converting the angular deviation to
relative miss distance, 10,000 Monte Carlo normally distributed random draws
individually multiplied by the deviation per mil divided by 1000 provided the average Phit
for the associated weapon system based on meters. The entities of the simulation
remained in the standing position in both the COMBATXXI and DAFS scenarios. If the
relative miss distance was less than half of the presented area of a standing target, that
draw indicated a hit. The linear Pkill for each weapon per round of ammunition was
determined by multiplying the Pkill times the Phit. Minimum range Phit for weapons with
no effective minimum range was assessed to have 100% chance to hit their intended
target at a range of 0 meters.

48
Min Range Max Range Min Range
P-kill Max Range
P-kill P-hit
(Max Rng)
Lin P -
Kill per
Round
(Max Rng)
AK-47---
7.62/ps 0 400 0.7 0.525 0.0844 0.04431
M249---
M855 0 1000 0.7 0.121 0.0058 0.0007018
XM29---
XM1018 100 500
.32
@100m*
.12
@500m* * *
FGM148---
JAVELIN 65 2500
0.99
@65m*
0.66
@2500m* * *
Table 5. Weapons effectiveness data for DAFS scenario (from T. Roofner, personal communication, 14 September 2012). * The XM29 and FGM148 data provided
were already in the format of probability to hit and kill a target
These linear Pkill rates were then translated from linear Pkill per round to linear Pkill
per 6 second time period. Based on the MCCDC data, reload times were available. A
few assumptions were made concerning ammunition and reloading:
• 30 round magazines for AK-47
• 100 round magazines for M-249
• 6 round magazines for XM-29
• As the XM-29 airburst munitions is meant, in part, to replace the M-203
grenade launcher and unclassified weapons data is not yet available, the
rate of fire for the XM-29 was assumed to be the same rate of fire for the
M-203 (5-7 rounds per minute).
• P-kill was scaled based on the proportion of weapon types available (i.e.
only 1/4th of the Marines in a fire team are equipped with a M249).

49
• P-kill was scaled based on the assumption that not every Marine or enemy
soldier would be using their weapon to the maximum extent possible;
some proportion were assumed to be moving or communicating. The
amount of total rounds fired per agent was reduced by 1/5th in order to
represent this phenomenon.
Sustained
Rate of Fire
(rpm)
Reload
Time
(seconds)
Min Range
P-kill
per 6
seconds
Max Range
P-kill
Per 6
seconds
Scaled
Min P-
kill per
DAFS
agent
Scaled
Max P-
kill per
DAFS
agent
AK-47---
7.62/ps 400 10 ~1.0 0.429 ~1.0
0.3614 @ 4/5th
M249---
M855 50 30 0.9919 0.0032 0.6183
0.0006 @ 1/5th
XM29---
XM1018 6 30 0.2066 0.0738 0.1296
0.04498 @ 3/5th
FGM148---
JAVELIN n/a n/a 0.99* 0.66*
0.066
0.044 @ 1/15th
Table 6. Linear Pkill per time unit (6 seconds) incorporating reload times and assumptions. Phit for min range is assumed to be 100% (excepting FGM-148, which was
estimated for a single shot).
Although most weapons were equitably distributed throughout each squad in the
company, there were only two JAVELIN missile operators as part of the reinforcing
assault force for the Marine unit represented in COMBATXXI. Though the JAVELIN is
an anti-armor weapon, it was fired against enemy infantry units in the simulation runs in
COMBATXXI. The fact that this is not a logical tactic is inconsequential to this study.
Because it was represented in the COMBATXXI scenario, it needed to be represented in
some manner in DAFS. One aggregate unit was assigned a JAVELIN weapon capability
in addition to their other capabilities, but was prevented from making any more than two
shots per simulation run.
50
C. ASSUMPTIONS
In order to abstract the situation from a higher resolution model to a lower
resolution model, several simplifying general assumptions were made.
• Agents of similar units have similar strengths and weaknesses.
• Aggregate agents of units can be ascribed the same fate with reference to
movement and attrition as the rest of the agents within their aggregate unit
(i.e. if a fire team dies, all members are assessed as deceased).
• Units are either fully capable or dead/completely incapable. The concept
of mobility kills or firepower kills is not addressed in DAFS.
• Terrain, though relevant in real life and COMBATXXI, is irrelevant in
DAFS. Shifting the locations was acceptable.
• The most significant assumption was that unit aggregation, position errors,
movement speed differentials, differentials in the sensor distributions, and
approximations of weapons effects will still provide similar results in the
low-resolution model as in the high-resolution model.
D. DESIGN OF EXPERIMENT
The experimental design was relatively simple and straight-forward. All runs
were made on the same desktop computer (i2600k processor, 16 GB RAM, Windows 7
OS, all background processes minimized). Twenty runs were completed in
COMBATXXI terminating upon completion of the route waypoints in batch mode to
reduce processor workload. Two hundred batch runs were completed of each of the three
separate DAFS scenarios. Log files and execution times were stored for later
comparative analysis.

51
V. RESULTS
The COMBATXXI and DAFS scenarios results were contrasted. As the first 5
COMBATXXI runs were used to calibrate the DAFS model, the only aspect of these runs
used in the final analysis was the computational time requirements necessary to complete
those runs. Ten of the remaining COMBATXXI runs were used to generate the
performance metrics used in comparison. The DAFS scenario was run on three different
routes, the first of which followed the same route as that used in the COMBATXXI
scenario. The remaining two batches followed alternate routes to the same objective.
The first DAFS scenario was used to contrast the bulk of the performance metrics, as it
most closely resembled the COMBATXXI scenario it was built to resemble.
A. OBJECTIVE OPINION
In experimenting with both models, there were many apparent differences, for
which system usability metrics were not assigned. Though some basic precepts are
similar, in execution the models had very different interfaces and outputs.
1. Ease of Use: COMBATXXI
COMBATXXI is a complex model, not just in the interactions between the
agents, but also regarding output. As this study focused on a pre-existing scenario for
contrast, much of the effort involved in development was transparent to this study. There
are several output options in the form of optional log files. Different log files provided
reporting on different aspects of the scenario and the associated interactions

52
Figure 24. Sample of options associated with log file creation. Those log files selected were those used in the final analysis.
The log files in COMBATXXI can be quite thorough and extensive. High-
resolution models can capture high-resolution output in order to enable the exploration of
the intricacies of the many possible interactions represented therein. The input variables
for complex algorithms are available and traceable. Some of the logs were larger and
more complex than others. In this scenario as one of the extreme examples, the
ObserverLogger for a single run representing 13 minutes of real-time included between
130,000 to 150,000 rows of 33 columns of data (approximately 4.5 million data points).
Not all of fields are used based on scenario settings, and most log files are smaller than
the ObserverLogger. The sheer volume of data was immense. For 20 runs of this
minimal scenario, the COMBATXXI log files were 835 MB (including ObserverLogger,
FireLogger, and DamageLogger as well as the default logs that are created).

53
WSMR and MCCDC have post-processing software that assists in developing
metrics from scenario output. Lacking an UNCLASSIFIED post-processor, data
management and analysis was time consuming. Additionally, correlation of data points
was made difficult through naming conventions. Fields identified units by their names in
one log, and by various identification numbers in others (i.e. observer_id, target_id,
fire_id, etc.). Determining something such as the attacking unit, defending unit, weapon
used, and result of an attack required cross validation between different logs. The
naming conventions were held constant, though, meaning that the process could be
automated to some degree.
2. Ease of Use: DAFS
DAFS was never developed to the level of distribution and continuous use that
COMBATXXI was developed, and this is a notable obstacle in implementation. Scenario
parameters are entered through Microsoft Access database files or XML format (Access
was used in this scenario development).
Figure 25. Sample DAFS input through Access spreadsheets
Though a library of sample scenarios provides insight into the schema for
scenario development, data formatting was a concern. Certain aspects of DAFS are
relatively arbitrary (i.e. geographical location or aggregation level of units) yet
necessarily proportional. Changing a scenario parameter can have unpredictable effects
on agent interactions unless the interrelation between parameters is understood.
Documentation on scenario creation and consideration of variable connections is limited

54
to the degree that it was often necessary to review the algorithms in Java code in order to
determine the data structures and limitations. At one point in development, hard-coded
parameters contradicted documentation. A limit placed on the minimum Pkill to enhance
program stability caused weapon effects to be disregarded regardless of range. Without
the requisite skill, a novice operator might not recognize the symptoms or understand the
corrective action required.
DAFS output was similar to the output present in COMBATXXI, but greatly
reduced due to fewer agents and limited built-in functionality. Though logging for
complex situations would be straight-forward to develop, it is not inherent in the design.
Based on the lesser number of agents and greatly simplified algorithms, there were far
fewer interactions between agents. For example, runs of the scenario in DAFS produced
a log similar to, but less detailed than, the ObserverLogger of COMBATXXI called the
Acquisition log. This log for all 200 DAFS runs was composed of 43,258 rows of 16
columns of data (690,000 data points), which is approximately 15% of the size of the
corresponding file for a single run of the same scenario in COMBATXXI. The Divining
the causality of results was greatly simplified (and potentially easier to explain).
Consequently, output processing times were substantially reduced when working with
DAFS.
3. Lessons Learned
Translating high-resolution data into a low-resolution simulation is not simple.
Several aspects of data analysis and correlation that were critical to completing this study
made DAFS scenario development more difficult without necessarily contributing to the
exploration of the problem space. In retrospect, many of these difficulties could have
been avoided for an exploratory analysis. These difficulties consisted included the
following:
• The use of the ACV Phase 0 scenario was difficult due to artifacts
remaining from the primary study. A custom scenario could have been
built and used more easily than adapting from an existing scenario,

55
especially if the goal is developing a systematic approach for future work
in this realm.
• Initial conditions play a huge role in determining the course of the
scenario. This scenario begins with friendly and enemy units within
sensor range of each other.
• Sensing is a difficult problem. The methodologies behind cognitive
models cannot be partially implemented easily.
• Calibration of two models using different units of measurement requires
attention to detail. As DAFS offers the flexibility to define most units as
required by the goals of the analysis, coordination with respect to
parameter scaling and parameter interaction requires attention to details.
During scenario development, this was a source for multiple anomalies.
• When dealing with massive amounts of data, a dedicated data analysis tool
would likely speed processing significantly. Excel is only marginally
capable in this regard. Data sorting and elimination of extraneous values
is essential. Implementing data mining techniques would be invaluable.
• Scaling of weapon effects is crucial. During initial scenario trial runs,
each individual Marine agent in DAFS was mistakenly assigned 100% of
the capabilities of the M249 and XM29. This was equivalent to estimating
that every single Marine would be equipped with all available weapons
and engage enemies with every weapon simultaneously (physically
impossible). Additionally, someone is moving or communicating rather
than shooting at any given time.
C. STATISTICAL COMPARISON
These two models represent reality in vastly different ways. Estimation of the
validity of simplifying a complex scenario for simplistic representation was based on the
following results.

56
1. Battle Metrics
One direct comparison between combat models is to contrast the survivors of the
battle and the time of battle. In this section, the two models are contrasted based on the
average and standard deviation between the 200 DAFS runs and 10 COMBATXXI runs.
Though the models concur that the blue (Marine) units in the scenario should be
victorious, the differences are obvious. While observing trial runs in COMBATXXI, it
was noted that at some point the blue and red units would cease engaging each other and
proceed to pass each other. It appears that in COMBATXXI, the enemy units became
combat-ineffective after some degree of attrition (approximately 60%) which apparently
equates to being destroyed in DAFS. Battle time was judged to be the time required from
the first shot being fired until the last shot was fired.
COMBATXXI DAFS
Blue Casualties (%) 0.18 0
Red Casualties (%) 59.9 100
Min Battle Time 7.218 minutes .30 minutes
Mean Battle Time 7.643 minutes 1.208 minutes
Max Battle Time 8.229 minutes 2.566 minutes
Table 7. Battle metrics contrasting COMBATXXI and DAFS results.
Sensor capability contrast included the attempt to aggregate the effects of the
COMBATXXI cognitive model through a relatively simplistic rate of detection in DAFS.
Though the application of the approximate distribution in DAFS produced a similar
distribution to chosen metric in COMBATXXI, the magnitude of binocular detections in
DAFS (Table 10) is excessive. This magnitude far exceeded the mathematical model
predictions previously discussed in translation. The cause of the unexpected peak in
binocular detections in DAFS was not determined, and remains a point for further
investigation. This may account, in part, for the shorter DAFS battle durations due to the

57
DAFS entities being able to engage enemy units earlier than their COMBATXXI
counterparts.
Figure 26. COMBATXXI experimental rates of acquisition to the level of identification
in Phase 0 scenario.
Figure 27. DAFS experimental rates of detection in Phase 0 scenario.
0
0.01
0.02
0.03
0.04
0.05
0.060 1 2 3 4 5 6 7 8 9 10 11 12
Iden
tific
atio
n Ac
quis
ition
s as
a
Perc
enta
ge o
f Tot
al A
cqui
sitio
ns
Simulation Time (minutes)
Total Rate of Identification COMBATXXI (Binoculars and Eyes)
Total Time of DetectionCXXI
Human Eye Time ofDetection
Binoc Time of Detection
0
0.02
0.04
0.06
0.08
0.1
0 1 2 3 4 5 6 7 8 9 10 11 12Iden
tific
atio
n Ac
quis
ition
s as
a P
erce
ntag
e of
Tot
al A
cqui
sitio
ns
Simulation Time (minutes)
Total Rate of Identification DAFS (Binoculars and Eyes)
Total Time of DetectionDAFS
Binoc Time of Detection
Human Eye Time ofDetection

58
Figure 28. A contrast between COMBATXXI and DAFS rates of target acquisition based
on COMBATXXI acquisition to level of identification and DAFS detection.
It would also be necessary to further explore the effects of sensors and detection
in different scenarios in order to fully realize the capabilities and difficulties associated
with general analysis. The fact that all entities began the scenario within sensor range of
each other did not allow for a realistic development of initial detections. This technique
of mimicking sensor distributions was not evaluated under conditions outside of sensor
range, and further work would need in order to utilize DAFS in other scenarios.
2. Computational Demands
Computational demands in this study refer to the time required for simulation run
computation. Simulation load times were not included in the time to complete the runs.
The 20 COMBATXXI runs were contrasted with 200 DAFS runs to assess expected time
to develop output per individual run. This contrast is not an even comparison, because
the COMBATXXI scenario included many more units, control measures, and behaviors
for entities beyond the scope of the area of interest for the study. This was by design, in
that DAFS could potentially be used to assess a portion of a scenario without including
the whole.
0
0.02
0.04
0.06
0.08
0.1
0 1 2 3 4 5 6 7 8 9 10 11 12Iden
tific
atio
n Ac
quis
ition
s as
a P
erce
ntag
e of
Tot
al A
cqui
sitio
ns
Simulation Time (minutes)
Total Rate of Identification COMBATXXI
(Binoculars and Eyes)
Total Time of DetectionCXXI
Total Time of DetectionDAFS

59
COMBATXXI runtime execution incorporated the option to run the simulation on
multiple computing cores simultaneously. An interesting side effect was that the
computational time required for a batch of runs was similar to the amount of time
required to process a single run divided by the number of computational cores available.
Though COMBATXXI recognized the number of virtual cores available (8 virtual cores),
the performance per run was approximately half as good as when using the number of
actual cores (4 actual cores) in trial runs. The 20 runs also did not divide evenly by 8
virtual cores, which made for interesting results. DAFS appeared to perform similarly
when 4 separate instances of the program were started simultaneously, but these attempts
were merely exploratory. For the sake of this experiment, both DAFS and
COMBATXXI were run as designed.
COMBATXXI completed each of 20 runs with a mean time per run of 12.9
minutes (SD 2.08), but due to the multiple core implementation required a total time of
64.4 minutes to complete. Thus, executing a batch took approximately 3.2 minutes per
run (even though a batch will take at least as long as the slowest run, regardless of core
availability).
DAFS by contrast was used to complete 200 runs of the same approximate
scenario. Using a single instance of the program, it required significantly less time than
that of COMBATXXI to execute with a total time of 62.24 seconds or .31 seconds per
run (SD .061).
D. SCENARIO AOA EXPLORATION
Contrasting the different routes of attack in DAFS was possible through a set of
minor scenario changes to reflect new waypoints for the Marine units. This allowed for
an attempt at executing a rapid prototype in the frame of AOA exploration. The results
of this exploration were statistically similar, with the western-most route showing only
the slightest trend toward longer battle times.

60
Figure 29. DAFS AOA of Phase 0 battle time based on different routing for Marines.
The eastern route was the same routing as the COMBATXXI scenario.
The expected losses for each route were similar as well, with the central and
western routes indicating only slightly increased potential for loss to the Marine units.
This could potentially be related to the limited weapon range for enemy units. The
eastern and western routes remain outside of enemy weapon range longer, while the
central route more quickly requires the Marine agents to move into range of all three
enemy platoons nearly simultaneously.
Eastern Route Central Route Western Route
Blue Casualties
(%) 0 3.71 0.5
Max Blue
Casualties 0 8 7
Red Casualties
(%) 100 100 100
Table 8. Casualty comparison based of DAFS Phase 0 AOA based on various routing

61
E. CONCLUSION AND RECOMMENDATIONS
COMBATXXI and DAFS use very different methodologies. Using them in
tandem for rapid prototyping, quick-turn analysis, AOA exploration, or developing initial
conditions will take a great deal of effort and is currently not feasible without further
development. With some effort to improve interconnectivity and usability, there is
potential for using DAFS to rapidly identify aspects in COMBATXXI scenarios needing
further investigation during development.
1. Regarding Ease of Use
COMBATXXI and DAFS both require a significant amount of effort to develop,
run, and analyze combat scenarios. The efforts are not entirely dissimilar, and data
developed for one simulation may be portable into the other. For this to be done on a
regular or larger scale, the process would benefit immensely from some sort of
automation in translation. The translation techniques used here were time consuming and
potentially unacceptably inaccurate.
Different naming conventions made tracing effects through logging files difficult
in COMBATXXI. The MCCDC scenario was artfully designed in one respect. All units
are assigned numeric designators for reference in logs. The Marine units were given 4
digit identifiers while the enemy units were given 5 digit identifiers. This differential
decreased analysis time requirements. Without referencing other multiple log files at
once, determining the specific unit responsible for firing a specific round at a specific
target was difficult to determine otherwise. When attempting to tune the DAFS scenario
by referencing these files, this aspect greatly increased development time. MCCDC has
an initiative in place to develop an unclassified post-processing application (Sawyer, A.,
personal communication, June 2012) which would potentially streamline this process
significantly.
DAFS was fast to run, but developing a scenario took a significant amount of
effort in researching the required data types and interconnections by accessing the
computer code directly. A complete and thorough users’ manual would be essential to
routine model implementation. There is a terrific potential in how quickly a scenario

62
could be developed if translated data and a simplified (or better understood) user
interface was immediately available. It would not be unreasonable to develop, run, and
analyze a similar scenario in less than 1 hour if all of these preconditions could be
established.
2. Regarding Statistical Comparison
The two models were statistically dissimilar in raw results. There was agreement
in the Boolean sense that both models concur as to the ultimate conclusion, however.
Losses were similar as well, though more exploration in different scenarios would be
required to validate this technique as a means for useful comparison. Sensor and weapon
effects data errors may have contributed to this error.
One potential source of error was using data for weapons not extrapolated from
COMBATXXI. The data used was based on a different source and weapon profiles than
those used in COMBATXXI. For example, the DAFS linear kill probabilities are an
estimation of actual weapon performance. The true probabilities to kill for weapons are
surely not linear, but distributed based on the type of weapon. Additionally, weapon
effects were reduced by 1/5th in order to account for those elements of units not firing
their weapons during that moment of combat. This did increase battle durations, but was
still not similar to the COMBATXXI results.
The approximation of sensing may have introduced two separate errors, but it is
unknown whether they affected results significantly. Admittedly, the approximation of
sensing into DAFS was a rough approximation. This error was discussed previously.
More importantly, the methodologies may not be accurately represented in DAFS via this
means. In DAFS, detection equates to the ability of an agent to engage a target.
Detection also is less transient in DAFS, meaning that a target is only detected once if it
does not leave sensor range. COMBATXXI allowed for multiple identifications of the
same target. It is not clear if identification carries the exact same context in
COMBATXXI as detection does in DAFS.
Computational effort was significantly reduced in DAFS than in COMBATXXI.
It took less time to run 200 replications in DAFS than it took to run a single replication in

63
COMBATXXI. In fact, extrapolated over the average values, more than 2400 DAFS
replications could be run in the same time as one replication of the same scenario in
COMBATXXI. A benefit of performing more replications is that the distribution of
potential values can be better developed. When runs are few, possible outcomes can be
overlooked. Additionally, AOA must be proportionally limited. Even as a precursor to
further scenario development, the low overhead in computation (and associated analysis)
could be of a significant financial and temporal advantage in most situations.
3. Regarding AOA Exploration
The AOA exploration was simple to implement, once the scenario parameters
were implemented into DAFS. It was as easy as adding different waypoints to the control
measures for the Marines and rerunning the scenario. The results were not significantly
different with regards to the time of battle, but the losses suffered by the Marine units
were different based on routing. Though the losses were small, this indicated an area for
concern or further exploration. The shorter routing toward the enemy put Marines in a
position of slightly increased hazard to enemy fire. Although this may be obvious to
even a novice tactician, this is a simple scenario. Results such as this in a larger, more
complex scenario could easily be overlooked. It is exactly the type of simple, useful
insight that DAFS might provide model developers such that they can rapidly,
economically identify and analyze conflicting results.

64
THIS PAGE INTENTIONALLY LEFT BLANK

65
VI. FUTURE WORK
Optimally, the effects of implementing DAFS in a parallel development
environment with a current study at WSMR or MCCDC could yield results as to the
efficacy of either evolutionary or rapid, throw-away prototyping and explore the benefits
of a broader, quick-turn COA assessment associated with scenario development. It is
possible that the cost of developing prototypes would be offset by later savings in study
development. This technique reflects the ethos of Marine Corps machine gunners’
statement, “slow is smooth, and smooth is fast.” With less time and money available to
make mistakes, more effort should be put into making less mistakes (realizing that
smooth actions make execution faster). As machine gunners accomplish their goals
through practice, effectively prototyping could be used as practice for final model
development.
There is also the potential for creating a variable resolution simulation that could
be dynamically modified to represent more or less detail. Considering the amount of
processing required to run and analyze more complex models, it might be valuable to
experiment with rapid prototyping capabilities within a model available through run-time
options. Including additional functionality in a complex system might be prohibitively
difficult, though.
One of the most interesting potentials for future work was in the area of sensing
algorithms. During the efforts to convert the scenario from COMBATXXI to DAFS, the
concept of using a sum of exponentially distributed variables to represent the cognitive
process in COMBATXXI was attempted. Sensor detections and many other Poisson-like
processes can be represented to some degree through exponential distributions. First, the
average time to gain the four levels of acquisition was used as the parameter for a gamma
distribution, but this assumes the exponential means are all the same (which they were
not). Dr. Buss developed a simple code addition to DAFS to model the phenomenon that
would accept multiple exponential distributions of various means as an input to develop a
single resulting detection algorithm. This technique was especially attractive in that it
represents the relatively complex cognitive process associated with target acquisition in a

66
relatively simple manner. Though it would require four random number draws (as
opposed to the two required for the representation used in this thesis), this technique
would still be relatively low-cost in terms of computational effort while producing a very
wide range of results based on the settings for each level of detection.
Additional work would be required to analyze and evaluate the techniques used
here if they were to be applied to general analysis. Entities in this study were all located
within sensor range of each other. It is likely that the distributions for detections
occurring throughout sensor ranges, including entities that enter sensor range during the
scenario, would be handled differently in COMBATXXI and DAFS. If DAFS is to be
used to prototype scenarios for COMBATXXI, the technique involving the use of
approximate distributions would need to be further explored.
Computational complexity and resource constraints are related. A study
contrasting the relative resources required per agent could easily be pursued along the
same lines as this study. As COMBATXXI is currently a production model with libraries
of vetted scenarios, it would be a logical choice. Simple unit dynamics would need to be
maintained to limit the effects of additional command structures and controls. By
gradually adding units to a scenario, the relative effort required to run and process the
output could be contrasted.
Finally, DAFS could benefit significantly from continuous use. This leads to
continual development and bug repair. A more thorough and straight-forward user’s
manual for the entry level user would be extremely valuable. Though the flexibility in
scenario development is related to the user’s ability to define parameters in relative terms,
the interrelations between data elements is not completely obvious or enforced through
strong data typing.

67
LIST OF REFERENCES
Ahner, D., Buss, A., & Ruck, J. (2007). Using a Low-Resolution Entity Model for Shaping Initial Conditions for High-Resolution Combat Models. Proceedings of the 2007 Winter Simulation Conference.
Brooks, F. P. (1995). The Mythical Man-Month (anniversary ed.). Addison – Wesley Longman Publishing Company, Inc.
Box, G. E. & Draper, N. R. (1986). Empirical Model-Building and Response Surface. John Wiley & Sons, Inc.
Chwif, L., Paul, R. J., & Pereira-Barretto, M.R. (2000). On Simulation Model Complexity. Proceedings of the 2000 Winter Simulation Conference.
Davis, A. M. (1992). Operational Prototyping: A New Development Approach. IEEE Software, September 1992
Davis, P. (1995). An Introduction to Variable-Resolution Modeling. Warfare Modeling. John Wiley & Sons, Inc.
Fitzpatrick, C., Balogh, I. & Reeves, D. (2012). Use of Hierarchical Task Networks to Model Complex Operational Tasks in COMBATXXI. presented at the WG-29 session of the 80th Military Operations Research Society Symposium (MORSS) June 2012, Colorado Springs CO.
Hillestad, R.J. & Juncosa, M.L. (1995). Cutting Some Trees to See the Forest: On Aggregation and Disaggregation in Combat Models. Warfare Modeling. John Wiley & Sons, Inc.
Pidd, M. (1996). Five Simple Principles of Modeling. Proceedings of the 1996 Winter Simulation Conference.
Raiffa H. (1982) Policy analysis: a checklist of concerns. PP-82-2. International Institute for Applied Systems Analysis.
Sohrabi, S., Baier, J. A., & McIlraith, S.A. (2009). HTN Planning with Preferences. International Joint Conferences on Artificial Intelligence.

68
THIS PAGE INTENTIONALLY LEFT BLANK

69
INITIAL DISTRIBUTION LIST
1. Defense Technical Information Center Ft. Belvoir, Virginia 2. Dudley Knox Library Naval Postgraduate School Monterey, California 3. Marine Corps Representative Naval Postgraduate School Monterey, California 4. Director, Training and Education, MCCDC, Code C46 Quantico, Virginia 5. Director, Marine Corps Research Center, MCCDC, Code C40RC Quantico, Virginia 6. Marine Corps Tactical Systems Support Activity (Attn: Operations Officer) Camp Pendleton, California 7. Director, Studies and Analysis Division, MCCDC, Code C45 Quantico, Virginia


