Low-Load Vickers Microindentation Hardness Testing · possible to Brinell hardness numbers for the...
6
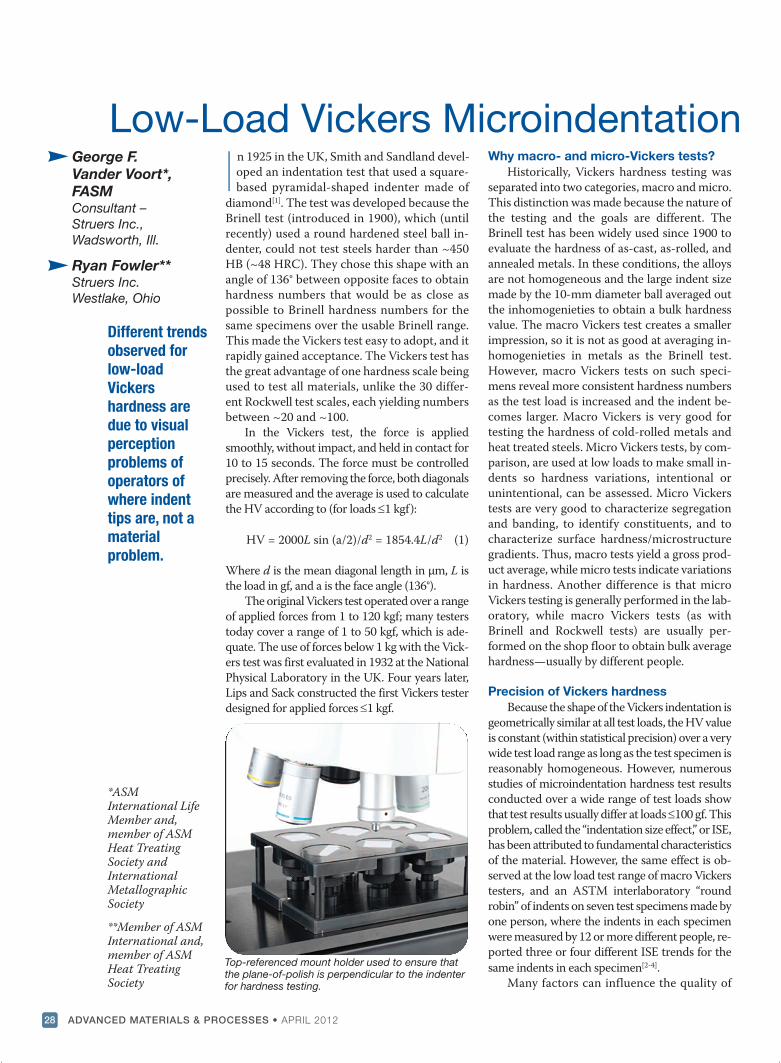
28 Low-Load Vickers Microindentation George F. Vander Voort*, FASM Consultant – Struers Inc., Wadsworth, Ill. Ryan Fowler** Struers Inc. Westlake, Ohio Different trends observed for low-load Vickers hardness are due to visual perception problems of operators of where indent tips are, not a material problem. ADVANCED MATERIALS & PROCESSES • APRIL 2012 I n 1925 in the UK, Smith and Sandland devel- oped an indentation test that used a square- based pyramidal-shaped indenter made of diamond [1] . The test was developed because the Brinell test (introduced in 1900), which (until recently) used a round hardened steel ball in- denter, could not test steels harder than ~450 HB (~48 HRC). They chose this shape with an angle of 136° between opposite faces to obtain hardness numbers that would be as close as possible to Brinell hardness numbers for the same specimens over the usable Brinell range. This made the Vickers test easy to adopt, and it rapidly gained acceptance. The Vickers test has the great advantage of one hardness scale being used to test all materials, unlike the 30 differ- ent Rockwell test scales, each yielding numbers between ~20 and ~100. In the Vickers test, the force is applied smoothly, without impact, and held in contact for 10 to 15 seconds. The force must be controlled precisely. After removing the force, both diagonals are measured and the average is used to calculate the HV according to (for loads £1 kgf ): HV = 2000L sin (a/2)/d 2 = 1854.4L/d 2 (1) Where d is the mean diagonal length in µm, L is the load in gf, and a is the face angle (136°). The original Vickers test operated over a range of applied forces from 1 to 120 kgf; many testers today cover a range of 1 to 50 kgf, which is ade- quate. The use of forces below 1 kg with the Vick- ers test was first evaluated in 1932 at the National Physical Laboratory in the UK. Four years later, Lips and Sack constructed the first Vickers tester designed for applied forces £1 kgf. Why macro- and micro-Vickers tests? Historically, Vickers hardness testing was separated into two categories, macro and micro. This distinction was made because the nature of the testing and the goals are different. The Brinell test has been widely used since 1900 to evaluate the hardness of as-cast, as-rolled, and annealed metals. In these conditions, the alloys are not homogeneous and the large indent size made by the 10-mm diameter ball averaged out the inhomogenieties to obtain a bulk hardness value. The macro Vickers test creates a smaller impression, so it is not as good at averaging in- homogenieties in metals as the Brinell test. However, macro Vickers tests on such speci- mens reveal more consistent hardness numbers as the test load is increased and the indent be- comes larger. Macro Vickers is very good for testing the hardness of cold-rolled metals and heat treated steels. Micro Vickers tests, by com- parison, are used at low loads to make small in- dents so hardness variations, intentional or unintentional, can be assessed. Micro Vickers tests are very good to characterize segregation and banding, to identify constituents, and to characterize surface hardness/microstructure gradients. Thus, macro tests yield a gross prod- uct average, while micro tests indicate variations in hardness. Another difference is that micro Vickers testing is generally performed in the lab- oratory, while macro Vickers tests (as with Brinell and Rockwell tests) are usually per- formed on the shop floor to obtain bulk average hardness—usually by different people. Precision of Vickers hardness Because the shape of the Vickers indentation is geometrically similar at all test loads, the HV value is constant (within statistical precision) over a very wide test load range as long as the test specimen is reasonably homogeneous. However, numerous studies of microindentation hardness test results conducted over a wide range of test loads show that test results usually differ at loads £100 gf. This problem, called the “indentation size effect,” or ISE, has been attributed to fundamental characteristics of the material. However, the same effect is ob- served at the low load test range of macro Vickers testers, and an ASTM interlaboratory “round robin” of indents on seven test specimens made by one person, where the indents in each specimen were measured by 12 or more different people, re- ported three or four different ISE trends for the same indents in each specimen [2-4] . Many factors can influence the quality of *ASM International Life Member and, member of ASM Heat Treating Society and International Metallographic Society **Member of ASM International and, member of ASM Heat Treating Society Top-referenced mount holder used to ensure that the plane-of-polish is perpendicular to the indenter for hardness testing.
Transcript of Low-Load Vickers Microindentation Hardness Testing · possible to Brinell hardness numbers for the...
28
Low-Load Vickers Microindentation George F. Vander Voort*,FASMConsultant – Struers Inc.,Wadsworth, Ill.
Ryan Fowler**Struers Inc.Westlake, Ohio
Different trendsobserved forlow-loadVickershardness aredue to visualperceptionproblems ofoperators ofwhere indenttips are, not amaterialproblem.
ADVANCED MATERIALS & PROCESSES • APRIL 2012
I n 1925 in the UK, Smith and Sandland devel-oped an indentation test that used a square-based pyramidal-shaped indenter made of
diamond[1]. The test was developed because theBrinell test (introduced in 1900), which (untilrecently) used a round hardened steel ball in-denter, could not test steels harder than ~450HB (~48 HRC). They chose this shape with anangle of 136° between opposite faces to obtainhardness numbers that would be as close aspossible to Brinell hardness numbers for thesame specimens over the usable Brinell range.This made the Vickers test easy to adopt, and itrapidly gained acceptance. The Vickers test hasthe great advantage of one hardness scale beingused to test all materials, unlike the 30 differ-ent Rockwell test scales, each yielding numbersbetween ~20 and ~100.
In the Vickers test, the force is appliedsmoothly, without impact, and held in contact for10 to 15 seconds. The force must be controlledprecisely. After removing the force, both diagonalsare measured and the average is used to calculatethe HV according to (for loads £1 kgf):
HV = 2000L sin (a/2)/d2 = 1854.4L/d2 (1)
Where d is the mean diagonal length in µm, L isthe load in gf, and a is the face angle (136°).
The original Vickers test operated over a rangeof applied forces from 1 to 120 kgf; many testerstoday cover a range of 1 to 50 kgf, which is ade-quate. The use of forces below 1 kg with the Vick-ers test was first evaluated in 1932 at the NationalPhysical Laboratory in the UK. Four years later,Lips and Sack constructed the first Vickers testerdesigned for applied forces £1 kgf.
Why macro- and micro-Vickers tests?Historically, Vickers hardness testing was
separated into two categories, macro and micro.This distinction was made because the nature ofthe testing and the goals are different. TheBrinell test has been widely used since 1900 toevaluate the hardness of as-cast, as-rolled, andannealed metals. In these conditions, the alloysare not homogeneous and the large indent sizemade by the 10-mm diameter ball averaged outthe inhomogenieties to obtain a bulk hardnessvalue. The macro Vickers test creates a smallerimpression, so it is not as good at averaging in-homogenieties in metals as the Brinell test.However, macro Vickers tests on such speci-mens reveal more consistent hardness numbersas the test load is increased and the indent be-comes larger. Macro Vickers is very good fortesting the hardness of cold-rolled metals andheat treated steels. Micro Vickers tests, by com-parison, are used at low loads to make small in-dents so hardness variations, intentional orunintentional, can be assessed. Micro Vickerstests are very good to characterize segregationand banding, to identify constituents, and tocharacterize surface hardness/microstructuregradients. Thus, macro tests yield a gross prod-uct average, while micro tests indicate variationsin hardness. Another difference is that microVickers testing is generally performed in the lab-oratory, while macro Vickers tests (as withBrinell and Rockwell tests) are usually per-formed on the shop floor to obtain bulk averagehardness—usually by different people.
Precision of Vickers hardnessBecause the shape of the Vickers indentation is
geometrically similar at all test loads, the HV valueis constant (within statistical precision) over a verywide test load range as long as the test specimen isreasonably homogeneous. However, numerousstudies of microindentation hardness test resultsconducted over a wide range of test loads showthat test results usually differ at loads £100 gf. Thisproblem, called the “indentation size effect,” or ISE,has been attributed to fundamental characteristicsof the material. However, the same effect is ob-served at the low load test range of macro Vickerstesters, and an ASTM interlaboratory “roundrobin” of indents on seven test specimens made byone person, where the indents in each specimenwere measured by 12 or more different people, re-ported three or four different ISE trends for thesame indents in each specimen[2-4].
Many factors can influence the quality of
*ASM International LifeMember and,member of ASMHeat Treating Society and InternationalMetallographicSociety
**Member of ASM International and, member of ASMHeat Treating Society
Top-referenced mount holder used to ensure thatthe plane-of-polish is perpendicular to the indenterfor hardness testing.
april amp features_am&p master template new QX6.qxt 3/22/2012 12:28 PM Page 28
29ADVANCED MATERIALS & PROCESSES • APRIL 2012
microindentation test results. In the early days of low-load(<100 gf ) hardness testing, it was quickly recognized thatimproper specimen preparation influences hardness testresults. Assuming the specimen is properly prepared, thegreatest source of error is in measuring the indent as doc-umented in the ASTM interlaboratory test[3,4]. Place the in-dent in the center of the measuring field (if not alreadythere), as lens image quality is best in the center. The lightsource should provide adequate even illumination for max-imum contrast and resolution. The accuracy of the filarmicrometer or other measuring device should be verifiedusing a stage micrometer.
Specimen preparation for microindentation hardnesstesting is not a trivial matter, and becomes more critical asthe applied force decreases. Specimen preparation formacro Vickers testing is less critical as the load increases.Furthermore, if testing is to be done near an edge, thenedge preservation (i.e., flatness out to the edge) is also re-quired. For relatively high test forces (e.g., 300-1000 gf ), aperfectly prepared specimen is not required. However, sec-tioning and grinding damage still must be removed. Thenormal preparation procedure could be stopped aftergrinding and polishing down to a 6-, 3-, or 1-µm diamondfinish, depending upon the load used. For lower loads, it isadvisable to prepare the specimen to remove all damage.Excessive residual damage from sectioning and grindinginfluences test results, producing erroneous hardness val-ues. Depending on the nature of the specimen, prepara-tion damage can cause either an increase or a decrease inthe apparent hardness relative to the correct hardness.Guidelines for preparing metallographic test specimens aregiven in ASTM Standard E3, Volume 9 of the ASM Hand-book, and in standard text books[2].
Most systems use an automated test cycle of loading, ap-plication for the desired time, and unloading to ensure re-producibility in the test. Vibrations must be carefullycontrolled, and this becomes even more important as the ap-plied force decreases. Manual application and removal of theapplied force is not recommended due to the difficulty in pre-venting vibrations, which will enlarge the indent size.
The indenter must be perpendicular to the test piece.An error of as little as 2° from perpendicular will distort theindentation shape and introduce errors. A larger tilt anglemay cause the specimen to move under the applied force.To aid in controlling this problem, most testers come with adevice that can be firmly attached to the stage. The mountedspecimen, or a bulk unmounted specimen of the proper size,can be placed within this device and the plane-of-polish isautomatically indexed perpendicular to the indenter. His-torically, it has been common practice to simply place aspecimen on the stage and proceed with indentation. But, ifthe plane-of-polish is not parallel to the back side of thespecimen, it will not be perpendicular to the indenter.
Because the diagonals must be measured after the forceis removed, the tester is equipped with two (or more) met-
allurgical objectives (i.e., reflected light), usually 10´ and40´. Some systems may have a third or fourth objective onthe turret. A higher power objective (60´, 80´, or 100´)should be used to measure small indents (<20 µm in diag-onal length). Objectives should have a reasonably high nu-merical aperture for its magnification to give bestresolution. Brown and Ineson showed that measurementvaried more from the true value as the NA of the objectivedecreases[5]. A 10´ objective is usually used as a spotter;i.e., simply to find the desired test location, except formacro Vickers testers. The measuring eyepiece is usually10´. The optical system must be carefully calibrated usinga stage micrometer. In general, indents can be measuredto a precision of ±0.5 µm in length. A proper Köhler illu-mination system is necessary to fully illuminate the speci-men. Unfortunately, the optical systems on manymicrohardness testers are not as good as on a high-qualitymetallograph.
Calculation of hardness is based on the length of thediagonals. The major problem is defining where the indenttips are located. This requires proper illumination, adjust-ment of the optics for best resolution and contrast, andcareful focusing. The micrometer lines have a finite thick-ness. Several approaches can be used to zero the systembefore measurement. A good approach is to bring the twofilar lines just into contact and then zero the micrometer.The interior sides of the filar lines are then adjusted so theindent tips just touch each line.
Bückle suggested that the metal flow at the edge of theindentation is a major source of measurement errors, par-ticularly at low loads. He noted that ridge height can benearly 1% of the diagonal width[5]. This produces problemswith focusing the image, which leads to errors in measure-ment of the indent size, either positive or negative. Themagnitude of the error increases with decreasing diagonallength, and is large enough to account for hardness devia-tions at low loads. A positive d error lowers the hardness,while a negative d error raises the hardness.
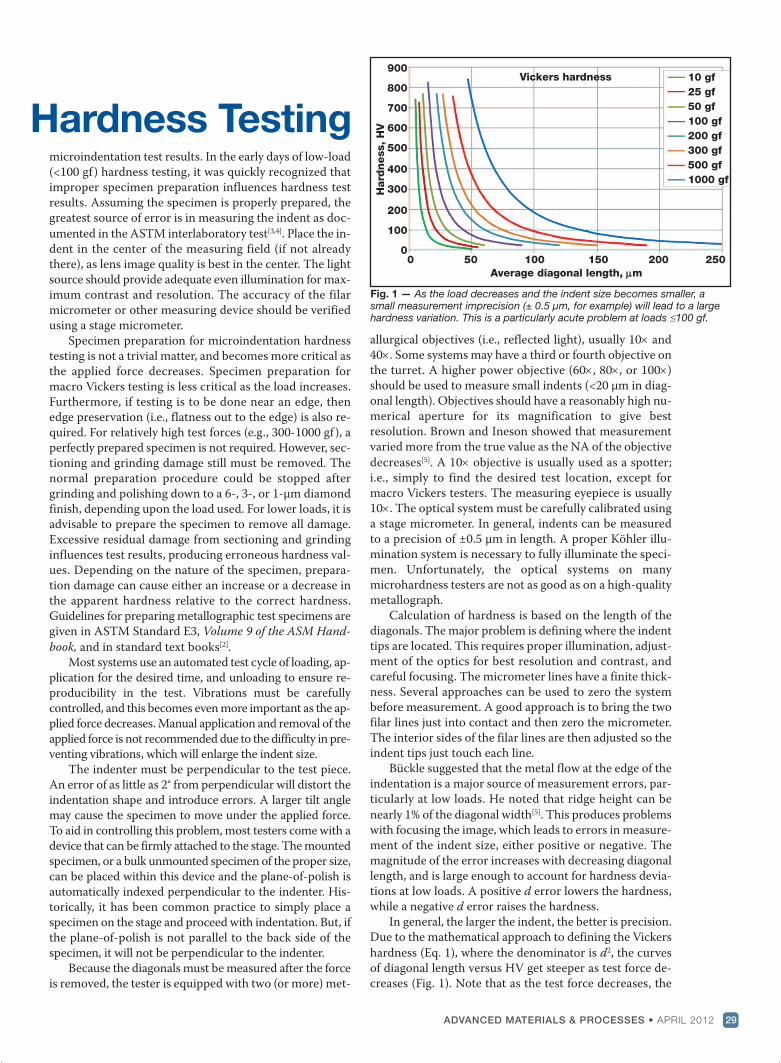
In general, the larger the indent, the better is precision.Due to the mathematical approach to defining the Vickershardness (Eq. 1), where the denominator is d2, the curvesof diagonal length versus HV get steeper as test force de-creases (Fig. 1). Note that as the test force decreases, the
Hardness Testing
Fig. 1 — As the load decreases and the indent size becomes smaller, asmall measurement imprecision (± 0.5 µm, for example) will lead to a largehardness variation. This is a particularly acute problem at loads £100 gf.
10 gf 25 gf 50 gf 100 gf 200 gf 300 gf 500 gf 1000 gf
0 50 100 150 200 250Average diagonal length, mm
900
800
700
600
500
400
300
200
100
0
Hardness, HV
Vickers hardness
april amp features_am&p master template new QX6.qxt 3/22/2012 12:28 PM Page 29
same small variation in diagonal length correlates to alarger variation in hardness.
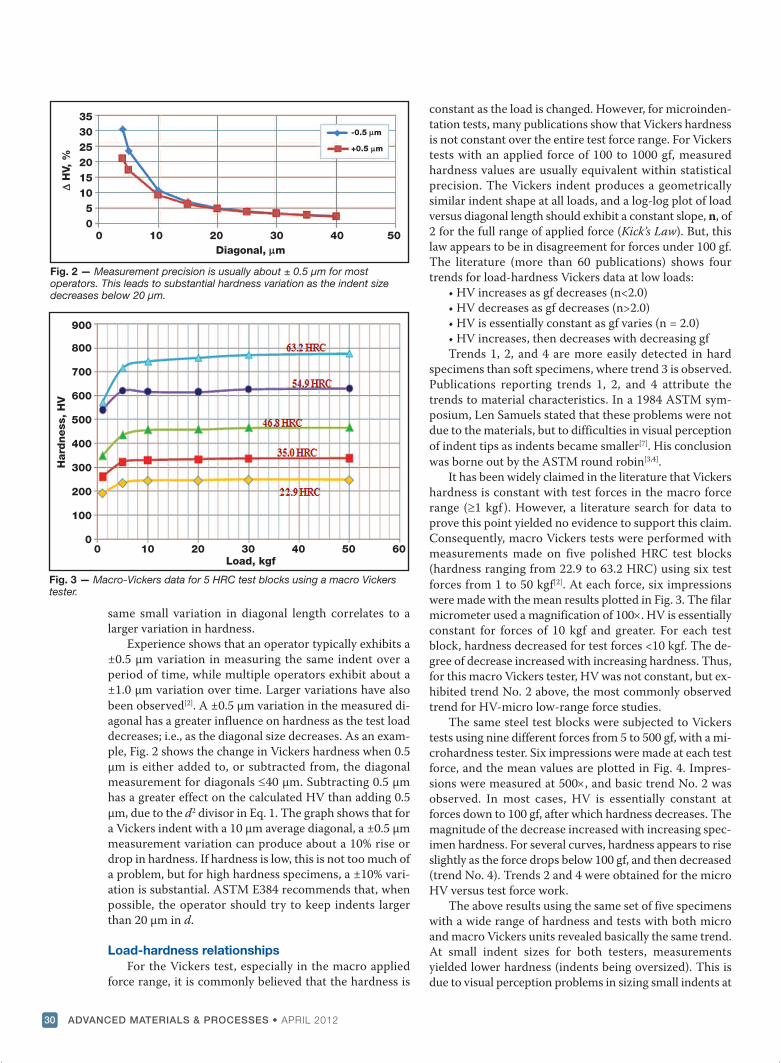
Experience shows that an operator typically exhibits a±0.5 µm variation in measuring the same indent over a period of time, while multiple operators exhibit about a±1.0 µm variation over time. Larger variations have alsobeen observed[2]. A ±0.5 µm variation in the measured di-agonal has a greater influence on hardness as the test loaddecreases; i.e., as the diagonal size decreases. As an exam-ple, Fig. 2 shows the change in Vickers hardness when 0.5µm is either added to, or subtracted from, the diagonalmeasurement for diagonals £40 µm. Subtracting 0.5 µmhas a greater effect on the calculated HV than adding 0.5µm, due to the d2 divisor in Eq. 1. The graph shows that fora Vickers indent with a 10 µm average diagonal, a ±0.5 µmmeasurement variation can produce about a 10% rise ordrop in hardness. If hardness is low, this is not too much ofa problem, but for high hardness specimens, a ±10% vari-ation is substantial. ASTM E384 recommends that, whenpossible, the operator should try to keep indents largerthan 20 µm in d.
Load-hardness relationshipsFor the Vickers test, especially in the macro applied
force range, it is commonly believed that the hardness is
constant as the load is changed. However, for microinden-tation tests, many publications show that Vickers hardnessis not constant over the entire test force range. For Vickerstests with an applied force of 100 to 1000 gf, measuredhardness values are usually equivalent within statisticalprecision. The Vickers indent produces a geometricallysimilar indent shape at all loads, and a log-log plot of loadversus diagonal length should exhibit a constant slope, n, of2 for the full range of applied force (Kick’s Law). But, thislaw appears to be in disagreement for forces under 100 gf.The literature (more than 60 publications) shows fourtrends for load-hardness Vickers data at low loads:
• HV increases as gf decreases (n<2.0)• HV decreases as gf decreases (n>2.0)• HV is essentially constant as gf varies (n = 2.0)• HV increases, then decreases with decreasing gfTrends 1, 2, and 4 are more easily detected in hard
specimens than soft specimens, where trend 3 is observed.Publications reporting trends 1, 2, and 4 attribute thetrends to material characteristics. In a 1984 ASTM sym-posium, Len Samuels stated that these problems were notdue to the materials, but to difficulties in visual perceptionof indent tips as indents became smaller[7]. His conclusionwas borne out by the ASTM round robin[3,4].
It has been widely claimed in the literature that Vickershardness is constant with test forces in the macro forcerange (³1 kgf ). However, a literature search for data toprove this point yielded no evidence to support this claim.Consequently, macro Vickers tests were performed withmeasurements made on five polished HRC test blocks(hardness ranging from 22.9 to 63.2 HRC) using six testforces from 1 to 50 kgf[2]. At each force, six impressionswere made with the mean results plotted in Fig. 3. The filarmicrometer used a magnification of 100´. HV is essentiallyconstant for forces of 10 kgf and greater. For each testblock, hardness decreased for test forces <10 kgf. The de-gree of decrease increased with increasing hardness. Thus,for this macro Vickers tester, HV was not constant, but ex-hibited trend No. 2 above, the most commonly observedtrend for HV-micro low-range force studies.
The same steel test blocks were subjected to Vickerstests using nine different forces from 5 to 500 gf, with a mi-crohardness tester. Six impressions were made at each testforce, and the mean values are plotted in Fig. 4. Impres-sions were measured at 500´, and basic trend No. 2 wasobserved. In most cases, HV is essentially constant atforces down to 100 gf, after which hardness decreases. Themagnitude of the decrease increased with increasing spec-imen hardness. For several curves, hardness appears to riseslightly as the force drops below 100 gf, and then decreased(trend No. 4). Trends 2 and 4 were obtained for the microHV versus test force work.
The above results using the same set of five specimenswith a wide range of hardness and tests with both microand macro Vickers units revealed basically the same trend.At small indent sizes for both testers, measurementsyielded lower hardness (indents being oversized). This isdue to visual perception problems in sizing small indents at
ADVANCED MATERIALS & PROCESSES • APRIL 201230
Fig. 2 — Measurement precision is usually about ± 0.5 μm for most operators. This leads to substantial hardness variation as the indent sizedecreases below 20 μm.
Fig. 3 — Macro-Vickers data for 5 HRC test blocks using a macro Vickerstester.
0 10 20 30 40 50Diagonal, mm
-0.5 mm
+0.5 mm
35 30 25 20 15 10 5 0
DHV, %
0 10 20 30 40 50 60Load, kgf
900
800
700
600
500
400
300
200
100
0
Hardness, HV
april amp features_am&p master template new QX6.qxt 3/26/2012 12:26 PM Page 30
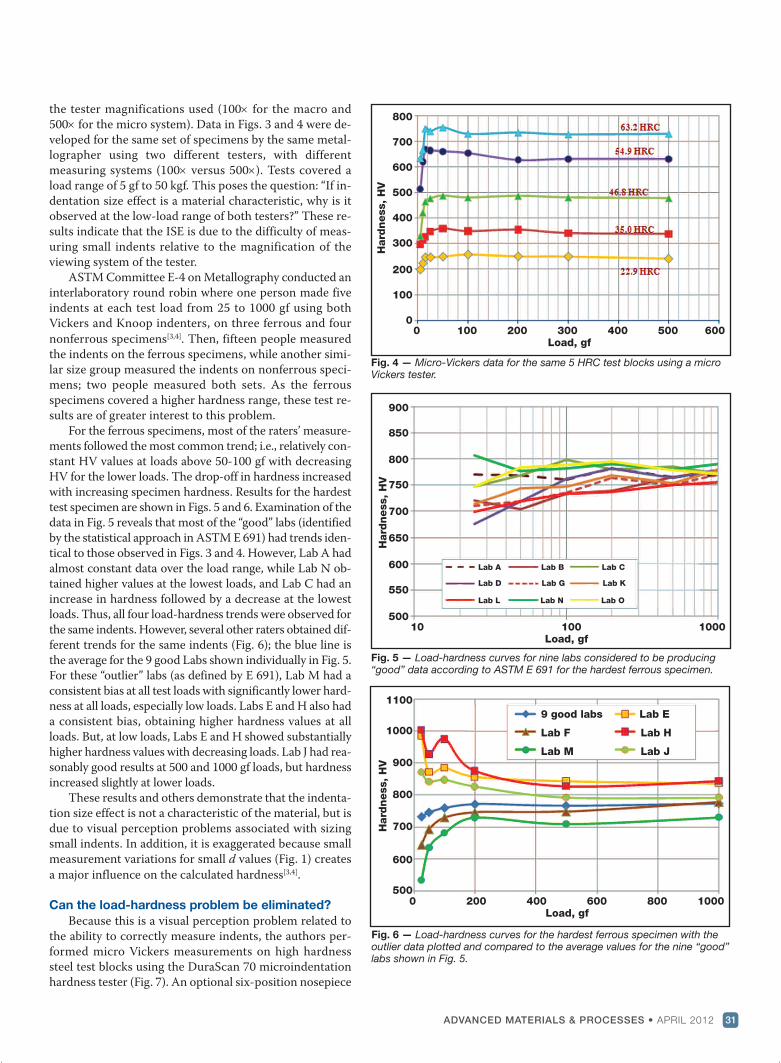
the tester magnifications used (100´ for the macro and500´ for the micro system). Data in Figs. 3 and 4 were de-veloped for the same set of specimens by the same metal-lographer using two different testers, with differentmeasuring systems (100´ versus 500´). Tests covered aload range of 5 gf to 50 kgf. This poses the question: “If in-dentation size effect is a material characteristic, why is itobserved at the low-load range of both testers?” These re-sults indicate that the ISE is due to the difficulty of meas-uring small indents relative to the magnification of theviewing system of the tester.
ASTM Committee E-4 on Metallography conducted aninterlaboratory round robin where one person made fiveindents at each test load from 25 to 1000 gf using bothVickers and Knoop indenters, on three ferrous and fournonferrous specimens[3,4]. Then, fifteen people measuredthe indents on the ferrous specimens, while another simi-lar size group measured the indents on nonferrous speci-mens; two people measured both sets. As the ferrousspecimens covered a higher hardness range, these test re-sults are of greater interest to this problem.
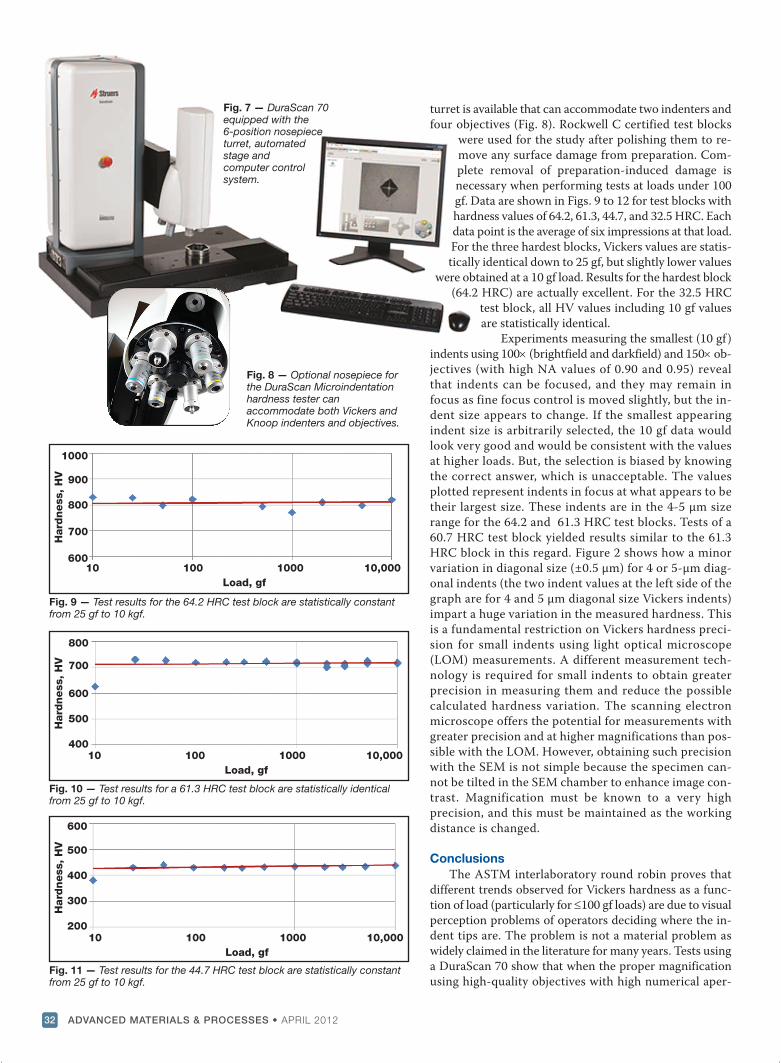
For the ferrous specimens, most of the raters’ measure-ments followed the most common trend; i.e., relatively con-stant HV values at loads above 50-100 gf with decreasingHV for the lower loads. The drop-off in hardness increasedwith increasing specimen hardness. Results for the hardesttest specimen are shown in Figs. 5 and 6. Examination of thedata in Fig. 5 reveals that most of the “good” labs (identifiedby the statistical approach in ASTM E 691) had trends iden-tical to those observed in Figs. 3 and 4. However, Lab A hadalmost constant data over the load range, while Lab N ob-tained higher values at the lowest loads, and Lab C had anincrease in hardness followed by a decrease at the lowestloads. Thus, all four load-hardness trends were observed forthe same indents. However, several other raters obtained dif-ferent trends for the same indents (Fig. 6); the blue line isthe average for the 9 good Labs shown individually in Fig. 5.For these “outlier” labs (as defined by E 691), Lab M had aconsistent bias at all test loads with significantly lower hard-ness at all loads, especially low loads. Labs E and H also hada consistent bias, obtaining higher hardness values at allloads. But, at low loads, Labs E and H showed substantiallyhigher hardness values with decreasing loads. Lab J had rea-sonably good results at 500 and 1000 gf loads, but hardnessincreased slightly at lower loads.
These results and others demonstrate that the indenta-tion size effect is not a characteristic of the material, but isdue to visual perception problems associated with sizingsmall indents. In addition, it is exaggerated because smallmeasurement variations for small d values (Fig. 1) createsa major influence on the calculated hardness[3,4].
Can the load-hardness problem be eliminated?Because this is a visual perception problem related to
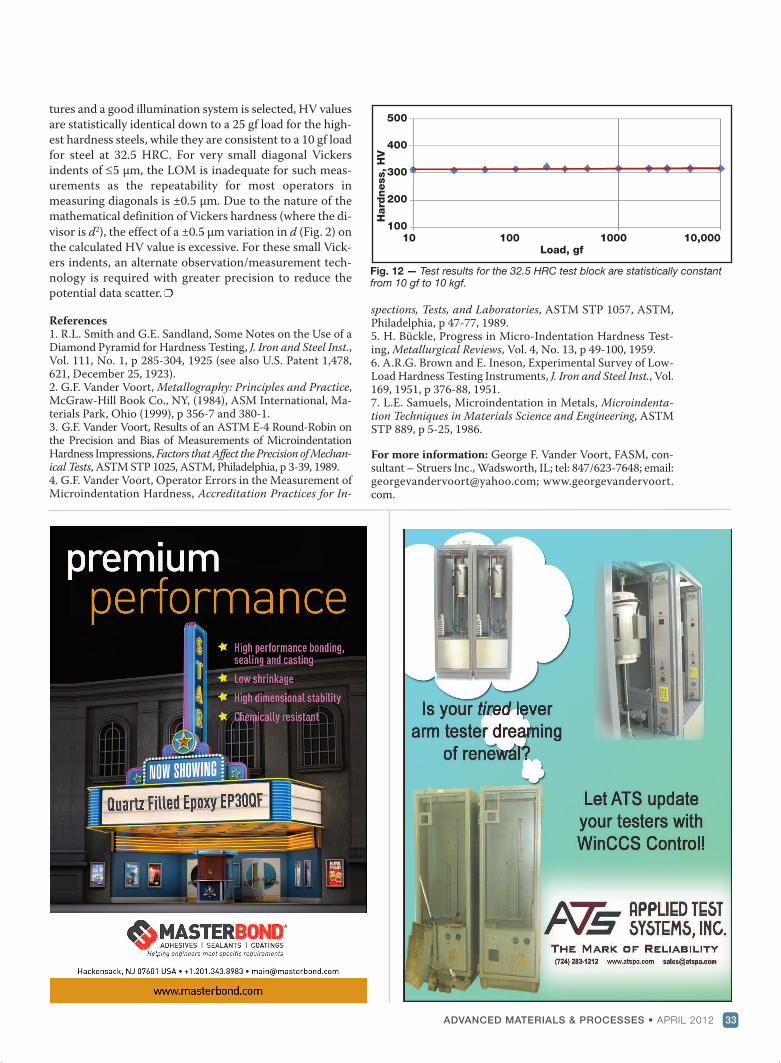
the ability to correctly measure indents, the authors per-formed micro Vickers measurements on high hardnesssteel test blocks using the DuraScan 70 microindentationhardness tester (Fig. 7). An optional six-position nosepiece
ADVANCED MATERIALS & PROCESSES • APRIL 2012 31
Fig. 4 — Micro-Vickers data for the same 5 HRC test blocks using a microVickers tester.
Fig. 5 — Load-hardness curves for nine labs considered to be producing“good” data according to ASTM E 691 for the hardest ferrous specimen.
Fig. 6 — Load-hardness curves for the hardest ferrous specimen with theoutlier data plotted and compared to the average values for the nine “good”labs shown in Fig. 5.
0 100 200 300 400 500 600Load, gf
800
700
600
500
400
300
200
100
0
Hardness, HV
10 100 1000Load, gf
Lab A Lab B Lab C
Lab D Lab G Lab K
Lab L Lab N Lab O
900
850
800
750
700
650
600
550
500
Hardness, HV
Hardness, HV
0 200 400 600 800 1000Load, gf
9 good labs Lab E
Lab F Lab H
Lab M Lab J
1100
1000
900
800
700
600
500
april amp features_am&p master template new QX6.qxt 3/22/2012 12:29 PM Page 31
turret is available that can accommodate two indenters andfour objectives (Fig. 8). Rockwell C certified test blocks
were used for the study after polishing them to re-move any surface damage from preparation. Com-plete removal of preparation-induced damage isnecessary when performing tests at loads under 100gf. Data are shown in Figs. 9 to 12 for test blocks withhardness values of 64.2, 61.3, 44.7, and 32.5 HRC. Eachdata point is the average of six impressions at that load.For the three hardest blocks, Vickers values are statis-tically identical down to 25 gf, but slightly lower values
were obtained at a 10 gf load. Results for the hardest block(64.2 HRC) are actually excellent. For the 32.5 HRC
test block, all HV values including 10 gf valuesare statistically identical.
Experiments measuring the smallest (10 gf )indents using 100´ (brightfield and darkfield) and 150´ ob-jectives (with high NA values of 0.90 and 0.95) revealthat indents can be focused, and they may remain infocus as fine focus control is moved slightly, but the in-dent size appears to change. If the smallest appearingindent size is arbitrarily selected, the 10 gf data wouldlook very good and would be consistent with the valuesat higher loads. But, the selection is biased by knowingthe correct answer, which is unacceptable. The valuesplotted represent indents in focus at what appears to betheir largest size. These indents are in the 4-5 μm sizerange for the 64.2 and 61.3 HRC test blocks. Tests of a60.7 HRC test block yielded results similar to the 61.3HRC block in this regard. Figure 2 shows how a minorvariation in diagonal size (±0.5 μm) for 4 or 5-μm diag-onal indents (the two indent values at the left side of thegraph are for 4 and 5 μm diagonal size Vickers indents)impart a huge variation in the measured hardness. Thisis a fundamental restriction on Vickers hardness preci-sion for small indents using light optical microscope(LOM) measurements. A different measurement tech-nology is required for small indents to obtain greaterprecision in measuring them and reduce the possiblecalculated hardness variation. The scanning electronmicroscope offers the potential for measurements withgreater precision and at higher magnifications than pos-sible with the LOM. However, obtaining such precisionwith the SEM is not simple because the specimen can-not be tilted in the SEM chamber to enhance image con-trast. Magnification must be known to a very highprecision, and this must be maintained as the workingdistance is changed.
ConclusionsThe ASTM interlaboratory round robin proves that
different trends observed for Vickers hardness as a func-tion of load (particularly for £100 gf loads) are due to visualperception problems of operators deciding where the in-dent tips are. The problem is not a material problem aswidely claimed in the literature for many years. Tests usinga DuraScan 70 show that when the proper magnificationusing high-quality objectives with high numerical aper-
ADVANCED MATERIALS & PROCESSES • APRIL 201232
Fig. 7 — DuraScan 70 equipped with the 6-position nosepiece turret, automated stage and computer control system.
Fig. 8 — Optional nosepiece forthe DuraScan Microindentationhardness tester can accommodate both Vickers andKnoop indenters and objectives.
Fig. 9 — Test results for the 64.2 HRC test block are statistically constantfrom 25 gf to 10 kgf.
Fig. 10 — Test results for a 61.3 HRC test block are statistically identicalfrom 25 gf to 10 kgf.
Fig. 11 — Test results for the 44.7 HRC test block are statistically constantfrom 25 gf to 10 kgf.
10 100 1000 10,000Load, gf
10 100 1000 10,000Load, gf
10 100 1000 10,000Load, gf
600
500
400
300
200
Hard
ness
, H
VH
ard
ness
, H
VH
ard
ness
, H
V
1000
900
800
700
600
800
700
600
500
400
april amp features_am&p master template new QX6.qxt 3/26/2012 2:48 PM Page 32
ADVANCED MATERIALS & PROCESSES • APRIL 2012 33
tures and a good illumination system is selected, HV valuesare statistically identical down to a 25 gf load for the high-est hardness steels, while they are consistent to a 10 gf loadfor steel at 32.5 HRC. For very small diagonal Vickersindents of £5 μm, the LOM is inadequate for such meas-urements as the repeatability for most operators inmeasuring diagonals is ±0.5 μm. Due to the nature of themathematical definition of Vickers hardness (where the di-visor is d2), the effect of a ±0.5 μm variation in d (Fig. 2) onthe calculated HV value is excessive. For these small Vick-ers indents, an alternate observation/measurement tech-nology is required with greater precision to reduce thepotential data scatter.
References1. R.L. Smith and G.E. Sandland, Some Notes on the Use of aDiamond Pyramid for Hardness Testing, J. Iron and Steel Inst.,Vol. 111, No. 1, p 285-304, 1925 (see also U.S. Patent 1,478,621, December 25, 1923).2. G.F. Vander Voort, Metallography: Principles and Practice,McGraw-Hill Book Co., NY, (1984), ASM International, Ma-terials Park, Ohio (1999), p 356-7 and 380-1.3. G.F. Vander Voort, Results of an ASTM E-4 Round-Robin onthe Precision and Bias of Measurements of MicroindentationHardness Impressions, Factors that Affect the Precision of Mechan-ical Tests, ASTM STP 1025, ASTM, Philadelphia, p 3-39, 1989.4. G.F. Vander Voort, Operator Errors in the Measurement ofMicroindentation Hardness, Accreditation Practices for In-
spections, Tests, and Laboratories, ASTM STP 1057, ASTM,Philadelphia, p 47-77, 1989.5. H. Bückle, Progress in Micro-Indentation Hardness Test-ing, Metallurgical Reviews, Vol. 4, No. 13, p 49-100, 1959.6. A.R.G. Brown and E. Ineson, Experimental Survey of Low-Load Hardness Testing Instruments, J. Iron and Steel Inst., Vol.169, 1951, p 376-88, 1951.7. L.E. Samuels, Microindentation in Metals, Microindenta-tion Techniques in Materials Science and Engineering, ASTMSTP 889, p 5-25, 1986.
For more information: George F. Vander Voort, FASM, con-sultant – Struers Inc., Wadsworth, IL; tel: 847/623-7648; email:[email protected]; www.georgevandervoort.com.
Fig. 12 — Test results for the 32.5 HRC test block are statistically constantfrom 10 gf to 10 kgf.
10 100 1000 10,000Load, gf
Hardness, HV
500
400
300
200
100
april amp features_am&p master template new QX6.qxt 3/22/2012 12:29 PM Page 33