
Low Income Health Program Overview · Low Income Health Program Overview. Dorothy Frost ......
40
Low Income Health Program Overview Dorothy Frost Teeter, Director MaryAnne Lindeblad, Medicaid Director Nathan Johnson, Chief Policy Officer February 7, 2017
Transcript of Low Income Health Program Overview · Low Income Health Program Overview. Dorothy Frost ......
Low Income Health Program Overview
Dorothy Frost Teeter, DirectorMaryAnne Lindeblad, Medicaid DirectorNathan Johnson, Chief Policy Officer
February 7, 2017

Today’s topics• Medicaid budget• Who we serve• Services provided• Managed care • Approaches to care • Physical & behavioral health integration• Medicaid transformation demonstration
2

3
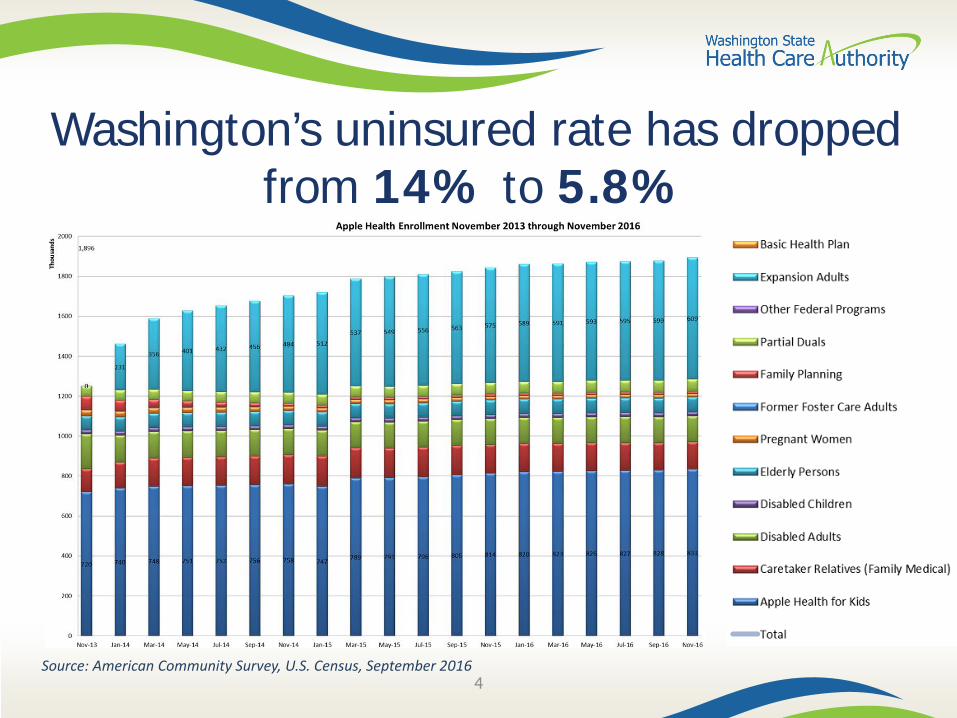
Washington’s uninsured rate has dropped from 14% to 5.8%
4Source: American Community Survey, U.S. Census, September 2016

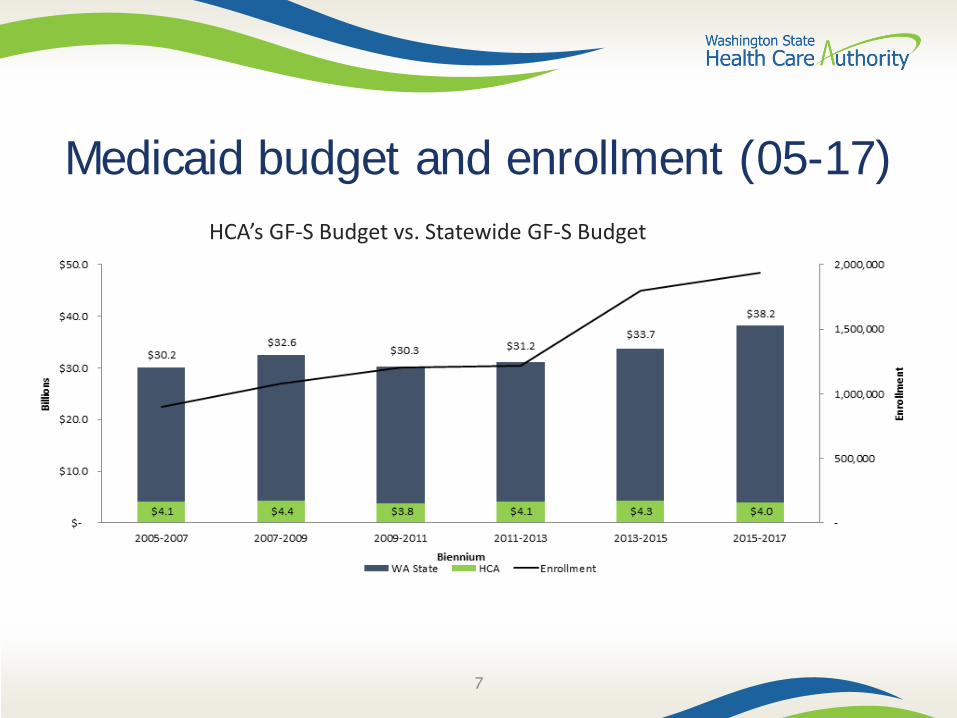
Medicaid budget and enrollment (05-17)
5

Medicaid budget and enrollment (05-17)
6
HCA’s GF-S Budget vs. Statewide GF-S Budget
Medicaid budget and enrollment (05-17)
7
HCA’s GF-S Budget vs. Statewide GF-S Budget
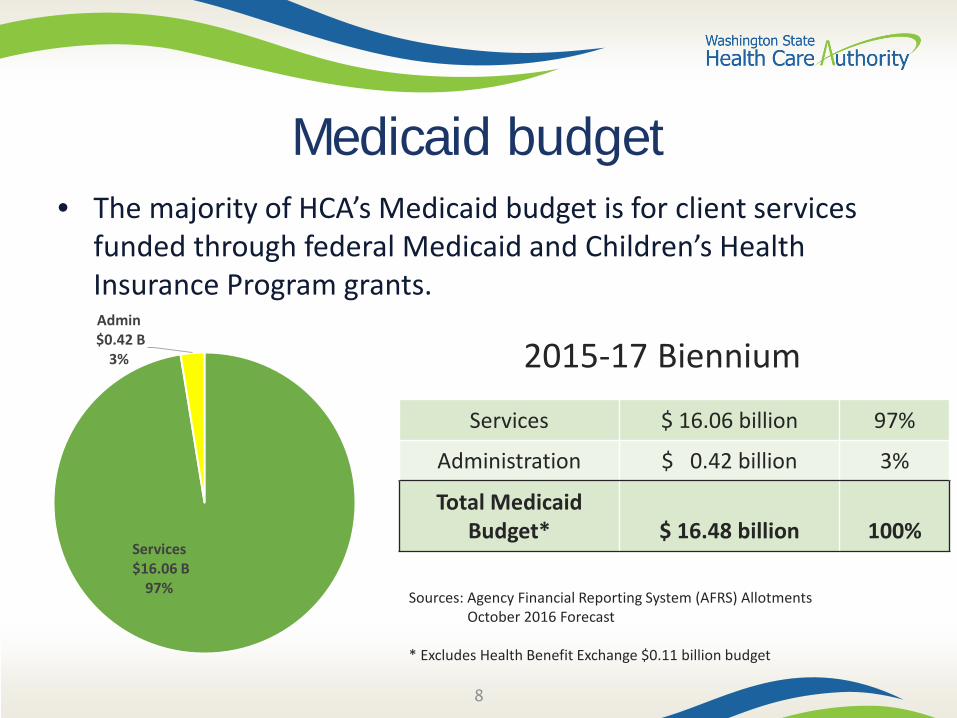
Medicaid budget• The majority of HCA’s Medicaid budget is for client services
funded through federal Medicaid and Children’s Health Insurance Program grants.
8
2015-17 Biennium
Services $ 16.06 billion 97%
Administration $ 0.42 billion 3%
Total Medicaid Budget* $ 16.48 billion 100%
Sources: Agency Financial Reporting System (AFRS) AllotmentsOctober 2016 Forecast
* Excludes Health Benefit Exchange $0.11 billion budget
Services$16.06 B
97%
Admin$0.42 B
3%
Medicaid
• Purchases health care for 1.9 million people– 8 in 10 Apple Health clients are enrolled in Managed Care
• Most – 1.55 million – receive care through five Managed Care Organizations (MCOs)
• $8 billion annual spend• Populations served include children, pregnant women,
disabled adults, elderly persons, former foster care adults, and adults covered through Medicaid expansion
9

Medicaid clients servedAn average of 1.9 million clients are served per month in FY 2017.
SFY 2017 State Expenditures Only
Source: October 2016 ForecastNotes: Presumptive SSI clients are included in Expansion AdultsOther Programs include State-only Children Health Program, Alien Emergency Medical, Medicaid Buy-In
822K
612K
150K
137K
76K
32K
24K
18K
12K
$626 M
$135M
$635M
$276M
$189M
$227M
$67M
$118M
$300 K
Apple Health for Kids
Expansion Adults
Blind/Disabled
Caretaker Relatives (Family Medical)
Elderly Persons
Partial Duals
Other Programs
Pregnant Women
Family Planning
State Expenditures Eligibles
Managed Care
11

Managed care contracting principles
• Provide comprehensive services through collaborative care coordination and integration
• Maintain a network capable of ensuring access• Control the cost of care
Goals
12

Managed care rates: budget proviso
• “$121,599,000 of the general fund-state appropriation for FY 2017 is provided solely for holding Medicaid managed care capitation rates flat at CY 2016 levels in state FY and CY 2017”
2nd Engrossed Substitute House Bill 2367, Section (1)(b)
• Engaged with OFM, Medicaid forecast work group, managed care plans to come up with strategies
• Obtained independent actuarial analysis, support, and recommendations• Office of the State Actuary obtained an actuarial review• Progress update to Joint Select Committee on Health Care (July 2016)• Legislative report submitted Oct. 1, 2016
Update
13

Managed care distribution by MCOManaged care enrollment by MCO Estimated paid premiums CY 16
14
Amerigroup148,478
10%
CHPW296,814
19%
Coordinated Care
206,138 13%
Molina689,253
44%
United221,589
14%
$1.937B
$978M
$810M
$617M
$532M
Molina
Community Health
United
Coordinated Care
Amerigroup
Total: $4.883 Billion
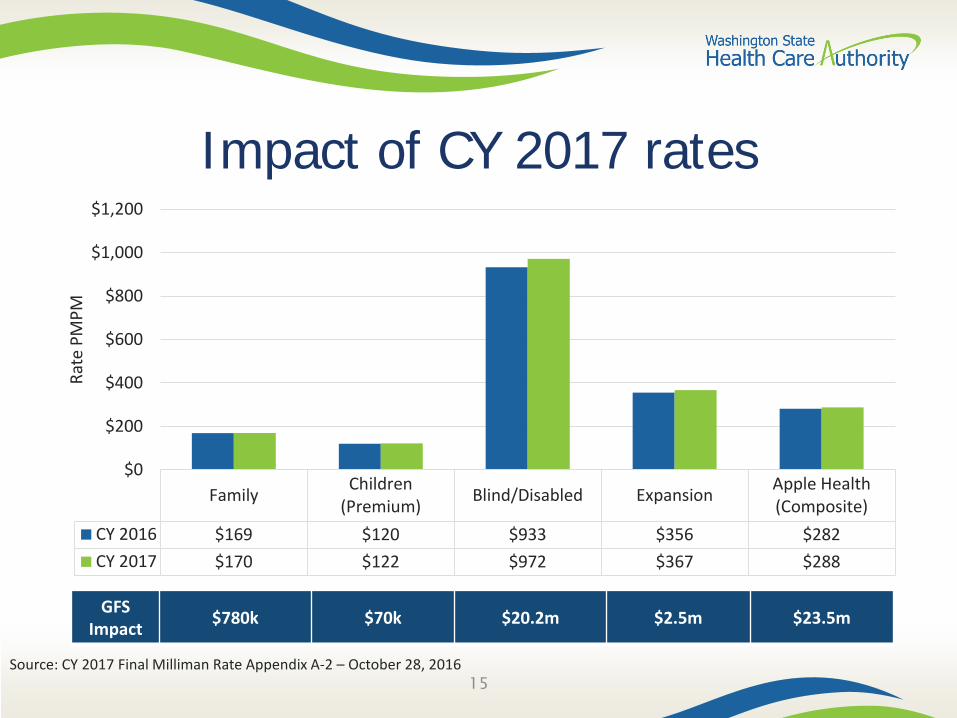
Impact of CY 2017 rates
Family Children(Premium) Blind/Disabled Expansion Apple Health
(Composite)CY 2016 $169 $120 $933 $356 $282CY 2017 $170 $122 $972 $367 $288
$0
$200
$400
$600
$800
$1,000
$1,200
Rate
PM
PM
15
GFSImpact $780k $70k $20.2m $2.5m $23.5m
Source: CY 2017 Final Milliman Rate Appendix A-2 – October 28, 2016
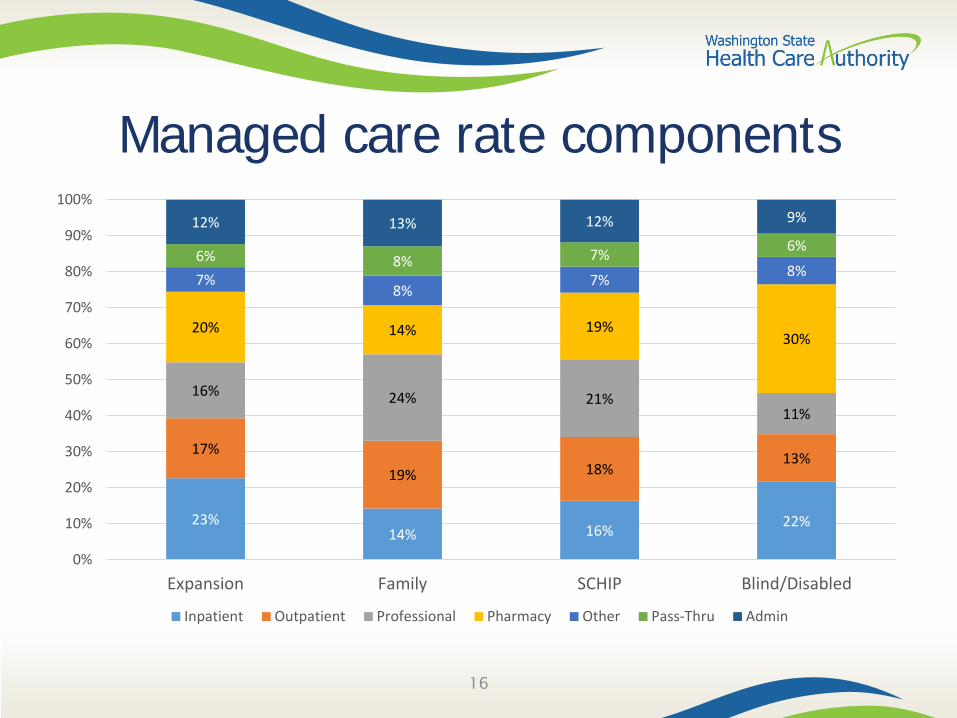
Managed care rate components
23%14% 16% 22%
17%
19% 18%13%
16% 24% 21%11%
20% 14% 19%30%
7%8%
7% 8%6% 8% 7% 6%
12% 13% 12% 9%
0%
10%
20%
30%
40%
50%
60%
70%
80%
90%
100%
Expansion Family SCHIP Blind/Disabled
Inpatient Outpatient Professional Pharmacy Other Pass-Thru Admin
16
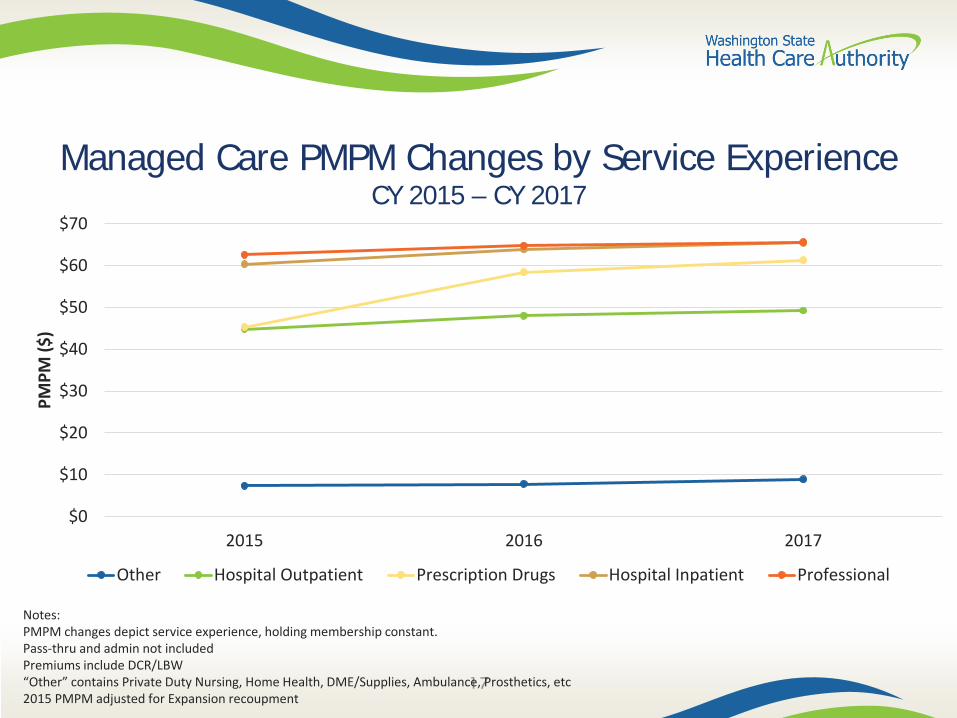
Managed Care PMPM Changes by Service ExperienceCY 2015 – CY 2017
17
$0
$10
$20
$30
$40
$50
$60
$70
2015 2016 2017
PMPM
($)
Other Hospital Outpatient Prescription Drugs Hospital Inpatient Professional
Notes: PMPM changes depict service experience, holding membership constant.Pass-thru and admin not includedPremiums include DCR/LBW“Other” contains Private Duty Nursing, Home Health, DME/Supplies, Ambulance, Prosthetics, etc2015 PMPM adjusted for Expansion recoupment

Approaches to Care
18
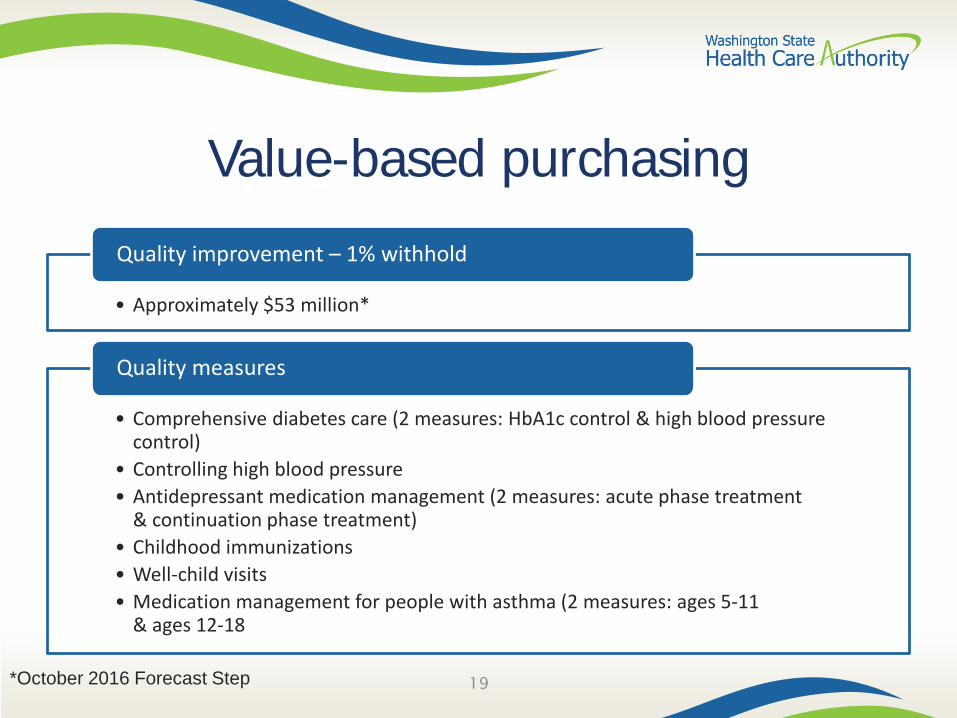
Value-based purchasing
• Approximately $53 million*
Quality improvement – 1% withhold
• Comprehensive diabetes care (2 measures: HbA1c control & high blood pressure control)
• Controlling high blood pressure• Antidepressant medication management (2 measures: acute phase treatment
& continuation phase treatment)• Childhood immunizations• Well-child visits• Medication management for people with asthma (2 measures: ages 5-11
& ages 12-18
Quality measures
19*October 2016 Forecast Step

Diagnosis of Opioid Use Disorder by Coverage
20
Traditional6,88219%
Newly eligible29,052
81%
Utilization of MAT by Coverage
Traditional 2,03618%
Newly Eligible9,55982%
Medicaid expansion impact on treatment for opioid use disorder
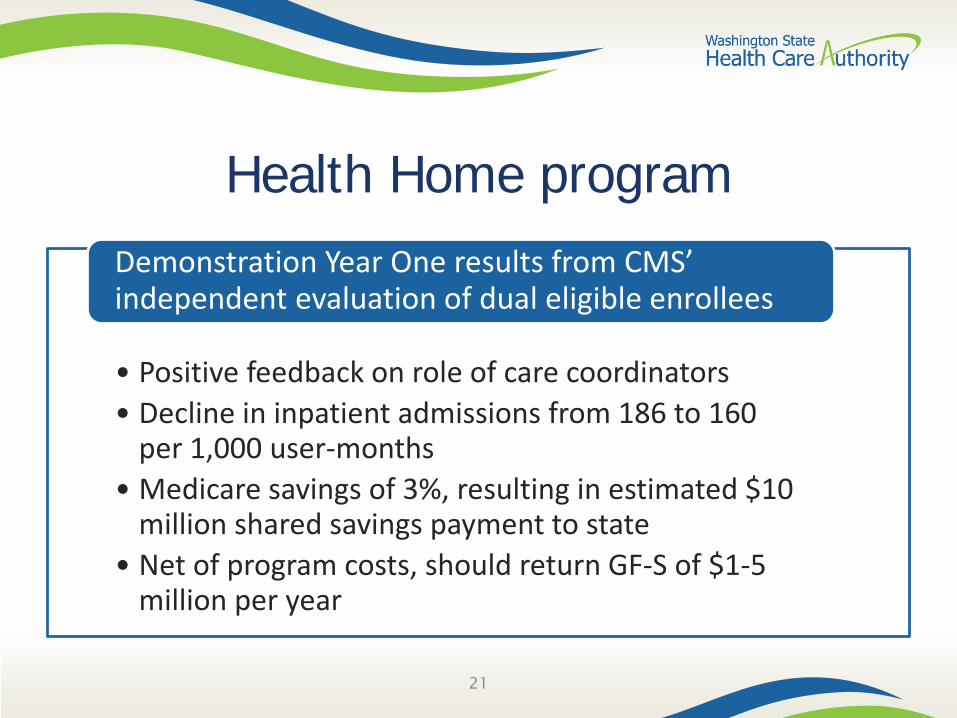
Health Home program
• Positive feedback on role of care coordinators• Decline in inpatient admissions from 186 to 160
per 1,000 user-months• Medicare savings of 3%, resulting in estimated $10
million shared savings payment to state• Net of program costs, should return GF-S of $1-5
million per year
Demonstration Year One results from CMS’independent evaluation of dual eligible enrollees
21

The case for integration
•10+ studies of collaborative care models for depression have been shown to improve clinical outcomes, employment rates, functioning, and quality of life; and they are cost-effective compared with other medical interventions
For patients with depression
• Integrated, on-site delivery of primary care was feasible, promoted greater access to primary care and preventive care, and resulted in a significantly larger improvement in health status than usual care
For patients with serious mental illness
•Trials reported improvements in medical care, quality of care, and patient outcomes. Two programs found to be cost-neutral… no significant decline in annual costs for a subsample of patients with comorbidities
For patients with substance abuse-related comorbidities
22
Sources: Unützer, JU, M Schoenbaum, BG Druss, and WJ Katon. January 2006. Transforming Mental Health Care at the Interface with General Medicine: Report for the Presidents Commission. Psychiatric Services 57:1, 37-47. Druss, BG, RM Rohrbaugh, CM Levinson, and RA Rosenheck. September 2001. Integrated Medical Care for Patients With Serious Psychiatric Illness: A Randomized Trial. Archives of General Psychiatry 58:9, 861-868. Butler, M, et al. October 2008. Evidence Report/Technology Assessment No. 173: Integration of Mental Health/Substance Abuse and Primary Care. Rockville: AHRQ.

Integrated managed care: legislation
23
• Changed how the state purchases mental health and substance use disorder services in the Medicaid program
• Directed the state to fully integrate the financing and delivery of physical health, mental health and substance use disorder services in the Medicaid program via managed care by 2020
• Directed the state to integrate mental health and substance use disorder services through Behavioral Health Organizations (BHOS) as an interim step to 2020
• Created a pathway for regions to fully integrate early, starting in April 2016
2SSB 6312
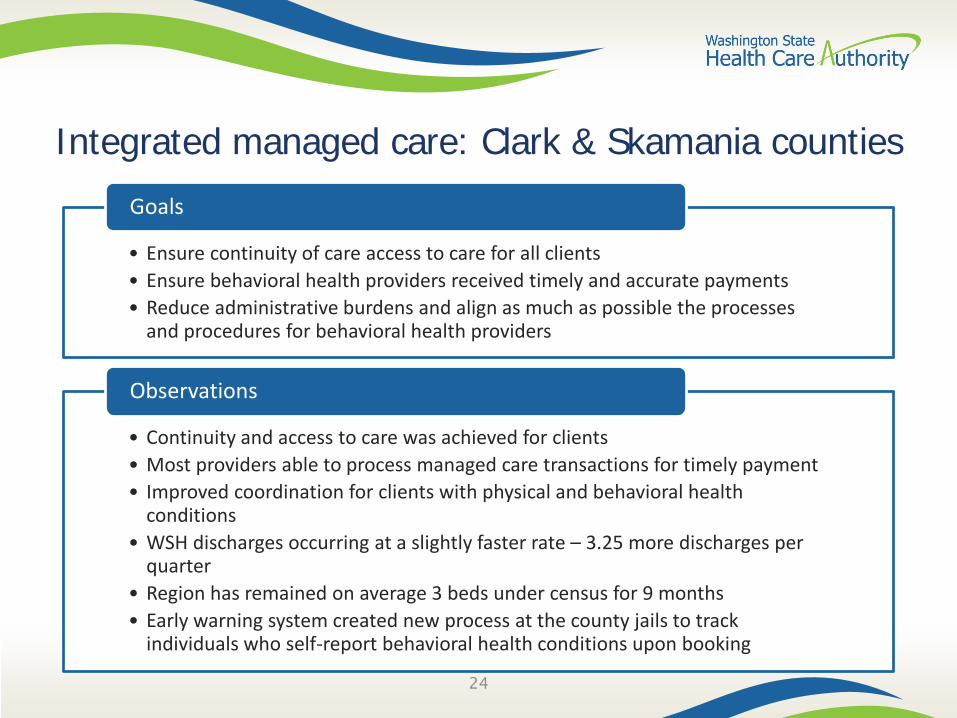
Integrated managed care: Clark & Skamania counties
24
• Ensure continuity of care access to care for all clients• Ensure behavioral health providers received timely and accurate payments• Reduce administrative burdens and align as much as possible the processes
and procedures for behavioral health providers
Goals
• Continuity and access to care was achieved for clients• Most providers able to process managed care transactions for timely payment• Improved coordination for clients with physical and behavioral health
conditions• WSH discharges occurring at a slightly faster rate – 3.25 more discharges per
quarter• Region has remained on average 3 beds under census for 9 months• Early warning system created new process at the county jails to track
individuals who self-report behavioral health conditions upon booking
Observations

Integrated managed care: what’s next
25
• Southwest Washington (Clark & Skamania counties) “early adopter” region first-year results using standard RDA measures
June 2017
• North Central Region (Chelan, Douglas, Grant counties): mid-adopter”
January 2018
• Other regions engaged in discussion with HCA about implementation of integrated managed care: Pierce, Thurston, Mason, King counties
2018-2020
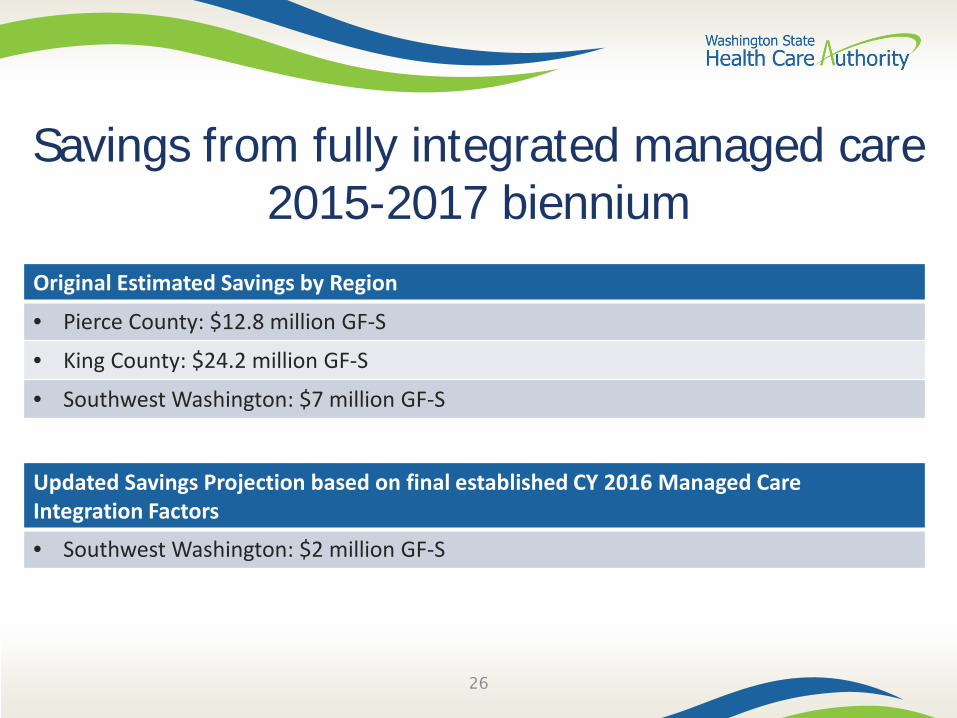
Savings from fully integrated managed care2015-2017 biennium
26
Original Estimated Savings by Region
• Pierce County: $12.8 million GF-S
• King County: $24.2 million GF-S
• Southwest Washington: $7 million GF-S
Updated Savings Projection based on final established CY 2016 Managed Care Integration Factors
• Southwest Washington: $2 million GF-S

Medicaid Transformation Demonstration
27
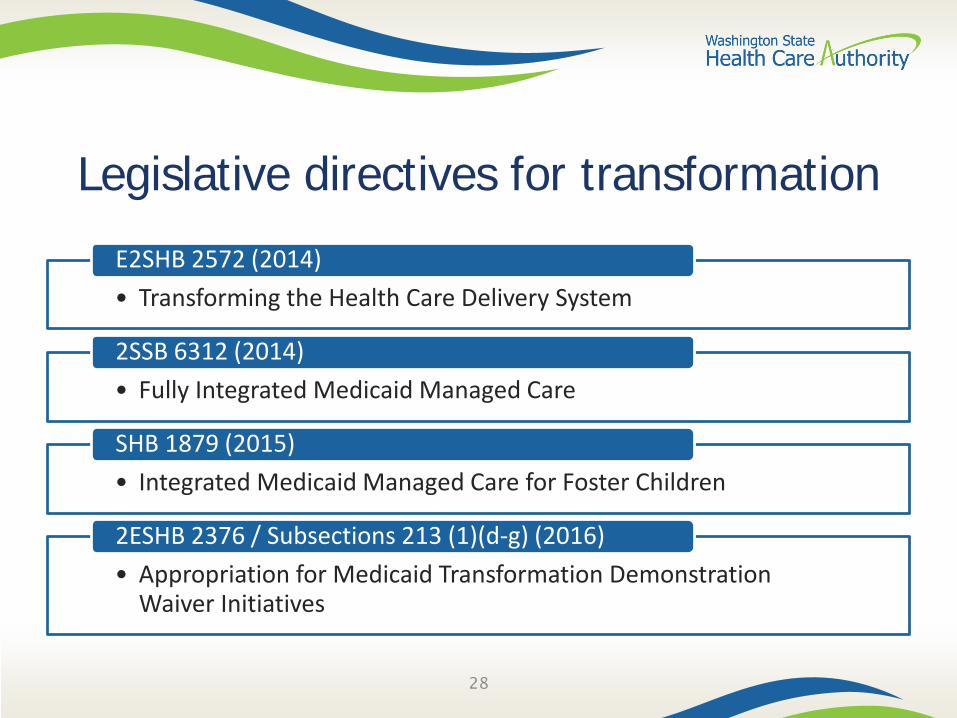
Legislative directives for transformation
• Transforming the Health Care Delivery SystemE2SHB 2572 (2014)
• Fully Integrated Medicaid Managed Care2SSB 6312 (2014)
• Integrated Medicaid Managed Care for Foster ChildrenSHB 1879 (2015)
• Appropriation for Medicaid Transformation Demonstration Waiver Initiatives
2ESHB 2376 / Subsections 213 (1)(d-g) (2016)
28
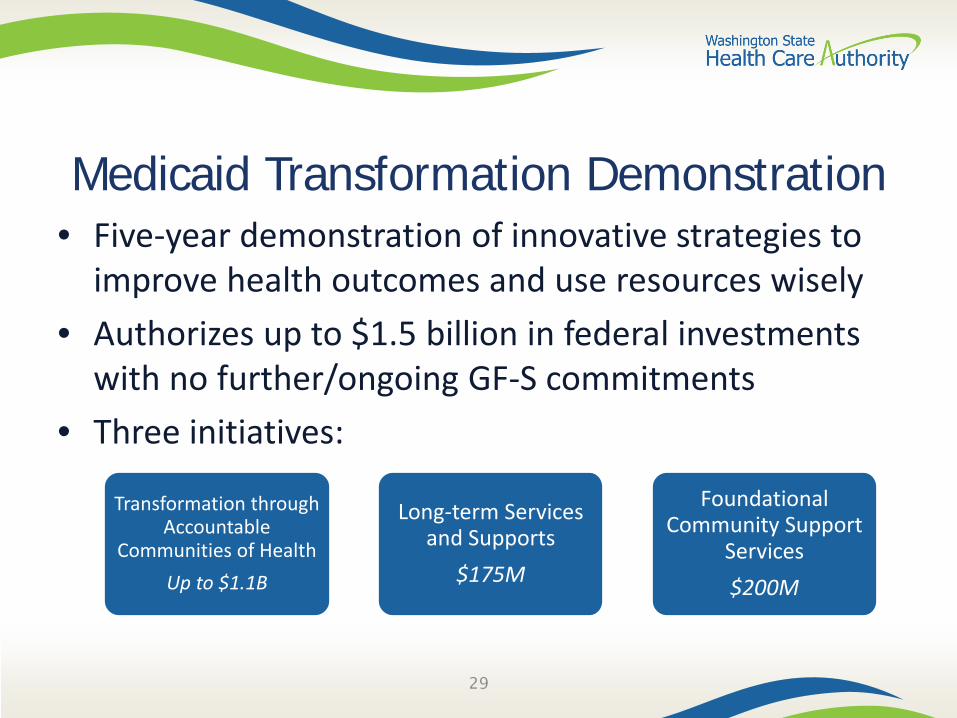
Medicaid Transformation Demonstration• Five-year demonstration of innovative strategies to
improve health outcomes and use resources wisely• Authorizes up to $1.5 billion in federal investments
with no further/ongoing GF-S commitments• Three initiatives:
29
Transformation through Accountable
Communities of HealthUp to $1.1B
Long-term Services and Supports
$175M
Foundational Community Support
Services$200M
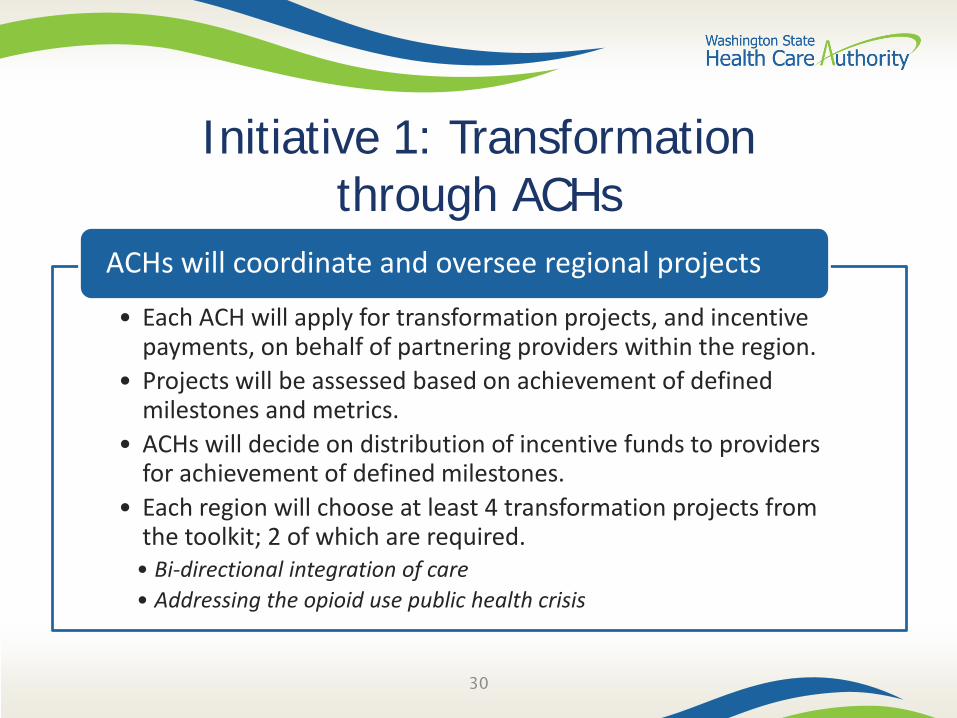
Initiative 1: Transformation through ACHs
30
• Each ACH will apply for transformation projects, and incentive payments, on behalf of partnering providers within the region.
• Projects will be assessed based on achievement of defined milestones and metrics.
• ACHs will decide on distribution of incentive funds to providers for achievement of defined milestones.
• Each region will choose at least 4 transformation projects from the toolkit; 2 of which are required.• Bi-directional integration of care• Addressing the opioid use public health crisis
ACHs will coordinate and oversee regional projects

Medicaid transformation goals
31
• Integrate physical and behavioral health purchasing and service delivery
• Convert 90% of Medicaid provider payments to reward outcomes
• Implement population health strategies that improve health equity
• Provide targeted services that address the needs of our aging populations and address the key determinants of health
Over the five-year demonstration, Washington will:

Budget neutrality
32
• Must be at or below what they would be without the waiver
Federal expenditures
• State must measure projected “without waiver” (WOW) expenditures against “with waiver” (WW) expenditures
• Difference between WOW and WW expenditures creates the budget neutrality “room” within which federal funds are made available
“Without Waiver” vs “With Waiver”
• Budget neutrality is measured annually but enforced over the five-year lifetime of the demonstration
Measurement
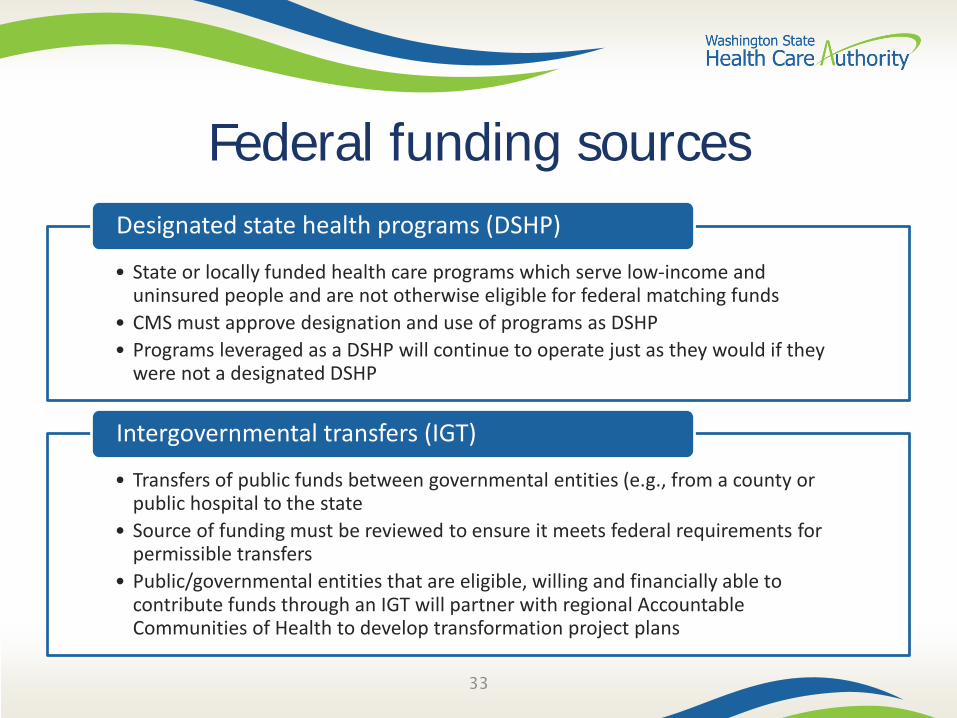
Federal funding sources
• State or locally funded health care programs which serve low-income and uninsured people and are not otherwise eligible for federal matching funds
• CMS must approve designation and use of programs as DSHP• Programs leveraged as a DSHP will continue to operate just as they would if they
were not a designated DSHP
Designated state health programs (DSHP)
• Transfers of public funds between governmental entities (e.g., from a county or public hospital to the state
• Source of funding must be reviewed to ensure it meets federal requirements for permissible transfers
• Public/governmental entities that are eligible, willing and financially able to contribute funds through an IGT will partner with regional Accountable Communities of Health to develop transformation project plans
Intergovernmental transfers (IGT)
33
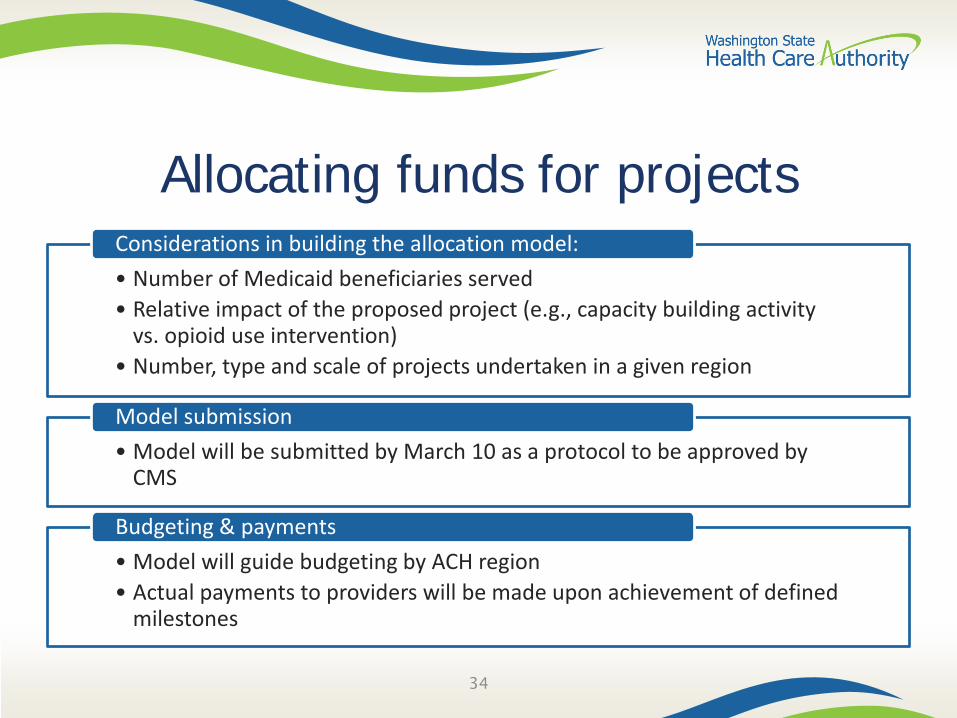
Allocating funds for projects
34
• Number of Medicaid beneficiaries served• Relative impact of the proposed project (e.g., capacity building activity
vs. opioid use intervention)• Number, type and scale of projects undertaken in a given region
Considerations in building the allocation model:
• Model will be submitted by March 10 as a protocol to be approved by CMS
Model submission
• Model will guide budgeting by ACH region• Actual payments to providers will be made upon achievement of defined
milestones
Budgeting & payments

Managing risk
35
• Would require legislative authority through budget appropriation or statute
• Current appropriation authority for all three demonstration initiatives
Demonstration does not create entitlements for future state obligations
• Federal funds are claimed through DSHP and IGT• Funds are issued upon completion of agreed milestones
State controls the pace and scope of financing

Financial executor
36
• Provides centralized management and accounting for transformation project incentive funds
• Avoids variation in payment arrangements across Accountable Communities of Health
• Provides central accountability to state for managing transactions
• Responsible for distributing incentive dollars to providers participating in transformation projects once milestones are achieved
State-contracted vendor
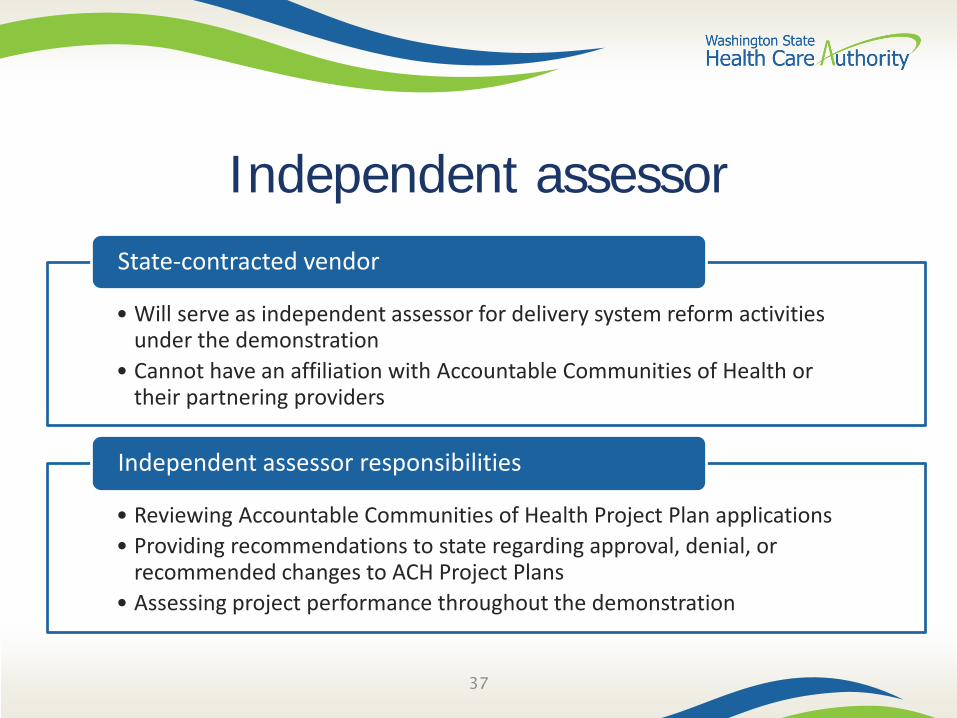
Independent assessor
37
• Will serve as independent assessor for delivery system reform activities under the demonstration
• Cannot have an affiliation with Accountable Communities of Health or their partnering providers
State-contracted vendor
• Reviewing Accountable Communities of Health Project Plan applications• Providing recommendations to state regarding approval, denial, or
recommended changes to ACH Project Plans• Assessing project performance throughout the demonstration
Independent assessor responsibilities
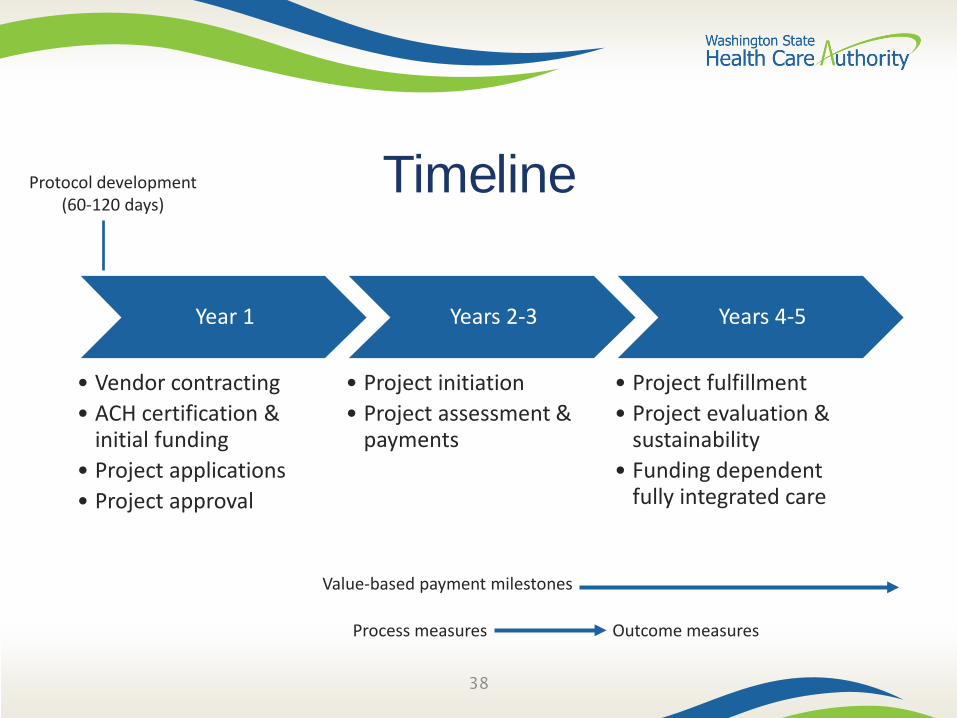
Timeline
Year 1
• Vendor contracting• ACH certification &
initial funding• Project applications• Project approval
Years 2-3
• Project initiation• Project assessment &
payments
Years 4-5
• Project fulfillment• Project evaluation &
sustainability• Funding dependent
fully integrated care
38
Protocol development(60-120 days)
Value-based payment milestones
Process measures Outcome measures
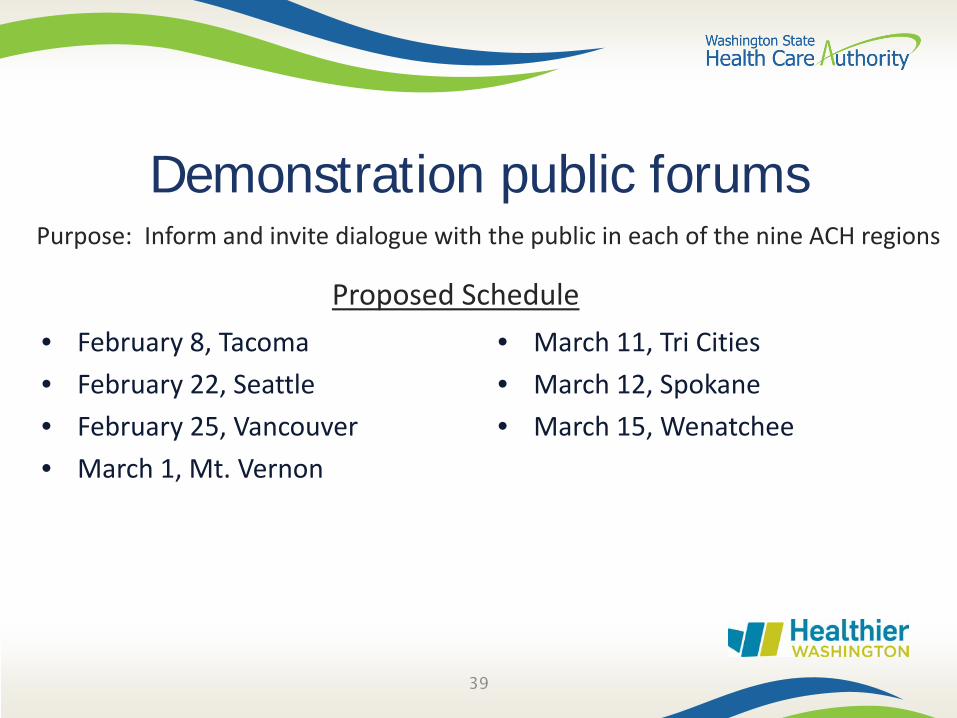
Demonstration public forums
• February 8, Tacoma• February 22, Seattle• February 25, Vancouver• March 1, Mt. Vernon
• March 11, Tri Cities• March 12, Spokane• March 15, Wenatchee
39
Purpose: Inform and invite dialogue with the public in each of the nine ACH regions
Proposed Schedule