
Low-Impact Development Controls and Long-Term … · Go to CivilStorm > Analysis > Scenarios to...
25
1 Copyright © 2014 Bentley Systems, Incorporated Low-Impact Development Controls and Long-Term Simulation with CivilStorm Workshop Overview In this workshop, a file is provided that contains hydrology data for a portion of a residential subdivision. Low-impact development (LID) controls such as porous pavers, rain gardens, a bioretention cell, grass swales, and a rain barrel are incorporated into one scenario. A second scenario shows the same area, but without LID measures. You will begin by examining the catchment and LID input data, and then add porous pavement to another driveway in the first scenario. You will then examine the input parameters for long-term simulation, and run a one-year simulation for both scenarios using historical rainfall data with the SWMM Engine. Finally, you will review and interpret model results using graphical and statistical output. This workshop is written for CivilStorm V8i SELECTseries 4.
Transcript of Low-Impact Development Controls and Long-Term … · Go to CivilStorm > Analysis > Scenarios to...

1 Copyright © 2014 Bentley Systems, Incorporated
Low-Impact Development
Controls and Long-Term
Simulation with CivilStorm
Workshop Overview
In this workshop, a file is provided that contains hydrology data for a portion of a
residential subdivision. Low-impact development (LID) controls such as porous
pavers, rain gardens, a bioretention cell, grass swales, and a rain barrel are
incorporated into one scenario. A second scenario shows the same area, but without
LID measures.
You will begin by examining the catchment and LID input data, and then add porous
pavement to another driveway in the first scenario. You will then examine the input
parameters for long-term simulation, and run a one-year simulation for both
scenarios using historical rainfall data with the SWMM Engine. Finally, you will
review and interpret model results using graphical and statistical output.
This workshop is written for CivilStorm V8i SELECTseries 4.
Module Objectives
2 Copyright © 2014 Bentley Systems, Incorporated
Module Objectives
In this module, you will explore:
• How LID controls are incorporated into a CivilStorm model
• How to configure a long-term simulation using a SWMM rainfall file
• How to use graphs and statistics to analyze model output
LID Controls
� Exercise: Reviewing the existing model
1. If using the stand-alone interface, start CivilStorm V8i and open the LID-
LTSstart.stsw file found in C:\Bentley Workshop\LID.
If using CivilStorm for Microstation, open the LID_LTS_ Start.dgn file found in
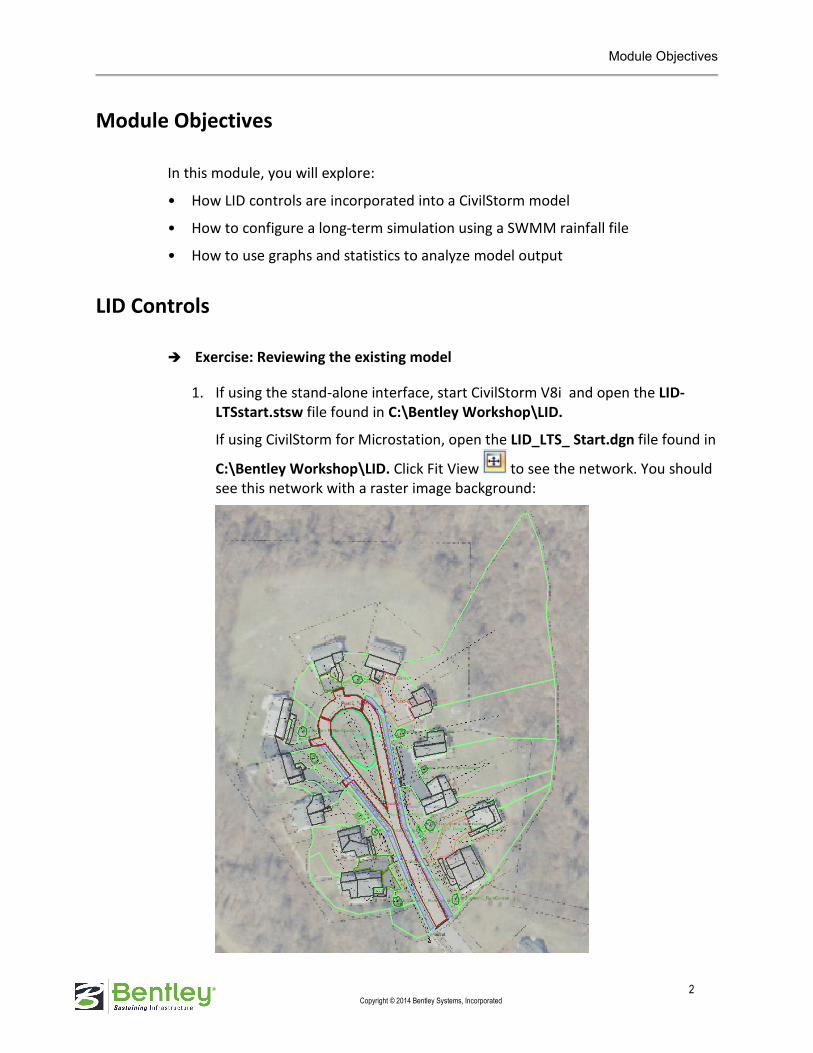
C:\Bentley Workshop\LID. Click Fit View to see the network. You should
see this network with a raster image background:

LID Controls
3 Copyright © 2014 Bentley Systems, Incorporated
This hydrologic network is a portion of a subdivision about 4 acres total in
size. The area is divided into a number of small watersheds in order to depict
the roofs, driveways, etc., that route to the various LID elements.
2. In MicroStation, switch to view 2 by clicking the “2” button below the
drawing. View 2 has been set up to show the network without the
background.
In the Stand-Alone version, you can toggle the background on and off by
choosing View > Background Layers and toggling the background file
aerial_plan.
3. Make sure that the current scenario is set to “Subdivision with LID Controls.”
Go to CivilStorm > Analysis > Scenarios to open the Scenario Manager. To
make the correct Scenario current, select “Subdivision with LID Controls” and
then select the Make Current button to ensure that it is the current
Scenario.
LID Controls
4 Copyright © 2014 Bentley Systems, Incorporated
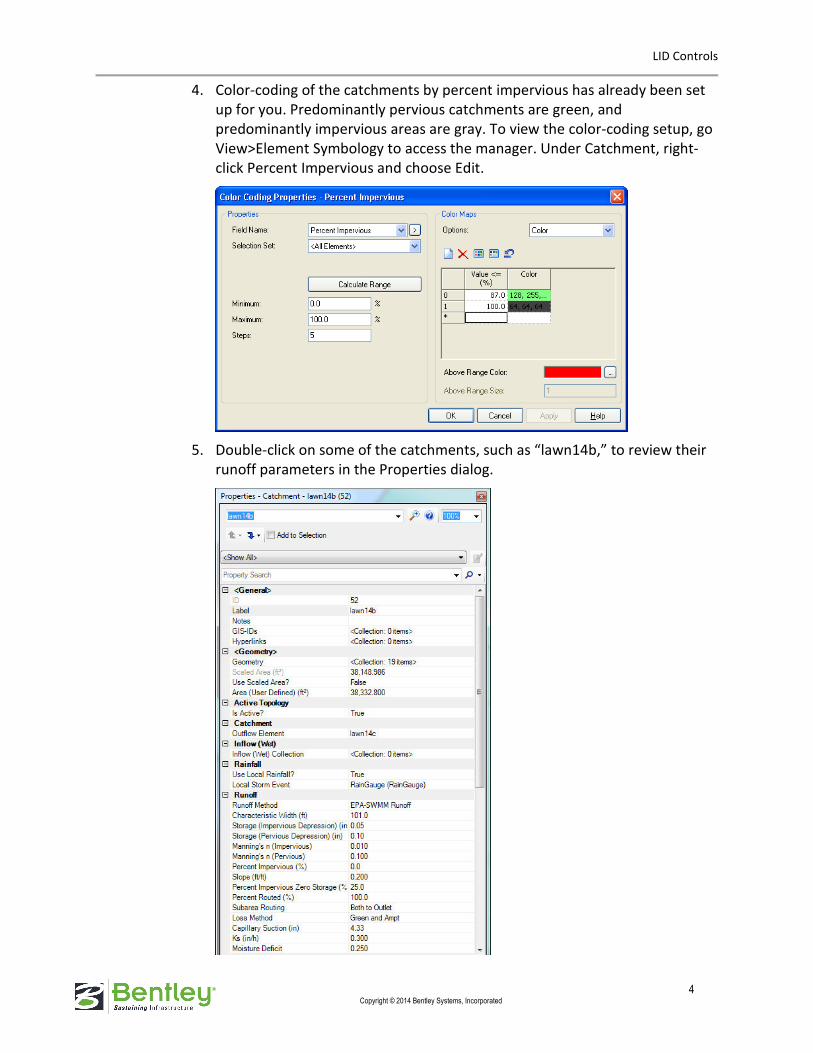
4. Color-coding of the catchments by percent impervious has already been set
up for you. Predominantly pervious catchments are green, and
predominantly impervious areas are gray. To view the color-coding setup, go
View>Element Symbology to access the manager. Under Catchment, right-
click Percent Impervious and choose Edit.
5. Double-click on some of the catchments, such as “lawn14b,” to review their
runoff parameters in the Properties dialog.
LID Controls
5 Copyright © 2014 Bentley Systems, Incorporated
Note that the Runoff Method selected for the catchments is the EPA-SWMM
Runoff method. When the EPA SWMM Runoff method is selected on a
catchment, the associated parameters for this method are brought up in the
Properties Manager.
You can see, for example, that the user-defined area of “lawn14b” is 0.88
acres.
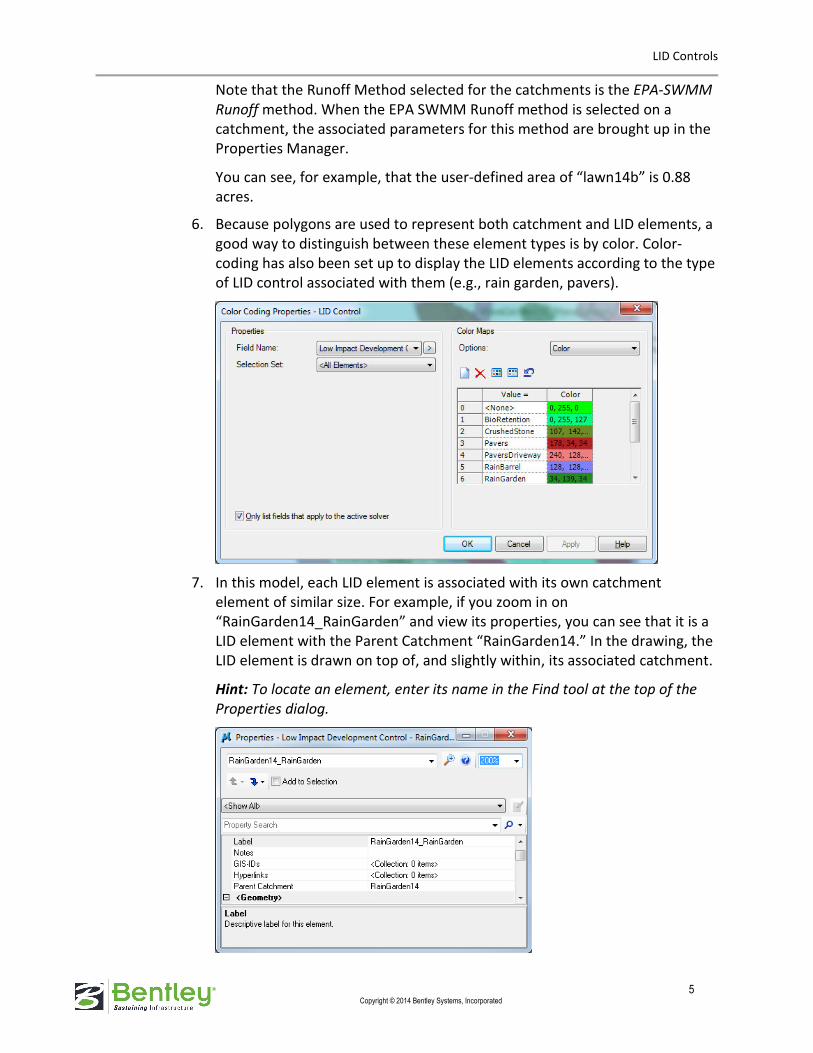
6. Because polygons are used to represent both catchment and LID elements, a
good way to distinguish between these element types is by color. Color-
coding has also been set up to display the LID elements according to the type
of LID control associated with them (e.g., rain garden, pavers).
7. In this model, each LID element is associated with its own catchment
element of similar size. For example, if you zoom in on
“RainGarden14_RainGarden” and view its properties, you can see that it is a
LID element with the Parent Catchment “RainGarden14.” In the drawing, the
LID element is drawn on top of, and slightly within, its associated catchment.
Hint: To locate an element, enter its name in the Find tool at the top of the
Properties dialog.
LID Controls
6 Copyright © 2014 Bentley Systems, Incorporated
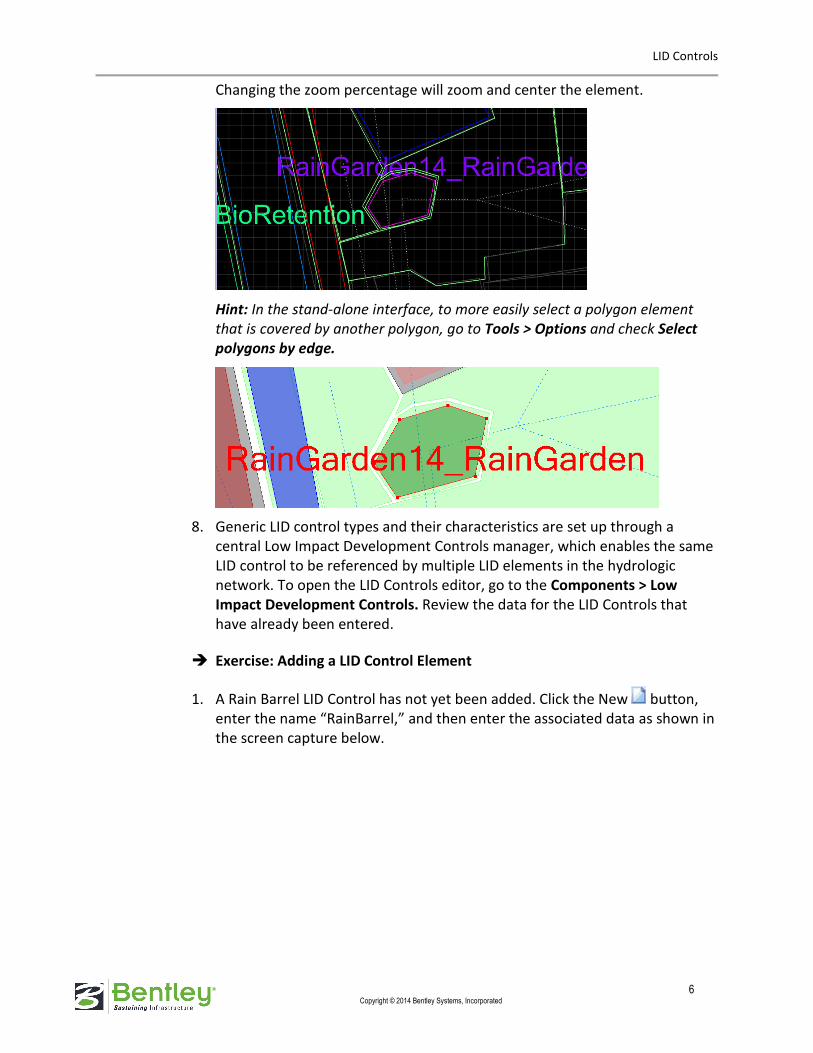
Changing the zoom percentage will zoom and center the element.
Hint: In the stand-alone interface, to more easily select a polygon element
that is covered by another polygon, go to Tools > Options and check Select
polygons by edge.
8. Generic LID control types and their characteristics are set up through a
central Low Impact Development Controls manager, which enables the same
LID control to be referenced by multiple LID elements in the hydrologic
network. To open the LID Controls editor, go to the Components > Low
Impact Development Controls. Review the data for the LID Controls that
have already been entered.
� Exercise: Adding a LID Control Element
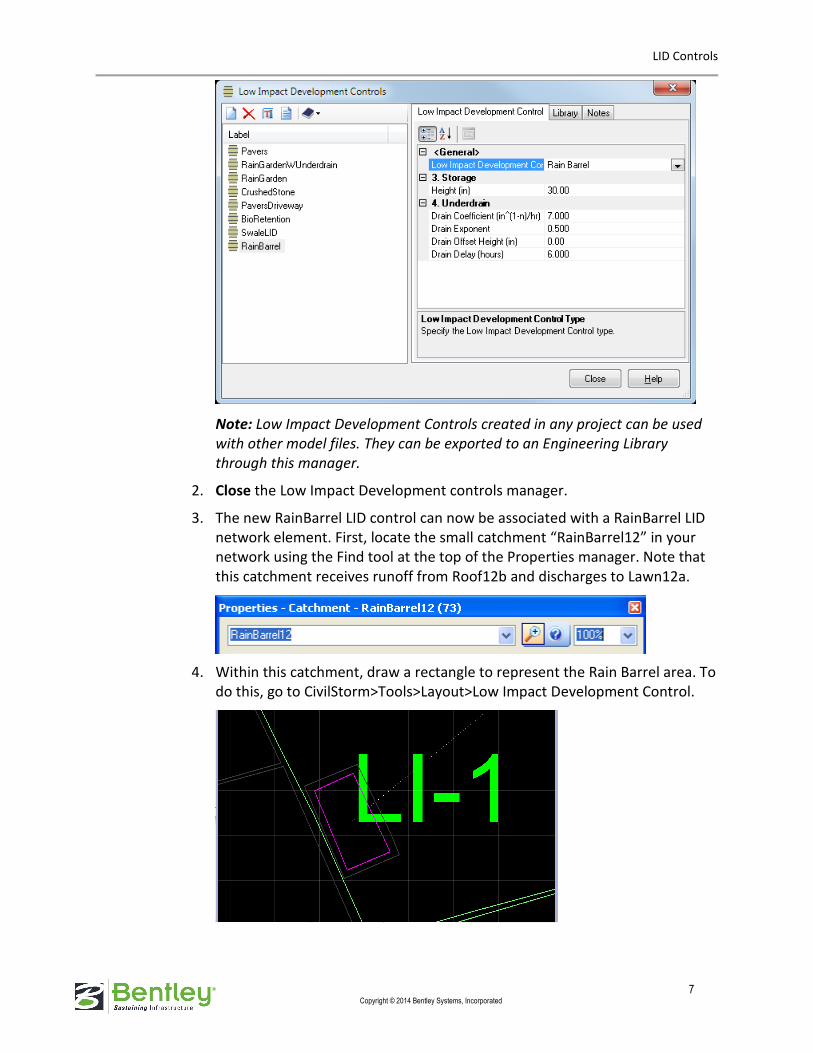
1. A Rain Barrel LID Control has not yet been added. Click the New button,
enter the name “RainBarrel,” and then enter the associated data as shown in
the screen capture below.
LID Controls
7 Copyright © 2014 Bentley Systems, Incorporated
Note: Low Impact Development Controls created in any project can be used
with other model files. They can be exported to an Engineering Library
through this manager.
2. Close the Low Impact Development controls manager.
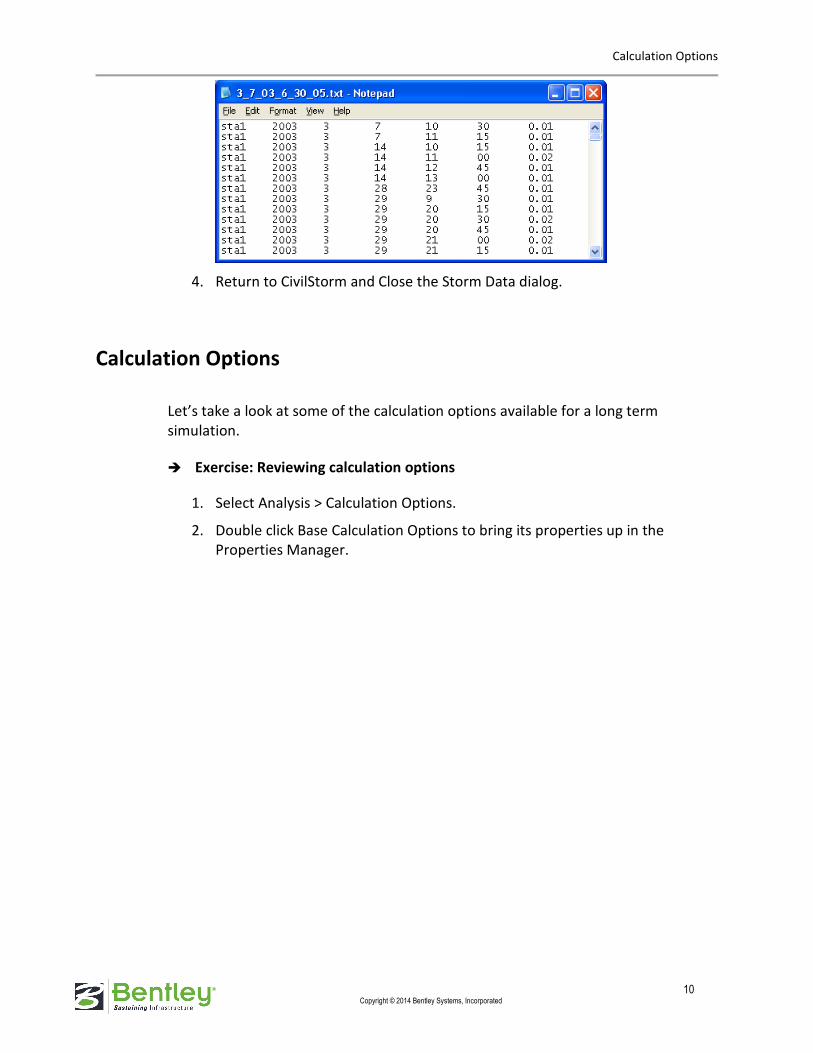
3. The new RainBarrel LID control can now be associated with a RainBarrel LID
network element. First, locate the small catchment “RainBarrel12” in your
network using the Find tool at the top of the Properties manager. Note that
this catchment receives runoff from Roof12b and discharges to Lawn12a.
4. Within this catchment, draw a rectangle to represent the Rain Barrel area. To
do this, go to CivilStorm>Tools>Layout>Low Impact Development Control.

LID Controls
8 Copyright © 2014 Bentley Systems, Incorporated
5. Using the Element Selection tool, click on the Rain Barrel LID element and
enter the following Properties:
• Label: RainBarrel12_RainBarrel
• Parent Catchment: RainBarrel12
• LID Control (what we created in step 7): RainBarrel
• Occupies Full Subcatchment: TRUE
• Top Width of Overland Flow Surface of Each Unit (ft) : 0
• Percent Initially Saturated (rain barrel % full at start of simulation): 0
• Number of Replicate Units: 2
Note: The area occupied by the rain barrels hasn’t been explicitly specified.
(The depth was specified in the Low Impact Development Controls manager.)
Instead, they have been configured to occupy the full area of the parent
catchment. An examination of catchment RainBarrel12 reveals a user-defined
area of 10 sq. ft. There are therefore two rain barrels, each occupying 5 sq. ft.
Hint: To change the units or display precision for any attribute, right-click the
attribute name, select Units and formatting, and enter the desired value.
6. We need to make the new Rain Barrel inactive in the “Subdivision without
LID controls” scenario. This scenario uses an Active Topology alternative
called “Inactive LIDs.” First, change the current Scenario to Subdivision
without LID controls using the scenario manager.

Rainfall for Long-Term Simulations
9 Copyright © 2014 Bentley Systems, Incorporated
7. When you change the scenario, you should notice that all of the LID polygons
in the model (except the one you just created) have either turned gray or are
no longer visible. This is because these elements are inactive in the current
scenario. For this exercise, we don’t want to see the inactive elements, so go
to Tools > Options and uncheck Display Inactive Topology.
8. In the Properties dialog for RainBarrel12_RainBarrel, change “Is Active?” to
False. The LID element should disappear from the drawing in this scenario.
Rainfall for Long-Term Simulations
� Exercise: Reviewing the rain file
1. Go to Components > Storm Data, and select RainGauge under the Rain File
folder. As you can see, an external Rain File has already been linked to this
model. The rainfall data for the station “sta1” is given as Incremental Depth
with a 15-min interval and units of in.
2. Minimize CivilStorm and browse to the dataset location C:\Bentley
Workshop\LID\Precip\.
3. Open 3_7_03_6_30_05.txt using a text editor. The data in the file follows the
SWMM format: Station ID, year, month, day, hour, minute, non-zero
precipitation.
Calculation Options
10 Copyright © 2014 Bentley Systems, Incorporated
4. Return to CivilStorm and Close the Storm Data dialog.
Calculation Options
Let’s take a look at some of the calculation options available for a long term
simulation.
� Exercise: Reviewing calculation options
1. Select Analysis > Calculation Options.
2. Double click Base Calculation Options to bring its properties up in the
Properties Manager.
Calculation Options
11 Copyright © 2014 Bentley Systems, Incorporated
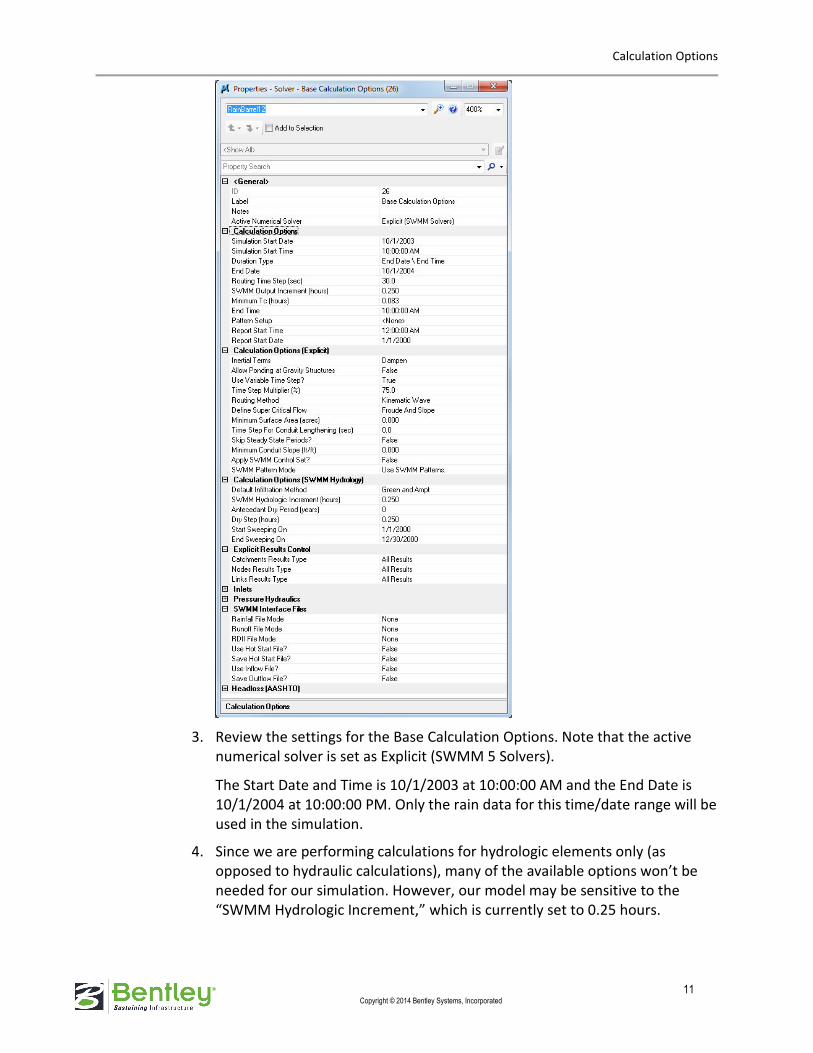
3. Review the settings for the Base Calculation Options. Note that the active
numerical solver is set as Explicit (SWMM 5 Solvers).
The Start Date and Time is 10/1/2003 at 10:00:00 AM and the End Date is
10/1/2004 at 10:00:00 PM. Only the rain data for this time/date range will be
used in the simulation.
4. Since we are performing calculations for hydrologic elements only (as
opposed to hydraulic calculations), many of the available options won’t be
needed for our simulation. However, our model may be sensitive to the
“SWMM Hydrologic Increment,” which is currently set to 0.25 hours.
Computing the Model and Viewing Results
12 Copyright © 2014 Bentley Systems, Incorporated
If we were running a larger LTS model that included hydraulics, we would
want to select a Routing Time Step and Output Increment to represent an
acceptable compromise between accuracy and model stability, and model
performance and computation time. Other options allow the user to improve
performance by restricting the amount of output generated, and by saving
data files from previous calculations, such as a Runoff File, for reuse in
subsequent runs.
Computing the Model and Viewing Results
� Exercise: Running the simulation
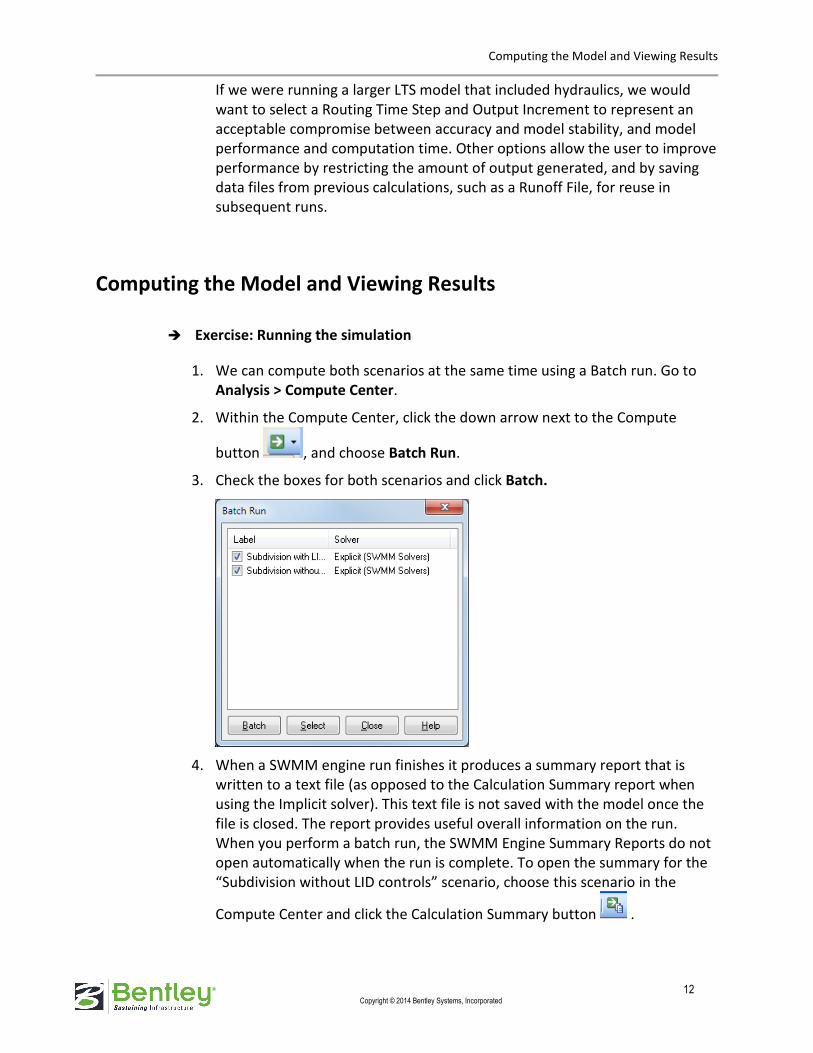
1. We can compute both scenarios at the same time using a Batch run. Go to
Analysis > Compute Center.
2. Within the Compute Center, click the down arrow next to the Compute
button , and choose Batch Run.
3. Check the boxes for both scenarios and click Batch.
4. When a SWMM engine run finishes it produces a summary report that is
written to a text file (as opposed to the Calculation Summary report when
using the Implicit solver). This text file is not saved with the model once the
file is closed. The report provides useful overall information on the run.
When you perform a batch run, the SWMM Engine Summary Reports do not
open automatically when the run is complete. To open the summary for the
“Subdivision without LID controls” scenario, choose this scenario in the
Compute Center and click the Calculation Summary button .
Computing the Model and Viewing Results
13 Copyright © 2014 Bentley Systems, Incorporated
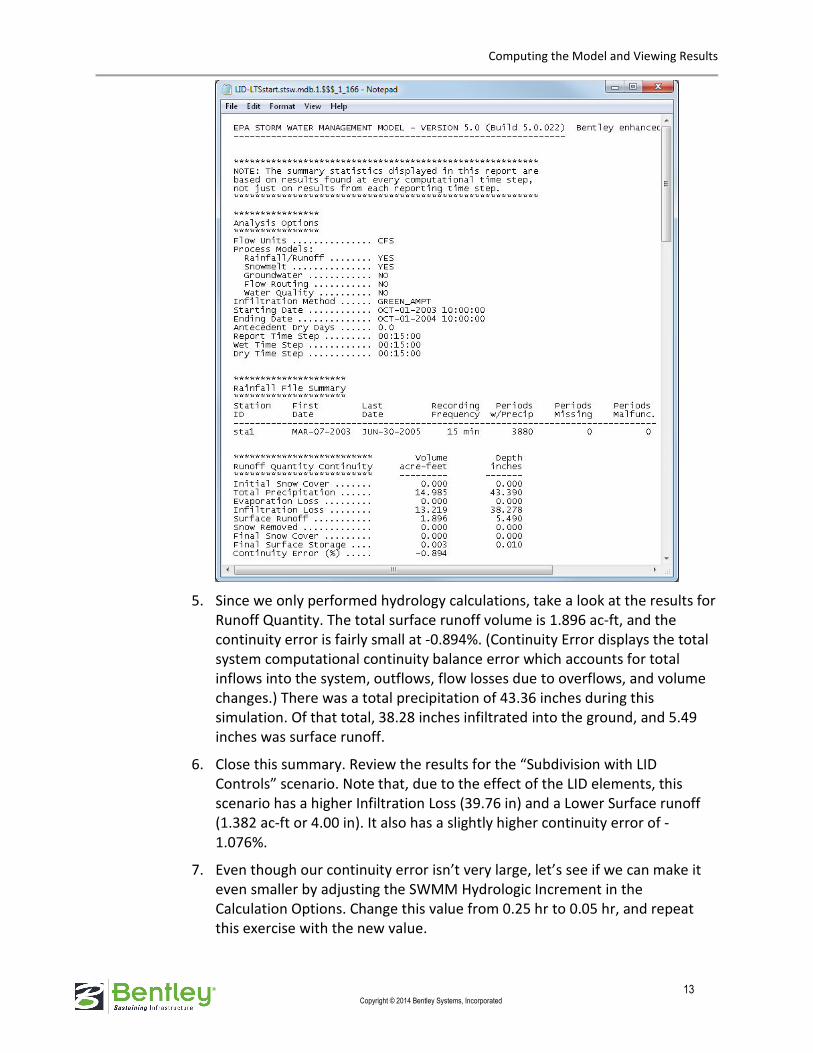
5. Since we only performed hydrology calculations, take a look at the results for
Runoff Quantity. The total surface runoff volume is 1.896 ac-ft, and the
continuity error is fairly small at -0.894%. (Continuity Error displays the total
system computational continuity balance error which accounts for total
inflows into the system, outflows, flow losses due to overflows, and volume
changes.) There was a total precipitation of 43.36 inches during this
simulation. Of that total, 38.28 inches infiltrated into the ground, and 5.49
inches was surface runoff.
6. Close this summary. Review the results for the “Subdivision with LID
Controls” scenario. Note that, due to the effect of the LID elements, this
scenario has a higher Infiltration Loss (39.76 in) and a Lower Surface runoff
(1.382 ac-ft or 4.00 in). It also has a slightly higher continuity error of -
1.076%.
7. Even though our continuity error isn’t very large, let’s see if we can make it
even smaller by adjusting the SWMM Hydrologic Increment in the
Calculation Options. Change this value from 0.25 hr to 0.05 hr, and repeat
this exercise with the new value.

Computing the Model and Viewing Results
14 Copyright © 2014 Bentley Systems, Incorporated
8. Compare runoff volume results for the new runs (summarized below). The
continuity error is considerably smaller with the reduced hydrologic
increment.
Without LID With LID
Total Precipitation (ac-ft) 14.985 14.985
Infiltration Loss (ac-ft) 13.162 14.286
Surface Runoff (ac-ft) 1.839 0.724
Continuity Error (%) -0.13 -0.387
� Exercise: Graphing results
1. Use the Find tool in the Properties manager to locate the outfall element,
named Outlet.
2. Select the outfall element, and then choose View > Graphs. In the
Presentation manager, on the Graph tab, select the New button.

Computing the Model and Viewing Results
15 Copyright © 2014 Bentley Systems, Incorporated
3. A default graph of flow vs. time at the outfall appears. Click the Graph Series
Options button . In the Graph Series Options dialog, select both
scenarios.
4. Click OK on the Graph Series Options dialog to view the graph.
5. To change the units on the graph, first click the Data tab. Then, right-click the
Time (hours) column heading, and select Units and Formatting to bring up
the Set Field Options dialog. Set the Date/Time Format to Short Date & Short
Time using the dropdown menu.
Computing the Model and Viewing Results
16 Copyright © 2014 Bentley Systems, Incorporated
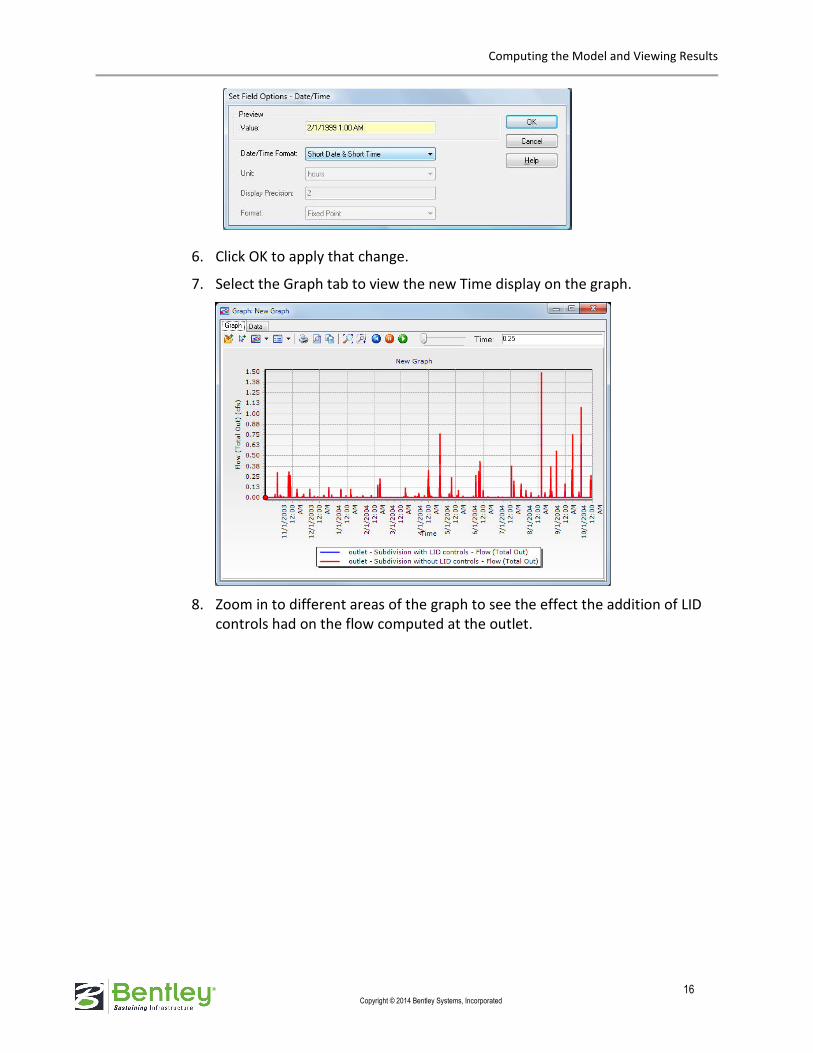
6. Click OK to apply that change.
7. Select the Graph tab to view the new Time display on the graph.
8. Zoom in to different areas of the graph to see the effect the addition of LID
controls had on the flow computed at the outlet.
Computing the Model and Viewing Results
17 Copyright © 2014 Bentley Systems, Incorporated
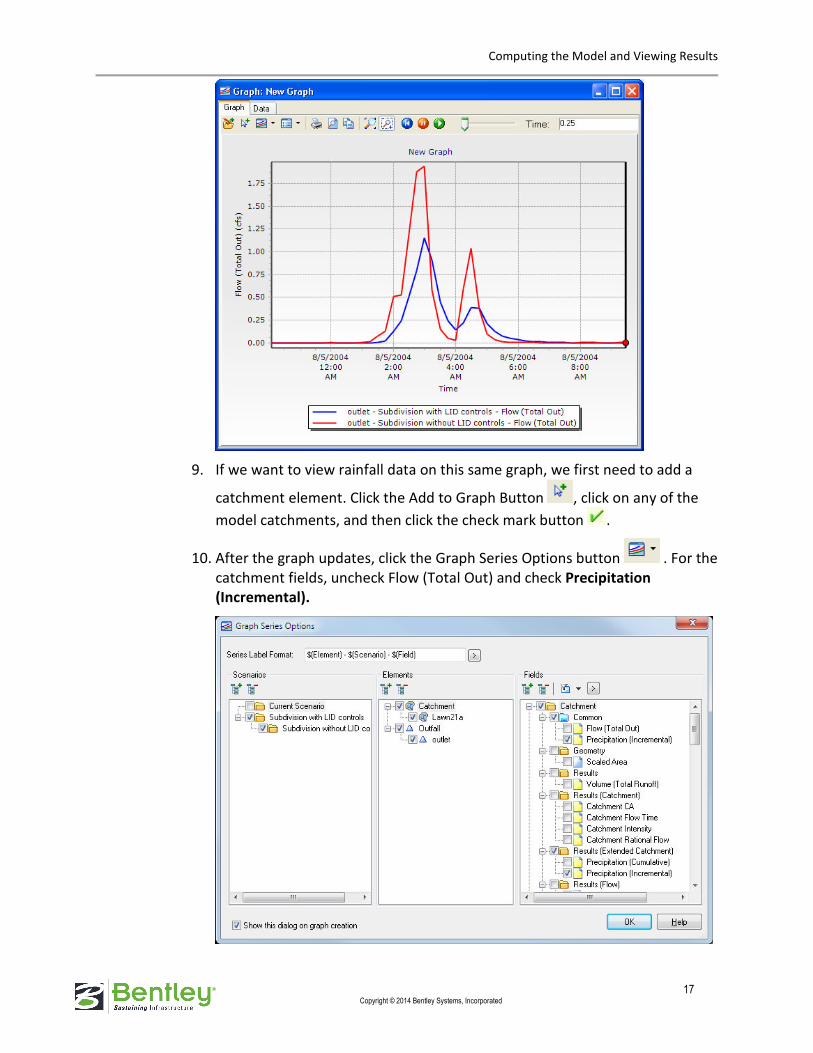
9. If we want to view rainfall data on this same graph, we first need to add a
catchment element. Click the Add to Graph Button , click on any of the
model catchments, and then click the check mark button .
10. After the graph updates, click the Graph Series Options button . For the
catchment fields, uncheck Flow (Total Out) and check Precipitation
(Incremental).

Statistics
18 Copyright © 2014 Bentley Systems, Incorporated
11. Your graph now has a y-axis for both flow and precipitation depth, and
should look similar to the one shown below.
12. Close the graph when you are done reviewing the data.
Statistics
Modelers are often required to summarize the results of long term simulations in
terms of parameters such as number of overflows, volume discharged or other
similar properties. CivilStorm can automatically perform statistical frequency
analysis of the results of each element in model, or the system as a whole, and
report the results of this analysis.
A statistical report can then be generated from the time series of simulation results.
� Exercise: Reviewing statistical data
1. Make Subdivision without LID Controls the current scenario.
2. Open the Statistics Manager by selecting Analysis > Statistics.
Statistics
19 Copyright © 2014 Bentley Systems, Incorporated
The Statistics manager lets you add, edit, remove and manage the statistics
settings that are associated with the project. The dialog box contains a list
pane that displays each of the statistics currently contained within the
project, along with a toolbar.
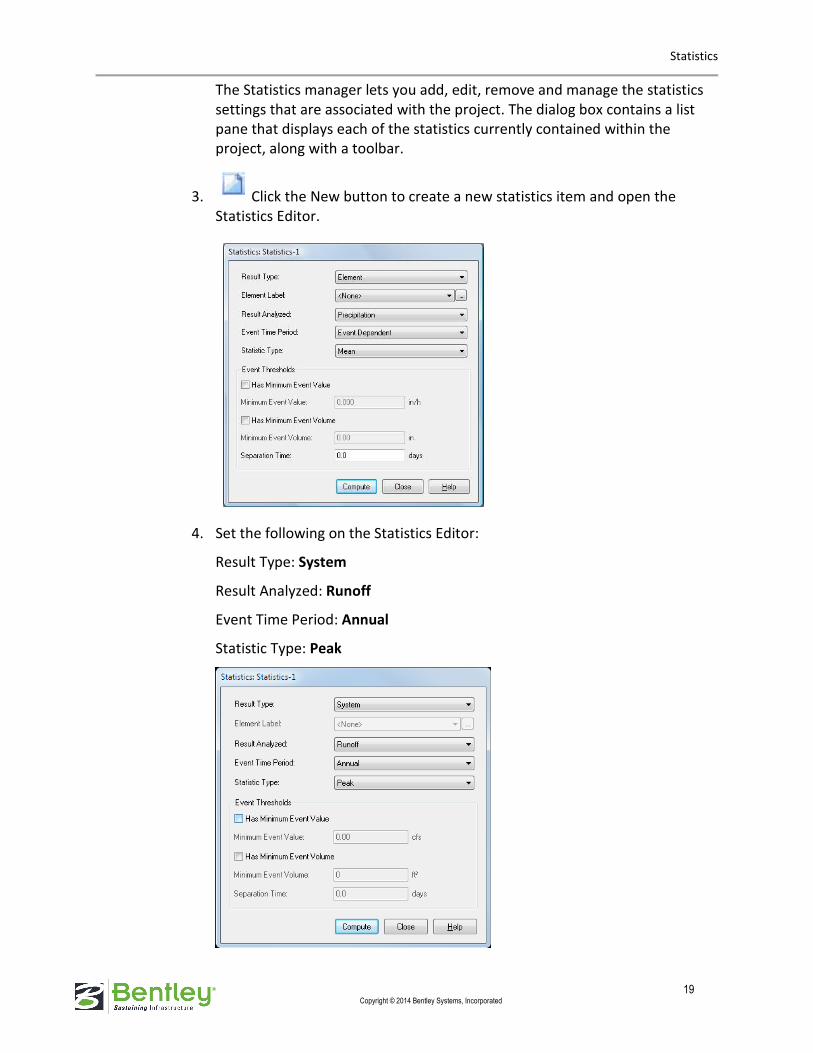
3. Click the New button to create a new statistics item and open the
Statistics Editor.
4. Set the following on the Statistics Editor:
Result Type: System
Result Analyzed: Runoff
Event Time Period: Annual
Statistic Type: Peak
Statistics
20 Copyright © 2014 Bentley Systems, Incorporated
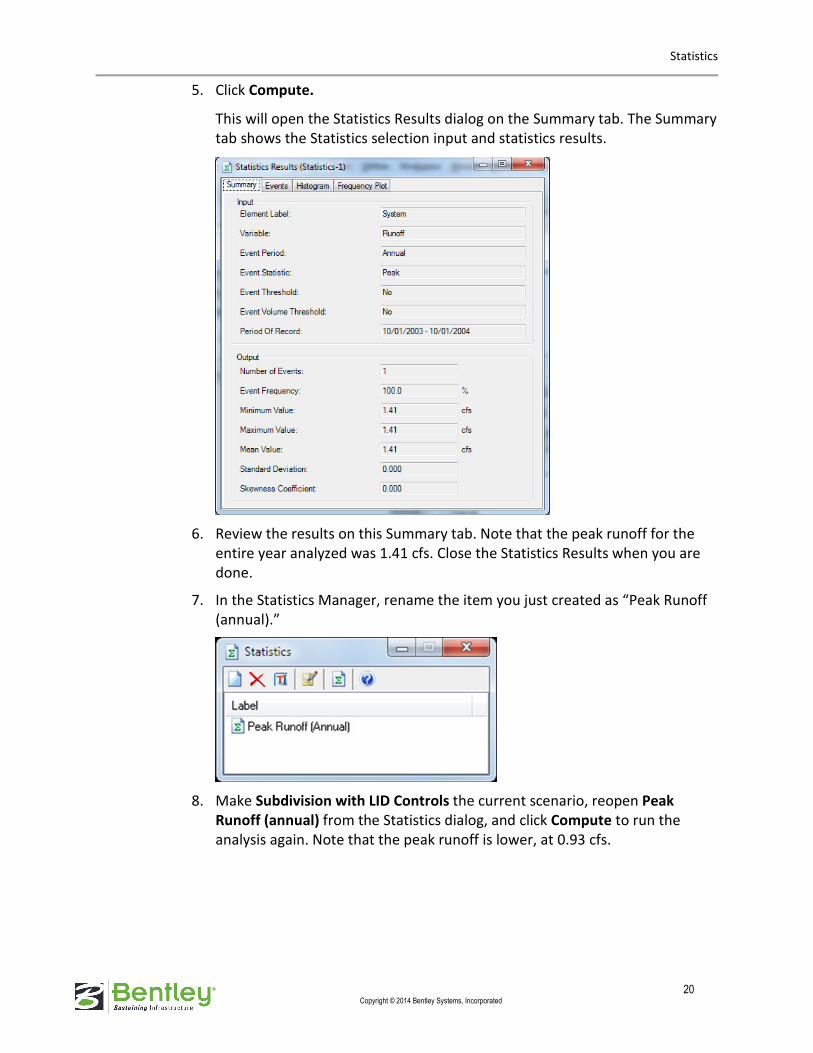
5. Click Compute.
This will open the Statistics Results dialog on the Summary tab. The Summary
tab shows the Statistics selection input and statistics results.
6. Review the results on this Summary tab. Note that the peak runoff for the
entire year analyzed was 1.41 cfs. Close the Statistics Results when you are
done.
7. In the Statistics Manager, rename the item you just created as “Peak Runoff
(annual).”
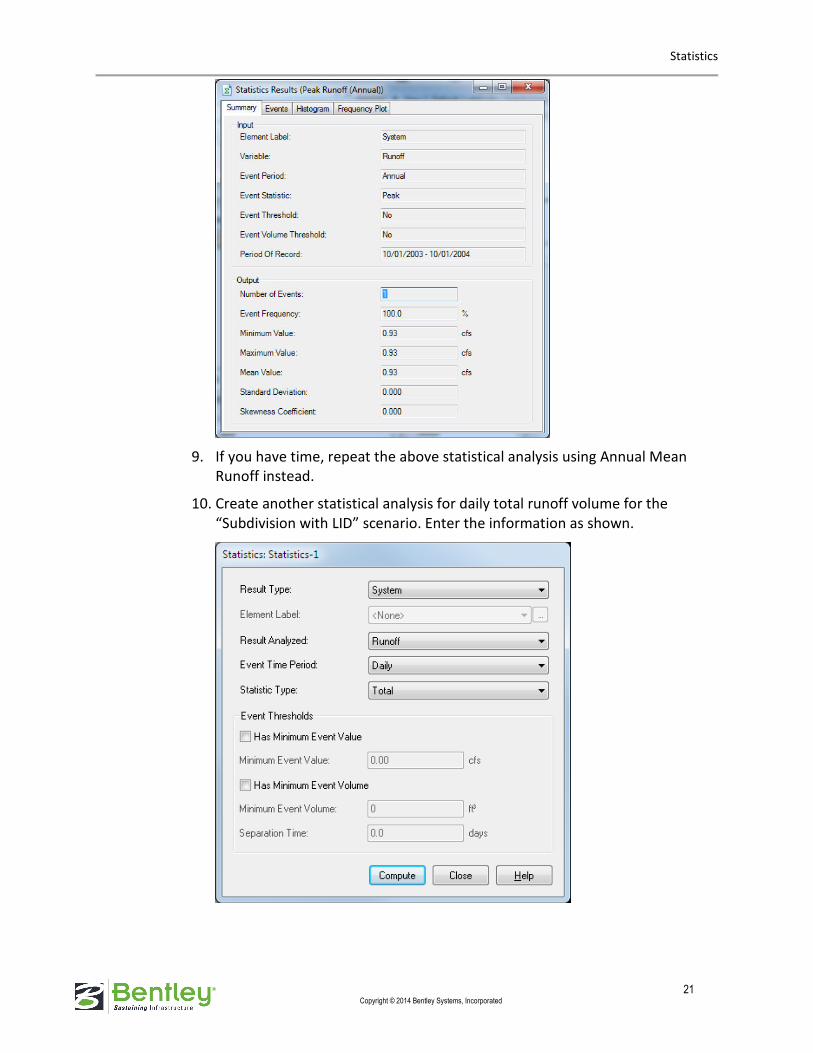
8. Make Subdivision with LID Controls the current scenario, reopen Peak
Runoff (annual) from the Statistics dialog, and click Compute to run the
analysis again. Note that the peak runoff is lower, at 0.93 cfs.
Statistics
21 Copyright © 2014 Bentley Systems, Incorporated
9. If you have time, repeat the above statistical analysis using Annual Mean
Runoff instead.
10. Create another statistical analysis for daily total runoff volume for the
“Subdivision with LID” scenario. Enter the information as shown.
Statistics
22 Copyright © 2014 Bentley Systems, Incorporated
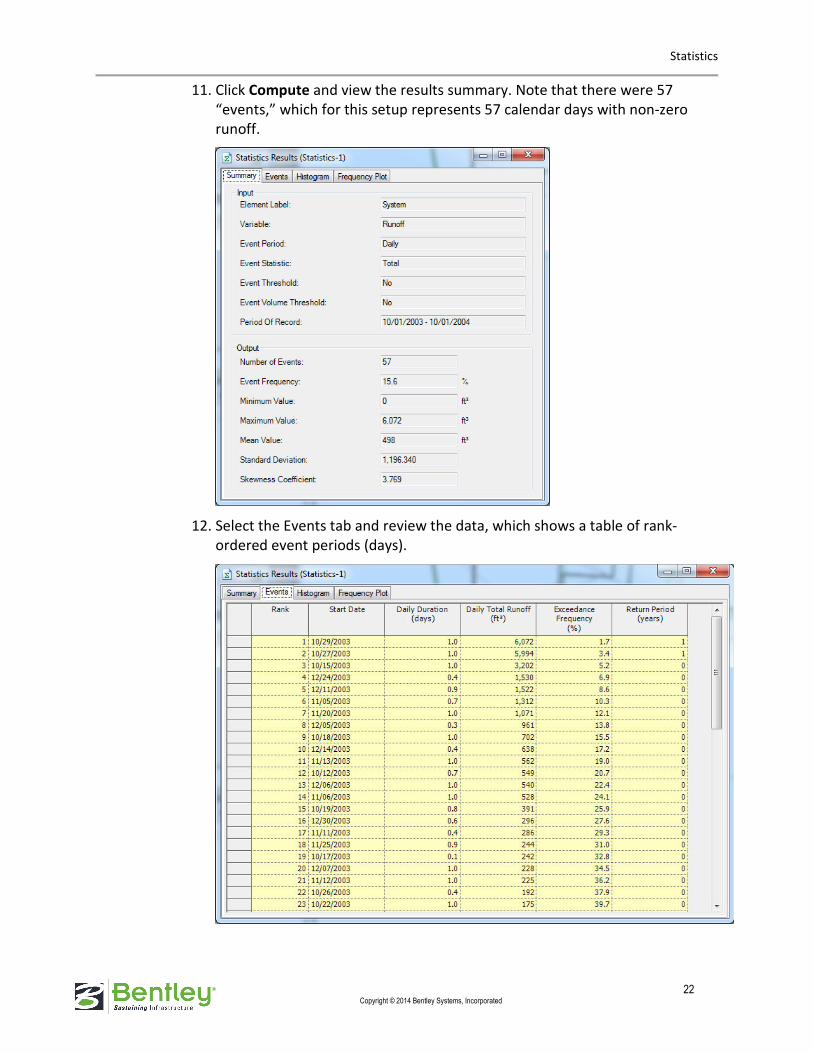
11. Click Compute and view the results summary. Note that there were 57
“events,” which for this setup represents 57 calendar days with non-zero
runoff.
12. Select the Events tab and review the data, which shows a table of rank-
ordered event periods (days).

Statistics
23 Copyright © 2014 Bentley Systems, Incorporated
13. Data can also be viewed graphically on the Histogram and Frequency Plot
tabs. For this analysis, note that the histogram’s Percent of Total and the
frequency plot’s Exceedance Frequency are computed relative to the number
of “events” (57 in this case), not the total number of days, which may be
misleading.

Assessment
24 Copyright © 2014 Bentley Systems, Incorporated
Assessment
1. What type of Low Impact Development Controls can be modeled in CivilStorm?
2. Low impact development as implementedin the software are based on the calculation
methods used in EPA SWMM Version 5.0, True or False?
3. What feature in CivilStorm allows you to compute multiple scenarios simultaneously?
4. What tool in CivilStorm allows you to summarize the results of long term continuous
simulation in terms of parameters?
5. Can low impact development controls created in one file be used in other model files?

Answer Key
25 Copyright © 2014 Bentley Systems, Incorporated
Answer Key
1. What type of Low Impact Development Controls can be modeled in CivilStorm?
Bio-retention Cell, Infiltration Trench, Porous Pavement, Rain Barrel and Vege-
tative Swales
2. Low impact development as implementedin the software are based on the calculation
methods used in EPA SWMM Version 5.0, True or False?
TRUE
3. What feature in CivilStorm allows you to compute multiple scenarios simultaneously?
Bath Run
4. What tool in CivilStorm allows you to summarize the results of long term continuous
simulation in terms of parameters?
Statistics
5. Can low impact development controls created in one file be used in other model files?
TRUE