Low gauge pressure comparisons between MIKES, Metrosert ...
22
J2/2007 Low gauge pressure comparisons between MIKES, Metrosert and FORCE Technology Range -2000 Pa to +2000 Pa, gauge Report on EUROMET Project 921 Markku Rantanen, Sari Semenoja, Guliko Peterson and Jesper Busk Mittatekniikan keskus Espoo 2007
Transcript of Low gauge pressure comparisons between MIKES, Metrosert ...
J2/2007
Low gauge pressure comparisons between MIKES, Metrosert and FORCE Technology
Range -2000 Pa to +2000 Pa, gauge
Report on EUROMET Project 921
Markku Rantanen, Sari Semenoja, Guliko Peterson and Jesper Busk
Mittatekniikan keskus
Espoo 2007

Publication J2/2007
Low gauge pressure comparisons between MIKES, Metrosert and FORCE Technology
Range -2000 Pa to +2000 Pa
Report on EUROMET Project 921
Markku Rantanen1 Sari Semenoja1
Guliko Peterson2 Jesper Busk3
1 Centre for Metrology and Accreditation (MIKES) 2 AS Metrosert
3 FORCE Technology
Mittatekniikan keskus Centre for Metrology and Accreditation
Espoo 2007


Abstract
MIKES (FI), Metrosert (EE) and FORCE Technology (DK) compared their low gauge pressures in 2006. The reference standards of the three laboratories for low gauge pressures apply dissimilar operating principles: a digital piston manometer at MIKES, a water column manometer at Metrosert and a diving bell-type standard at FORCE Technology. The comparison covered the range from -2000 Pa to + 2000 Pa. The transfer standard was a Furness FCO510 micro-manometer. The stability of the transfer standard was not as good as expected. The results of MIKES and Metrosert were in a good agreement except at nominal pressures -20 Pa and +20 Pa where the absolute values for the normalised error En were slightly higher than 1. The uncertainties given for the Metrosert results at these nominal pressures were much lower than the accredited uncertainties at present. The results of MIKES and FORCE Technology in the range from -200 Pa to +200 Pa were in a good agreement, using the uncertainties given in the CMC tables. The re-sults outside this range could not be assessed due to the instability of the transfer standard.

Contents
1 Introduction 7 2 Transfer standard 7 3 Measurement instructions 8 4 Low gauge pressure standard of MIKES 8 5 Stability of transfer standard and calculation of reference values 9 6 Measurements at Metrosert 11 7 Measurements at FORCE Technology 14 8 Conclusions 17 9 References 17


7
MIKES Publication J2/2007 M. Rantanen, S. Semenoja, G. Peterson, J. Busk: Low gauge…
1 Introduction
A comparison on low gauge pressures between MIKES and Metrosert was agreed in the meeting of the Baltic and Nordic national pressure laboratories, held on April 20th 2006 at MIKES. Later, FORCE Technology of Denmark joined in the comparison, which was registered as EUROMET Project number 921. The transfer standard, a Furness FCO510 micro-manometer for the range -2000 Pa to + 2000 Pa was provided by MIKES. The measurements were made between 28th of August and 12th of October 2006:
MIKES 1 28.8.2006 MIKES 2 4.9.2006 Metrosert 18.9.-20.9.2006 MIKES 3 22.9.2006 FORCE 5.-6.10.2006 MIKES 4 12.10.2006.
Gauge pressure is measured on a scale where zero is set to the ambient atmospheric pressure. Pressure modes are illustrated in Figure 1.
Fig. 1. Pressure modes [1]
2 Transfer standard
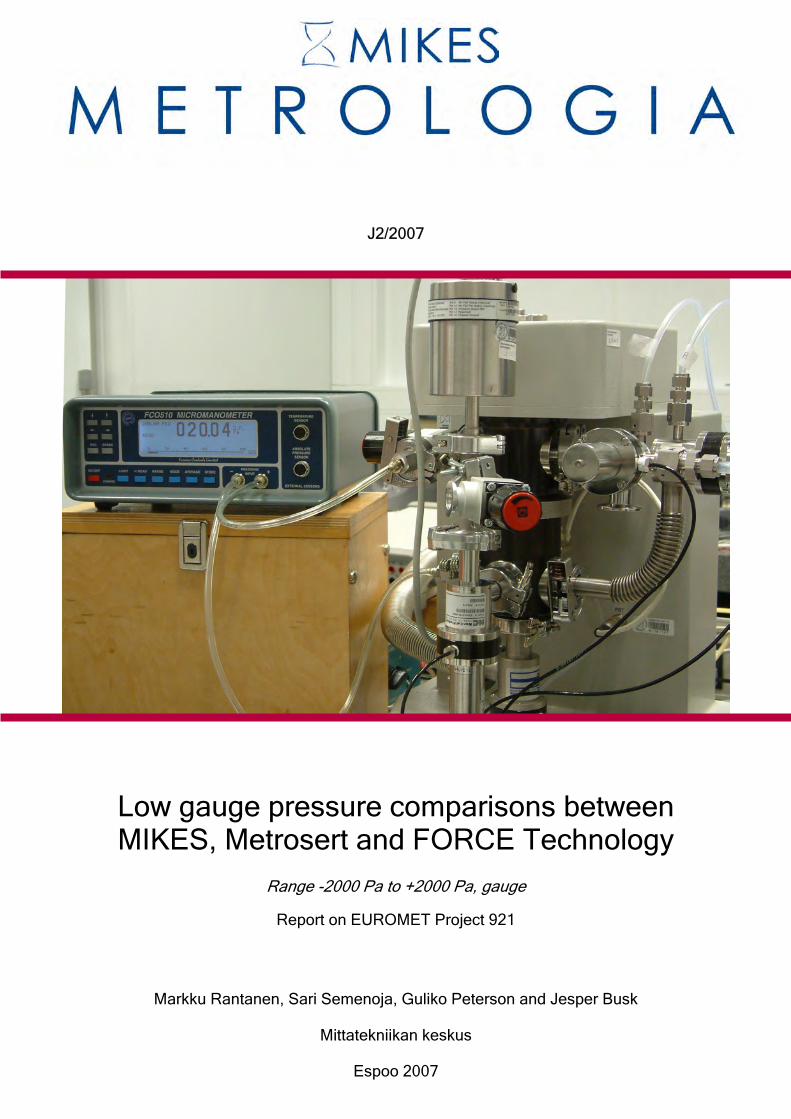
The transfer standard, micro-manometer Furness FCO 510 s/n 406144 was purchased to MIKES in 2004 originally for measurements on air conditioning systems in the new laboratory premises. There are two pressure measurement ranges in a Furness FCO510. One is from -2000 Pa to +2000 Pa with the resolution of the display 0,1 Pa and the other from -200 Pa to +200 Pa with the resolution of 0,01 Pa.
8
MIKES Publication J2/2007 M. Rantanen, S. Semenoja, G. Peterson, J. Busk: Low gauge…
3 Measurement instructions
As the transfer standard was known to have some hysteresis, only increasing pres-sures were selected as nominal pressures on the positive side, and decreasing pres-sures in the negative side, respectively. The following nominal pressures were specified: Range –200 Pa to +200 Pa: -200 Pa, -100 Pa, -50 Pa, -20 Pa, +20 Pa, +50 Pa, +100 Pa and +200 Pa Range -2000 Pa to +2000 Pa: -2000 Pa, -1500 Pa, -1000 Pa, -500 Pa, +500 Pa, +1000 Pa, +1500 Pa and +2000 Pa
4 Low gauge pressure standard of MIKES
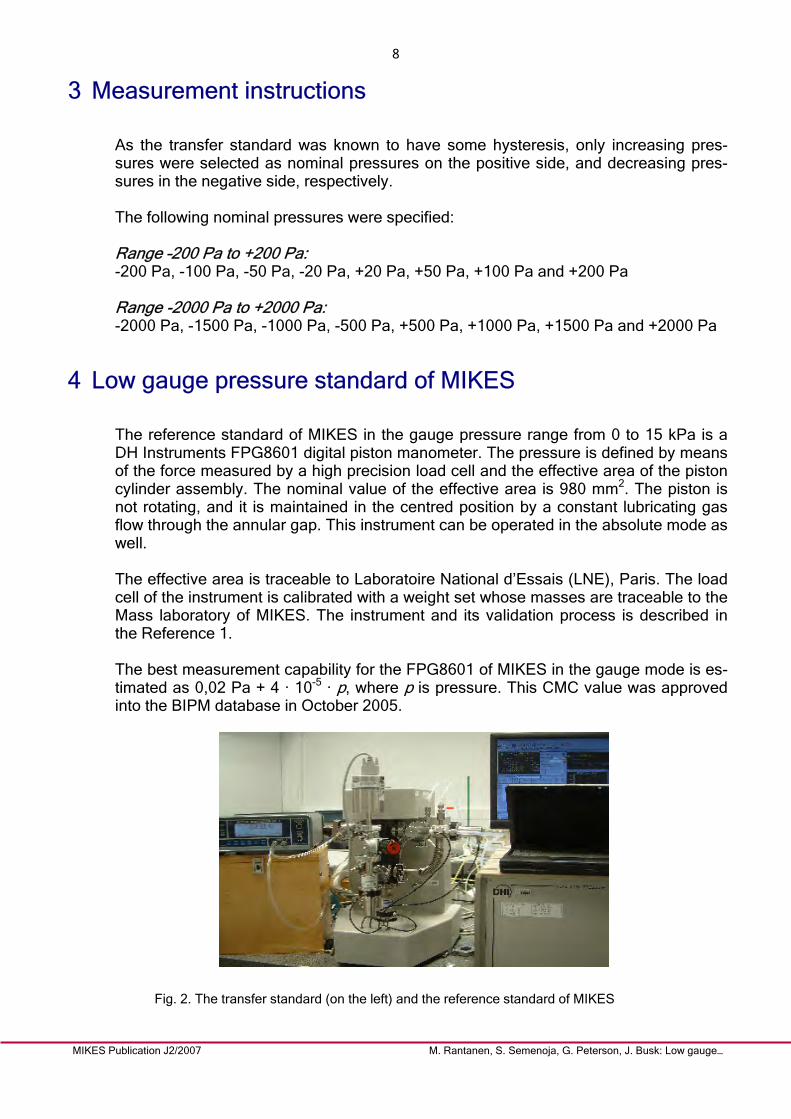
The reference standard of MIKES in the gauge pressure range from 0 to 15 kPa is a DH Instruments FPG8601 digital piston manometer. The pressure is defined by means of the force measured by a high precision load cell and the effective area of the piston cylinder assembly. The nominal value of the effective area is 980 mm2. The piston is not rotating, and it is maintained in the centred position by a constant lubricating gas flow through the annular gap. This instrument can be operated in the absolute mode as well. The effective area is traceable to Laboratoire National d’Essais (LNE), Paris. The load cell of the instrument is calibrated with a weight set whose masses are traceable to the Mass laboratory of MIKES. The instrument and its validation process is described in the Reference 1. The best measurement capability for the FPG8601 of MIKES in the gauge mode is es-timated as 0,02 Pa + 4 · 10-5 · p, where p is pressure. This CMC value was approved into the BIPM database in October 2005.
Fig. 2. The transfer standard (on the left) and the reference standard of MIKES

9
MIKES Publication J2/2007 M. Rantanen, S. Semenoja, G. Peterson, J. Busk: Low gauge…
5 Stability of transfer standard and calculation of reference values
The four measurements at MIKES showed that the stability of the transfer standard was much worse than expected. The results of the MIKES measurements are shown in Figures 3 and 4. Each result point is the deviation of the transfer standard indication from the pressure defined by the MIKES standard: Deviation = transfer standard indication – pressure from MIKES standard
Furness FCO510 range -2000 Pa to + 2000 Pa
-4
-3
-2
-1
0
1
2
3
4
-2500 -2000 -1500 -1000 -500 0 500 1000 1500 2000 2500
Nominal pressure [Pa]
Dev
iatio
n fr
om M
IKES
sta
ndar
d [P
a]
M1 28.8.2006 M2 4.9.2006 M3 22.9.2006 M4 12.10.2006
Fig. 3. MIKES results in the range from –2000 Pa to +2000 Pa.
Furness FCO510 range -200 Pa to + 200 Pa
-0,5
-0,4
-0,3
-0,2
-0,1
0,0
0,1
0,2
0,3
0,4
0,5
-250 -200 -150 -100 -50 0 50 100 150 200 250
Nominal pressure [Pa]
Dev
iatio
n fr
om M
IKES
sta
ndar
d [P
a]
M1 28.8.2006 M2 4.9.2006 M3 22.9.2006 M4 12.10.2006
Fig. 4 MIKES results in the range from -200 Pa to +200 Pa.
10
MIKES Publication J2/2007 M. Rantanen, S. Semenoja, G. Peterson, J. Busk: Low gauge…
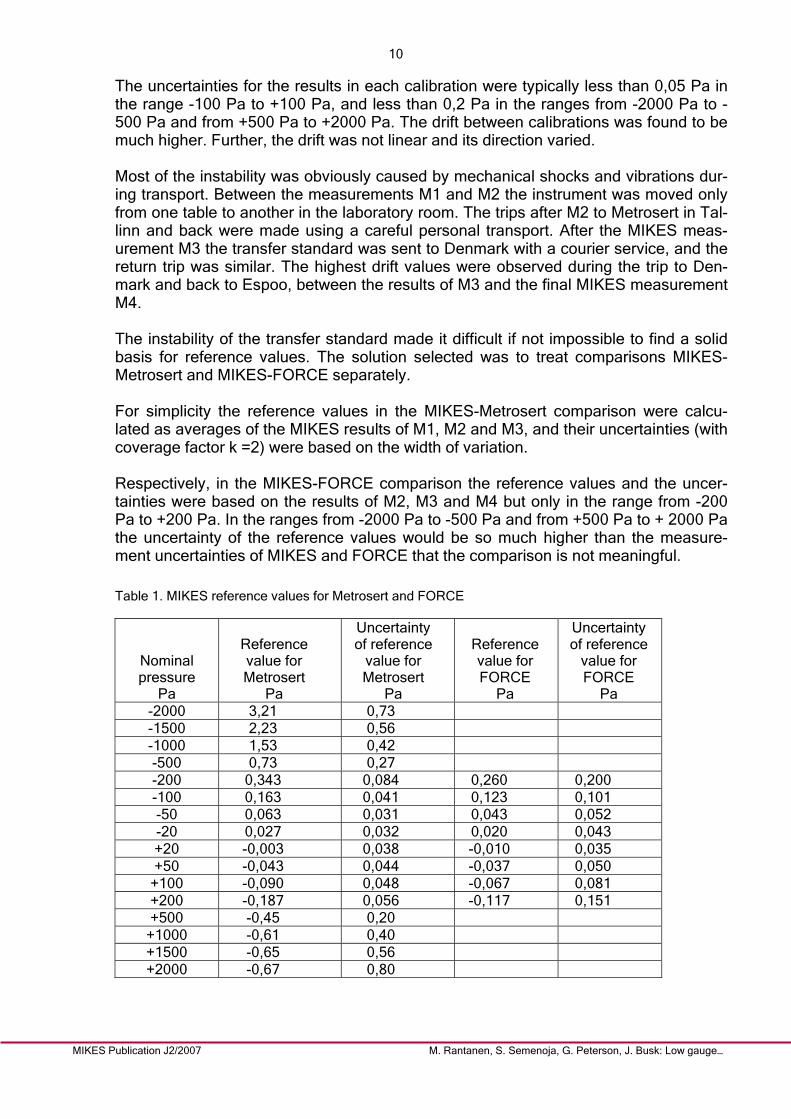
The uncertainties for the results in each calibration were typically less than 0,05 Pa in the range -100 Pa to +100 Pa, and less than 0,2 Pa in the ranges from -2000 Pa to -500 Pa and from +500 Pa to +2000 Pa. The drift between calibrations was found to be much higher. Further, the drift was not linear and its direction varied. Most of the instability was obviously caused by mechanical shocks and vibrations dur-ing transport. Between the measurements M1 and M2 the instrument was moved only from one table to another in the laboratory room. The trips after M2 to Metrosert in Tal-linn and back were made using a careful personal transport. After the MIKES meas-urement M3 the transfer standard was sent to Denmark with a courier service, and the return trip was similar. The highest drift values were observed during the trip to Den-mark and back to Espoo, between the results of M3 and the final MIKES measurement M4. The instability of the transfer standard made it difficult if not impossible to find a solid basis for reference values. The solution selected was to treat comparisons MIKES-Metrosert and MIKES-FORCE separately. For simplicity the reference values in the MIKES-Metrosert comparison were calcu-lated as averages of the MIKES results of M1, M2 and M3, and their uncertainties (with coverage factor k =2) were based on the width of variation. Respectively, in the MIKES-FORCE comparison the reference values and the uncer-tainties were based on the results of M2, M3 and M4 but only in the range from -200 Pa to +200 Pa. In the ranges from -2000 Pa to -500 Pa and from +500 Pa to + 2000 Pa the uncertainty of the reference values would be so much higher than the measure-ment uncertainties of MIKES and FORCE that the comparison is not meaningful.
Table 1. MIKES reference values for Metrosert and FORCE
Nominal pressure
Pa
Reference value for Metrosert
Pa
Uncertainty of reference
value for Metrosert
Pa
Reference value for FORCE
Pa
Uncertainty of reference
value for FORCE
Pa -2000 3,21 0,73 -1500 2,23 0,56 -1000 1,53 0,42 -500 0,73 0,27 -200 0,343 0,084 0,260 0,200 -100 0,163 0,041 0,123 0,101 -50 0,063 0,031 0,043 0,052 -20 0,027 0,032 0,020 0,043 +20 -0,003 0,038 -0,010 0,035 +50 -0,043 0,044 -0,037 0,050
+100 -0,090 0,048 -0,067 0,081 +200 -0,187 0,056 -0,117 0,151 +500 -0,45 0,20
+1000 -0,61 0,40 +1500 -0,65 0,56 +2000 -0,67 0,80
11
MIKES Publication J2/2007 M. Rantanen, S. Semenoja, G. Peterson, J. Busk: Low gauge…
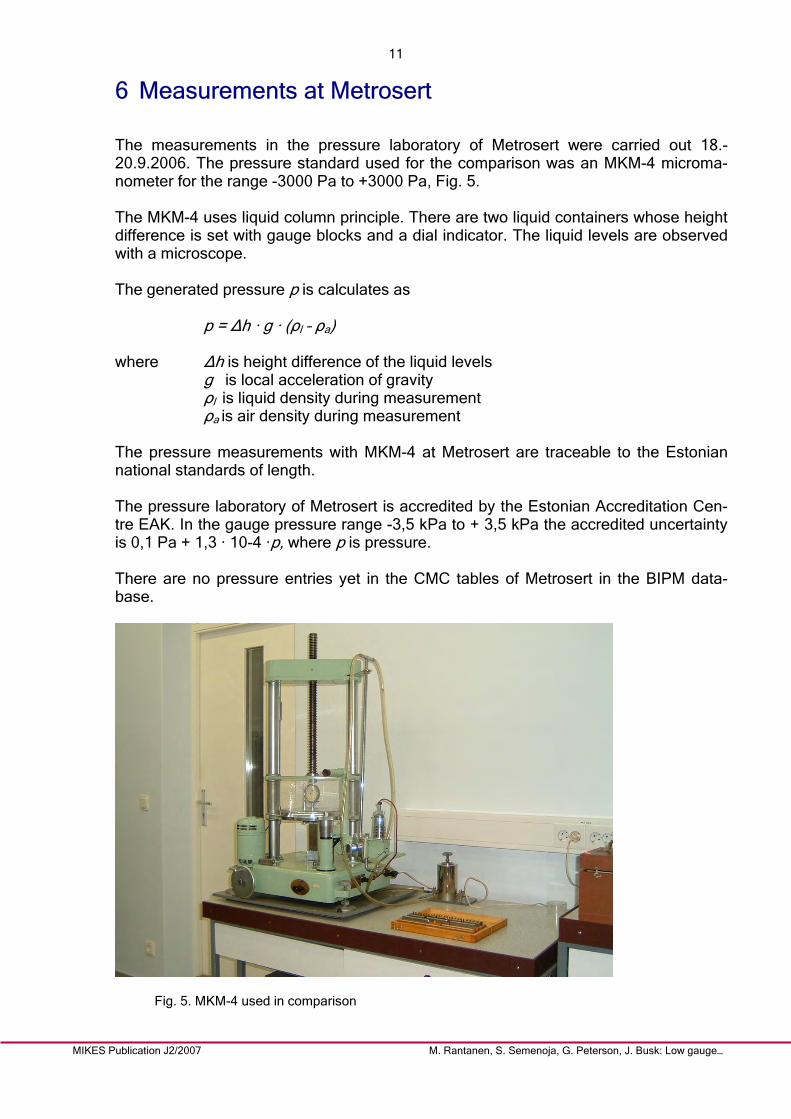
6 Measurements at Metrosert
The measurements in the pressure laboratory of Metrosert were carried out 18.-20.9.2006. The pressure standard used for the comparison was an MKM-4 microma-nometer for the range -3000 Pa to +3000 Pa, Fig. 5. The MKM-4 uses liquid column principle. There are two liquid containers whose height difference is set with gauge blocks and a dial indicator. The liquid levels are observed with a microscope. The generated pressure p is calculates as p = ∆h · g · (ρl – ρa) where ∆h is height difference of the liquid levels g is local acceleration of gravity ρl is liquid density during measurement ρa is air density during measurement The pressure measurements with MKM-4 at Metrosert are traceable to the Estonian national standards of length. The pressure laboratory of Metrosert is accredited by the Estonian Accreditation Cen-tre EAK. In the gauge pressure range -3,5 kPa to + 3,5 kPa the accredited uncertainty is 0,1 Pa + 1,3 · 10-4 ·p, where p is pressure. There are no pressure entries yet in the CMC tables of Metrosert in the BIPM data-base.
Fig. 5. MKM-4 used in comparison

12
MIKES Publication J2/2007 M. Rantanen, S. Semenoja, G. Peterson, J. Busk: Low gauge…
The results of Metrosert (as deviations of the transfer standard indications from the pressures defined by the Metrosert standard) and their uncertainties are shown in Ta-ble 2 and in Figures 6 and 7. In the range from -200 Pa to + 200 Pa the given uncer-tainties are smaller than the accredited ones.
Table 2. The results of Metrosert and corresponding normalised errors.
Nominal pressure
Pa
Result = deviation
Pa
Uncertainty of result
Pa
Reference value
Pa
Uncertainty of ref. value
Pa
Normalised error E(n)
-2000 3,1 0,5 3,21 0,73 -0,12 -1500 2,2 0,4 2,23 0,56 -0,05 -1000 1,6 0,3 1,53 0,42 0,13 -500 0,7 0,2 0,73 0,27 -0,08 -200 0,33 0,03 0,343 0,084 -0,15 -100 0,14 0,03 0,163 0,041 -0,46 -50 0,04 0,02 0,063 0,031 -0,64 -20 -0,02 0,02 0,027 0,032 -1,23 +20 0,05 0,02 -0,003 0,038 1,25 +50 0,00 0,03 -0,043 0,044 0,81
+100 -0,04 0,04 -0,090 0,048 0,8 +200 -0,18 0,06 -0,187 0,056 0,08 +500 -0,50 0,3 -0,45 0,20 -0,15
+1000 -0,80 0,3 -0,61 0,40 -0,38 +1500 -1,00 0,3 -0,65 0,56 -0,55 +2000 -1,00 0,3 -0,67 0,80 -0,39
MIKES-Metrosert
Pressures -2000 Pa to -500 Pa and +500 Pa to +2000 Pa
-1,0
-0,8
-0,6
-0,4
-0,2
0,0
0,2
0,4
0,6
0,8
1,0
-2500 -2000 -1500 -1000 -500 0 500 1000 1500 2000 2500
Nominal pressure [Pa]
Dev
iatio
n fr
om re
f. [P
a]
M 2 Metrosert Ref.= Avg. M1 to M3 M 3
Fig. 6. Metrosert results compared to MIKES results.
13
MIKES Publication J2/2007 M. Rantanen, S. Semenoja, G. Peterson, J. Busk: Low gauge…
MIKES-Metrosert -200 Pa to + 200 Pa
-0,15
-0,10
-0,05
0,00
0,05
0,10
0,15
-250 -200 -150 -100 -50 0 50 100 150 200 250
Nominal pressure [Pa]
Dev
iatio
n fr
om re
f. [P
a]
M2 Metrosert Ref. = Avg. M1 to M3 M3
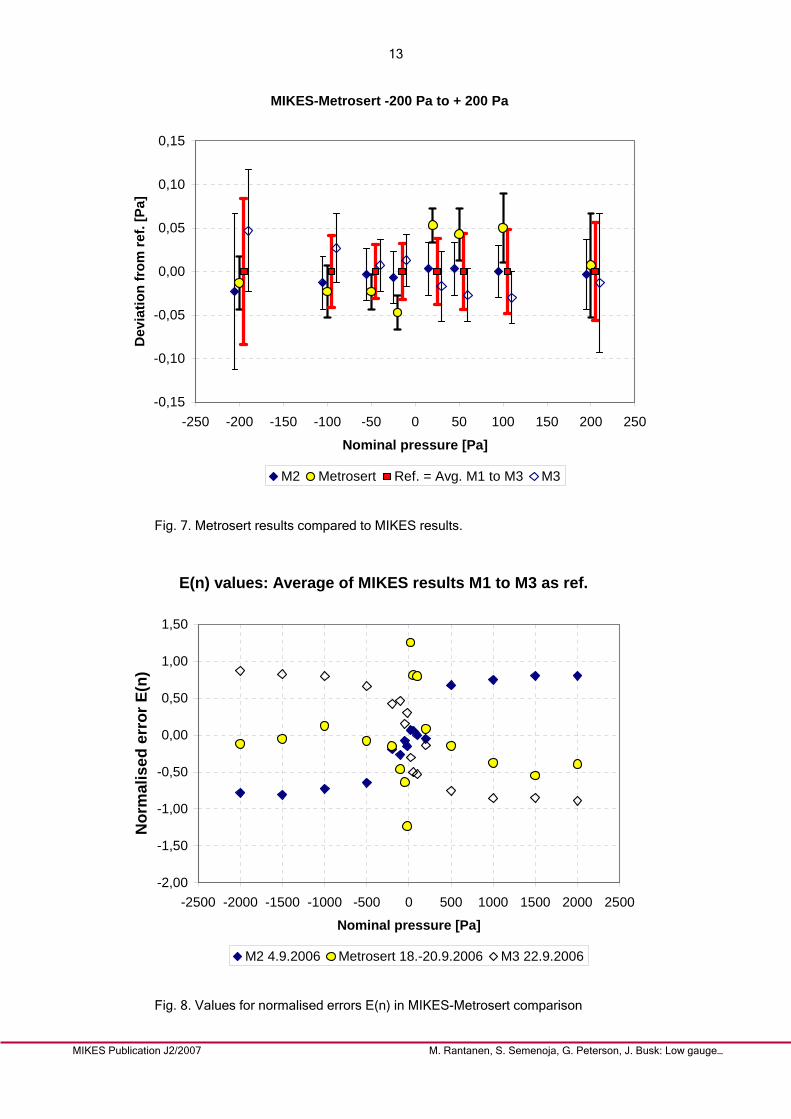
Fig. 7. Metrosert results compared to MIKES results.
E(n) values: Average of MIKES results M1 to M3 as ref.
-2,00
-1,50
-1,00
-0,50
0,00
0,50
1,00
1,50
-2500 -2000 -1500 -1000 -500 0 500 1000 1500 2000 2500
Nominal pressure [Pa]
Nor
mal
ised
err
or E
(n)
M2 4.9.2006 Metrosert 18.-20.9.2006 M3 22.9.2006
Fig. 8. Values for normalised errors E(n) in MIKES-Metrosert comparison
14
MIKES Publication J2/2007 M. Rantanen, S. Semenoja, G. Peterson, J. Busk: Low gauge…
A tool often used in analysing results from inter-laboratory comparisons is the normal-ised error En, which takes into account both the result and its uncertainty. The normal-ised error En is calculated as
( ) ( )( )22
reflab
refstdtransferlabstdtransfer
nUU
ppppE
+
−−−=
where ptransfer is pressure indicated by the transfer standard, pstd is the pressure of the laboratory standard, Ulab is the uncertainty of the laboratory result, and Uref is the uncertainty of the reference value. The result in an inter-laboratory comparison is regarded as correct within the limits of uncertainty, if the absolute value of the normalised error En is less than 1. The values of normalised errors En for the Metrosert results are given in Table 2 and il-lustrated in Fig. 8. The En –values for all the results were between -1 and +1 except for the results at nominal pressures -20 Pa and + 20 Pa. It must be noted that the uncer-tainties given for the Metrosert results are much smaller than the accredited uncertain-ties at present.
7 Measurements at FORCE Technology
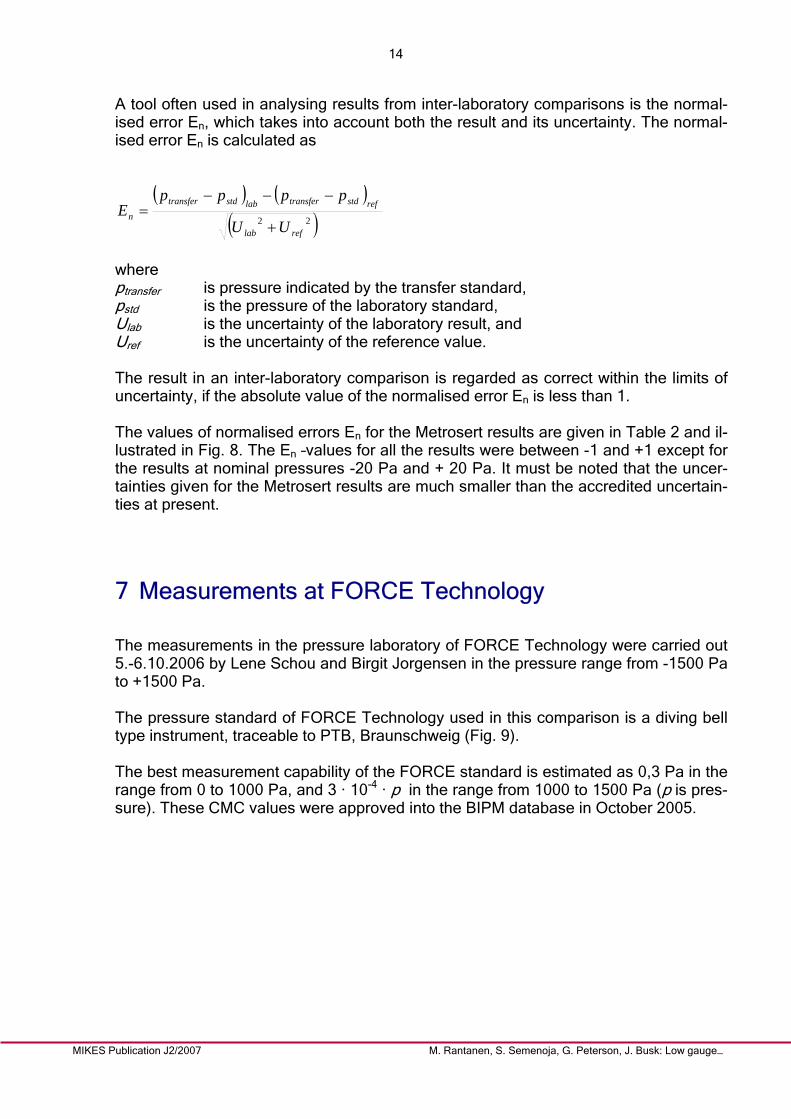
The measurements in the pressure laboratory of FORCE Technology were carried out 5.-6.10.2006 by Lene Schou and Birgit Jorgensen in the pressure range from -1500 Pa to +1500 Pa. The pressure standard of FORCE Technology used in this comparison is a diving bell type instrument, traceable to PTB, Braunschweig (Fig. 9). The best measurement capability of the FORCE standard is estimated as 0,3 Pa in the range from 0 to 1000 Pa, and 3 · 10-4 · p in the range from 1000 to 1500 Pa (p is pres-sure). These CMC values were approved into the BIPM database in October 2005.
15
MIKES Publication J2/2007 M. Rantanen, S. Semenoja, G. Peterson, J. Busk: Low gauge…
Fig.9. The low gauge pressure standard of FORCE Technology.
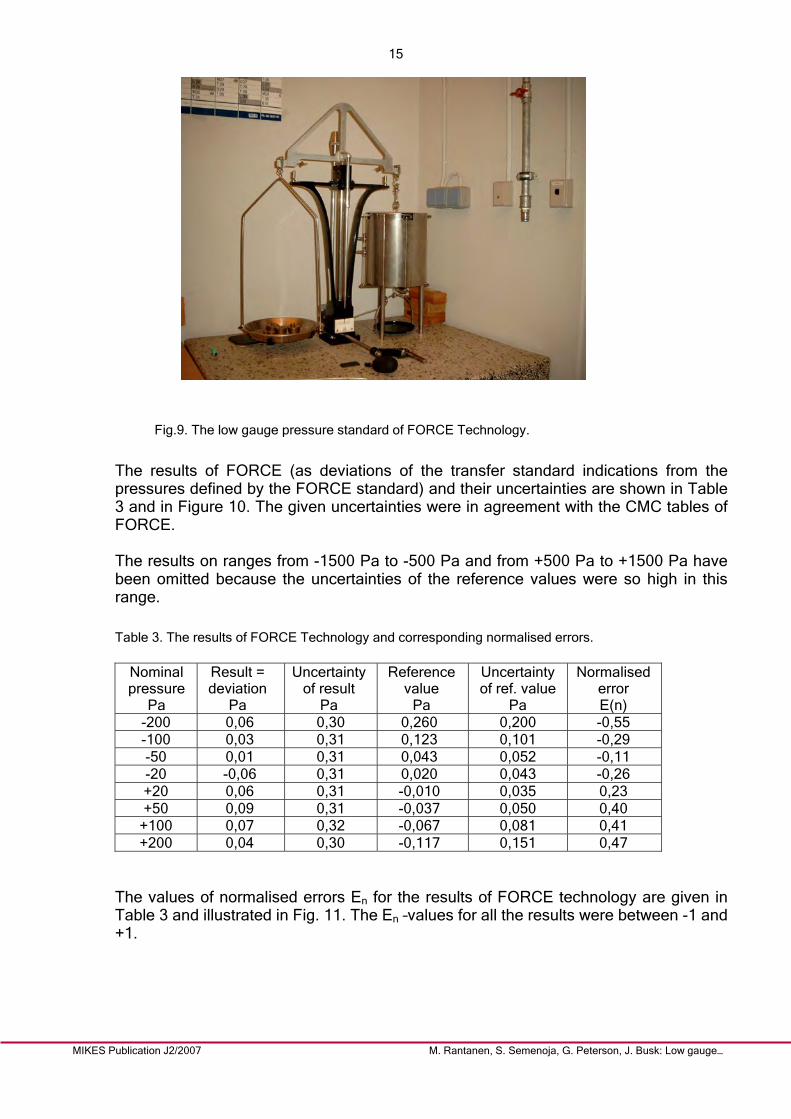
The results of FORCE (as deviations of the transfer standard indications from the pressures defined by the FORCE standard) and their uncertainties are shown in Table 3 and in Figure 10. The given uncertainties were in agreement with the CMC tables of FORCE. The results on ranges from -1500 Pa to -500 Pa and from +500 Pa to +1500 Pa have been omitted because the uncertainties of the reference values were so high in this range.
Table 3. The results of FORCE Technology and corresponding normalised errors.
Nominal pressure
Pa
Result = deviation
Pa
Uncertainty of result
Pa
Reference value
Pa
Uncertainty of ref. value
Pa
Normalised error E(n)
-200 0,06 0,30 0,260 0,200 -0,55 -100 0,03 0,31 0,123 0,101 -0,29 -50 0,01 0,31 0,043 0,052 -0,11 -20 -0,06 0,31 0,020 0,043 -0,26 +20 0,06 0,31 -0,010 0,035 0,23 +50 0,09 0,31 -0,037 0,050 0,40
+100 0,07 0,32 -0,067 0,081 0,41 +200 0,04 0,30 -0,117 0,151 0,47
The values of normalised errors En for the results of FORCE technology are given in Table 3 and illustrated in Fig. 11. The En –values for all the results were between -1 and +1.

16
MIKES Publication J2/2007 M. Rantanen, S. Semenoja, G. Peterson, J. Busk: Low gauge…
MIKES-FORCE -200 Pa to + 200 Pa
-0,6
-0,4
-0,2
0,0
0,2
0,4
0,6
-250 -200 -150 -100 -50 0 50 100 150 200 250
Nominal pressure [Pa]
Dev
iatio
n fr
om re
f. [P
a]
M3 FORCE Ref.= Avg. M2 to M4 M4
Fig.10. Results of FORCE Technology compared to MIKES results.
E(n) values: Average of MIKES results M2 to M4 as ref.
-1,50
-1,00
-0,50
0,00
0,50
1,00
1,50
-250 -200 -150 -100 -50 0 50 100 150 200 250
Nominal pressure [Pa]
Nor
mal
ised
err
or E
(n)
M3 22.9.2006 FORCE 6.10.2006 M4 12.10.2006
Fig. 11. Values for normalised errors E(n) in MIKES-FORCE comparison
17
MIKES Publication J2/2007 M. Rantanen, S. Semenoja, G. Peterson, J. Busk: Low gauge…
8 Conclusions
The transfer standard, a Furness FCO 510 micro-manometer was not as stable as ex-pected. Its uncertainty was too high for a very critical comparison of the measurement capabilities in the ranges from -2000 Pa to -500 Pa and from +500 Pa to +2000 Pa. However, the results of MIKES and Metrosert were in a good agreement in the range from -2000 Pa to + 2000 Pa. Only at nominal pressures -20 Pa and +20 Pa the abso-lute values for the normalised error En were slightly higher than 1. It must be noted that the uncertainties of the Metrosert results in the range from -200 Pa to +200 Pa were much lower than their accredited uncertainties at present. The results of MIKES and FORCE Technology were in a good agreement in the range from -200 Pa to +200 Pa. The uncertainties of the FORCE results were in agreement with their CMC tables. Outside this range the results of FORCE Technology were not assessed due to the high uncertainty of the reference values.
9 References
[1] Guide to the Measurement of Pressure and Vacuum. The Institute of Measurement and
Control, London 1998. 77 p. [2] Semenoja, Sari & Rantanen, Markku: Comparisons to establish a force-balanced piston
gauge and a spinning rotor gauge as the new measurement standards of MIKES. Vac-uum 73(2004) 269 – 274.
[3] Certificates of Calibration M-06P102, M-06P106, M-06P123 and M-06P124. Centre for
Metrology and Accreditation, Espoo 2006 [4] Peterson, Guliko: Pressure comparison in the range -2000 Pa to +2000 Pa. Result of AS
Metrosert. Tallinn 2006
[5] Calibration Certificate no. 9.1A-7500. FORCE Technology, Division for Quality and Me-trology, Broendby, 2006


Recent publications
J7/2004 M. Rantanen, S. Semenoja, Intercomparison in gauge pressure range from 20 Pa to 13 kPa
J8/2004 R. Rajala, Yleismittarin vertailumittaus, loppuraportti
J1/2005 T. Ehder (Toim.), Mikrobiologiset vertailukannat
J2/2005 M. Rantanen, G. Peterson, Pressure comparisons between MIKES and Metrosert: Ranges 95 kPa to 105 kPa absolute and 0,5 MPa to 1,75 MPa gauge
J3/2005 M. Rantanen, S. Semenoja, Calibration of a 130 Pa CDG: comparison of the results from MIKES and PTB
J4/2005 T. Weckström, Lämpötilan mittaus
J5/2005 M. Rantanen, S. Semenoja, Results on the effective area of a DHI piston-cylinder unit with the nominal area of 196 mm2
J6/2005 T. Ehder (Toim.), Kemian metrologian opas
J7/2005 M. Heinonen, J. Järvinen, A. Lassila, A. Manninen (Eds.), Finnish National Standards Laboratories Annual Report 2004
J8/2005 T. Weckström, Thermometer comparison L12 in the range from -80 °C to 400 °C
J9/2005 V. Esala, Pituuden vertailumittaus D7, loppuraportti
J1/2006 M. Rantanen, S. Semenoja, Intercomparison in Gauge Pressure Range from -95kPa to +100 kPa
J2/2006 M. Heinonen, J. Järvinen, A. Lassila, A. Manninen (Eds.), Finnish National Standards Laboratories Annual Report 2005
J3/2006 K. Riski, L. Stenlund, Mass Comparison: 610 g laboratory balance
J4/2006 M. Heinonen, Uncertainty in humidity measurements - Publication of the EUROMET Workshop P758
J5/2006 T. Ehder (Toim.), Kvalitatiivisen kemian metrologian opas orgaanisten yhdisteiden tunnistukseen
J6/2006 T. Ehder (Toim.), Mikrobiologian laboratorion elatusaineiden sisäinen laadunvarmistus
J7/2006 J. Järvinen (Toim.), Kansallinen mittanormaalitoiminta ja sen kehittäminen 2007-2011
J8/2006 V-P. Esala, Pituuden vertailumittaus D8 Loppuraportti 07.12.2006
J9/2006 R. Rajala, Yleismittarin vertailumittaus
J1/2007 M. Heinonen, J. Järvinen, A. Lassila, A. Manninen (Eds.), Finnish National Standards Laboratories Annual Report 2006
Orders: Kirsi Tuomisto, tel. +358 10 6054 436, e-mail [email protected]

ISBN 978-952-5610-21-5ISSN 1235-2704
• P.O.Box 9, Tekniikantie 1, FI-02151 ESPOO, Finland • Tel. +358 10 6054 000 • Fax +358 10 6054 299
• www.mikes.fi