LOW FREQUENCY FATIGUE IN ENDURANCE TRAINED, …
105
LOW FREQUENCY FATIGUE IN ENDURANCE TRAINED, SEDENTARY, AND SPINAL CORD INJURED SUBJECTS by EDWARD THOMAS MAHONEY (Under the direction of Dr. Kevin McCully) ABSTRACT This study examined low frequency fatigue (LFF) in endurance trained (ET) and sedentary (SED) able-bodied subjects, and in individuals with spinal cord injury (SCI). ET and SED performed two separate neuromuscular electrical stimulation (NMES) protocols to evoke fatigue of the quadriceps of one thigh (experimental leg) with the un-fatigued leg as a control. Protocol 1 (‘15 Min’) lasted 15 min and the duty cycle was 33%. For protocol 2, fatigue in SED was matched to ET during the 15 min protocol (‘Low Matched’) while fatigue in ET was matched to the SED 15 min protocol (‘High Matched’). Force was assessed at 20 Hz (P20) and 100 Hz (P100) and the ratio of P20/P100 was used to evaluate LFF in both thighs before and up to 24 hours following fatigue. The SCI group performed only one protocol in which fatigue was matched to SED during the 15 min protocol, and evaluation of LFF was the same. Results indicated that SED had a greater magnitude of LFF compared to ET with the 15 Min (p<0.001) and High Matched (p<0.020) comparisons. The ET group did not recover faster than the SED group for any of the comparisons. Muscle pain 24 hours after the fatigue tests may have affected LFF values. For SCI, the magnitude of LFF was not significantly different compared to SED. Recovery of LFF was faster in SED compared to SCI in both the experimental (p<0.001) and control leg (p<0.001). SCI did not recover from LFF over 24 hours in either leg. When LFF values in the experimental leg were corrected for LFF values in the control leg, no difference in recovery existed between SED and SCI (p=0.064). In summary, ET had less LFF than SED even when total fatigue was matched, suggesting that ET muscle is more ‘protected’ from LFF. Although ET did not recover faster from LFF, other factors such as muscle injury may make interpretations of recovery difficult. When paralyzed muscle is stimulated sufficiently, LFF will be substantial for at least 24 hours. In addition, assessing LFF with NMES in SCI causes a progressive increase in LFF, which is likely due to muscle injury. INDEX WORDS: Low frequency fatigue, electrical stimulation, spinal cord injury, endurance training, calcium impairment.
Transcript of LOW FREQUENCY FATIGUE IN ENDURANCE TRAINED, …

LOW FREQUENCY FATIGUE IN ENDURANCE TRAINED, SEDENTARY,
AND SPINAL CORD INJURED SUBJECTS
by
EDWARD THOMAS MAHONEY
(Under the direction of Dr. Kevin McCully)
ABSTRACT
This study examined low frequency fatigue (LFF) in endurance trained (ET) and
sedentary (SED) able-bodied subjects, and in individuals with spinal cord injury (SCI). ET and SED performed two separate neuromuscular electrical stimulation (NMES) protocols to evoke fatigue of the quadriceps of one thigh (experimental leg) with the un-fatigued leg as a control. Protocol 1 (‘15 Min’) lasted 15 min and the duty cycle was 33%. For protocol 2, fatigue in SED was matched to ET during the 15 min protocol (‘Low Matched’) while fatigue in ET was matched to the SED 15 min protocol (‘High Matched’). Force was assessed at 20 Hz (P20) and 100 Hz (P100) and the ratio of P20/P100 was used to evaluate LFF in both thighs before and up to 24 hours following fatigue. The SCI group performed only one protocol in which fatigue was matched to SED during the 15 min protocol, and evaluation of LFF was the same. Results indicated that SED had a greater magnitude of LFF compared to ET with the 15 Min (p<0.001) and High Matched (p<0.020) comparisons. The ET group did not recover faster than the SED group for any of the comparisons. Muscle pain 24 hours after the fatigue tests may have affected LFF values. For SCI, the magnitude of LFF was not significantly different compared to SED. Recovery of LFF was faster in SED compared to SCI in both the experimental (p<0.001) and control leg (p<0.001). SCI did not recover from LFF over 24 hours in either leg. When LFF values in the experimental leg were corrected for LFF values in the control leg, no difference in recovery existed between SED and SCI (p=0.064). In summary, ET had less LFF than SED even when total fatigue was matched, suggesting that ET muscle is more ‘protected’ from LFF. Although ET did not recover faster from LFF, other factors such as muscle injury may make interpretations of recovery difficult. When paralyzed muscle is stimulated sufficiently, LFF will be substantial for at least 24 hours. In addition, assessing LFF with NMES in SCI causes a progressive increase in LFF, which is likely due to muscle injury. INDEX WORDS: Low frequency fatigue, electrical stimulation, spinal cord injury, endurance training, calcium impairment.

LOW FREQUENCY FATIGUE IN ENDURANCE TRAINED, SEDENTARY,
AND SPINAL CORD INJURED SUBJECTS
by
EDWARD THOMAS MAHONEY
B.S. Ithaca College, 1995
M.A. University of Georgia, 1998
A Dissertation Submitted to the Graduate Faculty of The University of Georgia in
Partial Fulfillment of the Requirements for the Degree
DOCTOR OF PHILOSOPHY
ATHENS, GEORGIA
2006

© 2006
EDWARD THOMAS MAHONEY
All Rights Reserved
LOW FREQUENCY FATIGUE IN ENDURANCE TRAINED, SEDENTARY,
AND SPINAL CORD INJURED SUBJECTS
by
EDWARD THOMAS MAHONEY
Major Professor: Kevin McCully
Committee: Gary A. Dudley Rod Dishman
Kirk J. Cureton Patrick L. Jacobs
Electronic Version Approved: Maureen Grasso Dean of the Graduate School The University of Georgia August 2006

DEDICATION
I dedicate this work to my wife, Melanie who has always been supportive and is my pillar
of strength. Melanie, I love you and I am proud to be your husband.
Also, I dedicate this to Dr. Gary A. Dudley and his family as they have all faced extreme
challenges and hardships over the past 4 years. When most individuals would have given up due
to these overwhelming circumstances, Dr. Dudley continues to be dedicated to his work, and
more importantly, his family. He has the heart of a lion and an unending drive to acquire
knowledge and achieve excellence. He is a true inspiration to me, and to all that know him.
iv

ACKNOWLEDGMENTS
I would like to thank Dr. Kevin McCully for all the time you spent with me on this
project and for your guidance and support throughout my doctoral degree. I have enjoyed
working with you very much and hope that we might collaborate in the future. Dr. Gary Dudley,
thank you for giving me the opportunity to work in your lab and to learn from you over the past 4
years. You are a true inspiration to all and your scientific knowledge is second-to-none. Dr. Kirk
Cureton and Dr. Rod Dishman, thank you for your input and guidance on this project and for all
the valuable information I learned in your classes. To my former mentor, Dr. Patrick Jacobs,
thank you for your guidance on this project. More importantly, thank you for all the time you
spent with me when I first started learning about individuals with SCI. You are the first person
who sparked my interest in SCI research and I am grateful for all that I learned from you over the
past years. Also, I would like to thank Dr. Debbie Backus at Shepherd Center for facilitating my
data collection of SCI subjects and for all her help related to this project.
I would like to thank Mrs. Dudley for her amazing strength over the past 4 years. You
and your family will always be in our prayers. Also, our lab, and practically the entire building,
would like to thank you for the almost unending supply of snacks to fuel our brains and add mass
to our bodies! I would like to thank Timmy ‘Stat Master’ Puetz for all of his help with my
statistical analyses and for his friendship. Also, I would like to thank all my research subjects for
participating in my study. To the lab members, Chris Elder, Tracey ‘Tricky’ Kendall, and Chris
Black thanks for all the good times in the lab and for your help with this project. To my brother
v

Dave, I would like to thank you for your support and friendship over the past years and for all the
laughs we have had throughout our lives.
Lastly, I would like to thank my wife, Melanie for all her support and patience with me
over the past 4 years. I would have never made it without you. Thank you for keeping me
positive and for believing in me. I am excited to begin a new chapter of life with you in
beautiful Louisville, KY.
vi

TABLE OF CONTENTS
Page
ACKNOWLEDGEMENTS.............................................................................................................v
LIST OF TABLES......................................................................................................................... ix
LIST OF FIGURES .........................................................................................................................x
CHAPTER
I. INTRODUCTION.........................................................................................................1
Purpose.....................................................................................................................4
Specific Aims...........................................................................................................4
Hypotheses...............................................................................................................4
Significance of the Study .........................................................................................5
Limitations of the Study...........................................................................................6
II. REVIEW OF LITERATURE.......................................................................................8
Muscle Fatigue.........................................................................................................8
Fatigue and Endurance Training..............................................................................8
Calcium Related Fatigue..........................................................................................9
Training Status and Low Frequency Fatigue (LFF) ..............................................12
Effect of Fiber Type and Metabolic Fatigue on LFF.............................................13
Muscle Injury and LFF ..........................................................................................14
Surface Neuromuscular Electrical Stimulation (NMES).......................................16
Muscle Fatigue and Spinal Cord Injury (SCI) .......................................................17
vii

Low Frequency Fatigue and SCI ...........................................................................17
References..............................................................................................................19
III. LOW FREQUENCY FATIGUE AFTER ELECTRICALLY EVOKED
CONTRACTIONS IN TRAINED AND UNTRAINED SUBJECTS.............…….25
Abstract ..................................................................................................................26
Introduction............................................................................................................27
Methods..................................................................................................................28
Results....................................................................................................................35
Discussion..............................................................................................................39
References..............................................................................................................44
IV. LOW FREQUENCY FATIGUE IN INDIVIDUALS WITH SPINAL CORD
INJURY .................................................................................................................55
Abstract ..................................................................................................................57
Introduction............................................................................................................58
Methods..................................................................................................................60
Results....................................................................................................................66
Discussion..............................................................................................................70
References..............................................................................................................76
V. SUMMARY AND CONCLUSIONS..........................................................................88
References..............................................................................................................91
viii

LIST OF TABLES
Page
Table 3.1: Subjects characteristics.................................................................................................48
Table 3.2: Muscle pain ratings in the experimental leg in endurance trained and sedentary
subjects 24 and 48 hours after completion of fatigue tests...........................................55
Table 4.1: Individual and mean data for spinal cord injured participants .....................................80
Table 4.2: Mean subject characteristics for SCI and able-bodied groups......................................81
ix
LIST OF FIGURES
Page
Figure 3.1: Percent reduction in force-time integrals during fatigue protocols in endurance
trained and sedentary subjects.....................................................................................49
Figure 3.2: Representative force tracings at 20 Hz and 100 Hz for one sedentary participant pre-
and 1-hour post-fatigue ...............................................................................................50
Figure 3.3: 100 Hz force values (% initial) for 15 Min (a), High Matched (b) and Low Matched
(c) conditions in ET and SED. ....................................................................................51
Figure 3.4: Control leg LFF values over 24 hours post-fatigue in ET and SED for the 15 Min
condition .....................................................................................................................52
Figure 3.5: Magnitude of LFF for 15 Min (a), High Matched (b) and Low Matched (c) conditions
in ET and SED over 1-hour post-fatigue.....................................................................53
Figure 3.6: Recovery of LFF for 15 Min (a), High Matched (b) and Low Matched (c) conditions
in ET and SED over 24 hours post-fatigue.................................................................54
Figure 4.1: Percent reduction in force-time integrals during fatigue protocols in spinal cord
injured and able-bodied subjects.................................................................................82
Figure 4.2: Representative force tracings at 20 Hz and 100 Hz for one spinal cord injured
participant pre- and 1-hour post-fatigue. ....................................................................83
Figure 4.3: 100 Hz force values (% initial) after a fatigue test for the experimental (a) and control
(b) leg in SCI and able-bodied over 24 hours post-fatigue .........................................84
x

Figure 4.4. Magnitude (a) and recovery of LFF (b) in the experimental leg of SCI and able-
bodied subjects. ...........................................................................................................85
Figure 4.5. Recovery of LFF in the control leg over the 24-hour post-fatigue period in SCI and
able-bodied subjects ....................................................................................................86
Figure 4.6. Recovery of LFF in the experimental leg when statistically adjusted for LFF in the
control leg of SCI and able-bodied subjects................................................................87
Figure 5.1. The mechanisms responsible for force loss along the Injury/Fatigue continuum.......93
xi

CHAPTER I
INTRODUCTION
Extensive literature exists regarding muscle fatigue (6, 21, 44, 45, 48, 59). Although
muscular fatigue has been examined following different modes and intensities of exercise in
many different subject populations, very small proportions of these studies have examined the
mechanisms involved in the fatigue. For example, many studies have reported that fatigue is
greater in individuals with spinal cord compared to able-bodied subjects, but few studies have
tried to determine what factors are responsible for the enhanced fatigue in those with paralysis.
Although the most widely known mechanisms of fatigue are usually thought to be
metabolic in nature, the potential role that calcium may play in fatigue cannot be disregarded.
The uptake and release of calcium from the sarcoplasmic reticulum (SR) are important
contributors to producing and maintaining force (2, 3, 19). Many studies have demonstrated that
muscular force can be reduced for several hours and may be related to disruptions in excitation-
contraction coupling (19, 72-74). However, studies directly measuring calcium levels with
muscular fatigue are typically invasive and are usually performed in animal models.
In humans, it is possible to approximate the impairment of calcium release following
muscular activity by examining low frequency fatigue (LFF), a well-documented phenomenon
(17, 62, 67). Low frequency fatigue is defined as a preferential loss of force at low stimulation
frequencies (ie. 20 Hz) compared to high frequencies (ie. 100 Hz). Low frequency fatigue is
commonly assessed by the ratio of force produced at low and high activation frequencies
following exercise (63, 66). It is characterized by a slow rate of force recovery and persistence of
1

reduced force in the absence of electrical or metabolic disturbances and has been shown to last 6-
8 hours or longer (17, 31, 63).
It is well established that aerobic athletes fatigue less during contractions than their
sedentary (SED) counterparts (27, 42, 44, 68). Despite this, few studies have measured the
various mechanisms related to the differences in fatigue between these two groups. However,
studies have shown that endurance trained (ET) athletes recover faster from metabolic fatigue
because their muscles are better equipped to buffer hydrogen ions and resynthesize
phosphocreatine and ATP levels (27, 44) due to high muscle oxidative capacity. However, the
question of how ET affects the long lasting recovery of muscular force (ie. LFF) due to
impairment in excitation-contractions coupling has not been fully examined.
Low frequency fatigue has been reported to be most dramatic in fast-twitch muscle fibers
(51, 53), as well as when prior muscle injury has occurred (13, 34, 46, 53). Highly trained
endurance athletes display exceptional muscular endurance and typically have greater
percentages of slow-oxidative muscle fibers (56) when compared to SED. These slow-oxidative
muscle fibers may be less susceptible to contraction-induced muscle injury (22, 38). Also, it
appears that endurance training itself may provide some protection (18). If ET individuals, in fact
have greater percentages of slow-oxidative fibers, and are more protected from contraction–
induced muscle injury, then it is possible that they would be less prone to LFF.
Independent of muscle injury, force loss observed during a bout of muscular contractions
due to metabolic factors has been shown to affect LFF (42, 50). Pronounced fatigue causes large
increases in inorganic phosphate and hydrogen ions. It is hypothesized that high levels of
inorganic phosphate may be taken up into the SR, where it may precipitate with calcium (23).
2

The formation of calcium phosphate would lower free calcium concentrations in the SR, thus
reducing calcium release.
A study by McCully et al. (42) determined that protocols that elicit high levels of fatigue,
and therefore metabolic byproducts, can increase the magnitude of LFF observed during
recovery. With regard to ET and SED individuals, previous literature would indicate that when
these two groups perform identical protocols that SED would incur greater metabolic fatigue and
force loss. For these reasons, it seems plausible that SED individuals would have greater LFF
following contractions, compared to ET subjects.
Surface neuromuscular electrical stimulation (NMES) is commonly used in testing of
able-bodied subjects as well as in those with neuromuscular disorders to facilitate contraction of
weak or paralyzed skeletal muscle (5, 11, 39). Activating skeletal muscle for the purpose of
functional movements and exercise through NMES is challenging as skeletal muscle fatigue can
occur rapidly. The profound fatigue that occurs with this modality, is likely due to altered motor
unit recruitment patterns (20, 35, 36), as well as synchronous activation of a given motor neuron
pool (1, 52). It is well established that the use of NMES requires greater energy demand and
consequently causes more fatigue when compared to similar voluntary efforts (29, 35, 69).
Muscle fatigue has been reported to be greater in individuals with spinal cord injury
(SCI) when compared to able-bodied subjects (5, 10, 30, 48). The most widely supported
mechanism explaining the high levels of fatigue observed in SCI subjects has been attributed to
the increased proportion of fast-twitch fibers (8, 25). To our knowledge, few studies have
thoroughly examined LFF in individuals with SCI. Since there is a somewhat complete
transformation from slow to fast contractile machinery with chronic SCI, as well as an increased
3

risk of contraction-induced muscle injury (5), it seems plausible that paralyzed muscle would be
more susceptible to LFF than normally loaded muscle.
Purpose
The general aim of this study is to better understand the mechanisms of muscle fatigue, in
particular in individuals who are extremely fit, as well as in those who are severely
deconditioned. This will be accomplished by measuring the magnitude and recovery of ‘low
frequency fatigue’ resulting from two NMES-evoked fatigue protocols in endurance trained (ET)
and sedentary (SED) able-bodied subjects, as well as in individuals with spinal cord injury (SCI).
Low frequency fatigue (LFF) will be measured for up to 24 hours in each of these groups after
performing two protocols which induce different amounts of fatigue. This study will determine if
the total amount of force loss during a fatigue protocol affects the LFF response or whether
additional factors play a role. Also, this study will determine if use of a control leg (un-fatigued
leg) when examining LFF is warranted.
Specific Aims
1. In ET and SED subjects, the magnitude and recovery rates of LFF were evaluated in response
to separate NMES-evoked protocols designed to initiate two levels of fatigue.
2. In SCI and SED subjects, the magnitude and recovery rates of LFF were evaluated in response
to a separate NMES-evoked protocol designed to match force loss in both groups.
Hypotheses
1a. ET will have less magnitude and faster recovery of LFF compared to SED following the
performance of an identical fatigue protocol (15 Min).
4

1b. ET will have less magnitude and a faster recovery of LFF compared to SED following the
performance of fatigue protocols designed to match relative force loss (High and Low Matched
conditions).
2. SED able-bodied controls will have less magnitude and faster recovery of LFF compared to
SCI following the performance of fatigue protocols designed to match relative force loss
between groups.
Significance of the study
It is unknown if calcium related fatigue (ie. LFF) can be reduced with endurance training,
even though it is well known that overall muscle fatigue is greatly reduced. SCI is a condition
associated with enhanced muscle fatigue and increased susceptibility to contraction-induced
muscle injury, both of which have been shown to enhance LFF. The increased muscle
fatigue/injury in SCI limits the ability to use NMES as a therapeutic tool. This study is the first
to thoroughly examine LFF in subjects with SCI, as well as how training status influences the
LFF response. An important aspect of this study will be to monitor the magnitude and recovery
of LFF after a fatiguing bout of exercise. This study is unique in that it tested if enhanced fatigue
with deconditioning (SED and SCI) is related to a large magnitude and prolonged recovery of
LFF, and whether electrical stimulation protocols causing different levels of fatigue will affect
this response. Using various fatigue tests allowed examination of LFF after the same number of
stimulations and after the same percentage of force loss between groups.
By performing this study, more was learned about the importance of LFF in humans after
use of NMES. Low frequency fatigue has clinical implications in that individuals with SCI, or
other neuromuscular disorders, may use low-frequency NMES several times a day for
5
rehabilitation to make weak or paralyzed muscle contract. The results of this study may aid
clinicians in designing appropriate electrical stimulation protocols for rehabilitation.
Limitations of the study
This study assessed LFF, a phenomenon thought to be due to impaired calcium release
during muscular contractions. This study, however, did not directly measure calcium release
rates and was not designed to determine the role that various mechanisms may have on LFF (ie.
muscle injury that may occur). The ratio of force produced at low and high frequency (P20/P100)
was assessed after a fatigue protocol to quantify LFF. The magnitude and recovery of LFF may
give a rough idea of how much excitation-contraction coupling is impaired, but LFF data was not
used to generalize calcium uptake or release rates.
Another potential limitation of this study is that subjects had to re-enter the force chair
several times throughout the 24-hour post-fatigue period, which may lead to increased variability
in the force measurements. To limit variability of testing measures, a control leg was utilized in
the research design. In addition, subjects were asked to remain relatively inactive over the course
of the day and the electrodes were traced to ensure the same placement for the 24-hour
assessment of LFF, or at any other time the electrodes were taken off during testing.
It has been reported that LFF is more pronounced when prior muscle injury has occurred.
This is not a large concern for the able-bodied subjects as research has shown that these types of
contractions do not typically induce muscle injury. However, NMES-evoked isometric
contractions are capable of eliciting muscle injury in those with long-term SCI. Although we
tried to limit muscle injury by keeping force values low, we did not quantitatively assess muscle
injury, which could potentially limit the interpretation of the results of this study, especially in
6

the SCI group. However, if NMES-evoked force returns to baseline values 24 h post-fatigue,
then we can assume little, or no injury has occurred.
7

CHAPTER II
REVIEW OF LITERATURE Muscle fatigue Skeletal muscle fatigue is defined as the “failure to maintain the required or expected
power output” (16). Skeletal muscle fatigue ordinarily occurs due to a number of plausible
theories including failure at the neuromuscular junction, decreased calcium release and reuptake,
buildup of metabolic byproducts, and central fatigue (21). In addition, factors outside the motor
unit, including inadequate blood flow, may contribute to muscle fatigue. Force recovery
following fatigue is made up of three distinct components (45). With the first component,
muscular force recovers quickly (within seconds) and is likely related to disruption in electrical
excitability of the muscle membrane or buildup of K+ in the transverse tubules, possibly related
to the disruption of Na+-K+ adenosinetriphosphatase pump function. The second component is
due to the build-up of various metabolites produced during exercise, which recover somewhere
between 3-20 minutes. The third component of fatigue, which has been demonstrated to last up
to 6-8 h and potentially longer, is likely related to disruption of excitation-contraction coupling
(calcium impairment), and force loss is most severe when muscle actions are elicited at low
frequencies (ie.1-20 Hz).
Fatigue and endurance training
It is well established that endurance trained (ET) athletes fatigue less and recover quicker
than their sedentary (SED) counterparts (27, 42, 44, 68). Theriault et al. (68) examined resistance
to fatigue in the knee extensor muscles of active and ET individuals. Subjects performed 25
8

maximal voluntary isometric contractions, each lasting 10 s with 5 sec rest between contractions
and demonstrated a significant difference in the amount of fatigue between both groups. This
study demonstrates that ET fatigue less with intermittent-type exercise, which is likely due to
faster recovery between contractions. McCully et al. (44) examined muscle metabolism in
controls and long-distance runners using 31P magnetic resonance spectroscopy. Phosphocreatine
was measured during and following 5 min of repeated plantar flexion of the calf muscles. The
maximal rates of PCr resynthesis were nearly twice as fast for long-distance runners as compared
to controls (64.8 vs. 38.6 mmol/min/kg muscle). The differences shown here are consistent with
literature demonstrating that long-distance runners have faster recovery of metabolites than
controls, which is directly due to higher oxidative capacity. Extensive literature exists regarding
muscle fatigue related to the buildup of metabolic byproducts, namely inorganic phosphate and
hydrogen ions, and their mechanisms of action are quite well known (44, 45, 69-71).
Calcium related fatigue (LFF)
The proposed project will not examine metabolic fatigue but will be more focused on
examining the long-lasting fatigue related to calcium impairment. Although some researchers
believe that loss of muscular force is almost completely due to the accumulation of metabolic
byproducts, it is becoming clear that calcium impairment may play a larger role in fatigue than
previously thought. The uptake and release of calcium from the sarcoplasmic reticulum (SR) are
important contributors to producing and maintaining force. It has been demonstrated that the
onset of muscle fatigue may be related to the inability of the SR to adequately release and
sequester calcium (19). Also, accumulation of metabolic byproducts themselves might cause
reductions in calcium release from the SR (2). Insufficient delivery of calcium to the
myofilaments would lead to reduced force output and may be caused by impaired excitation-
9

contraction coupling, changes in SR calcium concentrations, or by transient modifications of the
SR calcium channel (19). The strongest evidence points to transient modification of the SR
calcium channel with fatigue, which reduces its opening probability and decreases calcium
release into the myoplasm. Data from animal models indicate that when intracellular calcium
[Ca+2]i concentration are elevated, general calcium homeostasis becomes impaired and calcium
release is subsequently reduced (14, 37, 74). Also, it has been reported that high levels of [Ca+2]i
are capable of activating proteases that lead to cellular damage. Therefore, reducing calcium
release with fatigue would favor a lower calcium environment (due to continued sequestration of
calcium), which may act to maintain cellular integrity by limiting calcium-mediated damage (9).
Pronounced fatigue causes large increases in inorganic phosphate and hydrogen ions. It is
hypothesized that high levels of inorganic phosphate may be taken up into the SR, where it may
precipitate with calcium (23). The formation of calcium phosphate would lower free calcium
concentrations in the SR, thus reducing calcium release. However, the ensuing impairment in
calcium release would preferentially affect muscular forces at low activation frequencies.
Higher frequencies, however, are capable of overcoming such impairments and can produce
saturating levels within the myoplasm, thus blunting reductions in muscle force. From such
studies, it is becoming increasingly clear that impaired calcium handling is an important
mechanism involved in muscular fatigue.
Studies directly measuring calcium (concentrations, release/reuptake rates, receptor and
channel activity, etc.) with muscular fatigue are typically invasive and are usually performed in
animal models. Measuring calcium handling in humans is not as simple. In humans, we can
obtain muscle biopsies to measure calcium release, uptake, and Ca+2-adenosinetriphosphatase
activity with various protocols. From force tracings, we can obtain crude estimates of calcium
10

kinetics by examining rise and relaxation times during contractions. In addition, it is possible to
approximate the magnitude of calcium release impairment following muscular activity by
examining low frequency fatigue (LFF), a well-documented phenomenon. Low frequency
fatigue is defined as a preferential loss of force at low stimulation frequencies (ie. 20 Hz)
compared to high frequencies (ie. 100 Hz). Low frequency fatigue is commonly assessed by the
ratio of force produced at low and high activation frequencies following muscular fatigue (63,
66, 67). It is characterized by a slow rate of force recovery and persistence of reduced force in
the absence of electrical or metabolic disturbances and has been shown to last 6-8 hours or
longer (17, 31, 63).
After a bout of fatiguing exercise, force produced at low and high electrical stimulation
frequencies should both be affected by metabolic fatigue (41) which is known to subside ~20
min following exercise (45). High frequency force is less affected by this calcium related fatigue,
whereas low frequency force appears to be preferentially suppressed. Low frequency fatigue is
likely due to impaired excitation-contraction coupling with evidence specifically pointing to
blunted calcium release from the SR at low stimulation frequencies (17, 45, 73). Chin et al. (15)
have reported that the reduction in calcium release with LFF is primarily due to an elevation in
the [Ca+2]i-time integral, which represents the cumulative increase in [Ca+2]i above resting levels
for series of tetanic contractions.
A common misconception is that LFF is only caused by low frequency evoked muscle
contractions. Studies have elicited LFF with voluntary contractions, (41, 52, 63) as well as with
both high (60-100 Hz) and low frequency (1-30 Hz) electrically induced contractions (32, 52,
74). However, Ratkevicius et al. (52) have demonstrated that electrically evoked contractions
actually cause more LFF than do voluntary contractions and longer contractions (30 sec) cause
11

more pronounced LFF, as compared to shorter ones (5 sec). Although high frequency fatigue
protocols will elicit LFF, there is some evidence that lower frequencies cause a more pronounced
LFF (7). In addition to longer individual muscle contractions, longer duration fatigue protocols
themselves have been shown to cause greater LFF (4). In summary, LFF is most pronounced
following longer individual contractions which are electrically evoked, and that are performed
within fatigue protocols that are of longer duration.
Training status and LFF
A question that has not been fully examined is how training status may influence LFF
after fatiguing bouts of exercise. Since LFF has been attributed to impaired calcium release from
the SR, it has been suggested that high intensity training may help to partially compensate for
this impairment. A study by Willems & Stauber (75) examined LFF in rat plantar flexors with 6
weeks of high-speed eccentric resistance training. They showed significantly smaller reductions
in the P20/P100 ratio in trained vs. control muscles after an electrically stimulated fatigue test.
Although no calcium related measures were performed in this study, they attributed the reduction
in LFF in the resistance-trained muscles to increase release of calcium from the SR. In support of
this, Ortenblad et al. (49) demonstrated that 5 weeks of sprint training in men led to an enhanced
rate of peak SR calcium release, whereas calcium sequestration function was not changed.
Although calcium release may be enhanced with high intensity trained (sprint and resistance
training), it is likely that muscle fiber types do not get ‘faster’. If anything, this type of training
may cause a fiber type shift from type IIb to IIa, which is known to occur when sedentary
individuals become active (68). Something inherent about this fiber type shift may cause
reductions in LFF as it has been reported that fast-fatigable fibers are more prone to LFF than
fast-fatigue resistant fibers (51). Although high intensity training appears to reduce LFF
12

following a bout of exercise, there is not much information on how endurance training affects
LFF.
Effects of fiber type and metabolic fatigue on LFF
Following muscular contractions, LFF is evident in both fast and slow twitch muscle
fibers of animals, as well as humans (33). However, it has been reported that fast-glycolytic
fibers demonstrate greater LFF following types of muscular contractions than do fast-oxidative
fibers (51, 53). Powers & Binder (51) reported that fatigue resistant motor units from cat flexor
digitorum muscles exhibited less pronounced LFF than fast-intermediate and fast-fatigable motor
units after a series of electrically stimulated contractions. Also, they demonstrated a significant
positive correlation (r = 0.611) between tetanic tension of individual motor units and the
magnitude of LFF, indicating the greatest LFF was observed in the largest motor units.
Force loss observed during a bout of muscular contractions due to metabolic factors has
been shown to affect LFF (42, 50). In the cat gastrocnemius muscle, Parikh and colleagues (50)
examined LFF after protocols of 2, 5, 10, 20 and 50 concentric contractions at optimal muscle
length. As expected, they demonstrated that force loss after 50 concentric contractions was
greater than the trials where fewer contractions were performed. They demonstrated that as the
number of the contractions in a protocol increased, force loss was greater, and LFF was more
pronounced after exercise.
McCully et al. (42) used an in vivo rat muscle model to examine the potential role that
metabolic byproducts might have on calcium related fatigue (ie. LFF). They examined muscular
force and metabolic byproducts during and following bouts of electrical stimulation. Two
stimulation protocols were used: 1) high intensity stimulation followed by medium intensity
stimulation (High Group), and 2) low intensity stimulation followed by medium intensity
13

stimulation (Low Group). Metabolic fatigue was based on concentrations of inorganic phosphate
and LFF was assessed as the relative decline of force at low compared to high stimulation
frequencies. During the initial stimulation period, the High Group had greater metabolic fatigue
and LFF compared to the Low Group. During the second stimulation and recovery period, the
High group demonstrated no difference in metabolic fatigue but had significantly greater LFF.
They determined that protocols that elicit high levels of fatigue, and therefore metabolic
byproducts, can increase the magnitude of LFF observed during recovery. With regard to ET and
SED individuals, previous literature would indicate that when these two groups perform identical
protocols that SED would incur greater metabolic fatigue and force loss. It is possible that
greater metabolic fatigue observed in SED subjects may lead to a greater magnitude of LFF
following contractions, compared to ET subjects.
Muscle injury and LFF
Low frequency fatigue has been reported to be greater when prior muscle injury has
occurred (13, 34, 46, 53). Since the origin of LFF has been attributed to disruption in the
excitation-contraction coupling process, studies have demonstrated that muscle injury can impair
calcium release/reuptake rates and affect muscular force, most predominately at low activation
frequencies (9, 46). Rijkelijkhuizen et al. (53) examined the effects of 40 isometric, concentric,
or eccentric muscle actions on LFF in different fibers types of the rat medial gastrocnemius.
Seventy minutes post-exercise, LFF was more severe with eccentric compared with isometric
and concentric contractions. Of the three contraction types, eccentric actions cause the greatest
disruption to muscle fibers (43, 47). This study indicates that more injurious bouts of exercise
demonstrate greater LFF. Newham et al. (46) used a bench step test to initiate muscle injury
using concentric contractions in the quadriceps of one leg (step up leg) and eccentric contractions
14

in the other (step down leg). Regardless of contraction type, this protocol caused pronounced
LFF, indicated by a reduction in the P10/P50 ratio, which was still significantly suppressed 24
hours following bench stepping. However, the leg that performed the eccentric contractions had
a significantly larger reduction in P10/P50 as compared to the concentric leg, for up to 5 hours
post-exercise. These studies indicate the dramatic effect that muscle injury can have on muscle
force at low activation frequencies.
Highly trained endurance athletes display exceptional muscular endurance and typically
have greater percentages of slow-oxidative muscle fibers (56) when compared to SED. In
addition to less pronounced LFF, these slow-oxidative muscle fibers have been reported to be
less susceptible to contraction-induced muscle injury (22, 38). Also, it has been reported that
endurance training, specifically running, seems to provide protection from muscle injury due to
the eccentric component involved with this exercise modality (18, 57). If ET individuals, in fact
have greater percentages of slow-oxidative fibers, and are more protected from contraction–
induced muscle injury, then it is possible that they would be less prone to LFF following a bout
of exercise designed to injure skeletal muscle. However, a study by Skurvydas et al. (62) showed
no differences in LFF between long-distance runners, sprinters and untrained men after stretch-
shortening exercise, which consisted of 100 maximal drop jumps. They may have failed to show
differences between groups due to the fact that LFF was measured in the muscles of the thigh,
but other muscle groups were likely involved during exercise. Also, drop jumps performed may
not have induced substantial fatigue and/or muscle injury solely to the quadriceps muscle,
potentially not evoking enough LFF to distinguish differences between groups.
15

Surface neuromuscular electrical stimulation (NMES)
The use of surface neuromuscular electrical stimulation (NMES) is commonly used in
testing of able-bodied subjects as well as in those with neuromuscular disorders to facilitate
contraction of weak or paralyzed skeletal muscle. Activating skeletal muscle for the purpose of
functional movements and exercise through NMES is challenging as skeletal muscle fatigue can
occur rapidly. The profound fatigue that occurs with this modality, is likely due to altered motor
unit recruitment patterns (20, 35, 36), as well as synchronous activation of a given motor neuron
pool (1, 52). It is well established that the use of NMES requires greater energy demand and
consequently causes more fatigue when compared to similar voluntary efforts (28, 35, 69).
Utilizing high frequencies (40-100 Hz) of NMES leads to rapid onset of fatigue but force
typically returns to baseline values fairly quick during recovery. Alternatively, low frequency
NMES typically leads to less fatigue during contractions but recovery of force is prolonged (17,
31, 63).
It is believed that fast-twitch fibers are activated to a greater extent with NMES than
during voluntary activation at matched submaximal workloads (35, 69). The enhanced force loss
with NMES is thought to be due to the greater myofibrillar adensosine triphosphatase rates in
these fast-twitch muscle fibers as well as their rapid loss of phosphocreatine stores (65).
Research has focused on trying to limit skeletal muscle fatigue with the use of NMES systems in
able-bodied subjects as well as those with neuromuscular diseases. One such approach has been
experimentation with variable frequency trains (55, 64), which alter the pulse frequency within a
train of stimulation. Variable-frequency trains may show promise in future NMES systems,
although recent data shows that the efficacy of this stimulation in spinal cord injured (SCI)
patients appears to be limited (58). In summary, exercise evoked via NMES leads to greater
16

levels of fatigue, which contributes to low levels of work typically reported with traditional
NMES-evoked training, and generally translates into limited improvements in fitness and health.
Muscle fatigue and SCI
Muscle fatigue has been reported to be greater in individuals with SCI, as compared to
able-bodied subjects (5, 12, 30). The most widely supported mechanism explaining the high
levels of fatigue observed in SCI subjects has been attributed to the increased proportion of fast-
twitch fibers, which have greater ATP turnover rates compared to slow twitch fibers. “Slow to
fast” fiber conversion has been shown to occur after 1-2 years post-injury with increased
expression of myosin heavy chain IIa and IIx (8, 25), as well as faster contraction speeds (24,
54). Muscle biopsy data from m. tibialis anterior from SCI subjects 2-11 years post-injury
indicate significantly less slow-twitch fibers than controls (69% vs. 14%, respectively) and
smaller mean fiber cross-sectional area (40). It is reported that a near complete conversion from
‘slow to fast’ muscle occurs over a period of approximately 70 months post-injury (8). Along
with fiber type changes, studies have demonstrated decreases in mitochondrial size as well as
reduced oxidative enzyme activities (26, 40). Over time, the paralyzed skeletal muscle contains
smaller fibers that have a greater energy demand (greater contractile speed) and a lower capacity
to supply it, leading to greater muscle fatigue. These factors likely account for some of the
difference in fatigability between SCI and able-bodied, with other factors possibly including
altered calcium handling and/or muscle injury occurring during the onset of muscular
contractions.
Low frequency fatigue and SCI
Although many studies have examined fatigue during contractions in SCI, few have
examined force for several hours after a bout of NMES-evoked exercise. Since there is a
17

somewhat complete transformation from slow to fast contractile machinery with chronic SCI, as
well as an increased risk of contraction-induced muscle injury (5), it seems plausible that
paralyzed muscle would be more susceptible to LFF than able-bodied muscle. To our
knowledge, few studies have examined LFF in individuals with SCI. Shields et al. (61) examined
low frequency force loss and recovery in the soleus muscle of chronic (> 3 years post-injury) and
acute SCI (< 5 weeks post-injury). The fatiguing NMES protocol consisted of 330 ms trains
delivered every second for 3 minutes. During the fatigue protocol they measured twitch (1Hz)
and tetanus (20Hz) force every 30 seconds during fatiguing contractions and at 5 min post-
exercise. Immediately following exercise, peak twitch and tetanus torque was reduced ~80% and
75%, respectively in the chronic SCI compared to only ~ 14% and 16% in acute SCI group.
Twitch and tetanus force in acute SCI had fully recovered within 5 minutes whereas chronic SCI
force had only recovered to ~65% and 60% of pre-fatigue values at 1 and 20 Hz, respectively.
This study, however did not actually measure LFF because high frequency force was not
assessed. Also, the fatigue protocol did not evoke LFF in the acute SCI group because low
frequency force (1 and 20 Hz) had recovered fully within 5 minutes.
Another study by Shields’ group (60), which was nearly identical to the aforementioned
study, was performed on 8 individuals with SCI (7 chronic, 1 acute) but assessed force at several
frequencies before, immediately after, and at 5 and 15 min following a 4 min fatigue protocol.
The frequencies used to assess force before and after the fatigue protocol were 1, 5, 10, 15, 20,
30, and 40 Hz. Extracting data from their graphs and calculating the ratio of force produced at 10
and 40 Hz as an indicator of LFF, yields ratios of 0.49, 0.34, 0.24, and 0.22 for before,
immediately after, and 5 and 15 min following fatigue, respectively. Although this study
18

demonstrates LFF in individuals with SCI it is limited, as it did not measure LFF for substantial
periods after the fatigue protocol.
References
1. Adams GR, Harris RT, Woodard D, and Dudley GA. Mapping of electrical muscle stimulation using MRI. J Appl Physiol 74: 532-537, 1993.
2. Allen DG, Kabbara AA, and Westerblad H. Muscle fatigue: the role of intracellular
calcium stores. Can J Appl Physiol 27: 83-96, 2002. 3. Allen DG and Westerblad H. The effects of caffeine on intracellular calcium, force and the
rate of relaxation of mouse skeletal muscle. J Physiol 487 ( Pt 2): 331-342, 1995. 4. Baker AJ, Kostov KG, Miller RG, and Weiner MW. Slow force recovery after long-
duration exercise: metabolic and activation factors in muscle fatigue. J Appl Physiol 74: 2294-2300, 1993.
5. Bickel CS, Slade JM, and Dudley GA. Long-term spinal cord injury increases susceptibility
to isometric contraction-induced muscle injury. Eur J Appl Physiol 91: 308-313, 2004. 6. Bickel CS, Slade JM, Warren GL, and Dudley GA. Fatigability and variable-frequency
train stimulation of human skeletal muscles. Phys Ther 83: 366-373, 2003. 7. Binder-Macleod SA and Russ DW. Effects of activation frequency and force on low-
frequency fatigue in human skeletal muscle. J Appl Physiol 86: 1337-1346, 1999. 8. Burnham R, Martin T, Stein R, Bell G, MacLean I, and Steadward R. Skeletal muscle
fibre type transformation following spinal cord injury. Spinal Cord 35: 86-91, 1997. 9. Byrd SK. Alterations in the sarcoplasmic reticulum: a possible link to exercise-induced
muscle damage. Med Sci Sports Exerc 24: 531-536, 1992. 10. Castro MJ, Apple DF, Jr., Hillegass EA, and Dudley GA. Influence of complete spinal
cord injury on skeletal muscle cross-sectional area within the first 6 months of injury. Eur J Appl Physiol Occup Physiol 80: 373-378, 1999.
11. Castro MJ, Apple DF, Jr., Rogers S, and Dudley GA. Influence of complete spinal cord
injury on skeletal muscle mechanics within the first 6 months of injury. Eur J Appl Physiol 81: 128-131, 2000.
12. Castro MJ, Apple DF, Jr., Staron RS, Campos GE, and Dudley GA. Influence of
complete spinal cord injury on skeletal muscle within 6 mo of injury. J Appl Physiol 86: 350-358, 1999.
19

13. Child RB, Brown SJ, Day SH, Saxton JM, and Donnelly AE. Manipulation of knee extensor force using percutaneous electrical myostimulation during eccentric actions: effects on indices of muscle damage in humans. Int J Sports Med 19: 468-473, 1998.
14. Chin ER and Allen DG. The role of elevations in intracellular [Ca2+] in the development of
low frequency fatigue in mouse single muscle fibres. J Physiol 491 ( Pt 3): 813-824, 1996. 15. Chin ER, Balnave CD, and Allen DG. Role of intracellular calcium and metabolites in low-
frequency fatigue of mouse skeletal muscle. Am J Physiol 272: C550-559, 1997. 16. Edwards RH. Physiological analysis of skeletal muscle weakness and fatigue. Clin Sci Mol
Med 54: 463-470, 1978. 17. Edwards RH, Hill DK, Jones DA, and Merton PA. Fatigue of long duration in human
skeletal muscle after exercise. J Physiol 272: 769-778, 1977. 18. Evans WJ, Meredith CN, Cannon JG, Dinarello CA, Frontera WR, Hughes VA, Jones
BH, and Knuttgen HG. Metabolic changes following eccentric exercise in trained and untrained men. J Appl Physiol 61: 1864-1868, 1986.
19. Favero TG. Sarcoplasmic reticulum Ca(2+) release and muscle fatigue. J Appl Physiol 87:
471-483, 1999. 20. Feiereisen P, Duchateau J, and Hainaut K. Motor unit recruitment order during voluntary
and electrically induced contractions in the tibialis anterior. Exp Brain Res 114: 117-123, 1997.
21. Fitts RH. Cellular mechanisms of muscle fatigue. Physiol Rev 74: 49-94, 1994. 22. Friden J, Seger J, and Ekblom B. Sublethal muscle fibre injuries after high-tension
anaerobic exercise. Eur J Appl Physiol Occup Physiol 57: 360-368, 1988. 23. Fryer MW, Owen VJ, Lamb GD, and Stephenson DG. Effects of creatine phosphate and
P(i) on Ca2+ movements and tension development in rat skinned skeletal muscle fibres. J Physiol 482 ( Pt 1): 123-140, 1995.
24. Gerrits HL, De Haan A, Hopman MT, van Der Woude LH, Jones DA, and Sargeant AJ.
Contractile properties of the quadriceps muscle in individuals with spinal cord injury. Muscle Nerve 22: 1249-1256, 1999.
25. Gerrits HL, Hopman MT, Offringa C, Engelen BG, Sargeant AJ, Jones DA, and Haan
A. Variability in fibre properties in paralysed human quadriceps muscles and effects of training. Pflugers Arch 445: 734-740, 2003.
26. Grimby G, Broberg C, Krotkiewska I, and Krotkiewski M. Muscle fiber composition in
patients with traumatic cord lesion. Scand J Rehabil Med 8: 37-42, 1976.
20

27. Guthrie BM, Frostick SP, Goodman J, Mikulis DJ, Plyley MJ, and Marshall KW. Endurance-trained and untrained skeletal muscle bioenergetics observed with magnetic resonance spectroscopy. Can J Appl Physiol 21: 251-263, 1996.
28. Hamada T, Hayashi T, Kimura T, Nakao K, and Moritani T. Electrical stimulation of
human lower extremities enhances energy consumption, carbohydrate oxidation, and whole body glucose uptake. J Appl Physiol 96: 911-916, 2004.
29. Hamada T, Kimura T, and Moritani T. Selective fatigue of fast motor units after
electrically elicited muscle contractions. J Electromyogr Kinesiol 14: 531-538, 2004. 30. Hillegass EA and Dudley GA. Surface electrical stimulation of skeletal muscle after spinal
cord injury. Spinal Cord 37: 251-257, 1999. 31. Isakov E, Mizrahi J, Graupe D, Becker E, and Najenson T. Energy cost and physiological
reactions to effort during activation of paraplegics by functional electrical stimulation. Scand J Rehabil Med Suppl 12: 102-107, 1985.
32. Jami L, Murthy KS, Petit J, and Zytnicki D. After-effects of repetitive stimulation at low
frequency on fast-contracting motor units of cat muscle. J Physiol 340: 129-143, 1983. 33. Jones DA, Howell S, Roussos C, and Edwards RH. Low-frequency fatigue in isolated
skeletal muscles and the effects of methylxanthines. Clin Sci (Lond) 63: 161-167, 1982. 34. Jones DA, Newham DJ, and Torgan C. Mechanical influences on long-lasting human
muscle fatigue and delayed-onset pain. J Physiol 412: 415-427, 1989. 35. Kim CK, Bangsbo J, Strange S, Karpakka J, and Saltin B. Metabolic response and
muscle glycogen depletion pattern during prolonged electrically induced dynamic exercise in man. Scand J Rehabil Med 27: 51-58, 1995.
36. Knaflitz M, Merletti R, and De Luca CJ. Inference of motor unit recruitment order in
voluntary and electrically elicited contractions. J Appl Physiol 68: 1657-1667, 1990. 37. Lamb GD, Junankar PR, and Stephenson DG. Raised intracellular [Ca2+] abolishes
excitation-contraction coupling in skeletal muscle fibres of rat and toad. J Physiol 489 ( Pt 2): 349-362, 1995.
38. Macpherson PC, Schork MA, and Faulkner JA. Contraction-induced injury to single fiber segments from fast and slow muscles of rats by single stretches. Am J Physiol 271: C1438-1446, 1996.
39. Mahoney ET, Bickel CS, Elder C, Black C, Slade JM, Apple D, Jr., and Dudley GA.
Changes in skeletal muscle size and glucose tolerance with electrically stimulated resistance training in subjects with chronic spinal cord injury. Arch Phys Med Rehabil 86: 1502-1504, 2005.
21

40. Martin TP, Stein RB, Hoeppner PH, and Reid DC. Influence of electrical stimulation on the morphological and metabolic properties of paralyzed muscle. J Appl Physiol 72: 1401-1406, 1992.
41. Martin V, Millet GY, Lattier G, and Perrod L. Effects of recovery modes after knee
extensor muscles eccentric contractions. Med Sci Sports Exerc 36: 1907-1915, 2004. 42. McCully KK, Authier B, Olive J, and Clark BJ, 3rd. Muscle fatigue: the role of
metabolism. Can J Appl Physiol 27: 70-82, 2002. 43. McCully KK and Faulkner JA. Injury to skeletal muscle fibers of mice following
lengthening contractions. J Appl Physiol 59: 119-126, 1985. 44. McCully KK, Vandenborne K, DeMeirleir K, Posner JD, and Leigh JS, Jr. Muscle
metabolism in track athletes, using 31P magnetic resonance spectroscopy. Can J Physiol Pharmacol 70: 1353-1359, 1992.
45. Miller RG, Giannini D, Milner-Brown HS, Layzer RB, Koretsky AP, Hooper D, and
Weiner MW. Effects of fatiguing exercise on high-energy phosphates, force, and EMG: evidence for three phases of recovery. Muscle Nerve 10: 810-821, 1987.
46. Newham DJ, Mills KR, Quigley BM, and Edwards RH. Pain and fatigue after concentric
and eccentric muscle contractions. Clin Sci (Lond) 64: 55-62, 1983. 47. Nosaka K, Newton M, and Sacco P. Responses of human elbow flexor muscles to
electrically stimulated forced lengthening exercise. Acta Physiol Scand 174: 137-145, 2002. 48. Olive JL, Slade JM, Dudley GA, and McCully KK. Blood flow and muscle fatigue in SCI
individuals during electrical stimulation. J Appl Physiol 94: 701-708, 2003. 49. Ortenblad N, Lunde PK, Levin K, Andersen JL, and Pedersen PK. Enhanced
sarcoplasmic reticulum Ca(2+) release following intermittent sprint training. Am J Physiol Regul Integr Comp Physiol 279: R152-160, 2000.
50. Parikh S, Morgan DL, Gregory JE, and Proske U. Low-frequency depression of tension in
the cat gastrocnemius muscle after eccentric exercise. J Appl Physiol 97: 1195-1202, 2004. 51. Powers RK and Binder MD. Effects of low-frequency stimulation on the tension-frequency
relations of fast-twitch motor units in the cat. J Neurophysiol 66: 905-918, 1991. 52. Ratkevicius A, Skurvydas A, Povilonis E, Quistorff B, and Lexell J. Effects of contraction
duration on low-frequency fatigue in voluntary and electrically induced exercise of quadriceps muscle in humans. Eur J Appl Physiol Occup Physiol 77: 462-468, 1998.
53. Rijkelijkhuizen JM, de Ruiter CJ, Huijing PA, and de Haan A. Low-frequency fatigue is
fibre type related and most pronounced after eccentric activity in rat medial gastrocnemius muscle. Pflugers Arch 447: 239-246, 2003.
22

54. Rochester L, Chandler CS, Johnson MA, Sutton RA, and Miller S. Influence of electrical stimulation of the tibialis anterior muscle in paraplegic subjects. 1. Contractile properties. Paraplegia 33: 437-449, 1995.
55. Russ DW and Binder-Macleod SA. Variable-frequency trains offset low-frequency fatigue
in human skeletal muscle. Muscle Nerve 22: 874-882, 1999. 56. Saltin B, Henriksson J, Nygaard E, Andersen P, and Jansson E. Fiber types and
metabolic potentials of skeletal muscles in sedentary man and endurance runners. Ann N Y Acad Sci 301: 3-29, 1977.
57. Schwane JA, Johnson SR, Vandenakker CB, and Armstrong RB. Delayed-onset
muscular soreness and plasma CPK and LDH activities after downhill running. Med Sci Sports Exerc 15: 51-56, 1983.
58. Scott Bickel C, Slade JM, VanHiel LR, Warren GL, and Dudley GA. Variable-
frequency-train stimulation of skeletal muscle after spinal cord injury. J Rehabil Res Dev 41: 33-40, 2004.
59. Shields RK. Fatigability, relaxation properties, and electromyographic responses of the
human paralyzed soleus muscle. J Neurophysiol 73: 2195-2206, 1995. 60. Shields RK and Chang YJ. The effects of fatigue on the torque-frequency curve of the the
human paralysed soleus muscle. J Electromyogr Kinesiol 41: 33-40, 1997. 61. Shields RK, Law LF, Reiling B, Sass K, and Wilwert J. Effects of electrically induced
fatigue on the twitch and tetanus of paralyzed soleus muscle in humans. J Appl Physiol 82: 1499-1507, 1997.
62. Skurvydas A, Dudoniene V, Kalvenas A, and Zuoza A. Skeletal muscle fatigue in long-
distance runners, sprinters and untrained men after repeated drop jumps performed at maximal intensity. Scand J Med Sci Sports 12: 34-39, 2002.
63. Skurvydas A, Jascaninas J, and Zachovajevas P. Changes in height of jump, maximal
voluntary contraction force and low-frequency fatigue after 100 intermittent or continuous jumps with maximal intensity. Acta Physiol Scand 169: 55-62, 2000.
64. Slade JM, Bickel CS, Warren GL, and Dudley GA. Variable frequency trains enhance
torque independent of stimulation amplitude. Acta Physiol Scand 177: 87-92, 2003. 65. Soderlund K, Greenhaff PL, and Hultman E. Energy metabolism in type I and type II
human muscle fibres during short term electrical stimulation at different frequencies. Acta Physiol Scand 144: 15-22, 1992.
23

66. Stokes MJ, Edwards RH, and Cooper RG. Effect of low frequency fatigue on human muscle strength and fatigability during subsequent stimulated activity. Eur J Appl Physiol Occup Physiol 59: 278-283, 1989.
67. Tarnopolsky M and Cupido C. Caffeine potentiates low frequency skeletal muscle force in
habitual and nonhabitual caffeine consumers. J Appl Physiol 89: 1719-1724, 2000. 68. Theriault R, Boulay MR, Theriault G, and Simoneau JA. Electrical stimulation-induced
changes in performance and fiber type proportion of human knee extensor muscles. Eur J Appl Physiol Occup Physiol 74: 311-317, 1996.
69. Vanderthommen M, Duteil S, Wary C, Raynaud JS, Leroy-Willig A, Crielaard JM, and
Carlier PG. A comparison of voluntary and electrically induced contractions by interleaved 1H- and 31P-NMRS in humans. J Appl Physiol 94: 1012-1024, 2003.
70. Westerblad H and Allen DG. The effects of intracellular injections of phosphate on
intracellular calcium and force in single fibres of mouse skeletal muscle. Pflugers Arch 431: 964-970, 1996.
71. Westerblad H, Allen DG, and Lannergren J. Muscle fatigue: lactic acid or inorganic
phosphate the major cause? News Physiol Sci 17: 17-21, 2002. 72. Westerblad H, Allen DG, and Lee JA. Measurements of intracellular calcium during
fatiguing stimulation in single Xenopus muscle fibres. Prog Clin Biol Res 315: 231-232, 1989.
73. Westerblad H, Bruton JD, Allen DG, and Lannergren J. Functional significance of Ca2+
in long-lasting fatigue of skeletal muscle. Eur J Appl Physiol 83: 166-174, 2000. 74. Westerblad H, Duty S, and Allen DG. Intracellular calcium concentration during low-
frequency fatigue in isolated single fibers of mouse skeletal muscle. J Appl Physiol 75: 382-388, 1993.
75. Willems ME and Stauber WT. Fatigue and recovery at long and short muscle lengths after
eccentric training. Med Sci Sports Exerc 34: 1738-1743, 2002.
24

CHAPTER III
LOW FREQUENCY FATIGUE AFTER ELECTRICALLY EVOKED
CONTRACTIONS IN TRAINED AND UNTRAINED SUBJECTS
____________________ Mahoney ET, Dudley GA, and McCully K. To be submitted to European Journal of Applied Physiology.
25

Abstract
Low frequency fatigue (LFF) is defined as a relative loss of force at low activation
frequencies and is related to impairments in excitation-contraction coupling. The aim of this
study was to examine LFF in endurance trained (ET) and sedentary (SED) individuals. Ten ET
and nine SED subjects performed two separate neuromuscular electrical stimulation (NMES)
protocols to evoke fatigue of the quadriceps muscle of one thigh (experimental leg) with the un-
fatigued leg as a control. Protocol 1 (‘15 Min’) lasted 15 min and consisted of 3-sec isometric
contractions at 30 Hz with 6 sec between contractions. For protocol 2, stimulation was adjusted
so that fatigue in the SED group was matched to ET during the 15 min protocol (‘Low Matched’)
while fatigue in the ET group was matched to the SED group 15 min protocol (‘High Matched’).
Force was assessed at 20 Hz (P20) and 100 Hz (P100) and the ratio of P20/P100 was used to
evaluate LFF in both thighs before and up to 24 hours following fatigue. The SED group had
significantly greater reduction in force during the 15 Min fatigue protocol (p < 0.001). The SED
group had a greater magnitude of LFF with the 15 Min (p < 0.001) and High Matched (p <
0.020) conditions. The ET group did not recover faster than the SED group for any of the
conditions. Muscle pain 24 hours after the fatigue tests (~1.5 out of 10) may have influenced
LFF values. In summary, ET had less LFF than SED even when relative force loss was matched
between groups, suggesting that endurance trained muscle is more ‘protected’ from LFF.
Endurance trained muscle did not have faster recovery of LFF, but other factors such as muscle
injury make interpretations of the recovery difficult.
Key words: Low frequency fatigue, electrical stimulation, endurance training, calcium
impairment.
26

Introduction
Endurance trained (ET) athletes demonstrate superior fatigue resistance compared to
sedentary (SED) individuals. During exercise, ET subjects have less relative force loss over
contractions and recover faster from metabolic fatigue, which is due to enhanced oxidative
capacity (11, 17, 29). Extensive literature exists regarding muscular force decrements that occur
with metabolic fatigue between ET and SED. However, little is known about how endurance
training affects the prolonged recovery of force, which occurs independent of metabolic fatigue
and is most evident at low frequencies of electrical stimulation (8, 22). This phenomenon is well
documented and is commonly known as low frequency fatigue (LFF), which has been shown to
last 6-8 hours or longer (8, 18, 25).
Low frequency fatigue is defined as a preferential loss of force at low stimulation
frequencies (ie. 20 Hz) compared to high frequencies (ie. 100 Hz). It is commonly assessed by
the ratio of force produced at low and high activation frequencies following muscular fatigue
(25, 27, 28). Although the exact mechanism is unclear, LFF is thought to be due impaired
excitation-contraction coupling with evidence specifically pointing to reduced calcium release
from the sarcoplasmic reticulum at low stimulation frequencies following fatigue (15, 30, 31). As
stated, LFF can exist for hours after fatiguing exercise, but many of the previous studies have not
followed it throughout its full recovery.
Few studies have examined how endurance training might affect LFF after exercise. To
our knowledge, only one study has directly examined LFF between ET and sedentary
individuals. A study by Skurvydas et al. (24) showed that LFF was not different between long
distance runners, sprinters, and untrained men. In this study, LFF was assessed in the thigh but
additional muscle groups were likely recruited during jumping exercise, which may limit these
27

findings. Also, the exercise may not have induced substantial fatigue/injury solely to the
quadriceps muscle, potentially not evoking enough LFF to distinguish differences between
groups.
Low frequency fatigue has been shown to be influenced by metabolic changes within
muscle (16, 19). Pronounced fatigue causes large increases in inorganic phosphate and hydrogen
ions. It is hypothesized that high levels of inorganic phosphate may be taken up into the
sarcoplasmic reticulum, where it may precipitate with calcium (10). The formation of calcium
phosphate would lower free calcium concentrations in the sarcoplasmic reticulum, thus reducing
calcium release. A study by McCully et al. (16) determined that protocols that elicit high levels
of fatigue, and therefore metabolic byproducts, can increase the magnitude of LFF observed
during recovery. With regard to ET and SED individuals, previous literature would indicate that
when these two groups perform identical protocols that SED would incur greater metabolic
fatigue and force loss. For these reasons, it seems plausible that SED individuals would have
greater LFF following contractions, compared to ET subjects.
The aim of the present study was to examine how endurance training influences both the
magnitude and recovery of LFF. Endurance trained and SED subjects performed fatigue tests
that were either identical in the number of contractions or in percentage force loss. We
hypothesize that ET subjects would have: 1) less magnitude of LFF and 2) faster recovery of
LFF compared to SED subjects following the fatigue tests.
Methods
Subjects:
Ten ET (two females) and nine SED (four females) subjects participated in this study.
The participants had no recent history of lower extremity pathology and gave written consent
28

prior to testing. This study was approved by the Institutional Review Board at the University of
Georgia. Sedentary subjects were performing one or fewer days of light aerobic exercise per
week. All of the ET subjects were performing vigorous aerobic exercise (~60-90% of heart rate
maximum) at least 5 hours per week. These subjects consisted of runners, cyclists and/or
triathletes. The recruitment of the ET group was based on the amount of endurance exercise the
subject participated in, rather than absolute aerobic fitness (ie. VO2 max). However, six of the ten
ET subjects had recently achieved VO2 max values ranging from 57 to 69 ml/kg/min during a peak
cycle ergometer test (personal communication Dr. Jonathan Wingo). All subjects were asked to
refrain from intense or unaccustomed exercise 24 hours prior to testing and to remain relatively
inactive for the total duration of testing. In addition, subjects were asked to abstain from caffeine
on testing days as it has been shown to affect muscular force at low activation frequencies (28).
Force measurements:
For isometric contractions of the thigh, subjects were seated in a custom-built force chair
with the hip and knee secured at approximately 70° of flexion. Both legs were firmly secured to a
rigid lever arm with an inelastic strap to ensure that the knee extensors could only perform
isometric contractions. The moment arm was established by placing a load cell (model 2000A;
Rice Lake Weighing Systems, West Coleman Street, Rice Lake, Wisconsin, USA) parallel to the
line of pull and perpendicular to the lever arm. Force was recorded from the load cell using a
MacLab A-D converter (model ML 400; ADInstruments, Milford, Mass., USA) sampling at
100 Hz and interfaced with a portable Macintosh computer (Apple Computer, Cupertino, Calif.,
USA). All force tracings were displayed and recorded on a computer.
29
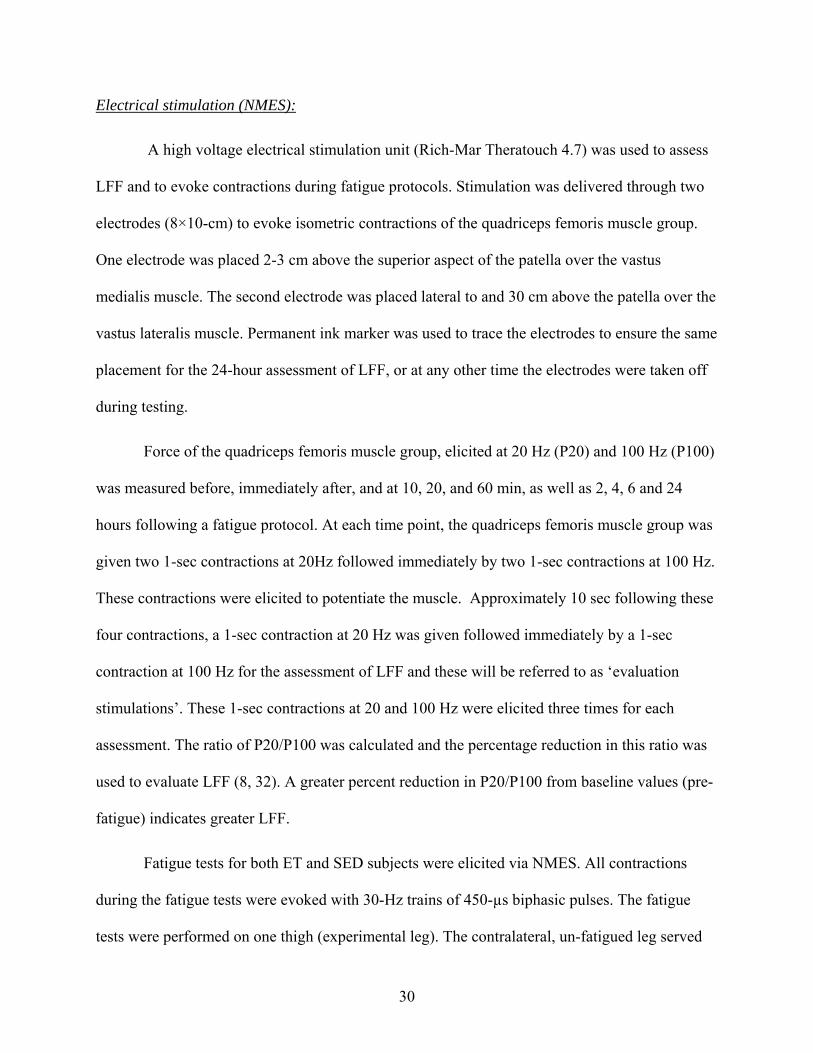
Electrical stimulation (NMES):
A high voltage electrical stimulation unit (Rich-Mar Theratouch 4.7) was used to assess
LFF and to evoke contractions during fatigue protocols. Stimulation was delivered through two
electrodes (8×10-cm) to evoke isometric contractions of the quadriceps femoris muscle group.
One electrode was placed 2-3 cm above the superior aspect of the patella over the vastus
medialis muscle. The second electrode was placed lateral to and 30 cm above the patella over the
vastus lateralis muscle. Permanent ink marker was used to trace the electrodes to ensure the same
placement for the 24-hour assessment of LFF, or at any other time the electrodes were taken off
during testing.
Force of the quadriceps femoris muscle group, elicited at 20 Hz (P20) and 100 Hz (P100)
was measured before, immediately after, and at 10, 20, and 60 min, as well as 2, 4, 6 and 24
hours following a fatigue protocol. At each time point, the quadriceps femoris muscle group was
given two 1-sec contractions at 20Hz followed immediately by two 1-sec contractions at 100 Hz.
These contractions were elicited to potentiate the muscle. Approximately 10 sec following these
four contractions, a 1-sec contraction at 20 Hz was given followed immediately by a 1-sec
contraction at 100 Hz for the assessment of LFF and these will be referred to as ‘evaluation
stimulations’. These 1-sec contractions at 20 and 100 Hz were elicited three times for each
assessment. The ratio of P20/P100 was calculated and the percentage reduction in this ratio was
used to evaluate LFF (8, 32). A greater percent reduction in P20/P100 from baseline values (pre-
fatigue) indicates greater LFF.
Fatigue tests for both ET and SED subjects were elicited via NMES. All contractions
during the fatigue tests were evoked with 30-Hz trains of 450-µs biphasic pulses. The fatigue
tests were performed on one thigh (experimental leg). The contralateral, un-fatigued leg served
30

as control. The experimental leg was assigned by counterbalancing dominant/non-dominant leg
for each subject and was kept the same for each subject for both test sessions. The measurements
of P20 and P100 were assessed in both thighs and P20/P100 values from the control leg were
used statistically to account for the effects of using NMES to evaluate LFF.
Experimental protocol:
Familiarization. Subjects were seated in the custom designed isometric force chair and
their legs and torso were firmly strapped into the chair. Subject’s legs were cleaned with alcohol
and two electrodes were placed on each thigh as previously described. Electrical stimulation at a
frequency of 100 Hz was given to evoke 1-3 sec isometric contractions of the knee extensors at
increasing current levels until ~22.7 kg of isometric force was produced. If this level of NMES
current was tolerated well and subjects were still interested in participation, they were asked to
return to the laboratory 1-2 days later for their first test session.
Test Session 1. Subjects were seated in the custom designed isometric force chair and
their legs and torso were firmly strapped into the chair. Subject’s legs were cleaned with alcohol
and two electrodes were placed on each thigh as previously described. Electrical stimulation
amplitude at 100 Hz was slowly increased over several 1-sec contractions to achieve ~ 22.7 kg of
isometric force in each thigh. After the NMES amplitude was determined, it remained the same
in each leg throughout the duration of each test session for the measurements of P20 and P100,
as well as for fatigue tests. As stated previously, P20 and P100 were measured before,
immediately after, and at 10, 20, and 60 min, as well as 2, 4, 6 and 24 hours following an NMES-
evoked fatigue test.
For test session 1, the NMES-evoked fatigue test for both ET and SED lasted 15 min and
consisted of 3-sec isometric contractions of the thigh with 6-sec rest between contractions. This
31

allowed for a total of one hundred 3-sec contractions, which were evoked at the same NMES
amplitude used for measurement of P20 and P100. This was designated the ’15 Min’ condition.
Test Session 2. Subjects returned for the second test session within a minimum of two
weeks following the first test session. The procedures and evaluation were the same as test
session 1 except that a different fatigue protocol was used. ET subjects performed a protocol
designed to produce the same amount of fatigue as the average fatigue value for the SED
subjects during the 15 min protocol. To achieve this, the ET group performed a fatigue protocol
with a duty cycle of 60% (3 sec on/2 sec off) lasting 8.3 min, allowing ET subjects to perform
the same number of contractions as in test session 1. This was designated the ‘High Matched’
condition. The SED subjects performed a protocol designed to produce the same amount of
fatigue as the average fatigue value for the ET group during the 15 min protocol. The duty cycle
for this fatigue test was the same as session 1, (33%; 3 sec on/6 sec off) and lasted 3-8 min,
which was dependent on individual force reductions in the SED group. This protocol was
designated the ‘Low Matched’ condition.
Assessment of muscle pain:
Muscle pain was evaluated in both the experimental and control leg based on a 10-point
Likert-type scale. Subjects were asked to rate the intensity of leg muscle pain from 0 “no pain at
all” to 10 “worst possible pain imaginable”. Subjects verbally reported these pain ratings before,
and at 24 and 48 hours following the NMES-evoked fatigue test.
Analysis of force tracings:
Force tracings for the first and last three contractions of the fatigue protocols were
analyzed by measuring force-time integrals (FTI). Fatigue was calculated as follows:
32

Fatigue = [FTI (1st 3 contractions) – FTI (last 3 contractions)] ÷ FTI (1st 3 contractions)
Single contractions for the assessment of P20 and P100 were always 1 sec in duration. For each
force tracing at 20 and 100 Hz, the average value for the first 0.5 sec after the initial rise was
analyzed. The highest mean force at 20 Hz and 100 Hz was used in the calculation of the
P20/P100 ratio at each time point.
Statistical Analyses:
Data analyses were performed using SPSS version 13.0 (SPSS Inc., Chicago, IL).
Descriptive statistics are presented in text, figures and tables as mean ± SD unless otherwise
noted. Independent t-tests were used to assess potential differences between the groups in subject
age, body mass, and percent force loss during NMES-evoked fatigue protocols. In the t-test
analyses, the homogeneity of variance was tested using Levene’s test for equality of variance.
Simple linear regression was used to examine relationships between 24 hour LFF (as percent
reduction in P20/P100 ratio) and muscle pain at 24 hours. Statistics were adjusted accordingly if
the assumption of equality of variance was violated.
For all analyses, the ratio of the P20/P100 was calculated for each time point. These time
points were then reported, as the percentage reduction from baseline and from here on will
represent LFF. The time points collected in the first 60 minutes post-fatigue were used to assess
the magnitude of LFF. These time points were selected because theory and prior empirical
research suggest that LFF can last 1 hour or longer when fatiguing contractions are performed
without causing muscle injury (5, 8). Also, 1 hour was selected as this tests our first hypothesis
about the magnitude of LFF after a fatigue protocol.
33

A separate analysis for magnitude of LFF was performed for each of the testing
conditions (ie. 15 Min, High Matched and Low Matched protocols). In each analysis, magnitude
of LFF in the experimental leg was analyzed using a 2 (group: SED, ET) x 4 (time: 0, 10, 20, and
60 minutes post-fatigue) mixed model ANCOVA with a repeated measure on the time variable.
P20/P100 ratio values for the control leg were used as varying covariates in an attempt to control
for the effects of using NMES to assess LFF.
A separate analysis for recovery of LFF was performed for each of the testing conditions
(ie. 15 Min, High Matched and Low Matched protocols). Recovery of LFF was analyzed using a
2 (group) x 8 (time: 0, 10, 20, 60 minutes; 2, 4, 6, and 24 hours) trend analysis in order to
examine differences in the rate of recovery between groups after the fatigue protocol. The
control leg LFF values were used as covariates in the trend analyses.
Perception of thigh muscle pain 24 and 48 hours after the fatigue protocol was used as an
indirect measure of muscle injury. A separate analysis for thigh muscle pain intensity was
performed for each of the experimental conditions (ie. 15 Min, High Matched and Low Matched
protocols). Pain data were analyzed using a 2 (group) x 3 (time: Pre, 24 & 48 hours post-fatigue)
ANOVA with repeated measure on the time variable.
Simple t-tests were used to assess potential differences in 100 Hz force between baseline
and 24-hour post-fatigue data within groups for each condition. Significant reductions in 100 Hz
muscle force at 24 hours were also used as an indicator of muscle injury.
All mixed model analyses were based on the F-statistic. Effects sizes for F-statistics were
expressed as partial eta-squared (η2). The Greenhouse-Geisser epsilon (ε) was reported and
degrees of freedom were adjusted when the sphericity assumption was violated (ie. if Mauchly’s
34

test of sphericity was statistically significant at p < 0.05). The familywise error rate was
controlled using the Bonferroni adjustment when tests of simple effects were conducted.
Results
Participant Characteristics:
Subject demographics are shown in table 3.1. No statistically significant differences
existed between groups for age (F (17) = 0.142, p = 0.244) or body mass (F (17) = 5.28, p =
0.656). Ten ET subjects completed test session 1 (‘15 Min’ condition). Nine of these ET
subjects returned to complete test session 2 (‘High Matched’ condition). The ET subject that did
not finish the study had scheduling difficulties and was unable to return for test session 2. Nine
SED subjects completed both test session 1 and 2 (‘15 Min’ and ‘Low Matched’ conditions). No
adverse events occurred during this study.
Force Reduction During NMES-Fatigue Protocols:
There was a significantly greater percent reduction in force in the SED group than the ET
group with the 15 Min fatigue protocol (-49.6 ± 9.5% vs. -27.6 ± 9.4%, respectively) (p < 0.001).
There was not a statistically significant difference in force loss between the SED and ET groups
in the High Matched (p = 0.57) and Low Matched (p = 0.99) conditions. Percent reduction in
force-time integrals during these NMES-evoked fatigue protocols for the ET and SED groups are
shown in Figure 3.1.
The duration of the ET High Matched fatigue protocol was 8.3 minutes, and used a shorter
duty cycle (3 s on/ 2 s off) in order to produce the same amount of fatigue as the average fatigue
value for the SED group during the 15 min protocol (~50%). The SED Low Matched fatigue test was
performed at the same duty cycle as the 15 min protocol (3 s on/ 6 s off) and lasted 4.8 ± 1.5
35

min, which was dependent on individual force reductions in this group. This protocol was used
to produce the same amount of fatigue as the ET group during the 15 min protocol (~28%).
Force Tracings:
Force tracings at 20 Hz and 100 Hz are shown in Fig. 3.2 for one sedentary subject before
and 1-hour following a fatigue test. Using the ratio of these forces allowed for quantification of
LFF. One hour after the fatigue protocol, 100 Hz force has returned to near baseline values,
whereas 20 Hz force is still depressed substantially.
100 Hz Force:
Percent change 100 Hz force values after a fatigue protocol are shown in Figure 3.3 (a-c) for 15
Min (a) and High Matched (b) conditions between ET and SED over 24 hours post-fatigue.
These data have been statistically adjusted for the control leg but no other statistical tests were
performed for these data. Return of 100 Hz force to baseline values shortly after exercise can be
used to assess recovery of metabolic fatigue.
LFF in the Control Leg:
Figure 3.4 shows the percent change from baseline P20/P100 values in the control leg for
the 15 Min condition in ET and SED groups. Both groups showed small amounts of LFF (8-
12%) in the control leg that remained constant over the time of the experiment. Data in the
control leg for the High and Low Matched conditions yielded similar responses (data not shown).
No statistical tests were performed for LFF in the control leg. In this study, LFF data from the
‘control leg’ will be used to statistically adjust for LFF values in the ‘experimental leg’. This
allowed us to determine what affect the fatigue protocol has on the response independent of the
evaluation stimulations.
36

Magnitude of LFF:
The magnitude of LFF, expressed as percent change from baseline P20/P100 ratio values
across the first 60 minutes post-fatigue, was examined for the 15 Min, High Matched and Low
Matched conditions (Figure 3.5a-c). No significant group x time interaction was found for the 15
Min (F (3, 50) = 0.43, p = 0.730, η2 = 0.025), High Matched (F (3, 47) = 0.96, p = 0.420, η2
=
0.058) or Low Matched (F (3, 50) = 1.71, p = 0.177, η2 = 0.093) conditions.
15 Min Condition. The magnitude of LFF was significantly greater in the SED group
compared to ET, based on a main effect for group (F (1,16) = 28.50, p < 0.001, η2 = 0.640), but
not time effect (F (3,50) = 1.44, p = 0.243, η2 = 0.079) for the 15 Min condition (Fig. 3.5a).
High Matched Condition. The magnitude of LFF was significantly greater in the SED
group compared to ET for the High Matched condition (Fig. 3.5b). This was based on a
significant main effect for group (F (1,15) = 6.74, p = 0.020, η2 = 0.310). In addition, there was a
significant main effect for time (F (3, 47) = 3.34, p = 0.027, η2 = 0.176) for this condition.
Low Matched Condition. The magnitude of LFF was not different between SED and ET
for the Low Matched condition. This was based on a lack of a significant main effect for group
(F (1, 16) = 0.20, p = 0.660, η2 = 0.012) (Fig. 3.5c). In addition, there was no significant main
effect for time (F (3,50) = 1.57, p = 0.208, η2 = 0.086) for this condition.
Recovery of LFF:
Trend analysis was used to examine difference between groups in the recovery of LFF
across the 24-hour period following the fatigue protocols (ie. 15 Min, High Matched and Low
Matched).
15 Min Condition. The recovery of LFF was significantly faster in SED compared to ET.
This was based on a significant group by trend interaction for the linear recovery of LFF over the
37
24-hour period between groups following the 15-minute fatigue protocol (F (7,135) = 2.77, p =
0.010, η2 = 0.126), which is shown in Fig. 3.6a. Decomposition of the interaction showed that
SED group recovered from LFF at a 9% greater rate than the ET group (t = 4.22, p < .001),
which was based on the differences in slopes for the linear trend between groups. Examination of
the data shows that the ET had only slight recovery of LFF over the 24 hours.
High Matched Condition. The recovery of LFF was not different between SED and ET
groups for the High Matched condition (Figure 3.6b). This was based on a lack of significant
group by trend interaction over the 24-hour post-fatigue period (F (7,127) = 0.72, p = 0.652, η2 =
0.038). However, there was a significant main effect for group (F (1, 127) = 18.73, p < 0.001, η2
= 0.129) and time (F (7, 127) = 13.03, p < 0.001, η2 = 0.418) for the recovery of LFF in the High
Matched condition.
Low Matched Condition. The recovery of LFF was not different between SED and ET
groups for the Low Matched condition (Figure 3.6c). This was based on a lack of significant
group by trend interaction over the 24-hour post-fatigue period (F (7,135) = 1.57, p = 0.149, η2 =
0.075). There was a significant main effect for time (F (7,135) = 5.50, p < 0.001, η2 = 0.222) but
not for group (F (1,135) = 1.62, p = 0.205, η2 = 0.012) for the recovery of LFF in the Low
Matched condition.
Indicators of Muscle Injury: Muscle pain ratings in the experimental leg in ET and SED groups at 24 and 48 hours
post-fatigue are shown in Table 3.2. (Pain was ‘0’ in all subjects before testing.) No pain was
reported for the control leg at pre, or at 24 or 48 hours post-fatigue. There were no significant
differences in pain ratings between groups at any time point. No significant group x time
interaction for pain was found for the 15 Min (F (2, 34) = 1.04, p = 0.364), High Matched (F (2,
38

32) = 0.785, p = 0.465) or Low Matched (F (2, 34) = 0.785, p = 0.460) conditions. Similarly, no
significant main effect for group was found for any of the three conditions (F (1, 17) = 1.65, p =
0.216; F (1, 16) = 1.129, p = 0.304; F (1, 17) = 0.831, p = 0.375 for 15 Min, High and Low
Matched, respectively.) However, all conditions demonstrated a significant main effect for time
(F (2, 34) = 37.39, p < 0.001), (F (2, 32) = 26.95, p < 0.001) and (F (2, 34) = 26.38, p < 0.001)
for 15 Min, High Matched, and Low Matched conditions, respectively).
Significant reductions in 100 Hz muscle force at 24 hours (from baseline values) were
used as an indicator of muscle injury. There were no significant within-group reductions in 100
Hz force at 24 hours compared to baseline values for any condition, indicating that muscle injury
was likely minimal. (p values = 0.092, 0.354, 0.397, and 0.230 for ET 15 Min, SED 15 Min, ET High
Matched, and SED Low Matched protocols, respectively).
Association between LFF and muscle pain:
LFF values and pain ratings at 24 hours post-fatigue in the experimental leg were used to
assess possible associations between LFF and muscle pain in the current study. There was a
significant linear relationship between 24-hour measures of LFF (as percent reduction in
P20/P100 ratio) and 24 h pain ratings for the 15 Min condition (r = -0.494, p = 0.032). This
indicates that approximately 24% of the variance in LFF at 24 h can be explained by muscle pain
or more indirectly, muscle injury. No significant relationships were found for these same
variables for the High Matched (r = -0.313, p = 0.207), and Low Matched (r = -0.064, p = 0.795)
conditions.
Discussion
The main finding of this study was that the SED group had a greater magnitude of LFF
compared to the ET group after fatigue protocols matched either to the total number of
39

contractions (15 Min) or the total amount of fatigue (High Matched). This is an important finding
as no differences in LFF have previously been reported between SED and ET subjects. In
addition, our results are consistent with the numerous studies that have shown that with the same
NMES-evoked or voluntary protocol that the total amount of fatigue is less in ET compared to
SED individuals (17, 29). In fact, our SED group had nearly double the amount of force loss
compared to ET (-49.6 ± 9.5% vs. -27.6 ± 9.4%, respectively) after the 15-minute fatigue
protocol. Regardless of whether fatigue was matched between groups, ET subjects appear to be
less susceptible to LFF following NMES-evoked contractions.
There are only two previous studies that have examined how aerobic fitness affects LFF
(3, 24) and the results are difficult to compare to our study. Skurvydas et al. (24) examined LFF
in long-distance runners, sprinters and untrained men after voluntary, jumping exercise. They
demonstrated substantial LFF immediately after, and 20 minutes following exercise in all groups,
but no between-group differences were observed. In this study, LFF was assessed in the thigh but
additional muscle groups were likely recruited during exercise, which may limit their findings.
Babcock et al. (24) examined LFF of the diaphragm muscle in highly fit and fit subjects before
and after an intense bout of running. They showed that both groups had significant LFF at 0 and
20 minutes post-fatigue, but no differences existed between groups at any time point. Both of
these two studies used voluntary, whole body exercise and then assessed LFF in one muscle or
muscle group, whereas the current study used NMES in the thigh muscles for exercise and for
assessment of LFF. Mixed findings between the previous studies and ours may be related to the
use of NMES-evoked exercise, which causes profound fatigue compared to voluntary exercise
and is likely due to altered motor unit recruitment patterns (9, 13, 14), as well as synchronous
activation of a motor units (1, 21). Also, it has been reported that NMES-evoked contractions
40

cause greater LFF than do voluntary ones (22), which may be responsible for the large
magnitude of LFF, and the differences observed between ET and SED in the present study.
A factor that may explain differences in the magnitude of LFF observed is the amount of
metabolic stress that occurred during the fatigue protocol (16). A study by McCully et al. (16)
used an in vivo rat model to examine the potential role that metabolic byproducts might have on
LFF. They examined muscular force and metabolic byproducts during and following bouts of
electrical stimulation. Metabolic fatigue was based on concentrations of inorganic phosphate and
LFF was assessed by force produced at low (20Hz) and high frequency (120Hz) electrical
stimulation. They determined that protocols that elicit high levels of fatigue, and therefore
metabolic byproducts, can increase the magnitude of LFF observed during recovery. This study
supports our results in that higher levels of fatigue, as was the case for SED after the 15 min
protocol, lead to greater initial amounts of LFF.
Although not quantitatively measured in this study, SED subjects likely incurred greater
metabolic stress during the 15 min fatigue protocol as force loss was nearly double that of ET.
Even when force loss was the same between groups, ET likely have less disruption in overall
metabolism due to enhanced mitochondrial function (17), which would blunt the production of
inorganic phosphate and hydrogen ions. It has been suggested that at high concentrations,
inorganic phosphate can enter the sarcoplasmic reticulum and precipitate with calcium (10)
therefore reducing available calcium for release. With a similar metabolic environment, muscle
force would be most affected at low activation frequencies and may be a plausible explanation as
to why the magnitude of LFF was more pronounced in SED subjects.
Recovery of LFF over 24 hours was not greater in ET for any of the conditions. However,
trend analysis revealed that the SED group actually recovered faster (~9%) from LFF compared
41

to ET following the 15-minute fatigue protocol. In fact, the ET had minimal recovery of LFF
over 24 hours after this fatigue protocol. This was unexpected, as we predicted that recovery
would be faster in ET subjects. Although overwhelming evidence shows that ET subjects recover
faster from metabolic fatigue, it is apparent that the recovery of LFF is distinctly different. It
seems plausible that SED recovered faster only because of their large magnitude of LFF.
Despite this finding, ET subjects are still better at maintaining low frequency force after fatigue,
which is important as most submaximal, voluntary contractions are elicited at low frequencies
(15-20 Hz)(20).
To our knowledge, no studies have assessed LFF at several time points throughout a
prolonged recovery period (ie. 24 hours) between ET and SED subjects, as was done in the
current study. Regardless of the groups examined, few studies have followed the recovery of
LFF more than an hour after exercise, even though it is possible to last several hours or even
days (5, 8, 12, 18). Skurvydas et al. (26) reported that after a 60 sec isometric sustained maximal
contraction of the quadriceps muscle, significant LFF was observed at 15 minutes post-exercise
in healthy untrained men. In a study by Blangsted et al. (5), healthy subjects performed static
wrist extension at 10% of maximal voluntary contraction for 10 minutes. They demonstrated that
their protocol caused significant LFF that lasted up to their final assessment at 2.5 hours post-
exercise. Besides fatigue, other factors such as muscle injury have been shown to affect LFF (7,
12, 18, 23), which seems to have a more profound, long-lasting effect on the response. Since the
origin of LFF has been attributed to disruption in the excitation-contraction coupling process,
studies have demonstrated that muscle injury can impair calcium handling and affect muscular
force, most predominately at low frequencies (2, 6, 18). Child et al. (7) examined the recovery of
LFF after a bout of eccentric contractions of the thigh, which were evoked by NMES and caused
42

significant muscle pain and injury. They showed that subjects had significant LFF up to 3 days
following this type of damaging exercise. It is apparent from such studies that decrements in low
frequency force can be severe with muscle injury and can last for days.
Prior to the start of this study, we believed that using NMES to evoke isometric
contractions would not cause muscle injury in able-bodied subjects based on previous research
(4). However, we believe that small amounts of muscle injury may have occurred in this study
and confounded our results, making interpretations of the recovery of LFF difficult. In the
current study, nearly three-fourths of all subjects tested reported low levels of muscle pain 24
hour post-fatigue, which would indicate that muscle injury, albeit minor, might have occurred.
Although 100 Hz force was not significantly reduced at 24 hours, P20/P100 ratios at 24 hours
were still reduced 10-15% from baseline values in all groups and conditions, which can be best
explained by the long-lasting effects of muscle injury. It is likely that some combination of
metabolic fatigue, as well as muscle injury played a role in the LFF response. However, the
current study does not allow us to determine their relative importance.
Several potential limitations exist for this study. First, it was not feasible to have subjects
remain in the force chair for 24 hours and therefore they had to re-enter the force chair several
times throughout the study, which may have increased variability of our force measures. To
counter this we tried to be as meticulous as possible by setting up subjects in the force chair the
same way each time they arrived and by using the non-fatigued leg as control. Secondly, surface
NMES was used and changes in the properties of the electrodes and/or the skin over the course
of the study may have altered conductance of electrical current and generation of muscular force.
Subjects were asked to remain relatively inactive over the course of the day and the electrodes
were traced to ensure the same placement for the 24-hour assessment of LFF, or at any other
43

time the electrodes were taken off during testing. Third, this study used submaximal electrical
current to evoke muscular contractions of the quadriceps muscle and therefore only small
portions of this muscle group were likely recruited. Submaximal current was used to limit the
pain associated with its use in individuals with normal sensory function. Future studies may want
to stimulate smaller muscles to maximize the chance of activating the entire muscle. Regardless,
this study shows that there are distinct differences in the magnitude of LFF between ET and SED
subjects.
Conclusion
In summary, ET had less magnitude of LFF compared to SED even when total fatigue
was matched, suggesting that endurance trained muscle is more ‘protected’ from LFF. Endurance
trained muscle did not have faster recovery of LFF, but other factors such as muscle injury make
interpretations of the recovery difficult. Future studies are needed to utilize voluntary
contractions to examine potential differences in LFF between ET and SED individuals. The
performance of voluntary contractions will reduce the chance that muscle injury will occur and
any differences in LFF can be attributed to the metabolic perturbations between these two
groups.
References
1. Adams GR, Harris RT, Woodard D, and Dudley GA. Mapping of electrical muscle stimulation using MRI. J Appl Physiol 74: 532-537, 1993.
2. Armstrong RB, Duan C, Delp MD, Hayes DA, Glenn GM, and Allen GD. Elevations in
rat soleus muscle [Ca2+] with passive stretch. J Appl Physiol 74: 2990-2997, 1993. 3. Babcock MA, Pegelow DF, Johnson BD, and Dempsey JA. Aerobic fitness effects on
exercise-induced low-frequency diaphragm fatigue. J Appl Physiol 81: 2156-2164, 1996. 4. Bickel CS, Slade JM, and Dudley GA. Long-term spinal cord injury increases susceptibility
to isometric contraction-induced muscle injury. Eur J Appl Physiol 91: 308-313, 2004.
44

5. Blangsted AK, Sjogaard G, Madeleine P, Olsen HB, and Sogaard K. Voluntary low-force contraction elicits prolonged low-frequency fatigue and changes in surface electromyography and mechanomyography. J Electromyogr Kinesiol 15: 138-148, 2005.
6. Byrd SK. Alterations in the sarcoplasmic reticulum: a possible link to exercise-induced
muscle damage. Med Sci Sports Exerc 24: 531-536, 1992. 7. Child RB, Brown SJ, Day SH, Saxton JM, and Donnelly AE. Manipulation of knee
extensor force using percutaneous electrical myostimulation during eccentric actions: effects on indices of muscle damage in humans. Int J Sports Med 19: 468-473, 1998.
8. Edwards RH, Hill DK, Jones DA, and Merton PA. Fatigue of long duration in human
skeletal muscle after exercise. J Physiol 272: 769-778, 1977. 9. Feiereisen P, Duchateau J, and Hainaut K. Motor unit recruitment order during voluntary
and electrically induced contractions in the tibialis anterior. Exp Brain Res 114: 117-123, 1997.
10. Fryer MW, Owen VJ, Lamb GD, and Stephenson DG. Effects of creatine phosphate and
P(i) on Ca2+ movements and tension development in rat skinned skeletal muscle fibres. J Physiol 482 ( Pt 1): 123-140, 1995.
11. Guthrie BM, Frostick SP, Goodman J, Mikulis DJ, Plyley MJ, and Marshall KW.
Endurance-trained and untrained skeletal muscle bioenergetics observed with magnetic resonance spectroscopy. Can J Appl Physiol 21: 251-263, 1996.
12. Jones DA, Newham DJ, and Torgan C. Mechanical influences on long-lasting human
muscle fatigue and delayed-onset pain. J Physiol 412: 415-427, 1989. 13. Kim CK, Bangsbo J, Strange S, Karpakka J, and Saltin B. Metabolic response and
muscle glycogen depletion pattern during prolonged electrically induced dynamic exercise in man. Scand J Rehabil Med 27: 51-58, 1995.
14. Knaflitz M, Merletti R, and De Luca CJ. Inference of motor unit recruitment order in
voluntary and electrically elicited contractions. J Appl Physiol 68: 1657-1667, 1990. 15. Lamb GD, Junankar PR, and Stephenson DG. Raised intracellular [Ca2+] abolishes
excitation-contraction coupling in skeletal muscle fibres of rat and toad. J Physiol 489 ( Pt 2): 349-362, 1995.
16. McCully KK, Authier B, Olive J, and Clark BJ, 3rd. Muscle fatigue: the role of
metabolism. Can J Appl Physiol 27: 70-82, 2002. 17. McCully KK, Vandenborne K, DeMeirleir K, Posner JD, and Leigh JS, Jr. Muscle
metabolism in track athletes, using 31P magnetic resonance spectroscopy. Can J Physiol Pharmacol 70: 1353-1359, 1992.
45

18. Newham DJ, Mills KR, Quigley BM, and Edwards RH. Pain and fatigue after concentric and eccentric muscle contractions. Clin Sci (Lond) 64: 55-62, 1983.
19. Parikh S, Morgan DL, Gregory JE, and Proske U. Low-frequency depression of tension
in the cat gastrocnemius muscle after eccentric exercise. J Appl Physiol 97: 1195-1202, 2004. 20. Pucci AR, Griffin L, and Cafarelli E. Maximal motor unit firing rates during isometric
resistance training in men. Exp Physiol 91: 171-178, 2006. 21. Ratkevicius A, Mizuno M, Povilonis E, and Quistorff B. Energy metabolism of the
gastrocnemius and soleus muscles during isometric voluntary and electrically induced contractions in man. J Physiol 507 ( Pt 2): 593-602, 1998.
22. Ratkevicius A, Skurvydas A, Povilonis E, Quistorff B, and Lexell J. Effects of
contraction duration on low-frequency fatigue in voluntary and electrically induced exercise of quadriceps muscle in humans. Eur J Appl Physiol Occup Physiol 77: 462-468, 1998.
23. Rijkelijkhuizen JM, de Ruiter CJ, Huijing PA, and de Haan A. Low-frequency fatigue is
fibre type related and most pronounced after eccentric activity in rat medial gastrocnemius muscle. Pflugers Arch 447: 239-246, 2003.
24. Skurvydas A, Dudoniene V, Kalvenas A, and Zuoza A. Skeletal muscle fatigue in long-
distance runners, sprinters and untrained men after repeated drop jumps performed at maximal intensity. Scand J Med Sci Sports 12: 34-39, 2002.
25. Skurvydas A, Jascaninas J, and Zachovajevas P. Changes in height of jump, maximal
voluntary contraction force and low-frequency fatigue after 100 intermittent or continuous jumps with maximal intensity. Acta Physiol Scand 169: 55-62, 2000.
26. Skurvydas A, Mamkus G, Stanislovaitis A, Mickeviciene D, Bulotiene D, and Masiulis
N. Low frequency fatigue of quadriceps muscle after sustained maximum voluntary contractions. Medicina (Kaunas) 39: 1094-1099, 2003.
27. Stokes MJ, Edwards RH, and Cooper RG. Effect of low frequency fatigue on human
muscle strength and fatigability during subsequent stimulated activity. Eur J Appl Physiol Occup Physiol 59: 278-283, 1989.
28. Tarnopolsky M and Cupido C. Caffeine potentiates low frequency skeletal muscle force in
habitual and nonhabitual caffeine consumers. J Appl Physiol 89: 1719-1724, 2000. 29. Theriault R, Boulay MR, Theriault G, and Simoneau JA. Electrical stimulation-induced
changes in performance and fiber type proportion of human knee extensor muscles. Eur J Appl Physiol Occup Physiol 74: 311-317, 1996.
46

30. Westerblad H, Allen DG, and Lee JA. Measurements of intracellular calcium during fatiguing stimulation in single Xenopus muscle fibres. Prog Clin Biol Res 315: 231-232, 1989.
31. Westerblad H, Duty S, and Allen DG. Intracellular calcium concentration during low-
frequency fatigue in isolated single fibers of mouse skeletal muscle. J Appl Physiol 75: 382-388, 1993.
32. Willems ME and Stauber WT. Fatigue and recovery at long and short muscle lengths after
eccentric training. Med Sci Sports Exerc 34: 1738-1743, 2002.
47

48

Figure 3.1. Percent reduction in force-time integrals during fatigue protocols in endurance
trained and sedentary subjects. Values are Mean ± SD; * p ≤ 0.05 for SED vs. ET.
49

Figure 3.2. Representative force tracings at 20 Hz and 100 Hz for one sedentary participant pre-
and 1-hour post-fatigue.
50

Figure 3.3 (a-c). 100 Hz force values (% initial) for 15 Min (a), High Matched (b) and Low
Matched (c) conditions in ET and SED. Return of 100 Hz force to baseline values shortly after
exercise can be used to assess recovery of metabolic fatigue. Values are Mean ± SD and have
been statistically adjusted for the control leg. (ET = open circles; SED = filled triangles). No
statistical tests were performed for these data.
51

Figure 3.4. Control leg LFF values over 24 hours post-fatigue in ET and SED for the 15 Min
condition (High and Low Matched not shown). Values are Mean ± SD. (ET = open circles; SED
= filled triangles). No statistical tests were performed for these data.
52

Figure 3.5 (a-c). Magnitude of LFF over 1-hour post-fatigue for 15 Min (a), High Matched (b)
and Low Matched (c) conditions in ET and SED. Values are Mean ± SD and have been
statistically adjusted for the control leg. * p ≤ 0.05, Main effect for group (ET = open circles;
SED = filled triangles).
53

Figure 3.6 (a-c). Recovery of LFF for 15 Min (a), High Matched (b) and Low Matched (c)
conditions in ET and SED over 24 hours post-fatigue. Values are Mean ± SD and have been
statistically adjusted for the control leg. * p ≤ 0.05, group by trend interaction with SED
recovering from LFF at a greater rate. (ET = open circles; SED = filled triangles).
54

55

CHAPTER IV
LOW FREQUENCY FATIGUE IN INDIVIDUALS WITH SPINAL CORD INJURY
____________________ Mahoney ET, Dudley GA, and McCully K. To be submitted to Muscle and Nerve
56
Abstract
Low frequency fatigue (LFF) is defined as a prolonged, preferential loss of muscular
force at low activation frequencies and is related to impairments in excitation-contraction
coupling. The primary aim of this study was to examine the magnitude and recovery of LFF
following a fatigue test in spinal cord injured (SCI) and sedentary able-bodied subjects. Nine
able-bodied and nine SCI subjects performed a single neuromuscular electrical stimulation
(NMES) protocol to evoke fatigue of the quadriceps muscle of one thigh (experimental leg) with
the un-fatigued leg as a control. The fatigue test for able-bodied subjects lasted 15 min and the
duty cycle was 33% (3 s On/6 sec Off). For SCI, stimulation was adjusted so that fatigue was
matched to the able-bodied group during the 15 min protocol. Force was assessed at 20 Hz (P20)
and 100 Hz (P100) and the ratio of P20/P100 was used to evaluate LFF in both thighs before and
up to 24 hours following fatigue. Results indicated that force loss during the fatigue protocol was
not different between groups. In the experimental leg, the magnitude of LFF was not
significantly different between groups. Recovery of LFF over the 24 hours was significantly
greater in able-bodied compared to SCI in both the experimental (p < 0.001) and control leg (p <
0.001). When LFF values in the experimental leg were corrected for LFF values in the control
leg, no differences existed between groups (p=0.064). The able-bodied group showed a gradual
recovery of LFF in the experimental leg, while the SCI did not. These results demonstrate that
SCI are more susceptible to LFF than able-bodied subjects. Importantly, just testing for LFF
produced substantial LFF in the SCI group, and can account for a substantial portion of the
response. We propose that muscle injury is the main factor responsible for the incomplete
recovery of LFF in the SCI group and future studies need to test whether fatigue in SCI subjects
actually represents the accumulation of muscle injury rather than fatigue.
57

Key words: Low frequency fatigue, spinal cord injury, electrical stimulation, calcium
impairment, muscle injury.
Introduction
Spinal cord injury (SCI) leads to dramatic alterations in skeletal muscle morphology and
function depending on the level of injury. The use of neuromuscular electrical stimulation
(NMES) is commonly used in those with SCI to facilitate contraction of the paralyzed
musculature for both rehabilitation as well as fitness conditioning. It is well established that the
use of NMES requires greater energy demand and consequently leads to a disproportionate
amount of fatigue when compared to similar voluntary efforts (1, 11, 16, 36). In addition, muscle
fatigue has been reported to be greater in individuals with SCI during NMES-evoked
contractions, as compared to able-bodied controls (2, 5, 13, 23). The affected musculature of SCI
can undergo dramatic losses in force during NMES-evoked contractions, equating 2-4 fold
greater relative force loss than able-bodied (5, 13).
Although a great deal of literature exists regarding fatigue during NMES-evoked
contractions in SCI and able-bodied subjects, few studies have examined recovery of muscular
force after a fatiguing bout of exercise. After exercise, prolonged decrements in muscular force
have been documented, and occur mainly at low frequencies of electrical stimulation (7, 26).
This has appropriately been termed low frequency fatigue (LFF) and is defined as a preferential
loss of force at low activation frequencies (ie. 20 Hz) compared to high frequencies (ie. 100 Hz).
Low frequency fatigue is commonly assessed by the ratio of force produced at low and high
activation frequencies following muscular fatigue (7, 28, 32, 34). Although the exact mechanism
is unclear, LFF is thought to be due impaired excitation-contraction coupling with evidence
58

specifically pointing to reduced calcium release from the sarcoplasmic reticulum at low
stimulation frequencies following fatigue (7, 8, 20, 38).
Following muscular contractions, LFF is evident in both fast and slow twitch muscle
fibers of animals, as well as humans (14). However, it has been reported that fast-glycolytic
fibers demonstrate greater LFF than do fast-oxidative fibers (25, 27). Powers & Binder (1991)
reported that fatigue resistant motor units from cat flexor digitorum muscles exhibited less
pronounced LFF than fast intermediate and fast-fatigable motor units after electrically stimulated
contractions. “Slow to fast” fiber conversion has been shown to occur 1-2 years after SCI with
increased expression of myosin heavy chain IIa and IIx (3, 10), as well as faster contraction
speeds (9, 29). This shift to predominantly fast-twitch muscle with SCI may predispose them to
higher levels of LFF following contractions.
Low frequency fatigue has been shown to be influenced by metabolic changes within
muscle (19). Pronounced fatigue causes large increases in inorganic phosphate and hydrogen
ions. It is hypothesized that high levels of inorganic phosphate may be taken up into the
sarcoplasmic reticulum, where it may precipitate with calcium (8). The formation of calcium
phosphate would lower free calcium concentrations in the sarcoplasmic reticulum, thus reducing
calcium release. A study by McCully et al. (19) determined that protocols that elicit high levels
of fatigue, and therefore metabolic byproducts, can increase the magnitude of LFF observed
during recovery.
Low frequency fatigue is more pronounced when muscle injury has occurred (6, 15, 22,
27). Since the origin of LFF has been attributed to disruption in the excitation-contraction
coupling process, studies have demonstrated that muscle injury can impair calcium
release/reuptake rates and affect muscular force (4), most predominately at low activation
59

frequencies (22). Unloaded skeletal muscle, as in SCI, has been shown to be more susceptible to
muscle injury upon reloading (2, 17, 21, 24, 33, 37). A study by Bickel et al. (2) showed that
individuals with long-term SCI had significant muscle injury in the quadriceps muscle following
NMES-evoked isometric contractions, whereas able-bodied had no injury. Since SCI have
greater metabolic impairment, increased risk of contraction-induced muscle injury, as well as a
near complete transformation from slow to fast twitch muscle fibers, it seems plausible that they
would have greater LFF following contractions, compared to ambulatory individuals.
To our knowledge, no studies have examined LFF between able-bodied subjects and
those with SCI. We have recently shown that sedentary, able-bodied subjects had a greater
magnitude of LFF compared to endurance-trained athletes after equivalent levels of fatigue.
(Mahoney et al., in preparation). The aim of the present study is to examine the magnitude and
recovery of LFF between SCI and able-bodied subjects following a fatigue protocol designed to
match force loss. We hypothesize that able-bodied subjects will have: 1) less magnitude of LFF
and 2) a faster recovery of LFF compared to SCI subjects.
Methods Subjects:
Nine SCI (2 females) and nine able-bodied (four females) subjects participated in this
study. Motor and sensory function of SCI participants was previously assessed by the American
Spinal Association (ASIA) classification system. All SCI participants were non-ambulatory and
consisted of those with complete and incomplete spinal lesions ranging from C5 to T9. Mean
duration of spinal injury was 13.6 ± 12.2 years. The participants gave written consent prior to
testing. This study was approved by the Institutional Review Boards of the University of Georgia
and Shepherd Center. Able-bodied subjects were performing one or fewer days of light aerobic
60

exercise per week. All subjects were asked to refrain from intense or unaccustomed exercise 24
hours prior to testing and to remain relatively inactive for the total duration of testing. In
addition, subjects were asked to abstain from caffeine on testing days as it has been shown to
affect muscular force at low activation frequencies (35).
Force measurements:
For isometric contractions of the thigh, subjects were seated in a custom-built force chair
with the hip and knee secured at approximately 70° of flexion. Both legs were firmly secured to a
rigid lever arm with an inelastic strap to ensure that the knee extensors could only perform
isometric contractions. The moment arm was established by placing a load cell (model 2000A;
Rice Lake Weighing Systems, West Coleman Street, Rice Lake, Wisconsin, USA) parallel to the
line of pull and perpendicular to the lever arm. Force was recorded from the load cell using a
MacLab A-D converter (model ML 400; ADInstruments, Milford, Mass., USA) sampling at
100 Hz and interfaced with a portable Macintosh computer (Apple Computer, Cupertino, Calif.,
USA). All force tracings were displayed and recorded on a computer.
Electrical stimulation (NMES). A high voltage electrical stimulation unit (Rich-Mar
Theratouch 4.7) was used to assess LFF and to evoke contractions during fatigue protocols.
Stimulation was delivered through two electrodes (8×10-cm) to evoke isometric contractions of
the quadriceps femoris muscle group. One electrode was placed 2-3 cm above the superior aspect
of the patella over the vastus medialis muscle. The second electrode was placed lateral to and 30
cm above the patella over the vastus lateralis muscle. Permanent ink marker was used to trace the
electrodes to ensure the same placement for the 24-hour assessment of LFF, or at any other time
the electrodes were taken off during testing.
61
Force of the quadriceps femoris muscle group, elicited at 20 Hz (P20) and 100 Hz (P100)
was measured before, immediately after, and at 10, 20, and 60 min, as well as 2, 4, 6 and 24
hours following a fatigue protocol. At each time point, the quadriceps femoris muscle group was
given two 1-sec contractions at 20 Hz followed immediately by two 1-sec contractions at 100
Hz. These contractions were elicited to potentiate the muscle. Approximately 10 sec following
these four contractions, a 1-sec contraction at 20 Hz was given followed immediately by a 1-sec
contraction at 100 Hz for the assessment of LFF and these will be referred to as ‘evaluation
stimulations’. These 1-sec contractions at 20 and 100 Hz were elicited three times for each
assessment. The ratio of P20/P100 was calculated and the percentage reduction in this ratio was
used to evaluate LFF (7, 39). A greater percent reduction in P20/P100 from baseline values (pre-
fatigue) indicates greater LFF.
Fatigue tests for both SCI and able-bodied subjects were elicited via NMES. All
contractions during the fatigue tests were evoked with 30-Hz trains of 450-µs biphasic pulses
with a 33% duty cycle (3 s on/6 s off). The fatigue test was evoked in one thigh (experimental
leg). The contralateral, un-fatigued leg served as control. The experimental leg was assigned by
counterbalancing dominant/non-dominant leg for each subject. The measurements of P20 and
P100 were assessed in both thighs.
Experimental protocol:
Familiarization. Subjects were seated in the custom designed isometric force chair and
their legs and torso were firmly strapped into the chair. Subject’s legs were cleaned with alcohol
and two electrodes were placed on each thigh as previously described. Electrical stimulation at a
frequency of 100 Hz was given to evoke 1-3 sec isometric contractions of the knee extensors at
increasing current levels until 22.7 kg of isometric force was produced in able-bodied subjects. If
62

this level of NMES current was tolerated well and subjects were still interested in participation,
they were asked to return to the laboratory 1-2 days later for testing. For SCI participants, the
current was increased until they could produce a minimal of 4.5 kg of isometric force with
maximum not exceeding 18 kg. Force in the SCI group was kept below 18 kg to substantially
reduce the risk of fracture when performing isometric contractions (12).
Test Session. Subjects were seated in the custom designed isometric force chair and their
legs and torso were firmly strapped into the chair. Subject’s legs were cleaned with alcohol and
two electrodes were placed on each thigh as previously described. Electrical stimulation
amplitude at 100 Hz was slowly increased over several 1-sec contractions to achieve ~18 to 22.7
kg of isometric force in each thigh for SCI and able-bodied subjects, respectively. After the
NMES amplitude was determined, it remained the same in each leg throughout the duration of
the test session for the measurements of P20 and P100, as well as for fatigue tests. As stated
previously, P20 and P100 were measured before, immediately after, and at 10, 20, and 60 min, as
well as 2, 4, 6 and 24 hours following an NMES-evoked fatigue test.
For this session, the NMES-evoked fatigue test for able-bodied individuals lasted 15 min
and consisted of 3-sec isometric contractions of the thigh with 6-sec rest between contractions
(33% duty cycle). This allowed for a total of one hundred 3-sec contractions, which were evoked
at the same NMES amplitude used for measurement of P20 and P100. All able-bodied subjects
were tested first to determine their average force loss during this fatigue protocol. The SCI group
performed a fatigue test that was terminated when mean force loss was equivalent to that of the
able-bodied group during the 15 min fatigue protocol. This was done in an effort to match
relative fatigue between groups. The duty cycle for the SCI fatigue test was the same as in able-
63

bodied (33%; 3 sec on/6 sec off) and ranged between 2-8 min, which was dependent on
individual force reductions in the SCI group.
Assessment of muscle pain:
Muscle pain was evaluated in both the experimental and control leg based on a 10-point
Likert-type scale in the able-bodied subjects only. Participants were asked to rate the intensity of
leg muscle pain from 0 “no pain at all” to 10 “worst possible pain imaginable”. Subjects verbally
reported these pain ratings before, and at 24 and 48 hours following the NMES-evoked fatigue
test.
Analysis of force tracings:
Force tracings for the first and last three contractions of the fatigue protocol were
analyzed by measuring force-time integrals (FTI). Fatigue was calculated as follows:
Fatigue = [FTI (1st 3 contractions) – FTI (last 3 contractions)] ÷ FTI (1st 3 contractions)
Single contractions for the assessment of P20 and P100 were always 1 sec in duration. For each
force tracing at 20 and 100 Hz, the average value for the first 0.5 sec after the initial rise was
analyzed. The highest mean force at 20 and 100 Hz was used in the calculation of the P20/P100
ratio at each time point.
Statistical Analyses:
The SCI subject population in this study consisted of individuals with both complete and
incomplete spinal injuries. Because we found no prior statistically significant differences in LFF
results between complete and incomplete subjects, the entire SCI population was combined for
comparison with able-bodied subjects.
64
Data analyses were performed using SPSS version 13.0 (SPSS Inc., Chicago, IL).
Independent t-tests were used to assess potential differences between the groups in subject age,
body mass, and percent force loss during NMES-evoked fatigue protocols. In the t-test analyses,
the homogeneity of variance was tested using Levene’s test for equality of variance. Statistics
were adjusted accordingly if the assumption of equality of variance was violated.
For all analyses, the ratio of the P20/P100 was calculated for each time point. These time
points were then reported, as the percentage reduction from baseline and from here on will
represent LFF. The magnitude of LFF will be assessed by the percentage reduction from baseline
P20/P100 values up to 1 hour following the fatigue protocol. This time period was selected
because it tests our first hypothesis about the magnitude of LFF after the fatigue protocol. The
recovery of LFF will be examined over the entire 24 hour post-fatigue period because prior
empirical research suggests that SCI would have muscle injury following NMES-evoked
isometric contractions (2), which can dramatically affect LFF (6).
The magnitude of LFF in the experimental leg was analyzed using a 2 (group: SCI, able-
bodied) x 4 (time: 0, 10, 20, and 60 minutes post-fatigue) mixed model ANOVA with a repeated
measure on the time variable. Magnitude of LFF was not examined in the control leg because it
did not perform a fatigue protocol.
A separate analysis for recovery of LFF was performed for both the experimental leg and
the control leg in each group. Recovery of LFF was analyzed using a 2 (group) x 8 (time: 0, 10,
20, 60 minutes; 2, 4, 6, and 24 hours) trend analysis in order to examine differences in the rate of
recovery between groups after the fatigue protocol. Since the recovery of LFF was significantly
different in the ‘control leg’ between groups, a secondary analysis was performed. This
assessment included a 2 (group) x 8 (time) trend analysis for the experimental leg with control
65

leg LFF values used as covariates. This allowed us to determine what effect the evaluation
stimulations have on the LFF response above and beyond that caused by the fatigue protocol.
Perception of thigh muscle pain in able-bodied participants was assessed at 24 and 48
hours post-fatigue. Pain data were analyzed using a 1 (group) x 3 (time: Pre, 24 & 48 hours post-
fatigue) ANOVA with repeated measure on the time variable.
Studentized t-tests were used to assess potential differences in 100 Hz force between
baseline and 24-hour post-fatigue data within-groups. Separate t-tests were run for both the able-
bodied and SCI. Significant reductions in 100 Hz muscle force at 24 hours were used as an
indicator of muscle injury.
All mixed model analyses were based on the F-statistic. Effects sizes for F-statistics were
expressed as partial eta-squared (η2). The Greenhouse-Geisser epsilon (ε) was reported and
degrees of freedom were adjusted when the sphericity assumption was violated (ie. if Mauchly’s
test of sphericity was statistically significant at p < 0.05). The familywise error rate was
controlled using the Bonferroni adjustment when tests of simple effects were conducted.
Results
Participant Characteristics:
All SCI participants were non-ambulatory and consisted of those with complete and
incomplete spinal lesions ranging from C5 to T9. Mean duration of spinal injury was 13.6 ± 12.2
years. Four of the nine SCI participants had limited sensory function in their thighs and none had
enough sensation to rate thigh muscle pain. Three of these 4 individuals had limited voluntary
motor function in the thigh area and were able to extend one or both knees with maximal
isometric forces less than ~9 kg. Sedentary able-bodied subjects were performing one or fewer
days of light aerobic exercise (ie. walking) per week. Individual subject characteristics for the
66

SCI group are shown in Table 4.1. Mean characteristics for SCI and able-bodied groups are
shown in Table 4.2. Spinal cord injured subjects were significantly older than able-bodied
subjects (F (16) = 5.61, p = 0.025) but no differences existed between groups for body mass (F
(16) = 0.303, p = 0.838). All subjects completed this study without incidence.
Force Reduction During NMES-Fatigue Protocols:
Mean percentage force loss during the fatigue tests was -50.3 ± 9.0 % for SCI and
–49.6 ± 9.5 % for able-bodied, which were not significantly different (F (16) = 0.010, p = 0.870).
Force loss during NMES-evoked fatigue protocols for groups are shown in Figure 4.1. The able-
bodied fatigue test lasted 15 minutes and consisted of 100 contractions (3 s on/ 6 s off). The SCI
fatigue test was performed at the same duty cycle (3 s on/ 6 s off) and lasted 4.3 ± 1.8 min, which
was dependent on individual force loss in this group. This protocol was used with the SCI group
to produce an equivalent force loss as the able-bodied group during the 15 min fatigue protocol
(~50%).
Force Tracings:
Representative force tracings at 20 Hz and 100 Hz are shown in Fig. 4.2 for one SCI
participant before and 1-hour post-fatigue. Using the ratio of these forces allowed for
quantification of LFF. One hour following the fatigue protocol, 100 Hz force has returned to near
baseline values, whereas 20 Hz force is still depressed substantially.
100 Hz Force:
Figure 4.3 shows percent change from baseline P100 values over 24 hours post-fatigue,
for both the experimental and control leg in SCI and able-bodied subjects. No statistical tests
were performed for these data. Return of 100 Hz force to baseline values shortly after exercise
can be used to assess recovery of metabolic fatigue. However, the SCI group appears to have
67

minimal recovery of 100 Hz force over the post-fatigue period, which would indicate that
additional factors (ie. muscle injury) are affecting the response.
Magnitude of LFF:
The magnitude of LFF, expressed as percent change from baseline P20/P100 ratio
values up to 1 hour post-fatigue, was examined between groups. In the experimental leg, the
analysis showed that a significant group x time interaction existed (F (3,16) = 8.599, p < 0.001,
η2 = 0.350) (Figure 4.4a). However, when tests for simple effects were performed and adjusted
for multiple comparisons, there were no significant differences noted at any time point.
Therefore, we concluded that no differences existed for the magnitude of LFF between groups.
Recovery of LFF:
Trend analysis was used to examine differences between groups in the recovery of LFF
across the 24-hour post-fatigue period in both the experimental and control leg. In the
experimental leg, the recovery of LFF was significantly faster in the able-bodied group compared
to SCI (Figure 4.4b). This was based on a significant group by trend interaction for the linear
recovery of LFF in the experimental leg over the 24-hour period between groups (F (7,128) =
4.91, p < 0.001, η2 = 0.212). Decomposition of the interaction showed that able-bodied recovered
from LFF in the experimental leg at an 18% greater rate than the SCI group (t = 5.68, p < 0.001),
which was based on differences in slopes for the linear trend between groups. In essence, the SCI
group had little or no recovery of LFF over 24 hours.
Similarly in the control leg, the recovery of LFF was significantly faster in the able-
bodied group compared to SCI (Figure 4.5). This was based on a significant group by trend
interaction for the linear recovery of LFF in the control leg over the 24-hour period between
groups (F (7,128) = 2.30, p = 0.031, η2 = 0.112). Decomposition of the interaction showed that
68

able-bodied recovered from LFF in the control leg at a 12% greater rate than the SCI group (t =
3.95, p < 0.001), which was based on differences in slopes for the linear trend between groups.
Since significant group differences were found for the recovery of LFF in the control leg,
a secondary analysis was performed. When the experimental leg was statistically adjusted for
control leg LFF values, recovery was not different between able-bodied and SCI individuals
(Figure 4.6). This was based on a lack of significant group by trend interaction for the recovery
of LFF over the 24-hour period between groups (F (7,127) = 1.98, p = 0.063, η2 = 0.098). There
was a significant main effect for time (F (7,127) = 6.34, p < 0.001, η2 = 0.259) but not for group
(F (1,127) = 0.76, p = 0.386, η2 = 0.006) for the recovery of LFF.
Indicators of Muscle Injury:
Muscle pain ratings in the experimental leg of the able-bodied group at 24 and 48 hours
post-fatigue were 2.0 ± 1.1 and 1.1 ± 0.9, respectively, and there was a significant main effect for
time (F (1,8) = 12.90, p = 0.007). No pain was reported for the control leg at 24 or 48 hours post-
fatigue. All able-bodied subjects reported some muscle pain in the experimental leg 24 hours
following the fatigue test, which ranged from 1-4 (out of 10), indicating that minor amounts of
muscle injury may have occurred in this group.
Significant reductions in 100 Hz muscle force at 24 hours (from baseline values) were
used as an indicator of muscle injury. Force at 100 Hz in the experimental leg was significantly
lower (-30.8 ± 19.6 %) in the SCI group at the 24-hour time point compared to baseline values (p
< 0.001). However, 100 Hz force in the able-bodied group was not different at 24 hours (p =
0.354). This suggests that muscle injury was likely more severe in the SCI compared to the able-
bodied group.
69

Discussion
We were unable to accept our first hypothesis, as our results indicate that no differences
were found between SCI and able-bodied subjects for the magnitude of LFF after a fatigue
protocol. This was an unexpected finding as we predicted that even with the same force loss, the
SCI group would have a greater metabolic impairment, which might cause the magnitude of LFF
to be greater in this group. In our companion paper, we showed that sedentary, able-bodied
individuals had a greater magnitude of LFF compared to endurance-trained subjects after fatigue
protocols matched for the total amount of fatigue. We predicted that the extreme disuse and
unloading of paralyzed muscle would cause the magnitude of LFF to be more severe than
normally loaded muscle, but our results did not support this hypothesis.
To our knowledge, no one has examined the differences in LFF between able-bodied and
SCI subjects. However, Shields et al. (31) examined reductions in low frequency force (ie. 20
Hz) in the soleus muscle of chronic (> 3 years post-injury) and acute SCI (< 5 weeks post-injury)
following a 3-minute bout of intermittent contractions. Immediately following exercise, 20 Hz
force was reduced by 75% in the chronic SCI but only 16% in acute SCI group. After 5 minutes
post-fatigue, 20 Hz force had completely recovered in the acute SCI groups but was still
suppressed nearly 60% in the chronically injured group. Direct comparisons to the Shields et al.
(31) study is difficult because of differences in the subject groups tested and because they caused
extremely different amounts of fatigue in these two groups upon examining LFF. A strength of
the current study is that we examined LFF after causing the same amount of fatigue in both
groups. It is possible that if the SCI group performed the same 15-minute fatigue protocol as the
able-bodied group, that the magnitude of LFF may have been different between groups.
70

We were able to accept our second hypothesis that able-bodied subjects would recover
faster from LFF. Our results demonstrate that when fatigue was matched between groups, that
the recovery of LFF in the experimental leg of the SCI group was significantly slower (~18%)
and had essentially no recovery over the 24 hours post-fatigue period. In the control leg, the able-
bodied group showed small amounts of LFF that remained constant over the time of the
experiment whereas SCI showed a progressive appearance of LFF that nearly matched the LFF
in the experimental leg by 24 hours. However, when the experimental leg LFF was statistically
for LFF in the control leg, recovery of LFF was not different between groups (p = 0.064). This
suggests that a large portion of the recovery from LFF in the SCI group can be attributed to the
evaluation stimulations. In the control leg of SCI (Fig 4.5), each additional set of evaluation
stimulations caused a further reduction in the P20/P100 ratio. In the SCI experimental leg (Fig.
4.4b) however, it appeared there was a ‘basement effect’ and once the P20/P100 ratio was
suppressed ~50%, each additional set of evaluation stimulations did not cause a further reduction
in this ratio. Therefore, it appears that both the fatigue protocol and evaluation stimulations affect
LFF in the SCI group but their relative impact cannot be determined in the present study.
Regardless, our results show definitively that if NMES is used to contract paralyzed muscle
repeatedly (ie. fatigue test in experimental leg) or used periodically over time (ie. evaluation
stimulations in control leg) that LFF will be severe and the recovery will be minimal over 24
hours.
The proposed physiological mechanism for the almost non-existent recovery of LFF in
the SCI group is probably related to contraction-induced muscle injury. It has been shown in
several studies that LFF is more severe when prior muscle injury has occurred (6, 15, 22, 27).
For example, Child et al. (6) examined the recovery of LFF after a bout of eccentric contractions
71
of the thigh, which were evoked by NMES and caused significant muscle pain and injury. They
showed that subjects had significant LFF up to 3 days following this type of exercise. Since the
origin of LFF has been attributed to disruption in the excitation-contraction coupling process,
disruption of myofibers with injury can impair calcium release/reuptake rates and affect
muscular force (4), most predominately at low activation frequencies (22).
Unloaded skeletal muscle, as in SCI, has been shown to be more susceptible to muscle
injury upon reloading (2, 17, 21, 24, 33, 37). Models of extreme unloading have consisted of
immobilization, hind limb suspension and space flight. A more severe model of unloading
occurs in those with paralysis, which results in complete inactivation of skeletal muscle below
the point of spinal lesion. A previous study from our laboratory showed that individuals with SCI
are more susceptible to muscle injury than able-bodied subjects (2). In a study by Bickel et al.
(2), T2-weighted magnetic resonance images were taken of the quadriceps femoris muscle group
prior to, and 3 days after 80 NMES-evoked isometric contractions of the thigh in both able-
bodied and SCI subjects. Three days post-exercise, there was a greater relative area of muscle
injured for the SCI group (25%) as compared to able-bodied (2%). In addition, they showed that
NMES evoked force was reduced by 22% three days post-exercise in SCI whereas able-bodied
force was not different from baseline values.
Although the current study did not quantify muscle injury, it likely played a role in the
almost non-existent recovery of LFF in the SCI group, which was most evident from the data
collected in the control leg. In the control leg, approximately ninety 1-sec contractions were
performed from pre- to 24 hours post-fatigue, which was more than were evoked in the study by
Bickel et al. (2). In addition to these ninety 1-sec contractions, the experimental leg performed a
fatigue protocol that consisted of at least nineteen 3-sec contractions (dependent on individual
72

fatigue values). Based on the findings by Bickel et al. (2), it is probable that muscle injury
occurred in both the experimental and control leg of SCI. In addition, the SCI group had a
significant reduction (~31%) in 100 Hz force in the experimental leg at 24 hours post-fatigue,
which can be best explained by the long-lasting effects of muscle injury. Even more dramatic
was the 20 Hz force loss in the SCI group (experimental leg) at 24 hours, which equated to ~66%
reduction from baseline values. Although all able-bodied subjects reported some muscle pain 24
hours post-fatigue (2.0 out of 10), no reduction was observed in 100 Hz force at this time point.
Small amounts of muscle injury in the able-bodied group may have occurred but it did not affect
the recovery of LFF as severely as it did in the SCI group.
We hypothesize that LFF in individuals with SCI would be less pronounced with
consistent NMES training, possibly by reducing muscle injury. Sabatier et al. (30) used NMES
resistance training of the thigh muscles in individuals with SCI and showed increases in fatigue
resistance after 12 weeks of training. The subjects performed only 80 dynamic knee extensions
per week, which significantly improved muscle size but would not be expected to cause reduced
fatigability. These researchers proposed that as training progressed muscle injury occurring
during contractions was reduced and therefore caused less force loss during a bout of
contractions. This potential reduction in muscle injury with training in the SCI population would
likely reduce the amount of LFF. Experimental evidence to support this hypothesis comes from a
study demonstrating that 10 weeks of eccentric training in rats significantly reduced LFF after a
fatiguing bout of exercise (39). Future studies need to examine how NMES-evoked training in
paralyzed muscle might affect LFF.
In addition to muscle injury, fast-twitch muscle fibers have been reported to be more
susceptible to LFF (25, 27). Numerous studies have demonstrated “slow to fast” fiber conversion
73

after 1-2 years of SCI with increased expression of myosin heavy chain IIa and IIx (3, 10), as
well as faster contraction speeds (9, 29). Muscle biopsy data from SCI subjects 2-11 years post-
injury indicate significantly fewer percentages of slow-twitch fibers compared to able-bodied
controls (18). Although not examined in this study, greater percentages of fast-twitch muscle
fibers in the SCI group may have partially contributed to the LFF observed in this group.
The SCI subject population in this study consisted of individuals with both complete and
incomplete spinal injuries. Because of potential differences in muscle function between
complete and incomplete SCI, it might be possible that LFF would differ as well. However, we
did not find any statistically significant differences between our complete and incomplete SCI
individuals for either magnitude or recovery of LFF. There was a trend for the incomplete SCI
individuals to have slightly less LFF and to show more recovery of LFF in both the experimental
and control leg. Because of our small sample sizes, we cannot exclude the possibility that
differences exist between these two SCI subgroups. Future studies with larger sample sizes will
be needed to test this hypothesis. Our study does show that regardless of the degree of sensory
and/or motor function in SCI, individuals who are non-ambulatory and are not loading the
paralyzed musculature on a daily basis will have LFF that can be severe and can last for at least
24 hours following use of NMES.
Several potential limitations exist for this study. First, it was not feasible to have subjects
remain in the force chair for 24 hours and therefore they had to re-enter the force chair several
times throughout the study, which may have increased variability of our force measures. To
counter this we tried to be as meticulous as possible by setting up subjects in the force chair the
same way each time they arrived and by using the non-fatigued leg as control. Secondly, surface
electrical stimulation was used and changes in the properties of the electrodes and/or the skin
74

over the course of the study may have altered conductance of electrical current and generation of
muscular force. Subjects were asked to remain relatively inactive over the course of the day and
the electrodes were traced to ensure the same placement for the 24-hour assessment of LFF, or at
any other time the electrodes were taken off during testing. Third, this study used submaximal
electrical current to evoke muscular contractions of the quadriceps muscle and therefore only
small portions of this muscle group were likely recruited. For the SCI group, this was done to
keep forces relatively low in order to reduce the risk of fracture in this population (12). For the
able-bodied group, submaximal current was used mainly to limit the pain associated with its use
in individuals with normal sensory function. Future studies may want to stimulate smaller
muscles to maximize the chance of activating the entire muscle. Despite increased variability that
may have occurred due to testing methods, we feel that the differences observed between these
groups for recovery of LFF are indeed ‘real’ and the robustness of the response in the SCI group
is truly remarkable.
Conclusion
This study shows that the magnitude of LFF after a matched fatigue protocol is not
different between SCI and able-bodied subjects. Over the 24-hour post-fatigue period, LFF in
able-bodied subjects recovers toward baseline values whereas no recovery is observed in SCI.
More importantly, simply assessing LFF with NMES in paralyzed muscle causes a progressive
increase in LFF, and can account for a substantial portion of the LFF over time. We propose that
muscle injury is the main factor responsible for the incomplete recovery of LFF in the SCI group
and future studies need to test whether fatigue in SCI subjects actually represents the
accumulation of muscle injury rather than fatigue.
75

Low frequency fatigue has clinical implications for those with SCI and various other
neuromuscular disorders. These patient populations may use low-frequency NMES daily for
rehabilitation to make weak or paralyzed muscles contract. In addition, many electrically
stimulated exercise modalities used in the SCI population are evoked by low frequency NMES.
From this study, it is apparent that once the paralyzed muscle is stimulated sufficiently, forces at
low frequencies will be substantially suppressed for at least 24 hours or longer, which may limit
rehabilitation and/or fitness goals.
References
1. Adams GR, Harris RT, Woodard D, and Dudley GA. Mapping of electrical muscle stimulation using MRI. J Appl Physiol 74: 532-537, 1993.
2. Bickel CS, Slade JM, and Dudley GA. Long-term spinal cord injury increases susceptibility
to isometric contraction-induced muscle injury. Eur J Appl Physiol 91: 308-313, 2004. 3. Burnham R, Martin T, Stein R, Bell G, MacLean I, and Steadward R. Skeletal muscle
fibre type transformation following spinal cord injury. Spinal Cord 35: 86-91, 1997. 4. Byrd SK. Alterations in the sarcoplasmic reticulum: a possible link to exercise-induced
muscle damage. Med Sci Sports Exerc 24: 531-536, 1992. 5. Castro MJ, Apple DF, Jr., Hillegass EA, and Dudley GA. Influence of complete spinal
cord injury on skeletal muscle cross-sectional area within the first 6 months of injury. Eur J Appl Physiol Occup Physiol 80: 373-378, 1999.
6. Child RB, Brown SJ, Day SH, Saxton JM, and Donnelly AE. Manipulation of knee
extensor force using percutaneous electrical myostimulation during eccentric actions: effects on indices of muscle damage in humans. Int J Sports Med 19: 468-473, 1998.
7. Edwards RH, Hill DK, Jones DA, and Merton PA. Fatigue of long duration in human
skeletal muscle after exercise. J Physiol 272: 769-778, 1977. 8. Fryer MW, Owen VJ, Lamb GD, and Stephenson DG. Effects of creatine phosphate and
P(i) on Ca2+ movements and tension development in rat skinned skeletal muscle fibres. J Physiol 482 ( Pt 1): 123-140, 1995.
9. Gerrits HL, De Haan A, Hopman MT, van Der Woude LH, Jones DA, and Sargeant
AJ. Contractile properties of the quadriceps muscle in individuals with spinal cord injury. Muscle Nerve 22: 1249-1256, 1999.
76

10. Gerrits HL, Hopman MT, Offringa C, Engelen BG, Sargeant AJ, Jones DA, and Haan
A. Variability in fibre properties in paralysed human quadriceps muscles and effects of training. Pflugers Arch 445: 734-740, 2003.
11. Hamada T, Hayashi T, Kimura T, Nakao K, and Moritani T. Electrical stimulation of
human lower extremities enhances energy consumption, carbohydrate oxidation, and whole body glucose uptake. J Appl Physiol 96: 911-916, 2004.
12. Hartkopp A, Murphy RJ, Mohr T, Kjaer M, and Biering-Sorensen F. Bone fracture
during electrical stimulation of the quadriceps in a spinal cord injured subject. Arch Phys Med Rehabil 79: 1133-1136, 1998.
13. Hillegass EA and Dudley GA. Surface electrical stimulation of skeletal muscle after spinal
cord injury. Spinal Cord 37: 251-257, 1999. 14. Jones DA, Howell S, Roussos C, and Edwards RH. Low-frequency fatigue in isolated
skeletal muscles and the effects of methylxanthines. Clin Sci (Lond) 63: 161-167, 1982. 15. Jones DA, Newham DJ, and Torgan C. Mechanical influences on long-lasting human
muscle fatigue and delayed-onset pain. J Physiol 412: 415-427, 1989. 16. Kim CK, Bangsbo J, Strange S, Karpakka J, and Saltin B. Metabolic response and
muscle glycogen depletion pattern during prolonged electrically induced dynamic exercise in man. Scand J Rehabil Med 27: 51-58, 1995.
17. LeBlanc A, Lin C, Shackelford L, Sinitsyn V, Evans H, Belichenko O, Schenkman B,
Kozlovskaya I, Oganov V, Bakulin A, Hedrick T, and Feeback D. Muscle volume, MRI relaxation times (T2), and body composition after spaceflight. J Appl Physiol 89: 2158-2164, 2000.
18. Martin TP, Stein RB, Hoeppner PH, and Reid DC. Influence of electrical stimulation on
the morphological and metabolic properties of paralyzed muscle. J Appl Physiol 72: 1401-1406, 1992.
19. McCully KK, Authier B, Olive J, and Clark BJ, 3rd. Muscle fatigue: the role of
metabolism. Can J Appl Physiol 27: 70-82, 2002. 20. Miller RG, Giannini D, Milner-Brown HS, Layzer RB, Koretsky AP, Hooper D, and
Weiner MW. Effects of fatiguing exercise on high-energy phosphates, force, and EMG: evidence for three phases of recovery. Muscle Nerve 10: 810-821, 1987.
21. Mozdziak PE, Pulvermacher PM, and Schultz E. Muscle regeneration during hindlimb
unloading results in a reduction in muscle size after reloading. J Appl Physiol 91: 183-190, 2001.
77

22. Newham DJ, Mills KR, Quigley BM, and Edwards RH. Pain and fatigue after concentric and eccentric muscle contractions. Clin Sci (Lond) 64: 55-62, 1983.
23. Olive JL, Slade JM, Dudley GA, and McCully KK. Blood flow and muscle fatigue in SCI
individuals during electrical stimulation. J Appl Physiol 94: 701-708, 2003. 24. Ploutz-Snyder LL, Tesch PA, Hather BM, and Dudley GA. Vulnerability to dysfunction
and muscle injury after unloading. Arch Phys Med Rehabil 77: 773-777, 1996. 25. Powers RK and Binder MD. Effects of low-frequency stimulation on the tension-frequency
relations of fast-twitch motor units in the cat. J Neurophysiol 66: 905-918, 1991. 26. Ratkevicius A, Skurvydas A, Povilonis E, Quistorff B, and Lexell J. Effects of
contraction duration on low-frequency fatigue in voluntary and electrically induced exercise of quadriceps muscle in humans. Eur J Appl Physiol Occup Physiol 77: 462-468, 1998.
27. Rijkelijkhuizen JM, de Ruiter CJ, Huijing PA, and de Haan A. Low-frequency fatigue is
fibre type related and most pronounced after eccentric activity in rat medial gastrocnemius muscle. Pflugers Arch 447: 239-246, 2003.
28. Rijkelijkhuizen JM, de Ruiter CJ, Huijing PA, and de Haan A. Low-frequency fatigue,
post-tetanic potentiation and their interaction at different muscle lengths following eccentric exercise. J Exp Biol 208: 55-63, 2005.
29. Rochester L, Chandler CS, Johnson MA, Sutton RA, and Miller S. Influence of electrical
stimulation of the tibialis anterior muscle in paraplegic subjects. 1. Contractile properties. Paraplegia 33: 437-449, 1995.
30. Sabatier MJ, Stoner L, Mahoney ET, Black C, Elder C, Dudley GA, and McCully K.
Electrically stimulated resistance training in SCI individuals increases muscle fatigue resistance but not femoral artery size or blood flow. Spinal Cord 44: 227-233, 2006.
31. Shields RK, Law LF, Reiling B, Sass K, and Wilwert J. Effects of electrically induced
fatigue on the twitch and tetanus of paralyzed soleus muscle in humans. J Appl Physiol 82: 1499-1507, 1997.
32. Skurvydas A, Jascaninas J, and Zachovajevas P. Changes in height of jump, maximal
voluntary contraction force and low-frequency fatigue after 100 intermittent or continuous jumps with maximal intensity. Acta Physiol Scand 169: 55-62, 2000.
33. Slade JM, Bickel CS, and Dudley GA. The effect of a repeat bout of exercise on muscle
injury in persons with spinal cord injury. Eur J Appl Physiol 92: 363-366, 2004. 34. Stokes MJ, Edwards RH, and Cooper RG. Effect of low frequency fatigue on human
muscle strength and fatigability during subsequent stimulated activity. Eur J Appl Physiol Occup Physiol 59: 278-283, 1989.
78

35. Tarnopolsky M and Cupido C. Caffeine potentiates low frequency skeletal muscle force in
habitual and nonhabitual caffeine consumers. J Appl Physiol 89: 1719-1724, 2000. 36. Vanderthommen M, Duteil S, Wary C, Raynaud JS, Leroy-Willig A, Crielaard JM, and
Carlier PG. A comparison of voluntary and electrically induced contractions by interleaved 1H- and 31P-NMRS in humans. J Appl Physiol 94: 1012-1024, 2003.
37. Warren GL, Stallone JL, Allen MR, and Bloomfield SA. Functional recovery of the
plantarflexor muscle group after hindlimb unloading in the rat. Eur J Appl Physiol 93: 130-138, 2004.
38. Westerblad H, Bruton JD, Allen DG, and Lannergren J. Functional significance of Ca2+
in long-lasting fatigue of skeletal muscle. Eur J Appl Physiol 83: 166-174, 2000. 39. Willems ME and Stauber WT. Fatigue and recovery at long and short muscle lengths after
eccentric training. Med Sci Sports Exerc 34: 1738-1743, 2002.
79

80

81

Figure 4.1. Percent reduction in force-time integrals during fatigue protocols in spinal cord
injured and able-bodied subjects. Fatigue protocols differed in length between groups and were
designed to produce the same amount of fatigue. Values are Mean ± SD.
82

Figure 4.2. Representative force tracings at 20 Hz and 100 Hz for one spinal cord injured
participant pre- and 1-hour post-fatigue.
83

Figure 4.3 (a-b). 100 Hz force values (% initial) after a fatigue test for the experimental (a) and
control leg (b) in SCI and able-bodied over 24 hours post-fatigue. Return of 100 Hz force to
baseline values shortly after exercise can be used to assess recovery of metabolic fatigue.
Minimal recovery of 100 Hz force in the SCI group indicates that non-metabolic factors may be
responsible. No statistical analyses were performed for these data. Values are Mean ± SD.
84

Figure 4.4 (a-b). (a) Magnitude of LFF was not different in the experimental leg of SCI and able-
bodied subjects over 1 hour post-fatigue. Values are Mean ± SD. (b) Recovery of LFF in the
experimental leg over the 24-hour post-fatigue period between SCI and able-bodied subjects. † p
< 0.001, group x trend interaction. Recovery was 18% faster in able-bodied based on differences
in slopes between groups.
85

Figure 4.5. Recovery of LFF in the control leg over the 24-hour post-fatigue period in SCI and
able-bodied subjects. Values are Mean ± SD. † p = 0.031, group x trend interaction. Recovery
was 12% faster in able-bodied based on differences in slopes between groups.
86

Figure 4.6. Recovery of LFF in the experimental leg when statistically adjusted for LFF in the
control leg of SCI and able-bodied subjects. Values are Mean ± SD. When LFF values in the
control leg were used as covariates, no difference in recovery rate was observed between groups
(p = 0.064; η2 = 0.098).
87

CHAPTER V
SUMMARY & CONCLUSIONS
This research showed that ET had less LFF than SED even when total fatigue was
matched, suggesting that endurance trained muscle is more ‘protected’ from LFF. Endurance
trained muscle did not have faster recovery of LFF, but other factors such as muscle injury make
interpretations of the recovery difficult. For SCI, the initial magnitude of LFF was not different
from able-bodied subjects but the recovery was essentially non-existent in SCI. More
importantly, simply assessing LFF with electrical stimulation in paralyzed muscle causes a
progressive increase in LFF with each set of evaluation stimulations, and seems to account for a
substantial portion of the LFF. This study overwhelmingly shows that SCI are more susceptible
to LFF with the use of NMES and the response is likely dictated by muscle injury.
Since many able-bodied subjects do not use NMES to evoke muscular contractions,
clinical relevance of LFF is less important for these individuals. The initial LFF response
between these groups is more important from a physiological perspective and determining the
potential mechanisms for these differences may be important as most submaximal, voluntary
contractions are elicited at low frequencies. Although the current study was not designed to
cause muscle injury, small amounts likely occurred, as NMES is a novel way to facilitate
muscular contractions in individuals without neuromuscular disorders. Future studies in this area
need to utilize voluntary, isometric contractions to examine potential differences in LFF between
ET and SED individuals. The performance of voluntary contractions will almost ensure that no
88
muscle injury will occur and any differences in LFF can be attributed solely to the metabolic
perturbations between groups.
Low frequency fatigue has clinical implications in the SCI population, who may use low-
frequency NMES daily for rehabilitation to make weak or paralyzed muscles contract. In
addition, many electrically stimulated exercise modalities used in the SCI population are evoked
by low frequency NMES, such as ambulation and cycling. From this study, it is apparent that
once the paralyzed muscle is sufficiently stimulated, that forces at low frequencies will be
substantially suppressed for at least 24 hours or longer, which may limit rehabilitation and/or
fitness goals.
This study may guide future research towards designing NMES protocols to limit fatigue
and muscle injury in those with SCI. The current study shows that when paralyzed muscle is
contracted with NMES, limited numbers of contractions should be evoked (to potentially limit
injury) and at least 2 days should be allowed for recovery before subsequent use of NMES. This
rest period will increase the chance of achieving adequate muscular force (especially at low
frequencies) to improve fitness, functional recovery from SCI, or whatever the patient’s goals
may be.
So what can be done to limit LFF, especially in the SCI population? The use of high
frequency NMES could offset the effects of low frequency fatigue. However, many rehabilitation
and exercise programs consist of repetitive muscular contractions and use of high frequency
stimulation over a single bout of contractions causes pronounced fatigue compared to lower
frequencies (3). Lieber and Kelly (3) used NMES to evoke contractions of the quadriceps muscle
at 10, 30, and 50 Hz for thirty minutes at a duty cycle of 50%. They demonstrated that increasing
frequency caused a greater decline in torque over time, which is well supported in the literature.
89

If NMES were to be used to evoke repetitive, intermittent contractions, then the use of high
frequencies would not be feasible if muscular force is a goal of the rehabilitation/exercise
program.
We hypothesize that LFF in individuals with SCI would be less pronounced with
consistent NMES training, possibly by reducing the amount of muscle injury. Although
protection from a repeat bout of exercise has never been shown in individuals with SCI, it almost
certainly exists. If muscle damage were excessive each time NMES was used to contract
paralyzed muscle one would hypothesize that over time the muscle would actually get smaller
with training. This is not the case as NMES-induced resistance and endurance training cause
muscle hypertrophy in individuals with SCI (4, 7). Future studies need to examine how
subsequent bouts of NMES-evoked contractions influence muscle injury in the SCI population
and how training of the paralyzed musculature might affect LFF.
Studies need to test whether fatigue in SCI subjects actually represents the accumulation
of muscle injury rather than fatigue. Muscle fatigue has repeatedly been shown to be greater
during NMES-evoked contractions in SCI compared to able-bodied subjects and has been
attributed to increased proportions of fast-twitch fibers (7), reductions in oxidative enzymes (5),
and alterations in calcium handling (2, 8). However, these factors cannot fully contribute to the
enhanced fatigue, which can be several-fold greater in SCI subjects. Most of these studies
examine ‘fatigue’ during a bout of NMES-evoked contractions but do not mention muscle injury
as a potential mechanism for the response. A study by Castro et al. (2) was the first to mention
muscle injury as a potential explanation for altered muscle mechanics (relaxation time) after SCI.
Bickel et al. (1) followed up by showing that NMES-evoked contractions of the thigh caused
significant muscle injury in individuals with SCI. However, this study did not try to elucidate
90

what factors caused the nearly two-fold greater force loss in SCI compared to able-bodied
individuals. It is evident that future research should try to determine what role muscle injury
plays on the ‘fatigue’ response in individuals with paralysis.
In the current study, LFF is likely attributed to muscular fatigue as well as injury.
However, it seems that it is not solely dictated by either of the two factors. Muscle fatigue is
defined as ‘a reduction in expected force output’ and is not due to structural changes occurring
within the muscle. With muscle injury there is also a reduction in expected force output but it is
due to structural disruption of the muscle, which can subsequently impair metabolic processes
(6). It is our contention that LFF meets somewhere along the Fatigue/Injury continuum, which is
shown in Figure 5.1.
For these reasons, the term ‘low frequency fatigue’ should possibly be replaced with a
more appropriate term. The word ‘fatigue’ in ‘low frequency fatigue’ would suggest that force is
reduced only because ionic/metabolic changes have occurred, but no structural alteration within
the muscle has occurred. In the current project, LFF probably does not exist completely devoid
of muscle injury and therefore in the future, the use of a term such as ‘low frequency force ratio’
may be more appropriate.
References
1. Bickel CS, Slade JM, and Dudley GA. Long-term spinal cord injury increases susceptibility to isometric contraction-induced muscle injury. Eur J Appl Physiol 91: 308-313, 2004.
2. Castro MJ, Apple DF, Jr., Rogers S, and Dudley GA. Influence of complete spinal cord
injury on skeletal muscle mechanics within the first 6 months of injury. Eur J Appl Physiol 81: 128-131, 2000.
3. Lieber RL and Kelly MJ. Torque history of electrically stimulated human quadriceps:
implications for stimulation therapy. J Orthop Res 11: 131-141, 1993. 4. Mahoney ET, Bickel CS, Elder C, Black C, Slade JM, Apple D, Jr., and Dudley GA.
Changes in skeletal muscle size and glucose tolerance with electrically stimulated resistance
91

training in subjects with chronic spinal cord injury. Arch Phys Med Rehabil 86: 1502-1504, 2005.
5. Martin TP, Stein RB, Hoeppner PH, and Reid DC. Influence of electrical stimulation on
the morphological and metabolic properties of paralyzed muscle. J Appl Physiol 72: 1401-1406, 1992.
6. McCully KK, Argov Z, Boden BP, Brown RL, Bank WJ, and Chance B. Detection of
muscle injury in humans with 31-P magnetic resonance spectroscopy. Muscle Nerve 11: 212-216, 1988.
7. Mohr T, Andersen JL, Biering-Sorensen F, Galbo H, Bangsbo J, Wagner A, and Kjaer
M. Long-term adaptation to electrically induced cycle training in severe spinal cord injured individuals. Spinal Cord 35: 1-16, 1997.
8. Talmadge RJ, Castro MJ, Apple DF, Jr., and Dudley GA. Phenotypic adaptations in
human muscle fibers 6 and 24 wk after spinal cord injury. J Appl Physiol 92: 147-154, 2002.
92
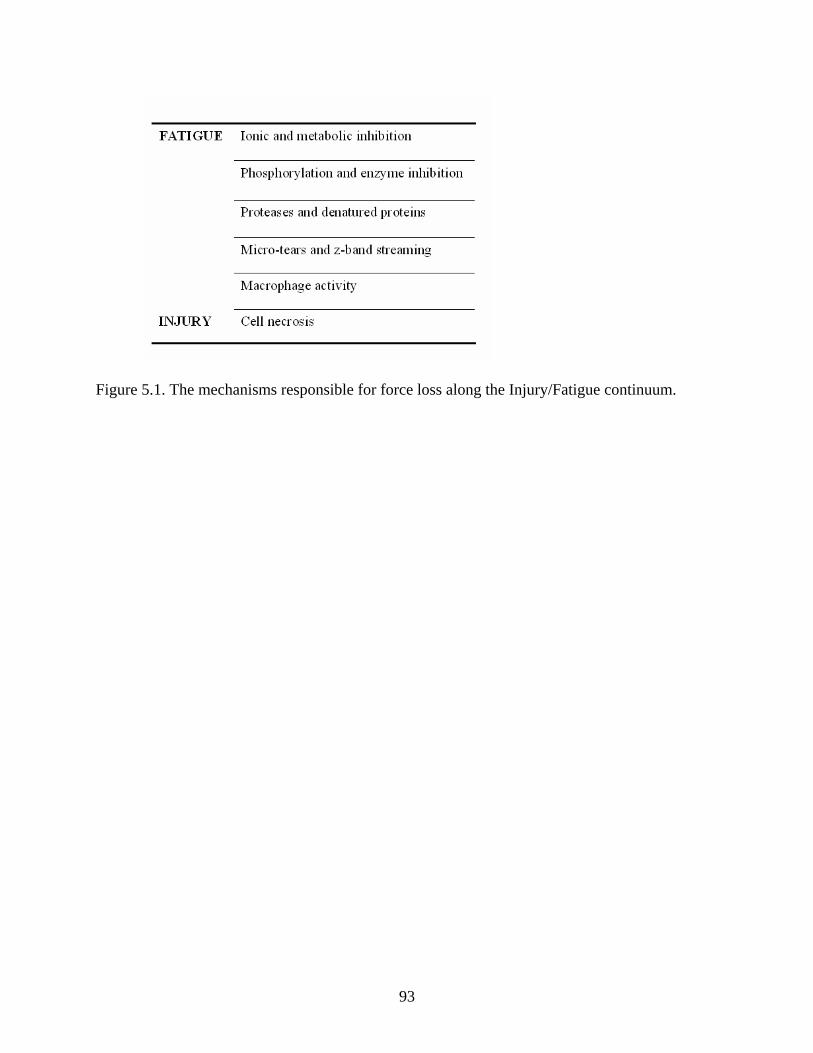
Figure 5.1. The mechanisms responsible for force loss along the Injury/Fatigue continuum.
93