Low-CostOptical Fibre Chemical Sensor for Use in...
11
Pertanika J. Sci. & Techno!. 11(1): 31- 41 (2003) ISSN: 0128-7680 © Universiti Putra Malaysia Press Low-Cost Optical Fibre Chemical Sensor for Use in Liquid Acid-Base Titration 1 Musa Ahmad, %Mohd. Rosli Kaskandar & 1 Tan Teng Wong 1 School of Chemical Science and Food Technology 2 School of Physics and Applied Science, Faculty of Sciences and Technology Universiti Kebangsaan Malaysia 43600 UKM Bangi, Selangor, Malaysia Received: 30 April 2001 ABSTRAK Instrumen mudah alih untuk penderia kimia gentian optik telah dibina dalam kajian ini menggunakan diod laser sebagai sumber cahaya dan fotodiod keadaan-pepejal sebagai pengesan. Peranti yang berkos rendah ini menunjukkan rangsangan yang baik dan boleh digunakan dalam tiga jenis titratan asid-bes iaitu Le. asid kuat - bes kuat, asid kuat - bes lemah dan asid lemah - bes kuat. Hasil kajian yang diperoleh menggunakan instrumen ini, didapati memberikan keputusan yang menyamai keputusan yang diperoleh menggunakan pH meter konvensional. ABSTRAGr A simple low-cost portable optical fibre chemical sensor instrument has been developed in this study by using a laser diode as a light source and solid-state photodiode as a detector. This inexpensive device is shown to have a good response and can be used in three different liquid acid-base titration studies Le. strong acid-strong base, strong acid-weak base and weak acid-strong base, by using a suitable pH indicator. The results obtained by using this instrument were found comparable with titration data obtained by using conventional pH meter. INTRODUCTION Chemical sensing with optical fibres is one of the most interesting of the emerging sensor techniques. Optical fibre chemical sensors permit the determination of a wide range of anions, cations, gases and organic compounds in solution or gas phases (Narayanaswamy 1985). Impetus to develop these sensors has arisen largely from the need to rapidly acquire data such as chemical compositions of process streams in manufacturing plants, invivo body fluids monitoring for clinical purposes and gaseous atmospheres, ground and river waters for pollution monitoring. The basic concept and the advantages of chemical sensors based on optical fibres have been discussed by many authors (Narayanaswamy 1985; Seitz 1984; Alder 1986; Narayanaswamy and Sevilla 1988; Wolfbeis 1986; Morris 1989; Narayanaswamy 1993; Saari 1987). To date, quite a number of optical fibre chemical sensors for pH measurements have been reported in the literature. The pH indicators for these sensors could be either immobilised on a support (Alabbas et al. 1989;
-
Upload
nguyenduong -
Category
Documents
-
view
215 -
download
0
Transcript of Low-CostOptical Fibre Chemical Sensor for Use in...

Pertanika J. Sci. & Techno!. 11(1): 31- 41 (2003)ISSN: 0128-7680
© Universiti Putra Malaysia Press
Low-Cost Optical Fibre Chemical Sensor for Usein Liquid Acid-Base Titration
1 Musa Ahmad, %Mohd. Rosli Kaskandar & 1 Tan Teng Wong1 School of Chemical Science and Food Technology
2 School of Physics and Applied Science, Faculty of Sciences and TechnologyUniversiti Kebangsaan Malaysia
43600 UKM Bangi, Selangor, Malaysia
Received: 30 April 2001
ABSTRAK
Instrumen mudah alih untuk penderia kimia gentian optik telah dibina dalamkajian ini menggunakan diod laser sebagai sumber cahaya dan fotodiodkeadaan-pepejal sebagai pengesan. Peranti yang berkos rendah ini menunjukkanrangsangan yang baik dan boleh digunakan dalam tiga jenis titratan asid-besiaitu Le. asid kuat - bes kuat, asid kuat - bes lemah dan asid lemah - bes kuat.Hasil kajian yang diperoleh menggunakan instrumen ini, didapati memberikankeputusan yang menyamai keputusan yang diperoleh menggunakan pH meterkonvensional.
ABSTRAGr
A simple low-cost portable optical fibre chemical sensor instrument has beendeveloped in this study by using a laser diode as a light source and solid-statephotodiode as a detector. This inexpensive device is shown to have a goodresponse and can be used in three different liquid acid-base titration studies Le.strong acid-strong base, strong acid-weak base and weak acid-strong base, byusing a suitable pH indicator. The results obtained by using this instrumentwere found comparable with titration data obtained by using conventional pHmeter.
INTRODUCTION
Chemical sensing with optical fibres is one of the most interesting of theemerging sensor techniques. Optical fibre chemical sensors permit thedetermination of a wide range of anions, cations, gases and organic compoundsin solution or gas phases (Narayanaswamy 1985). Impetus to develop thesesensors has arisen largely from the need to rapidly acquire data such aschemical compositions of process streams in manufacturing plants, invivo bodyfluids monitoring for clinical purposes and gaseous atmospheres, ground andriver waters for pollution monitoring. The basic concept and the advantages ofchemical sensors based on optical fibres have been discussed by many authors(Narayanaswamy 1985; Seitz 1984; Alder 1986; Narayanaswamy and Sevilla 1988;Wolfbeis 1986; Morris 1989; Narayanaswamy 1993; Saari 1987).
To date, quite a number of optical fibre chemical sensors for pHmeasurements have been reported in the literature. The pH indicators forthese sensors could be either immobilised on a support (Alabbas et al. 1989;

Musa Ahmad, Mohd. Rosli Kaskandar & Tan Teng Wong
Wolfbeis et at. 1992; Munkholm et al. 1986; Ding et at. 1991; Kirkbright et at.1984; Peterson et at. 1980; Moreno et at. 1990; Gupta and Marma 1998; Xu etat. 1998; Grant and Glass 1997; Pilar et at. 1997; Wallace et at. 1997; McCulloshand Uttarnchandani 1997; Bromberg et at. 1996; Zhang et at. 1996; Netto et at.1995; Motellier et al. 1995, Zhang et al. 1995, Ding et al. 1991) or directly usedin a solution form (Benairn et al. 1986; Sahrim et al. 1996). Zhu et al. (1992) hasreported a simple optical fibre pH sensor developed by incorporating a pHpaper at the tip of bifurcated fiber. The use of immobilised indicators willrequire the indicators to be immobilised to a kind of solid support such asentrapment in sol-gel film (Ding et at. 1991; Gupta and Sharma 1998; Grant andGlass 1997), a membrane2~ or by simple adsorption on a polymeric support(Alabbas et al. 1989; Kirkbright et at. 1984; Moreno et al. 1990). Withoutimmobilisation, the pH indicator was normally directly added to the solutionand the colour changes were monitored by the optical fibre probe. The signalobtained from these sensors, i.e. either reflectance (Alabbas et al. 1989; Kirkbrightet al. 1984; Moreno et at. 1990; Benaim et at. 1986; Sahrim et al. 1996; Christian1994) or fluorescencelO.1 117.20.26 are correlated to changes in pH of the solution.
The use of optical fibre chemical sensor to monitor the progress ofacid-base titration has earlier been reported by Shahrim et at. (1996), Benaimet al. (1986) and Moreno et at. (1990) The first two papers have reported usingfree pH indicators without prior immobilisation i.e. phenolftalien and phenolred, respectively. The work of Benaim et at. (1986) was on the development ofsimple optical pH sensor instrumentation with the probe designed for reflectancemeasurement. However, the type of acid-base titration carried out with thissensor was not mentioned. Shahrim et al. (1996) reported the same type ofreflectance probe with a fully computerized instrumentation system foracid-base titration between HCI and NaOH. Moreno et at. (1990) has beenusing cresol red immobilised on the anion-exchange resin as an indicator inacid-base titration between NaOH and strong acids (hydrochloric, perchloricand sulphuric acids), and also weak acids (salicylic, hydrofluoric and phosphoricacids). The instrumentation used in this work was a bulky tungsten-halogenlamp fitted in a spectrophotometer with photomultiplier tube as a detector.The measured parameter was the intensity of the light reflected by the resin,which was guided to the detector by the return fibre.
In this paper we presented a simple low-cost portable instrumentation foroptical fibre pH sensor. This sensor can be used to monitor the progress ofthree different types of acid-base titration by using suitable indicators. Differentfrom the reflectance type of sensors which have been previously developed, thedesign of the sensor used in this study was based on transmission mode.
METHOD
Chemicals and Solutions
Three different pH indicators are used in this study for titration end-pointdetection i.e. bromotyrnol blue (strong acid-strong base titration), bromophenol
32 PertanikaJ. Sci. & Technol. Vol. 11 0.1,2003
Low-Cost Optical Fibre Chemical Sensor for Use in Liquid Acid-Base Titration
blue (strong acid-weak base titration) and tymol blue (weak acid-strong basetitration). All the pH indicator solutions were prepared by dissolving 0.050 g ofthe indicator powder in 20% etanol and the solution was 50.00 mL volume ina volumetric flask.
The acid and base used in this study are hydrochloric acid, HCI; acetic acid,CHgCOOH; sodium hydroxide, NaOH and ammonia, NHg. The acid and basesolutions were prepared through appropriate dilution of the supplied solutionto produce acid and base solutions of 0.1 M concentration.
The Electronic Circuits
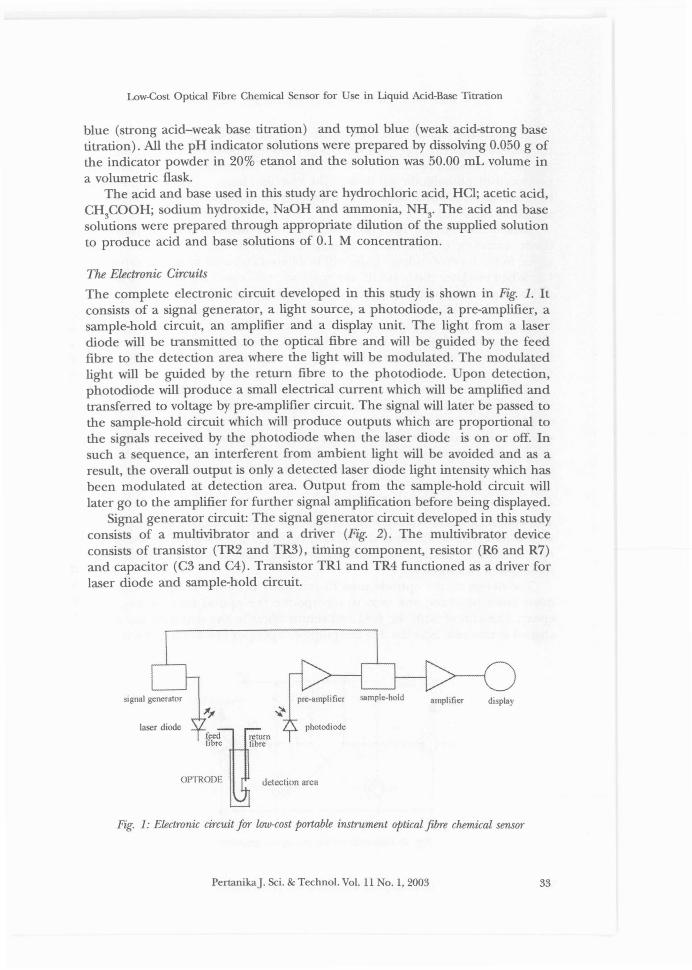
The complete electronic circuit developed in this study is shown in Fig. 1. Itconsists of a signal generator, a light source, a photodiode, a pre-amplifier, asample-hold circuit, an amplifier and a display unit. The light from a laserdiode will be transmitted to the optical fibre and will be guided by the feedfibre to the detection area where the light will be modulated. The modulatedlight will be guided by the return fibre to the photodiode. Upon detection,photodiode will produce a small electrical current which will be amplified andtransferred to voltage by pre-amplifier circuit. The signal will later be passed tothe sample-hold circuit which will produce outputs which are proportional tothe signals received by the photodiode when the laser diode is on or off. Insuch a sequence, an interferent from ambient light will be avoided and as aresult, the overall output is only a detected laser diode light intensity which hasbeen modulated at detection area. Output from the sample-hold circuit willlater go to the amplifier for further signal amplification before being displayed.
Signal generator circuit: The signal generator circuit developed in this studyconsists of a multivibrator and a driver (Fig. 2). The multivibrator deviceconsists of transistor (TR2 and TR3), timing component, resistor (R6 and R7)and capacitor (C3 and C4). Transistor TRI and TR4 functioned as a driver forlaser diode and sample-hold circuit.
pholodlOde
feed1rturnlibre libre
(WI RODE detecllOn area
laser diode
Fig. 1: Electronic circuit for low-cost portable instrument optical fibre chemical sensor
PertanikaJ. Sci. & Techno!. Vol. 11 No.1, 2003 33

Musa Ahmad, Mohd. Rosli Kaskandar & Tan Teng Wong
Pre-amplifier circuit: The pre-amplifier circuit used in this study was BIFEToperational-amplifier (op-amp) because its input impedance which is high, issuitable for handling small electrical signals. The small electrical currentproduced by photodiode will flow to the inverting input (-) and then directlyto a feedback resistor ~ which will transform the current to output voltage asshown in Fig. 3 (A).
Sample-hold circuit: The components used to build this circuit consist of adiode, capacitor C2 and BIFET op-amp as shown in Fig. 3 (B). An electricalsignal in the form of voltage pulse will be filtered and will charge the capacitorC2. When the laser diode is off, the transistor collector TRI and diode anodewill be at zero level and therefore, no signal will pass the diode. Therefore, onlya signal pulse is allowed to pass this circuit. The charge at the capacitor C2 willbe discharged only through resistor R2 because the input impedance at the opamp non-inverting input (+) is very high. The discharge duration is governedby the values of resistor Rl and capacitor C2 used. In this study, the dischargetime is 1 second.
Amplifier circuit: The output signal produced by the sample-hold circuit isnot big enough to be displayed and an amplifier circuit is needed for furtheramplification of the signal. The amplifier circuit consists of bipolar op-amp asshown in Fig. 3 (C). The values of ~ and ~ used in this circuit will determinethe amplification values, Ej" The end of ~ was connected to V
Rwhich, having
potential difference of (+) and (-), ensures that the Vo values could be adjusted.
Construction of optical Electrode (Optrode)
The optical fibre used for optrode construction is of multimode silica type withcore diameter of 1 mm and numerical aperture, NA of 0.47. Before using theoptical fibre, its surface was polished by using lapping sheets to produce asmooth and flat surface.
The design of the optrode used in this study is shown in Fig. 4. A mouldmade from plasticine was used to incorporate the optical fibre in the resinepoxy. The end of both the feed and return fibres in the detection has to bealigned to minimise light lost. For this purpose, a perspex block of 5 x 18 x 20 mm
12V
to laser diode
TR4
R8 R7 R6 R5 to sample-hold
TRI
34
Fig. 2: Electronic circuit for signal generator
PertanikaJ. Sci. & Techno!. Vol. 11 No.1, 2003

Low-Cost Optical Fibre Chemical Sensor for Use in Liquid Acid-Base Titration
Rr
> __ V.
::::- PHOTODIODE
--(A)
VR 1
R2H/MO
v.E,
toTRIIU
ell.l~f< .I...
-(B)
R,
6 Vo
E,+12 V
R,V..
-12 V
(C)
Fig. 3: Electronic circuit for pre-amplifier (A), sample-hold (B) and amplifier (C)
return fibre
~
detectionarea
feed fibre
~
Fig. 4: The design of the optical fibre optrode
PertanikaJ. Sci. & Techno!. Vol. 11 No. I, 2003 35

Musa Ahmad, Mohd. Rosli Kaskandar & Tan Teng Wong
(Fig. 5) was used to secure the position of the feed and return fibres. Bothfibres were inserted in the respective hole on the perspex block and thedistance between the two fibres was fixed at 1mm. The perspex block was laterplaced in the plasticine mould and the resin epoxy was gradually poured intothe mould. The hardened resin epoxy will produce an optrode with anapproximate size of 5 x 20 x 100 mm. Fig. 6 shows the picture of the low-eostportable optical fibre sensor instrumentation developed in this study.
Procedures
The instrumentation arrangement during acid-base titration process is as shownin Fig. 7. The optical fibre instrument has to be warmed up for about 15 minbefore use for better signal stability. A 150 ml beaker was used as a titrationcontainer where the optrode, magnetic bar and the conventional pH meterwere placed. The pH meter was calibrated by using a standard buffer solutionof pH 4.0 and pH 9.0 before use.
hole forreturn fibre
hole forfeed fibre
detectionarea
Fig. 5: A perspex block used to align the feed fibre and return fibre in the optrode
Fig. 6: Instrumentation for portable optical fibre chemical sensor
36 PertanikaJ. Sci. & Technol. Vol. 11 o. 1, 2003

Low-Cost Optical Fibre Chemical Sensor for Use in Liquid Acid-Base Titration
Fig. 7: Experimental set-up for use of portahle optical.fibre sensor in acidrbase titration
For titration between strong acid and weak base, 40 mL of 0.1 M HCIsolution was placed in a beaker whereas NaOH 0.1 M solution which was usedas a titran was placed in a burette. Mter adding 5 drops of bromothymol bluein the acid solution, the mixture was stirred by using a magnetic stirrer at aconstant speed. The NaOH solution was then added gradually and bothreadings from the optrode and pH meter were recorded. The same titrationprocess was repeated for other acid-base titrations i.e. titration between strongacid-weak base (0.1 M HCI and 0.1 M NHPH) and strong base-weak acid(0.1 M CH~COOH and 0.1 M NaOH) by using bromophenol blue and thymolblue as an indicator, respectively. The strong acid or strong base was used as atitran in each titration.
RESULTS AND DISCUSSION
Bromothymol blue, bromophenol blue and thymol blue were chosen in thisstudy because their colour changes (yellow to blue) are suitable for light sourceused in this study i.e red laser diode. The significant contrast in the colourchanges of the indicators used is also important to ensure it could be easilydetected by the voltmeter.
The sensor was found to give a rapid response time (in a range of a fewseconds) upon changes in the solution pH and this is due to the optical methodof measurements with detectors having a sub-microsecond response. Table 1summarizes the values of pH range as well as the titration end-point for all theindicators used in this study as measured by optrode and pH meters. As shown,the pH range and the titration end-point data obtained from both optrode andpH meters are comparable.
Figs. 8 - 10 show the titration curves for all the acid-base titrations whichhave been carried out in this study. The voltmeter reading from the optrodewas found to change with changes in the solution pH. This change is basically
PertanikaJ. Sci. & Techno!. Vo!. 11 No.1, 2003 37

Musa Ahmad, Mohd. Rosli Kaskandar & Tan Teng Wong
TABLE 1The pH range and titration data for bromothymol blue, bromophenol blue and
thymol blue as measured by optrode and pH meters
pH indicator Titration End-Point, mL pH Range
meter optrode different reference3l meter pH optrodepH
bromothymol blue 40.70 40.70 0.00 6.0 - 7.6 4.2 - 9.2 4.0 - 8.0bromophenol blue 37.40 37.70 0.30 2.8 - 5.0 3.0 - 6.2 2.7 - 6.3thymol blue 42.80 43.10 0.30 7.0 - 9.6 6.8 - 9.4 7.2 - 9.2
5040
~..
20 3010
Volume of NaOH, ml
12 ~---------,.----,
10 +----------+8t--------
i 6 +-----------l--
4
2 .
o ;-..-_--~-------<o50
.........._--_ -
10 20 30 40
Volume of NaOH, ml
4.40 -!- ----I
o
4.60
520 .,---------------,
>~ 4.80>
(A) (B)
Fig. 8: Titration curve for titration between 40 mL HCI, O.lM and NaOH,O.lM measured by pcmable optical fibre
3.00..--------------,
2.80
> 2.60 .
g 2.40 .....,J ..2.20 l-_.-...O<d::~~--~......~2.00 ~ ~__-~_......,.---J
o 5 10 15 20 25 30 35 40 45
Volume of HCI, ml
12 r-------------,
10
8
i 6
4
2· .
o .f-._--_- -_~--1
o 5 10 15 20 25 30 35 40 45
Volume of HCI, ml
(A) (B)
Fig. 9: Titration curve for titration between 40 mL NH], O.lM and HCI,O.lM measured by pcmable optical fibre chemical sensor (A) and conventional pH meter(B),
when bromophenol blue was used as an indicator
38 PertanikaJ. Sci. & Techno!. Vo!. 11 No. I, 2003

Low-Cost Optical Fibre Chemical Sensor for Use in Liquid Acid-Base Titration
so4020 30
Volume of NaOH, ml10
12·
10
8
:I: 6Q.
4
2
00so4010 20 30
Volume of NaOH, rri
3.40 ,..--------------,
3.00>.g 2.80 +----
> 2.60+----
2.40
2.20 l--~----------I
o
' _-----(A) (B)
Fig. 10: Titration curve for titration between 40 mL CH)COOH, 0.1M and NaOH,0.1M measured by portable optical fibre chemical sensor (A) and conventional
pH meter (B), when tymol blue was used as an indicator
due to the changes in the colour of the solution when the titran was addedgradually to the solution. When the end-point of the acid-base titration isreached, the colour change is completed and therefore an abrupt changeoccurs in the volt reading as shown in Figs. 8 - 10 (A). A similar shape oftitration curves was also observed for acid-base titration between HCI andNaOH monitored by optical fibre pH sensor based on reflectance measurement(Moreno et at. 1990). These changes correspond to similar changes observed inthe pH reading as shown in Figs. 8 - 10 (B) when the pH of the solution wasmonitored by using conventional pH glass electrode.
CONCLUSION
The low-cost portable optical fibre sensor has been successfully developed inthis study. The optrode could be used to monitor the progress of liquid acidbase titration between strong acid-strong base, strong acid-weak base and weakacid-strong base. The opto-electronic components used were a laser diode andphotodiode detector with no optical filtering elements.
ACKNOWLEDGEMENT
The researchers would like to acknowledge the Malaysian Government forfinancial support of this research under IRPA 03-02-02-0044 research grant.
REFERENCES
ALABBAS, S.H, D.C AsHWORTH and R ARAYANASWAMY. 1989. Design and performancefeatures of an optical-fibre reflectance pH Sensor. Anal. Proc. 26: 373.
ALDER J.F. 1986. Optical fibre chemical sensors. Fresenius Z. Anal. Chem: 324, 372.
BENAIM, N., K.T.V. GRATTANT and A.W. PALMER. 1986. Simple fiber optic pH for use inliquid titrations. Analyst 111: 1095-1097.
PertanikaJ. Sci. & Techno!. Vol. 11 No. I, 2003 39

Musa Ahmad, Mohd. Rosli Kaskandar & Tan Teng Wong
BROMBERG A, J. ZILBERSTEIN, G. FRISHMAN, S. RIESEMBERG, E. BE ORl, E. SILBERSTEIN,J. ZIMNAVODA and A. KRiTzMAN. 1996. Optical-fibre sensors for blood gases and pH,based on porous glass tips, sensors and actuators. B: Chemical 31(3): 181-191.
CHRISTIAN, G. D. 1994. Analytical Chemistry. 5th edn. p. 172-177,220-232. ewYork :JohnWiley & Sons, Inc.
DING, j. Y., M. R SHAHRlARI and G. H. SIGEL. 1991. Fiber optic pH sensors prepared bysol gel immobilisation technique. Electronic Letters 27: 1560-1562.
GUPTA B. D. and S. SHARMA. 1998. A long-range fiber optic pH sensor prepared by dyedoped sol-gel immobilization technique. optics Communications 154(5-6): 282.
GRANT S. A. and R S. GLASS. 1997. A sol-gel based fiber optic sensor for local blood pHmeasurements, sensors and actuators. B: Chemical 45(1): 35-42.
K.nurnRIGHT G. K., R NARAYANASWAMY and N. A WELTI. 1984. Fibre optic pH probe basedon the use of an immobilised colorimetric indicator. Analyst 109: 1025.
MCCULLOCH, S. and D. UTTAMCHANDANl. 1997. Development ofa fibre optic micro-optrodefor intracellular pH measurements. IEEE Proceedings Optoelectronics 144(3): 162-167.
MORENO M. C., M. JIMENEZ C. P. CONDE and C. CAMARA. 1990. Analytical performance ofan optical pH sensor for acid-base titration. Anal. Chim. Acta 230: 35.
MOTELLIER S. , M. H. omt, B. DURiAuLT and H. PITSCH. 1995. pH determination of clayinterstitial water using a fiber-optic sensor, sensors and actuators. B:Chemical29(1-3).
MUNKHOLM C., D. R WALT, F. P. M!.LANOVICH and S. M. KiAINER. 1986. Polymer modificationof fiber optic chemical sensors as a method of enhancing fluorescence signal for pHmeasurement. Anal. Chem. 58: 1427.
ARAYANASWAMY, R 1985. Optical fibre sensors in chemical analysis: Fibre optics forchemical sensing. Anal. Proc. 22: 204-206.
NARAYANASWAMY Rand F. SEVILLA III. 1988. Optical fibre sensors for chemical species.J Phys. E. Sci. Instrum.: 21, 10.
NARAYANASWAMY R 1993. Chemical transducers based on fiber optics for environmentalmonitoring. In The Science of the Total Environment, p. 135, 103.
NETTO E.j.,j. 1. PETERSON, M. MCSHANE and V. HAMpSHIRE. 1995. A fiber-optic broad-rangepH sensor system for gastric measurements, sensors and actuators. B:Chemical29(1-3): 157-163.
ORRIS j. O. W. 1989. Current status and prospects for the use of optical fibres inchemical analysis. Analyst 114: 1359.
WOLFBEIS O.S., N.V. RODRIGUEZ and T. WERNER. 1992. LED-compatible fluorosensor formeasurement of near-neutral pH values. Mikrochim. Acta 108: 113.
P[TERSO j.I., S.R GoLDSTEIN and R V. FITZGERALD. 1980. Fiber optic pH probe forphysiological use. Anal. Chem. 52: 864.
PILAR M. D., T. SoTOMAYOR, M. A. DE PAOLI and W. A. OLIVEIRA. 1997. Fiber-optic pHsensor based on poly(o-methoxyaniline). Analytica Chimica Acta 353(2-3): 275-280.
40 PertanikaJ. Sci. & Technol. Vol. 11 No.1, 2003
Low-Cost Optical Fibre Chemical Sensor for Use in Liquid Acid-Base Titration
SAARI L. A 1987. Trends in fiber optic sensor development. Trends in Analytical Chemistry6(4): 85.
SAHRIM H]. AHMAD, A MUSA and K.L. Wo G. 1996. Computerised optical fibre sensor forpH measurement. Pertanika J Sci. & Tecnol. 4(2): 209-220.
SEITZ, W. R. 1984. Chemical sensors based on fiber optics. Anal. Chem. 56(1): 16A - 34A.
WALLACE P. A, M. CAMPBELL, Y. YANG, A S. HOLMEs-SMITH and M.UTIAMlAL. 1997. Adistributed optical fibre fluorosensor for pH measurement. Journal of Luminescence72-74: 1017-1019.
WOLFBEIS O. S. 1986. Analytical chemistry with optical sensors. Fresenius Z. Anal.Chern..325, 387.
Xu Z., R. ANDREW, A. RICARDO and M. ROGER. 1998. Novel fiber-optic pH sensorincorporating carboxy SNAFL-2 and fluorescent wavelength-ratiometric detection.Journal of Biomedical Materials Research 39(1): 9-15.
ZHU j., Y. JIN and j. XUE. 1992. Fibrication and characterization of a sterilizable pHoptrode. Fresenius J Anal. Chern.. 342: 42.
ZHANG S., S. TANAKA, Y. A B. D. WICKRAMASfNGHE and P. ROLFE. 1995. Fibre-optical sensorbased on fluorescent indicator for monitoring physiological pH values. Medical &Biological Engineering & Computing 33(2): 152-156.
ZHANG S. F., Y. A. B. D. WICKRAMASINGHE and P. ROLFE. 1996. Investigation of an opticalfibre pH sensor with the membrane based on phospholipid copolymer. Biosensorsand Bioelectronics 11(1-2): 11-16.
PertanikaJ. Sci. & Techno!. Vo!. 11 No.1, 2003 41