LOW-COST POLICY OPTIONS FOR · Centro de Ciencias de la Atmósfera October 2019 LOW-COST POLICY...
28
Centro de Ciencias de la Atmósfera October 2019 LOW-COST POLICY OPTIONS FOR ACHIEVING MEXICO’S NDC AND LONG- TERM CLIMATE GOALS Fernando Olea - consultant
Transcript of LOW-COST POLICY OPTIONS FOR · Centro de Ciencias de la Atmósfera October 2019 LOW-COST POLICY...
Centro de Ciencias de la Atmósfera October 2019
LOW-COST POLICY OPTIONS FOR
ACHIEVING MEXICO’S NDC AND LONG-
TERM CLIMATE GOALS
Fernando Olea - consultant

– Context
– The EPS model
– Reference scenario and data needs
– Climate policies assessed
– Long-term projection
– Some results
CONTENT
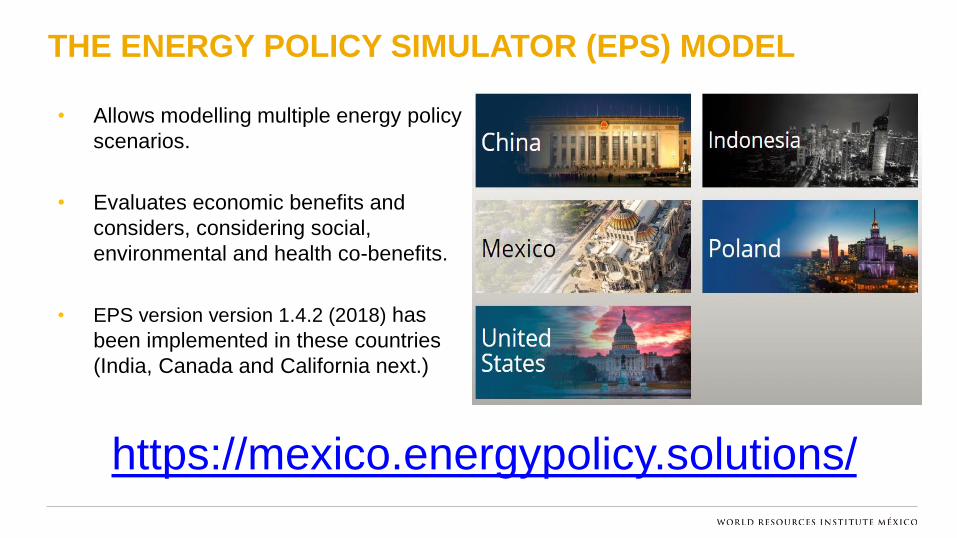
• Allows modelling multiple energy policy
scenarios.
• Evaluates economic benefits and
considers, considering social,
environmental and health co-benefits.
• EPS version version 1.4.2 (2018) has
been implemented in these countries
(India, Canada and California next.)
THE ENERGY POLICY SIMULATOR (EPS) MODEL
https://mexico.energypolicy.solutions/

Fuente: Energy Innovation
CALCULATION FLUX
Simplified diagram of the large model components and the calculation flux.

1. Electricity generation
2. Energy consumption in buildings
3. Oil and gas
4. Industry
5. Waste management
6. Agriculture
7. Transport
8. Land use and forestry
EMISSION SOURCES CONSIDERED
Industry
Buildings
Transport
Land use
Electricity

• CO2e emissions total and by sector
• Criteria pollutant emissions
• Energy balance by source and technology
• Power generation capacity by technology
• Fuel consumption
• Changes in infrastructure investments and operation costs
• Health benefits from pollution abatement
• Co-benefits on public health
MODEL OUTCOMES

-
200
400
600
800
1,000
1,200
2015 2020 2025 2030
Source: Presentation of NDCs SRE/SEMARNAT (March 2015) and linear intrapolation,
Source: WRI, Energy Policy Simulator Mexico v.1.4.1
EPS REFERENCE TRAJECTORY
• EPS model runs against a
“reference scenario”, similar to
an emissions baseline.
• Based on the National
Emissions Inventory 2015 and
current energy prospective
studies (2017-2031)
• Less growth in emissions that
NDC baseline from new data
and mitigation actions
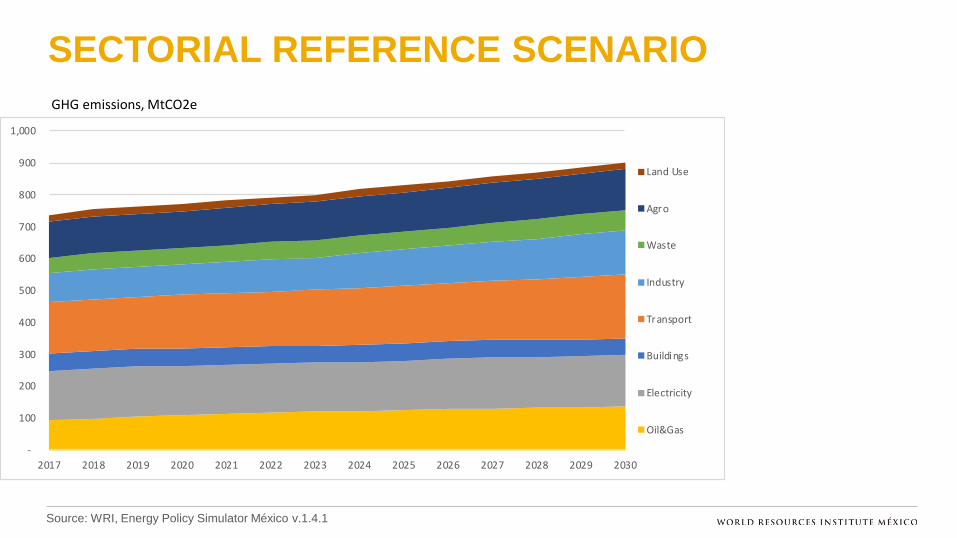
• Emissions projected at 901
MtCO2e in 2030 (71 Mton
difference, 7%)
972
672
792
GHG emissions, MtCO2e
772
901
762
623
737
741
-
100
200
300
400
500
600
700
800
900
1,000
2017 2018 2019 2020 2021 2022 2023 2024 2025 2026 2027 2028 2029 2030
Land Use
Agro
Waste
Industry
Transport
Buildings
Electricity
Oil&Gas
Source: WRI, Energy Policy Simulator México v.1.4.1
SECTORIAL REFERENCE SCENARIO
GHG emissions, MtCO2e

0
100
200
300
400
500
600
700
800
900
1000
2017 2018 2019 2020 2021 2022 2023 2024 2025 2026 2027 2028 2029 2030
Land Use
Agro
Waste
Industry
Transport
Buildings
Electricity
Oil&Gas
Source: WRI, Energy Policy Simulator México v.1.4.1
APPLYING MITIGATION POLICIES
GHG emissions, MtCO2e
Conditional
NDC scenario
with mitigation
policies across
sectors

0
100
200
300
400
500
600
700
800
900
1000
2017 2018 2019 2020 2021 2022 2023 2024 2025 2026 2027 2028 2029 2030
Land Use
Agro
Waste
Industry
Transport
Buildings
Electricity
Oil&Gas
Source: WRI, Energy Policy Simulator México v.1.4.1
CONDITIONAL NDC SCENARIO
737 737
635
GHG emissions, MtCO2e

EPS NC, 691
EPS Cond, 552
-
200
400
600
800
1,000
1,200
1,400
2015 2020 2025 2030 2035 2040 2045 2050
Source: NDCs Presentation SRE/SEMARNAT (March 2015) and linear intrapolation
Source: WRI, Energy Policy Simulator México v.1.4.1
LONG-TERM REFERENCE SCENARIO (2050)
GHG emissions, MtCO2e
972
672
901 762
623 737
1,075
1,310
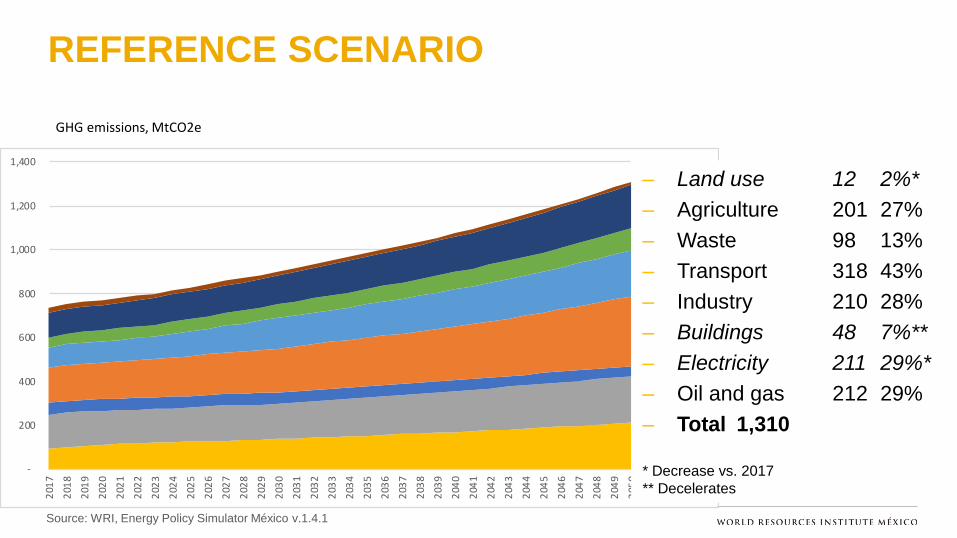
• Projected emissions reach
1,310 MtCO2e in 2050

Source: WRI, Energy Policy Simulator México v.1.4.1
LONG-TERM REFERENCE SCENARIO (2050) Criteria pollutant emissions, Mt
CH4 EmissionsN2O EmissionsCO Emissions
OC EmissionsBC Emissions
PM10 Emissions
PM25 Emissions
NOx EmissionsSOx Emissions0
100
200
300
400
500
600
20172018
20192020
20212022
20232024
20252026
20272028
20292030
20312032
20332034
20352036
20372038
20392040
20412042
20432044
20452046
20472048
20492050

Source: WRI, Energy Policy Simulator México v.1.4.1
LONG-TERM REFERENCE SCENARIO (2050) Criteria pollutant emissions, Mt
CH4 Emissions
N2O Emissions
CO Emissions
NOx EmissionsSOx Emissions
0
2
4
6
8
10
12
20172018
20192020
20212022
20232024
20252026
20272028
20292030
20312032
20332034
20352036
20372038
20392040
20412042
20432044
20452046
20472048
20492050

Source: WRI, Energy Policy Simulator México v.1.4.1
LONG-TERM NDC SCENARIO (2050) Criteria pollutant emissions, Mt
CH4 EmissionsN2O EmissionsCO Emissions
OC EmissionsBC Emissions
PM10 Emissions
PM25 Emissions
NOx EmissionsSOx Emissions0
100
200
300
400
500
600
20172018
20192020
20212022
20232024
20252026
20272028
20292030
20312032
20332034
20352036
20372038
20392040
20412042
20432044
20452046
20472048
20492050
CH4 EmissionsN2O EmissionsCO Emissions
OC EmissionsBC Emissions
PM10 Emissions
PM25 Emissions
NOx EmissionsSOx Emissions0
50
100
150
200
250
300
350
400
450
500
20172018
20192020
20212022
20232024
20252026
20272028
20292030
20312032
20332034
20352036
20372038
20392040
20412042
20432044
20452046
20472048
20492050

Source: WRI, Energy Policy Simulator México v.1.4.1
LONG-TERM REFERENCE SCENARIO (2050) Criteria pollutant emissions, Mt
CH4 Emissions
N2O Emissions
CO Emissions
NOx EmissionsSOx Emissions
0
2
4
6
8
10
12
20172018
20192020
20212022
20232024
20252026
20272028
20292030
20312032
20332034
20352036
20372038
20392040
20412042
20432044
20452046
20472048
20492050
CH4 Emissions
N2O Emissions
CO Emissions
NOx Emissions
SOx Emissions
0
2
4
6
8
10
12
20172018
20192020
20212022
20232024
20252026
20272028
20292030
20312032
20332034
20352036
20372038
20392040
20412042
20432044
20452046
20472048
20492050
Source: WRI, Energy Policy Simulator México v.1.4.1
REFERENCE SCENARIO
GHG emissions, MtCO2e
-
200
400
600
800
1,000
1,200
1,400
201
7
201
8
201
9
202
0
202
1
202
2
202
3
202
4
202
5
202
6
202
7
202
8
202
9
203
0
203
1
203
2
203
3
203
4
203
5
203
6
203
7
203
8
203
9
204
0
204
1
204
2
204
3
204
4
204
5
204
6
204
7
204
8
204
9
205
0
Land Use
Agro
Waste
Industry
Transport
Buildings
Electricity
Oil&Gas
– Land use 12 2%*
– Agriculture 201 27%
– Waste 98 13%
– Transport 318 43%
– Industry 210 28%
– Buildings 48 7%**
– Electricity 211 29%*
– Oil and gas 212 29%
– Total 1,310
* Decrease vs. 2017
** Decelerates

Source: WRI, Energy Policy Simulator México v.1.4.1
COMPARATIVE OF EMISSIONS
ESCENARIO DE REFERENCIA
Sector 2017 2030 2050
Buildings 55 8% 53 6% 48 4%
Transport 158 22% 199 22% 318 24%
Electricity 155 21% 161 18% 211 16%
Oil&Gas 94 13% 137 15% 212 16%
Industry 90 12% 140 16% 210 16%
Waste 48 7% 63 7% 98 7%
Agro 113 15% 129 14% 201 15%
Land Use 22 3% 18 2% 12 1%
TOTAL 737 901 1310
Crecimiento porcentual v.2017 22% 78%

0
200
400
600
800
1000
1200
1400
201
7
201
8
201
9
202
0
202
1
202
2
202
3
202
4
202
5
202
6
202
7
202
8
202
9
203
0
203
1
203
2
203
3
203
4
203
5
203
6
203
7
203
8
203
9
204
0
204
1
204
2
204
3
204
4
204
5
204
6
204
7
204
8
204
9
205
0
Land Use
Agro
Waste
Industry
Transport
Buildings
Electricity
Oil&Gas
Source: WRI, Energy Policy Simulator México v.1.4.1
ABATEMENT BY 2050 – NDC SCENARIO
GHG emissions, MtCO2e
737 737
635 676
754

EXAMPLE OF POLICY LEVERS: TRANSPORT
• Incentives for electric vehicles (EV) (dedicated lanes, preferential parking, recharge point benefits).
• Mandate on EV sales
• Subsidy to EVs
• Feebates – revenue neutral charge on efficiency
• Vehicle efficiency standards
• Low-carbon fuel standard
• Transport demand management: improving public transportation, non-motorized transportation

Source: WRI, Energy Policy Simulator Mexico v.1.4.1
MARGINAL ABATEMENT COST CURVE –
NDC SCENARIO 2050
Figure 7. Conditional NDC Scenario—Marginal Abatement Cost Curve through 2050 (NPV)
COLUMN WIDTH (x-axis) COLUMN HEIGHT (y-axis)
Policy Group Annual average abatement potential [MtCO2e] Cost effectiveness [$/tCO2e]
Transportation Demand Management 16 -132.62
Cogeneration and Waste Heat Recovery 5 -76.1
Industry Energy Efficiency Standards 31 -69.83
Subsidy for Electricity Production 20 -59.02
Renewable Portfolio Standard 10 -33.65
Early Retirement of Power Plants 1 -31.46
Vehicle Fuel Economy Standards 32 -22.46
Feebate 7 -10.23
Livestock Measures 30 -1.49
Reduce F-gases 16 -0.24
Improved Forest Management 4 0.34
Cement Clinker Substitution 8 0.76
Forest Set-Asides 8 9.73
Low Carbon Fuel Standard 10 9.87
Cropland Management 4 14.85
Afforestation and Reforestation 5 14.91
Carbon Tax 58 15.2
Distributed Solar Promotion 20 15.42
Methane Capture and Destruction 50 16.55
Building Energy Efficiency Standards 9 17.15
Industrial Fuel Switching 12 25.71
Building Component Electrification 10 30.07

• Light vehicle transition to new technologies reaches only 2.8% by 2030, but
grows to 17% in 2050.
Source: WRI, Energy Policy Simulator México v.1.4.1
VEHICLE ELECTRIFICATION
18,13 18,74
32,40
18
20
22
24
26
28
30
32
34
2017 2020 2023 2026 2029 2032 2035 2038 2041 2044 2047 2050
Mill
on
es d
e ve
híc
ulo
s
Light-duty vehicles
0,10% 1,25% 6,75% 0,85% 1,42% 3,38%
99,03% 95,79% 79,62%
0,02% 1,51% 10,22%
2017 2030 2050
Composition by type of technology
Híbridos Diésel Gasolina Gas natural Eléctricos

Source: WRI, Energy Policy Simulator México v.1.4.1
ENERGY TRANSITION
341,29
578,69
298,17
399,33
674,05
280
330
380
430
480
530
580
630
680
2017 2022 2027 2032 2037 2042 2047 2052
TWh
/añ
o
Electricity generation
Condicionado Referencia
0,42%
20,71% 19,37%
0,22%
16,49% 30,54%
5,20%
8,89%
10,13%
17,52%
18,00%
11,78%
2,24%
1,62% 0,92%
18,84%
6,39%
3,77% 2,14% 38,37%
28,36% 24,56%
8,29% 1,20%
2017 2030 2050
Installed capacity (GW) Carbón
Gas Natural (non-peaker)Gas Natural(peaker)Petróleo
Nuclear
Hidroeléctrica
Eólica (offshore)
Eólica (onshore)
Solar PV
Solar PVDistribuidaBiomasa
7% 46% 60%
Renewable energy penetration

Source: WRI, Energy Policy Simulator México v.1.4.1
STATISTICAL HUMAN DEATHS AVOIDED FROM
ABATEMENT OF CRITERIA POLLUTANTS
27.257
48.968
0
5.000
10.000
15.000
20.000
25.000
30.000
35.000
40.000
45.000
50.000
2017 2020 2023 2026 2029 2032 2035 2038 2041 2044 2047 2050
Accumulated statistical deaths avoided from abatement of particulate matter concentration

Thank you GRACIAS
Dr. Andrés Flores Montalvo Director de Cambio Climático y Energía
World Resources Institute México [email protected]
www.wrimexico.org
Ing. Fernando Olea Tinoco
Consultant World Resources Institute


• The EPS model evaluates the effects of 58 energy and
environmental policies with various metrics, such as:
– Emission of 12 pollutants
– Cash flows of government, enterprises and consumers
– Composition of the electricity generation matrix
– Use of fuels
– Social and health benefits of pollutant emission reduction.
• The EPS runs on Vensim, a system dynamics platform. EPS models
energy use processes and the economy as an open, changing and
non-equilibrium system.
Source: Energy Innovation
MODEL ARCHITECTURE
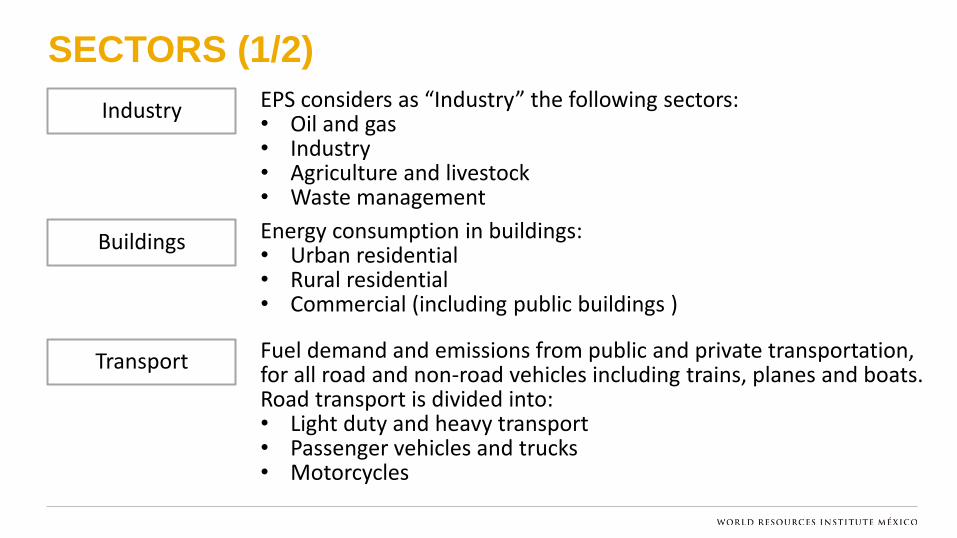
SECTORS (1/2)
EPS considers as “Industry” the following sectors: • Oil and gas • Industry • Agriculture and livestock • Waste management
Industry
Energy consumption in buildings: • Urban residential • Rural residential • Commercial (including public buildings )
Buildings
Fuel demand and emissions from public and private transportation, for all road and non-road vehicles including trains, planes and boats. Road transport is divided into: • Light duty and heavy transport • Passenger vehicles and trucks • Motorcycles
Transport

SECTORS (2/2)
Emissions and carbon sinks from land use changes and forest action. Land use
Assesses emissions and costs of satisfying electricity demand of sectors (industry, buildings and transport), at the least cost while taking into account operation policy, technical and political limitations.
Electricty generation
The carbon capture and storage (CCS) module impacts fuel emissions from industry and increases energy demand (required by CCS itself, if technology is available
CCS
This module is not used in Mexico; it is used to model large scale residential and commercial heating systems. It is linked to the industrial sector, allowing the modeling synergies between electric generation and thermal cogeneration.
Urban heating