Low-Cost Methods for Molecular Characterization of Mutant ... · Low-Cost Methods for Molecular...
42
Bradley J. Till · Joanna Jankowicz-Cieslak Owen A. Huynh · Mayada M. Beshir Robert G. Laport · Bernhard J. Hofinger Low-Cost Methods for Molecular Characterization of Mutant Plants Tissue Desiccation, DNA Extraction and Mutation Discovery: Protocols
Transcript of Low-Cost Methods for Molecular Characterization of Mutant ... · Low-Cost Methods for Molecular...

Bradley J. Till · Joanna Jankowicz-CieslakOwen A. Huynh · Mayada M. BeshirRobert G. Laport · Bernhard J. Ho� nger
Low-Cost Methods for Molecular Characterization of Mutant PlantsTissue Desiccation, DNA Extraction and Mutation Discovery: Protocols

Low-Cost Methods for Molecular Characterizationof Mutant Plants

ThiS is a FM Blank Page

Bradley J. Till • Joanna Jankowicz-Cieslak •Owen A. Huynh • Mayada M. Beshir •Robert G. Laport • Bernhard J. Hofinger
Low-Cost Methods forMolecular Characterizationof Mutant Plants
Tissue Desiccation, DNA Extraction andMutation Discovery: Protocols

Bradley J. TillPlant Breeding and Genetics LaboratoryJoint FAO/IAEA Division of NuclearTechniques in Food and Agriculture
ViennaAustria
Joanna Jankowicz-CieslakPlant Breeding and Genetics LaboratoryJoint FAO/IAEA Division of NuclearTechniques in Food and Agriculture
ViennaAustria
Owen A. HuynhPlant Breeding and Genetics LaboratoryJoint FAO/IAEA Division of NuclearTechniques in Food and Agriculture
ViennaAustria
Mayada M. BeshirAgricultural Research CorporationKhartoum NorthSudan
Robert G. LaportSchool of Biological SciencesUniversity of Nebraska-LincolnLincolnNebraskaUSA
Bernhard J. HofingerPlant Breeding and Genetics LaboratoryJoint FAO/IAEA Division of NuclearTechniques in Food and Agriculture
ViennaAustria
ISBN 978-3-319-16258-4 ISBN 978-3-319-16259-1 (eBook)DOI 10.1007/978-3-319-16259-1
Springer Cham Heidelberg New York Dordrecht London© International Atomic Energy Agency 2015. The book is published with open access atSpringerLink.com.Open Access provided with a grant from the International Atomic Energy Agency.Open Access This book is distributed under the terms of the Creative Commons AttributionNon-commercial License which permits any noncommercial use, distribution, and reproduction in anymedium, provided the original author(s) and source are credited.All commercial rights are reserved by the Publisher, whether the whole or part of the material isconcerned, specifically the rights of translation, reprinting, reuse of illustrations, recitation, broad-casting, reproduction on microfilms or in any other physical way, and transmission or informationstorage and retrieval, electronic adaptation, computer software, or by similar or dissimilar methodol-ogy now known or hereafter developed.The use of general descriptive names, registered names, trademarks, service marks, etc. in thispublication does not imply, even in the absence of a specific statement, that such names are exemptfrom the relevant protective laws and regulations and therefore free for general use.The publisher, the authors and the editors are safe to assume that the advice and information in this bookare believed to be true and accurate at the date of publication. Neither the publisher nor the authors or theeditors give a warranty, express or implied, with respect to the material contained herein or for any errorsor omissions that may have been made.
Printed on acid-free paper
Springer International Publishing AG Switzerland is part of Springer Science+Business Media(www.springer.com)

Foreword
The Joint FAO/IAEA Programme of Nuclear Techniques in Food and Agriculture
has, for over 50 years, supported Member States in the use of nuclear techniques for
crop improvement. This includes the use of induced mutations to generate novel
diversity for breeding crops with higher yield, better nutritive value, and stronger
resilience to biotic and abiotic stresses. This approach, first applied in the late
1920s, has been very successful across the world. More than 3,200 officially
registered mutant crop varieties can be found in the IAEA’s Mutant Variety
Database. Covering over 150 species, examples include salt-tolerant rice, barley
that can be grown at over 3,000 m, and wheat that is resistant to the emerging global
disease known as Ug99. While successful, there are factors that threaten global food
production and security. These include increasing world population and climate
change and variation. Thus, continued and increasing efforts are required of plant
breeding and genetics to meet the demand. Established and emerging biotechnol-
ogies that leverage available genome sequences can be used to facilitate and speed-
up the plant breeding process. While successfully applied in developed countries,
technology transfer to developing countries can be challenging. Issues include
equipment and material costs and ease of experimental execution. The methods
described in this book address this by providing low-cost and simple to execute
molecular assays for germplasm characterization that can be applied in any labo-
ratory equipped for basic molecular biology.
The views expressed in this text do not necessarily reflect those of the IAEA or
FAO, or governments of their Member States. The mention of names of specific
companies or products does not imply an intention to infringe on proprietary rights,
nor should it be construed as an endorsement or recommendation on the part of
IAEA or FAO.
Vienna, Austria Bradley J. Till
v

ThiS is a FM Blank Page

Acknowledgements
We thank the participants of IAEA TC-funded training courses for their useful
feedback when using these protocols during trainings held in the IAEA laboratories
in Seibersdorf, Austria, from 2009 to 2014. We also thank Dr. Huijun Guo of the
Chinese Academy of Agricultural Sciences for her assistance in evaluating an early
draft of the DNA extraction protocol. We thank Dr. Thomas H. Tai of the United
States Department of Agriculture and Dr. Jochen Kumlehn of the Leibniz Institute
of Plant Genetics and Crop Plant Research, Germany, for serving as external
reviewers and helping to improve this protocol book. Funding for this work was
provided by the Food and Agriculture Organization of the United Nations and the
International Atomic Energy Agency through their Joint FAO/IAEA Programme of
Nuclear Techniques in Food and Agriculture. This work is part of IAEA Coordi-
nated Research Project D24012.
vii

ThiS is a FM Blank Page

Contents
1 Introduction . . . . . . . . . . . . . . . . . . . . . . . . . . . . . . . . . . . . . . . . . . . . 1
1.1 Background . . . . . . . . . . . . . . . . . . . . . . . . . . . . . . . . . . . . . . . . . 1
1.2 Methods Used to Isolate Genomic DNA from Plant Tissues . . . . . . 2
1.3 Methods for the Discovery and Characterization of Induced
and Natural Nucleotide Variation in Plant Genomes . . . . . . . . . . . . 3
References . . . . . . . . . . . . . . . . . . . . . . . . . . . . . . . . . . . . . . . . . . . . . . 3
2 Health and Safety Considerations . . . . . . . . . . . . . . . . . . . . . . . . . . . . 5
2.1 Guidelines . . . . . . . . . . . . . . . . . . . . . . . . . . . . . . . . . . . . . . . . . . 5
2.2 Preparation of a Home-Made Chemical Spill Kit . . . . . . . . . . . . . . 6
Reference . . . . . . . . . . . . . . . . . . . . . . . . . . . . . . . . . . . . . . . . . . . . . . . 7
3 Sample Collection and Storage . . . . . . . . . . . . . . . . . . . . . . . . . . . . . . 9
3.1 Background . . . . . . . . . . . . . . . . . . . . . . . . . . . . . . . . . . . . . . . . . 9
3.2 Materials . . . . . . . . . . . . . . . . . . . . . . . . . . . . . . . . . . . . . . . . . . . 10
3.3 Methods . . . . . . . . . . . . . . . . . . . . . . . . . . . . . . . . . . . . . . . . . . . . 10
References . . . . . . . . . . . . . . . . . . . . . . . . . . . . . . . . . . . . . . . . . . . . . . 11
4 Low-Cost DNA Extraction . . . . . . . . . . . . . . . . . . . . . . . . . . . . . . . . . 13
4.1 Materials . . . . . . . . . . . . . . . . . . . . . . . . . . . . . . . . . . . . . . . . . . . 13
4.2 Methods . . . . . . . . . . . . . . . . . . . . . . . . . . . . . . . . . . . . . . . . . . . . 13
4.2.1 Preparation of Silica Powder DNA Binding Solution . . . . . . 13
4.2.2 Low-Cost Extraction of Genomic DNA . . . . . . . . . . . . . . . 14
4.3 Alternative Buffers for DNA Extraction . . . . . . . . . . . . . . . . . . . . 17
Reference . . . . . . . . . . . . . . . . . . . . . . . . . . . . . . . . . . . . . . . . . . . . . . . 17
5 PCR Amplification for Low-Cost Mutation Discovery . . . . . . . . . . . . 19
5.1 Materials . . . . . . . . . . . . . . . . . . . . . . . . . . . . . . . . . . . . . . . . . . . 19
5.2 Methods . . . . . . . . . . . . . . . . . . . . . . . . . . . . . . . . . . . . . . . . . . . . 20
References . . . . . . . . . . . . . . . . . . . . . . . . . . . . . . . . . . . . . . . . . . . . . . 20
ix

6 Enzymatic Mismatch Cleavage and Agarose Gel Evaluation
of Samples . . . . . . . . . . . . . . . . . . . . . . . . . . . . . . . . . . . . . . . . . . . . . 21
6.1 Materials . . . . . . . . . . . . . . . . . . . . . . . . . . . . . . . . . . . . . . . . . . . 21
6.2 Methods . . . . . . . . . . . . . . . . . . . . . . . . . . . . . . . . . . . . . . . . . . . . 21
Reference . . . . . . . . . . . . . . . . . . . . . . . . . . . . . . . . . . . . . . . . . . . . . . . 22
7 Alternative Enzymology for Mismatch Cleavage for TILLING and
Ecotilling: Extraction of Enzymes from Common Weedy Plants . . . . 23
7.1 Materials . . . . . . . . . . . . . . . . . . . . . . . . . . . . . . . . . . . . . . . . . . . 23
7.2 Methods . . . . . . . . . . . . . . . . . . . . . . . . . . . . . . . . . . . . . . . . . . . . 23
7.2.1 Enzyme Extraction . . . . . . . . . . . . . . . . . . . . . . . . . . . . . . 23
7.2.2 Concentration of Enzymes Using Amicon Ultra 10 kDa
MWCO Centrifugal Filter Devices (for 0.5 ml Starting
Volume; in 1.5-ml Tubes) . . . . . . . . . . . . . . . . . . . . . . . . . 25
7.2.3 Test of Mismatch Cleavage Activity . . . . . . . . . . . . . . . . . . 26
Reference . . . . . . . . . . . . . . . . . . . . . . . . . . . . . . . . . . . . . . . . . . . . . . . 26
8 Example Data . . . . . . . . . . . . . . . . . . . . . . . . . . . . . . . . . . . . . . . . . . . 27
8.1 Quality of Genomic DNA Obtained by Silica Powder-Based
DNA Extraction Method . . . . . . . . . . . . . . . . . . . . . . . . . . . . . . . . 27
8.2 Quality of Genomic DNA Obtained by Silica Powder-Based
DNA Extraction Method Using Alternative Buffers . . . . . . . . . . . . 28
8.2.1 Summary . . . . . . . . . . . . . . . . . . . . . . . . . . . . . . . . . . . . . 30
8.3 Example of PCR Products Using TILLING Primers with
Source Genomic DNA from a Commercial Kit and Low-Cost
Silica Method . . . . . . . . . . . . . . . . . . . . . . . . . . . . . . . . . . . . . . . . 30
8.4 Example of Low-Cost Agarose Gel-Based TILLING Assays
for the Discovery of Induced Point Mutations . . . . . . . . . . . . . . . . 31
8.5 Example of Enzyme Activity Recovered from Weeds Compared
to Crude Celery Juice Extract . . . . . . . . . . . . . . . . . . . . . . . . . . . . 31
8.5.1 Summary . . . . . . . . . . . . . . . . . . . . . . . . . . . . . . . . . . . . . 31
References . . . . . . . . . . . . . . . . . . . . . . . . . . . . . . . . . . . . . . . . . . . . . . 33
9 Conclusions . . . . . . . . . . . . . . . . . . . . . . . . . . . . . . . . . . . . . . . . . . . . . 35
x Contents

Chapter 1
Introduction
Abstract A range of molecular methods can be employed for the characterization
of natural and induced nucleotide variation in plants. These facilitate a better
understanding of gene function and allow a reduction in the time needed to breed
new mutant varieties. Molecular biology, however, can be difficult to master, and
while efficient, many protocols rely on expensive pre-made kits. The FAO/IAEA
Plant Breeding and Genetics Laboratory (PBGL) has developed a series of low-cost
and easy to use approaches for the molecular characterization of mutant plant
materials. The protocols are designed specifically to avoid complicated procedures,
expensive equipment, and the use of hazardous chemicals. Furthermore, these
protocols have been validated by research fellows from many developing countries.
1.1 Background
The extraction of high quality and quantity genomic DNA from tissues is at the
heart of many molecular assays. Indeed, with the routine use of molecular markers
and more recently the application of next generation sequencing approaches to
characterize plant variation, the recovery of DNA can be considered a fundamental
objective of the plant scientist, and is often a bottleneck in genotyping. The basic
steps of DNA extraction are: (1) proper collection and storage of plant tissues, (2)
lysis of plant cells, (3) solubilization of lipids and proteins with detergents, (4)
separation of DNA from other molecules, (5) purification of the separated DNA,
and (6) suspension in an appropriate buffer. Isolation of DNA dates to the late 1800s
with the work of Friedrich Miescher and colleagues who first discovered the
presence of DNA in cells long before it was established that DNA was the genetic
material (Dahm 2005).
© International Atomic Energy Agency 2015
B.J. Till et al., Low-Cost Methods for Molecular Characterization of Mutant Plants,DOI 10.1007/978-3-319-16259-1_1
1
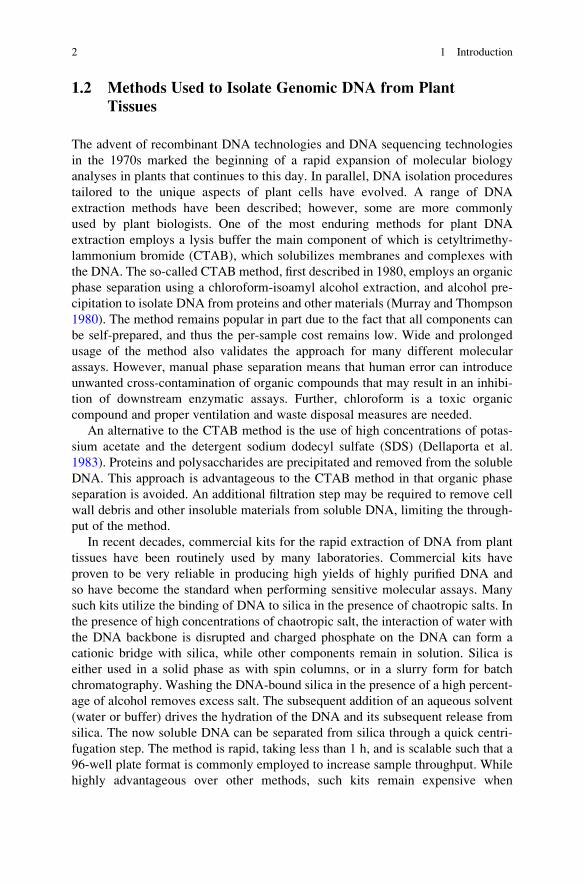
1.2 Methods Used to Isolate Genomic DNA from Plant
Tissues
The advent of recombinant DNA technologies and DNA sequencing technologies
in the 1970s marked the beginning of a rapid expansion of molecular biology
analyses in plants that continues to this day. In parallel, DNA isolation procedures
tailored to the unique aspects of plant cells have evolved. A range of DNA
extraction methods have been described; however, some are more commonly
used by plant biologists. One of the most enduring methods for plant DNA
extraction employs a lysis buffer the main component of which is cetyltrimethy-
lammonium bromide (CTAB), which solubilizes membranes and complexes with
the DNA. The so-called CTAB method, first described in 1980, employs an organic
phase separation using a chloroform-isoamyl alcohol extraction, and alcohol pre-
cipitation to isolate DNA from proteins and other materials (Murray and Thompson
1980). The method remains popular in part due to the fact that all components can
be self-prepared, and thus the per-sample cost remains low. Wide and prolonged
usage of the method also validates the approach for many different molecular
assays. However, manual phase separation means that human error can introduce
unwanted cross-contamination of organic compounds that may result in an inhibi-
tion of downstream enzymatic assays. Further, chloroform is a toxic organic
compound and proper ventilation and waste disposal measures are needed.
An alternative to the CTAB method is the use of high concentrations of potas-
sium acetate and the detergent sodium dodecyl sulfate (SDS) (Dellaporta et al.
1983). Proteins and polysaccharides are precipitated and removed from the soluble
DNA. This approach is advantageous to the CTAB method in that organic phase
separation is avoided. An additional filtration step may be required to remove cell
wall debris and other insoluble materials from soluble DNA, limiting the through-
put of the method.
In recent decades, commercial kits for the rapid extraction of DNA from plant
tissues have been routinely used by many laboratories. Commercial kits have
proven to be very reliable in producing high yields of highly purified DNA and
so have become the standard when performing sensitive molecular assays. Many
such kits utilize the binding of DNA to silica in the presence of chaotropic salts. In
the presence of high concentrations of chaotropic salt, the interaction of water with
the DNA backbone is disrupted and charged phosphate on the DNA can form a
cationic bridge with silica, while other components remain in solution. Silica is
either used in a solid phase as with spin columns, or in a slurry form for batch
chromatography. Washing the DNA-bound silica in the presence of a high percent-
age of alcohol removes excess salt. The subsequent addition of an aqueous solvent
(water or buffer) drives the hydration of the DNA and its subsequent release from
silica. The now soluble DNA can be separated from silica through a quick centri-
fugation step. The method is rapid, taking less than 1 h, and is scalable such that a
96-well plate format is commonly employed to increase sample throughput. While
highly advantageous over other methods, such kits remain expensive when
2 1 Introduction

compared to home-made ones such as the CTAB and Dellaporta protocols. There-
fore, the methods described here were developed to provide the ease and quality of
silica-based DNA extraction at a fraction of the cost while using basic laboratory
equipment.
1.3 Methods for the Discovery and Characterization
of Induced and Natural Nucleotide Variation in Plant
Genomes
Nucleotide variation is the major source of the phenotypic diversity that is exploited
by plant breeders. Variation can be either natural or induced. In the late 1990s, a
reverse-genetic strategy was developed whereby induced mutations were used in
combination with novel methods for the discovery of nucleotide variation
(McCallum et al. 2000). Known as Targeting Induced Local Lesions IN Genomes
(TILLING), this approach allows for the recovery of multiple new alleles in any
gene in the genome, provided the correct balance of population size and mutation
density can be achieved (Colbert et al. 2001; Till et al. 2003). Efficient techniques
for the discovery of Single Nucleotide Polymorphisms (SNP) and small insertion/
deletions (indels) were developed utilizing single-strand-specific nucleases that can
be easily prepared through extractions of plants such as celery, or mung beans (Till
et al. 2004). TILLING has been applied to over 20 plant and animal species, and
similar approaches have been used to characterize naturally occurring nucleotide
variation, known as Ecotilling (Comai et al. 2004; Jankowicz-Cieslak et al. 2011).
While TILLING and Ecotilling have been primarily used in seed crops, the methods
work well in vegetatively (clonally) propagated and polyploid species such as
banana and cassava (Jankowicz-Cieslak et al. 2012; Till et al. 2010). The PBGL
has developed low-cost methods for the extraction of enzymes from a variety of
plant materials, including easily obtainable weedy plants. The laboratory has also
adapted low-cost agarose gel-based TILLING and Ecotilling assays.
Open Access This chapter is distributed under the terms of the Creative Commons Attribution
Noncommercial License, which permits any noncommercial use, distribution, and reproduction in
any medium, provided the original author(s) and source are credited.
References
Colbert T, Till BJ, Tompa R, Reynolds S, Steine MN et al (2001) High-throughput screening for
induced point mutations. Plant Physiol 126:480–484
Comai L, Young K, Till BJ, Reynolds SH, Greene EA et al (2004) Efficient discovery of DNA
polymorphisms in natural populations by Ecotilling. Plant J 37:778–786
Dahm R (2005) Friedrich Miescher and the discovery of DNA. Dev Biol 278:274–288
References 3

Dellaporta SL, Wood J, Hicks JB (1983) A plant DNA minipreparation: version II. Plant Mol Biol
Rep 1:19–21
Jankowicz-Cieslak J, Huynh OA, Bado S, Matijevic M, Till BJ (2011) Reverse-genetics by
TILLING expands through the plant kingdom. Emir J Food Agric 23:290–300
Jankowicz-Cieslak J, Huynh OA, Brozynska M, Nakitandwe J, Till BJ (2012) Induction, rapid
fixation and retention of mutations in vegetatively propagated banana. Plant Biotechnol J
10:1056–1066
Mccallum CM, Comai L, Greene EA, Henikoff S (2000) Targeted screening for induced muta-
tions. Nat Biotechnol 18:455–457
Murray MG, Thompson WF (1980) Rapid isolation of high molecular weight plant DNA. Nucleic
Acids Res 8:4321–4325
Till BJ, Reynolds SH, Greene EA, Codomo CA, Enns LC et al (2003) Large-scale discovery of
induced point mutations with high-throughput TILLING. Genome Res 13:524–530
Till BJ, Burtner C, Comai L, Henikoff S (2004) Mismatch cleavage by single-strand specific
nucleases. Nucleic Acids Res 32:2632–2641
Till BJ, Jankowicz-Cieslak J, Sagi L, Huynh OA, Utsushi H et al (2010) Discovery of nucleotide
polymorphisms in the Musa gene pool by Ecotilling. Theor Appl Genet 121:1381–1389
4 1 Introduction

Chapter 2
Health and Safety Considerations
Abstract All laboratories should have standardized health and safety rules and
practices. These can vary from region to region due to differences in legislation.
Before beginning new experiments, please consult your local safety guidelines.
Failure to follow these rules could result in accidents, fines, or a closure of the
laboratory. Consider the following guidelines in this chapter applicable to all
laboratories.
More information on general laboratory practices is available (Barker 2005).
2.1 Guidelines
1. Always wear a laboratory coat in the laboratory. Remove the coat when exiting
the lab to avoid contaminating people with the things you are protecting yourself
from.
2. Wear eye protection (special safety goggles) when working with chemicals or
anything that you don’t want entering your eye.
3. Wear gloves to protect your hands from dangerous materials, and to protect your
samples from contamination. Standard laboratory gloves made of latex or nitrile
are suitable for the methods described. Powder-free gloves are advised when
using equipment with precision optics. Do not touch common items like the
telephone, door handles, or light switches with gloves as the next person
touching those items may not be protected from hand contamination. The
same rule applies to mobile phones. Remove gloves before leaving the
laboratory.
4. Wear proper foot protection, and avoid open toe footwear and high heels.
5. Wear clothing that covers your legs. Avoid loose fitting clothing that can be
caught in machinery or be passed over an open flame.
6. Familiarize yourself with emergency procedures. Know where the nearest eye-
wash station and shower are located. Know where the nearest first aid kit is
located, and locate the list of emergency telephone numbers.
7. Consult the Materials Safety Data Sheet (MSDS) for the chemicals you will be
using. These sheets should come with the chemicals. They provide information
© International Atomic Energy Agency 2015
B.J. Till et al., Low-Cost Methods for Molecular Characterization of Mutant Plants,DOI 10.1007/978-3-319-16259-1_2
5

on health risks, first aid measures, fire and explosion data, how to deal with
accidental release (spills), handling and storage, and guidelines for personal
protection. If you don’t have the MSDS, you can find them by doing a web
search of the item with MSDS in the title. Note that it is a best practice to review
the MSDS supplied by the manufacturer of the chemical you have in your own
laboratory. Similar chemical names or other formulations may result in mislead-
ing web search results.
8. Locate the emergency spill kit to handle accidental spillage of hazardous
materials. If your laboratory is not equipped, consider preparing one (see Sect.
2.2).
9. Don’t rush. If you are unfamiliar with a piece of equipment, or concerned about
the safety of a procedure, stop! Make sure you know what you are doing and the
risks associated with the procedures before you begin. Many laboratories use a
written standard operating procedure (SOP) that is followed during the initial
performance of a protocol or procedure and made available for future reference.
Check with the procedures of your laboratory and consider employing an SOP
approach.
2.2 Preparation of a Home-Made Chemical Spill Kit
All laboratories should contain a kit for chemical spills. While spill kits are
commercially available, self-prepared ones can be made at a fraction of the cost.
Key materials and their use are found in Table 2.1. The kit should be designed to
handle a spill from the largest volume of chemical you have in the laboratory. For
Table 2.1 Components of a chemical spill kit and their usesa
Component Use
Five gallon plastic or rubber bucket with lid
clearly labelled “Chemical Spill Kit” with
emergency telephone numbers printed clearly
on the lid and the side of the bucket
This bucket contains all the materials of the
spill kit, and should be located near the labo-
ratory doorway to allow someone to access it
after they have left the spill area
Goggles For eye protection while cleaning spill
Chemical-resistant gloves For hand protection when dealing with spills
Absorbent materials (cat litter, vermiculite,
activated charcoal, or sawdust)
This material is placed on the liquid spills to
contain the liquid for easy removal
Small broom and plastic dustpan For removal of dry spills, and absorbed mate-
rials. It is important that the dustpan or scoop
be plastic as metal materials can spark and
cause fire/explosions
Sturdy plastic bags To contain materials
Baking soda (sodium bicarbonate), in a plastic
bag marked “for liquid acid spills”
For neutralization of small acid spills
Acetic acid powder in a plastic bag marked “for
liquid base spills”
For neutralization of small base spills
aNote that material collected after a spill should not go into the normal waste but be disposed of in
the appropriate manner according to the local guidelines for hazardous waste
6 2 Health and Safety Considerations

detailed guidelines please refer to the “Guide for Chemical Spill Response Planning
in Laboratories” prepared by the American Chemical Society (http://www.acs.org/
content/acs/en/about/governance/committees/chemicalsafety/publications/guide-
for-chemical-spill-response.html).
Open Access This chapter is distributed under the terms of the Creative Commons Attribution
Noncommercial License, which permits any noncommercial use, distribution, and reproduction in
any medium, provided the original author(s) and source are credited.
Reference
Barker K (2005) At the bench: a laboratory navigator. Cold Spring Harbor Press, New York, NY
Reference 7
Chapter 3
Sample Collection and Storage
Abstract Of importance to the successful extraction of genomic DNA from plant
tissues is the collection of the suitable material and proper storage of the tissues
before DNA isolation. If the samples are not properly treated, DNA can be degraded
prior to isolation. The rate of sample degradation can vary dramatically from
species to species depending on the method of sample collection. Mechanisms of
genomic DNA degradation include exposure to endogenous nucleases due to
organellar and cellular lysis. To prevent this from occurring, leaf or root tissues
are commonly flash frozen in liquid nitrogen and then stored at �80 �C. At thesetemperatures, nucleases remain inactive and DNA is stable. Thawing of tissue in
some species can lead to rapid degradation. Therefore, during the extraction
procedure, it may be necessary to grind the tissue to a fine powder in the presence
of liquid nitrogen and expose frozen tissue immediately to a lysis buffer containing
EDTA, which inhibits nuclease activity. This chapter provides an alternative
method for sample collection and storage. Silica gel is used to desiccate tissues at
room temperature. This avoids the use of liquid nitrogen and storage at �80 �C.
3.1 Background
While collection of tissues in liquid nitrogen and �80 �C storage may be highly
suitable for most plant species, it can be impractical in some developing countries
owing to the expense and difficulty in procuring liquid nitrogen. The provision of
continuous power supplies for ultralow (�80 �C) freezers may also be difficult and
costly. Lyophilization, or freeze drying, is an alternative approach that results in
tissue samples that can be stored at room temperature for many months prior to the
isolation of DNA. This has been used to produce high quality genomic DNA
suitable for high throughput TILLING assays (Till et al. 2004). Lyophilization
circumvents the need for continual�80 �C storage, but commercial lyophilizers are
also expensive. An alternative method is described in this chapter. Tissue is
collected and stored in silica gel (Chase and Hills 1991; Liston et al. 1990). This
removes water from tissues, and in many cases the dried material is stable at room
temperature for weeks to months before the isolation of DNA. The exact length of
© International Atomic Energy Agency 2015
B.J. Till et al., Low-Cost Methods for Molecular Characterization of Mutant Plants,DOI 10.1007/978-3-319-16259-1_3
9

time that dried tissue can be stored and still yield suitable quantities and quality of
genomic DNA should be determined empirically. Other factors such as stress-
induced accumulation of phenolic compounds may also limit the utility and shelf-
life of the material. This is likely to vary between species and genotypes
(Savolainen et al. 1995).
3.2 Materials
Materials needed for the desiccation of plant tissues at room temperature are listed
in Table 3.1.
3.3 Methods
1. Label envelopes for tissue storage. Tissue desiccation works best when it is
stored in porous materials. Paper envelopes, tea bags, or kimwipes work well.
2. The material should be cut to roughly the same length as the collection envelope
to facilitate desiccation (Fig. 3.1, left panel).
3. Immediately upon collection, place the envelopes containing the leaf material
into a container containing silica gel. Seal the container with Parafilm to limit the
effects of atmospheric humidity. The ratio of silica gel to tissue should be no less
than 10:1 by weight (Weising et al. 2005). Orange silica gel has a moisture
indicator. When fully dehydrated and ready for use, it is orange; when fully
hydrated, the silica gel turns white (Fig. 3.1, right panel). The silica gel can be
dehydrated by heating at a high temperature (over 80 �C) until the color returnsto orange and may be re-used many times.
4. Incubate the material with silica gel for at least 48 h at room temperature (RT).
The tissue is suitable for DNA extraction when brittle. Incubate for additional
time if necessary. The tissue can be stored for long periods (>1 month) in silica
gel at RT. It is suggested that you perform the tests in your own laboratory to
determine the maximal amount of time that tissue can be stored under these
conditions.
Table 3.1 Materials for collection, storage, and desiccation of plant tissues
Material description Examples of suppliers and catalogue numbers
Scissors Any supplier
Porous paper envelopes Any supplier
Silica gel with moisture indicator Sigma 13767
Container for storing tissue with silica gel Any supplier
Parafilm® for sealing container Sigma P7793
10 3 Sample Collection and Storage

Open Access This chapter is distributed under the terms of the Creative Commons Attribution
Noncommercial License, which permits any noncommercial use, distribution, and reproduction in
any medium, provided the original author(s) and source are credited.
References
Chase MW, Hills HH (1991) Silica gel: an ideal material for field preservation of leaf samples for
DNA studies. Taxon 40:215–220
Liston A, Rieseberg LH, Adams RP, Do N, Zhu G (1990) A method for collecting dried plant
specimens for DNA and isozyme analyses, and the results of a field experiment in Xinjiang,
China. Ann Missouri Bot Gard 77:859–863
Savolainen V, Cuenoud P, Spichiger R, Martinez MD, Crevecoeur M et al (1995) The use of
herbarium specimens in DNA phylogenetics: evaluation and improvement. Plant Syst Evol
197:87–98
Till BJ, Reynolds SH, Weil C, Springer N, Burtner C et al (2004) Discovery of induced point
mutations in maize genes by TILLING. BMC Plant Biol 4:12
Weising K, Nybom H, Wolff K, Kahl G (2005) DNA fingerprinting in plants: principles, methods
and applications. CRC Press, Boca Raton, FL
Fig 3.1 Leaf tissue is collected and placed in an envelope (left panel). The length of the tissue
should equal the length of the envelope. Silica gel with color indicator turns white when fully
hydrated (right panel). Only gel with an orange color should be used
References 11

Chapter 4
Low-Cost DNA Extraction
Abstract The methods described in this chapter were developed to avoid toxic
organic phase separation utilized in many low-cost DNA extraction protocols such
as the CTAB method. The steps involve: (1) lysis of the plant material, (2) binding
of DNA to silica powder under chaotropic conditions, (3) washing the bound DNA,
and (4) elution of DNA from the silica powder. This method has been tested in
several plant species and the applicability of such DNA preparations for molecular
marker studies in barley is shown in Chap. 8.
4.1 Materials
Chemicals, enzymes, and equipment are listed in Table 4.1, and working stocks in
Table 4.2.
4.2 Methods
4.2.1 Preparation of Silica Powder DNA Binding Solution
1. Transfer silica powder (Celite 545 silica) into a 50-ml conical tube (fill to the
2.5 ml line¼ approximately 800 mg).
2. Add 30 ml dH2O.
3. Shake vigorously (vortex and invert 15 times or until a hydrated slurry forms).
4. Let the slurry settle for approximately 15 min.
5. Remove (pipette off) the liquid.
6. Repeat steps 2–5 an additional two times for a total of three washes. After the
last washing step suspend the hydrated silica in a volume of water equal to the
volume of silica (typically up to the 5-ml mark on the conical tube). This is the
liquid silica stock (LSS) and can be stored at RT for up to 1 month.
7. Prior to use, suspend LSS by vortexing for 30 s or until a homogenized slurry is
formed. Transfer 50 μl into 2-ml tubes. Prepare one tube per tissue sample.
© International Atomic Energy Agency 2015
B.J. Till et al., Low-Cost Methods for Molecular Characterization of Mutant Plants,DOI 10.1007/978-3-319-16259-1_4
13

ATTENTION: try to keep the silica suspended when transferring to tubes to
ensure that all tubes receive the same amount of LSS.
8. Add 1 ml H2O per tube to perform a final wash step.
9. Mix by vortexing for 15 s or until silica is fully suspended.
10. Centrifuge at full speed (16,000�g) for 20 s.
11. Pipette off the liquid.
12. Add 700 μl DNA binding buffer (6 M potassium iodide or alternatively 6 M
guanidine thiocyanate).
13. Suspend the silica in DNA binding buffer by vortexing for 15 s.
14. The Silica Binding Solution (SBS) is now ready for use.
4.2.2 Low-Cost Extraction of Genomic DNA
1. Prepare an ice bath.
2. Label 2-ml tubes containing three metal tungsten carbide beads with sample
names.
3. Add the dried tissue to the appropriate tube.
4. Tape the tubes onto a vortex mixer (Fig. 4.1) and vortex on high setting for 30 s
or until the material is ground to a fine powder. NOTE: If the tissue is not fully
ground, grinding is facilitated by addition of 0.2 g of purified sea sand per tube.
It is common for some tissues to not be completely ground to a powder. High
Table 4.1 Chemicals, enzymes and equipment for low-cost DNA extraction
Material description Examples of suppliers and catalogue numbers
Celite 545 silica powder (Celite 545-AW
reagent grade)
Sigma 20199-U
SDS (sodium dodecyl sulfate) Sigma L-4390
50-ml conical tube with cap Fisher Scientific 14-432-22
Sodium acetate anhydrous Sigma S-2889
NaCl (sodium chloride) Sigma S-3014
RNase A Sigma R6513
Ethanol (absolute) Fisher Scientific BP2818-4
H2O (distilled or deionized and autoclaved)
Potassium iodide Sigma P2963
Guanidine thiocyanate (optional) Sigma G9277
Microcentrifuge tubes (1.5 and 2.0 ml) Any general laboratory supplier
Micropipettes (1,000, 200, and 20 μl) Any general laboratory supplier
Microcentrifuge Eppendorf Centrifuge 5415D
Vortex mixer Vortex Genie 2, Fisher Scientific NC9864336
Metal beads (tungsten carbide beads, 3 mm) Qiagen 69997
Sea sand (optional) Sigma 274739
Agarose gel equipment Horizontal electrophoresis from any general lab-
oratory supplier
14 4 Low-Cost DNA Extraction

quality DNA can still be produced from such samples. Sample degradation can
occur after prolonged vortexing. It is therefore suggested to test different
grinding times to find proper conditions to maximize both genomic DNA
yield and quality.
5. Add 800 μl of Lysis Buffer and 4 μl RNAse A (10 μg/ml) to each tube. NOTE:
See Sect. 4.3 for alternative buffers.
Table 4.2 Working stocks for DNA extraction
Stock solution Recipe Comments
5 M NaCl MW¼ 58.44 g/mol
29.22 g/100 ml
Do not use if precipitate forms. Either heat to get
fully back into solution or discard and make fresh
3 M Sodium
Acetate
(pH 5.2)
MW¼ 82.03 g/mol
24.61 g/100 ml
Adjust pH value with glacial acetic acid
95 % (v/v)
Ethanol
95 ml ethanol abs
5 ml H2O
Use fresh. Ethanol absorbs water and the %will drop
over time
Tris-EDTA
(TE) buffer
(10�)
100 mM Tris-HCl,
pH 8.0
10 mM EDTA
Tris and EDTA can be prepared from powders. This
may be less costly. However, note that the pH of Tris
changes with temperature
Lysis buffer 0.5 % SDS (w/v) in
10� TE
0.5 g SDS/100 ml
DNA binding
buffer
6 M Potassium Iodide
(KI)
Alternative: 6 M
Guanidine
thiocyanate
ATTENTION! It takes several hours until fully
dissolved (leave it for approximately 4–5 h)
Wash buffer 1 ml of 5 M NaCl
99 ml of 95 % EtOH
ATTENTION! Prepare fresh because the salt pre-
cipitates during storage
DNA elution
buffer
1x TE-buffer Tris-EDTA buffer is advised for most applications.
If the presence of EDTA is inhibitory to downstream
applications, elution can be carried out using 10 mM
Tris
Fig. 4.1 Sample grinding is accomplished by combining desiccated leaf material and metal beads
into a 2-ml tube (left panel) and taping sample tubes to a standard vortex mixer (middle panel).Grinding is complete when a find powder is produced. The presence of unground tissue with the
powder does not affect the quality of extracted DNA (right panel, and example data in Chap. 8)
4.2 Methods 15

6. Vortex at a high speed for approximately 2 min until the powder is fully
hydrated and mixed with buffer.
7. Incubate for 10 min at RT.
8. Add 200 μl 3 M sodium acetate (pH 5.2). Mix by the inversion of tubes and
incubate on ice for 5 min.
9. Centrifuge at 16,000�g for 5 min at RT to pellet the leaf material.
10. Label the tubes with aliquots of silica binding solution (SBS, 700 μl) with the
sample name.
11. Transfer the liquid into appropriately labelled SBS-containing tubes. DO NOT
TRANSFER THE LEAF MATERIAL!
12. Completely suspend the silica powder by vortexing and inverting the tubes
(approximately 20 s).
13. Incubate for 15 min at RT (on a shaker at 400 rpm, or invert tubes every 3 min
by hand).
14. Centrifuge at 16,000�g for 3 min at RT to pellet the silica.
15. Remove the supernatant with a pipette and discard (the DNA is bound to the
silica at this stage).
16. Add 500 μl of freshly prepared wash buffer to each tube.
17. Completely suspend the silica powder by vortexing or inverting the tubes
(approximately 20 s).
18. Centrifuge at 16,000�g for 3 min at RT to pellet the silica. Remove the
supernatant and keep the pellet.
19. Repeat steps 16–18.
20. Centrifuge the pellet for 30 s and remove any residual wash buffer with a
pipette.
21. Open the lid on tubes containing silica pellet and place in a fume hood for 30
min to fully dry the pellets (NOTE: This can be done for a longer period on the
bench top if a fume hood is not available).
22. Add 200 μl TE buffer to each tube to elute the DNA. The DNA is now in the
liquid buffer. A buffered solution is preferred over water to prevent degradation.
23. Completely suspend the silica powder by vortexing and inversion of tubes
(approximately 20 s).
24. Incubate at RT for 5 min.
25. Centrifuge at 16,000�g for 5 min at RT to pellet the silica.
26. Label new 1.5-ml tubes with sample numbers/codes.
27. Collect the liquid containing genomic DNA and place into new tubes.
28. Store DNA temporarily at 4 �C before checking the quality and quantity.
29. Evaluate the quality and quantity of the extracted DNA.While fluorometric and
spectrophotometric methods have their advantages, it is suggested that samples
are evaluated using agarose gel electrophoresis and a quantitative marker so
that sample degradation and the presence of any RNA can be monitored. See
Chap. 8 for example data.
16 4 Low-Cost DNA Extraction

4.3 Alternative Buffers for DNA Extraction
The main areas for the optimization of DNA-extraction methods include increasing
sample yield, reducing co-purification of unwanted components (e.g., polysaccha-
rides, and polyphenols), and reducing sample degradation. To a large extent,
providing the starting tissues are of good quality, all three areas can be influenced
by the sample lysis procedure. Table 4.3 lists four lysis buffers to optimize the
isolation of DNA from grapevine and sorghum. A more thorough compilation of
buffer components and additives to enhance DNA isolation in the presence of
secondary compounds can be found in Weising et al. (2005). Data from buffer
optimizations are shown in Chap. 8.
Open Access This chapter is distributed under the terms of the Creative Commons Attribution
Noncommercial License, which permits any noncommercial use, distribution, and reproduction in
any medium, provided the original author(s) and source are credited.
Reference
Weising K, Nybom H, Wolff K, Kahl G (2005) DNA fingerprinting in plants: principles, methods
and applications. CRC Press, Boca Raton, FL
Table 4.3 Alternative lysis buffers for DNA extraction
Lysis buffer
(LB) name Recipe (in 10� TE)
Preparation in final volume of 100 ml in
10� TE
LB1 0.5 % SDS (w/v) 0.5 g SDS
LB2 0.5 % SDS (w/v) 0.5 g SDS
0.5 M NaCl 10 ml of 5 M NaCl
3 % PVP (w/v) 3 g
LB3 0.5 % SDS (w/v) 0.5 g SDS
0.5 M NaCl 10 ml of 5 M NaCl
3 % PVP (w/v) 3 g
1 % sodium sulfite 1 g
LB4 0.5 % SDS (w/v) 0.5 g SDS
0.5 M NaCl 10 ml of 5 M NaCl
3 % PVP (w/v) 3 g
1 % sodium sulfite 1 g
2 % N-lauryl-sarcosyl
sodium salt
2 g
Reference 17
Chapter 5
PCR Amplification for Low-Cost MutationDiscovery
Abstract PCR is used to amplify regions to be interrogated for the presence of
mutations (SNP and small indel polymorphisms). While PCR is a common practice
and many protocols exist, reaction conditions are provided here that are optimized
for TILLING and Ecotilling assays utilizing native agarose gel electrophoresis.
5.1 Materials
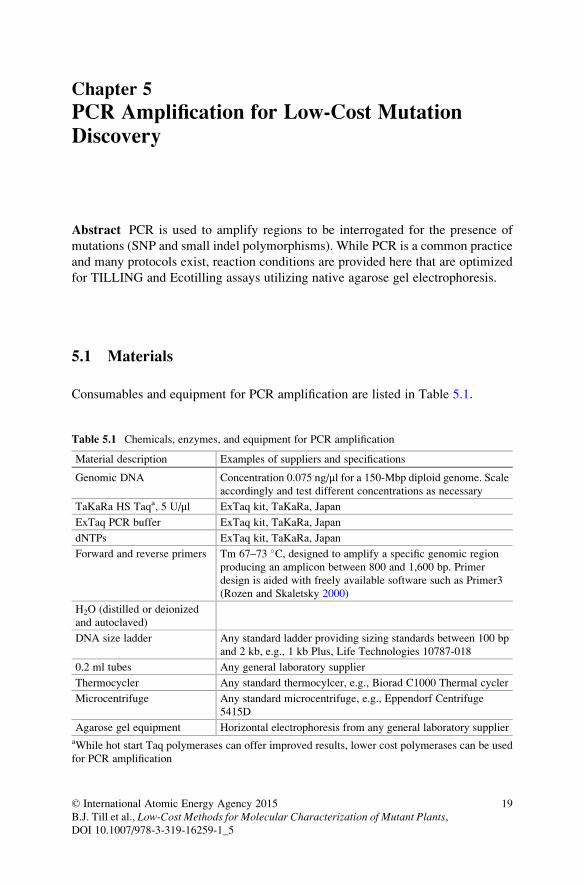
Consumables and equipment for PCR amplification are listed in Table 5.1.
Table 5.1 Chemicals, enzymes, and equipment for PCR amplification
Material description Examples of suppliers and specifications
Genomic DNA Concentration 0.075 ng/μl for a 150-Mbp diploid genome. Scale
accordingly and test different concentrations as necessary
TaKaRa HS Taqa, 5 U/μl ExTaq kit, TaKaRa, Japan
ExTaq PCR buffer ExTaq kit, TaKaRa, Japan
dNTPs ExTaq kit, TaKaRa, Japan
Forward and reverse primers Tm 67–73 �C, designed to amplify a specific genomic region
producing an amplicon between 800 and 1,600 bp. Primer
design is aided with freely available software such as Primer3
(Rozen and Skaletsky 2000)
H2O (distilled or deionized
and autoclaved)
DNA size ladder Any standard ladder providing sizing standards between 100 bp
and 2 kb, e.g., 1 kb Plus, Life Technologies 10787-018
0.2 ml tubes Any general laboratory supplier
Thermocycler Any standard thermocylcer, e.g., Biorad C1000 Thermal cycler
Microcentrifuge Any standard microcentrifuge, e.g., Eppendorf Centrifuge
5415D
Agarose gel equipment Horizontal electrophoresis from any general laboratory supplieraWhile hot start Taq polymerases can offer improved results, lower cost polymerases can be used
for PCR amplification
© International Atomic Energy Agency 2015
B.J. Till et al., Low-Cost Methods for Molecular Characterization of Mutant Plants,DOI 10.1007/978-3-319-16259-1_5
19

5.2 Methods
1. Prepare a PCR master mix on ice by combining:
H2O 82.5 μl10� Ex Taq buffer 15 μl2.5 mM dNTP mix 12 μl10 μM L primer 1.5 μl10 μM R primer 1.5 μlTaKaRa HS taq (5 U/μl) 0.38 μl
2. Mix the PCR master mix by pipetting it up and down ten times followed by pulse
centrifugation.
3. Combine 7.5 μl DNA at the appropriate concentration with 22.5 μl of PCR
master mix. Mix by pipetting it up and down.
4. Incubate in a thermal cycler using the following parameters:
95 �C for 2 min; loop 1 for 8 cycles (94 �C for 20 s, 73 �C for 30 s, reduce
temperature 1 �C per cycle, ramp to 72 �C at 0.5 �C/s, 72 �C for 1 min); loop
2 for 45 cycles (94 �C for 20 s, 65 �C for 30 s, ramp to 72 �C at 0.5 �C/s, 72 �C for
1 min); 72 �C for 5 min; 99 �C for 10 min; loop 3 for 70 cycles (70 �C for 20 s,
reduce temperature 0.3 �C per cycle); hold at 8 �C.5. OPTIONAL: Check the yield of the PCR product by agarose gel electrophoresis.
See Chap. 8 for example data. For the efficient discovery of nucleotide poly-
morphisms, PCR product yield should be approximately 10 ng/μl or higher inconcentration. PCR product should be a single band. Co-amplification of mul-
tiple sequences can result in high error rates (Cooper et al. 2008).
Open Access This chapter is distributed under the terms of the Creative Commons Attribution
Noncommercial License, which permits any noncommercial use, distribution, and reproduction in
any medium, provided the original author(s) and source are credited.
References
Cooper JL, Till BJ, Laport RG, Darlow MC, Kleaffner JM et al (2008) TILLING to detect induced
mutations in soybean. BMC Plant Biol 8:9
Rozen S, Skaletsky H (2000) Primer3 on the WWW for general users and for biologist pro-
grammers. In: Krawetz S, Misener S (eds) Methods in molecular biology. Humana Press,
Totowa, NJ, pp 365–386
20 5 PCR Amplification for Low-Cost Mutation Discovery

Chapter 6
Enzymatic Mismatch Cleavage and Agarose
Gel Evaluation of Samples
Abstract Denaturation and annealing of PCR products allows DNA strands with
small sequence differences to hybridize together. The result is heteroduplexed
molecules that are single stranded in polymorphic sequence locations, but double
stranded elsewhere. These molecules are the substrates for cleavage by single-
strand-specific nucleases such as CEL I, crude Celery Juice Extract (CJE)
containing CEL I, and other plant extracts containing single-strand-specific nucle-
ases [Till et al. (Nucleic Acids Res, 32:2632–2641, 2004)]. Enzymatic cleavage
initiates on a single strand and can result in double strand breaks. The products of
cleavage can therefore be observed using native gel electrophoresis.
6.1 Materials
Consumables and equipment for enzymatic mismatch cleavage are listed in
Table 6.1.
6.2 Methods
1. Prepare the following enzyme master mix on ice (calculated for five samples):
81.5 μl water15 μl 10� CEL I buffer
3.5 μl CJE nuclease
2. Label four new PCR tubes with the sample name.
3. Combine 20 μl of PCR product with 20 μl of enzyme master mix. Pipette the
mixture up and down to mix or vortex briefly followed by pulse centrifugation.
4. Incubate at 45 �C for 15 min in a thermal cycler.
5. Place the reactions on ice, stop the reaction by adding 10 μl of 0.25 M EDTA per
sample, and mix well by vortexing and centrifuge briefly (NOTE: Samples can
be stored frozen for months before analysis).
© International Atomic Energy Agency 2015
B.J. Till et al., Low-Cost Methods for Molecular Characterization of Mutant Plants,DOI 10.1007/978-3-319-16259-1_6
21

6. Analyze the samples by electrophoresis using a 1.5 % agarose gel. See Chap. 8
for example data.
Open Access This chapter is distributed under the terms of the Creative Commons Attribution
Noncommercial License, which permits any noncommercial use, distribution, and reproduction in
any medium, provided the original author(s) and source are credited.
Reference
Till BJ, Burtner C, Comai L, Henikoff S (2004) Mismatch cleavage by single-strand specific
nucleases. Nucleic Acids Res 32:2632–2641
Table 6.1 Chemicals, enzymes, and equipment for enzymatic mismatch cleavage
Material description Examples of suppliers and specifications
10� CELI buffer 5 ml 1 M MgSO4, 100 μl 10 % Triton X-100, 5 ml 1 M Hepes
(pH 7.4), 5 μl 20 mg/ml bovine serum albumin, 2.5 ml 2 M KCl,
37.5 ml water
Crude Celery Juice
Extract (CJE)
See Till et al. (2004) for the preparation of enzyme and defining unit
activity. Chap. 7 provides a protocol for the preparation of single-
strand-specific nucleases from weedy plants
1 kb DNA ladder Any general laboratory supplier
0.25 M EDTA Prepared from ethylenediaminetetraacetic acid (EDTA) stock from
any general laboratory supplier
H2O Distilled or deionized and autoclaved
1.5 ml, 2.0 ml tubes Any general laboratory supplier
Thermocycler e.g., Biorad C1000 Thermal cycler
Microcentrifuge Eppendorf Centrifuge 5415D
Agarose gel equipment Horizontal electrophoresis from any general laboratory supplier
22 6 Enzymatic Mismatch Cleavage and Agarose Gel Evaluation of Samples

Chapter 7
Alternative Enzymology for Mismatch
Cleavage for TILLING and Ecotilling:
Extraction of Enzymes from CommonWeedy
Plants
Abstract A crude celery extract containing the single-strand-specific nuclease
CEL I, has been widely used in TILLING and Ecotilling projects around the
world. Yet, celery is hard to come by in some countries. Sequences homologous
to CEL I can be found in different plant species. Previous work showed that similar
mismatch cleavage activities could be found in crude extracts of mung bean (Till
BJ, Burtner C, Comai L, Henikoff S. Nucleic Acids Res 32:2632–2641, 2004). It is
likely that the same activity can be recovered in many different plant species.
Therefore, a protocol for the extraction of active enzyme was developed that uses
plants common across the world, namely weeds. Monocotyledenous and
dicotyledenous weedy plants from the grassland, field and waste grounds around
crop fields are suitable for this protocol. Due to lower recovery of enzymatic
activity compared to celery-based extractions, a centrifuge-based filter method is
applied to concentrate the enzyme extract.
7.1 Materials
Extraction of single-strand-specific nuclease from weedy material is performed
using standard laboratory equipment and consumables (Table 7.1). Concentration
of enzyme extracts is accomplished using specialized centrifugation filters
(Table 7.2), and testing of enzyme activity relies on standard materials for PCR
(Table 7.3).
7.2 Methods
7.2.1 Enzyme Extraction
1. Collect approximately 200 g of mixed monocot and dicot weedy plants. Wash
material 3� in water and then grind using a hand-held mixer and by adding
about 300 ml of water to facilitate tissue disruption.
© International Atomic Energy Agency 2015
B.J. Till et al., Low-Cost Methods for Molecular Characterization of Mutant Plants,DOI 10.1007/978-3-319-16259-1_7
23

2. Add 1 M Tris-HCl (pH 7.7) and 100 mM PMSF to a final concentration of
buffer A (0.1 M Tris-HCl and 100 μM PMSF) (NOTE: stocks and water should
be kept at 4 �C, perform subsequent steps at 4 �C).3. Centrifuge for 20 min at 2,600� g in Sorvall GSA rotor or equivalent to pellet
debris and transfer the supernatant to a clean beaker.
4. Bring the supernatant to 25 % ammonium sulfate (add 144 g/l of solution). Mix
gently at 4 �C (cold room) for 30 min.
Table 7.1 Chemicals, enzymes, and equipment for extraction of enzymes from common weedy
plants
Material description Comment
Hand-held mixer (or juicer) From any supplier
STOCK: 100 mM phenylmethylsulfonyl
fluoride (PMSF; stock in isopropanol)
To prepare an aqueous solution of 100 μM PMSF
(for buffers A and B), add 1 ml 0.1 M PMSF per
liter of solution immediately before use
STOCK: 1 M Tris-HCl, pH 7.7
Buffer A: 0.1 M Tris-HCl, pH 7.7, 100 μMPMSF
Buffer B: 0.1 M Tris-HCl, pH 7.7, 0.5 M
KCl, 100 μM PMSF
Dialysis tubing with a 10,000 Da molecu-
lar weight cut off (MWCO)
E.g., Spectra/Por1 Membrane MWCO: 10,000,
Spectrum Laboratories, Inc.
(NH4)2SO4 (ammonium sulfate)
Sorvall centrifuge Or equivalent centrifuge/rotor combination to
achieve the required gravitational force
Table 7.2 Chemicals, enzymes, and equipment for concentration of enzyme extracts
Material description Comment
Amicon ultra centrifugal filters (0.5 ml, 10 kDa
MWCO)
Millipore Amicon Ref. No. UFC501024
24Pk
Refrigerated (4�C) microcentrifuge E.g., Eppendorf 5415R
Table 7.3 Chemicals, enzymes, and equipment for the test of mismatch cleavage activity
Material description Comment
Thermocycler E.g., Biorad C1000 Thermal cycler
PCR tubes Life Science No 781340
TaKaRa Ex Taq™ polymerase
(5 U/μl)TaKaRa
10 Ex Taq™ reaction buffer TaKaRa
dNTP mixture (2.5 mM of each
dNTP)
TaKaRa
Agarose gel equipment Horizontal electrophoresis from any general laboratory
supplier
24 7 Alternative Enzymology for Mismatch Cleavage for TILLING and Ecotilling:. . .

5. Centrifuge for 40 min at 4 �C at ~14,000� g in Sorvall GSA rotor (~9,000 rpm)
or equivalent. Discard the pellet.
6. Bring the supernatant to 80 % ammonium sulfate (add 390 g/l of solution). Mix
gently at 4 �C for 30 min using a magnetic stir bar and plate.
7. Centrifuge for 1.5 h at 4 �C at ~14,000� g. SAVE the pellet. Discard the
supernatant (NOTE: Be careful not to disturb pellet while decanting the supernatant).
8. OPTIONAL: Pellets can be frozen at −80 �C for months.
9. Resuspend the pellets by vortexing in ~1/10 the starting volume with Buffer B
(frozen pellets of the weed juice extract were suspended in 15 ml Buffer B and
pellets of the celery juice extract in 10 ml Buffer B). Ensure that the pellet is
thoroughly resuspended by pipetting it up and down or by vortexing.
10. Place the suspension into treated dialysis tubing use e.g. Spectra/Por1 7 10 kDa
MWCO tubing (NOTE: follow manufacturer’s guidelines for treatment of
tubing before use).
11. Dialyze for 1 h against Buffer B at 4 �C with constant agitation of the buffer
using a magnetic stir bar and plate. Use at least 2 l of buffer per 10 ml of
suspended solution.
12. Repeat for a total of four steps with a minimum of 4 h dialysis for each step
(NOTE: Longer dialysis is better, and it is often convenient to perform the third
treatment overnight).
13. Remove the liquid from dialysis tubing. It is convenient to store ~75 % of the
liquid in a single tube at −20 or −80 �C and the remainder in small aliquots for
testing. This protein mixture does not require storage in glycerol and remains
stable through multiple freeze–thaw cycles; however, limiting freeze–thaw
cycles to five reduces the chance of diminished enzyme activity.
14. Perform activity test (Step 7.2.3, or proceed immediately to enzyme concen-
tration, Step 7.2.2).
7.2.2 Concentration of Enzymes Using Amicon Ultra 10 kDaMWCO Centrifugal Filter Devices (for 0.5 ml StartingVolume; in 1.5-ml Tubes)
1. Perform with 600 μl of protein extract after dialysis.
2. Clear extract of plant material by centrifugation for 30 min at 10,000� g, 4 �C.3. Transfer 500 μl of the (cleared) supernatant to a filter device and keep the rest of
the supernatant as the “before concentration” control.
4. Centrifuge the filter device with a collection tube inserted, as per the manufac-
turer’s instructions for 30 min at 14,000� g, 4 �C.5. Remove the filter device, invert, and place in a new collection tube.
6. Centrifuge for 2 min at 1,000� g, 4 �C.7. Measure the recovered volume. This is your concentrated protein. Calculate the
concentration factor with the following formula: concentration factor¼starting
volume/final volume.
7.2 Methods 25
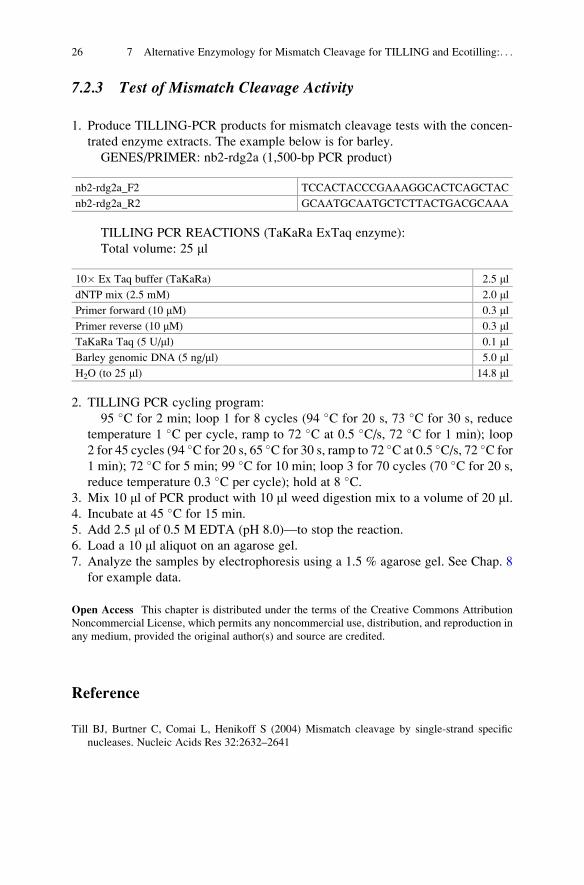
7.2.3 Test of Mismatch Cleavage Activity
1. Produce TILLING-PCR products for mismatch cleavage tests with the concen-
trated enzyme extracts. The example below is for barley.
GENES/PRIMER: nb2-rdg2a (1,500-bp PCR product)
nb2-rdg2a_F2 TCCACTACCCGAAAGGCACTCAGCTAC
nb2-rdg2a_R2 GCAATGCAATGCTCTTACTGACGCAAA
TILLING PCR REACTIONS (TaKaRa ExTaq enzyme):
Total volume: 25 μl
10� Ex Taq buffer (TaKaRa) 2.5 μl
dNTP mix (2.5 mM) 2.0 μlPrimer forward (10 μM) 0.3 μlPrimer reverse (10 μM) 0.3 μlTaKaRa Taq (5 U/μl) 0.1 μl
Barley genomic DNA (5 ng/μl) 5.0 μlH2O (to 25 μl) 14.8 μl
2. TILLING PCR cycling program:
95 �C for 2 min; loop 1 for 8 cycles (94 �C for 20 s, 73 �C for 30 s, reduce
temperature 1 �C per cycle, ramp to 72 �C at 0.5 �C/s, 72 �C for 1 min); loop
2 for 45 cycles (94 �C for 20 s, 65 �C for 30 s, ramp to 72 �C at 0.5 �C/s, 72 �C for
1 min); 72 �C for 5 min; 99 �C for 10 min; loop 3 for 70 cycles (70 �C for 20 s,
reduce temperature 0.3 �C per cycle); hold at 8 �C.3. Mix 10 μl of PCR product with 10 μl weed digestion mix to a volume of 20 μl.4. Incubate at 45 �C for 15 min.
5. Add 2.5 μl of 0.5 M EDTA (pH 8.0)—to stop the reaction.
6. Load a 10 μl aliquot on an agarose gel.
7. Analyze the samples by electrophoresis using a 1.5 % agarose gel. See Chap. 8
for example data.
Open Access This chapter is distributed under the terms of the Creative Commons Attribution
Noncommercial License, which permits any noncommercial use, distribution, and reproduction in
any medium, provided the original author(s) and source are credited.
Reference
Till BJ, Burtner C, Comai L, Henikoff S (2004) Mismatch cleavage by single-strand specific
nucleases. Nucleic Acids Res 32:2632–2641
26 7 Alternative Enzymology for Mismatch Cleavage for TILLING and Ecotilling:. . .
Chapter 8
Example Data
Abstract Standard agarose gel electrophoresis is a quick method for the evaluation
of the quality and quantity of DNA. This chapter provides examples of genomic
DNA produced using the low-cost extraction protocol, PCR amplification using the
extracted genomic DNA, and enzymatic mismatch cleavage of PCR products with
crude celery juice extract and weed juice extract to detect mutations.
8.1 Quality of Genomic DNA Obtained by Silica Powder-
Based DNA Extraction Method
While spectrophotometric approaches (e.g., Nanodrop) provide a quick and accu-
rate measure of DNA concentration and protein contamination, and fluorometric
methods (e.g., Qubit) provide high sensitivity, it is advisable that when optimizing
the DNA extraction protocol, samples are also run on a traditional agarose gel. This
allows an estimation of DNA concentration (relative to concentration standards
such as lambda DNA, Till et al. 2007), the extent of RNA carryover, as well as an
estimation of the extent of DNA degradation, something which cannot be easily
determined from the other two techniques (Figs. 8.1 and 8.2). Furthermore,
chaotropic salts can lower the accuracy of spectrophotometric methods. Reducing
sample degradation may be a key optimization step for some species. Alternative
buffers can be employed to limit degradation and the copurification of secondary
metabolites that can inhibit downstream molecular assays (see Sect. 8.2).
© International Atomic Energy Agency 2015
B.J. Till et al., Low-Cost Methods for Molecular Characterization of Mutant Plants,DOI 10.1007/978-3-319-16259-1_8
27

8.2 Quality of Genomic DNA Obtained by Silica
Powder-Based DNA Extraction Method Using
Alternative Buffers
Alternative buffers can be used to extract DNA from tissues or species where the
use of the standard buffer produces low-quality DNA. Tissue from Sorghum bicolorand grapevine (Vitis vinifera) were used to compare different buffer compositions
(Tables 8.1 and 8.2).
Quality and quantity of genomic DNA using different buffers were assayed by
native agarose gel electrophoresis (Fig. 8.3).
M 1 2 3 4 5 6 7 8 9 10 11 12 13 14 15 16 M
Fig. 8.1 Quality of barley genomic DNA extractions using combinations of self-made and
commercial products. Eight microliters of each genomic DNA extraction was electrophoresed
on a 0.7 % agarose gel. M¼ 1 kb Plus DNA ladder (Life Technologies). Lanes 1–4 are samples
prepared with the DNeasy kit from Qiagen. Lanes 5–8 are samples prepared using DNeasy
columns but with self-made 6M Guanidine thiocyanate buffer replacing commercial buffer
AP3/E. Lanes 9–12 are samples prepared with self-made lysis buffer but with commercial DNA
binding buffer AP3/E. Lanes 13–16 represent samples prepared using only self-made buffers
described in Chap. 4
M1 2 3 4 5 6 7
Fig. 8.2 Genomic DNA samples produced at the FAO/IAEA 2013 training course on “Plant
Mutation Breeding: Mutation Induction, Mutation Detection, and Pre-Breeding.” Lanes 1–3
represent lambda DNA concentration standards of 3, 10, and 30 ng/μL, respectively. Lanes 4–7represent genomic DNA prepared by Ms. Sasanti Wisiarsih and Mr. Wijaya Murti Indriatama of
Indonesia using the protocol described in Chap. 4 using a 6M KI buffer
28 8 Example Data

Table 8.1 Sorghum (Sorghum bicolor, Sb) genomic DNA extractions using the silica powder
method with four different lysis buffers
Sample designation Sb1a Sb1b Sb2a Sb2b Sb3a Sb3b Sb4a Sb4b
Lysis buffer (LB)a LB 1 LB 2 LB 3 LB 4
Incubation temperature (for
lysis)
RT 65 �C RT 65 �C RT 65 �C RT 65 �C
DNA concentration (ng/μl) 11 15 2 3 6 5 7 7
Total yield (μg) 2.0 2.6 0.4 0.6 1.0 0.9 1.3 1.3aSee Table 4.3 for composition of buffers
Table 8.2 Grapevine (Vitis vinifera, Vv) genomic DNA extractions using the silica powder
method with four different lysis buffers
Sample designation Vv1a Vv1b Vv2a Vv2b Vv3a Vv3b Vv4a Vv4b
Lysis buffer (LB)a LB 1 LB 2 LB 3 LB 4
Incubation temperature (for
lysis)
RT 65 �C RT 65 �C RT 65 �C RT 65 �C
DNA concentration (ng/μl) 22 32 7 3 11 6 4 9
Total yield (μg) 3.9 5.7 1.3 0.6 2.1 1.1 0.6 1.5aSee Table 4.3 for composition of buffers
Fig. 8.3 Quality of genomic DNA extracted from sorghum and grapevine using the silica powder
method with four different lysis buffers. Lanes 1–8 represent samples extracted from sorghum and
lanes 9–16 from grapevine. Lanes 1, 2, 9, and 10 were prepared with lysis buffer 1 from Table 4.3.
Lanes 3, 4, 11, and 12 with lysis buffer 2, lanes 5, 6, 13, and 14 with lysis buffer 3 and lanes 7, 8,
15, and 16 with lysis buffer 4. Lysis buffer 1 produced the highest yield with sorghum, but only
degraded DNA with grapevine tissue (circled)
8.2 Quality of Genomic DNA Obtained by Silica Powder-Based DNA Extraction. . . 29

8.2.1 Summary
High yield and high quality genomic DNA can be recovered from sorghum using a
simple lysis buffer. This buffer, however, is not suitable for grapevine DNA
extraction and alternative buffers are required to recover high molecular weight
DNA, albeit at a lower concentration than can be achieved from sorghum samples.
This suggests further parameter changes can be made to increase yields.
8.3 Example of PCR Products Using TILLING Primers
with Source Genomic DNA from a Commercial Kit
and Low-Cost Silica Method
High quality and quantity of gene-specific PCR products are produced in reactions
where source genomic DNA is extracted using either commercial kits or the low-
cost silica method (Fig. 8.4).
M 1 2 3 4 5 6 7 8 9 10 11 12 13 14 15 16
M 1 2 3 4 5 6 7 8 9 10 11 12 13 14 15 16
Fig. 8.4 PCR amplification of genomic DNAs described in Chap. 7 using primers for the barley
nb2-rdg2a (top panel) and nbs3-rdg2a (bottom panel) gene targets as described in Hofinger
et al. (2013). Samples are loaded in the same order as in Fig. 8.1
30 8 Example Data

8.4 Example of Low-Cost Agarose Gel-Based TILLING
Assays for the Discovery of Induced Point Mutations
PCR products are the substrate for enzymatic mismatch cleavage assays for muta-
tion discovery. Agarose gels provide a low-cost platform for mutation discovery
using self-extracted enzymes (Fig. 8.5).
8.5 Example of Enzyme Activity Recovered from Weeds
Compared to Crude Celery Juice Extract
The recovery of proteins from collected weeds versus celery is listed in Table 8.3.
This was used to prepare reaction mixes (Table 8.4) to test for enzymatic activity.
Samples were evaluated via standard agarose gel electrophoresis (Fig. 8.6).
8.5.1 Summary
Crude enzyme extracts of weeds show a similar activity to that of celery extract for
the cleavage of single nucleotide polymorphisms. The per unit activity, however,
was lower than for CEL I, likely owing to the co-precipitation of other plant
M 1 2 3 4 5 6 7 8 9
** ** **
**
** ***
*
Fig. 8.5 Gel image of mutation discovery using crude celery juice extract for enzymatic
mismatch cleavage. DNA from Arabidopsis plants with previously characterized induced point
mutations in the OXI1 gene was used (Till et al. 2004). Lane 2 represents a wild-type sample with
no mutation. Lane 9 represents undigested PCR product. All other lanes contain samples with
known mutations in the amplified region. Lower molecular weight bands representing cleavage
products at the site of mutation are observable in all other lanes (marked by asterisks). This image
was produced at the 2009 FAO/IAEA International Training Course on Novel Biotechnologies for
Enhancing Mutation Induction Efficiency by Mr. Saad Alzahrani of Saudi Arabia, and Mr Azhar
Bin Mohamad of Malaysia
8.5 Example of Enzyme Activity Recovered from Weeds Compared to Crude Celery. . . 31
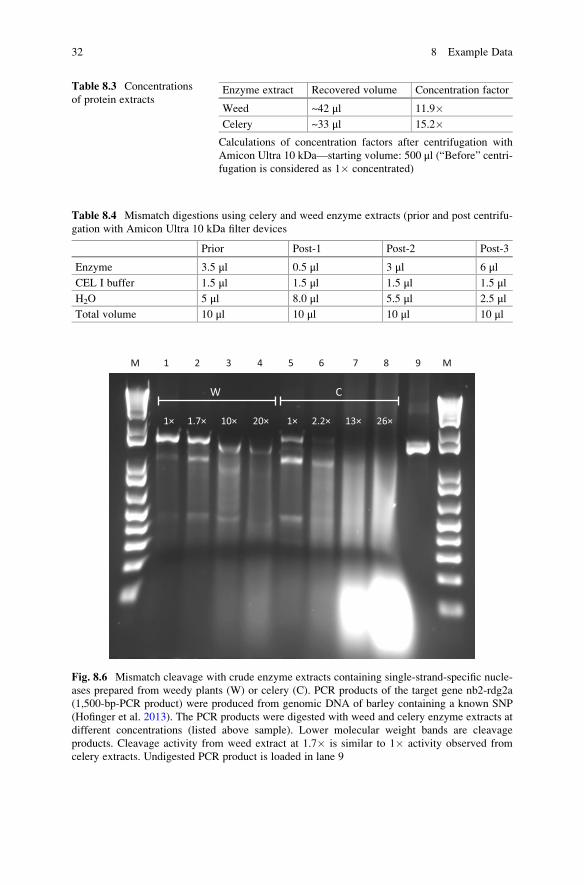
Table 8.3 Concentrations
of protein extractsEnzyme extract Recovered volume Concentration factor
Weed ~42 μl 11.9�Celery ~33 μl 15.2�Calculations of concentration factors after centrifugation with
Amicon Ultra 10 kDa—starting volume: 500 μl (“Before” centri-fugation is considered as 1� concentrated)
Table 8.4 Mismatch digestions using celery and weed enzyme extracts (prior and post centrifu-
gation with Amicon Ultra 10 kDa filter devices
Prior Post-1 Post-2 Post-3
Enzyme 3.5 μl 0.5 μl 3 μl 6 μlCEL I buffer 1.5 μl 1.5 μl 1.5 μl 1.5 μlH2O 5 μl 8.0 μl 5.5 μl 2.5 μlTotal volume 10 μl 10 μl 10 μl 10 μl
M 1 2 3 4 5 6 7 8 9 M
1× 1.7× 10× 20× 1× 2.2× 13× 26×
W C
Fig. 8.6 Mismatch cleavage with crude enzyme extracts containing single-strand-specific nucle-
ases prepared from weedy plants (W) or celery (C). PCR products of the target gene nb2-rdg2a
(1,500-bp-PCR product) were produced from genomic DNA of barley containing a known SNP
(Hofinger et al. 2013). The PCR products were digested with weed and celery enzyme extracts at
different concentrations (listed above sample). Lower molecular weight bands are cleavage
products. Cleavage activity from weed extract at 1.7� is similar to 1� activity observed from
celery extracts. Undigested PCR product is loaded in lane 9
32 8 Example Data

proteins in weeds, presumably including a larger amount of RuBisCO. This limi-
tation can be overcome through the use of a simple centrifugation-based protein
concentration step. Using this protocol, 150 ml of weed extract produces sufficient
enzyme for approximately 2,000 reactions.
Open Access This chapter is distributed under the terms of the Creative Commons Attribution
Noncommercial License, which permits any noncommercial use, distribution, and reproduction in
any medium, provided the original author(s) and source are credited.
References
Hofinger BJ, Huynh OA, Jankowicz-Cieslak J, Muller A, Otto I, Kumlehn J, Till BJ (2013)
Validation of doubled haploid plants by enzymatic mismatch cleavage. Plant Methods 9(1):43
Till BJ, Burtner C, Comai L, Henikoff S (2004) Mismatch cleavage by single-strand specific
nucleases. Nucleic Acids Res 32:2632–2641
Till BJ, Cooper CJ, Tai TH, Colowit P, Greene EA, Henikoff S, Comai L (2007) Discovery of
chemically induced mutations in rice by TILLING. BMC Plant Biol 7:19
References 33

Chapter 9
Conclusions
The approaches described here provide rapid and low-cost alternatives for sample
preparation, genomic DNA extraction, and mutation discovery. When evaluating
the methods, it is important to remember that protocol adaptations may be neces-
sary to compensate for sample differences (species and genotype), environmental
conditions in the laboratory, and quality of the water and chemicals used. Cost
savings in DNA preparation must be balanced with the shelf-life and suitability of
the samples for use in downstream applications. With the appropriate validation of
sample quality and longevity, the protocols described here can provide sufficient
DNA for a variety of molecular applications such as marker studies and TILLING,
at approximately one tenth of the cost per sample when compared to
commercial kits.
Open Access This chapter is distributed under the terms of the Creative Commons Attribution
Noncommercial License, which permits any noncommercial use, distribution, and reproduction in
any medium, provided the original author(s) and source are credited.
© International Atomic Energy Agency 2015
B.J. Till et al., Low-Cost Methods for Molecular Characterization of Mutant Plants,DOI 10.1007/978-3-319-16259-1_9
35