Low-Cost Hydrogen-from-Ethanol: A Distributed Production System ...
28
Low-Cost Hydrogen-from- Ethanol: A Distributed Production System Presented at the Bio-Derived Liquids to Hydrogen Distributed Reforming Working Group Meeting Laurel, Maryland Tuesday, November 6, 2007 H 2 Gen Innovations, Inc. Alexandria, Virginia www.h2gen.com
Transcript of Low-Cost Hydrogen-from-Ethanol: A Distributed Production System ...

Low-Cost Hydrogen-from- Ethanol: A Distributed
Production SystemPresented at the
Bio-Derived Liquids to Hydrogen Distributed Reforming Working
Group Meeting
Laurel, MarylandTuesday, November 6, 2007
H2
Gen Innovations, Inc.Alexandria, Virginia
www.h2gen.com

2
Topics
•
H2
Gen Reformer System Innovation•
Natural Gas Reformer–
Key performance metrics
–
Summary unique H2A inputs
•
Ethanol Reformer–
Key performance metrics
–
Summary unique H2A inputs
•
Questions from 2007 Merit Review

3
H2
Gen Innovations’ Commercial SMR
•
Compact, low-cost 115 kg/day natural gas reformer proven in commercial practice [13 US Patents granted]
•
Built-in, unique, low-cost PSA system
•
Unique sulfur-tolerant catalyst developed with Süd Chemie

4
DOE Program Results
•
Task 1-
Natural Gas Reformer Scaling: Commercial HGM-2000 (115 kg/day) reformer successfully scaled up to 565 kg/day; field testing under way
•
Task 2-
Ethanol Experiments: Initial micro-reactor long-term testing of ethanol as feedstock for the H2
Gen reformer system on- going
5
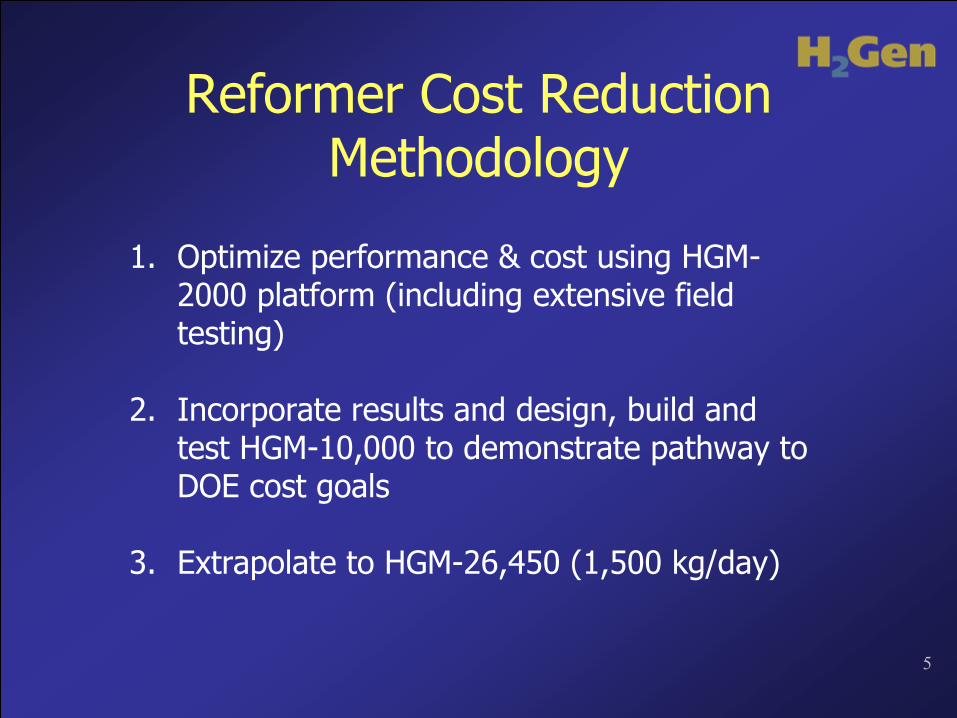
Reformer Cost Reduction Methodology
1.
Optimize performance & cost using HGM- 2000 platform (including extensive field
testing)
2.
Incorporate results and design, build and test HGM-10,000 to demonstrate pathway to DOE cost goals
3.
Extrapolate to HGM-26,450 (1,500 kg/day)

6
Capital Cost Estimate Procedure (500/year manufacturing rate)
115 kg/day
565 kg/day 1,500
kg/day
HGM-
2000 Cost
HGM-
10,000 cost
HGM-
26,450 cost
Calculate: Power Law Cost Scaling
Actual Single Unit Capital Cost
Estimate 500 unit/year production costs with progress ratios
Estimate Cost Using Power Law Cost Scaling

7
The H2
Gen HGM-2000
Natural Gas
WaterHydrogen
Low Cost
Small Footprint
Highly pure product2.1m
53.6 Nm3/h
2,000 scf/h
115 kg/day

8
HGM-2000 Field Units

9
Plant Floor

10
DOE HGM-10,000 (565 kg/day)Under construction
At field site

11
HGM 10,000 Layout drawings 24’
8”
8’

12
Key Performance Metrics for H2
Gen Reformers
Fuel NG LPG Ethanol
Based on 565 kg/day SMR Based on 80 kg/day SMR Based on 80 kg/day SMR
Overall process CH4+2H2O CO2+4H2 C3H8+6H2O 3CO2+10H2 C2H6O+3H2O 2CO2+6H2
Net pre-reforming - C3H8+2H2O 2CH4+CO2+2H2 C2H6O+H2O 1.5CH4+0.5CO2+H2
Fuel feed to SMR 100 nm3/hr 20 kg/hr 35 kg/hr
H2 yield 270 nm3/hr 70 nm3/hr 70 nm3/hr
S:C 4 4.2 2.5
Feed conversion 100% 100% 100%
LHV Efficiency 73% 68.9% 68.9%
Current status HGM-2k in serial production
HGM-10k unit started at customer’s site
First unit under construction Model data

13
Capital & Installation Cost H2A Variances for natural gas reformer
(based on 1,500 kg/day systems in 500 production quantities)H2A H2Gen Delta
SMR + PSA System FOB $1,172,478 769,225$ (403,253)$
Installation CostsState Sales tax (5%) 58,624$ 38,461$ (20,163)$ Unspecified (5%) 58,624$ -$ (58,624)$ Engineering Design 30,000$ -$ (30,000)$ Transportation & Insurance -$ 20,892$ 20,892$ On-Site Riggers -$ 16,200$ 16,200$ Site Preparation 74,344$ 81,993$ 7,649$ Utility Hook-ups -$ 26,714$ 26,714$ Permitting costs 30,000$ 30,000$ -$
Total Installation Costs 251,592$ 214,260$ (37,332)$ Total Capital Costs 1,424,070$ 983,485$ (440,585)$
Contingency % 10% 2%Contingency* 201,270$ 40,254$ (161,016)$
Total Costs with Contingency 1,625,340$ 1,023,739$ (601,601)$ *Contingency is also on compression, storage and dispensing at $1.52 million
H2Gen: HGM Cost Scaling size and quantity.XLS; Tab 'H2A Comparison';E21 - 11 / 2 / 2007

14
Reactor Replacement CostsYear H2A H2Gen Delta
(Current) (Future-2012)1 -$ 2 -$ 3 -$ 4 -$ 5 -$
5-Year catalyst replacement (15% of SMR Capex) 6 175,872$ (175,872)$ 7 -$
7-year replacement of hot module (12% of Capex) 8 92,775$ 92,775$ 9 -$
10 -$ SMR (H2A) & Dispenser replacements 11 1,370,366$ $80,640 (1,289,726)$
12 -$ 13 -$ 14 -$ 15 -$ 16 175,872$ 92,775$ (83,097)$ 17 -$ 18 -$ 19 -$ 20 -$
Totals 1,722,110$ 266,190$ (1,455,920)$

15
H2A Model Input Changes for Natural Gas Reformers
(based on 1,500 kg/day systems in 500 production quantities)H2A H2Gen Hydrogen Price
H2A with no changes (current) (future-2012) 3.49 /kg$ Reduced FOB SMR + PSA Cost $1,172,478 769,225$ 3.16 /kg$ Reduced Installation Costs 251,592$ 214,260$ 3.15 /kg$ Increased Efficiency 69.0% 73.0% 3.09 /kg$ Reduced Electricity consumption 1.50 kWh/kg 1.03 kWh/kg 3.05 /kg$ Reduced Annual Maintenance 45,751$ 36,452$ 3.02 /kg$ Reduced Reactor Replacement 1,722,110$ 266,190$ 2.89 /kg$ Reduced Start-up Time 1 year 1 month 2.70 /kg$ Reduced startup operating costs 100% 10% 2.57 /kg$ Reduced 2012 Compr. & storage 1,520,085$ 1,059,210$ 2.55 /kg$
Other costs Reduced Contingency 201,270$ 40,254$ 2.47 /kg$ Rent on 7,200 square feet 43,194$ -$ 2.35 /kg$ Dispensing labor (3/8 x 50%) 18,478$ -$ 2.29 /kg$
H2Gen: HGM Cost Scaling size and quantity.XLS; Tab 'H2A Comparison';E67 - 11 / 2 / 2007

16
Task 2: Ethanol ReformingChange in approach from original program• Pre-reforming to create CH4 stream from ethanol fuel feed followed by an
H2Gen CH4 reforming process• Use H2Gen pre-reforming process developed for commercial LPG
reforming to handle heavy feed constituents (US Patent pending)
Pre-reforming of ethanol: C2H5OH + H2O CH4 + CO2 + 2 H2
Followed by reforming of methane : CH4 + 2H2O CO2 + 4 H2
0
10
20
30
40
50
60
70
80
90
100
300 350 400 450 500 550 600
Catalyst inlet temperature ( C )
Etha
nol c
onve
rsio
n (%
)

17
Hydrogen from Ethanol Costs (based on 1,500 kg/day systems in 500 production quantities)
•
Assumptions:–
68.9% LHV efficiency (vs. 73% for NG)
–
Same capital costs & other assumptions as for natural gas reformer
•
Cost of Hydrogen from Ethanol*:–
H2A model: $4.49/kg
–
H2A with H2
Gen data: $3.98/kg *H2A assumes ethanol cost at $1.07/gallon

18
Future Implications of Energy Costs for Transportation
(EIA 2007 Annual Energy Outlook Energy Projections)
H2Gen: HGM Cost Scaling size and quantity.XLS; Tab 'Fuel Costs';E106 - 10 / 23 / 2007
0.00
0.50
1.00
1.50
2.00
2.50
3.00
2004 2009 2014 2019 2024 202918.018.519.019.520.020.521.021.522.022.5
Average Gasoline Cost ($/gallon)
Average Light-Duty Fuel Economy( mpg)
Gasoline CostMPG
Ethanol Cost

19
2007 AEO Projections in 2005$/MBTU
H2Gen: HGM Cost Scaling size and quantity.XLS; Tab 'Fuel Costs';E67 - 10 / 23 / 2007
0
5
10
15
20
25
30
35
2005 2010 2015 2020 2025 2030
Electricity(Commercial)
Ethanol
MotorGasoline
Natural Gas(Industrial)
Energy Cost ($/MBTU-HHV)

20
Reviewer’s Comments Weaknesses
• Requires integration into overall production, compression, and storage system to determine transients, turndown, etc. True, but turndown and transients have been measured independently
• Scale up from 113 to 567 was not clearly defined as to risk both on a market penetration basis and reliability of performance. Unclear whether the availability of components is within their current analysis or if a new evaluation will be undertaken since there is limited performance data available. Market risk: commercial demand has been identified and is very robust for 567 kg/day reformerReliability of performance: not clear what this means….performance is being measured in the field. Availability of components has been demonstrated: first unit has been built and second is under construction.
• Catalyst development strategy does not fit with this project. Catalyst development with Süd Chemie is essential for both natural gas cost reduction and ethanol reforming.
• Unclear if it is necessary to pre-reform ethanol. Ethanol must be pre-reformed to utilize the existing low-cost SMR technology, and to pre-reform ethanol denaturants
• No safety and code analysis for the installation of the hydrogen generator at the field site. Every H2Gen reformer system has undergone extensive HAZOP safety reviews by industrial gas companies and/or the site operator prior to installation.

21
Reviewer’s CommentsSpecific recommendations and additions or deletions to the work scope
• Continue to complete this project to benchmark progress to goals. Agreed.
• Add task to track hydrogen quality and its impact on cost of hydrogen. Good suggestion.
• Maybe they should focus on their primary objective which is the development of hydrogen generator for distributed production of hydrogen using natural gas as feedstock. Would like to see more of these hydrogen generators built instead of redirecting their effort on reforming ethanol. We agree that more hydrogen generators should be built, but DOE funding will not support additional units. Our commercial customers are providing the resources to continue reformer production and use in the industrial gas business. No other commercial organization will support the development of ethanol reforming, however. Since hydrogen made from ethanol is the least costly renewable hydrogen option, the DOE is the appropriate sponsor to capture the societal benefits of renewable hydrogen.
• It is a good idea for DOE to fund H2Gen for ethanol reforming. Agreed.

22
Thank You•
Contact Information:Frank Lomax, CTO, [email protected]
Maxim [email protected]
C.E. (Sandy) Thomas, [email protected]
H2Gen Innovations, Inc.Alexandria, Virginia 22304www.h2gen.com

23
Back-up Slides

24
Fuel Costs per Mile
H2Gen:Ethanol vehicles.XLS; Tab 'Charts';H 75 8/28 /2006
0 10 20 30 40 50 60
Gasoline ICEV
Gasoline ICE HEV
H2 (NG) ICE HEV
H2 (NG) FCV
H2 Ethanol ICE HEV
H2 Wind ICE HEV
H2 PV ICE HEV
H2 Ethanol FCV
H2 Wind FCV
H2 PV FCV
Fuel Cost (cents/mile)H2Gen:Ethanol vehicles.XLS; Tab 'Charts';H 75 8/28
/2006
Assumptions: Gasoline = $2.90/gallon; Ethanol = $1.50/gallon; PV
= 20 cents/kWh for 7 hours/day; Wind = 5 cents/kWh for 12 hours/day;Gasoline-HEV fuel economy = 1.45 X ICEV; H2-HEV fuel economy = 1.71 x ICEV; FCV fuel economy = 2.38 X ICEV[DOE cost parameters: 11% annual capital recovery, 90% capacity factor, NG = $3.97/MBTU (HHV), Electricity= 7 cents/kWh]

25
Fuel Costs per Mile
H2Gen:Ethanol vehicles.XLS; Tab 'Charts';H 75 8/28 /2006
0 10 20 30 40 50 60
Gasoline ICEV
Gasoline ICE HEV
H2 (NG) ICE HEV
H2 (NG) FCV
H2 Ethanol ICE HEV
H2 Wind ICE HEV
H2 PV ICE HEV
H2 Ethanol FCV
H2 Wind FCV
H2 PV FCV
Fuel Cost (cents/mile)H2Gen:Ethanol vehicles.XLS; Tab 'Charts';H 75 8/28
/2006
Assumptions: Gasoline = $2.90/gallon; Ethanol = $1.50/gallon; PV
= 20 cents/kWh for 7 hours/day; Wind = 5 cents/kWh for 12 hours/day;Gasoline-HEV fuel economy = 1.45 X ICEV; H2-HEV fuel economy = 1.71 x ICEV; FCV fuel economy = 2.38 X ICEV[DOE cost parameters: 11% annual capital recovery, 90% capacity factor, NG = $3.97/MBTU (HHV), Electricity= 7 cents/kWh]
RenewableHydrogenOptions

26H2Gen:Ethanol vehicles.XLS; Tab 'GHG vs Fuel Cost';K 51 2/19 /2007
0
200
400
600
800
1000
1200
1400
0 10 20 30 40 50 60
Fuel Cost (cents/mile)
H2 (Grid Electrolyzer) HEVH2 (Grid Electrolyzer) FCVGasoline ICEVGasoline-ICE HEVGasoline Plug-In ICE HEVH2 (NG-HGM) ICE HEVH2 (NG-HGM) FCVH2 (Corn Ethanol-HGM) ICE HEVH2 (Corn Ethanol-HGM) FCVH2 (Bio-Ethanol-HGM) ICE HEVH2 (Bio-Ethanol-HGM) FCVH2 (Wind-Electrolyzer) ICE HEVH2 (Wind-Electrolyzer) FCVH2 (PV-Electrolyzer) ICE HEVH2 (PV-Electrolyzer) FCV
Greenhouse Gas Emissions (g/mile)
GHGs vs. Fuel Cost
H2-PV-Electrolysis(20 c/kWh for 7 hr/day)
Gasoline:$2.50/gal.
HEV
H2-Grid-Electrolysis(6 c/kWh for 24 hr/day)
H2 ICE HEV
H2 FCV
H2HEV
ICEV
H2-Wind-Electrolysis(5 c/kWh for 8.4 hr/day [35%]) H2 FCV
H2 = hydrogen; HEV = hybrid electric vehicle; FCV = fuel cell vehicle; ICEV = internal combustion engine vehicle; PV = photovoltaic (solar cells)EPRI: Wind = 7.5 cents/kWh by 2010; Wind = 5.2 cents/kWh by 2020
with 29% average capacity factor
Plug-in HEV

27
0
100
200
300
400
500
600
0 5 10 15 20 25
Fuel Cost (cents/mile)
Gasoline ICEVGasoline-ICE HEVH2 (NG-HGM) ICE HEVH2 (NG-HGM) FCVGasoline Plug-In ICE HEVH2 (Corn Ethanol-HGM) ICE HEVH2 (Corn Ethanol-HGM) FCVH2 (Bio-Ethanol-HGM) ICE HEVH2 (Bio-Ethanol-HGM) FCVH2 (Wind-Electrolyzer) ICE HEVH2 (Wind-Electrolyzer) FCV
Greenhouse Gas Emissions (g/mile)
GHG vs. Fuel Cost (Scale change)
GasolineICEV
HEV
H2-Natural Gas ICE HEV
H2-FCV
H2-Corn Ethanol ICE HEV
H2-Cellulosic Ethanol ICE HEV
H2-Wind-Electrolysis(5 c/kWh for 8.4 hr/day [35%])
Plug-in HEV
Electricity = 8 cents/kWh; PHEV electricity 40% H2Gen:Ethanol vehicles.XLS; Tab 'GHG vs Fuel Cost';AC 51 2/19 /2007
Corn Ethanol = $1.5/gallon Cellulosic Ethanol = $0.75/gallon Natural Gas =$8.98/MBTU Gasoline =$2.5/gallon
Note: these charts are based on the NRC/NAS capital recovery assumptions (16% annual capital recovery & 90% capacity factor)

28
Vehicle Costs per Mile (Constant 2005$)
H2Gen: HGM Cost Scaling size and quantity.XLS; Tab 'Fuel Costs';Q108 - 10 / 24 / 2007
02468
1012141618
2005 2010 2015 2020 2025 2030
FCV - H2/EtOH
ICEV - Gasoline
FCV - H2/EtOH($1.07/gal)HEV - Gasoline
FCV - H2/NG
Vehicle Fuel Cost (Cents/mile)
(FCV = 2.4 X ICEV fuel economy)(HEV = 1.45 X ICEV fuel economy)