Low cost carriers and foreign tourism inflows Giacinto-Migliardi.pdf · European Transport \...
26
European Transport \ Trasporti Europei (Year) Issue 55, Paper n° 5, ISSN 1825-3997 1 Low cost carriers and foreign tourism inflows: a cointegrated VAR analysis for Italy 1 Valter Di Giacinto 1 , Andrea Migliardi 2 1 Bank of Italy, L’Aquila 2 Bank of Italy, Genoa Abstract This paper seeks to quantify the impact of the expansion of LCC on foreign tourism trends in Italy. We rely on a novel data set on the seats on flights by low cost carriers between foreign destinations and each Italian airport. Cointegrated vector autoregressive models are estimated for both Italy and its main geographical areas. A single equilibrium relation is uncovered, relating the level of LCC travel supply to the dynamics of the global business cycle, of relative consumer prices and of foreign tourist expenditure. According to our structural impulse response analysis, a positive shock to LCC travel supply determines an increase in Italy both for foreign tourist expenditure and for arrivals. The estimated response for per capita expenditure is positive at national level, but negative for two of the four macro regions. These findings suggest that focusing on arrival statistics may provide a partial view of the impact of LCC supply policies. Keywords: Tourism demand, Low cost carriers, cointegration analysis. 1. Introduction This paper provides an empirical analysis of the joint evolution of the foreign tourism and low fare air transport industries in Italy over the last decade. The rapid expansion of the operations of low cost carriers (LCCs), opening new routes and market segments and connecting a large number of regional destinations, has deeply changed foreign tourism demand. Before the introduction of LCC travel facilities many cities had no direct air access to foreign destinations and could only be reached via a hub airport. This made journeys longer and more expensive, discouraging potential foreign tourists from travelling to locations not served by direct flights. As a consequence tourism seasonality was more pronounced and prices variation between high and low season sharper. 1 We are grateful to Renato Redondi for providing the data set on LCC flight supply at Italian airports and for useful suggestions. We thank Luigi Cannari and Elena Mattevi for valuable comments. The views expressed in this paper are those of the authors and do not involve the responsibility of the Bank of Italy. Corresponding author: Andrea Migliardi ([email protected])
Transcript of Low cost carriers and foreign tourism inflows Giacinto-Migliardi.pdf · European Transport \...

European Transport \ Trasporti Europei (Year) Issue 55, Paper n° 5, ISSN 1825-3997
1
Low cost carriers and foreign tourism inflows:
a cointegrated VAR analysis for Italy1
Valter Di Giacinto 1, Andrea Migliardi
2
1 Bank of Italy, L’Aquila
2 Bank of Italy, Genoa
Abstract
This paper seeks to quantify the impact of the expansion of LCC on foreign tourism trends in Italy. We
rely on a novel data set on the seats on flights by low cost carriers between foreign destinations and each
Italian airport.
Cointegrated vector autoregressive models are estimated for both Italy and its main geographical areas.
A single equilibrium relation is uncovered, relating the level of LCC travel supply to the dynamics of the
global business cycle, of relative consumer prices and of foreign tourist expenditure.
According to our structural impulse response analysis, a positive shock to LCC travel supply
determines an increase in Italy both for foreign tourist expenditure and for arrivals. The estimated response for per capita expenditure is positive at national level, but negative for two of the four macro
regions. These findings suggest that focusing on arrival statistics may provide a partial view of the impact
of LCC supply policies.
Keywords: Tourism demand, Low cost carriers, cointegration analysis.
1. Introduction
This paper provides an empirical analysis of the joint evolution of the foreign tourism
and low fare air transport industries in Italy over the last decade.
The rapid expansion of the operations of low cost carriers (LCCs), opening new
routes and market segments and connecting a large number of regional destinations, has
deeply changed foreign tourism demand. Before the introduction of LCC travel facilities
many cities had no direct air access to foreign destinations and could only be reached
via a hub airport. This made journeys longer and more expensive, discouraging potential
foreign tourists from travelling to locations not served by direct flights. As a
consequence tourism seasonality was more pronounced and prices variation between
high and low season sharper.
1 We are grateful to Renato Redondi for providing the data set on LCC flight supply at Italian airports and
for useful suggestions. We thank Luigi Cannari and Elena Mattevi for valuable comments. The views
expressed in this paper are those of the authors and do not involve the responsibility of the Bank of Italy. Corresponding author: Andrea Migliardi ([email protected])

European Transport \ Trasporti Europei (Year) Issue 55, Paper n° 5, ISSN 1825-3997
2
Overall, the descriptive evidence shows that in the years from 1999 to 2009 period, as
LCC business soared in Italy and in other countries, the number of foreign travellers
flying to Italy increased substantially. However, the rise in inbound passenger traffic
was not matched by a parallel increase in foreign tourism receipts, which actually fell
slightly over the same period as real expenditure per visitor diminished. Both the
shortening of the average stay and the fall in daily expenditure per person contributed to
this outcome.
The success of the low fare travel industry can arguably be considered an important
factor of the rapid growth in the number of tourists arriving but it may also help explain
the trend of per capita expenditure.
From a theoretical point of view, the reduction in fares or travel time made possible
by an increased supply of LCC flights can have both positive and negative effects on the
per capita tourist expenditure.
A reduction in air transport prices, by inducing a positive income effect, should result
in increased tourist expenditure (net of transport costs), as travellers have more money
to spend on alternative items of the tourism consumption bundle (Stabler et al. 2010).
A time effect can supplement the income effect when entirely new air routes are
opened by low cost companies. By exploiting the new travel opportunities, foreign
tourists facing a tight constraint on the length of their vacation may be able to reduce the
overall time spent travelling and have more time to spend at their final destination.
Negative effects on average individual expenditure levels can be envisaged when
reduced transport costs trigger an unfavourable change in the composition of the pool of
foreign travellers. By making long journeys affordable to less wealthy foreign
consumers or by fostering the demand for travel services by tourists who prefer shorter
stays, an expansion of the LCC flight supply can generate an adverse selection effect, as
low-spending tourists partially crowd out higher-spending travellers.
As both the positive income/time effect and negative selection effects are likely to
coexist, it is not possible to identify a priori the sign of the influence of LCC supply
expansion on per capita tourist expenditure, which will therefore have to be assessed on
empirical grounds. Some degree of heterogeneity across different areas is to be expected
in this respect, as the balance between positive and negative effects may depend on the
specific structural features of individual destinations.
By fitting a series of cointegrated VAR models on national time series data, we seek
to shed light on the complex network of influences exerted by the expansion of the
supply of low fare flights on the short- and long-run dynamics of foreign tourism in
Italy. We subsequently dealt with the issue of differential effects across tourist districts
by estimating the model separately for Italy’s four macro regions.
The endogenous response of LCC travel supply to global and local shocks affecting
travel demand is fully taken into account within the proposed structural VAR model,
allowing some interesting dynamics to be disclosed in this regard as well.
The paper is organized as follows. Section 2 provides a concise review of the relevant
literature and highlights the role of local public policy in stimulating LCC flight
operations at specific airports. Some preliminary descriptive evidence is presented in
Section 3. Section 4 is devoted to the specification, identification and estimation of the
baseline structural VAR model. Section 5 deals with an extended model, separately
addressing tourist arrivals and individual expenditure. Regional dynamics are
documented in Section 6. Section 7 summarizes and concludes.

European Transport \ Trasporti Europei (Year) Issue 55, Paper n° 5, ISSN 1825-3997
3
2. Review of the literature
2.1 The introduction of low cost carriers and their market model.
In 1991 Ryanair transformed itself from a conventional regional airline into an LCC,
following the path blazed by Southwest Airlines in the early 1970s in the United States
(see De Neufville, 2007, and Berry and Jia, 2010, for the expansion of LCC in the
United States).
In Italy low fare airlines began to operate at the end of the 1990s and expanded their
activity at a fast pace. According to ENAC, Italy’s civil aviation authority, in the period
2004-09 the number of passengers travelling with LCCs rose by nearly 60 per cent, well
above the average growth rate in Europe and faster than in the other main EU countries
(Germany, France, the UK and Spain; see Cepolina-Parola, 2008).
Three features distinguish low cost carriers’ business model: a simple and standard
product; an explicit target of high-frequency point-to-point traffic and leisure traffic;
and low operating costs. LCCs often sell a high percentage of tickets directly online and
have a fleet composed of a single type of airplane (reducing maintenance costs).
The main difference in costs between traditional airlines and LCCs consists in labour
costs; LCCs should have higher productivity, lower average salaries and fewer
employees assigned to services than full costs airlines. Another important difference
consists in landing fees: LCCs often choose secondary regional airports, where
conditions are negotiable. Finally, LCCs use to fly with a single type of airplane,
reducing labour and maintenance costs. Campisi et al. (2010) give more information
about the differences in business models and estimate the competitive advantages for
different types of costs; estimates about lower costs for LCCs are available in Carlucci
and Cirà (2009).
2.2 Tourism literature and VAR models.
Empirical research on the tourism market has evolved rapidly in the recent years,
applying a wide range of econometric techniques to analyze the main variables
characterizing economic performance in this sector. Panel data methodology is often
used in scientific papers forecasting tourism demand because of the advantages of
working with wider information sets. Witt and Witt (1995) made a first survey of the
literature. More recently, Wong et al. (2007) reviewed the main empirical studies
encompassing the use of panel data and VAR technique, and Song and Li (2008)
compiled a list of articles published in tourism scientific journals, providing information
on the various econometric models. The most important determinants of tourism
demand underlined by the literature are tourists’ income, tourism prices in the
destination relative to those in the home country, tourism prices in competing
destination countries (substitute prices) and exchange rates.
As far as the main results of VAR models are concerned, we show the results of a
selected list of papers. De Mello and Nell (2001) specify a VAR model for British
tourism demand towards France, Spain and Portugal. They estimate the long-run
relationships between destinations’ shares of tourism expenditure, UK real per capita
tourism budget, cross and own prices. The reactions have the expected signs (positive
for an increase in the real per capita tourism budget and negative for an increase in
prices).

European Transport \ Trasporti Europei (Year) Issue 55, Paper n° 5, ISSN 1825-3997
4
Song and Witt (2006) perform an impulse response analysis to examine the impacts of
shocks to each of the explanatory variables on the demand for tourism. They study
inbound tourism to Macau and consider, as main explanatory variables, GDP in foreign
countries, own prices and substitute prices. In their evidence, tourism demand generally
responds with correct signs to different shocks, but the magnitudes of the responses are
small. The effects of the shocks on tourism demand tend to last for 3–4 years.
According to the empirical results on demand for Hong Kong tourism (Wong et al.,
2006), the forecasting performance of VAR models can be improved when they are
estimated using the Bayesian approach (BVAR model).
2.3 The impact of LCCs and the question of fair competition.
In 2009 LCCs had between 15 and 34 per cent of the market in the main European
Countries (KPMG, 2011). In general, the economic literature acknowledges that the
spread of low cost carriers has changed the airline and airport market, with benefits for
regional development and for consumers.
Various aspects of the effects on air travel markets have been pointed up. De
Neufville (2007) describes how airport strategies changed in response to entry of low
cast carriers. Piga and Bachis (2006) provide information about the impact on prices.
Graham (2013) and Lin et al. (2013) provide some relevant insights on the relationships
between LCCs and airports. Among the papers finding a positive impact of LCCs on
regional development, we mention Hahn (2006) for the creation of jobs in the region for
some German airports, Percoco (2009) for local growth in Italy at NUTS3 level, and
Bieger and Wittmer (2006) for the influence on tourism in Switzerland. Williams and
Balaz (2009) find links between LCC entry and regional development via four main
flows: the labour market; business travel and tacit knowledge; inward investment and
business connectivity; and mobility for consumers and markets. The latter flows include
tourism demand, which is quite price elastic.
On the other hand, there is the increasingly important issue of fair competition
between airlines; this was examined by the European Commission for the well known
Ryanair-Charleroi airport case at the beginning of 2004. The EU measures following
this case are detailed in Barbot (2006). In general, financial and commercial advantages
to LCCs are not negligible: estimates based on press releases put the French airports’
subsidies in favour of LCCs at € 35 million per year; for the whole of Europe, subsidies
may come to as much as € 660 million. Alderighi and Baccelli (2006) provide some
examples from the Italian market: cumulative budgets of € 13.5 million and € 25 million
respectively in the regions of Piedmont and Apulia and a specific measure by Aeroporti
di Roma (ADR) in Rome (see also Cour des Comptes, 2008; Vera Rebollo and Ivars
Baidal, 2009).
3. Some descriptive evidence
Our empirical analysis of foreign tourism demand in Italy is carried out on a novel
data set pooling information on inbound tourism flows from the Bank of Italy survey
and data on the supply of LCC travel services to foreign destinations operated within
each Italian airport.
The Bank of Italy’s international tourism (IIT) survey is a sample survey involving
some 150,000 interviews per year conducted at the country’s border. The survey-based
statistics encompass information compiled at different intervals (monthly, quarterly,

European Transport \ Trasporti Europei (Year) Issue 55, Paper n° 5, ISSN 1825-3997
5
annual) and with different territorial disaggregation (up to the NUTS3 level). The
specific characteristics of the survey and downloadable data are available at
http://www.bancaditalia.it/statistiche/rapp_estero/altre_stat/turismo-int.
In the period 1999-2009 foreign tourism expenditure in Italy declined slightly in real
terms (Figure 1.a). In real terms, receipts decreased in the Centre and the North-East,
while they remained broadly stable in the North-West. In the South foreign tourism
expenditure showed an upward trend until 2006, followed by a sharp reversal.
Figure 1.a
Figure 1.b
50
60
70
80
90
100
110
120
130
140
1999 2000 2001 2002 2003 2004 2005 2006 2007 2008 2009
North West
Centre
Italy
South
North East
60
70
80
90
100
110
120
130
140
150
1999 2000 2001 2002 2003 2004 2005 2006 2007 2008 2009
South
North West
Italy
Centre
North East
Figure 1a: International tourism expenditure in Italy (real terms, index 1999=100).
Figure 1b: International tourism arrivals to Italy (index 1999=100). Source: Bank of Italy, based on IIT Survey.
The decline of tourism expenditure has been shown to depend on different factors,
such as the rise of new destinations in emerging countries and the crowding out of some
traditional catchment areas (e.g., Germany, United States and Japan). In this context, the
LCC expansion should attenuate the underlying reduction in tourism demand by
bringing down travel airfares.
In order to get some insights of the determinants of the decline in total foreign
receipts, the latter can be decomposed as follows:
TEij = Aij * Lij * PCEij
where TEij is the total expenditure in region i from country j, A is the arrivals of
international tourists, L the average length of stay and PCE is the per capita daily
expenditure.
Contrary to the dynamics of total receipts, foreign tourist arrivals (Aij) recorded a
cumulative 16.3 per cent increase in the period 1999-2009 (Figure 1.b). The average
length of the stay of international travellers (Lij) trended downwards starting in 2005
(Figure 2.a). The cumulative decline, amounting to slightly less than 20 per cent,
explains a substantial part of the reduction in total foreign tourism receipts. All the
macro regions except the North–West show a decline similar to the one observed at the
national level. To better understand the heterogeneous behaviour of this variable, it is
useful to refer directly to the duration of trip depicted in Figure 2.a: on average, the
length of tourist stays fell from 4.3 to 3.5 days in Italy. In the South, where the decline
came to a cumulative 25.9 per cent, the initial length of the stay far exceeded the
average for the country, but it fell to 7.1 days in 2009. The favourable performance
recorded in the North-West reflected the very short length of stays in the initial year (2.3
days in 1999); the North-West is the main target areas in Italy for business trips, which
typically involve shorter stays.

European Transport \ Trasporti Europei (Year) Issue 55, Paper n° 5, ISSN 1825-3997
6
Figure 2.a
Figure 2.b
60
70
80
90
100
110
120
130
140
1999 2000 2001 2002 2003 2004 2005 2006 2007 2008 2009
North West
North East
Italy
Centre
South
75
80
85
90
95
100
105
110
115
1999 2000 2001 2002 2003 2004 2005 2006 2007 2008 2009
North East
South
North West
Italy
Centre
Figure 2a: International tourism in Italy – Duration of trip (index 1999=100).
Figure 2b: International tourism in Italy – Per capita expenditure (index 1999=100). Source: Bank of Italy, based on IIT Survey.
Like travel duration, average daily expenditure (PCEij) shows a significant decrease
over the period in question (15 per cent; Figure 2.b). This may have been partly due to
the gradual replacement of wealthier tourists (such as Japanese, Americans and
Germans) by travellers from emerging countries, with smaller budgets and different life
styles. The global tendency to exploit low cost holiday opportunities may also have had
an impact. The decline was fairly uniform across Italy except for the South, where a
markedly milder reduction was recorded (5.5 per cent), also due to an initial level 28.5
per cent below the national standard.
The statistics compiled by the International Center for Competitiveness Studies in the
Aviation Industry (ICCSAI) based on raw data from OAG Aviation allow us to evaluate
the dynamics of the LCC supply of travel services to foreign destinations over the last
decade. As shown by Figures 3.a and 3.b, LCC business grew rapidly in all four macro
regions in terms both of total available seats and of market shares.
During the period 1999-2009, the LCC market share on routes to and from Italy grew
continuously, increasing more than 16-fold. In terms of available seats, LCC supply
showed the steepest increase in the North West, mostly because of the expansion of low
cost flights at the Milan Malpensa hub and at the Ryanair hub for Italy in Milan Orio al
Serio. The South and Centre also outperformed the average.
Figure 3.a
Figure 3.b
0
500
1.000
1.500
2.000
2.500
3.000
3.500
1999 2000 2001 2002 2003 2004 2005 2006 2007 2008 2009
North West
South
Centre
North East
Italy
0%
10%
20%
30%
40%
50%
60%
70%
80%
1999 2000 2001 2002 2003 2004 2005 2006 2007 2008 2009
North West
Centre
North East
Italy
South
Figure 3a: LCC: Available seats. International flights to/from Italy (index 1999=100).
Figure 3b: LCC market share in Italy in terms of available seats (1) (percentages). Source: ICCSAI calculations based on OAG data.
(1) LCC share of total available seats at Italian airports.

European Transport \ Trasporti Europei (Year) Issue 55, Paper n° 5, ISSN 1825-3997
7
According to Assaeroporti, in the period 2000-09 passenger traffic on international
flights to/from Italian airports increased overall by 5.3 per cent per year. LCC market
share increased as a result of the slackening of growth for the traditional carriers. Figure
3.b shows that the rise in LCC market share was especially pronounced in the South,
with a sharp increase until 2005 and a subsequently flattening at a very high level (about
70 per cent). At the end of the period LCC market share in the North-West and the
North-East was close to the national average, slightly below 40 per cent. In the Centre,
where the leading incumbent Italian carrier has its main international hub, market share
remained below the national average despite a ten fold increase (from 3.8 to 31.2 per
cent).
The rise in inbound passenger traffic was not matched by a corresponding increase in
foreign tourism receipts, which, on the contrary, recorded a slight reduction in real
terms. A decline in average expenditure per foreign visitor accounts for this divergence.
The decline was triggered by a shortening of the average length of stays in Italy and a
simultaneous decrease in average daily average expenditure.
4. Empirical findings: the baseline model
4.1 Model specification.
A recent strand of the literature has advocated the use of identified vector
autoregressive (VAR) models in the empirical evaluation of the macroeconomic effects
of public infrastructure investment (Pereira, 2001, Kamps, 2005, Di Giacinto et al.,
2010). On this respect, the introduction of LCC travel services may be deemed to
present many points in common with a shock to public infrastructure endowments, as it
influences the productivity of the existing stock of airport facilities. Building on this
similitude, we choose to rely on the VAR methodology in order to derive our empirical
estimates of the impact of the expansion of LCCs on foreign tourism inflows in Italy.
In the VAR approach, as initially popularized by Sims (1980), the system of dynamic
equations governing the joint evolution of the endogenous variables is not formally
derived from an underlying structural model but is specified according to the features
the observed data. In this way greater model flexibility is achieved and, while no
empirical estimates of “deep” structural parameters (e.g. the price elasticity of consumer
demand for transport services) are obtained, important policy issues may be fruitfully
addressed by analyzing the pattern of dynamic responses of the endogenous variables to
unforeseen exogenous shocks affecting any of the system variables.
The baseline VAR specification considered in the empirical analysis was estimated on
data aggregated at the national level and includes four endogenous variables. The first
two variables account for foreign tourism demand fluctuations due to income and price
factors.
Income dynamics in countries of origin are measured by the GDP series for the
aggregate OECD area (referred to as INCOME in what follows). The great bulk of
foreign tourism flows to Italy originates from this area, and a disaggregated analysis
showed that tourism expenditure shares by country of origin are closely related to GDP
shares. Since OECD GDP data are available only on a quarterly basis, monthly figures
were obtained by interpolation. The Chow and Lin (1971) method was adopted to this
end, using the OECD Composite Leading Indicator (CLI), in the trend restored version,
as the high-frequency indicator series (source: OECD, Main economic indicators).
European Transport \ Trasporti Europei (Year) Issue 55, Paper n° 5, ISSN 1825-3997
8
The OECD relative Consumer Price Index (RCPI) was then introduced in order to
account of exchange rate and comparative price level dynamics in Italy and in foreign
countries. The RCPI is a measure of the real effective exchange rate that takes into
account not only changes in market exchange rates but also variations in relative
consumer price levels, and can therefore be used as an indicator of competitiveness.
A positive shock to foreign income is expected to boost tourism demand by foreign
residents, possibly with a few months’ lag, as households usually plan foreign trips well
ahead of the actual date of departure.
A positive shock to the relative price level, on the contrary, is expected to discourage
foreign tourism demand by lowering the competitiveness of Italian suppliers relative to
those located abroad.
The remaining two variables considered in the baseline VAR specifications are the
total flight seats on foreign routes supplied by low-cost carriers (LOWCOST) in Italy
and the total foreign tourism expenditure series described in the previous section
(TOTEXP).
While we can rely on a detailed database that provides information on the flight seats
operated by LCCs in each Italian airport, only yearly average figures are available. To
match the frequency of the model’s remaining variables, annual data were interpolated
at monthly frequency using data on passenger traffic at individual airports (source:
Assaeroporti)2.
Log-levels, seasonally adjusted figures for the four endogenous variables were
considered in the empirical analysis. The order of integration of the individual series
was first assessed by running a series of augmented Dickey-Fuller tests. All variables
were found out to be I(1), as the null hypothesis could not be rejected at standard
significance thresholds for the log-levels while it was always rejected for the first-
differenced series.
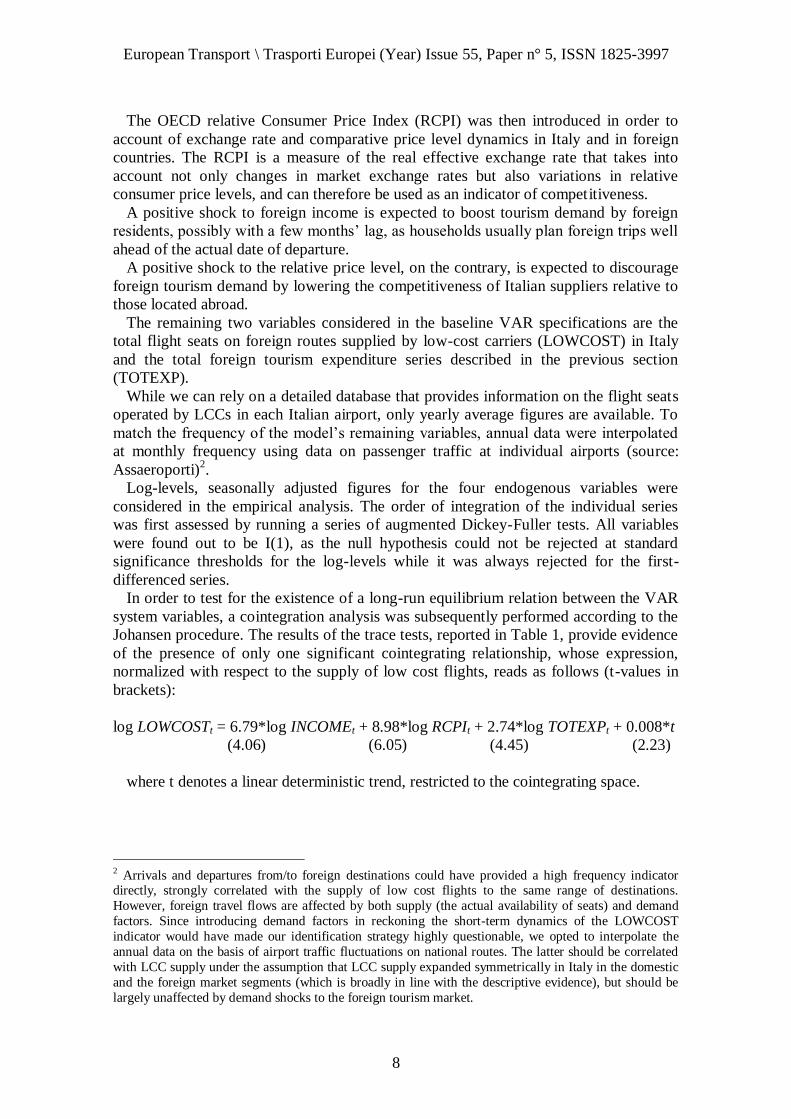
In order to test for the existence of a long-run equilibrium relation between the VAR
system variables, a cointegration analysis was subsequently performed according to the
Johansen procedure. The results of the trace tests, reported in Table 1, provide evidence
of the presence of only one significant cointegrating relationship, whose expression,
normalized with respect to the supply of low cost flights, reads as follows (t-values in
brackets):
log LOWCOSTt = 6.79*log INCOMEt + 8.98*log RCPIt + 2.74*log TOTEXPt + 0.008*t
(4.06) (6.05) (4.45) (2.23)
where t denotes a linear deterministic trend, restricted to the cointegrating space.
2 Arrivals and departures from/to foreign destinations could have provided a high frequency indicator directly, strongly correlated with the supply of low cost flights to the same range of destinations.
However, foreign travel flows are affected by both supply (the actual availability of seats) and demand
factors. Since introducing demand factors in reckoning the short-term dynamics of the LOWCOST
indicator would have made our identification strategy highly questionable, we opted to interpolate the
annual data on the basis of airport traffic fluctuations on national routes. The latter should be correlated
with LCC supply under the assumption that LCC supply expanded symmetrically in Italy in the domestic
and the foreign market segments (which is broadly in line with the descriptive evidence), but should be
largely unaffected by demand shocks to the foreign tourism market.

European Transport \ Trasporti Europei (Year) Issue 55, Paper n° 5, ISSN 1825-3997
9
Table 1: Unrestricted cointegration rank Test (Trace test).
No. of CE(s) Eigenvalue Statistic 5% Crit. Value P.value**
None * 0.240322 53.26026 47.85613 0.0143
At most 1 0.107654 21.37642 29.79707 0.3346
At most 2 0.041030 8.163892 15.49471 0.4480
At most 3 0.028081 3.304000 3.841466 0.0691 Trend assumption: Linear deterministic trend. Lags interval (in first
differences): 1 to 3.
* denotes rejection of the hypothesis at the 0.05 level.
**MacKinnon-Haug-Michelis (1999) p-values.
The normalized cointegrating relation can be interpreted as providing the long-run
equilibrium level between supply and demand of low cost travel services. Increased
income levels in countries of origin and higher foreign tourism expenditure flows are
expected to boost demand for international travel services and both are positively
correlated with the supply of low cost flights in the long-run equilibrium.
The sign of the equilibrium relationship between the low cost flight supply and
national price competitiveness cannot be univocally determined a priori. On the demand
side, higher relative prices should discourage inbound tourism but, at the same time,
they should also stimulate outbound flows. The overall impact on the level of low cost
travel flows will thus depend on which of these opposing forces prevails. On the supply
side, LCCs may be better equipped than standard carriers to compete in markets with an
overall higher price level. In this case a positive relation between the supply of low cost
flight seats and the relative CPI should be expected.
On the whole, our empirical estimates point to the existence of a positive and
significant long-run association between the LOWCOST and RCPI indicators.
Once the system variables have been found to be jointly cointegrated, the VAR model
can be better expressed in the corresponding vector error correction (VEC) form, which
(again omitting deterministic components) reads as
tptptttt XXXXX 1122111 ...
where
t
t
t
t
t
TOTEXP
LOWCOST
RCPI
INCOME
X
log
log
log
log
and where the where the matrix has rank =1.
Once the VEC model parameters have been estimated, the short and long-run
dynamic feedbacks across the endogenous variables can be uncovered by analyzing the
impulse response functions.
4.2 Identification.
As is well known, in order to permit a structural interpretation of dynamic impulse-
response coefficients, a proper identification scheme has to be introduced. By referring
to the large empirical VAR literature initiated by Sims (1980), we achieve identification
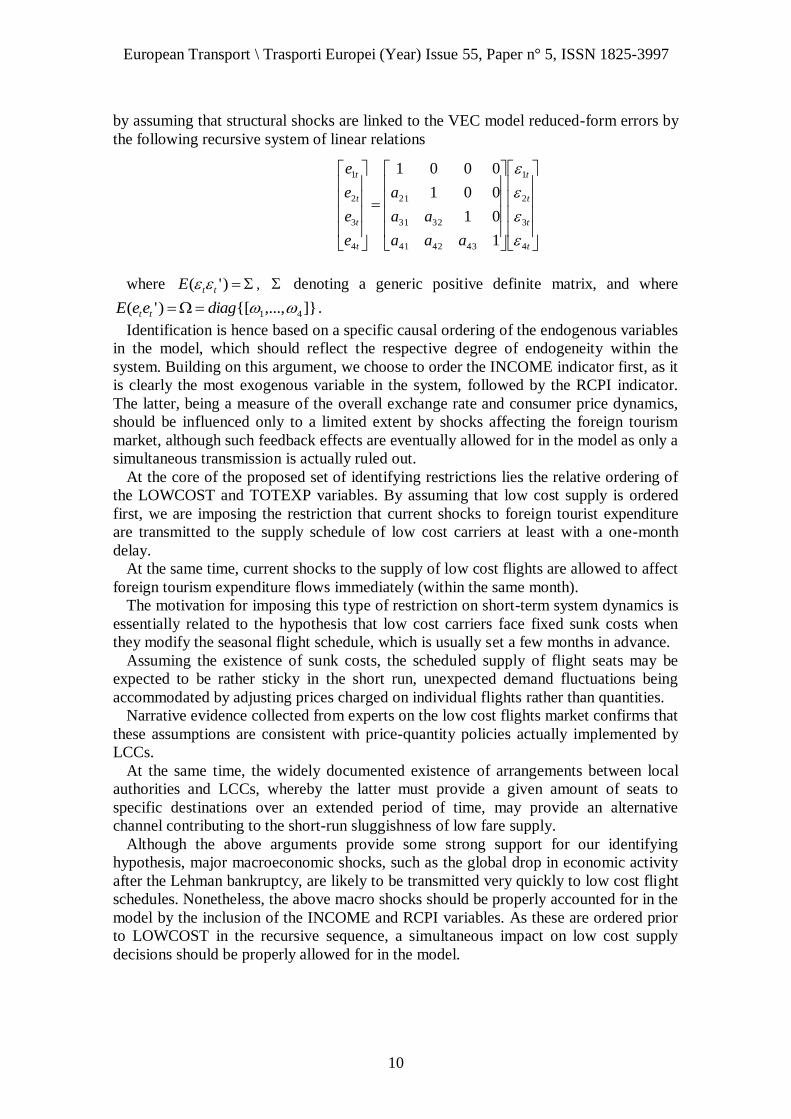
European Transport \ Trasporti Europei (Year) Issue 55, Paper n° 5, ISSN 1825-3997
10
by assuming that structural shocks are linked to the VEC model reduced-form errors by
the following recursive system of linear relations
t
t
t
t
t
t
t
t
aaa
aa
a
e
e
e
e
4
3
2
1
434241
3231
21
4
3
2
1
1
01
001
0001
where )'( ttE , denoting a generic positive definite matrix, and where
]},...,{[)'( 41 diageeE tt .
Identification is hence based on a specific causal ordering of the endogenous variables
in the model, which should reflect the respective degree of endogeneity within the
system. Building on this argument, we choose to order the INCOME indicator first, as it
is clearly the most exogenous variable in the system, followed by the RCPI indicator.
The latter, being a measure of the overall exchange rate and consumer price dynamics,
should be influenced only to a limited extent by shocks affecting the foreign tourism
market, although such feedback effects are eventually allowed for in the model as only a
simultaneous transmission is actually ruled out.
At the core of the proposed set of identifying restrictions lies the relative ordering of
the LOWCOST and TOTEXP variables. By assuming that low cost supply is ordered
first, we are imposing the restriction that current shocks to foreign tourist expenditure
are transmitted to the supply schedule of low cost carriers at least with a one-month
delay.
At the same time, current shocks to the supply of low cost flights are allowed to affect
foreign tourism expenditure flows immediately (within the same month).
The motivation for imposing this type of restriction on short-term system dynamics is
essentially related to the hypothesis that low cost carriers face fixed sunk costs when
they modify the seasonal flight schedule, which is usually set a few months in advance.
Assuming the existence of sunk costs, the scheduled supply of flight seats may be
expected to be rather sticky in the short run, unexpected demand fluctuations being
accommodated by adjusting prices charged on individual flights rather than quantities.
Narrative evidence collected from experts on the low cost flights market confirms that
these assumptions are consistent with price-quantity policies actually implemented by
LCCs.
At the same time, the widely documented existence of arrangements between local
authorities and LCCs, whereby the latter must provide a given amount of seats to
specific destinations over an extended period of time, may provide an alternative
channel contributing to the short-run sluggishness of low fare supply.
Although the above arguments provide some strong support for our identifying
hypothesis, major macroeconomic shocks, such as the global drop in economic activity
after the Lehman bankruptcy, are likely to be transmitted very quickly to low cost flight
schedules. Nonetheless, the above macro shocks should be properly accounted for in the
model by the inclusion of the INCOME and RCPI variables. As these are ordered prior
to LOWCOST in the recursive sequence, a simultaneous impact on low cost supply
decisions should be properly allowed for in the model.

European Transport \ Trasporti Europei (Year) Issue 55, Paper n° 5, ISSN 1825-3997
11
4.3 Impulse-response analysis.
The dynamic response of foreign tourists’ expenditure in Italy to a one standard
deviation shock respectively affecting one of the four structural disturbance terms
identified in the baseline VEC model is depicted in Figure 4.
The impulse-response evidence shows that an unexpected income shock induces a
transitory increase in foreign tourist expenditure, peaking about 9 months after the
shock. Quite surprisingly, the income effect is negative in the first few months. This can
occur if the short-term impact of income fluctuations on tourism demand is higher for
competing travel destinations than for Italy, inducing a temporary relocation of flows in
favour of rival destinations.
As expected, the response of foreign tourist expenditure to an increase in relative
consumer prices in Italy is negative and highly persistent over time.
Impulse = INCOME
Impulse = RCPI
Impulse = LOWCOST
Impulse = TOTEXP
Figure 4: Foreign tourist expenditure in Italy: Impulse-response functions from the
baseline VEC model.
An exogenous increase in LCC flight seat supply is found out to exert a positive long-
run influence on spending by foreign travellers. As expected, the impact is negligible in
the first few months following the low cost supply shock, as some time is required
before foreign consumers fully revise their tourism spending choices. The response
becomes positive and significant four months after the shock and stabilizes after about
one year.

European Transport \ Trasporti Europei (Year) Issue 55, Paper n° 5, ISSN 1825-3997
12
As usual, dynamic elasticity estimates, which allow for a more straightforward
interpretation compared to impulse responses, can be obtained by properly normalizing
the individual response coefficients (see, King and Watson, 1997, Kamps, 2005)3.
The VAR-based estimates of the elasticity of foreign tourism expenditure with respect
to LCC supply are equal to about 0.15 after 6 months and to 0.18 in the long run, when
all dynamic feedbacks (possibly involving an adjustment of national tourism industry
supply) have produced their effects.
Finally, the response of TOTEXP to the own shock shows that these disturbances
have mainly short-run effects on the dynamics of the series and should thus be expected
to capture the influence of mostly transitory factors that impact on the demand and
supply of tourism services and that are unrelated to the other structural disturbances
identified within the system.
While analysis of the behaviour of foreign tourist flows lies at the core of the present
study, the VEC model evidence can also be used to outline some interesting features of
the supply of low cost air transport services.
To this end, in Figure 5 we plot the response functions of the LOWCOST variable to
the individual VEC model shocks.
A positive income shift in countries of origin is found to result in a substantial
increase in LCC supply in the long run, confirming the evidence conveyed by the
cointegrating relationship.
However, there is also evidence of some stickiness in the short-term response of LCC
supply to global business cycle fluctuations, as it takes about half a year for the supply
of low cost seats to adjust to the new long-run level. Since no a priori restrictions are
placed on the LCC response to macro shocks, the above evidence of sluggishness in the
response provides some empirical support for the assumption that LCC face non-
negligible adjustment costs when they are forced to modify the seasonal flight schedule.
A similar pattern of adjustment is also observed in the case of shocks to relative
consumer prices. In line with the evidence provided by the cointegrating relationship, a
positive shock to the RCPI leads to a higher level of low cost travel supply in the long
run.
The sign of the response of LOWCOST to an identified shock affecting foreign tourist
expenditure is negative in the long-run, although it is only barely significant in
statistical terms. The negative response is in contrast with the positive long-run
elasticity evidenced by the cointegrating relationship (although the latter does not admit
a causal interpretation).
Total tourist expenditure is the product of the number of arrivals and per capita
expenditure. A positive shock to arrivals can be reasonably expected to always induce a
response of the same sign of LCC supply, as it signals an increase in demand for travel
services. On the other hand, a negative response is conceivable when unforeseen shocks
affect per capita expenditure. Under the assumption that tourists on a low budget tend to
prefer low cost travel suppliers, a persistent decline in per capita expenditure may be
interpreted by LCCs as providing evidence of a favourable composition effect
3 The impulse responses are normalized by dividing them for the responses of the shock variable at the
same time horizon. VAR-based elasticities computed according to this procedure, unlike ordinary
regression estimates, capture all the dynamic feedback between the full set of variables in the system and
can thus be viewed as the empirical counterpart of the general equilibrium effects typically considered in
theoretical models.

European Transport \ Trasporti Europei (Year) Issue 55, Paper n° 5, ISSN 1825-3997
13
influencing travel demand, thus triggering an expansion of LCC supply. Some empirical
evidence on this hypothesis is presented in the next section.
Impulse = INCOME
Impulse = RCPI
Impulse = LOWCOST
Impulse = TOTEXP
Figure 5: LCC seats supply from Italy to foreign destinations: Impulse-response
functions from the baseline VEC model.
The response of LCC supply to the own structural shock displays a strong persistence
of effects over time. This pattern can be interpreted as evidence that strategic choices
regarding low cost flight supply, for instance, the decision to start operating from a
given airport, tend to be maintained over rather long periods of time (which appears to
be consistent with the narrative evidence).
5. Empirical findings: the baseline model
While total foreign tourist expenditure clearly represents the key variable for
macroeconomic analysis and may arguably qualify as the relevant target for policy
decisions regarding the possible subsidization of local LCC supply, tourist arrival flows
are clearly more directly related to the supply of travel services by LCCs.
In order to gain more insights into the impact of the surge in low fare travel on the
Italian tourism market we proceeded to estimate an extended VEC model where the logs
of total foreign arrivals (ARRIVALS) and per capita real expenditure (PCEXP) replace
total foreign tourist expenditure (TOTEXP).
The Johansen trace test again provides evidence of the existence of a single
cointegrating vector. A VEC model was accordingly selected.
Consistently with our baseline approach, the two new variables are ordered last in the
VEC model. However, to identify separate structural shocks for arrivals and individual
expenditures some a priori ordering of the two variables must be introduced. In this

European Transport \ Trasporti Europei (Year) Issue 55, Paper n° 5, ISSN 1825-3997
14
case, ordering ARRIVALS prior to PCEXP amounts to assuming that foreign travellers
first choose their destination and subsequently set the length of their stay and the level
of daily expenditure according to their budget constraint.
Impulse = INCOME
Response = ARRIVALS
Response = PCEXP
Impulse = RCPI
Response = ARRIVALS
Response = PCEXP
Impulse = LOWCOST
Response = ARRIVALS
Response = PCEXP
Figure 6: Impulse-response functions from the extended VEC model.
On the contrary, if one assumes that consumers first set their individual expenditure
allocated to tourism services and subsequently choose their destination according to
preferences and relative market prices, PCEXP should be ordered prior to ARRIVALS.
As we have no strong a priori motivations in favour of one of the hypotheses,
whenever the relative ordering of the two variables is relevant we report empirical
findings obtained under both recursive orderings in order to outline common patterns
(see Figure 7).
The impulse responses of foreign arrivals and average individual expenditure for the
three main structural shocks in the extended VEC model are shown in Figure 6.

European Transport \ Trasporti Europei (Year) Issue 55, Paper n° 5, ISSN 1825-3997
15
In line with expectations, a positive shock to GDP in foreign countries is found to
induce a positive response of arrivals. However, it takes a few months for the income
shock to fully display its effects, dynamic responses peaking about 9 months after the
shock and subsequently stabilizing.
A different pattern is observed for the PCEXP response, which is always negative,
although it is only significant in the first few months.
The different findings for the two response functions can be reconciled under the
assumption that foreign customers who adjust more quickly their prior choices after an
income shock are characterized by below average per capita expenditure. In this case, as
all potential customers progressively adjust their tourism demand to the new income
level, individual tourist expenditure will tend to revert to the population mean, causing a
progressive fading of the negative short term impact.
The impact of an increase in relative consumer prices is negative for both arrivals and
individual expenditure and is highly persistent over time.
While a positive shock to LOWCOST can be expected to exert a positive influence on
foreign arrivals, as it reduces transport costs, the sign of the impact on per capita
expenditure cannot be univocally set a priori. A reduction in air fares entails a positive
income effect that should result, ceteris paribus, in higher per capita expenditure. At the
same time, lower air fares may make a foreign journey affordable for less wealthy
consumers, thus potentially introducing an adverse selection effect, which could lower
per capita expenditure levels after the shock.
The empirical evidence conveyed by IR functions confirms a substantial positive
effect of the LOWCOST shock on arrivals, although it takes a few months for the shock
to be fully passed through. The dynamic elasticity of ARRIVALS to a LOWCOST
structural shock is sizeable, amounting to 0.10 at a six-months horizon and to 0.12 in the
long-run.
As expected, a more complex pattern is found in the case of per capita expenditure.
The response to a positive LCC supply shock is estimated to be negative and significant
in the first three months, although it subsequently picks up and becomes positive and
persistent in the long run. On the basis of the above discussion, this pattern can be
interpreted as evidence that adverse selection effects are predominant in the short-run,
while income effects dominate in the longer run. As already discussed in the case of an
income shock, foreign tourists who more quickly adjust demand after a LOWCOST
shock appear to be marked by lower expenditure levels per trip, possibly because they
opt for shorter vacations. As all potential foreign customers revise their tourism choices
over time, the negative composition effect is gradually eliminated, allowing the income
effect to stand out neatly.
The elasticity of per capita expenditure to LOWCOST is sizeable, although it is much
smaller than that of arrivals (respectively 0.04 and 0.06 after six months and in the long-
run).
The sum of the long-run elasticities of arrivals and per capita expenditure (0.18) turns
out to be very close to our baseline estimate of the long-run elasticity of total foreign
expenditure. Overall, about two thirds of the persistent influence of an LCC supply
shock on incoming travellers’ expenditure can be related to the impact on arrivals and
the remaining third to higher average individual expenditure after the shock.
In the baseline model a negative feedback from foreign tourism expenditure to LCC
supply was found. To better qualify this occurrence we plot the response of LOWCOST
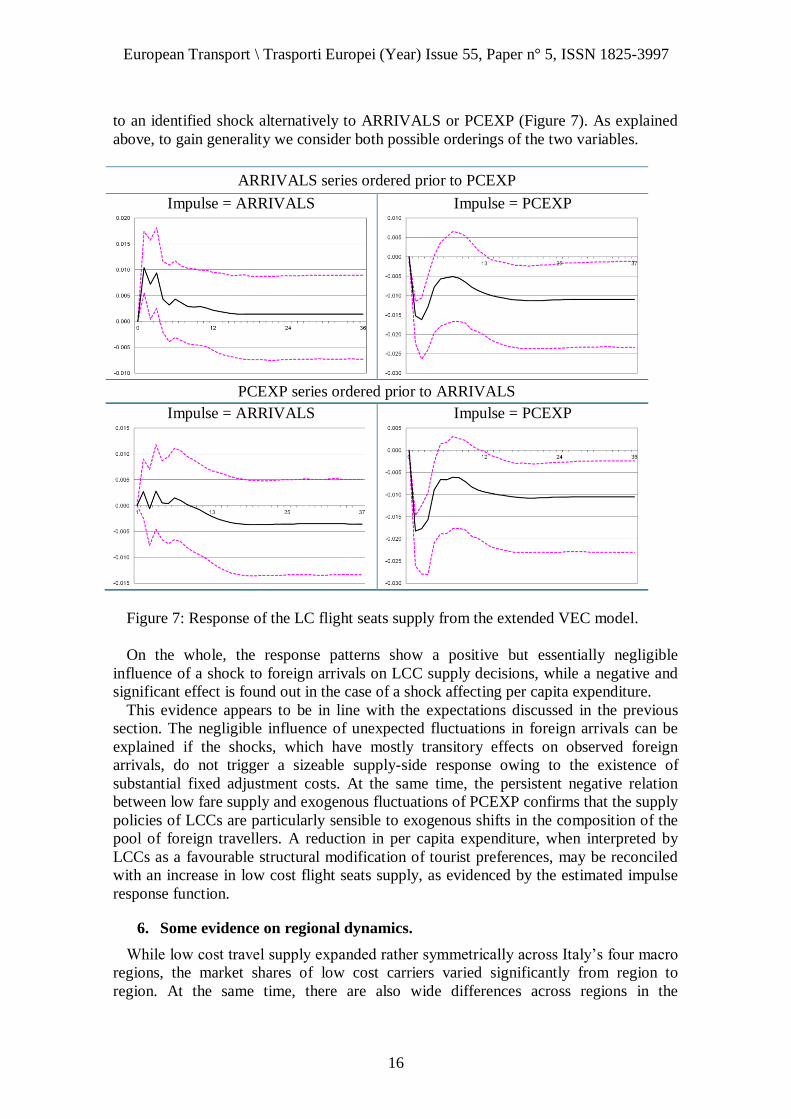
European Transport \ Trasporti Europei (Year) Issue 55, Paper n° 5, ISSN 1825-3997
16
to an identified shock alternatively to ARRIVALS or PCEXP (Figure 7). As explained
above, to gain generality we consider both possible orderings of the two variables.
ARRIVALS series ordered prior to PCEXP
Impulse = ARRIVALS
Impulse = PCEXP
PCEXP series ordered prior to ARRIVALS
Impulse = ARRIVALS
Impulse = PCEXP
Figure 7: Response of the LC flight seats supply from the extended VEC model.
On the whole, the response patterns show a positive but essentially negligible
influence of a shock to foreign arrivals on LCC supply decisions, while a negative and
significant effect is found out in the case of a shock affecting per capita expenditure.
This evidence appears to be in line with the expectations discussed in the previous
section. The negligible influence of unexpected fluctuations in foreign arrivals can be
explained if the shocks, which have mostly transitory effects on observed foreign
arrivals, do not trigger a sizeable supply-side response owing to the existence of
substantial fixed adjustment costs. At the same time, the persistent negative relation
between low fare supply and exogenous fluctuations of PCEXP confirms that the supply
policies of LCCs are particularly sensible to exogenous shifts in the composition of the
pool of foreign travellers. A reduction in per capita expenditure, when interpreted by
LCCs as a favourable structural modification of tourist preferences, may be reconciled
with an increase in low cost flight seats supply, as evidenced by the estimated impulse
response function.
6. Some evidence on regional dynamics.
While low cost travel supply expanded rather symmetrically across Italy’s four macro
regions, the market shares of low cost carriers varied significantly from region to
region. At the same time, there are also wide differences across regions in the

European Transport \ Trasporti Europei (Year) Issue 55, Paper n° 5, ISSN 1825-3997
17
underlying structural features of the tourism market in terms of specialization in given
market segments, range of services supplied, penetration of international markets and
distance from the main countries of origin. Together, these differences can determine a
possibly highly heterogeneous impact of local low cost supply shocks, which is worth
investigating
In order to get some empirical evidence on regional effects of the low cost travel
industry, we first proceeded to estimate the baseline VEC model individually for each of
the four macro regions.
North-West
North-East
Centre
South and Islands
Figure 8: Regional responses of total foreign tourist expenditure to a 1 s.d. shock to
local LC foreign flight seats supply.
The LOWCOST supply series considered in the estimation were obtained by pooling
data on the low fare flights operated at all the airports within each area.
In reporting the estimates we focus on the impact of low cost travel supply on local
foreign tourism markets.
The impulse responses showing the dynamic effects of a one standard deviation
positive shock to LOWCOST on the level of foreign tourist expenditure within the area
are reported in Figure 8. The long-run response is positive and significant in all areas.
The response tends to accumulate over time and is generally non-significant in the first
months after the shock, except for the South, where a strong response is also observed
in the short-run.
Elasticity figures, by properly normalizing the regional impulse-response coefficients,
allow for a direct comparison of the size of the LCC effect across areas.
Dynamic elasticities are reported in panel (a) of Table 2. On the whole, elasticity
estimates for the North-West and the Centre are rather close to those previously
obtained at the national level. Those for the North-East lie substantially below the

European Transport \ Trasporti Europei (Year) Issue 55, Paper n° 5, ISSN 1825-3997
18
national average at all time horizons, while for the South they are far above the national
level.
These findings confirm the expectations that structural differences in the regional
tourism markets may imply heterogeneous effects of the expansion of low cost travel.
More insights on the possible sources of these asymmetries can be gained by
separating the LCC influence on tourist arrivals and on individual expenditures, by
estimating the extended VEC model discussed in Section 4 on regional data. In doing so
we are aware that, given the sample design of the survey, detailed monthly data on
arrivals and expenditures at the regional level may not always be accurate enough for
precise parameter estimation. Consequently some caution is required when interpreting
empirical estimates.
Response functions for arrivals and per capita expenditure are given in Figures 9 and
10 respectively. The response patterns show a substantial positive impact of LOWCOST
shock on arrivals in all areas except the South, where estimated responses only show
some impact in the short-run, albeit rather imprecisely measured.
Dynamic elasticities, reported in panel (b) of Table 2, show that, in contrast with total
tourist expenditure, the highest values are attained in the North-East (0.2, substantially
above the national average). Elasticity of arrivals is in line with national average in the
North-West and the Centre, while it is particularly low in the South.
The picture is more varied when we consider the responses of per capita expenditure.
In the case of the Centre, the pattern of dynamic responses rather closely matches the
one already documented in Section 4 for Italy as a whole and thus could be explained
using the same arguments.
North-West
-0.015
-0.01
-0.005
0
0.005
0.01
0.015
0.02
0.025
0.03
0 12 24 36
North-East
-0.005
0
0.005
0.01
0.015
0.02
0.025
0.03
0 12 24 36
Centre
-0.005
0
0.005
0.01
0.015
0.02
0.025
0.03
0 12 24 36
South and Islands
-0.02
-0.01
0
0.01
0.02
0.03
0.04
0 12 24 36
Figure 9: Regional responses of foreign arrivals to a 1 s.d. shock to local LC foreign
flight seats supply.

European Transport \ Trasporti Europei (Year) Issue 55, Paper n° 5, ISSN 1825-3997
19
A different pattern is found for regional VEC estimates in the case of the North-West
and North-East. In both areas per capita tourist expenditure decreases after an
exogenous shock to the local low fare supply and the effect is highly persistent over
time. This evidence could be consistent with the hypothesis of adverse composition
effects reshaping local tourism demand after the expansion of low cost flight seats
supply. Other microeconomic factors, such as individual time and cost constraints or a
change in consumer preferences, could equally contribute to the reduction in tourism
expenditure (see, for example, Stabler et al., 2010). However, according to the result of
the VAR approach, although LCCs are found to boost foreign tourist arrivals in both
northern areas, the opportunity of low fare travels appealed primarily to customers who
opted for an overall less costly tourism package.
An opposite picture is found for South. In this case, while there is almost no impact
on arrivals, the low cost shocks exert a strong positive influence on per capita
expenditure. This may reflect the operation of a strong income effect. In the case of the
South, which also includes the two major islands (Sicily and Sardinia), a travel time
effect may also be at work. Low fare travel supply in these areas may well have
displaced not only traditional high fare flight operators but also other modes of transport
(train and ferry) which are not only costlier but also more time-consuming.
North-West
-0.045
-0.040
-0.035
-0.030
-0.025
-0.020
-0.015
-0.010
-0.005
0.000
0 12 24 36
North-East
-0.040
-0.035
-0.030
-0.025
-0.020
-0.015
-0.010
-0.005
0.000
0.005
0 12 24 36
Centre
-0.030
-0.025
-0.020
-0.015
-0.010
-0.005
0.000
0.005
0.010
0.015
0.020
0.025
0 12 24 36
South and Islands
-0.010
-0.005
0.000
0.005
0.010
0.015
0.020
0.025
0.030
0.035
0 12 24 36
Figure 10: Regional responses of per capita tourist expenditure to a 1 s.d. shock to
local LC foreign flight seats supply.
By substantially reducing their travel time to southern destinations, foreign tourists
may have been able to devote more time to the actual vacation period, which in turn
could have caused part of the observed increase in individual tourism expenditure after
the expansion of LCCs in the area.
Dynamic elasticity estimates derived from the above impulse-responses are displayed
in the panel (c) of Table 2.

European Transport \ Trasporti Europei (Year) Issue 55, Paper n° 5, ISSN 1825-3997
20
A particularly high and positive elasticity is obtained for the South. The estimate is
close to the corresponding national value in the case of the Centre. A much larger
negative elasticity is estimated for the North-East than for the North-West (-0.11 and -
0.05, respectively), which reconciles the high elasticity of arrivals with an overall
moderate elasticity of total foreign expenditure in the North.
Table 2: VAR-based elasticity estimates for the four macro regions.
Time horizon
6 months 12 months 36 months
a) Total foreign tourist expenditure
North-West 0.17 0.23 0.18
North-East 0.08 0.06 0.06 Centre 0.16 0.22 0.20
South and Islands 0.14 0.33 0.33
Italy 0.15 0.22 0.18
b) Total foreign arrivals
North-West 0.14 0.13 0.13 North-East 0.20 0.19 0.20
Centre 0.10 0.14 0.14
South and Islands -0.26 0.03 0.06
Italy 0.10 0.13 0.12
c) Per capita tourist expenditure
North-West -0.05 -0.05 -0.05
North-East -0.09 -0.11 -0.11
Centre 0.07 0.10 0.08
South and Islands 0.14 0.31 0.31
Italy 0.04 0.08 0.06
Finally, a comparison of the elasticity estimates obtained at the regional and national
levels may yield some preliminary evidence on the scope of spatial externalities in the
low cost travel market.
When a low cost flight is initially operated from a given airport, the increased local
supply of travel services, apart from directly influencing local tourist demand, may
indirectly affect the demand for tourist services in other regions. These externalities, or
spillovers, may be positive or negative.
Positive spatial spillover effects essentially derive from the possibility that foreign
travellers may take the opportunity of new low cost flights to arrive in Italy but then use
internal means of transport to reach a different final destination within Italy. Negative
spillover effects may be recorded when the increased local supply of travel services
attracts new travellers to the area by diverting them from other destinations.
When positive spillovers prevail, a higher elasticity of foreign tourism to LCC supply
should obtain when the model is estimated at the national compared to the regional
level. The opposite holds in the case of negative spatial externalities.
When we aggregate the long-run regional elasticities estimated from the baseline
VEC specifications, weighting individual estimates by the average regional shares of the
foreign tourism market, we obtain an aggregate value of 0.17. This estimate matches
quite closely the elasticity yielded by the national VEC model (0.18) and may be taken
European Transport \ Trasporti Europei (Year) Issue 55, Paper n° 5, ISSN 1825-3997
21
as evidence that, at least at the level of four macro regions, spillovers are essentially
negligible, possibly because positive and negative externalities tend to offset each other.
Naturally, when spillovers are highly localized in space their effects should be
observed on a finer spatial scale than the one we use here. However, providing such
detailed spatial estimates goes beyond the scope of this paper.
7. Summary and conclusions.
In this paper we address the impact of the expansion of LCC industry on the foreign
tourism market in Italy.
The assembly of a specific high-frequency data set permitted the implementation of
standard multivariate time series analysis techniques in order to identify and estimate
the impact of low cost travel supply on foreign tourism to Italy.
By controlling for the major factors influencing international tourist demand and
travel services supply (namely income and relative price dynamics), we were able to
identify exogenous shifts of the low cost supply schedule under reasonably mild a priori
restrictions. These require that the supply of low cost seats is essentially sticky in the
short-run, while it can fully adjust to unforeseen foreign tourism market demand and
supply fluctuations in the long-run. The low cost supply is thus treated as an
endogenous variable in the long-run, a condition that allowed us to single out some
interesting dynamic feedback effects from foreign tourist inflows to low cost travel
supply decisions.
The analysis was conducted first on data aggregated at the national level. We found
evidence of the existence of a single cointegrating vector, which can be interpreted as a
relation equating demand and supply of low cost travel services in the long run.
In line with expectations, a strong and positive impact of low cost supply shocks on
foreign tourist expenditure in Italy is obtained on the basis of VEC models estimates.
An exogenous shift doubling the national supply of low cost flights to foreign
destinations is estimated eventually to induce an 18 per cent increase in real expenditure
by foreign tourists. The initial impact of the low cost shock is essentially negligible, as
most foreign travellers require some time to adjust their planned tourism decisions.
However, dynamic responses pick up rather quickly and the new long-run equilibrium
level of foreign tourist demand is attained about one year after the shock.
Quite surprisingly, an unforeseen shock to foreign tourist expenditure is found to
induce a negative response of low cost carriers’ supply-side decisions. By fitting an
extended VEC model in which total foreign expenditure is related to its foreign arrivals
and per capita expenditure components, we shed some light on this apparently puzzling
behaviour, while discovering other interesting aspects of the range of complex
influences exerted by low cost travel supply shocks on foreign tourist demand.
While a drop in flight prices can be expected in all cases to drive an increase in
foreign visitors, the impact on average individual expenditure may be non-trivial.
Both positive and negative effects may actually be expected. A positive income effect
may operate through the reduction in air fares, which should boost tourist expenditure
by relaxing the consumer budget constraint. Similarly, when consumers face a time
constraint, by substituting low cost flights for alternative but much slower modes of
travel they may be able to spend more time on the actual vacation, with an overall
positive influence on tourist receipts.
Negative effects on per capita tourist expenditure, on the contrary, may be observed if
the introduction of low cost travel services causes an adverse selection effect, which

European Transport \ Trasporti Europei (Year) Issue 55, Paper n° 5, ISSN 1825-3997
22
alters the composition of the pool of incoming foreign tourists in favour of customers
with lower budgets.
Based on the extended model estimation results, positive LCC effects are found in the
long run both for arrivals and for individual expenditure, respectively explaining about
two thirds and one third of the long-run elasticity of foreign tourist expenditure to low
cost travel supply in Italy.
In line with expectations, no evidence of negative feedbacks from foreign arrivals to
low cost supply is found out. A negative response was observed, however, in the case of
a shock to per capita expenditure levels. It can be explained on the basis of an
underlying structural complementarity between low budget tourist flows and low cost
airlines.
In order to uncover possibly heterogeneous patterns across Italy, the baseline and
extended VEC model estimation was replicated for the four Italian macro regions. A
positive long-run elasticity of total foreign tourist expenditure was found out for all
regions, with noticeable heterogeneity in the case of the North-East and South,
essentially related to the different sign of the response of individual tourist expenditure
to low cost supply shocks. On average, a substantially negative elasticity is estimated
for the North-East and, to a lesser extent, for the North-West, pointing to the possible
existence of adverse selection effects. A positive elasticity is estimated in the case of
Centre and, to a much larger extent, the South, which can be related to strong
income/time effects fostering tourist demand in these areas.
When individual regional elasticity estimates are aggregated they match the
corresponding national estimate quite closely, apparently ruling out the existence of
strong spatial externalities across the four macro regions. Of course, this preliminary
evidence has to be better qualified and we leave these refinements to future research.
Numerous local authorities have been reported to be subsidizing low cost carriers in
order to have them increase the local flight seats supply. Our empirical estimates
suggest that focusing on arrival statistics may provide only a partial view of policy
outcomes, since we also found strong effects of low cost supply shocks on per capita
foreign tourist expenditure, which may enhance or depress the direct effect on arrivals.

European Transport \ Trasporti Europei (Year) Issue 55, Paper n° 5, ISSN 1825-3997
23
STATISTICAL APPENDIX
Table a1: International tourism expenditure in Italy by country of origin (percentages).
2004 2005 2006 2007 2008 2009
EU 27 76.6 77.1 71.4 74.6 79.9 73.4
EU 15 71.4 68.9 69.4 72.1 74.8 69.6
France 10.2 6.0 7.7 6.2 10.4 10.3
Germany 21.4 30.9 28.1 13.9 29.6 21.4
United Kingdom 17.1 18.3 15.4 30.1 17.8 12.8
Other EU Countries 5.2 8.2 2.0 2.5 5.1 3.9
Extra EU 11.1 14.3 17.6 16.9 10.5 20.9
North America 9.3 5.0 7.4 5.8 3.9 4.0
United States 8.9 4.2 6.7 5.7 3.4 2.8
South and Central America 0.3 1.3 0.9 0.8 1.0 0.3
Asia 1.0 0.4 1.3 1.2 0.8 0.9
Africa 1.0 1.0 0.3 0.7 1.3 0.3
Oceania 0.7 1.0 1.1 0.0 2.6 0.2
Total 100.0 100.0 100.0 100.0 100.0 100.0
Source: Bank of Italy, International Inbound Tourism Survey.
Table a2: International tourism expenditure in Italy (index, 1999=100).
1999 2004 2009
North-West 100 97.0 97.1
North-East 100 88.4 69.5
Centre 100 70.9 72.0
South and Islands 100 118.5 100.3
Italy 100 89.2 80.7
Source: Bank of Italy, International Inbound Tourism Survey.

European Transport \ Trasporti Europei (Year) Issue 55, Paper n° 5, ISSN 1825-3997
24
Table a3: International tourist arrivals in Italy (index, 1999=100).
1999 2004 2009
North-West 100 82.8 106.1
North-East 100 94.6 107.0
Centre 100 96.1 115.7
South and Islands 100 134.3 143.1
Italy 100 97.6 116.3
Source: Bank of Italy, International Inbound Tourism Survey.
Table a4: Average length of journey: foreign tourists in Italy (index, 1999=100).
1999 2004 2009
North-West 100 131.6 111.1
North-East 100 101.9 76.4
Centre 100 85.8 76.6
South and Islands 100 83.8 74.1
Italy 100 100.3 81.6
Source: Bank of Italy, International Inbound Tourism Survey.
Table a5: Daily per capita expenditure: foreign tourists in Italy (index, 1999=100).
1999 2004 2009
North-West 100 89.0 82.4
North-East 100 91.7 85.0
Centre 100 86.0 81.2
South and Islands 100 105.3 94.5
Italy 100 91.1 85.0
Source: Bank of Italy, International Inbound Tourism Survey.

European Transport \ Trasporti Europei (Year) Issue 55, Paper n° 5, ISSN 1825-3997
25
References
Alderighi M., Baccelli O. (2006), “Il rapporto fra vettori ed aeroporti: analisi e
valutazione del sistema di regolazione in Italia”, VIII Scientific Conference SIET
(Società Italiana degli Economisti dei Trasporti), Trieste.
Barbot C. (2006), “Low-Cost Carriers, secondary airports and state aid: an economic
assessment of the Charleroi affair”, Journal of Air Transport Management, Vol. 12,
Issue 4, July 2006.
Berry S., Jia P. (2010), “Tracing the woes: an empirical analysis of the airline industry”,
American Economic Journal, 2, 1-43, August.
Bieger T., Wittmer A. (2006), “Air transport and tourism – Perspective and challenges
for destinations, airlines and governments”, Journal of Air Transport Management, n.
12.
Campisi D., Costa, R., Mancuso, P. (2010), “The effects of low cost airlines growth in
Italy”, Modern Economy, August.
Carlucci F., Cirà A. (2009), “Compagnie aeree low cost, competitività dei sistemi
aeroportuali e ricadute sui territori locali”, Working Paper, XI Scientific Conference
SIET, Trieste.
Cepolina S., Parola F. (2008), “L’evoluzione dei vettori low-cost nei principali mercati
europei”, Working Paper, X Scientific Conference SIET, Sassari.
Chow G.C., Lin A. (1971), “Best Linear Unbiased Interpolation, Distribution and
Extrapolation of Time Series by Related Series”, Review of Economics and Statistics,
vol. 53, pp. 372-375
Cour des Comptes (2008), « Les aéroports français face aux mutations du transport
aérien », http://www.ccomptes.fr/fr/CC/documents/RPT/RPT-Aeroports.pdf.
De Mello M., Nell K.S. (2001), “The forecasting ability of a cointegrated VAR demand
system with endogenous vs. exogenous expenditure variable”, University of Porto,
Working Paper n. 109, July.
De Neufville R. (2007), “Low-cost airports for low-cost airlines: flexible design to
manage the risks”, Journal of Transportation Planning and Technology.
Di Giacinto V., Micucci G., Montanaro P. (2010), “Dynamic macroeconomic effects of
Public capital: evidence from regional Italian data”, Giornale degli Economisti e
Annali di Economia, Vol. 69 No. 1, pp. 29-66.
Graham A. (2013), “Understanding the low cost carrier and airport relationship: A
critical analysis of the salient issues”, Tourism Management, Vol. 36, pp. 66-76.
Hahn B. (2006), “Billigfluglinien - Eine umweltwissen-schaftliche Betrachtung,”
Wuppertal Papers, n. 159, July.
Kamps C. (2005), “The Dynamic Effects of Public Capital: VAR Evidence for 22
OECD Countries”, International Tax and Public Finance, Vol. 12, pp. 533-58.
King R.G., Watson M.W., (1997), “Testing Long-Run Neutrality”, Federal Reserve
Bank of Richmond Economic Quarterly, Vol. 83(3), 69-101.
KPMG (2011), “Evoluzione del traffico low cost a livello europeo e nazionale”,
http://www.enac.gov.it/La_Comunicazione/Pubblicazioni/info-170143071.html.
Lin E., Mak B., Wong K. (2013), “The business relationships between LCCs and
airports in Southeast Asia: Influence of power imbalance and mutual dependence”,
Transportation Research Part A, Vol. 50, pp. 33-46.
Pereira A.M., (2001), “Public Investment and Private Sector Performance –
International Evidence”, Public Finance & Management, Vol. 1, No. 2, pp. 261-77.

European Transport \ Trasporti Europei (Year) Issue 55, Paper n° 5, ISSN 1825-3997
26
Percoco M. (2009), “Airport activity and local development: evidence from Italy”,
Urban Studies, July.
Piga C., Bachis E. (2006), “Pricing strategies by European traditional and low cost
airlines: or, when is it the best time to book on line?”, Loughborough University,
Discussion Paper n. 14.
Sims, C. (1980), “Macroeconomics and reality”, Econometrica, 48, 1-48.
Song H., Li G. (2008), “Tourism demand modelling and forecasting – A review of
recent research”, Tourism Management, 29, 203-220.
Song, H., Witt, S.F. (2006), “Forecasting international tourist flows to Macau”, Tourism
Management, 27 (2), 214-224.
Stabler M.J., Papatheodorou A., Sinclair M.T. (2010), The Economics of Tourism,
Routledge.
Vera Rebollo J.F., Ivars Baidal, J.A. (2009), “The spread of Low-cost Carriers: tourism
and regional policy effects in Spain”, Regional Studies, 43 (04), 559-570
Williams A.M., Balaz V. (2009), “Low-Cost Carriers, economies of flows and regional
externalities”, Regional Studies, Vol. 43.5, pp. 677-691, June 2009.
Witt S.F., Witt C.A. (1995), “Forecasting tourism demand: a review of empirical
research”, International Journal of Forecasting, 11, 447-475
Wong, K.K.F., Song, H. and Chon, K. (2006), “Bayesian models for tourism demand
forecasting”, Tourism Management, 27 (5), 773-780.
Wong K.K.F., Song H., Witt S.F., Wu D.C. (2007), “Tourism forecasting: to combine
or not to combine?”, Tourism Management, 28, 1068-1078.