Low Carbon Cements: The Challenges and …cement.mineralproducts.org/documents/future_cement...Low...
30
Low Carbon Cements: The Challenges and Opportunities First Global Future Cement Conference 2011 First Global Future Cement Conference 2011 8 February 2011 Dr Pal Chana Executive Director Mineral Products Association
Transcript of Low Carbon Cements: The Challenges and …cement.mineralproducts.org/documents/future_cement...Low...

Low Carbon Cements: The Challenges and Opportunities
First Global Future Cement Conference 2011First Global Future Cement Conference 2011
8 February 2011
Dr Pal Chana
Executive Director
Mineral Products Association

The Big Picture
Tackling the CO2 challenge
Summary
Tackling the CO2 challenge
Low Carbon Cements
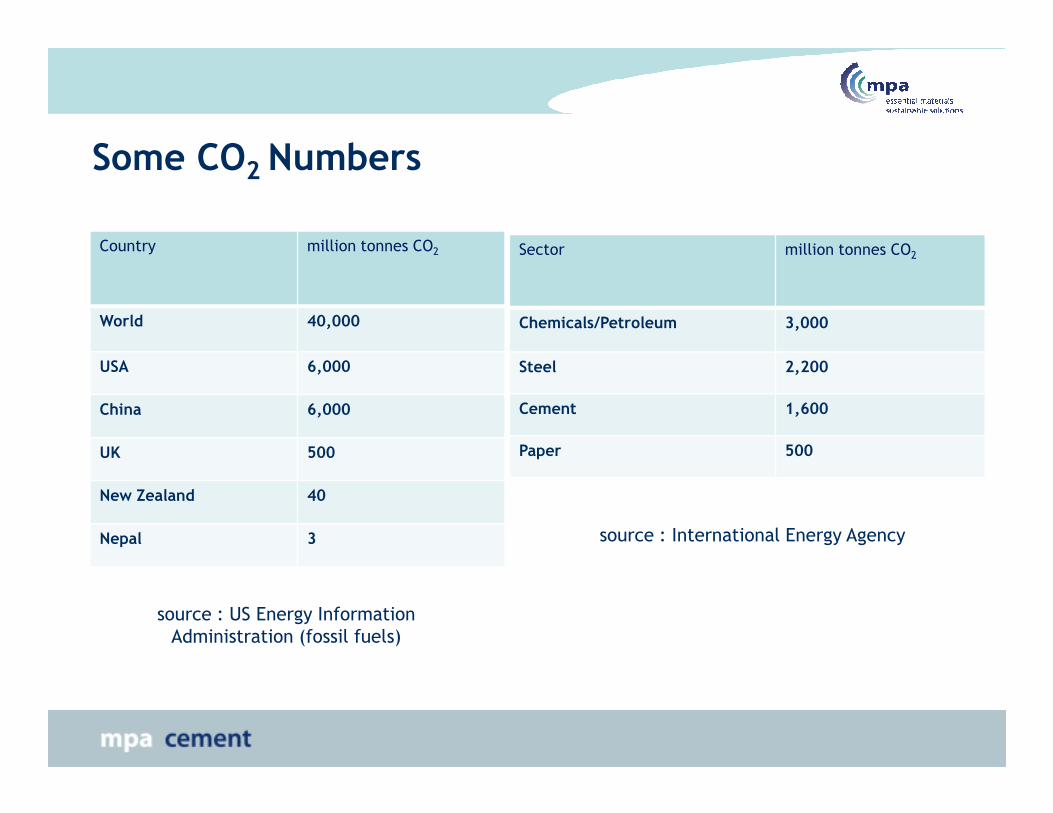
Some CO2 Numbers
Country million tonnes CO2
World 40,000
USA 6,000
China 6,000
Sector million tonnes CO2
Chemicals/Petroleum 3,000
Steel 2,200
Cement 1,600 China 6,000
UK 500
New Zealand 40
Nepal 3
Cement 1,600
Paper 500
source : International Energy Agency
source : US Energy Information
Administration (fossil fuels)
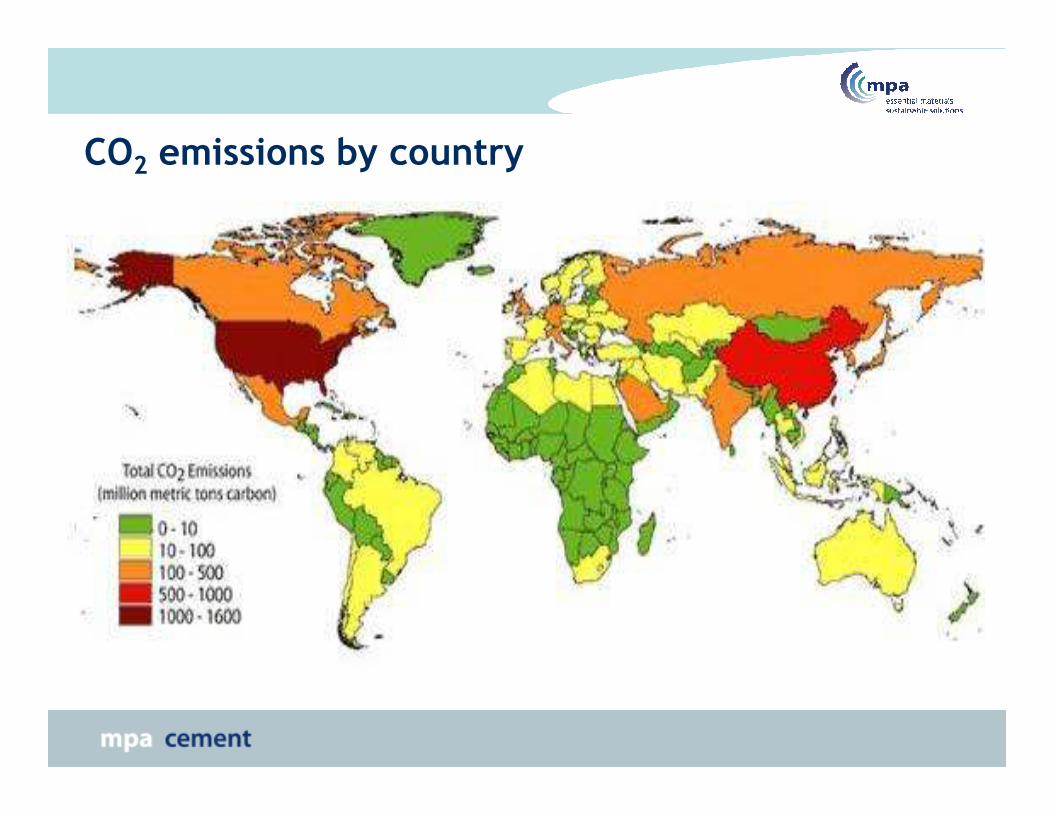
CO2 emissions by country

World cement production in 2009

Imperatives to Reduce CO2
• Climate Change
• Cost Reduction/Avoidance
• Future Scarcity of Fossil Fuels• Future Scarcity of Fossil Fuels
• Taxes & Legislation
• Expectations of customers, investors and employees

But this is the real imperative!

WBCSD:CSI- 24 member companies, 100 countries

WBCSD: Communication Partners

Direct CO2 emissions - clinker
Carbon Dioxide Emission from Clinker Production
50%
60%
70%
80%
90%
100%
Percentage
0%
10%
20%
30%
40%
50%
Percentage
Calcination (Process)
CO2 %
61
Combustion (Fuel) CO2
%
39

Levers to reduce CO2 emissions in
cement clinker production
•Clinker substitution
•Energy efficiency
•Alternative fuels / biomass
•Carbon capture and storage

IEA Roadmap – Portfolio of CO2 Abatement Measures

Good progress to date
1990 2000 2005 2006 2007 2008
Net CO2 / tonne clinker, kg/tonne 907 863 847 843 842 838
Net CO2 / tonne cementitious,
kg/tonne
754 712 672 662 656 646
kg/tonne
Heat Consumption,
MJ/tonne clinker
4266 3763 3686 3666 3676 3657
% Alternative fuel 2.7 6.2 9.4 9.7 10.3 11.0
Clinker/cement ratio, % 83 82 79 78 77 76
Electricity Consumption
kWhr/tonne cement
114.7 112.9 111.1 110.1 109.7 109.9

Tilbury
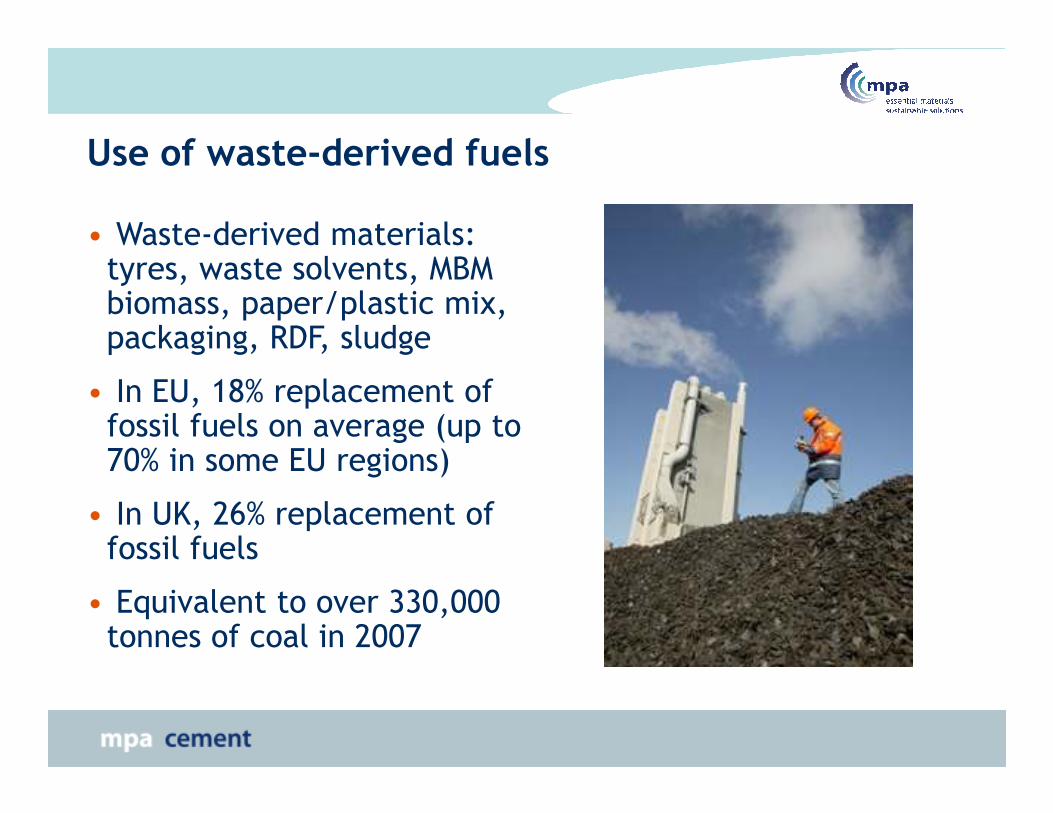
Use of waste-derived fuels
• Waste-derived materials: tyres, waste solvents, MBM biomass, paper/plastic mix, packaging, RDF, sludge
• In EU, 18% replacement of fossil fuels on average (up to
• In EU, 18% replacement of fossil fuels on average (up to 70% in some EU regions)
• In UK, 26% replacement of fossil fuels
• Equivalent to over 330,000 tonnes of coal in 2007
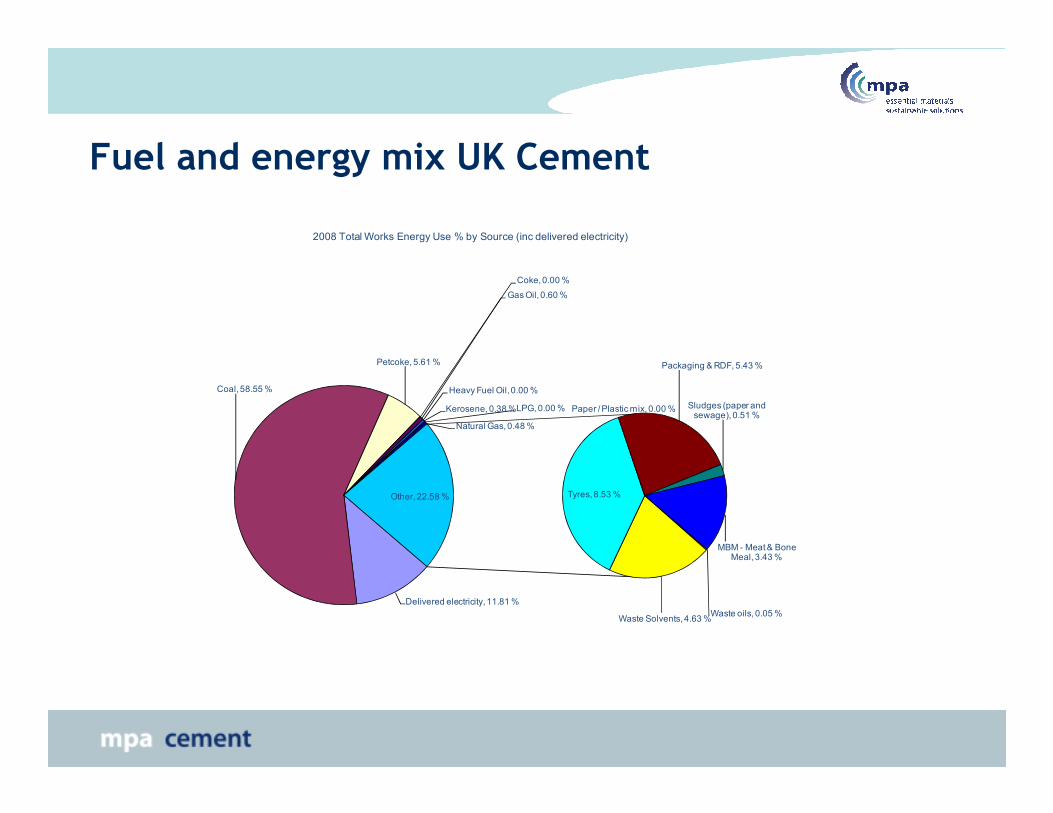
Fuel and energy mix UK Cement
Coal, 58.55 %
Petcoke, 5.61 %
Coke, 0.00 %
Gas Oil, 0.60 %
Heavy Fuel Oil, 0.00 %
Kerosene, 0.38 %LPG, 0.00 % Paper / Plastic mix, 0.00 %
Packaging & RDF, 5.43 %
Sludges (paper and
2008 Total Works Energy Use % by Source (inc delivered electricity)
Delivered electricity, 11.81 %
Kerosene, 0.38 %LPG, 0.00 %
Natural Gas, 0.48 %
Waste oils, 0.05 %Waste Solvents, 4.63 %
Tyres, 8.53 %
Paper / Plastic mix, 0.00 % Sludges (paper and sewage), 0.51 %
MBM - Meat & Bone Meal, 3.43 %
Other, 22.58 %

What is Carbon Capture and Storage?
The removal of CO2 from exhaust gases.
Two possible methods applicable to cement:• Post-combustion – Scrubbing kiln gas to separate CO2 exhaust
gases
• Oxy-Combustion – Combustion in O2 instead of air
The possible storage options/recovery: The possible storage options/recovery:

Carbon Capture and Storage
A long term possibility?
•IEA GHG – UK Cement industry Study
•CCS Cement plant will cost double a non-CCS cement plant plant
•Operational costs also double
•Need for transport infrastructure
•Technical barriers for Oxyfuel and post combustion
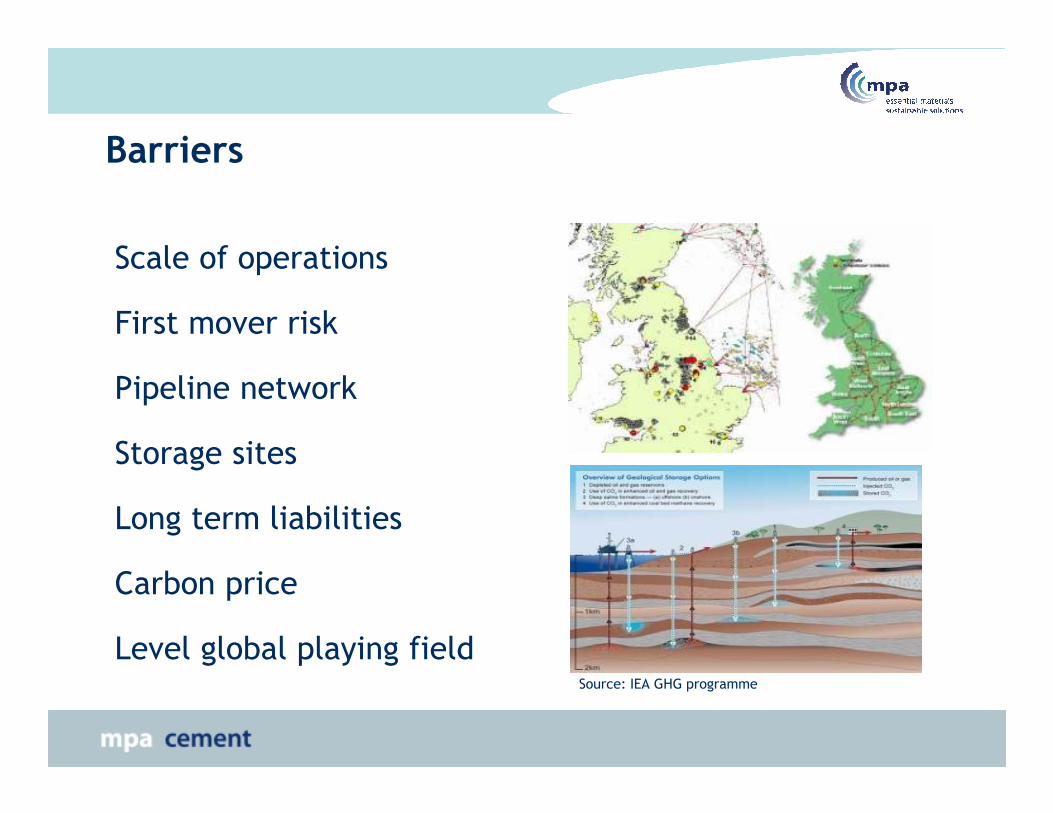
Barriers
Scale of operations
First mover risk
Pipeline network Pipeline network
Storage sites
Long term liabilities
Carbon price
Level global playing fieldSource: IEA GHG programme
Low Carbon Cements
Low Carbon Cements
The Key Challenges:
Develop Economic
Manufacturing ProcessManufacturing Process
Demonstrate Performance
Market entry
Funding

Manufacturing process challenges
Availability of raw materials
Scaling up and CO2 balance
Energy requirements
Economics
Regulatory Permits (IPPC, EA etc)

Novacem
• Based on magnesium oxide
and hydrated magnesium
carbonates
• Accelerated carbonation of
magnesium silicates under
elevated levels of
temperature and pressure temperature and pressure
(180 °C / 150 bar)• Carbonates produced are
heated at low temperatures
(700 °C) to produce MgO• Use of magnesium silicates
eliminates CO2emissions from
raw materials processing

Environmental and Economic Performance
Cement
(Current EU Average)
Cement
(EU BAT in 10 yrs)
Novacem
Capacity
(Mt clinker pa)
2.0 2.0 0.5-1.0 (?)
Fuel consumption 100%
(3.7 GJ/tonne)
80% 50% (?)
Electricity
consumption
100%
(110 kWhe/tonne)
80% 100-120% (?)
CO2 emission
(tonne/tonne clinker)
0.88 0.79 -0.05 (?)
CAPEX (M€) 230 260 260 (?)
OPEX 100% 95% 100% (?)
Cost of production (€
per tonne clinker)
37 36
(plus cost of CO2)
?
Performance challenges
Testing/validation
Long term performanceLong term performance
Codes and standards
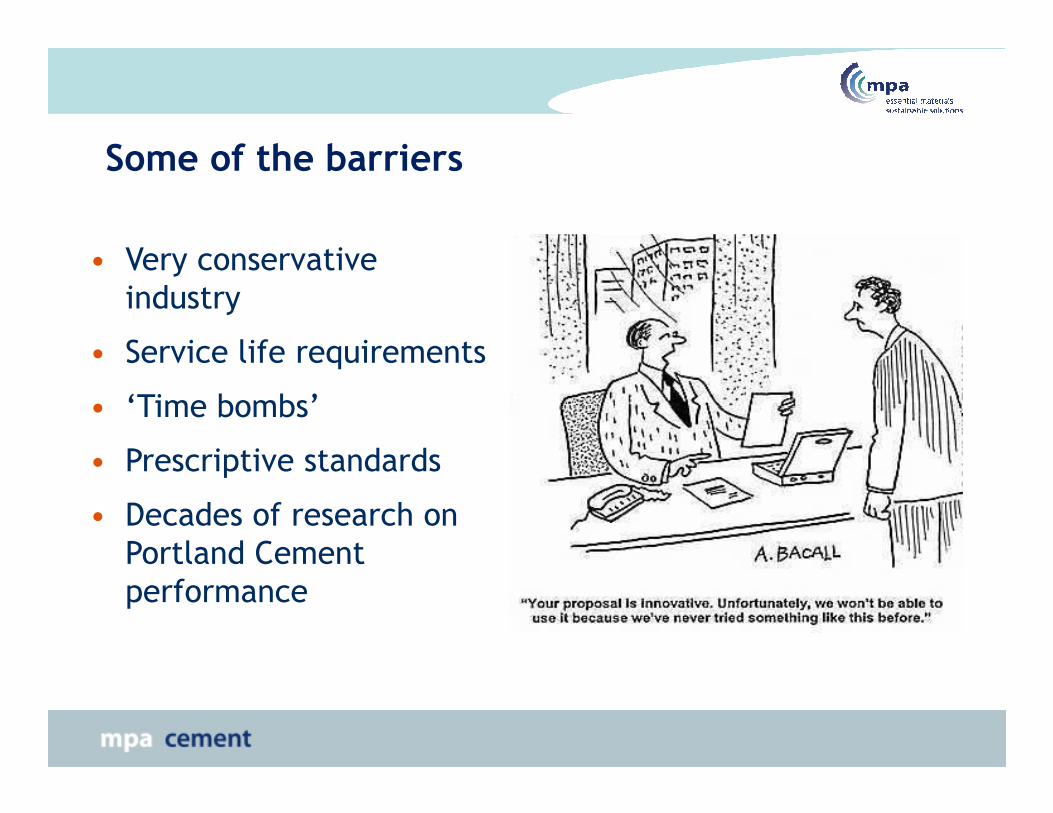
Some of the barriers
• Very conservative
industry
• Service life requirements
• ‘Time bombs’• ‘Time bombs’
• Prescriptive standards
• Decades of research on
Portland Cement
performance
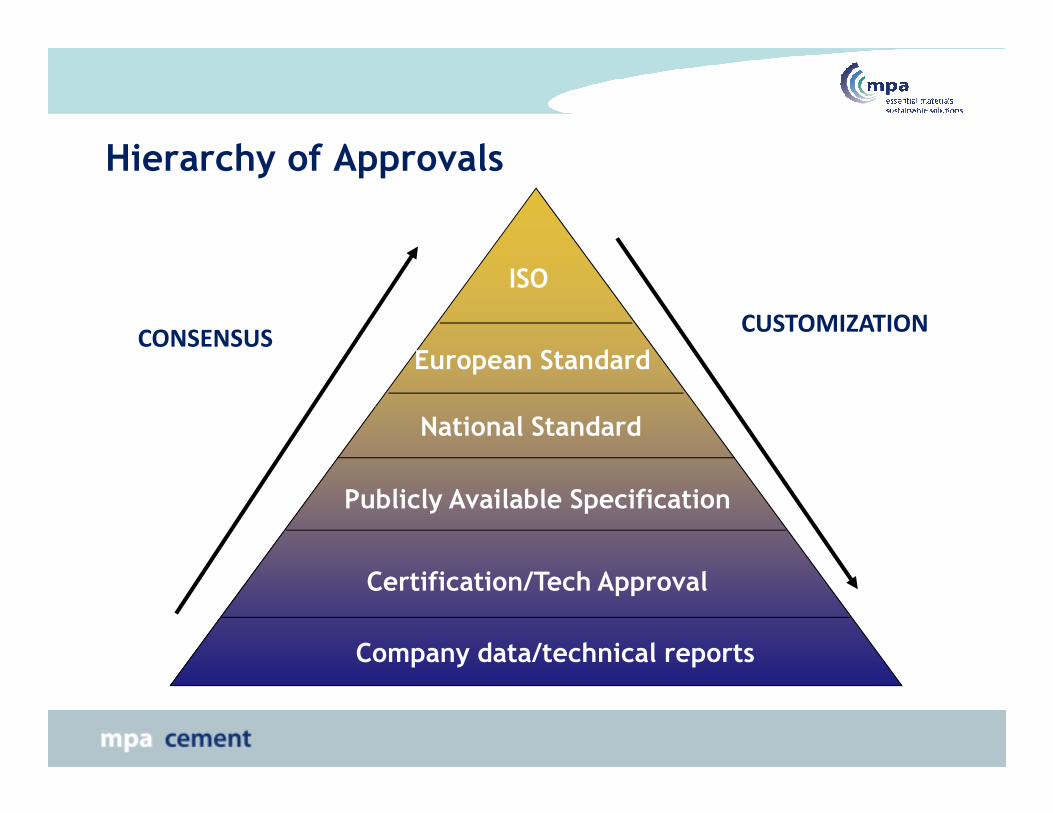
Hierarchy of Approvals
European Standard
ISO
CONSENSUSCUSTOMIZATION
Company data/technical reports
Certification/Tech Approval
Publicly Available Specification
National Standard

‘Novel’ cements?

Concrete thermal mass – exemplar buildings
Millennium Green – Nottinghamshire
Jubilee Library – Brighton(Lomax, Cassidy & Edwards / Bennetts associates)
BedZed – South London(Zed Factory)
St Matthews – Lambeth(PRP Architects)
Millennium Green – Nottinghamshire(Gusto Homes)
Summary
Global cement industry is taking a long term view on sustainability
Cement industry has developed a good track record on sustainability issues through programs like the CSICement industry has developed a good track record on sustainability issues through programs like the CSI
Novel cement formulations are promising but face significant hurdles to become a practical alternative