College students’ accounts of carbon transforming processes in socio-ecological systems.

Final Report February
2018
Cambridge Econometrics
Cambridge and Brussels
www.camecon.com
European Climate Foundation
Low-carbon cars in Europe: A socio-economic assessment

Low-carbon cars in Europe: A socio-economic assessment
2 Cambridge Econometrics
Our mission is to provide clear insights, based on rigorous and independent economic analysis, to support policy-makers and strategic planners in government, civil society and business in addressing
the complex challenges facing society.
Cambridge Econometrics Limited is owned by a charitable body, the Cambridge Trust for New Thinking in Economics.
www.neweconomicthinking.org

Low-carbon cars in Europe: A socio-economic assessment
3 Cambridge Econometrics
Authorisation and Version History
Version Date Authorised for release by
Description
1.0 19/02/18 Richard Lewney Final report

Low-carbon cars in Europe: A socio-economic assessment
4 Cambridge Econometrics
Acknowledgments
This study on the impacts of low-carbon mobility in Europe builds on a series of previous studies examining the potential impacts of the transition to low-carbon mobility, at a European (‘Fuelling Europe’s Future’, 20131) and Member State (‘Fuelling Britain’s Future’, 20152, ‘En route pour un transport durable’, 20163, ‘Low-carbon cars in Germany’, 20174). The technology cost analysis published in Fuelling Europe’s Future, developed by Ricardo-AEA and the core working group for that project, forms the starting point for this analysis.
Cambridge Econometrics provided the lead for the economic analysis presented in this report, undertaking economic modelling in E3ME.
Element Energy developed and applied a passenger car stock model for two groups of EU Member States, and carried out analysis on synergies between electric vehicle charging and the functioning of the electricity grid, plus a detailed assessment of charging infrastructure requirements and battery costs.
The report was funded by the European Climate Foundation who convened a core working group to advise and review the analysis and reporting. The authors would like to thank all members of the core working group for their respective inputs.
The stakeholders who contributed to this study shared the aim of establishing a constructive and transparent exchange of views on the technical, economic and environmental issues associated with the development of low-carbon technologies for cars. The objective was to evaluate the boundaries within which vehicle technologies can contribute to mitigating carbon emissions from cars across Europe. Each stakeholder contributed their knowledge and vision of these issues. The information and conclusions in this report have benefitted from these contributions, but should not be treated as necessarily reflecting the views of the companies and organisations involved.
The technology cost analysis was independently reviewed by Peter Mock, Managing Director of the International Council for Clean Transportation.
1 https://www.camecon.com/how/our-work/fuelling-europes-future/ 2 https://www.camecon.com/how/our-work/fuelling-britains-future/ 3 https://www.camecon.com/how/our-work/en-route-pour-un-transport-durable/ 4 https://www.camecon.com/how/our-work/low-carbon-cars-in-germany/
Background
Core analytical team
Disclaimer
Review
Low-carbon cars in Europe: A socio-economic assessment
5 Cambridge Econometrics
Contents
Page
Acronyms and Abbreviations 6
Executive Summary 7
1 Introduction 9
2 Overview of scenarios 13
3 Modelling assumptions 23
4 Infrastructure requirements 43
5 Consumers’ Perspective 56
6 Synergies between EVs and the electricity grid 60
7 Economic impacts 69
8 Environmental impacts 75
9 Conclusions 80
Appendix A E3ME model description 81
Appendix B ICE Vehicle Technology improvements 88
Appendix C Grid Synergies 90

Low-carbon cars in Europe: A socio-economic assessment
6 Cambridge Econometrics
Acronyms and Abbreviations
Table 1.1 sets out the acronyms and abbreviations commonly used in the report.
Table 0.1 Acronyms and abbreviations
Abbreviation Definition
Powertrain types
Internal combustion engine
ICE These are conventional petrol or diesel cars with an internal combustion engine. In the various scenarios modelled there is variation in the level of efficiency improvements to the ICE. Efficiency improvements cover engine options, transmission options, driving resistance reduction, tyres and hybridisation. Under our definition of an ICE, hybridisation is limited to micro-hybrids with start-stop technology and regenerative breaking.
Hybrid electric vehicles
HEV This definition covers full hybrid electric vehicles that can be run in pure EV mode for some time. They have a larger battery than the micro-hybrids (that are classified as ICEs).
Plug-in hybrid electric vehicle
PHEV Plug-in hybrid electric vehicles have a large battery and an internal combustion engine. They can be plugged in to recharge the vehicle battery. EVs with range extenders are not included in the study.
Battery electric vehicle
BEV This category refers to fully electric vehicles, with a battery but no engine.
Fuel cell electric vehicle
FCEV FCEVs are hydrogen fuelled vehicles, which include a fuel cell and a battery-powered electric motor.
Zero emissions vehicle
ZEV Includes all vehicles with zero tailpipe emissions (e.g. FCEVs and BEVs).
Economic terminology
Gross domestic product
GDP A monetary measure of the market value of all final goods and services in the national economy
Gross Value added
GVA A measure of the total value of goods and services in the economy netted from value of inputs and taxes.
Other acronyms
New European Driving Cycle
NEDC Test cycle used for the certification of cars in Europe until September 2017
Original equipment manufacturers
OEMs Refers to equipment manufacturers of motor vehicles
Million barrels of oil equivalent
mboe A unit for measuring oil volumes
Worldwide harmonized Light vehicles Test Procedure
WLTP Test cycle used for the certification of cars in Europe since September 2017

Low-carbon cars in Europe: A socio-economic assessment
7 Cambridge Econometrics
Executive Summary
This report assesses the economic costs and benefits of decarbonising passenger cars in Europe. A scenario approach has been developed to envisage various possible vehicle technology futures, and then economic modelling has been applied to assess impacts. The study follows a similar approach to that of the 2013 Fuelling Europe’s Future report.
Cambridge Econometrics and Element Energy were commissioned by the European Climate Foundation (ECF) to assess the likely economic impacts and the transitional challenges associated with decarbonising the European car fleet in the medium term (to 2030) and the long term (to 2050).
This technical report sets out the findings from our analysis. It provides details about the charging infrastructure requirements, technology costs and economic impacts of the transition to low-carbon mobility. A summary report, presenting the key messages from the study, is also available5.
The study shows that, while there are potentially large economic and environmental benefits associated with decarbonising passenger car transport in Europe, there are also transitional challenges which must be addressed if the benefits are to be realised. In recent years, there has been a strong push to decarbonise transport in Europe, including the publication in late 2017 of draft emissions reduction targets for 2025 and 2030. There have also been announcements from OEMs regarding deployment of advanced powertrain models across their ranges, signalling how rapidly the landscape is changing.
The potential benefits if Europe embraces the transition are substantial.
• Reduced use of oil and petroleum products will cut energy import dependence and bring about large reductions in carbon emissions.
• There are net gains in value added and employment gains which increase as oil imports are reduced over time. By 2030, the TECH scenario would lead to an increase in GDP of 0.6% compared with a ‘no change’ case, and an increase in employment of around 670,000 jobs.
• There is substantial potential for EV and grid synergies using smart charging strategies to shift EV charging demand away from peak periods to periods of low system demand. This would mitigate the challenges to the electricity system posed by EVs, limiting increases in peak electricity demand.
• For the consumer, the four-year total cost of ownership of Zero-Emission Vehicles is likely to converge towards that of conventional petrol and diesel cars in the next decade
However, our modelling, in combination with insight from the Core Working Group, also highlights a number of transitional challenges:
• The implementation of a rapid charging infrastructure will require investments reaching several billion euros per year by 2030. A determined
5 See: https://www.camecon.com/how/our-work/fuelling-europes-future/

Low-carbon cars in Europe: A socio-economic assessment
8 Cambridge Econometrics
and joint effort of the industry, government and civil society is needed to deploy sufficient charging infrastructure. Timing, location, capability and interoperability are key issues.
• The transition to low-carbon mobility causes a wide range of impacts in employment across several sectors. Employment in the automotive sector is a little higher in our central scenario than in the ‘no change’ case until 2030, during which time climate goals are met through a balanced mix of hybrids, plug-in vehicles and increasingly efficient ICEs. After 2030, the transition to electric mobility will increase employment in sectors such as construction and infrastructure, as well as services, but is likely to have an adverse impact on employment in the automotive value chain.
• The transition poses a significant challenge to maintain the competitiveness and market share of the European auto industry, by remaining at the cutting edge of clean technology innovation.
Low-carbon cars in Europe: A socio-economic assessment
9 Cambridge Econometrics
1 Introduction
1.1 Background
In November 2013, the European Parliament and the Council of the European Union set out legislation to limit the emissions of new vehicles. The EU CO2 standards required fleet-wide average vehicle emissions to be below 95g CO2 per km by 2021. In 2017, the Commission announced6 proposed new standards for 2025 and 2030; a 15% reduction in average new vehicle emissions between 2021 and 2025, and a 30% reduction in new vehicle emissions in 2030 compared to 2021. These aim to continue to move Europe along a low carbon pathway and to meet EU-wide targets for a 60% reduction in transport CO2 emissions by 2050.
Announcements in 2017 by the French and UK governments that new sales of conventional petrol and diesel cars will be banned by 2040 have also sent a clear signal that change is coming. As well as supporting the curtailment of CO2 emissions, the impetus for this change is, in part, due to increasing concern about the level of local air pollutants (such as NOx) emitted by vehicles and the negative health outcomes associated with this pollution, especially in densely populated urban areas. Many other EU Member States have explicit targets for EVs in the stock; Germany is aiming for 1 million in 2020, and Poland the same number by 2025.
As such, most major car manufacturers in Europe have developed new product lines that are increasingly fuel efficient, and are now moving increasingly towards electrification or fuel cells as the next step in reducing emissions to meet the proposed targets.
There has been much debate about the potential impacts of the transition to ZEVs. The purpose of this study is to shed light on the potential benefits and the transitional challenges of decarbonising passenger cars for the European automotive industry and the wider economy over the period to 2050. In doing so, it highlights some of the key issues that policy makers should focus on, including;
• What is the scale and pace of investment in infrastructure required?
• How will government tax revenues be affected due to reduced fuel duty?
• What will be in the impact on the electricity grid, and peak electricity demand, and how could this be better managed?
The study also addresses some of the key uncertainties about the transition: What if future oil prices are higher (or lower) than projected? What if technology costs and battery costs are different to expected? What if PHEVs or FCEVs become the ‘technology winner’, instead of BEVs?
6 https://ec.europa.eu/clima/policies/transport/vehicles/proposal_en
Low-carbon transport policy
Motivation for the study

Low-carbon cars in Europe: A socio-economic assessment
10 Cambridge Econometrics
1.2 Methodology
For this study, a set of scenarios were defined in which it was assumed that a certain low-carbon vehicle technology mix would be introduced and taken up in response to vehicle CO2 emissions regulations. The particular factors affecting consumers’ decisions to purchase alternative vehicle technologies were not assessed.
As shown in the graphic below, the methodology involved three key stages:
1) Stakeholder consultation to define the scenarios and agree on the key modelling assumptions
2) An integrated modelling framework that involved (i) application of the Element Energy’s vehicle stock model to assess the impact of alternative low-carbon vehicle sales mix on energy demand and emissions, vehicle prices, technology costs and the total vehicle cost of ownership and (ii) application of the E3ME model to assess the wider socio-economic effects of the low-carbon vehicle transition.
3) Off-model analysis to consider the energy system and grid benefits of increased use of BEVs and FCEVs (e.g. through the provision of grid balancing services).
Figure 1.1: Our approach
The two models that were applied in our framework are Element Energy’s Vehicle Stock Model and Cambridge Econometrics’ E3ME model.
The vehicle stock model calculates vehicle fuel demand, vehicle emissions and vehicle prices for a given mix of vehicle technologies. The model uses information about the efficiency of new vehicles and vehicle survival rates to assess how changes in new vehicles sales affect stock characteristics. The model also includes a detailed technology sub-model to calculate how the efficiency and price of new vehicles are affected, with increasing uptake of
Element Energy’s Vehicle Stock
Model
Low-carbon cars in Europe: A socio-economic assessment
11 Cambridge Econometrics
fuel efficient technologies. The vehicle stock model is highly disaggregated, modelling 16 different technology types across three different size-bands (small, medium and large)7. It differentiates two blocks of countries, EU15 and EU13, and accounts for the second-hand market flow between these two regions.
Some of the outputs from the vehicle stock model (including fuel demand and vehicle prices) are then used as inputs to E3ME, an integrated macro-econometric model, which has full representation of the linkages between the energy system, environment and economy at a global level. The high regional and sectoral disaggregation (including explicit coverage of every EU Member State) allows modelling of scenarios specific to Europe (and allows the disaggregation of results down to Member State level, although for this analysis we report only two aggregated European regions) and detailed analysis of sectors and trade relationships in key supply chains (for the automotive and petroleum refining industries). E3ME was used to assess how the transition to low carbon vehicles affects household incomes, trade in oil and petroleum, consumption, GDP, employment, CO2, NOx and particulates.
For more information and the full model manual, see www.e3me.com. A summary description of the model is also available in Appendix A of this report.
1.3 Structure of the report
The report is structured as follows:
• Section 2 sets out the scenarios that were developed to inform the analysis and are required to answer the questions raised by the Core Working Group.
• The main modelling assumptions and technology cost data are set out in Section 3.
• New infrastructure requirements are a key consideration for the deployment of zero emission vehicles, these are considered in Section 4.
• Above all, a transition requires consumers to adopt low and zero emission cars. In Section 5 we look at the capital and fuel costs facing the consumer for new cars in the future.
• A transition to electric vehicles has implications for the electricity grid. In Section 6, Element Energy has assessed the implications for the German electricity grid of electric vehicles and the extent to which the challenges that arise are offset by the application of smart charging.
• The core analysis focuses on the macroeconomic impact of the difference scenarios. The net impacts and transitional challenges are set out in Section 7.
• The main driver of low emissions cars is to reduce the harmful impact that road transport has on the local and global environment. The contribution
7 See Section 3, Table 3.1 for more details.
E3ME

Low-carbon cars in Europe: A socio-economic assessment
12 Cambridge Econometrics
of passenger cars to CO2 emissions and local air quality pollutants is set out in Section 8.
• The report finishes with our conclusions in Section 9. These are the views of the report’s authors and do not necessarily represent the views of the European Climate Foundation or the members of the Core Working Group, either individually or collectively.

Low-carbon cars in Europe: A socio-economic assessment
13 Cambridge Econometrics
2 Overview of scenarios
2.1 Scenario design
The analysis set out in this report is based on a set of scenarios developed by the Core Working Group, each assuming a different new vehicle sales mix. These represent a range of decarbonisation pathways and are designed to assess the impact of a shift towards low carbon powertrains; they do not necessarily reflect current predictions of the future makeup of the European car fleet. Uptake of each kind of vehicle is by assumption: implicitly we assume that this change is brought about by policy. The five core scenarios to be modelled for this study are summarised in the table below:
Table 2.1 Description of the five core modelling scenarios
Scenario Scenario description
REF (Reference)
• No change in the deployment of efficiency technology or the sales mix from 2015 onwards
• Some improvements in the fuel-efficiency of the vehicle stock, due to stock turnover
CPI (Current Policy)
• Improvements to the efficiency of the ICE and a modest increase in HEV, PHEV and BEV deployment to meet 95gCO2/km EU vehicle efficiency target for 2021
• No further deployment of efficiency technology or advanced powertrains post-2021
TECH (High Technology)
• New cars meet 95gCO2/km (NEDC) target in 2021, and achieve ~77 gCO2/km (WLTP) in 2025 and ~57gCO2/km (WLTP) in 2030
• Ambitious deployment of fuel-efficient technologies in all new vehicles over the period to 2050 (e.g. light-weighting)
• ICE and HEV sales are banned in 2040, consistent with policies already announced by several Member States (e.g. France, UK, Netherlands, Norway)
• Before 2040, BEVs deployed mostly in small and medium sized segments in a way consistent with latest announcements
• BEVs outnumber PHEVs 2:1 until 2040, where PHEV sales drop off
• FCEVs gain market share after 2030, and are deployed in the medium and large segments (which have higher annual mileage)
TECH PHEV (High Technology, PHEVs dominate)
• A variant of TECH where PHEVs emerge as the dominant technology to 2040, and take the majority share of advanced powertrain deployment over this period
• PHEVs outnumber BEVs 2:1 until 2040, when PHEV sales drop off slightly
TECH OEM (High Technology, Ambitious uptake)
• A low carbon technology scenario with a more ambitious deployment for advanced powertrains as new sales of ICEs stop in 2035 and HEVs stop in 2040 as per the TECH scenario. This is in line with recent OEM announcements and an ambitious view on policy announcements.
• PHEV and BEV sales are equal until 2035 after which the market share if PHEVs decline, becoming zero in 2050
Low-carbon cars in Europe: A socio-economic assessment
14 Cambridge Econometrics
For the most part, this technical report focusses on the impact of the central TECH scenario, but the variants are useful in that they allow us to explore:
• the implication for jobs in the automotive supply chain (TECH PHEV)
• the impact of a rapid transition to low carbon vehicles on CO2 emissions as well as the associated economic risks and potential benefits (TECH OEM)
2.2 Vehicle sales and stock
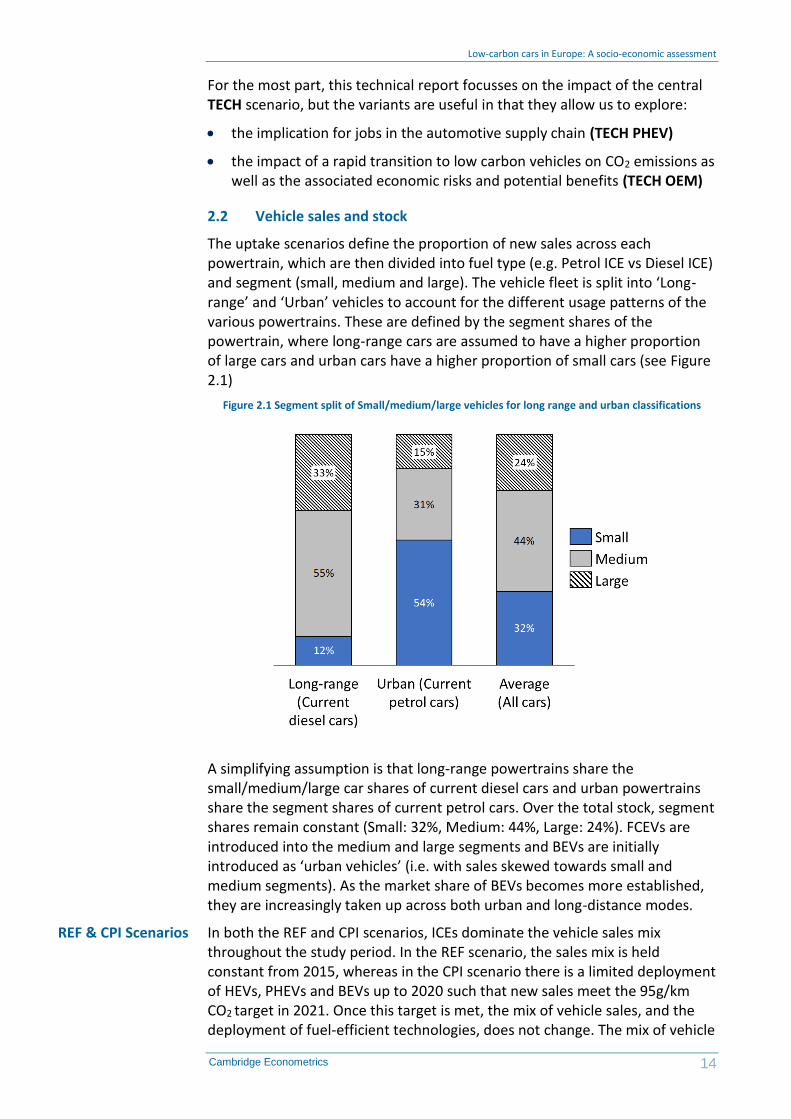
The uptake scenarios define the proportion of new sales across each powertrain, which are then divided into fuel type (e.g. Petrol ICE vs Diesel ICE) and segment (small, medium and large). The vehicle fleet is split into ‘Long-range’ and ‘Urban’ vehicles to account for the different usage patterns of the various powertrains. These are defined by the segment shares of the powertrain, where long-range cars are assumed to have a higher proportion of large cars and urban cars have a higher proportion of small cars (see Figure 2.1)
Figure 2.1 Segment split of Small/medium/large vehicles for long range and urban classifications
A simplifying assumption is that long-range powertrains share the small/medium/large car shares of current diesel cars and urban powertrains share the segment shares of current petrol cars. Over the total stock, segment shares remain constant (Small: 32%, Medium: 44%, Large: 24%). FCEVs are introduced into the medium and large segments and BEVs are initially introduced as ‘urban vehicles’ (i.e. with sales skewed towards small and medium segments). As the market share of BEVs becomes more established, they are increasingly taken up across both urban and long-distance modes.
In both the REF and CPI scenarios, ICEs dominate the vehicle sales mix throughout the study period. In the REF scenario, the sales mix is held constant from 2015, whereas in the CPI scenario there is a limited deployment of HEVs, PHEVs and BEVs up to 2020 such that new sales meet the 95g/km CO2 target in 2021. Once this target is met, the mix of vehicle sales, and the deployment of fuel-efficient technologies, does not change. The mix of vehicle
REF & CPI Scenarios
Low-carbon cars in Europe: A socio-economic assessment
15 Cambridge Econometrics
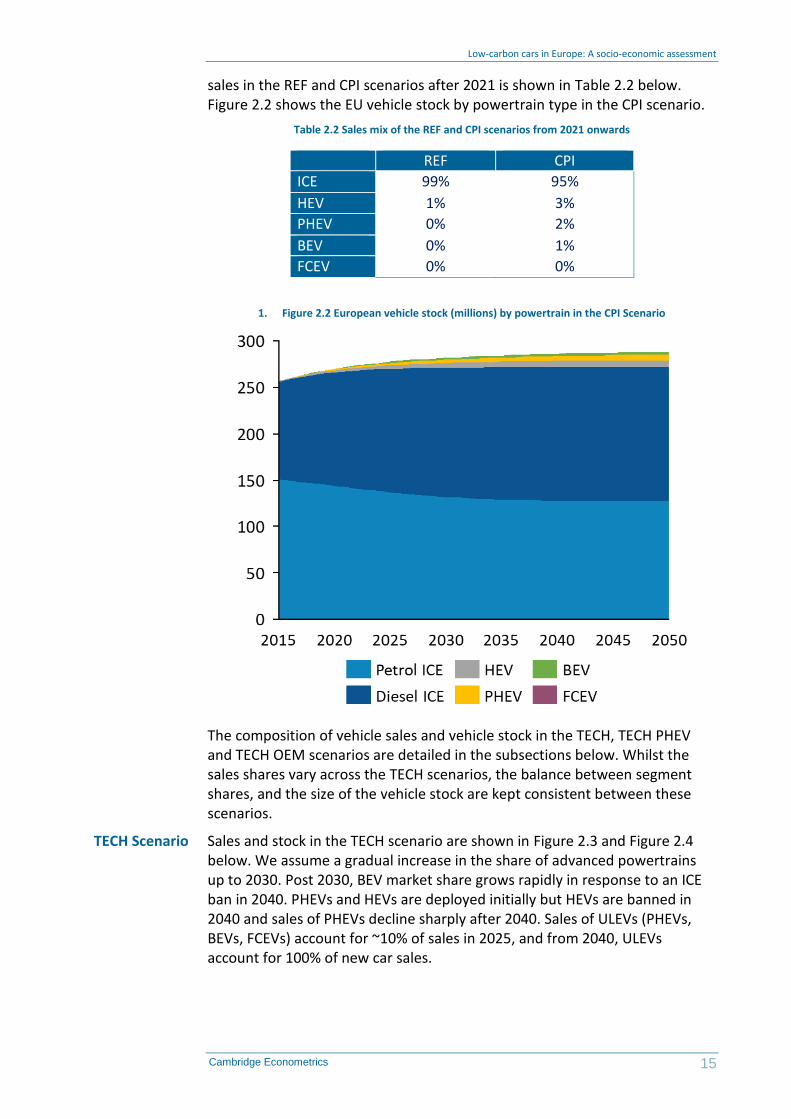
sales in the REF and CPI scenarios after 2021 is shown in Table 2.2 below. Figure 2.2 shows the EU vehicle stock by powertrain type in the CPI scenario.
Table 2.2 Sales mix of the REF and CPI scenarios from 2021 onwards
REF CPI
ICE 99% 95%
HEV 1% 3%
PHEV 0% 2%
BEV 0% 1%
FCEV 0% 0%
1. Figure 2.2 European vehicle stock (millions) by powertrain in the CPI Scenario
The composition of vehicle sales and vehicle stock in the TECH, TECH PHEV and TECH OEM scenarios are detailed in the subsections below. Whilst the sales shares vary across the TECH scenarios, the balance between segment shares, and the size of the vehicle stock are kept consistent between these scenarios.
Sales and stock in the TECH scenario are shown in Figure 2.3 and Figure 2.4 below. We assume a gradual increase in the share of advanced powertrains up to 2030. Post 2030, BEV market share grows rapidly in response to an ICE ban in 2040. PHEVs and HEVs are deployed initially but HEVs are banned in 2040 and sales of PHEVs decline sharply after 2040. Sales of ULEVs (PHEVs, BEVs, FCEVs) account for ~10% of sales in 2025, and from 2040, ULEVs account for 100% of new car sales.
TECH Scenario

Low-carbon cars in Europe: A socio-economic assessment
16 Cambridge Econometrics
Figure 2.3 New vehicle sales by powertrain type in the TECH Scenario
Figure 2.4 European vehicle stock (millions) by powertrain in the TECH Scenario
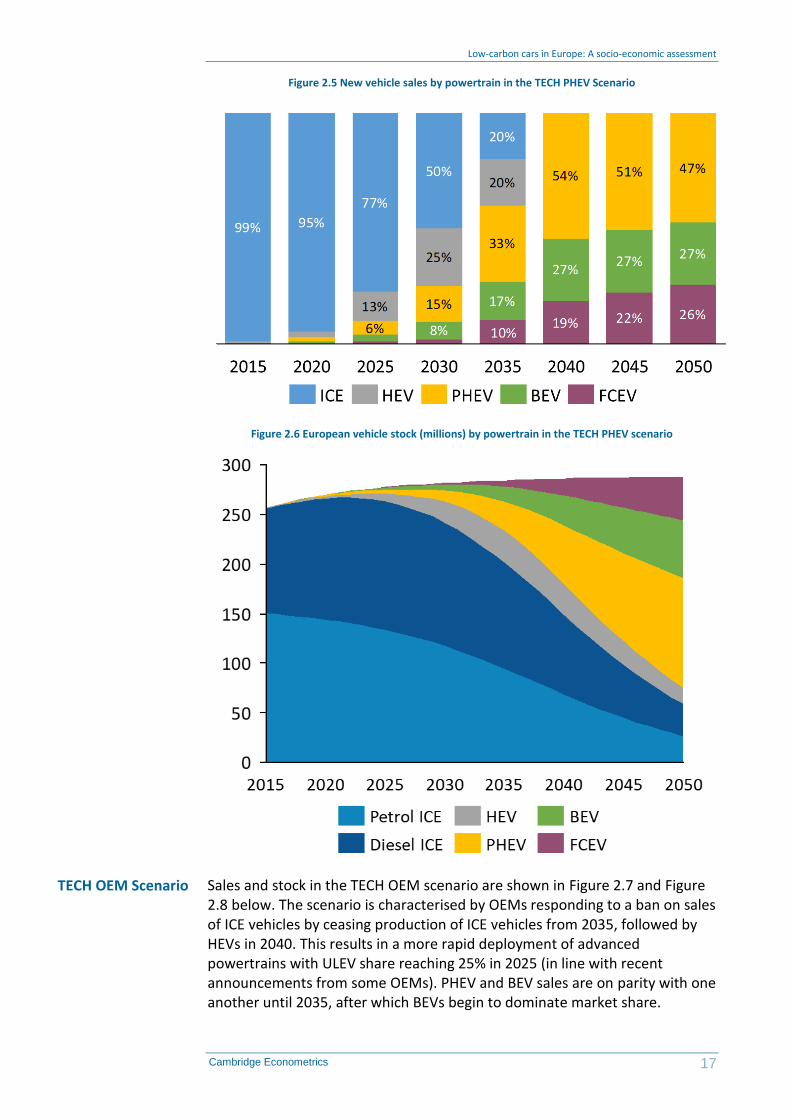
Sales and stock in the TECH PHEV scenario are shown in Figure 2.5 and Figure 2.6 below. The total share of advanced powertrains in sales is identical to the TECH scenario, but PHEVs emerge as the ‘technology winner’ post 2030 and become the dominant advanced powertrain. Deployment of FCEVs steadily increases throughout the time period, and FCEVs begin to gain market share at the expense of PHEVs from 2040.
TECH PHEV Scenario
Low-carbon cars in Europe: A socio-economic assessment
17 Cambridge Econometrics
Figure 2.5 New vehicle sales by powertrain in the TECH PHEV Scenario
Figure 2.6 European vehicle stock (millions) by powertrain in the TECH PHEV scenario
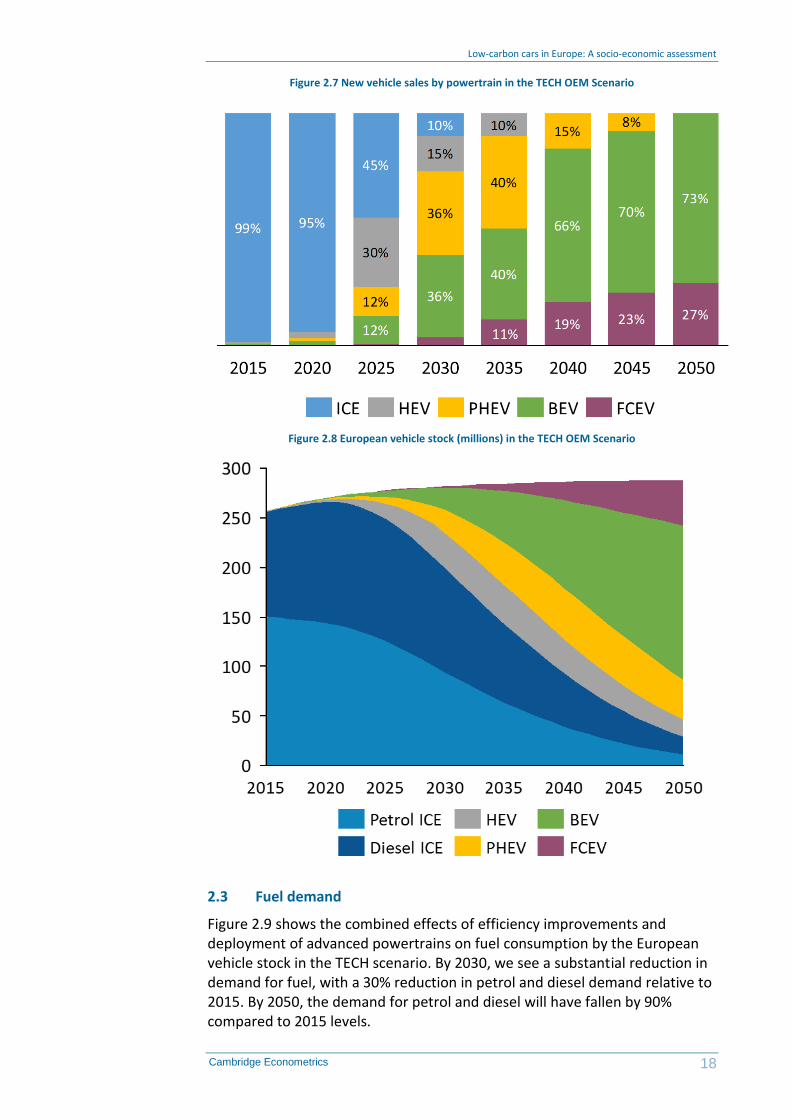
Sales and stock in the TECH OEM scenario are shown in Figure 2.7 and Figure 2.8 below. The scenario is characterised by OEMs responding to a ban on sales of ICE vehicles by ceasing production of ICE vehicles from 2035, followed by HEVs in 2040. This results in a more rapid deployment of advanced powertrains with ULEV share reaching 25% in 2025 (in line with recent announcements from some OEMs). PHEV and BEV sales are on parity with one another until 2035, after which BEVs begin to dominate market share.
TECH OEM Scenario
Low-carbon cars in Europe: A socio-economic assessment
18 Cambridge Econometrics
Figure 2.7 New vehicle sales by powertrain in the TECH OEM Scenario
Figure 2.8 European vehicle stock (millions) in the TECH OEM Scenario
2.3 Fuel demand
Figure 2.9 shows the combined effects of efficiency improvements and deployment of advanced powertrains on fuel consumption by the European vehicle stock in the TECH scenario. By 2030, we see a substantial reduction in demand for fuel, with a 30% reduction in petrol and diesel demand relative to 2015. By 2050, the demand for petrol and diesel will have fallen by 90% compared to 2015 levels.

Low-carbon cars in Europe: A socio-economic assessment
19 Cambridge Econometrics
Electricity and hydrogen demand grows in line with rollout of the stock of PHEVs, BEVs and FCEVs and, by 2050, though due to their higher efficiencies their share of total energy demand is lower than their share within the vehicle stock.
2.4 Sensitivities
Two sensitivities have been created to explore the impact of key uncertainties. These cover the percent of miles driven under electric power for PHEVs and the efficiency gains of ICEs
The carbon reductions achieved from the uptake of PHEVs is largely dependent on the percentage of annual mileage driven in electric mode. This is highly uncertain, and standardised driving cycles (WLTP or NEDC) are not a reliable indication of real world driving patterns. The model instead uses assumptions regarding the real world electric range, Figure 2.10 shows the resulting electric mileage of a petrol PHEV in 2020 and 2030.
Figure 2.10 Percentage of miles driven in electric mode for a petrol PHEV in 2020 and 2030 in the TECH Scenarios
PHEV electric mileage
Figure 2.9 Stock fuel consumption of petrol, diesel, hydrogen and electricity (mtoe)

Low-carbon cars in Europe: A socio-economic assessment
20 Cambridge Econometrics
These values are supported by a 2014 study by Fraunhofer ISI8, which looked at the real-world driving patterns of PHEV drivers in Germany and the USA. The study showed that the average percentage of miles driven in electric mode by a Chevrolet Volt and an Opel Ampera were 78.5% and 77.7% respectively. The recorded real world electric range for both vehicles was around 62 km, similar to the model assumptions regarding real world range of medium and large PHEVs. Figure 2.11 compares the results from the Fraunhofer study to the values used in the model for a petrol PHEV in 2020 and 2030. The agreement between the modelled and real-world values justifies the approach used.
Figure 2.11 Comparison of real world PHEV miles driven in electric mode (Fraunhofer ISI) to values used in the vehicle stock model
There is a concern that these real data points are reflective of a niche group of early consumers with different charging habits to the mass market. However, in Norway, where electric vehicles are well established in the mass market, a 2016 consumer survey by the Institute of Transport Economics9 suggests this is not the case. The study estimates the total percentage of miles driven in electric mode to be 72% for an Opel Ampera; this is lower than the equivalent values used in the stock model, but not drastically so.
By assuming a relatively high proportion of electric miles, we assume that the difference in tailpipe emissions between PHEVs and BEVs is relatively small. Consequently the differences in total emissions and fuel consumption in the TECH and TECH PHEV scenarios are also small. This is reinforced by a 2017 study, also from Fraunhofer ISI, which demonstrates that, accounting for PHEVs higher annual mileage, PHEVs with a real-world range of over 60 km drive the same number of kilometres in electric mode as BEVs. This therefore implies, at least initially, that their carbon-saving potential could be as large as BEVs, as they are likely to replace higher-mileage ICE vehicles.
8 Fraunhofer Institute for Systems and Innovation Research ISI, Real-world economy and CO2 emissions of plug-in hybrid electric vehicles 9 Norwegian Institute for Transport Economics, Learning from Norwegian Battery Electric and Plug-in Hybrid Vehicle Users

Low-carbon cars in Europe: A socio-economic assessment
21 Cambridge Econometrics
There is, however, significant uncertainty in the above assumptions, especially surrounding future vehicle attributes and consumer charging behaviour. The future range and battery capacity of PHEVs is critical, and any variation in these values will heavily impact the electric mileage percentage. In addition to this, there are uncertainties surrounding the charging habits of consumers without access to home charging and those who purchase PHEVs as a result of favourable tax regimes (rather than running cost or environmental considerations). A low charging frequency has been demonstrated in the Netherlands where a 2015 study by TNO showed PHEVs covered as little as 28% of total mileage in electric mode for a Chevrolet Volt, and 21% for a Mitsubishi Outlander PHEV.
To recognise the risk that future consumer charging behaviour may be different to our central assumption, two PHEV sensitivities have been created:
1 percentage of annual mileage driven in electric mode is half of the baseline case
2 PHEVs are driven solely in fuel mode (i.e. no electric mileage)
In these sensitivities, total demand for electricity will be lower, and total demand for fossil fuels higher, reflecting more miles driven on the ICE and less on the electric motor.
The technology deployment used in the TECH, TECH PHEV and TECH OEM uptake scenarios includes ambitious efficiency gains of ICE and HEV vehicles. Whether these improvements materialise will depend on whether OEMs continue to invest in ICE/HEV development. There is clear uncertainty around this assumption; it may be the case that such investment will cease (or at least decline) as ICE sales fall.
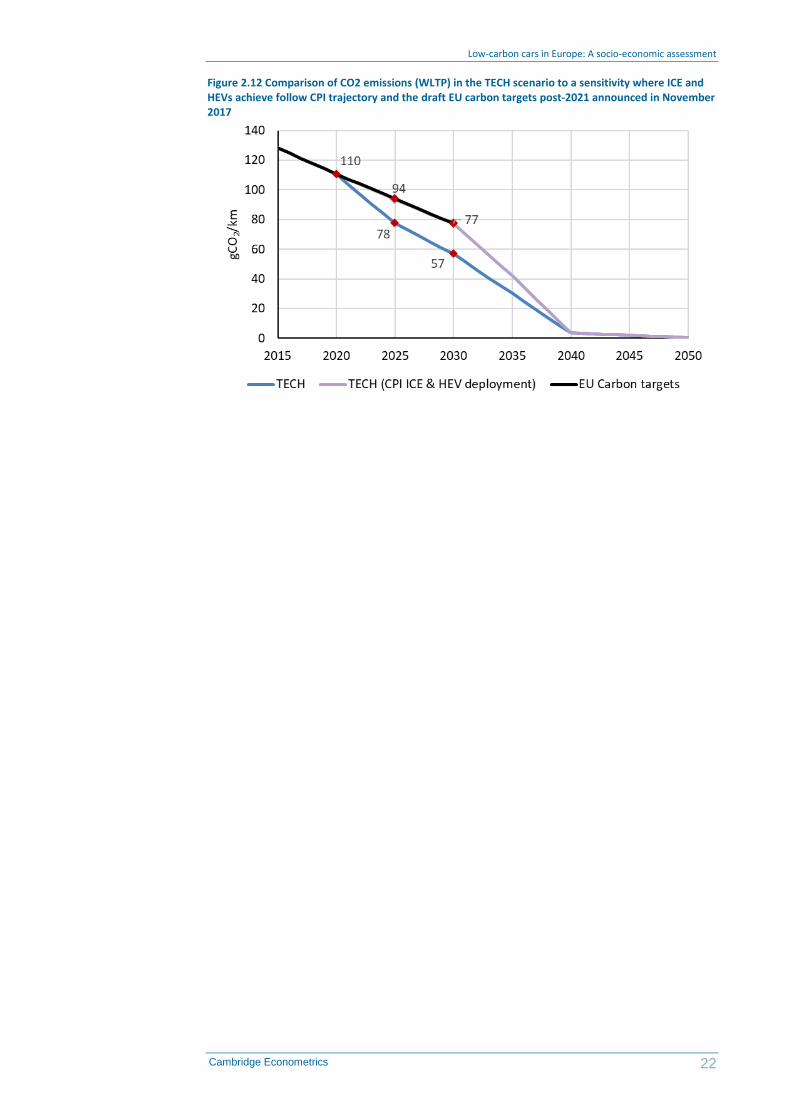
To account for this uncertainty, a sensitivity has been created where ICE and HEV vehicles do not see any improvement in fuel efficiency beyond 2020 (consistent with the CPI scenario), whereas BEVs, PHEVs and FCEVs all achieve the continued efficiency improvements outlined in the TECH deployment scenario. This reflects the potential impact of OEMs focusing on the development of alternative vehicles rather than improvements in traditional powertrains.
The resulting WLTP CO2 emissions are shown in Figure 2.12. The emissions from new vehicles in this scenario closely match the draft EU emissions targets of a 30% reduction in new car emissions by 2030 (15% by 2025) relative to 2021. This suggests that one way of meeting these targets is through the deployment of advanced powertrains as outlined in the TECH scenario, with no further efficiency improvements in either ICE or HEV vehicles after 2020.
ICE efficiency gains
Low-carbon cars in Europe: A socio-economic assessment
22 Cambridge Econometrics
Figure 2.12 Comparison of CO2 emissions (WLTP) in the TECH scenario to a sensitivity where ICE and HEVs achieve follow CPI trajectory and the draft EU carbon targets post-2021 announced in November 2017
Low-carbon cars in Europe: A socio-economic assessment
23 Cambridge Econometrics
3 Modelling assumptions
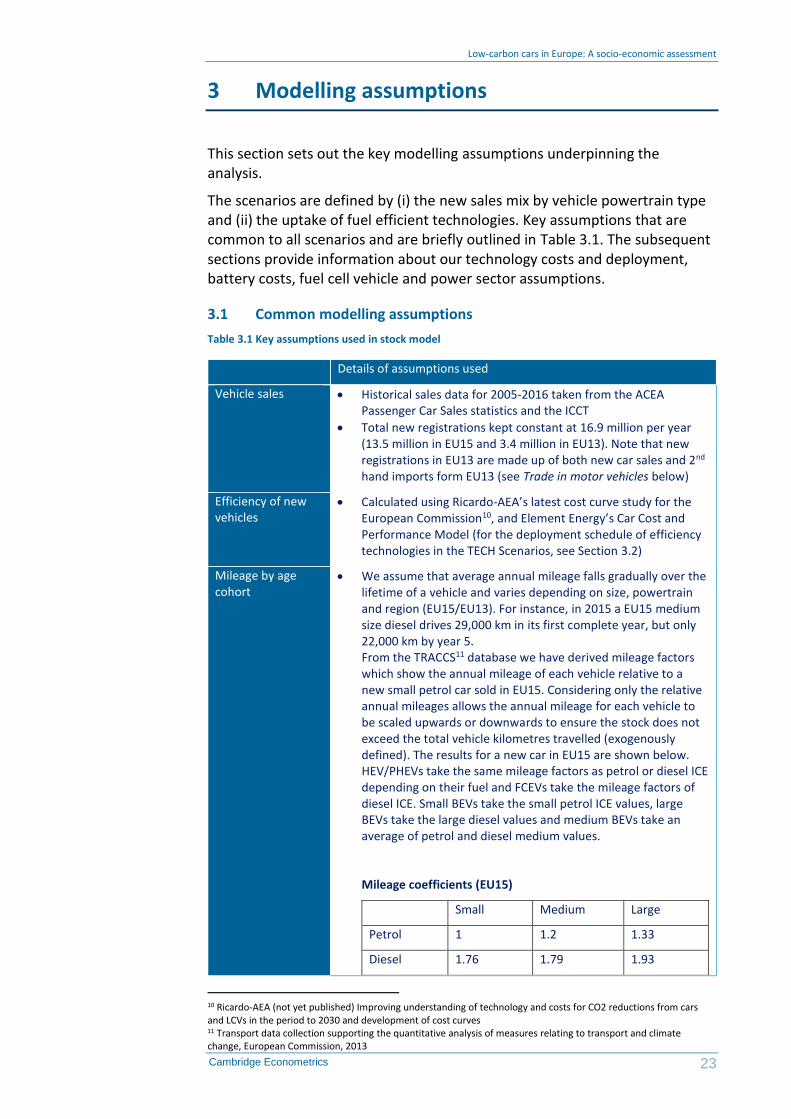
This section sets out the key modelling assumptions underpinning the analysis.
The scenarios are defined by (i) the new sales mix by vehicle powertrain type and (ii) the uptake of fuel efficient technologies. Key assumptions that are common to all scenarios and are briefly outlined in Table 3.1. The subsequent sections provide information about our technology costs and deployment, battery costs, fuel cell vehicle and power sector assumptions.
3.1 Common modelling assumptions
Table 3.1 Key assumptions used in stock model
Details of assumptions used
Vehicle sales • Historical sales data for 2005-2016 taken from the ACEA Passenger Car Sales statistics and the ICCT
• Total new registrations kept constant at 16.9 million per year (13.5 million in EU15 and 3.4 million in EU13). Note that new registrations in EU13 are made up of both new car sales and 2nd hand imports form EU13 (see Trade in motor vehicles below)
Efficiency of new vehicles
• Calculated using Ricardo-AEA’s latest cost curve study for the European Commission10, and Element Energy’s Car Cost and Performance Model (for the deployment schedule of efficiency technologies in the TECH Scenarios, see Section 3.2)
Mileage by age cohort
• We assume that average annual mileage falls gradually over the lifetime of a vehicle and varies depending on size, powertrain and region (EU15/EU13). For instance, in 2015 a EU15 medium size diesel drives 29,000 km in its first complete year, but only 22,000 km by year 5. From the TRACCS11 database we have derived mileage factors which show the annual mileage of each vehicle relative to a new small petrol car sold in EU15. Considering only the relative annual mileages allows the annual mileage for each vehicle to be scaled upwards or downwards to ensure the stock does not exceed the total vehicle kilometres travelled (exogenously defined). The results for a new car in EU15 are shown below. HEV/PHEVs take the same mileage factors as petrol or diesel ICE depending on their fuel and FCEVs take the mileage factors of diesel ICE. Small BEVs take the small petrol ICE values, large BEVs take the large diesel values and medium BEVs take an average of petrol and diesel medium values.
Mileage coefficients (EU15)
Small Medium Large
Petrol 1 1.2 1.33
Diesel 1.76 1.79 1.93
10 Ricardo-AEA (not yet published) Improving understanding of technology and costs for CO2 reductions from cars and LCVs in the period to 2030 and development of cost curves 11 Transport data collection supporting the quantitative analysis of measures relating to transport and climate change, European Commission, 2013

Low-carbon cars in Europe: A socio-economic assessment
24 Cambridge Econometrics
Total vehicle km travelled
• Total vehicle km travelled are increased in line with the Sultan reference scenario described in ‘EU Transport GHG: Routes to 2050 II’. This results in a 31% increase in total km travelled from 2015-2050.
Vehicle survival rates
• The survival rate was derived from analysis of the age distribution of the total EU car stock between 2005-201012 (using stock data from the TRACCS database). This results in an average lifetime of 19.5 years for cars bought from 2015. The same survival rate is used for all powertrains and segments.
Fuel prices • Historical data for fuel prices is taken from the European Commission’s Oil Bulletin
• For the central scenarios, we assume oil prices grow in line with the IEA World Energy Outlook Current Policies Scenario (and a constant percentage mark-up is applied to derive the petrol and diesel fuel price)
Electricity prices • These assume additional capacity being delivered in line with the PRIMES 2016 Reference Scenario
• The electricity price for EV users is assumed to be the same as that paid by households
• The impact of additional demand on electricity prices will be explored later in the project.
Rest of world • Rest of world assumptions on low carbon transport policy affect the global oil price and are tested through sensitivity analysis
Value chains • In all scenarios, we assume that Member States captures a consistent share of the vehicle value chain for conventional ICEs. For the central scenarios, we assume that, for EVs, battery modules and battery packs are assembled in the EU but that the battery cells are manufactured in Asia.
Trade in motor vehicles
• We assume the same volume of vehicle imports and exports between the EU15 and EU13 in each scenario. The stock model reflects the fact that 67% of new registrations in EU13 are second hand imports from EU15, and reflects the current age distribution of these imported vehicles13. This behaviour is assumed to remain constant.
• The price of vehicle imports and vehicle exports changes in line with the change in domestic vehicle prices (reflecting that transport policy is assumed to be consistent across the EU). Vehicles are exported according to their size and powertrain in proportion to their stock share.
Air quality • Real world NOx and PM emission factors were taken from an EEA study14 using the Tier 2 emissions calculation method
Vehicle depreciation
• We assume an annual depreciation rate of 20%
3.2 ICE efficiency gains
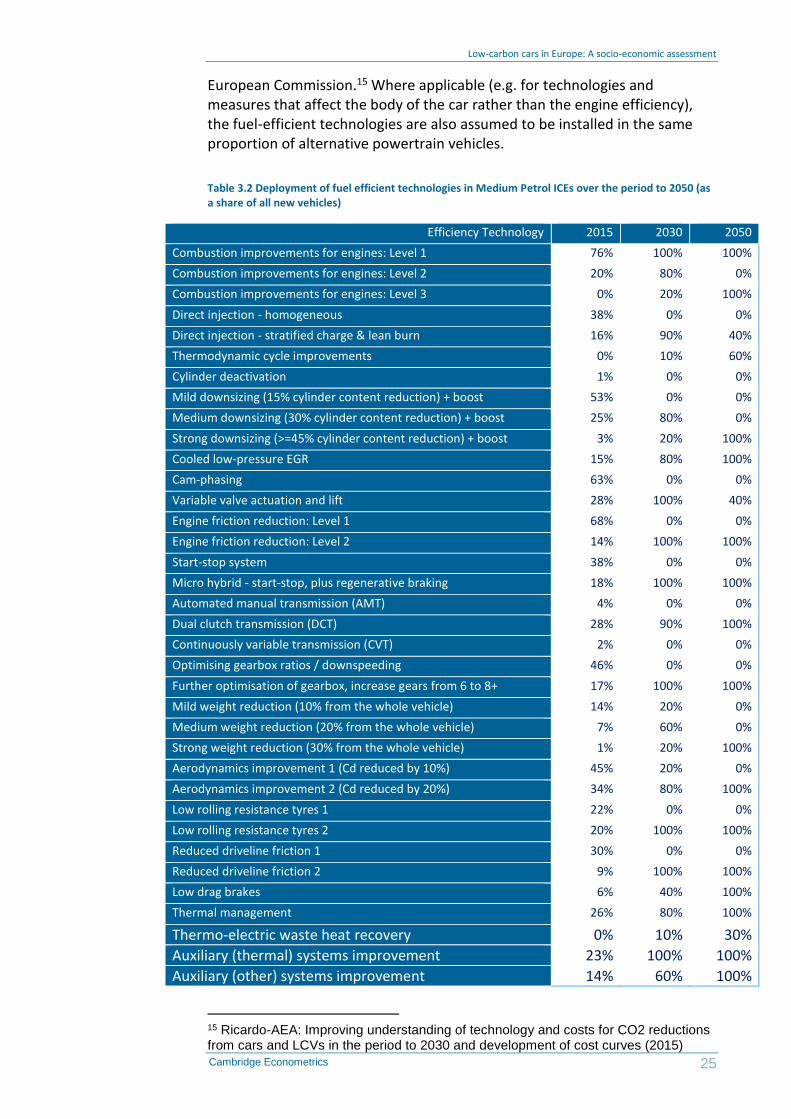
Table 3.2 and Table 3.3 below show the assumptions used on the uptake of fuel efficient technologies for petrol and diesel ICEs in our TECH, TECH PHEV and TECH OEM scenarios. This deployment schedule is taken from the baseline scenario reported for the Ricardo-AEA cost curve study for the
12 Element Energy for Transport and Environment (2016) Towards a European Market for Electro-Mobility 13 Trade data used is that collated and estimated by CE for use in T&E’s EU Transport Roadmap Model (EUTRM) 14 EEA Air pollutant emission inventory guidebook 2016
Low-carbon cars in Europe: A socio-economic assessment
25 Cambridge Econometrics
European Commission.15 Where applicable (e.g. for technologies and measures that affect the body of the car rather than the engine efficiency), the fuel-efficient technologies are also assumed to be installed in the same proportion of alternative powertrain vehicles.
Table 3.2 Deployment of fuel efficient technologies in Medium Petrol ICEs over the period to 2050 (as a share of all new vehicles)
Efficiency Technology 2015 2030 2050
Combustion improvements for engines: Level 1 76% 100% 100%
Combustion improvements for engines: Level 2 20% 80% 0%
Combustion improvements for engines: Level 3 0% 20% 100%
Direct injection - homogeneous 38% 0% 0%
Direct injection - stratified charge & lean burn 16% 90% 40%
Thermodynamic cycle improvements 0% 10% 60%
Cylinder deactivation 1% 0% 0%
Mild downsizing (15% cylinder content reduction) + boost 53% 0% 0%
Medium downsizing (30% cylinder content reduction) + boost 25% 80% 0%
Strong downsizing (>=45% cylinder content reduction) + boost 3% 20% 100%
Cooled low-pressure EGR 15% 80% 100%
Cam-phasing 63% 0% 0%
Variable valve actuation and lift 28% 100% 40%
Engine friction reduction: Level 1 68% 0% 0%
Engine friction reduction: Level 2 14% 100% 100%
Start-stop system 38% 0% 0%
Micro hybrid - start-stop, plus regenerative braking 18% 100% 100%
Automated manual transmission (AMT) 4% 0% 0%
Dual clutch transmission (DCT) 28% 90% 100%
Continuously variable transmission (CVT) 2% 0% 0%
Optimising gearbox ratios / downspeeding 46% 0% 0%
Further optimisation of gearbox, increase gears from 6 to 8+ 17% 100% 100%
Mild weight reduction (10% from the whole vehicle) 14% 20% 0%
Medium weight reduction (20% from the whole vehicle) 7% 60% 0%
Strong weight reduction (30% from the whole vehicle) 1% 20% 100%
Aerodynamics improvement 1 (Cd reduced by 10%) 45% 20% 0%
Aerodynamics improvement 2 (Cd reduced by 20%) 34% 80% 100%
Low rolling resistance tyres 1 22% 0% 0%
Low rolling resistance tyres 2 20% 100% 100%
Reduced driveline friction 1 30% 0% 0%
Reduced driveline friction 2 9% 100% 100%
Low drag brakes 6% 40% 100%
Thermal management 26% 80% 100%
Thermo-electric waste heat recovery 0% 10% 30%
Auxiliary (thermal) systems improvement 23% 100% 100%
Auxiliary (other) systems improvement 14% 60% 100%
15 Ricardo-AEA: Improving understanding of technology and costs for CO2 reductions from cars and LCVs in the period to 2030 and development of cost curves (2015)

Low-carbon cars in Europe: A socio-economic assessment
26 Cambridge Econometrics
Table 3.3 Deployment of fuel efficient technologies in Medium Diesel ICEs over the period to 2050 (as a share of all new vehicles)
Efficiency Technology 2015 2030 2050
Combustion improvements for engines: Level 1 76% 100% 100%
Combustion improvements for engines: Level 2 11% 80% 100%
Combustion improvements for engines: Level 3 0% 20% 100%
Mild downsizing (15% cylinder content reduction) + boost 53% 0% 0%
Medium downsizing (30% cylinder content reduction) + boost 15% 80% 0%
Strong downsizing (>=45% cylinder content reduction) + boost 3% 20% 100%
Cooled low-pressure EGR 14% 100% 100%
Variable valve actuation and lift 9% 60% 100%
Engine friction reduction: Level 1 68% 0% 0%
Engine friction reduction: Level 2 14% 100% 100%
Start-stop system 47% 0% 0%
Micro hybrid - start-stop, plus regenerative braking 22% 100% 100%
Automated manual transmission (AMT) 4% 0% 0%
Dual clutch transmission (DCT) 23% 70% 100%
Continuously variable transmission (CVT) 1% 0% 0%
Optimising gearbox ratios / downspeeding 62% 0% 0%
Further optimisation of gearbox, increase gears from 6 to 8+ 17% 100% 100%
Mild weight reduction (10% from the whole vehicle) 14% 20% 0%
Medium weight reduction (20% from the whole vehicle) 7% 60% 0%
Strong weight reduction (30% from the whole vehicle) 1% 20% 100%
Aerodynamics improvement 1 (Cd reduced by 10%) 41% 20% 0%
Aerodynamics improvement 2 (Cd reduced by 20%) 35% 80% 100%
Low rolling resistance tyres 1 24% 0% 0%
Low rolling resistance tyres 2 26% 100% 100%
Reduced driveline friction 1 40% 0% 0%
Reduced driveline friction 2 9% 100% 100%
Low drag brakes 6% 40% 100%
Thermal management 21% 80% 100%
Thermo-electric waste heat recovery 0% 10% 30%
Auxiliary (thermal) systems improvement 23% 100% 100%
Auxiliary (other) systems improvement 14% 60% 100%
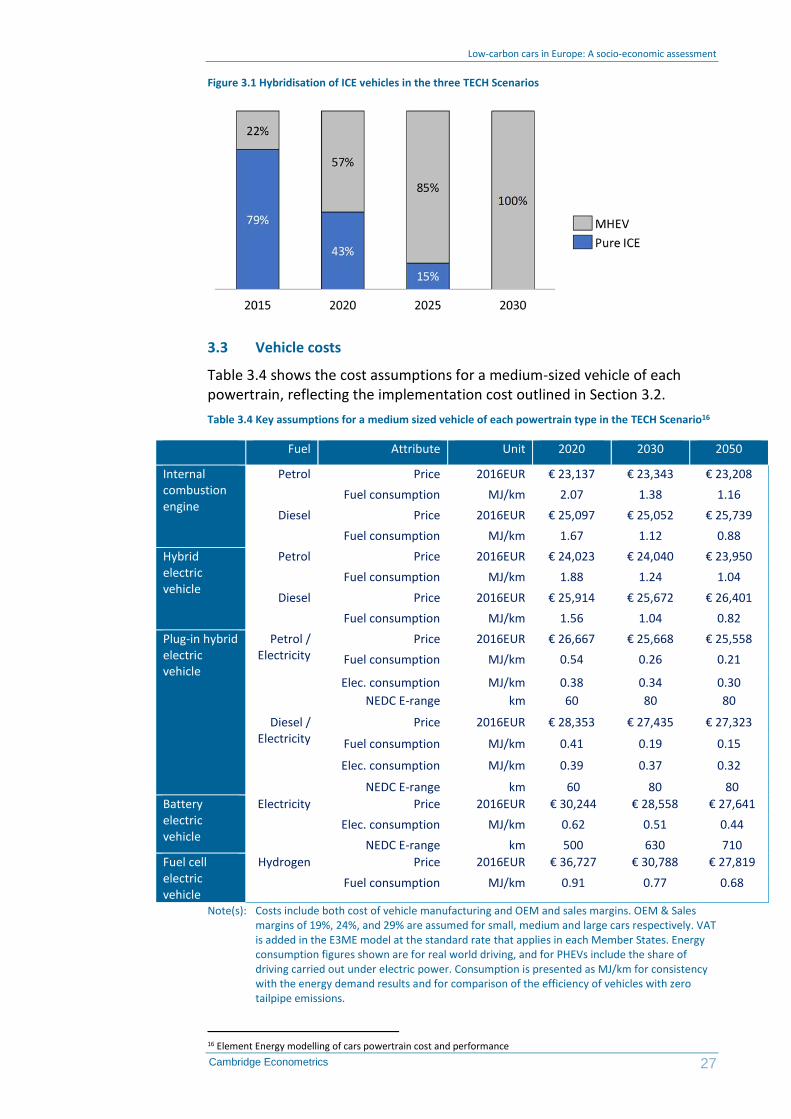
In summary this encompasses an assumption around the hybridisation of ICE vehicles in the three TECH scenarios. Under our definition of an ICE, hybridisation is limited to micro-hybrids (MHEV) with 48V electrical systems, start-stop technology and regenerative braking. In 2020, these hybridisation technologies are assumed to have been deployed across ~60% of new ICE cars, and 100% by 2030 as shown in Figure 3.1.
Low-carbon cars in Europe: A socio-economic assessment
27 Cambridge Econometrics
Figure 3.1 Hybridisation of ICE vehicles in the three TECH Scenarios
3.3 Vehicle costs
Table 3.4 shows the cost assumptions for a medium-sized vehicle of each powertrain, reflecting the implementation cost outlined in Section 3.2.
Table 3.4 Key assumptions for a medium sized vehicle of each powertrain type in the TECH Scenario16
Powertrain Fuel Attribute Unit 2020 2030 2050
Internal combustion engine
Petrol Price 2016EUR € 23,137 € 23,343 € 23,208
Fuel consumption MJ/km 2.07 1.38 1.16
Diesel Price 2016EUR € 25,097 € 25,052 € 25,739
Fuel consumption MJ/km 1.67 1.12 0.88
Hybrid electric vehicle
Petrol Price 2016EUR € 24,023 € 24,040 € 23,950
Fuel consumption MJ/km 1.88 1.24 1.04
Diesel Price 2016EUR € 25,914 € 25,672 € 26,401
Fuel consumption MJ/km 1.56 1.04 0.82
Plug-in hybrid electric vehicle
Petrol / Electricity
Price 2016EUR € 26,667 € 25,668 € 25,558
Fuel consumption MJ/km 0.54 0.26 0.21
Elec. consumption MJ/km 0.38 0.34 0.30
NEDC E-range km 60 80 80
Diesel / Electricity
Price 2016EUR € 28,353 € 27,435 € 27,323
Fuel consumption MJ/km 0.41 0.19 0.15
Elec. consumption MJ/km 0.39 0.37 0.32
NEDC E-range km 60 80 80
Battery electric vehicle
Electricity Price 2016EUR € 30,244 € 28,558 € 27,641
Elec. consumption MJ/km 0.62 0.51 0.44
NEDC E-range km 500 630 710
Fuel cell electric vehicle
Hydrogen Price 2016EUR € 36,727 € 30,788 € 27,819
Fuel consumption MJ/km 0.91 0.77 0.68
Note(s): Costs include both cost of vehicle manufacturing and OEM and sales margins. OEM & Sales margins of 19%, 24%, and 29% are assumed for small, medium and large cars respectively. VAT is added in the E3ME model at the standard rate that applies in each Member States. Energy consumption figures shown are for real world driving, and for PHEVs include the share of driving carried out under electric power. Consumption is presented as MJ/km for consistency with the energy demand results and for comparison of the efficiency of vehicles with zero tailpipe emissions.
16 Element Energy modelling of cars powertrain cost and performance

Low-carbon cars in Europe: A socio-economic assessment
28 Cambridge Econometrics
3.4 Battery costs and range
A key input to the modelling of EV cost is the battery pack size (kWh). There is currently considerable uncertainty about future battery pack sizes, as these will depend both on future reductions in battery costs and OEM design choices to balance vehicle driving ranges against cost, based on customer preferences. While the plug-in hybrid market shows a convergence for the electric driving range at around 50 km, the battery electric vehicle market shows greater diversity and speed of change. BEVs are beginning the transition from first generation vehicles such as the Nissan Leaf and VW Golf with driving ranges of 150-200 km to second generation models such as the Chevrolet Bolt and Tesla Model 3 and new entrants from German OEMs in the premium sector such as the Audi E-tron/Q8 and Porsche Mission E concepts. OEM statements suggest that medium size next generation BEVs will target driving ranges of 320 km or more, while large vehicles will have longer ranges of 500 km or more, similar to the Tesla Model S. In smaller segments, Renault has almost doubled the range of the B-segment Zoe (to 400km NEDC) by upgrading the battery pack size to c.40 kWh. Figure 3.2 plots the driving ranges of BEVs (past models and some of the announced models). It shows an overall upward trend, but a virtually constant range for small cars.
Figure 3.2 Official driving range (km, NEDC) of battery electric vehicles introduced on the EU market
(2010-2017) and announced (2018-2020). EE compilation of publicly available data.
Taking these trends into consideration, Table 3.5 shows the proposed battery size assumptions for hybrid, plug-in hybrid and battery electric vehicles between 2020 and 2050.
Given the costs of increasing BEV driving ranges through additional battery capacity, it is expected that OEMs will offer multiple battery configurations to allow customers to make a trade-off between vehicle price and range. This is already seen in the Nissan Leaf, where 24 kWh and the newer 30 kWh are both on sale. To account for this, we assume ‘short-range’ and ‘long-range’ versions of BEVs in the modelling.
Beyond 2020, we have used different assumptions for PHEVs and BEVs on changes in battery capacity. For PHEVs, we assume that the electric range will be increased to 80 km (NEDC) by 2025 in order to provide approximately 50 km of real world range. Beyond this point, it is assumed that OEMs maintain this electric driving range of 80 km, and decrease pack sizes over time as vehicle efficiency improvements lead to reductions in energy use per km. For
Definitions

Low-carbon cars in Europe: A socio-economic assessment
29 Cambridge Econometrics
BEVs, we assume that pack sizes are held constant, and vehicle driving ranges increase over time as improvements in battery energy density reduce pack weight (currently over 400 kg for the 60 kWh pack in the Chevrolet Bolt) and vehicle-level efficiency improvements reduce energy consumption per kilometre.
The battery sizes are intended to be representative, since in practice there are a wide range of options and specifications available to manufacturers, leading to a wide range of costs, performance and range.
Table 3.5 Battery size assumptions
Battery sizes (kWh)
Powertrain Market segment
2020 2030 2040 2050
HEV Small 0.95 0.82 0.78 0.74
HEV Medium 1.00 0.86 0.81 0.77
HEV Large 1.27 1.11 1.05 1.00
PHEV Small 4.47 4.51 4.25 4.03
PHEV Medium 7.62 7.58 7.14 6.77
PHEV Large 10.51 10.71 10.24 9.78
BEV – Short range
Small 21.00 21.00 21.00 21.00
BEV – Short range
Medium 28.00 28.00 28.00 28.00
BEV – Short range
Large - - - -
BEV – Long range
Small 45.00 45.00 45.00 45.00
BEV – Long range
Medium 60.00 60.00 60.00 60.00
BEV – Long range
Large 92.00 92.00 92.00 92.00
The primary influence on plug-in vehicle cost and performance is battery technology, since other components such as electric motors are already well developed and have more limited potential for future improvements. There are four key areas of battery technology where breakthroughs are needed:
• reducing the cost
• increasing the specific energy (to improve vehicle range/performance for a given battery weight or reduce weight for a given battery kWh capacity)
• improving usable operational lifetime
• reducing recharging time, for example allowing rapid charging at 150 kW+ with no impact on battery state of health
In the short to medium term, lithium ion battery technology is expected to form the principal basis of batteries for use in full HEVs and more advanced
Costs and energy savings

Low-carbon cars in Europe: A socio-economic assessment
30 Cambridge Econometrics
plug-in vehicles (i.e. PHEVs, BEVs). Discussions with OEMs and cell suppliers have confirmed there is significant scope for innovation within lithium ion chemistries, such as increasing use of silicon in the anode, use of solid state electrolytes and improved packaging efficiency. In the medium term, lithium-sulphur and lithium-air hold perhaps the most promise (up to five and ten times the energy density of lithium ion respectively in theory, twice and three times in practice at pack level), but these technologies are believed to be relevant only in 2030 and beyond, if key challenges such as short life are overcome.
Two scenarios are proposed for the battery cost projections. The OEM announcement scenario is in line with OEM announcements and other publications, and a more conservative ‘Bottom-up model scenario’ is based on a recent Element Energy study for BEUC (the European Consumer Association). That study employed Element Energy’s component-level model of battery costs, which takes into account cell costs and performance developments over time, as well as packing costs such as thermal management, wiring harnesses, containers and the Battery Management System. The battery cost projections of each scenario are outlined in Figure 3.3.
Figure 3.3 Battery system costs (€/kWh) for a large long-range BEV in both the 'Bottom up model' and 'OEM announcement' scenarios
Results from the Element Energy’s battery cost model suggest strong reductions in battery costs between now and 2030, reaching a cost of €135/kWh for a large (>60 kWh) pack. This is based on materials and manufacturing costs plus a margin and does not account for short-term strategic pricing such as incurring losses in early deployments to build market share. These strategic pricing decisions could take place either at the OEMs or their suppliers, for example with cell manufacturers offering low prices to build market share and maximise throughput in new plants, or OEMs cross-subsidising zero emission models with profits from conventional vehicles.
The Element Energy costs projections are comparable to the projections made by battery experts Avicenne, who forecast a pack level cost of €260/kWh and
Bottom up model case

Low-carbon cars in Europe: A socio-economic assessment
31 Cambridge Econometrics
€205/kWh in 2020 and 2025 respectively for a 30 kWh pack (vs. €249/kWh and €198/kWh in the Element Energy cost estimates).
Nonetheless, these estimates are seen as conservative compared to some cost projections recently published; they are therefore used for a high-cost case sensitivity test.
The costs are an average taken from announcements from car OEMs, as well as publications by the ICCT (2016) and McKinsey (2017). We assume that battery costs reach €130/kWh at a pack level by 2020, falling to €90/kWh by 2030. This is equivalent to achieving the 2030 ‘Modelled costs’ 10 years early, in 2020. Under this scenario, only long range BEVs are assumed to be sold since vehicles would be cost effective even with relatively large battery packs. The two cost scenarios are shown in Table 3.6 and Table 3.7.
For comparison, OEM announcements include estimates from GM that the cost of the Chevrolet Bolt battery is $145/kWh at the cell level, equivalent to €175/kWh at a pack level assuming that packing costs add 33% to the cell cost). GM also published a roadmap for cell costs suggesting that a cell cost of $100/kWh (€90/kWh) is expected by 2022. The most optimistic recent estimates suggest that battery packs from the Tesla Gigafactory could reach $125/kWh by 2020 at a pack level (€110/kWh, $88/kWh cell cost plus $38/kWh for packing costs). Tesla itself expects a 33% reduction in cost from the approximately $250/kWh pack costs in the current Model S.
Table 3.6 Battery system costs - OEM announcement case
Battery system costs (€/kWh)
Powertrain Market segment 2020 2030 2040 2050
HEV Small 490 326 256 222
HEV Medium 490 326 256 222
HEV Large 490 326 256 222
PHEV Small 274 190 173 149
PHEV Medium 274 190 173 149
PHEV Large 274 190 173 149
BEV – Short Small 176 129 118 101
BEV – Short Medium 157 115 105 90
BEV – Short Large 135 90 82 70
BEV – Long Small 141 98 89 76
BEV – Long Medium 141 98 89 76
BEV – Long Large 135 90 82 70
OEM announcement
case
Low-carbon cars in Europe: A socio-economic assessment
32 Cambridge Econometrics
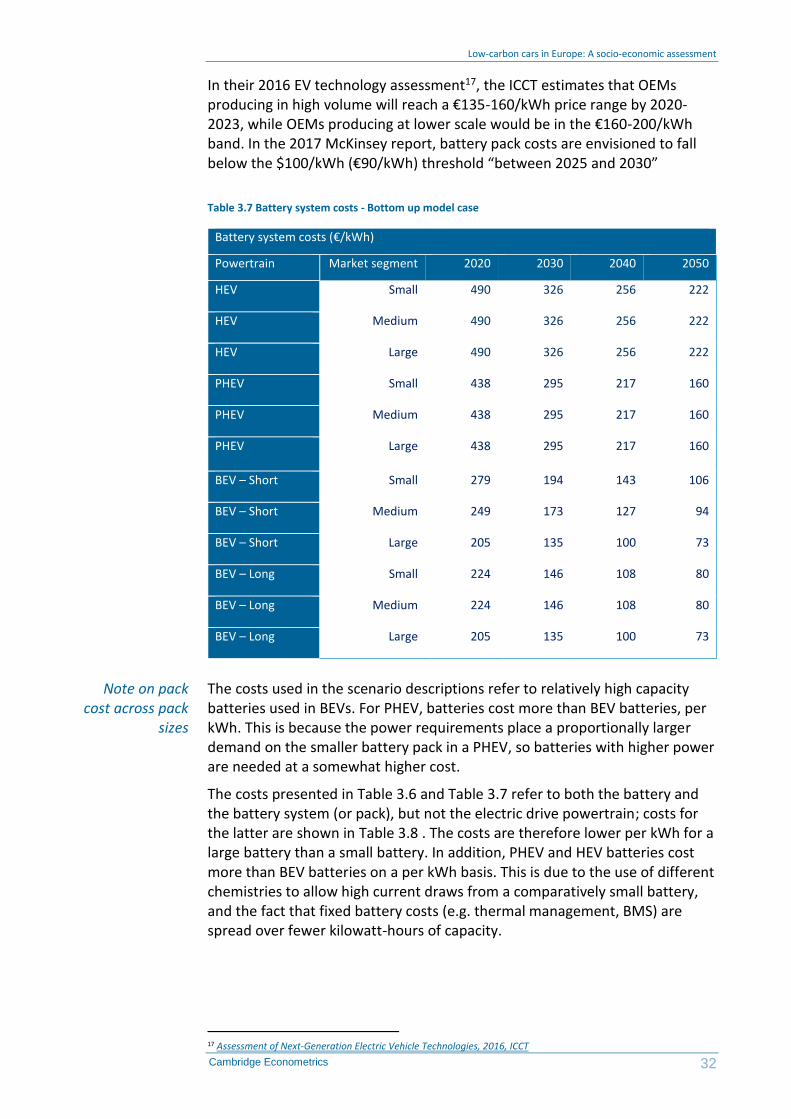
In their 2016 EV technology assessment17, the ICCT estimates that OEMs producing in high volume will reach a €135-160/kWh price range by 2020-2023, while OEMs producing at lower scale would be in the €160-200/kWh band. In the 2017 McKinsey report, battery pack costs are envisioned to fall below the $100/kWh (€90/kWh) threshold “between 2025 and 2030”
Table 3.7 Battery system costs - Bottom up model case
Battery system costs (€/kWh)
Powertrain Market segment 2020 2030 2040 2050
HEV Small 490 326 256 222
HEV Medium 490 326 256 222
HEV Large 490 326 256 222
PHEV Small 438 295 217 160
PHEV Medium 438 295 217 160
PHEV Large 438 295 217 160
BEV – Short Small 279 194 143 106
BEV – Short Medium 249 173 127 94
BEV – Short Large 205 135 100 73
BEV – Long Small 224 146 108 80
BEV – Long Medium 224 146 108 80
BEV – Long Large 205 135 100 73
The costs used in the scenario descriptions refer to relatively high capacity batteries used in BEVs. For PHEV, batteries cost more than BEV batteries, per kWh. This is because the power requirements place a proportionally larger demand on the smaller battery pack in a PHEV, so batteries with higher power are needed at a somewhat higher cost.
The costs presented in Table 3.6 and Table 3.7 refer to both the battery and the battery system (or pack), but not the electric drive powertrain; costs for the latter are shown in Table 3.8 . The costs are therefore lower per kWh for a large battery than a small battery. In addition, PHEV and HEV batteries cost more than BEV batteries on a per kWh basis. This is due to the use of different chemistries to allow high current draws from a comparatively small battery, and the fact that fixed battery costs (e.g. thermal management, BMS) are spread over fewer kilowatt-hours of capacity.
17 Assessment of Next-Generation Electric Vehicle Technologies, 2016, ICCT
Note on pack cost across pack
sizes

Low-carbon cars in Europe: A socio-economic assessment
33 Cambridge Econometrics
Table 3.8 Electric powertrain costs (motor, inverter, booster)
Electric powertrain costs (€)
Powertrain Market segment
2020 2030 2040 2050 kW
HEV Small 412 328 328 328 19
HEV Medium 625 499 499 499 32
HEV Large 748 597 597 597 39
PHEV Small 541 432 432 432 27
PHEV Medium 840 670 670 670 45
PHEV Large 1937 1545 1545 1545 110
BEV – Short Small 1188 948 948 948 65
BEV – Short Medium 1914 1527 1527 1527 109
BEV – Short Large 2333 1861 1861 1861 134
BEV – Long Small 1188 948 948 948 65
BEV – Long Medium 1914 1527 1527 1527 109
BEV – Long Large 2333 1861 1861 1861 134
The powertrain costs vary by approximately a factor of two between the powertrain required for a small HEV and a large BEV. These costs are based on the combination of kW assumptions (shown in the last column above) and the system cost (motor, inverter, boost converter) as used in R-AEA (2015), where the cost goes from a fixed €88 and €16.80/kW in 2020 down to €70 and €13.40/kW in 2030.
Overall, the total battery system and powertrain costs are shown in Table 3.9 for the total electric system and powertrain for each of the different market segments based on the derived battery size.

Low-carbon cars in Europe: A socio-economic assessment
34 Cambridge Econometrics
Table 3.9 Total cost of electric powertrain and battery
Total cost of electric powertrain and battery (€)
Powertrain Market segment
2020 2030 2040 2050
HEV Small 833 553 464 424
HEV Medium 1140 773 665 614
HEV Large 1449 972 825 755
PHEV Small 2462 1630 1400 1160
PHEV Medium 3584 2382 2054 1711
PHEV Large 6053 4113 3621 3107
BEV – Short Small 4888 3667 3420 3074
BEV – Short Medium 6314 4750 4458 4047
BEV – Short Large - - - -
BEV – Long Small 7547 5336 4938 4378
BEV – Long Medium 10393 7377 6847 6101
BEV – Long Large 14453 9964 9230 8196
Note(s): The cost difference between BEV and PHEV will be smaller than the battery cost difference, since a BEV system entirely displaces an ICE, whereas a PHEV only allows for a smaller ICE engine to support it, expect in the case of the large segment, where an overall higher kW is assumed. An ICE has a cost of around €2,000 in the medium category.
In line with recent vehicle cost modelling for ECF and BEUC (2016), we apply State of Charge (SOC) assumptions (Table 3.10) to derive the useable energy of the battery. The expected range (Table 3.11) is then derived based on the test cycle efficiency of the vehicle (in all electric mode, under the Worldwide Harmonised Light Vehicles Test Procedure18).
18 The projected efficiency under the NEDC are converted to WLTP equivalent as per the conversion of each efficiency measure given in Ricardo-AEA (2015). Starting conversion factors for 2015 were sourced from ADAC EcoTest laboratory results. The difference in kWh/km between NEDC and WLTP is typically around 5%.
Battery range

Low-carbon cars in Europe: A socio-economic assessment
35 Cambridge Econometrics
Table 3.10 Battery usable State of Charge (SOC)
Battery usable SOC for electric range (%)
Powertrain Market segment 2020 2030 2040 2050
PHEV Small 70% 72% 74% 75%
PHEV Medium 70% 72% 74% 75%
PHEV Large 70% 72% 74% 75%
BEV Small 85% 90% 90% 90%
BEV Medium 85% 90% 90% 90%
BEV Large 85% 90% 90% 90%
Table 3.11 Vehicle range in full electric mode
All electric range (km – WLTP)
Powertrain Market segment 2020 2030 2040 2050
PHEV Small 38 50 50 50
PHEV Medium 60 80 80 80
PHEV Large 60 80 80 80
BEV – Short Small 202 246 260 271
BEV – Short Medium 253 313 334 353
BEV – Long Small 352 468 495 517
BEV – Long Medium 451 609 647 679
BEV – Long Large 523 710 754 791
The 2020 values in Table 3.11 reflect announced ranges of next generation models. For example, a Chevrolet Bolt or Tesla Model 3 with a range of 200 miles on the US EPA test cycle would have a range of 460-480 km on the NEDC, since the NEDC gives an approximately 40-45% increase in range for a given vehicle19. Ranges continue to increase after 2020 due to improvements in energy use per km (from light-weighting, improved ancillaries, aerodynamics etc.). PHEV ranges increase modestly beyond 2020 for the same reason, but it is assumed that the majority of reduced energy consumption is used to reduce the pack size and cost, since a range of 40-60 km is already sufficient for a large proportion of daily driving.
19 For example, the NEDC range for the Nissan Leaf 30kWh is 155 miles, compared with 107 on the EPA test.

Low-carbon cars in Europe: A socio-economic assessment
36 Cambridge Econometrics
3.5 Fuel cell vehicle assumptions
The assumptions regarding FCEVs build on work carried out by Element Energy for several national hydrogen mobility initiatives, as well as the cross-cutting Hydrogen Mobility Europe (H2ME) demonstration project funded by the Fuel Cells and Hydrogen Joint undertaking. They are based on aggregated and anonymised data provided by technology suppliers and vehicle manufacturers, data from real-world deployments and published data from the national hydrogen mobility initiatives and academic research.
The two largest components influencing the costs of FCEVs are the fuel cell system and the high-pressure hydrogen tank. Future values for these costs are subject to significant uncertainty, since they depend greatly on improvements at a technology level (for example reducing the precious metal content in the stack) and substantial increases in manufacturing volumes. For current costs, representing very low production volumes, fuel cell costs of €200/kW are assumed as a central estimate. Figure 3.4 shows the assumptions.
Figure 3.4 Current and projected costs of fuel cell systems
This is consistent with the 2010 values in the EU Powertrains study20, reflecting the fact that FCEV commercialisation is occurring approximately five years later than assumed in that analysis. Recent discussions with fuel cell vehicle OEMs suggest that these costs reflect likely industry trends once this five-year delay is accounted for. A cost of €200/kW implies a system cost of €20,000 for a 100 kW system. This is broadly consistent with the retail price of the Toyota Mirai (approximately €66,000 plus taxes), but it is not possible to derive directly the fuel cell cost based on the vehicle selling price since the margins for these initial vehicles are unknown. Given the very low sales of fuel cell vehicles before 2020, current fuel cell cost and margin assumptions have only a small impact on the economic modelling in the study. This uncertainty is lower by 2030 (when FCEVs are sufficiently numerous to have macroeconomic impacts), since the majority of OEMs have similar views on
20 FCH JU (2010): A Portfolio of Powertrains for Europe: A Fact-based Analysis
Fuel cell system and hydrogen tank
costs

Low-carbon cars in Europe: A socio-economic assessment
37 Cambridge Econometrics
long-term fuel cell costs and the margins will converge with those of conventional vehicles once high sales volumes are reached.
In 2020 and beyond, significant cost reductions in fuel cell systems are expected due to technology improvements and increasing production volumes. Future assumptions are based on the EU Powertrains Study and the UK’s Hydrogen Technology Innovation Needs Assessment (TINA) carried out by Element Energy and the Carbon Trust. These costs would result in a 100 kW fuel cell system costing €5000-6000 by 2030. Figure 3.5 shows the expected cost progression of hydrogen tanks. These are based on the UK TINA and bilateral discussions with vehicle manufacturers. Like fuel cell costs, significant cost reductions are expected as manufacturing volumes increase, with a reduction of at least 50% relative to today’s prices by 2030.
Figure 3.5 Hydrogen tank cost projections for full power fuel cell electric passenger cars
Low and high estimates of fuel cell and hydrogen tank trends (from the TINA) are also provided for use in sensitivity analysis, reflecting higher and lower sales volume assumptions from system manufacturers as shown in Figure 3.6.

Low-carbon cars in Europe: A socio-economic assessment
38 Cambridge Econometrics
Figure 3.6 Assumed growth in global automotive fuel cell systems (units per manufacturer per year)
Fuel consumption assumptions were developed from the stated New European Drive Cycle (NEDC) range and hydrogen tank size of current generation FCEVs (for example the Hyundai IX-35). This gives a current fuel consumption of c.1.1 kg/100km for a large car, and 0.85 kg/100km for a medium car such as the Toyota Mirai. Fuel consumption is expected to decrease in future model generations, partly due to increasing fuel cell efficiency but also through efficiency savings at a vehicle level such as weight reduction or improved aerodynamics. Assumed fuel efficiency improvements are in line with those in the European Powertrains Study, and are equivalent to a 10% reduction per decade. The effect of non-fuel cell improvements (e.g. due to light-weighting or improved aerodynamics) is aligned with the assumptions for all other powertrains in this study.
Figure 3.7 Fuel consumption assumptions for medium and large FCEVs (kg/100km)
The FCEV driving range between refuelling events is currently around 600 km which is significantly higher than current generation electric vehicles. Range assumptions and the assumed motor and fuel cell powers are shown below in Figure 3.8. As fuel cell costs decrease and fuel efficiency improves, vehicle
Hydrogen fuel consumption
Driving range and system power
outputs

Low-carbon cars in Europe: A socio-economic assessment
39 Cambridge Econometrics
manufacturers may choose to increase vehicle range, or reduce hydrogen tank sizes while keeping the range constant. This also applies to fuel cell and motor powers, where manufacturers can trade off increased power (and hence increased performance) with cost reduction for a given performance. These decisions will depend on perceived customer needs as well as technology progression. A similar trade-off exists for range-extended fuel cell vans, where the relative sizes of the battery and fuel cell stack can be optimised, based on the future rates of cost reduction in each technology.
As a simplifying assumption, motor/fuel cell powers are assumed to remain constant throughout the study timeframe. This is consistent with manufacturers favouring cost reduction to improve total cost of ownership relative to conventional vehicles, rather than ‘spending’ technology improvements on better performance. Fuel tank sizes are assumed to remain constant and therefore any fuel efficiency improvements result in an increased driving range. This increase in range is similar to a recent Hyundai prototype (800 km range), and also reflects the need to provide similar operating range to diesel cars and maintain an operational advantage compared with battery electric vehicles for long range duty cycles.
Figure 3.8 Modelling assumptions for hydrogen vehicle range and power outputs of drive motors and fuel cell systems
Hydrogen production for the transport sector is expected to be dominated by water electrolysers, steam methane reforming (SMR) and by-product from industrial processes (for example chloralkali plants). These sources form the basis of the production mix in this study. Other potential sources include waste or biomass gasification, or SMR with carbon capture and storage. These additional routes could potentially provide low cost, low carbon hydrogen, but are not yet technically or economically proven and have not been included in the cost assumptions below.
Hydrogen production cost data was sourced from the UK Technology Innovation Needs Assessment, and Element Energy and E4Tech’s Development of Water Electrolysis in the European Union study. The capital and fixed operating costs per kg of hydrogen produced are shown in Figure 3.9. SMR and by-product technologies are already mature, and so future cost reductions are assumed to be zero for this study. Current electrolyser costs are relatively high, driven by low manufacturing volumes and relative
Hydrogen production
Low-carbon cars in Europe: A socio-economic assessment
40 Cambridge Econometrics
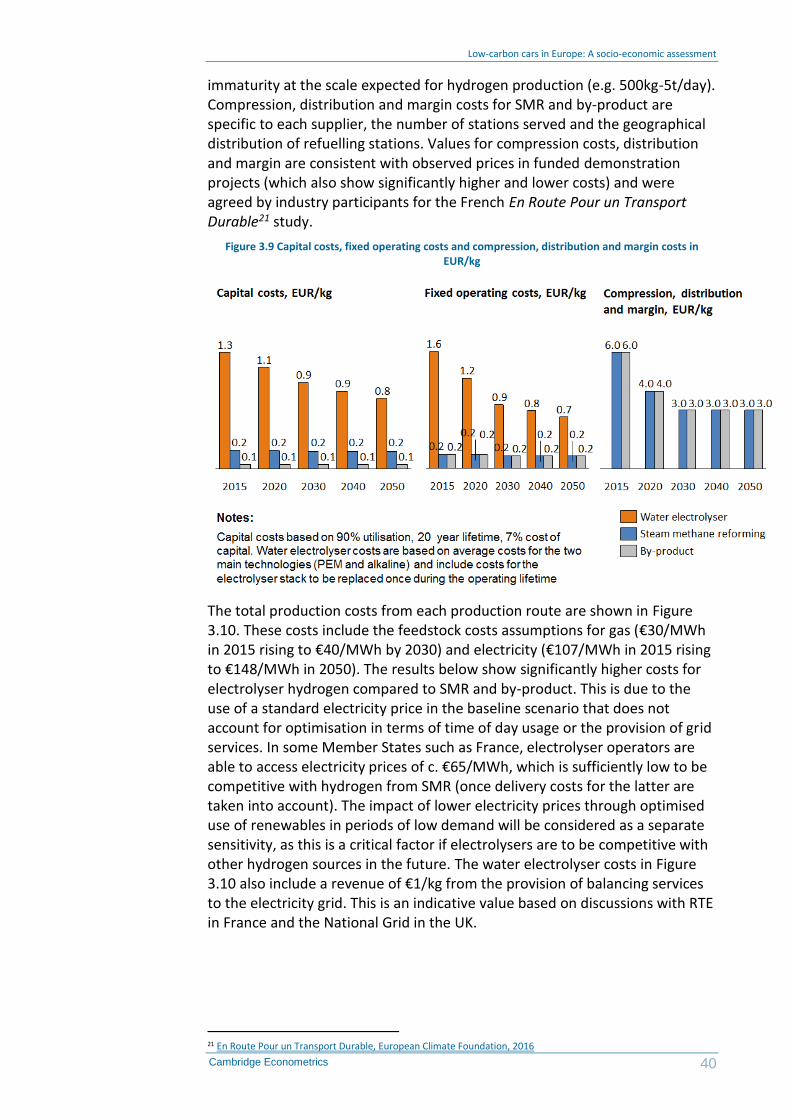
immaturity at the scale expected for hydrogen production (e.g. 500kg-5t/day). Compression, distribution and margin costs for SMR and by-product are specific to each supplier, the number of stations served and the geographical distribution of refuelling stations. Values for compression costs, distribution and margin are consistent with observed prices in funded demonstration projects (which also show significantly higher and lower costs) and were agreed by industry participants for the French En Route Pour un Transport Durable21 study.
Figure 3.9 Capital costs, fixed operating costs and compression, distribution and margin costs in EUR/kg
The total production costs from each production route are shown in Figure 3.10. These costs include the feedstock costs assumptions for gas (€30/MWh in 2015 rising to €40/MWh by 2030) and electricity (€107/MWh in 2015 rising to €148/MWh in 2050). The results below show significantly higher costs for electrolyser hydrogen compared to SMR and by-product. This is due to the use of a standard electricity price in the baseline scenario that does not account for optimisation in terms of time of day usage or the provision of grid services. In some Member States such as France, electrolyser operators are able to access electricity prices of c. €65/MWh, which is sufficiently low to be competitive with hydrogen from SMR (once delivery costs for the latter are taken into account). The impact of lower electricity prices through optimised use of renewables in periods of low demand will be considered as a separate sensitivity, as this is a critical factor if electrolysers are to be competitive with other hydrogen sources in the future. The water electrolyser costs in Figure 3.10 also include a revenue of €1/kg from the provision of balancing services to the electricity grid. This is an indicative value based on discussions with RTE in France and the National Grid in the UK.
21 En Route Pour un Transport Durable, European Climate Foundation, 2016

Low-carbon cars in Europe: A socio-economic assessment
41 Cambridge Econometrics
Figure 3.10 Total costs of hydrogen production. Note that this includes placeholder assumptions for gas and electricity costs which will continue to be refined during the study based on EU averages
The hydrogen production mix in any given hydrogen market will be influenced by relative costs of each production source, customer demand (in terms of the carbon footprint of the hydrogen) and policies such as incentives for green hydrogen. The production mix already varies significantly between leading hydrogen markets in Europe. For example, most, if not all, of the first 100 stations deployed by H2 Mobility Germany will use hydrogen from steam methane reforming or industrial by-product hydrogen delivered by truck. In contrast, most of the recent stations deployed in the UK under the EU-Financed HyFIVE and H2ME projects are supplied by on-site water electrolysers. This is due in part to electrolysis specialists making significant investments in the UK (as they are in Scandinavia), but also due to the relative ease of guaranteeing hydrogen purity from electrolysers compared with SMR routes. The production mix used to calculate the CO2 footprint of hydrogen is shown in Figure 3.11, and shows a slight dominance of SMR-derived hydrogen in 2015, with equal quantities of electrolyser and SMR hydrogen beyond 2020. It should be noted that if the electrolyser market develops quickly, both in terms of technology cost reductions and the ability to provide grid services and take advantage of otherwise-curtailed renewable energy, green hydrogen could become the dominant production method during the 2020s. Grid services can potentially provide up to an additional €80,000 per MW capacity per year and could prove to be a significant incentive to developing the electrolyser market. The production mix shown below in 2020 would deliver an approximately 50% well-to-wheel CO2 saving relative to an equivalent diesel car (assuming the electricity supplied to the water electrolysers is green).
Figure 3.11 Assumed hydrogen production mix

Low-carbon cars in Europe: A socio-economic assessment
42 Cambridge Econometrics
3.6 Power sector assumptions
The structure of the power sector and the renewable content of electricity generation has three important implications for the results of the study:
• it determines the net environmental impact of electrification of the vehicle fleet
• it determines the price of electricity that EV owners will be charged, which has implications for the Total Cost of Ownership (TCO) for an EV relative to a conventional ICE
• it could affect net electricity system costs negatively (distribution costs and additional power requirements) or positively (through synergies between EV and the power grid)
Our power sector projections are based on the European Commission’s PRIMES Reference Scenario 2016. Due to the difficulty in charging different electricity prices to EV users and other final consumers, the price of electricity paid by vehicle users is assumed to be the same to the rate paid by households. Figure 3.12 shows the evolution of average European household prices over the period to 2050.
Figure 3.12 EU28 average electricity price, 2015 prices (€/MWh)
Low-carbon cars in Europe: A socio-economic assessment
43 Cambridge Econometrics
4 Infrastructure requirements
This section describes the definition, costs, deployment of electric charging posts and deployment of hydrogen refuelling stations. It also provides a breakdown of our calculation for total infrastructure requirements.
4.1 Definition and cost
Building on the definitions implemented in the previous Fuelling Europe’s Future study, updated with inputs from several industry stakeholders part of the Steering Committee as well as recent publications (e.g. the EC Transport infrastructure development report), we adopt the following definitions and costs for charging points.
Table 4.1 represents the range of available charge points to end users and illustrates the characteristics and costs of charging posts. Within each ‘archetype’ there is significant variation in price and features. For the residential sector, the standard option is a wall box with a Type 2 connector and a charging rage of 3.7 kW (16 amp single phase) or 7.4 kW (32 amp), though some industry stakeholders believe the latter will make up the majority of residential wall boxes in the future. This solution is often offered through OEM dealerships either with an OEM-branded charging point or through a partnership with an independent provider. For example, BMW offers the Wallbox Pure (3.7 kW) and Wallbox Pro (7.4 kW) solutions for the i3. In some instances, consumers will choose not to install a wall box and simply charge their EVs from a standard socket to avoid paying capacity charges (this is the case in France).
For residential sites with no access to a private driveway or garage, solutions are similar to a private domestic charge point with the addition of options for metering electricity and controlling access to authorised users. In the workplace, we consider that double socket ground-mounted charging posts will prevail in the short term, but these could be replaced in the market by (double or single socket) 11 kW accelerated recharging posts in the medium term.
For public stations in public places such as on-street parking spaces, dedicated car parks and retail car parks, a rate of 11 kW or 22 kW is assumed. The 11 kW rate is predominant in some Member States such as the Netherlands and Germany, and reflects the transition to 11 kW on-board chargers observed among car OEMs. A 22 kW rate is not relevant to many cars today because few EV models are compatible with this rate but this could increase, with the development of on-board chargers that can handle 3 to 43 kW AC, such as those developed by Continental22. The installation rate of 22 kW charging posts has been quite high in some Member States, including France, Ireland and the UK. As the difference between 11 kW and 22 kW posts is not significant in terms of cost (both are based on a 3-phase connection, one at 16 amp, one at 32 amp), the distinction is not made in this study’s modelling. An
22 https://www.continental-corporation.com/en/press/press-releases/allcharge-technology-from-continental-makes-evs-fit-for-any-type-of-charging-station-63864
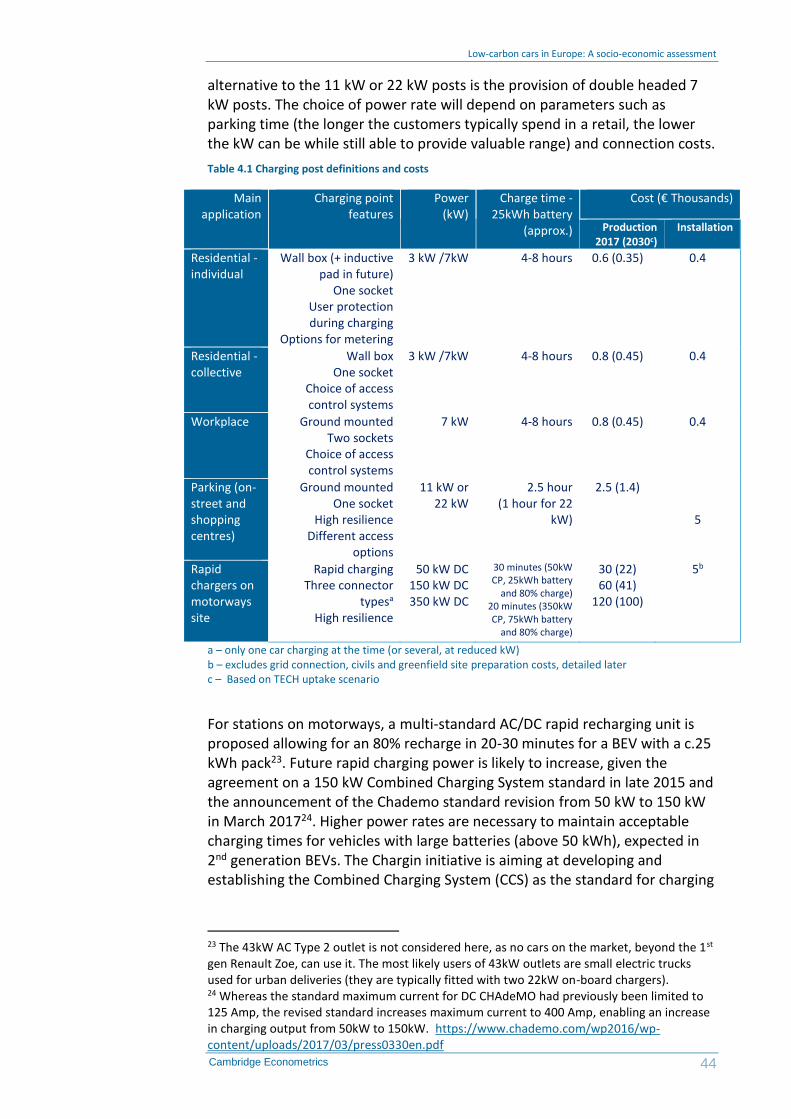
Low-carbon cars in Europe: A socio-economic assessment
44 Cambridge Econometrics
alternative to the 11 kW or 22 kW posts is the provision of double headed 7 kW posts. The choice of power rate will depend on parameters such as parking time (the longer the customers typically spend in a retail, the lower the kW can be while still able to provide valuable range) and connection costs.
Table 4.1 Charging post definitions and costs
Main application
Charging point features
Power (kW)
Charge time - 25kWh battery
(approx.)
Cost (€ Thousands)
Production 2017 (2030c)
Installation
Residential - individual
Wall box (+ inductive pad in future)
One socket User protection during charging
Options for metering
3 kW /7kW 4-8 hours 0.6 (0.35) 0.4
Residential - collective
Wall box One socket
Choice of access control systems
3 kW /7kW 4-8 hours 0.8 (0.45) 0.4
Workplace
Ground mounted Two sockets
Choice of access control systems
7 kW 4-8 hours 0.8 (0.45) 0.4
Parking (on-street and shopping centres)
Ground mounted One socket
High resilience Different access
options
11 kW or 22 kW
2.5 hour (1 hour for 22
kW)
2.5 (1.4)
5
Rapid chargers on motorways site
Rapid charging Three connector
typesa High resilience
50 kW DC 150 kW DC 350 kW DC
30 minutes (50kW CP, 25kWh battery
and 80% charge) 20 minutes (350kW CP, 75kWh battery
and 80% charge)
30 (22) 60 (41)
120 (100)
5b
a – only one car charging at the time (or several, at reduced kW) b – excludes grid connection, civils and greenfield site preparation costs, detailed later c – Based on TECH uptake scenario
For stations on motorways, a multi-standard AC/DC rapid recharging unit is proposed allowing for an 80% recharge in 20-30 minutes for a BEV with a c.25 kWh pack23. Future rapid charging power is likely to increase, given the agreement on a 150 kW Combined Charging System standard in late 2015 and the announcement of the Chademo standard revision from 50 kW to 150 kW in March 201724. Higher power rates are necessary to maintain acceptable charging times for vehicles with large batteries (above 50 kWh), expected in 2nd generation BEVs. The Chargin initiative is aiming at developing and establishing the Combined Charging System (CCS) as the standard for charging
23 The 43kW AC Type 2 outlet is not considered here, as no cars on the market, beyond the 1st gen Renault Zoe, can use it. The most likely users of 43kW outlets are small electric trucks used for urban deliveries (they are typically fitted with two 22kW on-board chargers). 24 Whereas the standard maximum current for DC CHAdeMO had previously been limited to 125 Amp, the revised standard increases maximum current to 400 Amp, enabling an increase in charging output from 50kW to 150kW. https://www.chademo.com/wp2016/wp-content/uploads/2017/03/press0330en.pdf
Low-carbon cars in Europe: A socio-economic assessment
45 Cambridge Econometrics
battery-powered electric vehicles of all kinds25. It envisages using CCS for rates up to 350 kW (‘ultra-fast’). Chargin was launched in 2016 by BMW, Audi, VW, Porsche, Daimler, Ford, Mennekes, GM, Phoenix contact, TUV but has since grown to over 140 members (as of June 2017). A group of car OEMs that are part of Chargin announced in late 2016 their intention to form a Joint Venture and install 400 ultra-fast charging sites26. The first 350 kW station was unveiled by Porsche in July 2017 in Germany27.
As the production volumes of charge points increase, production costs decrease due to advancements in manufacturing techniques and economies of scale. To model this we apply a learning rate to the product cost whereby the cost decreases by 10% for every doubling of annual production. The actual cost is therefore dependent on the uptake scenario modelled. This same learning rate has not been applied to the installation costs as they include fixed costs which will not be reduced with increased production.
The costs shown in Table 4.1 do not account for grid reinforcement. These are covered by the site costs (discussed later) for the case of rapid charging at motorway stations. Installing low rate charging points can also trigger grid reinforcement costs, when a high uptake of EVs is reached.
4.2 Deployment and financing
Over the projection period, we assume that private charging posts (residential and workplace) are financed by the household or business purchasing the EV. For public infrastructure, we assume that in the period to 2025 the investments are paid for by a mixture of public sector financing (e.g. at a national or EU level), private investors (such as the Netherlands Fastned network) and OEMs as part of joint investments in the sector (this is already observed in several EU rapid-charge networks where OEMs such as Renault-Nissan are funding part of the network investments). After 2025, we assume that installations in multi-storey car parks, retail parks and shopping centres will be undertaken by the land management businesses that operate them to attract higher rents and more customers. For this reason, we have not included the real estate costs of creating car parking spaces in the infrastructure costs. Similarly, post 2025 we assume that rapid charging motorway charging posts will be funded purely by private investments as the volume of EVs on the road will make a business model viable.
For deployment, we assume that each EV sold has, on average, either a residential wall box or a workplace charging post in place. In addition, we assume that there will be two public charging posts in urban areas for every ten EVs on the road. These assumptions are in line with the approach developed and reviewed by industry members of the stakeholder groups convened for ‘En route pour un transport durable’ and ‘Low-carbon cars in Germany’.
25 www.charinev.org 26 http://media.daimler.com/marsMediaSite/en/instance/ko/BMW-Group-Daimler-AG-Ford-Motor-Company-and-Volkswagen-Group.xhtml?oid=14866747 27 https://newsroom.porsche.com/de/unternehmen/porsche-zentrum-berlin-adlershof-schnellladepark-solarpylon-13955.html
Financing
Deployment

Low-carbon cars in Europe: A socio-economic assessment
46 Cambridge Econometrics
For rapid charging, there are two considerations for calculating the required infrastructure investments. Firstly, there must be a set maximum distance between charging sites to ensure a battery electric car can travel uninterrupted across the entirety of the European road network. The Good Practice Guide for the Implementation of the Directive on the Deployment of Alternative Fuels recommends a maximum distance between stations of 60 km to provide adequate coverage for electric vehicles. Currently there are over 350,000 km of motorways and main roads across the EU. If we assume a maximum distance of 60 km between charging sites (effectively 30 km in the case of motorways to cater for each side), then this suggests 7,150 rapid charge points are needed to cover the entirety of the EU. Using the OpenChargeMap.org (OCM) database, we estimate there are currently approximately 2,550 rapid charging sites installed on European main roads28. This suggests that a further 4,600 charging sites will be needed across the EU to achieve full coverage, before considering queuing times and the number of charging points per site. This is outlined in Table 4.2.
Table 4.2 Estimated number of rapid charging sites required for full coverage on national roads motorways
Motorway and main/national
road length, km
Number of sites needed for full
mobility
Existing rapid charge points
sites
Further rapid charging sites needed
EU15 274,062 5,640 2,290 3,350
EU13 83,192 1,510 260 1,245
Total 357,254 7,150 2,550 4,595
The cost of preparing these sites will depend on the number of charging posts installed, the location and existing facilities of the site, and most significantly, the level of grid reinforcement needed to cope with the increased local electricity demand.
During the initial uptake of EVs the additional demand on the grid will be relatively low. The assumption is that in the short term, charging stations of a few 50 kW chargers will be installed with overall no major network upgrades needed (according to discussions with rapid charging networks). From 2020, as the uptake of EVs accelerates, the number of chargers at each site will increase and include 150 kW (and eventually 350 kW) posts, requiring upgrades to the local network.
The costs of developing a greenfield site with no pre-existing infrastructure will differ from developing a brownfield site which is located within a conventional fuel filling station. Although it is likely that 50 kW power may not be available in either case, the cost of developing a green field site will be significantly higher than a brownfield site, where the basic infrastructure already exists.
28 Element Energy’s analysis of the OCM database, accessed in June 2017. Discounting charge points found at Nissan car dealerships as these are not based on motorways, and Tesla’s supercharger network sites because they are not currently compatible with non-Tesla cars, to avoid underestimating site preparation costs. Overall, this discounting reduces the number of sites by ca. 15%.

Low-carbon cars in Europe: A socio-economic assessment
47 Cambridge Econometrics
Table 4.3 Rapid charging sites preparation cost (per site). Source: SDG for the EC, Clean Power for Transport Infrastructure Deployment, 2017
Table 4.3 shows the site preparation costs assumed in the study, which are based on a recent study conducted for the European Commission29. For future charging stations, we have assumed a ratio between brownfield and greenfield sites of 6:1. This ratio is based on the analysis in Clean Power for Transport Infrastructure Deployment which calculates the charge points required to reach full mobility on the nine TEN-T corridors. Sites that currently exist are assumed to be small sites (fewer than five charging posts), that will need to be upgraded to accommodate the demand for additional charge points. The upgrade costs are set to the ‘mature state’ brownfield costs and this upgrade cost occurs again for every ten additional charge points installed at a site.
Combining these costs with the need to transition from 2,550 sites to overall 7,150 sites, the total rapid charging sites preparation costs can be calculated. We assume the split of initial/mature and greenfield/brownfield as shown in Figure 4.1. Under these assumptions, the total cost to reach full mobility (defined as a site every 60 km) by 2025 across the EU is €700 million spent, for the preparation of rapid charging sites (i.e. excluding the cost of the charging posts and their installation). Depending on the uptake scenario, there can be additional sites added to accommodate excess charge points, this will reduce the average distance between charging sites, bringing it closer to the density of current conventional fuelling stations.
29 Clean power for Transport Infrastructure Deployment, Directorate-General for Mobility and Transport, European Commission, 2017
Item Initial stage (2
chargers) Mature Stage (8 or
more chargers)
Brownfield site
Grid connection € 10,000 € 345,000
Civils € 64,000 € 82,000
Greenfield site
Access roads € 50,000 € 50,000
Site works € 100,000 € 100,000
Professional fees € 33,000 € 33,000
Grid connection € 5,000 € 340,000
Civils € 64,000 € 82,000
Brownfield site TOTAL € 74,000 € 427,000
Greenfield site TOTAL € 252,000 € 605,000
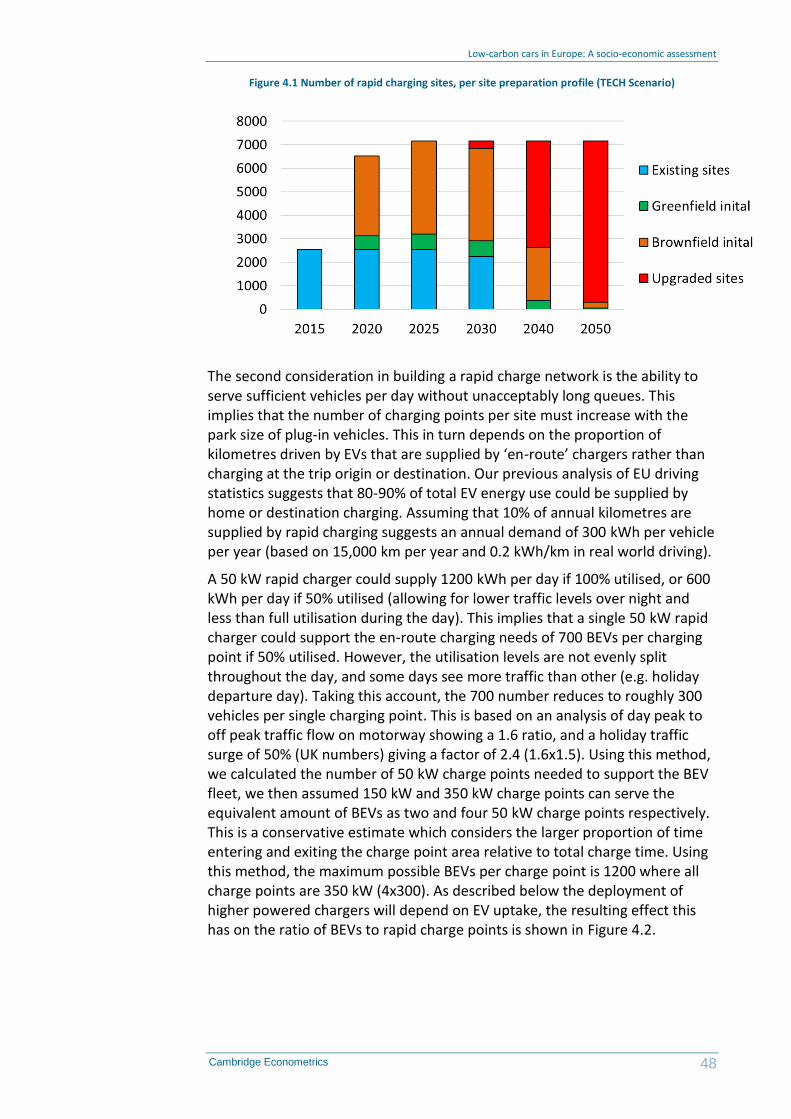
Low-carbon cars in Europe: A socio-economic assessment
48 Cambridge Econometrics
Figure 4.1 Number of rapid charging sites, per site preparation profile (TECH Scenario)
The second consideration in building a rapid charge network is the ability to serve sufficient vehicles per day without unacceptably long queues. This implies that the number of charging points per site must increase with the park size of plug-in vehicles. This in turn depends on the proportion of kilometres driven by EVs that are supplied by ‘en-route’ chargers rather than charging at the trip origin or destination. Our previous analysis of EU driving statistics suggests that 80-90% of total EV energy use could be supplied by home or destination charging. Assuming that 10% of annual kilometres are supplied by rapid charging suggests an annual demand of 300 kWh per vehicle per year (based on 15,000 km per year and 0.2 kWh/km in real world driving).
A 50 kW rapid charger could supply 1200 kWh per day if 100% utilised, or 600 kWh per day if 50% utilised (allowing for lower traffic levels over night and less than full utilisation during the day). This implies that a single 50 kW rapid charger could support the en-route charging needs of 700 BEVs per charging point if 50% utilised. However, the utilisation levels are not evenly split throughout the day, and some days see more traffic than other (e.g. holiday departure day). Taking this account, the 700 number reduces to roughly 300 vehicles per single charging point. This is based on an analysis of day peak to off peak traffic flow on motorway showing a 1.6 ratio, and a holiday traffic surge of 50% (UK numbers) giving a factor of 2.4 (1.6x1.5). Using this method, we calculated the number of 50 kW charge points needed to support the BEV fleet, we then assumed 150 kW and 350 kW charge points can serve the equivalent amount of BEVs as two and four 50 kW charge points respectively. This is a conservative estimate which considers the larger proportion of time entering and exiting the charge point area relative to total charge time. Using this method, the maximum possible BEVs per charge point is 1200 where all charge points are 350 kW (4x300). As described below the deployment of higher powered chargers will depend on EV uptake, the resulting effect this has on the ratio of BEVs to rapid charge points is shown in Figure 4.2.
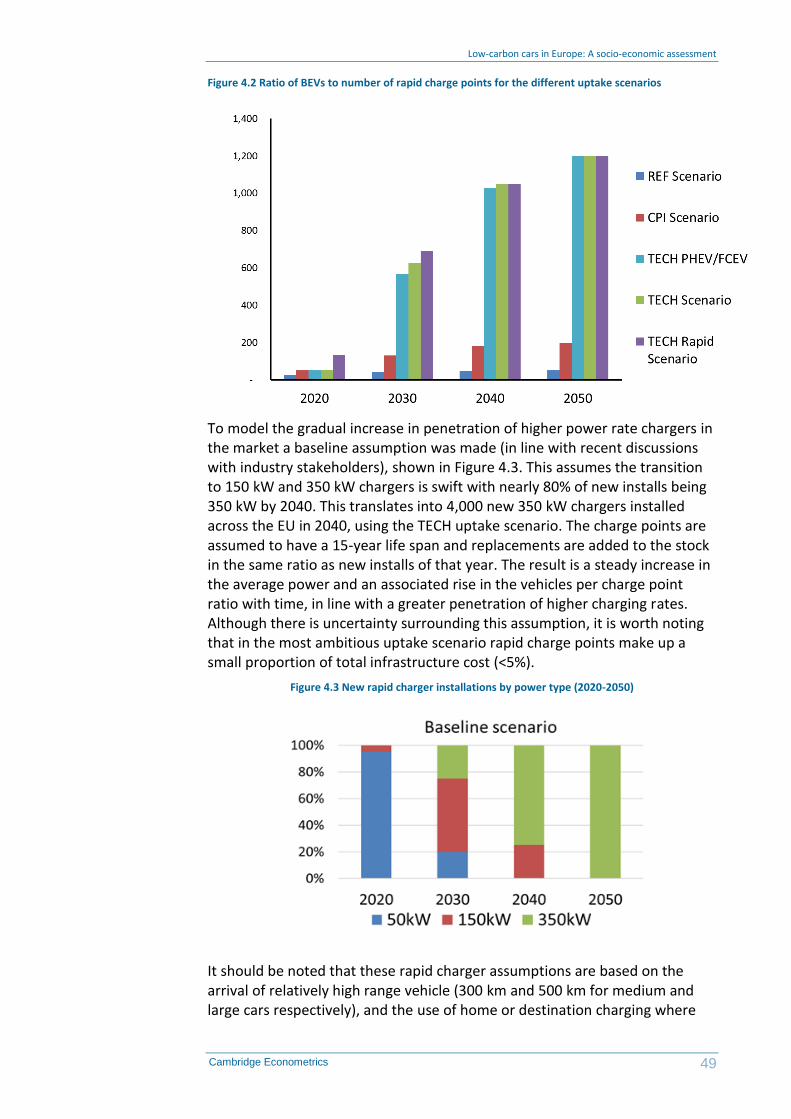
Low-carbon cars in Europe: A socio-economic assessment
49 Cambridge Econometrics
Figure 4.2 Ratio of BEVs to number of rapid charge points for the different uptake scenarios
To model the gradual increase in penetration of higher power rate chargers in the market a baseline assumption was made (in line with recent discussions with industry stakeholders), shown in Figure 4.3. This assumes the transition to 150 kW and 350 kW chargers is swift with nearly 80% of new installs being 350 kW by 2040. This translates into 4,000 new 350 kW chargers installed across the EU in 2040, using the TECH uptake scenario. The charge points are assumed to have a 15-year life span and replacements are added to the stock in the same ratio as new installs of that year. The result is a steady increase in the average power and an associated rise in the vehicles per charge point ratio with time, in line with a greater penetration of higher charging rates. Although there is uncertainty surrounding this assumption, it is worth noting that in the most ambitious uptake scenario rapid charge points make up a small proportion of total infrastructure cost (<5%).
Figure 4.3 New rapid charger installations by power type (2020-2050)
It should be noted that these rapid charger assumptions are based on the arrival of relatively high range vehicle (300 km and 500 km for medium and large cars respectively), and the use of home or destination charging where

Low-carbon cars in Europe: A socio-economic assessment
50 Cambridge Econometrics
possible in preference to en-route rapid charging. The proposed assumptions are summarised in Table 4.4.
Table 4.4 Deployment of EV charging posts
2020 2030 2040 2050
Charging posts per EV
Residential 0.8 0.8 0.8 0.8
Workplace 0.2 0.2 0.2 0.2
Parking 0.2 0.2 0.2 0.2
BEVs per rapid charging points
Fixed number of charging
points required for
EU15 geographic
coverage
Based on uptake
scenario
Based on uptake
scenario
Based on uptake
scenario
Changing the power of all new rapid chargers to 150 kW from 2020 does not have an immediate large impact on the number of vehicles that can be supported by each charging point, because existing BEVs will not support the higher power rate. From the late 2020s, 350 kW charge points might have achieved a noticeable penetration and are likely to significantly decrease charging times as battery pack sizes are unlikely to continue to grow rapidly beyond 60 kWh (or 80 kW-100 kW in larger vehicles).
Combining the considerations regarding the required number of sites and the number of charge points needed to support the BEV fleet we can model the build out of rapid charging infrastructure. This can be divided into three distinct stages and is shown graphically in Figure 4.4:
1 Initial stage: Initial sites are built to achieve full mobility across the EU
road network. This requires 8,000 additional rapid charging posts deployed (based on two chargers per site in the 3,350 sites needed in EU15, and two chargers per site across 500 sites in EU13). This is assumed to occur by 2020 in EU15 and 2025 for EU13
2 Upgrade stage: Once full mobility has been achieved, the current sites are progressively upgraded to mature sites by adding an additional eight charge points to each. For every eight additional charge points needed to support the electric car fleet, one site is upgraded.
3 Mature stage: Once all sites have been upgraded, the number of sites begins to be built out again by the addition of mature sites (or additional upgrades to existing sites). These new mature sites are built in the ratio of one site per ten additional charge points needed. This does not necessarily have to be in new geographic locations but represents the additional site costs of adding ten additional charge points.

Low-carbon cars in Europe: A socio-economic assessment
51 Cambridge Econometrics
Figure 4.4 Number of rapid charge sites in relation to rapid charge points in the TECH uptake scenario (results are for EU15)
To illustrate the resulting deployment levels, Table 4.5 combines the (B)EV per charging points assumptions with the EV stock for the TECH uptake scenario.
Table 4.5 Number of deployed charge points in the TECH scenario (results are for entirety of EU)
Charging posts deployed
(thousands of units)
2020 2030 2040 2050
Residential 1,500 24,500 72,500 121,000
Workplace 400 6,100 18,100 30,300
Parking 400 6,100 18,100 30,300
Rapid charging posts
8 22
61
107
4.3 Hydrogen infrastructure
Fuel cell vehicles are refuelled by hydrogen refuelling stations, dispensing high pressure gaseous hydrogen into the vehicles’ on-board storage tanks. The main elements of a hydrogen refuelling station (HRS) are a compressor, hydrogen storage, pre-cooling/refrigeration equipment and dispensers. The exact configuration of an HRS, in terms of its size, the pressure of primary and buffer storage and dispensing rate per hour, varies according to the station supplier and the intended use. HRS costs in this study are based on three different station sizes (200, 500 and 1000 kg per day), dispensing 700 bar hydrogen and meeting the performance specifications set out in the SAE J2601 international standard. Cost assumptions are drawn from the various H2
Mobility studies around Europe, the UK TINA, and quotations received directly from equipment suppliers. Current and projected installed costs are shown in Figure 4.5, which include equipment, civil works and engineering/project management costs.
Refuelling station costs

Low-carbon cars in Europe: A socio-economic assessment
52 Cambridge Econometrics
Costs are also shown per kilogram of capacity, assuming a 7% per year cost of capital, 90% utilisation factor and a 20-year lifetime. These costs are appropriate for hydrogen stations receiving hydrogen deliveries by truck, or from an on-site electrolyser30. The costs for the electrolyser itself are included in the production cost section.
Hydrogen refuelling station costs are expected to decrease by approximately 50% by 2030, reflecting design improvements and increases in manufacturing volumes. In particular, this is expected to reduce the cost of components (such as compressors and dispensers) currently produced by a limited number of suppliers. By 2030, capital costs represent a relatively small proportion of the expected hydrogen selling price (€7-10/kg), particularly for the larger station sizes. Hence, possible breakthroughs in HRS design that lead to much lower costs than predicted here, while beneficial particularly in terms of reducing capital investment for the early network, do not strongly affect the overall economics of hydrogen refuelling.
Costs shown in this document were validated by the stakeholders in ‘En route pour un transport durable’. These numbers are broadly in line with recent funded deployments in lead markets such as Germany, the UK and Scandinavia, although we are aware of several HRS suppliers aiming to deliver significantly lower cost stations through modular designs and joint procurement mechanisms to allow investments in high volume manufacturing capacity.
Figure 4.5 Capital costs of hydrogen refuelling stations. Assumptions: 90% utilisation, 7% cost of capital, 20-year operating lifetime
Operating costs for HRS are shown in Figure 4.6. Like capital costs, significant cost reductions are expected in future, due to more efficient supply chains, use of local labour for maintenance rather than engineering teams from the equipment supplier, and increased component lifetimes. Again, costs beyond 2020 are a relatively small proportion of the overall hydrogen cost structure,
30 An HRS with an on-site electrolyser producing hydrogen at 10-30 bar will require additional compression relative to a station receiving trucked-in and storing hydrogen at 200 bar. However, since some delivered hydrogen stations also use large volume, low pressure storage, we have not explicitly included an additional compression cost for electrolyser stations only

Low-carbon cars in Europe: A socio-economic assessment
53 Cambridge Econometrics
which is dominated by the cost of the hydrogen itself. This is similar to the cost structure for conventional petrol stations, and unlike that of electric charging points, whose capital costs are high in proportion to the value of the electricity supplied.
Figure 4.6 Fixed operating costs of hydrogen refuelling stations, EUR/kg
The future rate of deployment of HRS in lead European markets for hydrogen is strongly linked to the roll-out of FCEVs, particularly the step change in sales driven by lower cost, second generation vehicles beyond 2020. Based on deployment activities to date (either through national ‘Hydrogen Mobility’ initiatives or participation in EU-funded demonstration projects), the lead markets are expected to be Germany, France, the UK and Scandinavia, with strong recent progress in Benelux and other clusters of deployments in Italy and eastern European countries such as Latvia. Publicly-announced HRS deployments are shown in Table 4.6.
In the case of Germany, deployments beyond the first 100 stations will be explicitly tied to the number of vehicles on the road. In other markets, station deployments are based on current announcements by station investors and operators31, and then linked to the actual number of hydrogen vehicles deployed in Europe. It should be noted since the national H2 Mobility strategies were published, the expected deployment volumes of fuel cell passenger cars have decreased. This is due to the decisions by car makers to produce limited volumes of first generation vehicles, before a significant ramp-up of next generation vehicles after 2020. For example, Toyota has stated that the second-generation fuel cell vehicle will be produced in volumes of 30,000 per year globally, with a further step change in production for a third-generation product in 202532. As with the vehicles, the exact number of stations deployed by 2020 has minimal effect on the macro-economic modelling given the small numbers in relation to the overall car stock.
31 Based on the published strategies of the UK, German and French H2 Mobility coalitions (EAS-HyMob & H2ME) and the Scandinavian Hydrogen Partnership 32 http://www.reuters.com/article/us-toyota-environment-idUSKCN0S80B720151014
Deployment of hydrogen
infrastructure

Low-carbon cars in Europe: A socio-economic assessment
54 Cambridge Econometrics
Table 4.6 Announced hydrogen station deployments in European Member States
Country 2020 2025 2030
France 21 167 773
Germany 100 400 (by 2023)
Scandinavia* 150 300
UK 65 1150
In this study, the number of stations in Europe (and implied capital and operating costs) is linked to the announcements outlined in Table 4.6 and then to the number of FCEVs defined in the various uptake scenarios post 2030. The exception to this is in the REF and CPI Scenarios where no stations are built post 2020 to reflect the lack of FCEVs in the vehicle fleet. The number of passenger cars on the road by 2025 is expected to be between 100,000 and 200,000, based on recent discussions with fuel cell vehicle manufacturers on their introduction dates and production volumes. Additional vehicle types such as the range-extended fuel cell commercial vehicles produced by SymbioFCell in France could add to these numbers.
Based on an average hydrogen consumption of a passenger car of 0.5 kg/day, each 200 kg/day a station can support c. 400 cars and we use this ratio to calculate the initial infrastructure needed to support fuel cell vehicles. In reality, station sizes will vary from large stations of 1000 kg/day, and small (<100 kg/day) stations used to provide coverage in rural areas with low traffic flows. To model the uptake of larger stations as FCEVs market share grows, we have assumed a gradual increase in 500 kg/day and 1000 kg/day stations through time where 500 kg/day stations become the dominant size in 2035. Thereafter, installation of 1000 kg/day stations starts and they become the most deployed stations after 2040. This is shown graphically in Figure 4.7. Using the same logic as above, 500 kg/day and 1000 kg/day stations can support roughly 1,000 and 2,000 cars respectively (see
Table 4.7).
Figure 4.7 proportion of newly installed HRS stations by capacity

Low-carbon cars in Europe: A socio-economic assessment
55 Cambridge Econometrics
Table 4.7 Number of hydrogen refuelling stations in the TECH uptake scenario and the associated volume of FCEVs that can be supported per station
2020 2025 2030 2030-2050
Number of HRS* 200kg/day 500kg/day
336
-
867
-
1461
236
In relation to
number of FCEVs in stock
Max number of FCEVs per HRS
400 400 480 1000 (500kg/day) 2000 (1000kg/day)
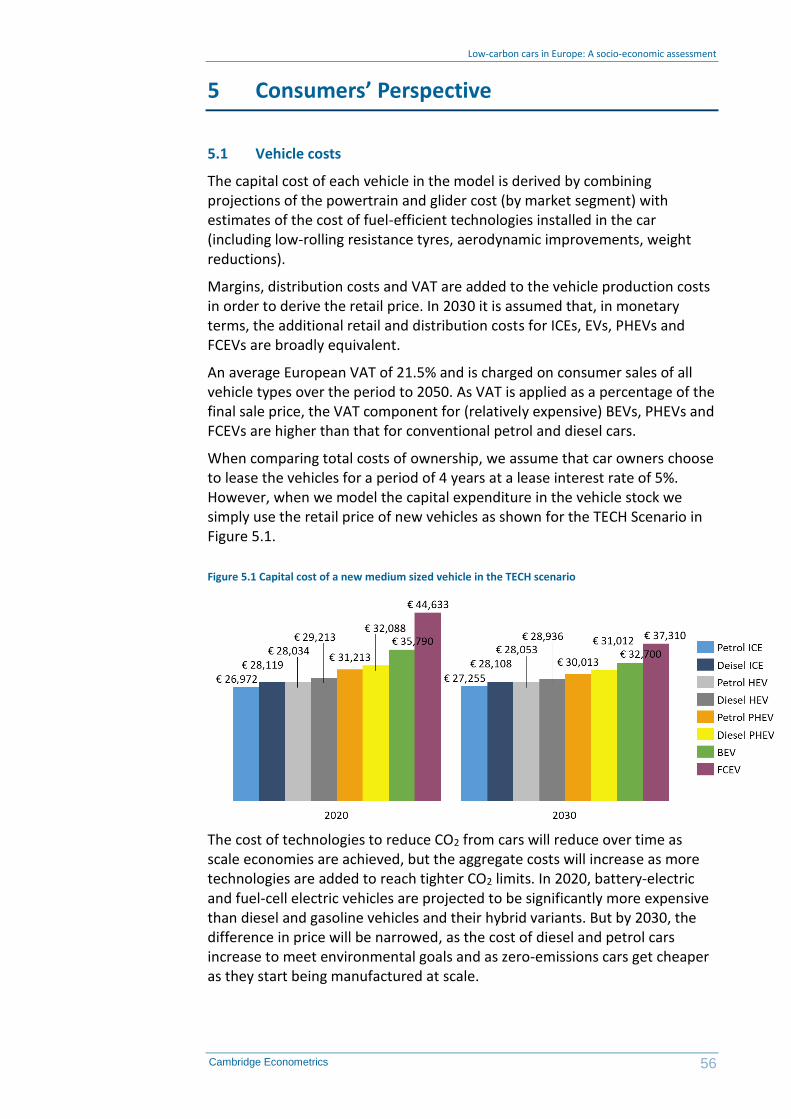
Low-carbon cars in Europe: A socio-economic assessment
56 Cambridge Econometrics
5 Consumers’ Perspective
5.1 Vehicle costs
The capital cost of each vehicle in the model is derived by combining projections of the powertrain and glider cost (by market segment) with estimates of the cost of fuel-efficient technologies installed in the car (including low-rolling resistance tyres, aerodynamic improvements, weight reductions).
Margins, distribution costs and VAT are added to the vehicle production costs in order to derive the retail price. In 2030 it is assumed that, in monetary terms, the additional retail and distribution costs for ICEs, EVs, PHEVs and FCEVs are broadly equivalent.
An average European VAT of 21.5% and is charged on consumer sales of all vehicle types over the period to 2050. As VAT is applied as a percentage of the final sale price, the VAT component for (relatively expensive) BEVs, PHEVs and FCEVs are higher than that for conventional petrol and diesel cars.
When comparing total costs of ownership, we assume that car owners choose to lease the vehicles for a period of 4 years at a lease interest rate of 5%. However, when we model the capital expenditure in the vehicle stock we simply use the retail price of new vehicles as shown for the TECH Scenario in Figure 5.1.
The cost of technologies to reduce CO2 from cars will reduce over time as scale economies are achieved, but the aggregate costs will increase as more technologies are added to reach tighter CO2 limits. In 2020, battery-electric and fuel-cell electric vehicles are projected to be significantly more expensive than diesel and gasoline vehicles and their hybrid variants. But by 2030, the difference in price will be narrowed, as the cost of diesel and petrol cars increase to meet environmental goals and as zero-emissions cars get cheaper as they start being manufactured at scale.
Figure 5.1 Capital cost of a new medium sized vehicle in the TECH scenario

Low-carbon cars in Europe: A socio-economic assessment
57 Cambridge Econometrics
5.2 Fuel costs
One feature of the TECH scenario is a substantial improvement to the efficiency of conventional ICEs, leading to fuel bill savings for owners of petrol and diesel cars. In addition, the transition towards an increase in the share of PHEVs, BEVs and FCEVs has implications for fuel bills in the TECH scenario due to the differences in the costs of these alternative fuels, as well as the improvements in the efficiency of energy conversion in an electric powertrain relative to a conventional ICE.
The oil price projections used for this analysis are taken from IEA’s November 2016 World Energy Outlook and the cost of petrol and diesel production is assumed to grow in line with these oil prices over the period to 2050. The electricity price is considered at a Member State level and increases in line with the 2016 PRIMES Reference Scenario.
As PHEVs, EVs and FCEVs, become more prevalent in the vehicle mix, assumptions about the price of electricity becomes more important and domestic electricity prices are modelled as steadily increasing in line with the wholesale cost of production.
In the TECH scenario, we see a reduction in annual fuel costs across all vehicles though improved fuel efficiency. Savings vary substantially for vehicles for different powertrain types. In 2015, assuming an annual mileage of 15,000km a new medium ICE would cost €1,538 to run. In the TECH scenario, efficiency improvements mean that the average annual cost of fuel for a new ICE is nearly €550 less by 2030 and around €650 by 2050 (See Figure 5.3).
Figure 5.2 Projected cost of petrol, diesel, hydrogen and electricity (2016 €/MWh)
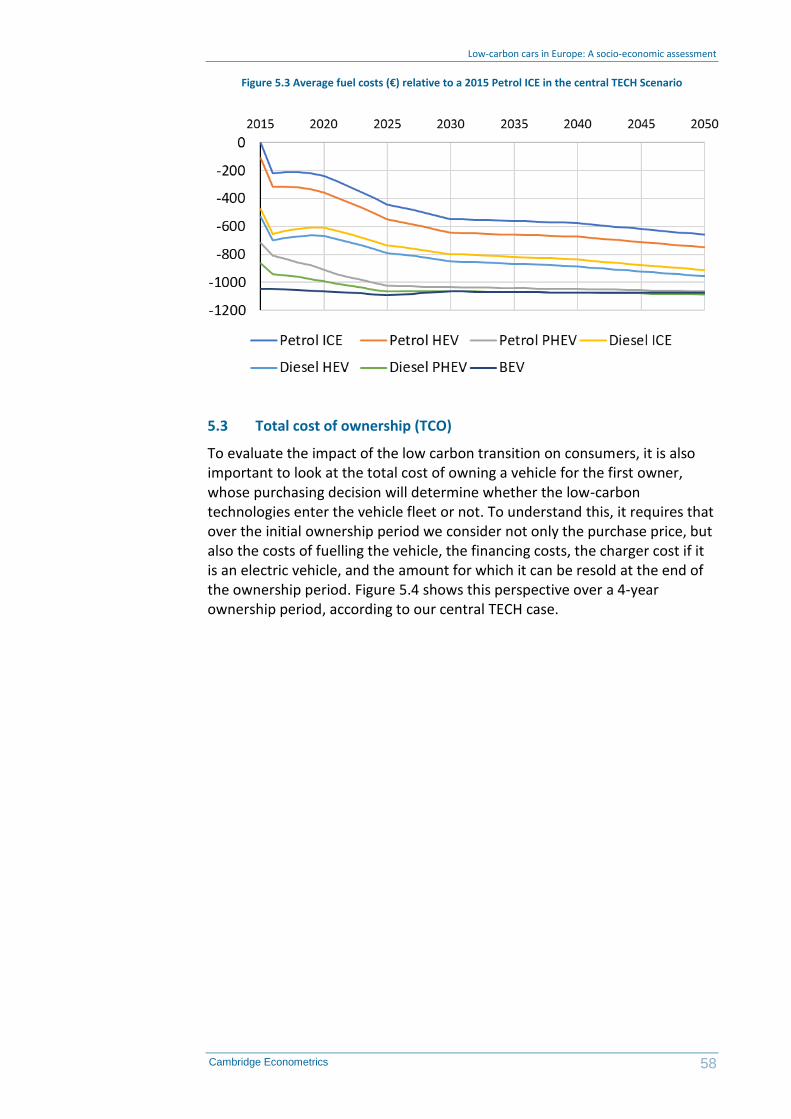
Low-carbon cars in Europe: A socio-economic assessment
58 Cambridge Econometrics
Figure 5.3 Average fuel costs (€) relative to a 2015 Petrol ICE in the central TECH Scenario
5.3 Total cost of ownership (TCO)
To evaluate the impact of the low carbon transition on consumers, it is also important to look at the total cost of owning a vehicle for the first owner, whose purchasing decision will determine whether the low-carbon technologies enter the vehicle fleet or not. To understand this, it requires that over the initial ownership period we consider not only the purchase price, but also the costs of fuelling the vehicle, the financing costs, the charger cost if it is an electric vehicle, and the amount for which it can be resold at the end of the ownership period. Figure 5.4 shows this perspective over a 4-year ownership period, according to our central TECH case.

Low-carbon cars in Europe: A socio-economic assessment
59 Cambridge Econometrics
Figure 5.4 Total cost of owning and running a mid-size car over 4 years with various power trains in the TECH scenario in 2020 and 2030 (€)
The main finding of the TCO analysis is that there is strong convergence in the cost of owning and running all types of vehicles in our central case, and this convergence is much stronger than for the purchase price alone.
As outlined in Section 2 describing the sensitivities tested within the scenario development, there is fair degree of uncertainty about how PHEVs will be driven in terms of the percentage of total mileage driven in electric mode. This is reflected in us testing the impact of high and low sensitivities regarding PHEV electric mileage. In the high electric mileage case, the baseline values are used which have been calculated from real world range. In the low electric mileage case the value used is 50% of the baseline values. This is explained in more detail in Section 2.4.

Low-carbon cars in Europe: A socio-economic assessment
60 Cambridge Econometrics
6 Synergies between EVs and the electricity grid
This section presents Element Energy’s assessment of the synergies between EVs and the electricity system. These include impacts at generation level (additional peaking plant capacity, additional fossil fuel use, increased integration of renewable energy sources by reducing curtailment) and distribution level impacts. The analysis also includes the potential to generate ancillary services for balancing the system, via controlled charging or Vehicle To Grid (V2G) technology.
An assessment of these impacts required a coupling of the energy and transport sectors beyond that which is included in E3ME’s representation of the energy system. Any net costs or benefits identified here, are in addition to the figures determined by Cambridge Econometrics in its E3ME modelling described in Chapter 7.
The analysis is based on vehicle deployment in the TECH scenario.
6.1 Methodology and scope
We model the impacts of EV charging (and H2 generation for FCEVs) for the following items:
• distribution network reinforcement (required if there is an increase in the peak load on the network)
• generation capacity investment (usually Peaking Plant capacity required to meet new peak loads on the network due to EV charging)
• generation production costs/savings (for example additional fuel used in peaking or mid-merit plant to charge EVs)
• smart charging costs (the infrastructure required to enable controlled, or V2G charging)
• balancing services provision (revenues from the provision of these services, usually contracted or mandated by the system operator in each country)
We run separate models for each of five countries, which have distinct EV deployment as well as energy system and renewable energy capacity profiles. The models are run in 2030 and 2050 to represent the differences in EV and RES deployment expected in those years. The baseline aggregate electricity demand is taken from E3ME, which we modify to incorporate EV/energy system synergies. We compare two scenarios of EV charging to this baseline scenario:
• in ‘unmanaged charging’ we assume that vehicles are set to charge as soon as they arrive at their destination (home or workplace) and are plugged in: this tends to increase peak loads on the network
• in ‘smart charging’, where possible the introduction of new peaks on the network is avoided, while ensuring that vehicles have the required charging energy daily

Low-carbon cars in Europe: A socio-economic assessment
61 Cambridge Econometrics
These charging loads are added to the background electricity demand profiles, for each hour of the year. Renewable energy capacities are added to the model with an hourly generation profile determined from historical production datasets. An hourly dispatch model is used to determine the scheduling of fossil fuel plant in response to the applied electricity demand and renewable generation profiles. The dispatch model determines fuel use and energy prices.
In addition, a revenue model also identifies the annual value of providing grid services to the System Operator in each Member State. An EV fleet can provide system services such as primary frequency response, by increasing or reducing the charging demand following a signal from the system operator. V2G technology enhances the system ability to provide these services. We include the costs of a smart system, battery degradation and round-trip losses in V2G operation.
As an alternative to EVs, the revenue model also estimates the revenues that could be generated through controlled dispatching of H2 electrolysers providing H2 for FCEVs.
Baseline electricity demand data is modified from ENTSO-E hourly data. Initial RES and fossil plant capacities are taken from the PRIMES Reference Scenario, meaning that the evolution of capacity by technology is in line with the European Commission’s baseline view. The RES output profiles are based on European historical datasets. A more detailed model description can be found in Appendix C.
6.2 Results: total system costs and benefits
In all countries, unmanaged charging leads to significant additional cost compared with the base case. The bulk of these costs are related to distribution network reinforcements and higher generation production costs (a combination of capital investments in peaking plant and additional fuel use in these low efficiency peaking plants).
Costs are at €2bn or more in each of the investigated countries with high EV penetration (excluding Poland, which has lower EV deployment). Costs are
Passive charging causes significant
costs
Figure 6.1 Unmanaged EV charging (left) vs smart charging (right) in Germany in 2050

Low-carbon cars in Europe: A socio-economic assessment
62 Cambridge Econometrics
highly likely to be socialised leading to an increase in residential electricity prices by 4-8%.
Unmanaged charging leads to use of more polluting plant increasing the carbon intensity of electricity by about 10%.
In all of the investigated countries, shifting the EV charging in time can almost completely avoid any peak increase while still ensuring that EVs are fully charged at the end of their charging window. As a result, additional distribution system investments are largely avoided with smart charging.
Furthermore, investments in generation capacity and fossil fuel costs can be largely avoided with smart charging. Overall, the ICT costs incurred with a smart charging system are exceeded by its benefits.
In the above scenarios, the capacity of renewable energy sources in each country is determined by the input PRIMES scenarios, for consistency with the E3ME analysis. The PRIMES scenarios are meant to be a determination of the economically optimal level of RES deployment which meets a carbon target. This level of RES capacity includes some curtailment of energy when generation exceeds demand. However the charging of an EV fleet can be used to absorb RES at times of excess supply, and therefore a much larger RES capacity can be deployed with the same “economically optimal” level of curtailment as in PRIMES.
Smart charging avoids increase of
peak demand
Smart charging can enable higher
renewable energy penetration
Figure 6.2 System costs and benefits of passive and smart charging in the UK in 2030 (left) and 2050 (right)
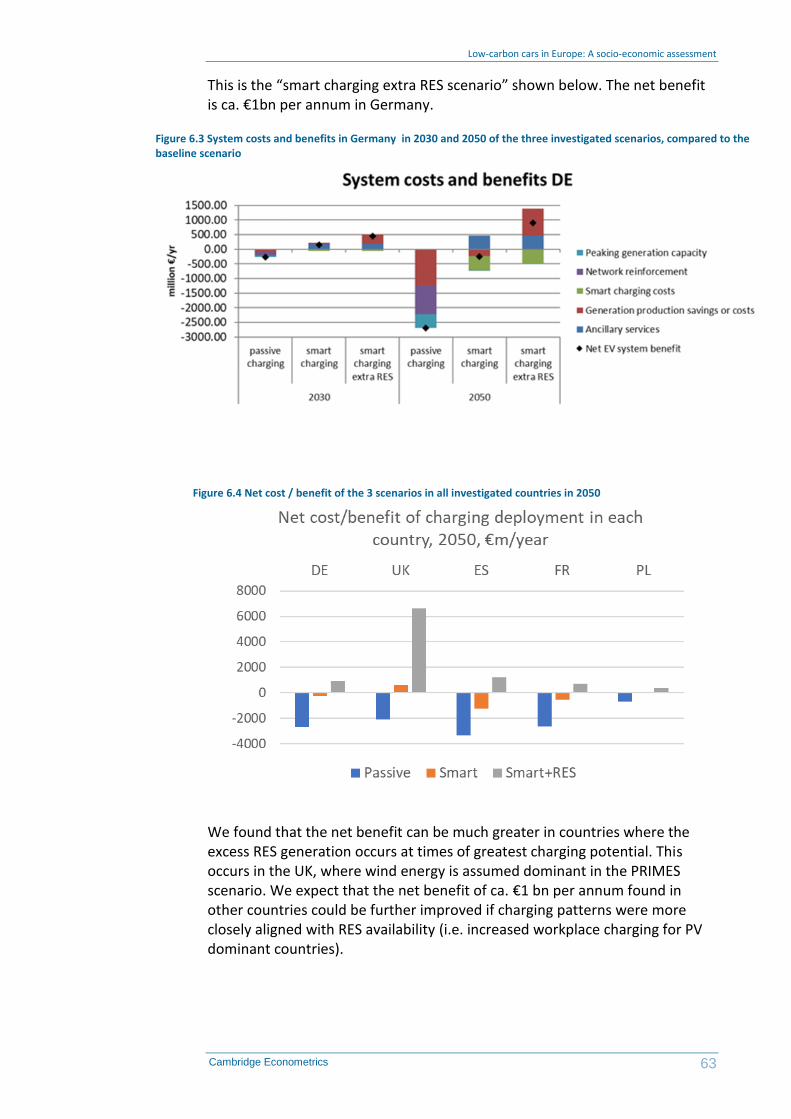
Low-carbon cars in Europe: A socio-economic assessment
63 Cambridge Econometrics
This is the “smart charging extra RES scenario” shown below. The net benefit is ca. €1bn per annum in Germany.
We found that the net benefit can be much greater in countries where the excess RES generation occurs at times of greatest charging potential. This occurs in the UK, where wind energy is assumed dominant in the PRIMES scenario. We expect that the net benefit of ca. €1 bn per annum found in other countries could be further improved if charging patterns were more closely aligned with RES availability (i.e. increased workplace charging for PV dominant countries).
Figure 6.3 System costs and benefits in Germany in 2030 and 2050 of the three investigated scenarios, compared to the baseline scenario
Figure 6.4 Net cost / benefit of the 3 scenarios in all investigated countries in 2050

Low-carbon cars in Europe: A socio-economic assessment
64 Cambridge Econometrics
This opportunity is shown in the figure below. In the UK, the short run
marginal cost (SRMC) of electricity is lowest overnight (where, on average,
demand is lowest and RES deployment is highest), and overnight home
charging is most effective here. In countries with high solar capacities, solar
energy produces low SRMC during the day. Workplace EV charging during the
day would make best use of this energy as well as attract lower price
electricity for charging.
Electricity grids are stabilised with a range of services which balance supply and demand across a range of timescales. Rapid, “response” services (primary control reserve or frequency response) tend to attract higher values per MW of service delivered and are the main revenue streams for EVs. Slower responding services are longer in duration and their values approach that of bulk energy prices.
Generation production savings depend on the RES
profile
EVs can provide the majority of
balancing services
Figure 6.5 Smart EV profile and short run marginal cost of electricity (without EVs) in the UK and Germany in 2050: In the UK, EVs charge at times of low SRMC, whereas in Germany, EVs charge at times of high SRMC.
Figure 6.6 Balancing services by timescale and market where they are procured
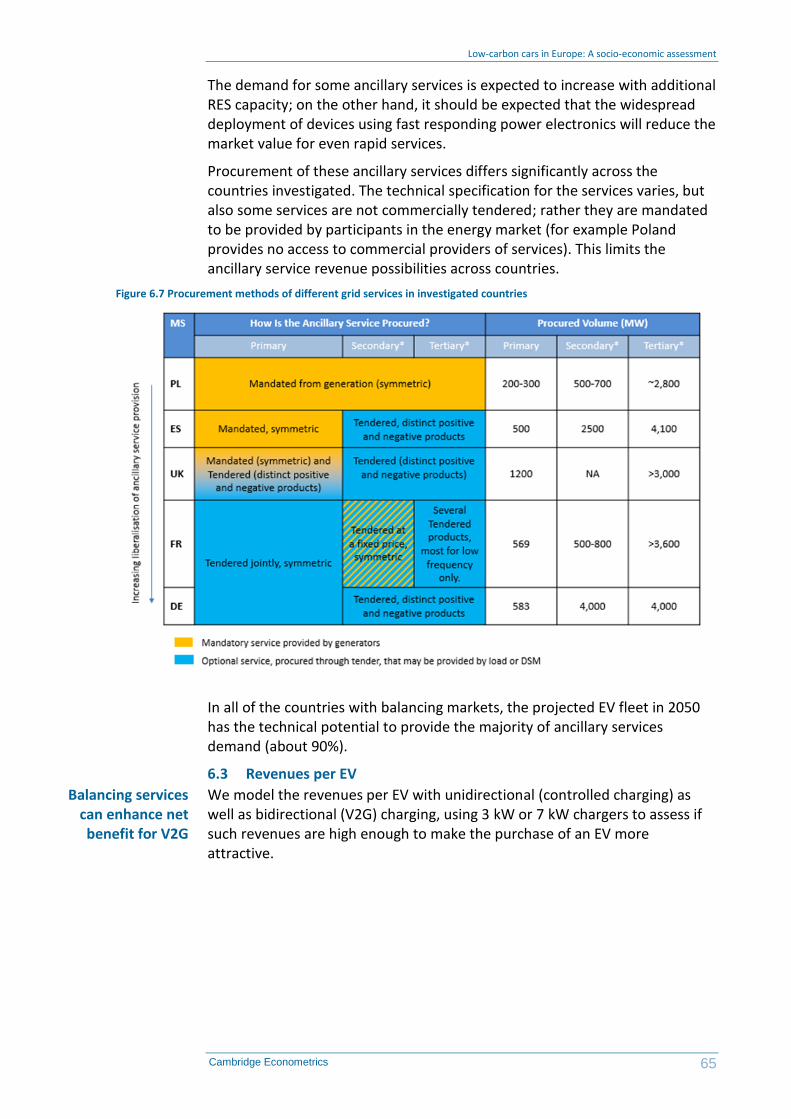
Low-carbon cars in Europe: A socio-economic assessment
65 Cambridge Econometrics
The demand for some ancillary services is expected to increase with additional RES capacity; on the other hand, it should be expected that the widespread deployment of devices using fast responding power electronics will reduce the market value for even rapid services.
Procurement of these ancillary services differs significantly across the countries investigated. The technical specification for the services varies, but also some services are not commercially tendered; rather they are mandated to be provided by participants in the energy market (for example Poland provides no access to commercial providers of services). This limits the ancillary service revenue possibilities across countries.
In all of the countries with balancing markets, the projected EV fleet in 2050 has the technical potential to provide the majority of ancillary services demand (about 90%).
6.3 Revenues per EV
We model the revenues per EV with unidirectional (controlled charging) as well as bidirectional (V2G) charging, using 3 kW or 7 kW chargers to assess if such revenues are high enough to make the purchase of an EV more attractive.
Balancing services can enhance net benefit for V2G
Figure 6.7 Procurement methods of different grid services in investigated countries

Low-carbon cars in Europe: A socio-economic assessment
66 Cambridge Econometrics
Compared with controlled charging, V2G incurs additional costs. These are: additional hardware costs, energy round trip losses when power is put back into the grid, and enhanced battery degradation due to V2G induced additional cycling of the battery).
We found that, despite higher capital and operational costs, 7kW chargers offer much higher net benefit than 3kW.
However, we also found that these net revenues are very sensitive to the value of ancillary services. A halving of service value would eliminate any net benefit of 3 kW V2G, while higher power V2G would be barely profitable.
Net benefit is very sensitive to future
value of services
Figure 6.8 Net benefit of grid service provision with a 3kW vs 7kW bi-directional residential charger, in the UK in 2030
Figure 6.9 Net benefit of grid service provision with a 7kW bi-directional residential charger, in the UK in 2030, assuming 50% lower service prices than currently

Low-carbon cars in Europe: A socio-economic assessment
67 Cambridge Econometrics
The business case of service provision from EVs depends on the balancing markets in each country. In the graph below, we show net benefits for EVs with V2G capability, across four Member States. High value primary response services are mandated in Spain and are not open to commercial competition, and so V2G systems would operate at a loss in Spain. Although the modelled services are very different in Germany, UK and France, overall the net revenues for V2G are similar for these countries.
6.4 Services provision by electrolysers
Electrolysers supplying hydrogen to FCEVs could provide a significant amount of balancing services in the investigated countries. This would enable a more attractive offer to FCEV owners, if the revenues of these services are passed on to them.
6.5 Conclusions
Unmanaged charging would impose significant additional costs on the
electricity system, in addition to the cost and benefits determined by the
E3ME modelling described in Chapter 7:
• significant load growth at peak times requires additional investment in the distribution network, peaking generation plant and additional fossil fuel costs
Figure 6.10 Net benefit of service provision with V2G in the investigated countries in 2030
Figure 6.11 Revenues per FCEV from service provision by electrolysers in 2030
Low-carbon cars in Europe: A socio-economic assessment
68 Cambridge Econometrics
• these costs add up to more than €2bn per annum in each of Germany, the UK, France and Spain and would lead to an increase in residential electricity prices by 4-8% in 2050
Smart charging of EVs could avoid these additional costs to a large extent:
• moving EV charging to times of lower electricity demand avoids significant network reinforcements or peaking plant investments.
• smart charging of EVs would permit additional renewable capacity to be deployed without excessive curtailment
The net benefit of smart charging depends on the dominant renewable energy
source in each country:
• in wind-dominant countries, overnight EV charging can absorb excess RES as well as avoid increased in peak load on the distribution network.
• in PV-dominant countries, daytime workplace charging may be the most advantageous way to absorb excess RES
Providing balancing services to the system operator would offer early
revenues for EV owners:
• net benefits of service provision per EV are significantly higher using V2G technology rather than unidirectional charging (up to €660/EV/year)
• however net benefits are highly sensitive to balancing services prices, which vary among Member States; they may be expected to decrease with the wider roll out of fast response battery storage.

Low-carbon cars in Europe: A socio-economic assessment
69 Cambridge Econometrics
7 Economic impacts
The economic impact of decarbonising Europe’s passenger vehicles, compared to a reference case (REF) in which cars remain unchanged from today, was modelled using E3ME33.
7.1 GDP impacts and sensitivity tests
The impact comes from the shift in spending away from imported oil and towards a higher capital content in vehicles and spending on decarbonised fuels. The higher cost of vehicles raises prices to consumers and depresses real incomes and spending. It diverts spending towards the value chain for manufacturing vehicles and their component parts and away from other sectors of the economy. However, better fuel-efficiency lowers running costs for consumers, with positive consequences for the economy. It diverts spending away from oil supply chains and towards other areas of the economy. Since oil is imported into Europe while the decarbonised fuels are produced in Europe, the shift in spending on fuel boosts the European economy and is reflected in an improvement in the balance of trade. A summary of the main economic indicators in presented in Table 7.1.
Table 7.1: Main macroeconomic indicators
CPI TECH TECH OEM TECH PHEV
2030 Impacts (relative to REF)
GDP (%) 0.1% 0.2% 0.2% 0.2%
Employment (000s) 91 206 260 196
Oil Imports (mboe) -291 -513 -605 -505
CO2 emissions from passenger cars (mtCO2) -123.2 -217.7 -257.9 -214.5
CPI TECH TECH OEM TECH PHEV
2050 Impacts (relative to REF)
GDP (%) 0.2% 0.6% 0.5% 0.5%
Employment (000s) 130 670 672 557
Oil Imports (mboe) -416 -1578 -1638 -1520
CO2 emissions from passenger cars (mtCO2) -175.9 -666.8 -692.0 -643.6
33 https://www.camecon.com/how/e3me-model/

Low-carbon cars in Europe: A socio-economic assessment
70 Cambridge Econometrics
The scale of the long-term economic impact is uncertain, depending on a number of competing factors: the cost of vehicles, low-carbon technologies and EV batteries; the location of vehicle supply chains; and future oil prices, to name a few of the key uncertainties. However, the dominant impact arises from the reduction in oil imports. This is evident in the macroeconomic results in which the GDP impact tends to follow oil imports in the CPI and TECH scenarios. Compared to the TECH scenario, TECH PHEV leads to lower employment, fewer emissions savings and a slightly lower impact on GDP. The most ambitious scenario is TECH OEM, and this also yields the greatest economic benefits in terms of the impact on both GDP and employment which comes directly from the substantial reduction in oil imports.
Figure 7.1 below shows the GDP impacts under different scenarios. In the TECH scenario, by 2030, there is a modest (0.2%) GDP improvement, as the economic benefits of reduced spending on oil and petroleum imports outweigh the negative economic impacts associated with higher vehicle prices. However, by 2050 this has widened to almost 0.6%, as spending on imported fuels falls further due to continued improvement in efficiency of the stock and a continued shift away from ICEs and towards PHEVs, BEVs and FCEVs.
Figure 7.1 GDP results relative to the reference scenario
A number of sensitivities have been explored within the economic modelling, to better understand the degree to which the outcomes outlined above are dependent upon particular assumptions.
Different oil price assumptions were explored, including low and high variants, which lead to smaller and larger GDP impacts respectively: if world oil prices are lower (in all scenarios), the benefit of reducing oil consumption is less. A further sensitivity was carried out in which oil prices are lower in the scenario than in the reference, to test the case in which a global transition away from oil reduces global oil prices34. In this scenario, the GDP impacts for Europe relative to the reference case are far greater (1.5% in 2050): not only does the
34 https://europeanclimate.org/oil-market-futures/
Sensitivities

Low-carbon cars in Europe: A socio-economic assessment
71 Cambridge Econometrics
scenario reduce the volume of oil imports, it also reduces their price. Thus, a global transition to a low-carbon economy, as foreseen in the Paris agreement, delivers a greater GDP benefit for Europe than a transition only within the continent.
Another sensitivity changed the assumption for the amount of time that PHEVs spend in electric mode. In the main scenarios, this is assumed to be 80%; in the sensitivity tests it is reduced to only 40%, or zero). As expected, the GDP impacts are larger when the share of time spent in electric mode is higher, because this is when the shift away from fossil fuels is larger. When the most extreme sensitivity (no time at all in electric mode) was tested, the GDP impact in the TECH PHEV scenario (the case in which PHEVs have the largest share in the stock) was reduced (compared to the 80% case) by 0.1 pp of GDP in 2050.
A further sensitivity explored the impact of locating battery cell production within or outside of Europe. The central assumption is that all European demand for battery cells will be met by manufacture within Europe. Sensitivities explored the difference in GDP outcomes when only half of domestic demand was met through domestic production, and a case where all battery cells are imported from outside of Europe. These sensitivities were tested in the TECH OEM scenario, in which batteries play the largest role. The difference between all and no battery cell production in Europe amounts to around 0.1 pp of GDP in 2050; so even in a case where all battery cells are imported, the scenario still showed a positive GDP impact in 2050 of between 0.4% and 0.5%.
7.2 Sectoral impacts
The costs and benefits vary by sector: some benefit and some are adversely affected by the transition.
In the TECH scenario, spending on road fuel is €97 billion lower in nominal terms than in the reference scenario by 2030. While much of this spending in the REF scenario flows to producers based outside of Europe, reduced spending has an adverse impact on domestic refining. In the TECH scenario, gross output in the petroleum refining sector is considerably lower than in the reference scenario by 2030.
The electricity and hydrogen sectors gain directly through investment in charging infrastructure and through consumers’ expenditure on electricity and hydrogen. In the TECH scenario, gross output in the electricity sector is €5.8bn higher than in the reference scenario by 2030.
In the TECH scenario, the automotive supply chain shows a net increase in gross output of €13 billion and an increase of 43,000 jobs in 2030 compared to the reference scenario. However, with the supply chain there is a substantial transition in content from traditional motor vehicles production to electrical equipment in the long term. By 2050, output in traditional motor vehicles falls by €15 billion whereas electrical equipment output increases by €51 billion.
Oil and petroleum refining
Other energy industries
The automotive supply chain
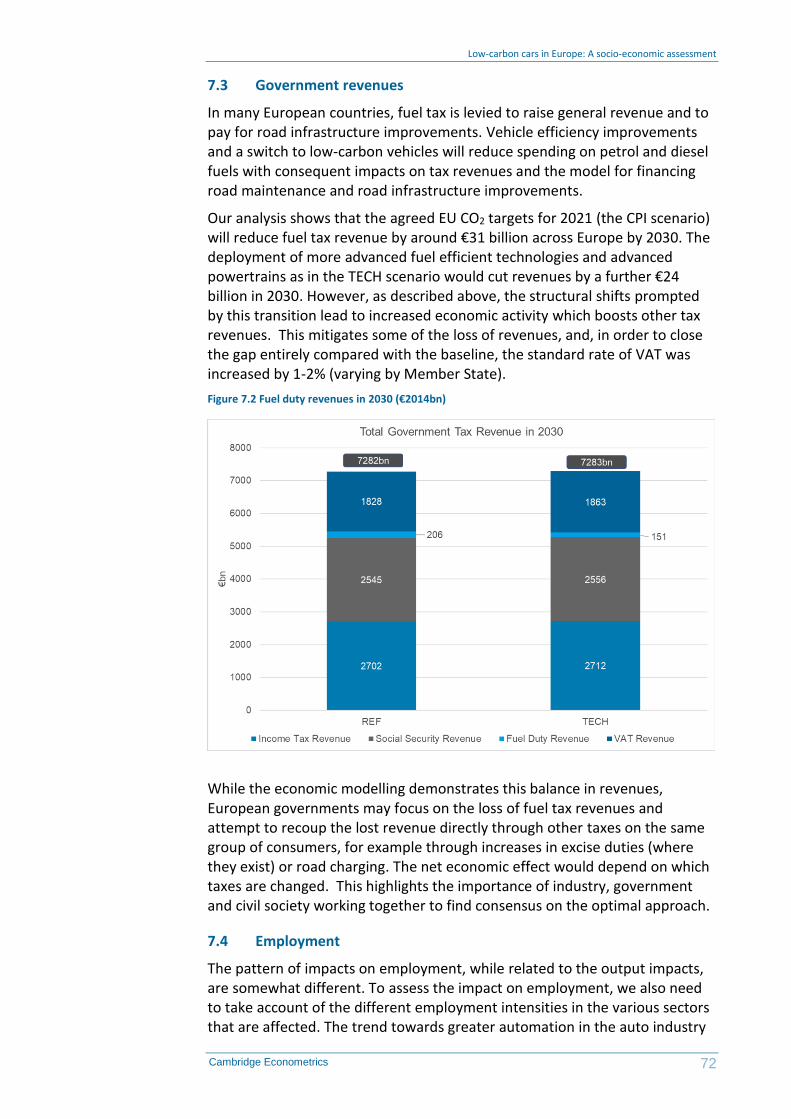
Low-carbon cars in Europe: A socio-economic assessment
72 Cambridge Econometrics
7.3 Government revenues
In many European countries, fuel tax is levied to raise general revenue and to pay for road infrastructure improvements. Vehicle efficiency improvements and a switch to low-carbon vehicles will reduce spending on petrol and diesel fuels with consequent impacts on tax revenues and the model for financing road maintenance and road infrastructure improvements.
Our analysis shows that the agreed EU CO2 targets for 2021 (the CPI scenario) will reduce fuel tax revenue by around €31 billion across Europe by 2030. The deployment of more advanced fuel efficient technologies and advanced powertrains as in the TECH scenario would cut revenues by a further €24 billion in 2030. However, as described above, the structural shifts prompted by this transition lead to increased economic activity which boosts other tax revenues. This mitigates some of the loss of revenues, and, in order to close the gap entirely compared with the baseline, the standard rate of VAT was increased by 1-2% (varying by Member State).
Figure 7.2 Fuel duty revenues in 2030 (€2014bn)
While the economic modelling demonstrates this balance in revenues, European governments may focus on the loss of fuel tax revenues and attempt to recoup the lost revenue directly through other taxes on the same group of consumers, for example through increases in excise duties (where they exist) or road charging. The net economic effect would depend on which taxes are changed. This highlights the importance of industry, government and civil society working together to find consensus on the optimal approach.
7.4 Employment
The pattern of impacts on employment, while related to the output impacts, are somewhat different. To assess the impact on employment, we also need to take account of the different employment intensities in the various sectors that are affected. The trend towards greater automation in the auto industry

Low-carbon cars in Europe: A socio-economic assessment
73 Cambridge Econometrics
is expected to reduce the number of jobs, regardless of the low-carbon transition. Building battery-electric vehicles is expected to be less labour intensive than building the gasoline and diesel vehicles they will replace, while building hybrids and plug-in hybrids is expected to be more labour intensive. Our modelling confirms that the net employment impact for the auto sector from the transition depends on the market shares of these various technologies, and the degree to which they are imported or produced in Europe.
Figure 7.3 shows the evolution of jobs in Europe as a result of the transition to low-carbon cars in 2030 and 2050 under our central TECH scenario, relative to the Reference case. There is a net increase in employment in the following sectors: electricity, hydrogen, services and most manufacturing sectors. Employment in the petrol and diesel fuels sector is reduced. Employment in the automotive manufacturing sector is higher until 2030, but is lower thereafter in our central TECH scenario.
Figure 7.3 The employment impact per sector of the transition to low-carbon cars (TECH compared to REF)
In our TECH scenario, net auto sector jobs increase through to 2030, because diesel and gasoline engines are built to greater levels of sophistication and efficiency to meet climate goals, and because of the increasing deployment of hybrids, plug-in hybrids and fuel-cell vehicles, with their greater technological complexity. However, by 2050, the net impact on auto jobs is negative because hybrids are increasingly replaced by battery-electric vehicles, which are simpler to build and therefore generate fewer jobs.
In the scenario in which plug-in hybrids remain dominant for longer (TECH PHEV), European workers continue to benefit from building more complex vehicles for longer, and the net employment impact in the auto sector is still positive in 2050. However, this scenario produces less employment than the TECH scenario elsewhere in the economy, as consumers spend more on imported fossil fuels. Nonetheless, the analysis does support the assertion
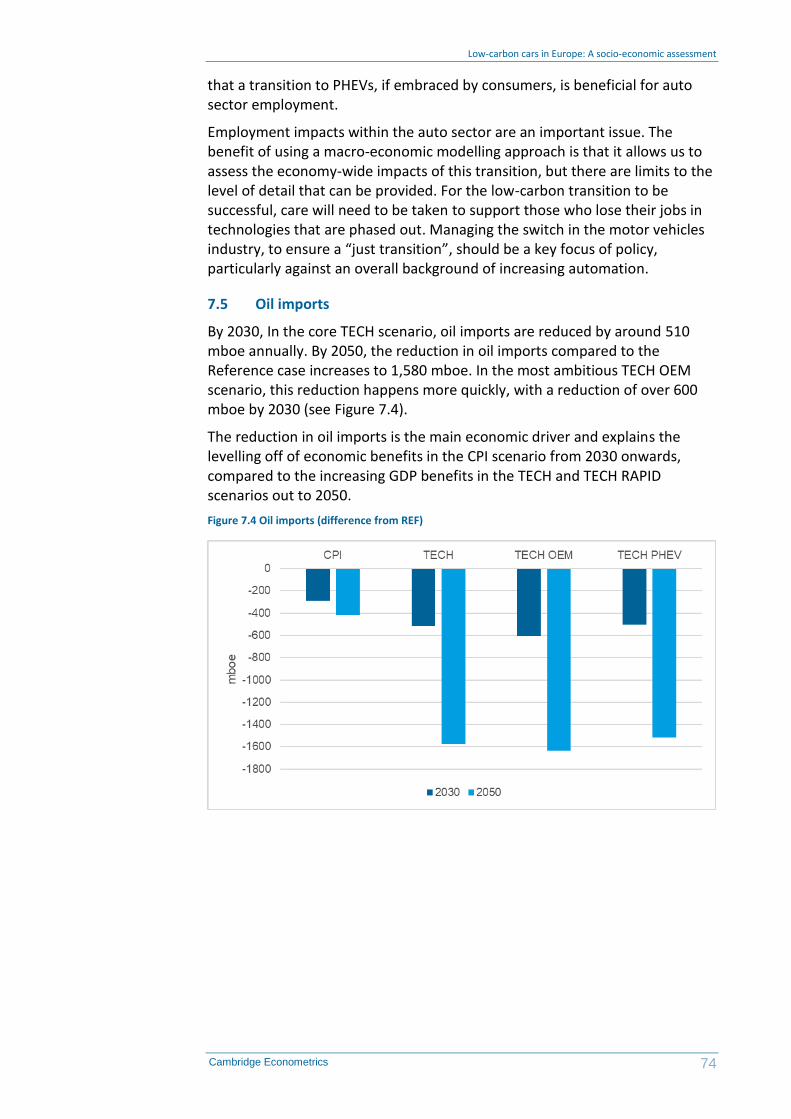
Low-carbon cars in Europe: A socio-economic assessment
74 Cambridge Econometrics
that a transition to PHEVs, if embraced by consumers, is beneficial for auto sector employment.
Employment impacts within the auto sector are an important issue. The benefit of using a macro-economic modelling approach is that it allows us to assess the economy-wide impacts of this transition, but there are limits to the level of detail that can be provided. For the low-carbon transition to be successful, care will need to be taken to support those who lose their jobs in technologies that are phased out. Managing the switch in the motor vehicles industry, to ensure a “just transition”, should be a key focus of policy, particularly against an overall background of increasing automation.
7.5 Oil imports
By 2030, In the core TECH scenario, oil imports are reduced by around 510 mboe annually. By 2050, the reduction in oil imports compared to the Reference case increases to 1,580 mboe. In the most ambitious TECH OEM scenario, this reduction happens more quickly, with a reduction of over 600 mboe by 2030 (see Figure 7.4).
The reduction in oil imports is the main economic driver and explains the levelling off of economic benefits in the CPI scenario from 2030 onwards, compared to the increasing GDP benefits in the TECH and TECH RAPID scenarios out to 2050.
Figure 7.4 Oil imports (difference from REF)
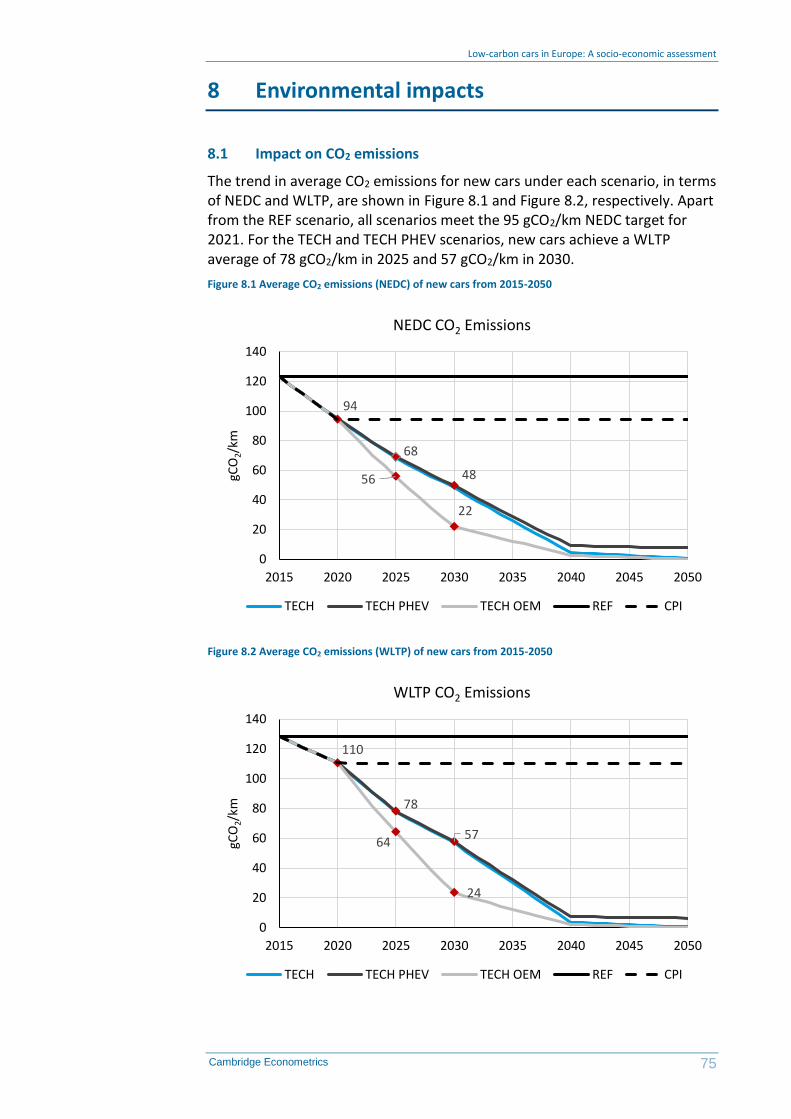
Low-carbon cars in Europe: A socio-economic assessment
75 Cambridge Econometrics
8 Environmental impacts
8.1 Impact on CO2 emissions
The trend in average CO2 emissions for new cars under each scenario, in terms of NEDC and WLTP, are shown in Figure 8.1 and Figure 8.2, respectively. Apart from the REF scenario, all scenarios meet the 95 gCO2/km NEDC target for 2021. For the TECH and TECH PHEV scenarios, new cars achieve a WLTP average of 78 gCO2/km in 2025 and 57 gCO2/km in 2030.
Figure 8.1 Average CO2 emissions (NEDC) of new cars from 2015-2050
Figure 8.2 Average CO2 emissions (WLTP) of new cars from 2015-2050
68
48
94
56
22
0
20
40
60
80
100
120
140
2015 2020 2025 2030 2035 2040 2045 2050
gCO
2/km
NEDC CO2 Emissions
TECH TECH PHEV TECH OEM REF CPI
78
57
110
64
24
0
20
40
60
80
100
120
140
2015 2020 2025 2030 2035 2040 2045 2050
gCO
2/km
WLTP CO2 Emissions
TECH TECH PHEV TECH OEM REF CPI

Low-carbon cars in Europe: A socio-economic assessment
76 Cambridge Econometrics
Figure 8.3 shows the vehicle stock’s CO2 tailpipe emission under each scenario. In the central TECH scenario, CO2 emissions from cars are reduced from around 610 mt per annum in 2017 to about 60 mt per annum in 2050. This is achieved via a combination of increased fuel efficiency and switching the energy source from diesel and gasoline to low-carbon electricity and hydrogen.
Note that the TECH and TECH PHEV scenarios are similar to one another up to
2035 as the main driver up to that point is the removal of older, less efficient
ICE vehicles from the stock.
Figure 8.3 Total EU vehicle stock CO2 tailpipe emissions (Mt)
8.2 Implied emissions from electricity
The tailpipe analysis of CO2 emissions set out above treats all EVs as zero emission (as the vehicles themselves have no emissions). However, an economy-wide analysis needs to take account of the emissions from the generation of the electricity needed to charge the batteries. The carbon intensity of the grid varies from country to country, based upon the generation technologies that are used.
The PRIMES Reference Scenario contains detailed data and projections of generation by technology for each Member State, and associated emissions factors, allowing the calculation of the emissions associated with electricity consumption; this can be multiplied by electricity demand from passenger cars in the scenarios to calculate the total implied emissions. This analysis shows that the implied emissions from the European EV fleet in the TECH scenario would total 66 mt CO2. If these embedded emissions were included in the calculation of CO2 emissions above, total emissions in the TECH scenario would be around 126 mt CO2 in 2050, a reduction of almost 80% on 2017 levels.
However, the PRIMES Reference Scenario is based upon current policies and existing market trends; it does not reflect the introduction of any new policies, or even meeting long-term targets, such as the EU’s climate and energy goals, or the NDCs agreed in the Paris Agreement. In scenarios in
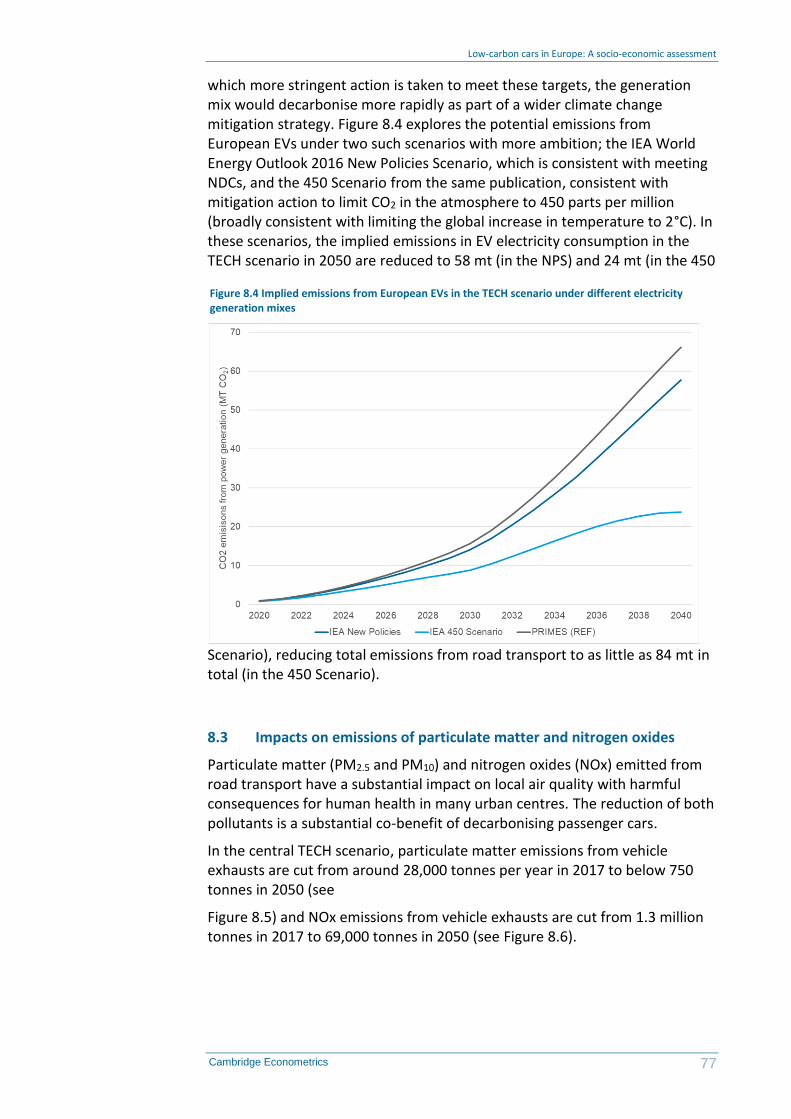
Low-carbon cars in Europe: A socio-economic assessment
77 Cambridge Econometrics
which more stringent action is taken to meet these targets, the generation mix would decarbonise more rapidly as part of a wider climate change mitigation strategy. Figure 8.4 explores the potential emissions from European EVs under two such scenarios with more ambition; the IEA World Energy Outlook 2016 New Policies Scenario, which is consistent with meeting NDCs, and the 450 Scenario from the same publication, consistent with mitigation action to limit CO2 in the atmosphere to 450 parts per million (broadly consistent with limiting the global increase in temperature to 2°C). In these scenarios, the implied emissions in EV electricity consumption in the TECH scenario in 2050 are reduced to 58 mt (in the NPS) and 24 mt (in the 450
Scenario), reducing total emissions from road transport to as little as 84 mt in total (in the 450 Scenario).
8.3 Impacts on emissions of particulate matter and nitrogen oxides
Particulate matter (PM2.5 and PM10) and nitrogen oxides (NOx) emitted from road transport have a substantial impact on local air quality with harmful consequences for human health in many urban centres. The reduction of both pollutants is a substantial co-benefit of decarbonising passenger cars.
In the central TECH scenario, particulate matter emissions from vehicle exhausts are cut from around 28,000 tonnes per year in 2017 to below 750 tonnes in 2050 (see
Figure 8.5) and NOx emissions from vehicle exhausts are cut from 1.3 million tonnes in 2017 to 69,000 tonnes in 2050 (see Figure 8.6).
Figure 8.4 Implied emissions from European EVs in the TECH scenario under different electricity generation mixes

Low-carbon cars in Europe: A socio-economic assessment
78 Cambridge Econometrics
Figure 8.5 Total particulate matter tailpipe emissions in the TECH and CPI scenarios (tonnes)
Figure 8.6 Total NOx tailpipe emissions in the TECH and CPI scenarios (tonnes)
In the short to medium term, much of the reduction seen across all scenarios, is from the impact of the Euro 5 and Euro 6 emissions standards. As these standards are already in place and set out to 2020 for ICEs, the reduction to 2030 is through the replacement in the vehicle stock of the least efficient older ICE-based vehicles by more efficient newer ICE-based vehicles. However, beyond 2030, tailpipe emissions in the CPI scenario decrease only moderately whereas in the TECH Scenario they are cut significantly. This is

Low-carbon cars in Europe: A socio-economic assessment
79 Cambridge Econometrics
mainly achieved by the transition away from petrol and diesel vehicles towards zero emissions electricity and hydrogen.
It is worth noting that the particulate emissions that we model only refer to tailpipe emissions. While substantial, they are only one source of local air pollutants from road transport. The largest source of emissions of particulates from road transport is tyre and brake wear and road abrasion which have been shown to account for over half of total particulate matter emissions.

Low-carbon cars in Europe: A socio-economic assessment
80 Cambridge Econometrics
9 Conclusions
This study focused on the potential benefits of decarbonising cars in Europe.
We find that all the scenarios yield net economic benefits in the short, medium and long term. This comes about because of the economic benefits of reducing oil imports, and all scenarios lead to reductions in oil consumption and emissions. The economic benefit increases over the period to 2050 as oil imports are further reduced as efficient vehicles build up in the stock. The implication of this finding is that a transition towards low carbon cars to meet Europe’s climate goals can be adopted without fear of economic collapse.
While this study has not sought to analyse impacts on competitiveness in the sector, participants agreed that the European auto industry needs to remain at the cutting edge of clean technology innovation to remain competitive and thereby to maintain its share of a rapidly evolving market.
Lowering Europe’s dependence on imported oil also contributes to its energy security. Moreover, all of the TECH scenario variants would substantially reduce CO2 emissions and improve local air quality.
Considerable transitional challenges were observed:
• The transition depends on the rapid deployment of charging infrastructure at considerable scale and cost. Without this, uptake of EVs will be limited.
• Employment in the motor vehicles sector would likely fall post 2030 as advanced powertrains dominate the market, since they require fewer people to manufacture and assemble the components. There is time to plan for this within the sector by looking at natural rates of retirement and retraining, but if the transition occurs more rapidly, as set out in the TECH OEM scenario, greater affirmative action will be required. Efforts must be made to ensure workers who are currently producing legacy technologies are retrained for quality jobs in producing technologies for which demand is expected to increase in the future.
• Fuel duty revenues would decline, but the net benefits in the rest of the economy would make up much of the shortfall by expanding the tax base elsewhere. The scale of net decline in revenues could be met in a number of different ways; however, politicians might be tempted to introduce other taxes on road users to recoup the shortfall from the same group of consumers.
• A shift to electric vehicles could put considerable strain on the electricity generation and distribution system by exacerbating peak loads. However, our research suggests that there are technologies that could manage this by helping to spread out the demand (e.g. smart-charging). Moreover, such technologies could afford benefits to EV owners by offering flexibility services back to the grid.

Appendix A E3ME model description
Introduction
E3ME is a computer-based model of the world’s economic and energy systems and the environment. It was originally developed through the European Commission’s research framework programmes and is now widely used in Europe and beyond for policy assessment, for forecasting and for research purposes.
Recent applications of E3ME include:
• a global assessment of the economic impact of renewables for IRENA
• contribution to the EU’s Impact Assessment of its 2030 climate and energy package
• evaluations of the economic impact of removing fossil fuel subsidies in India and Indonesia
• analysis of future energy systems, environmental tax reform and trade deals in East Asia
• an assessment of the potential for green jobs in Europe
• an economic evaluation for the EU Impact Assessment of the Energy Efficiency Directive
This model description provides a short summary of the E3ME model. For further details, the reader is referred to the full model manual available online from www.e3me.com.
E3ME’s basic structure and data
The structure of E3ME is based on the system of national accounts, with further linkages to energy demand and environmental emissions. The labour market is also covered in detail, including both voluntary and involuntary unemployment. In total there are 33 sets of econometrically estimated equations, also including the components of GDP (consumption, investment, international trade), prices, energy demand and materials demand. Each equation set is disaggregated by country and by sector.
E3ME’s historical database covers the period 1970-2014 and the model projects forward annually to 2050. The main data sources for European countries are Eurostat and the IEA, supplemented by the OECD’s STAN database and other sources where appropriate. For regions outside Europe, additional sources for data include the UN, OECD, World Bank, IMF, ILO and national statistics. Gaps in the data are estimated using customised software algorithms.
The main dimensions of the model
The main dimensions of E3ME are:
• 59 countries – all major world economies, the EU28 and candidate countries plus other countries’ economies grouped
Overview
Recent applications

Low-carbon cars in Europe: A socio-economic assessment
82 Cambridge Econometrics
• 43 or 69 (Europe) industry sectors, based on standard international classifications
• 28 or 43 (Europe) categories of household expenditure
• 22 different users of 12 different fuel types
• 14 types of air-borne emission (where data are available) including the six greenhouse gases monitored under the Kyoto protocol
The countries and sectors covered by the model are listed at the end of this document.
Standard outputs from the model
As a general model of the economy, based on the full structure of the national accounts, E3ME is capable of producing a broad range of economic indicators. In addition there is range of energy and environment indicators. The following list provides a summary of the most common model outputs:
• GDP and the aggregate components of GDP (household expenditure, investment, government expenditure and international trade)
• sectoral output and GVA, prices, trade and competitiveness effects
• international trade by sector, origin and destination
• consumer prices and expenditures
• sectoral employment, unemployment, sectoral wage rates and labour supply
• energy demand, by sector and by fuel, energy prices
• CO2 emissions by sector and by fuel
• other air-borne emissions
• material demands
This list is by no means exhaustive and the delivered outputs often depend on the requirements of the specific application. In addition to the sectoral dimension mentioned in the list, all indicators are produced at the national and regional level and annually over the period up to 2050.
E3ME as an E3 model
The figure below shows how the three components (modules) of the model - energy, environment and economy - fit together. Each component is shown in its own box. Each data set has been constructed by statistical offices to conform with accounting conventions. Exogenous factors coming from outside the modelling framework are shown on the outside edge of the chart as inputs into each component. For each region’s economy the exogenous factors are economic policies (including tax rates, growth in government expenditures, interest rates and exchange rates). For the energy system, the outside factors are the world oil prices and energy policy (including regulation of the energy industries). For the environment component, exogenous factors include policies such as reduction in SO2 emissions by means of end-of-pipe filters from large combustion plants. The linkages between the
The E3 interactions
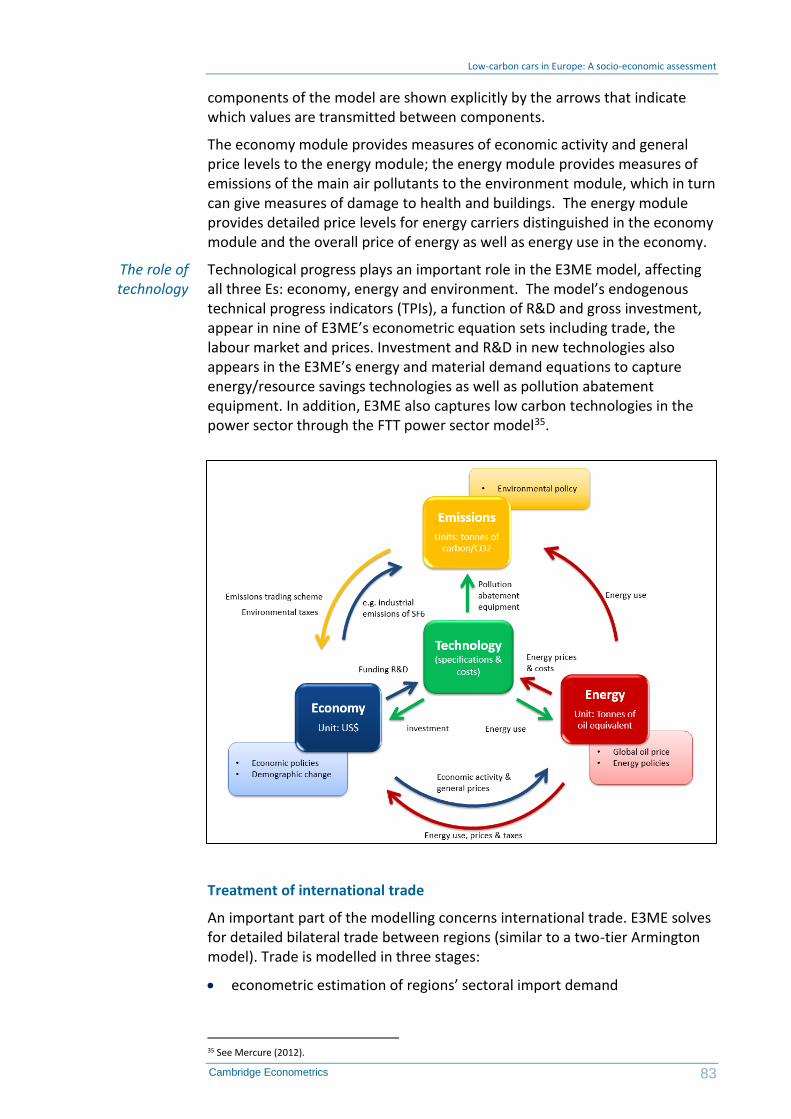
Low-carbon cars in Europe: A socio-economic assessment
83 Cambridge Econometrics
components of the model are shown explicitly by the arrows that indicate which values are transmitted between components.
The economy module provides measures of economic activity and general price levels to the energy module; the energy module provides measures of emissions of the main air pollutants to the environment module, which in turn can give measures of damage to health and buildings. The energy module provides detailed price levels for energy carriers distinguished in the economy module and the overall price of energy as well as energy use in the economy.
Technological progress plays an important role in the E3ME model, affecting all three Es: economy, energy and environment. The model’s endogenous technical progress indicators (TPIs), a function of R&D and gross investment, appear in nine of E3ME’s econometric equation sets including trade, the labour market and prices. Investment and R&D in new technologies also appears in the E3ME’s energy and material demand equations to capture energy/resource savings technologies as well as pollution abatement equipment. In addition, E3ME also captures low carbon technologies in the power sector through the FTT power sector model35.
Treatment of international trade
An important part of the modelling concerns international trade. E3ME solves for detailed bilateral trade between regions (similar to a two-tier Armington model). Trade is modelled in three stages:
• econometric estimation of regions’ sectoral import demand
35 See Mercure (2012).
The role of technology

Low-carbon cars in Europe: A socio-economic assessment
84 Cambridge Econometrics
• econometric estimation of regions’ bilateral imports from each partner
• forming exports from other regions’ import demands
Trade volumes are determined by a combination of economic activity indicators, relative prices and technology.
The labour market
Treatment of the labour market is an area that distinguishes E3ME from other macroeconomic models. E3ME includes econometric equation sets for employment, average working hours, wage rates and participation rates. The first three of these are disaggregated by economic sector while participation rates are disaggregated by gender and five-year age band.
The labour force is determined by multiplying labour market participation rates by population. Unemployment (including both voluntary and involuntary unemployment) is determined by taking the difference between the labour force and employment. This is typically a key variable of interest for policy makers.
Comparison with CGE models and econometric specification
E3ME is often compared to Computable General Equilibrium (CGE) models. In many ways the modelling approaches are similar; they are used to answer similar questions and use similar inputs and outputs. However, underlying this there are important theoretical differences between the modelling approaches.
In a typical CGE framework, optimal behaviour is assumed, output is determined by supply-side constraints and prices adjust fully so that all the available capacity is used. In E3ME the determination of output comes from a post-Keynesian framework and it is possible to have spare capacity. The model is more demand-driven and it is not assumed that prices always adjust to market clearing levels.
The differences have important practical implications, as they mean that in E3ME regulation and other policy may lead to increases in output if they are able to draw upon spare economic capacity. This is described in more detail in the model manual.
The econometric specification of E3ME gives the model a strong empirical grounding. E3ME uses a system of error correction, allowing short-term dynamic (or transition) outcomes, moving towards a long-term trend. The dynamic specification is important when considering short and medium-term analysis (e.g. up to 2020) and rebound effects36, which are included as standard in the model’s results.
Key strengths of E3ME
In summary the key strengths of E3ME are:
36 Where an initial increase in efficiency reduces demand, but this is negated in the long run as greater efficiency lowers the relative cost and increases consumption. See Barker et al (2009).

Low-carbon cars in Europe: A socio-economic assessment
85 Cambridge Econometrics
• the close integration of the economy, energy systems and the environment, with two-way linkages between each component
• the detailed sectoral disaggregation in the model’s classifications, allowing for the analysis of similarly detailed scenarios
• its global coverage, while still allowing for analysis at the national level for large economies
• the econometric approach, which provides a strong empirical basis for the model and means it is not reliant on some of the restrictive assumptions common to CGE models
• the econometric specification of the model, making it suitable for short and medium-term assessment, as well as longer-term trends
Applications of E3ME
Although E3ME can be used for forecasting, the model is more commonly used for evaluating the impacts of an input shock through a scenario-based analysis. The shock may be either a change in policy, a change in economic assumptions or another change to a model variable. The analysis can be either forward looking (ex-ante) or evaluating previous developments in an ex-post manner. Scenarios may be used either to assess policy, or to assess sensitivities to key inputs (e.g. international energy prices).
For ex-ante analysis a baseline forecast up to 2050 is required; E3ME is usually calibrated to match a set of projections that are published by the European Commission and the IEA but alternative projections may be used. The scenarios represent alternative versions of the future based on a different set of inputs. By comparing the outcomes to the baseline (usually in percentage terms), the effects of the change in inputs can be determined.
It is possible to set up a scenario in which any of the model’s inputs or variables are changed. In the case of exogenous inputs, such as population or energy prices, this is straight forward. However, it is also possible to add shocks to other model variables. For example, investment is endogenously determined by E3ME, but additional exogenous investment (e.g. through an increase in public investment expenditure) can also be modelled as part of a scenario input.
Model-based scenario analyses often focus on changes in price because this is easy to quantify and represent in the model structure. Examples include:
• changes in tax rates including direct, indirect, border, energy and environment taxes
• changes in international energy prices
• emission trading schemes
All of the price changes above can be represented in E3ME’s framework reasonably well, given the level of disaggregation available. However, it is also possible to assess the effects of regulation, albeit with an assumption about effectiveness and cost. For example, an increase in vehicle fuel-efficiency standards could be assessed in the model with an assumption about how
Scenario-based analysis
Price or tax scenarios
Regulatory impacts

Low-carbon cars in Europe: A socio-economic assessment
86 Cambridge Econometrics
efficient vehicles become, and the cost of these measures. This would be entered into the model as a higher price for cars and a reduction in fuel consumption (all other things being equal). E3ME could then be used to determine:
• secondary effects, for example on fuel suppliers
• rebound effects37
• overall macroeconomic impacts
Table 1: Main dimensions of the E3ME model
Regions Industries (Europe)
Industries (non-Europe)
1 Belgium Crops, animals, etc Agriculture etc 2 Denmark Forestry & logging Coal 3 Germany Fishing Oil & Gas etc 4 Greece Coal Other Mining 5 Spain Oil and Gas Food, Drink & Tobacco 6 France Other mining Textiles, Clothing & Leather 7 Ireland Food, drink & tobacco Wood & Paper 8 Italy Textiles & leather Printing & Publishing 9 Luxembourg Wood & wood prods Manufactured Fuels 10 Netherlands Paper & paper prods Pharmaceuticals 11 Austria Printing & reproduction Other chemicals 12 Portugal Coke & ref petroleum Rubber & Plastics 13 Finland Other chemicals Non-Metallic Minerals 14 Sweden Pharmaceuticals Basic Metals 15 UK Rubber & plastic products Metal Goods 16 Czech Rep. Non-metallic mineral prods Mechanical Engineering 17 Estonia Basic metals Electronics 18 Cyprus Fabricated metal prods Electrical Engineering 19 Latvia Computers etc Motor Vehicles 20 Lithuania Electrical equipment Other Transport Equipment 21 Hungary Other machinery/equipment Other Manufacturing 22 Malta Motor vehicles Electricity 23 Poland Other transport equip Gas Supply 24 Slovenia Furniture; other manufacture Water Supply 25 Slovakia Machinery repair/installation Construction 26 Bulgaria Electricity Distribution 27 Romania Gas, steam & air cond. Retailing 28 Norway Water, treatment & supply Hotels & Catering 29 Switzerland Sewerage & waste Land Transport etc 30 Iceland Construction Water Transport 31 Croatia Wholesale & retail MV Air Transport 32 Turkey Wholesale excl MV Communications 33 Macedonia Retail excl MV Banking & Finance 34 USA Land transport, pipelines Insurance 35 Japan Water transport Computing Services 36 Canada Air transport Professional Services 37 Australia Warehousing Other Business Services 38 New Zealand Postal & courier activities Public Administration 39 Russian Fed. Accommodation & food serv Education 40 Rest of Annex I Publishing activities Health & Social Work 41 China Motion pic, video, television Miscellaneous Services 42 India Telecommunications Unallocated 43 Mexico Computer programming etc.
37 In the example, the higher fuel efficiency effectively reduces the cost of motoring. In the long-run this is likely to lead to an increase in demand, meaning some of the initial savings are lost. Barker et al (2009) demonstrate that this can be as high as 50% of the original reduction.

Low-carbon cars in Europe: A socio-economic assessment
87 Cambridge Econometrics
44 Brazil Financial services 45 Argentina Insurance 46 Colombia Aux to financial services 47 Rest Latin Am. Real estate 48 Korea Imputed rents 49 Taiwan Legal, account, consult 50 Indonesia Architectural & engineering 51 Rest of ASEAN R&D 52 Rest of OPEC Advertising 53 Rest of world Other professional 54 Ukraine Rental & leasing 55 Saudi Arabia Employment activities 56 Nigeria Travel agency 57 South Africa Security & investigation, etc 58 Rest of Africa Public admin & defence 59 Africa OPEC Education 60 Human health activities
61 Residential care
62 Creative, arts, recreational
63 Sports activities 64 Membership orgs 65 Repair comp. & pers. goods 66 Other personal serv. 67 Hholds as employers 68 Extraterritorial orgs 69 Unallocated/Dwellings Source(s): Cambridge Econometrics.
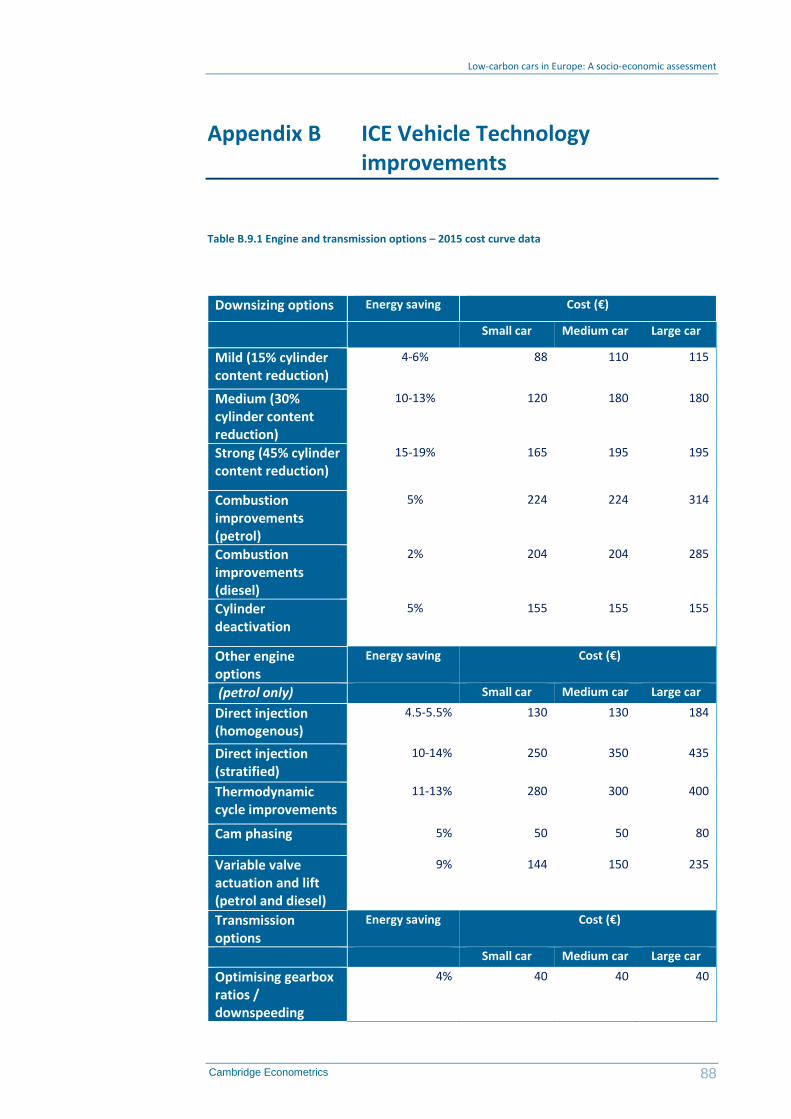
Low-carbon cars in Europe: A socio-economic assessment
88 Cambridge Econometrics
Appendix B ICE Vehicle Technology improvements
Table B.9.1 Engine and transmission options – 2015 cost curve data
Downsizing options Energy saving Cost (€)
Small car Medium car Large car
Mild (15% cylinder content reduction)
4-6% 88 110 115
Medium (30% cylinder content reduction)
10-13% 120 180 180
Strong (45% cylinder content reduction)
15-19% 165 195 195
Combustion improvements (petrol)
5% 224 224 314
Combustion improvements (diesel)
2% 204 204 285
Cylinder deactivation
5% 155 155 155
Other engine options
Energy saving Cost (€)
(petrol only) Small car Medium car Large car
Direct injection (homogenous)
4.5-5.5% 130 130 184
Direct injection (stratified)
10-14% 250 350 435
Thermodynamic cycle improvements
11-13% 280 300 400
Cam phasing 5% 50 50 80
Variable valve actuation and lift (petrol and diesel)
9% 144 150 235
Transmission options
Energy saving Cost (€)
Small car Medium car Large car
Optimising gearbox ratios / downspeeding
4% 40 40 40

Low-carbon cars in Europe: A socio-economic assessment
89 Cambridge Econometrics
Automated manual transmission
2-5% 220 220 230
Dual clutch transmission
3-6% 233 250 257
Partial hybridisation Energy saving Cost (€)
Small car Medium car Large car
Start-stop 2.5-5% 66 80 96
Start-stop with regenerative breaking
6-10% 219 235 300
Low-carbon cars in Europe: A socio-economic assessment
90 Cambridge Econometrics
Appendix C Grid Synergies
C.1 Further insights into the model
Our model consists of 3 parts: an EV profile calculator, a dispatch model, and a revenue model.
Critical inputs to calculate the smart and passive EV charging profiles are EV rollout and electricity consumption in each country, taken from the wider study, and travel patterns of EV owners, given by a consumer study. The breakdown of EV charging in home and work charging is taken from recent market research.
The passive and the smart EV charging profile is calculated by the profile calculator based on the described EV inputs and system load profiles in the respective country sourced from the ENTSO-E webpage. The calculation ensures (in both the smart and passive case) that each EV is fully charged at the end of its charging period. The calculated charging profile allows to quantify the increase of peak demand in each case.
With our dispatch model, we model the electricity system in 5 EU member states in 2030 and in 2050: Germany, the UK, France, Spain and Poland. Among the most important inputs for the modelling of these systems are the capacities of different generation technologies in these countries, taken from the EU Reference Scenario 2016 (based on the PRIMES model) published by the European Commission. Furthermore an extensive database on renewable energy generation by Imperial College London and ETH Zurich is used for the modelling of wind and solar energy generation in each hour of the year. The electricity system load profiles in hourly resolution are taken from the ENTSO-E webpage.
The EV profile (smart or passive) is added to the system load profile in the respective country and used as input for the dispatch model, simulating the hourly dispatch of power plants in each country throughout the year.
From theses runs of the dispatch model we get the total annual electricity production costs, carbon emissions and load factors of each generation technology for each of the tested EV charging scenarios: passive charging, smart charging and smart charging with additional RES capacity.
Our revenue model estimates the revenues that EV owners could gain from offering grid balancing services to the transmission system operator (TSO) in each investigated country. It uses the same inputs as the EV profile calculator on EV rollout and electricity consumption etc. In addition, it uses data on services prices, market design and volume in each country’s balancing market obtained from extensive market research using the TSOs’ as well as the ENTSO-E webpage and reports by National Regulatory Authorities (NRAs).
C.2 Early revenues from balancing services
Balancing services represent opportunity for early revenues for EVs which could boost EV sales.We model the revenues per EV with unidirectional as
EV Profile Calculator
Dispatch Model
Revenue model

Low-carbon cars in Europe: A socio-economic assessment
91 Cambridge Econometrics
well as bidirectional charging, using 3kW or 7kW chargers to assess if such revenues are high enough to make the purchase of an EV more attractive.
In each country, the contracting and specification of balancing services vary. Revenues can compromise availability payments (expressed in terms of MW of capacity available to provide a service if required) and utilisation payments (in return for MWh of service actually delivered).
The highest value services are rapid, frequency response services. Generally, positive (turn up) service is valued most highly because this is required to offset the loss of a generator from the system. Negative (turn down) can also be contracted, and in some cases the primary response service is required to be symmetric (turn up and down power needs to be the same).
The diagram below shows how turn up or turn down can be offered for a 3 or 7kW charger. The operational and revenue models for ancillary services in each country differ as a result and an example for Germany is given below.
Figure 9.1 charging profile and associated balancing service provision volumes
Table 9.2 Service volumes of an EV and associated revenues per service in Germany in 2030
Service Type of reserve
Daily service volume (kW) Availability
price (€/MW/h)
Utilisation rate
Utilisation price
(€/MWh)
Annual revenue (€/year)
Unidirectional V2G Unidirectional V2G
3kW 7kW 3kW 7kW 3kW 7kW 3kW 7kW
PCR symmetric 6 6 24 64 14.57 4.3% 0.00 32 32 128 340
SCR negative 24 64 24 64 2.36 4.2% 0.00 21 55 21 55
positive 6 6 36 76 5.67 8.0% 55.00 22 22 132 279
TCR* negative 24 64 24 64 0.8 1.0% 0.00 7 19 7 19
positive 6 6 36 76 4.5 0.3% 55.00 10 10 61 129
Total 92 138 349 822
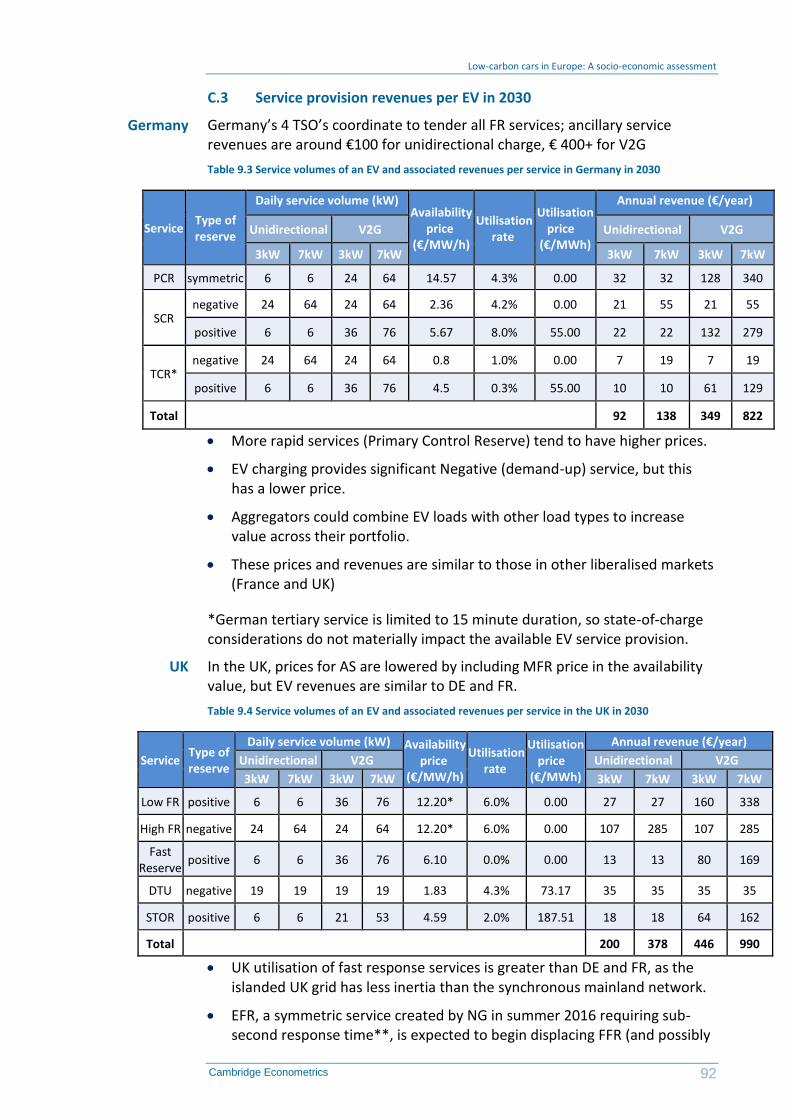
Low-carbon cars in Europe: A socio-economic assessment
92 Cambridge Econometrics
C.3 Service provision revenues per EV in 2030
Germany’s 4 TSO’s coordinate to tender all FR services; ancillary service revenues are around €100 for unidirectional charge, € 400+ for V2G
Table 9.3 Service volumes of an EV and associated revenues per service in Germany in 2030
Service Type of reserve
Daily service volume (kW) Availability
price (€/MW/h)
Utilisation rate
Utilisation price
(€/MWh)
Annual revenue (€/year)
Unidirectional V2G Unidirectional V2G
3kW 7kW 3kW 7kW 3kW 7kW 3kW 7kW
PCR symmetric 6 6 24 64 14.57 4.3% 0.00 32 32 128 340
SCR negative 24 64 24 64 2.36 4.2% 0.00 21 55 21 55
positive 6 6 36 76 5.67 8.0% 55.00 22 22 132 279
TCR* negative 24 64 24 64 0.8 1.0% 0.00 7 19 7 19
positive 6 6 36 76 4.5 0.3% 55.00 10 10 61 129
Total 92 138 349 822
• More rapid services (Primary Control Reserve) tend to have higher prices.
• EV charging provides significant Negative (demand-up) service, but this has a lower price.
• Aggregators could combine EV loads with other load types to increase value across their portfolio.
• These prices and revenues are similar to those in other liberalised markets (France and UK)
*German tertiary service is limited to 15 minute duration, so state-of-charge considerations do not materially impact the available EV service provision.
In the UK, prices for AS are lowered by including MFR price in the availability value, but EV revenues are similar to DE and FR.
Table 9.4 Service volumes of an EV and associated revenues per service in the UK in 2030
Service Type of reserve
Daily service volume (kW) Availability price
(€/MW/h)
Utilisation rate
Utilisation price
(€/MWh)
Annual revenue (€/year)
Unidirectional V2G Unidirectional V2G
3kW 7kW 3kW 7kW 3kW 7kW 3kW 7kW
Low FR positive 6 6 36 76 12.20* 6.0% 0.00 27 27 160 338
High FR negative 24 64 24 64 12.20* 6.0% 0.00 107 285 107 285
Fast Reserve
positive 6 6 36 76 6.10 0.0% 0.00 13 13 80 169
DTU negative 19 19 19 19 1.83 4.3% 73.17 35 35 35 35
STOR positive 6 6 21 53 4.59 2.0% 187.51 18 18 64 162
Total 200 378 446 990
• UK utilisation of fast response services is greater than DE and FR, as the islanded UK grid has less inertia than the synchronous mainland network.
• EFR, a symmetric service created by NG in summer 2016 requiring sub-second response time**, is expected to begin displacing FFR (and possibly
Germany
UK
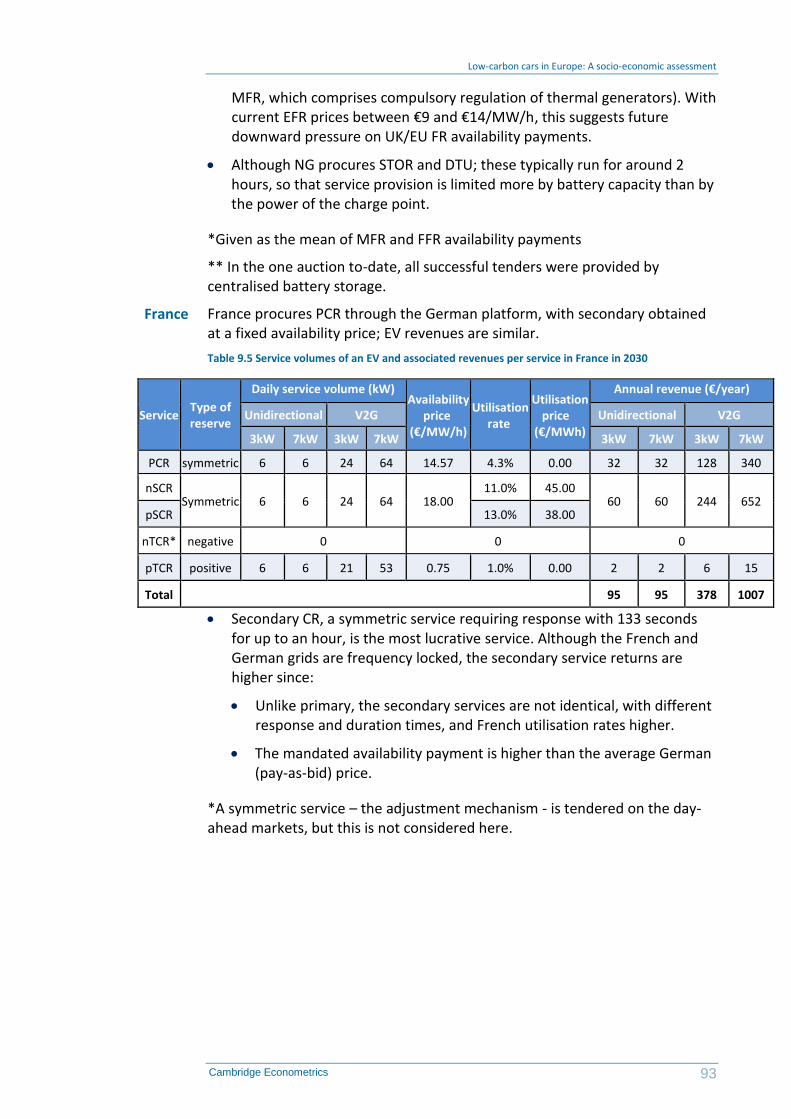
Low-carbon cars in Europe: A socio-economic assessment
93 Cambridge Econometrics
MFR, which comprises compulsory regulation of thermal generators). With current EFR prices between €9 and €14/MW/h, this suggests future downward pressure on UK/EU FR availability payments.
• Although NG procures STOR and DTU; these typically run for around 2 hours, so that service provision is limited more by battery capacity than by the power of the charge point.
*Given as the mean of MFR and FFR availability payments
** In the one auction to-date, all successful tenders were provided by centralised battery storage.
France procures PCR through the German platform, with secondary obtained at a fixed availability price; EV revenues are similar.
Table 9.5 Service volumes of an EV and associated revenues per service in France in 2030
Service Type of reserve
Daily service volume (kW) Availability
price (€/MW/h)
Utilisation rate
Utilisation price
(€/MWh)
Annual revenue (€/year)
Unidirectional V2G Unidirectional V2G
3kW 7kW 3kW 7kW 3kW 7kW 3kW 7kW
PCR symmetric 6 6 24 64 14.57 4.3% 0.00 32 32 128 340
nSCR Symmetric 6 6 24 64 18.00
11.0% 45.00 60 60 244 652
pSCR 13.0% 38.00
nTCR* negative 0 0 0
pTCR positive 6 6 21 53 0.75 1.0% 0.00 2 2 6 15
Total 95 95 378 1007
• Secondary CR, a symmetric service requiring response with 133 seconds for up to an hour, is the most lucrative service. Although the French and German grids are frequency locked, the secondary service returns are higher since:
• Unlike primary, the secondary services are not identical, with different response and duration times, and French utilisation rates higher.
• The mandated availability payment is higher than the average German (pay-as-bid) price.
*A symmetric service – the adjustment mechanism - is tendered on the day-ahead markets, but this is not considered here.
France

Low-carbon cars in Europe: A socio-economic assessment
94 Cambridge Econometrics
Spain: EV charge management value is low by European standards, since
PCR is procured through mandation of generator headroom
Table 9.6 Service volumes of an EV and associated revenues per service in Spain in 2030
Service Type of reserve
Daily service volume (kW) Availability price
(€/MW/h)
Utilisation rate
Utilisation price
(€/MWh)
Annual revenue (€/year)
Unidirectional V2G Unidirectional V2G
3kW 7kW 3kW 7kW 3kW 7kW 3kW 7kW
PCR symmetric 0 0
nSCR negative 24 64 24 64 0* 10.0% 32.40 28 76 28 76
pSCR positive 6 6 36 76 0* 12.0% 43.00 11 11 68 143
nTCR negative 19 19 19 19 0* 5.0% 19.40 7 7 7 7
pTCR positive 6 6 21 53 0* 8.0% 50.40 9 9 31 79
Total 55 103 134 304
• Spain provides all its ENTSO-E demand PCR through mandatory headroom in thermal plant; this increases wholesale power prices by 6% - around €3/MWh.
• Secondary and tertiary revenues are not as large as in DE, though as in Spain they are rewarded through a clearing cost, rather than pay-as-bid auction, it may be possible to access greater value through DSM by determining and bidding the true SRMC of charge management.
The Polish TSO obtains all frequency management from generators; there is no market for ancillary services from load management.
Poland’s grid is over 85% coal powered; frequency regulation is provided by ramping these up and down in response to variation in the grid frequency (as indicated right). Thermal plant leaves some headroom allowing it to increase output in response to a fall in system frequency.
We estimate the opportunity cost of providing FR through mandated coal turbine headroom at between €15 and €30/MW/h. In a liberalised market, we expect managed EV charging and other DSM to compete at or below this price.
EU policy encourages the increased liberalisation of energy markets and Ancillary Services (AS) provision in particular. In the 2016 Network Code, Article 108 - Ancillary Services identifies:
• With regard to active power and reactive power services, and in coordination with other TSOs where appropriate, each TSO shall use all available economically efficient and feasible means to procure the necessary level of ancillary services.
Spain
Poland
2016 EU Network Code on System
Operation

Low-carbon cars in Europe: A socio-economic assessment
95 Cambridge Econometrics
C.4 Net benefit of service provision with V2G per EV in 2030
Figure 9.2 Net benefit of grid service provision with a 3kW vs 7kW bi-directional residential charger, in Germany in 2030
Figure 9.3 Net benefit of grid service provision with a 3kW vs 7kW bi-directional residential charger, in the UK in 2030
Germany
UK
France
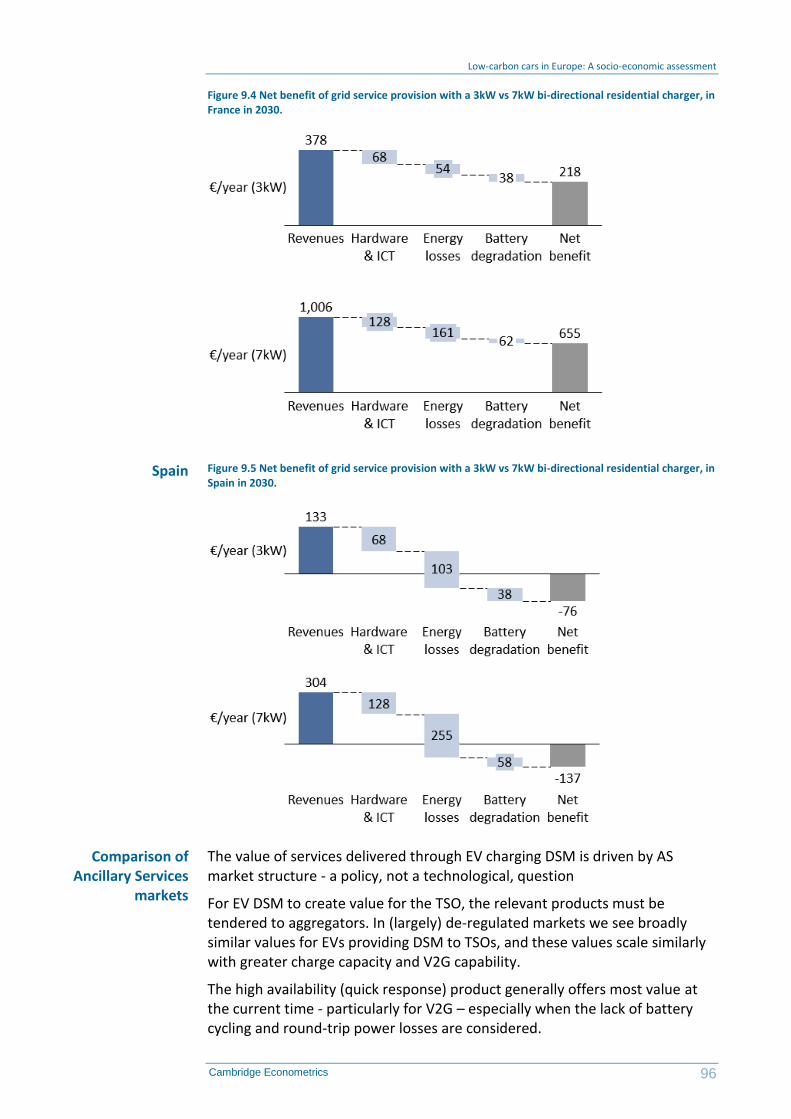
Low-carbon cars in Europe: A socio-economic assessment
96 Cambridge Econometrics
Figure 9.4 Net benefit of grid service provision with a 3kW vs 7kW bi-directional residential charger, in France in 2030.
Figure 9.5 Net benefit of grid service provision with a 3kW vs 7kW bi-directional residential charger, in Spain in 2030.
The value of services delivered through EV charging DSM is driven by AS market structure - a policy, not a technological, question
For EV DSM to create value for the TSO, the relevant products must be tendered to aggregators. In (largely) de-regulated markets we see broadly similar values for EVs providing DSM to TSOs, and these values scale similarly with greater charge capacity and V2G capability.
The high availability (quick response) product generally offers most value at the current time - particularly for V2G – especially when the lack of battery cycling and round-trip power losses are considered.
Spain
Comparison of Ancillary Services
markets

Low-carbon cars in Europe: A socio-economic assessment
97 Cambridge Econometrics
Six member states procure PCR through an integrated platform; exporting and importing frequency response on an hourly basis. As ENTSO-E policy drives greater integration, greater cross-border provision of AS may become possible, decoupling the physical location and access to AS markets.
A 2016 UK auction agreed 201MW of EFR at LCOE’s of between €9 and 14/MW/h from batteries. Given battery capex learning curves and that these contracts are at most 4 years long, this is likely an upper bound on long-term availability payments. Therefore we can expect an erosion of service value in the future as competition increases.
Primary reserve requirements are typically sized to insulate the grid against the sudden disconnection of a handful of large generators, requirements are not expected to change substantially to 2050. Secondary and Tertiary requirements (and utilisation rates) are likely to increase as renewables displace thermal plant, and lower the inertia of the system.
Given the (increasingly) integrated EU grid, MS generation composition does not have a significant impact on their AS demand DE and FR have very similar EV values (and share a PCR provision platform) with very different generation mixes.