Papa John’s Cardinal Stadium University of Louisville Louisville, KY
description

Performance Measure Summary - Louisville-Jefferson County KY-IN
There are several inventory and performance measures listed in the pages of this Urban Area Report for the
years from 1982 to 2014. There is no single performance measure that experts agree “says it all.” A few key
points should be recognized by users of the Urban Mobility Scorecard data.
Use the trends – The multi-year performance measures are better indicators, in most cases, than any single
year. Examining a few measures over many years reduces the chance that data variations or the estimating
procedures may have caused a "spike" in any single year. (5 years is 5 times better than 1 year.)
Use several measures – Each performance measure illustrates a different element of congestion. (The
view is more interesting from atop several measures .)
Compare to similar regions – Congestion analyses that compare areas with similar characteristics (for
example, population, growth rate, road and public transportation system design) are usually more insightful
than comparisons of different regions. (Los Angeles is not Peoria.)
Compare ranking changes and performance measure values – In some performance measures a small
change in the value may cause a significant change in rank from one year to the next. This is the case when
there are several regions with nearly the same value. (15 hours is only 1 hour more than 14 hours .)
Consider the scope of improvement options – Any improvement project in a corridor within most of the
regions will only have a modest effect on the regional congestion level. (To have an effect on areawide
congestion, there must be significant change in the system or service.)
Performance Measures and Definition of Terms
Travel Time Index – A measure of congestion that focuses on each trip and each mile of travel. It is
calculated as the ratio of travel time in the peak period to travel time in free-flow. A value of 1.30 indicates
that a 20-minute free-flow trip takes 26 minutes in the peak.
Planning Time Index – A travel time reliability measure that represents the total travel time that should be
planned for a trip. Computed with the 95th percentile travel time it represents the amount of time that should
be planned for a commute trip to be late for only 1 day a month. If it is computed with the 80th percentile
travel time it represents the amount of time that should be planned for a trip to be late for only 1 day a week.
A PTI of 2.00 means that for a 20-minute trip in light traffic, 40 minutes should be planned.
Peak Commuters – Number of travelers who begin a trip during the morning or evening peak travel periods
(6 to 10 a.m. and 3 to 7 p.m.). "Commuters" are private vehicle users unless specifically noted.
Annual Delay per Commuter – A yearly sum of all the per-trip delays for those persons who travel in the
peak period (6 to 10 a.m. and 3 to 7 p.m.). This measure illustrates the effect of traffic slowdowns as well as
the length of each trip.
Total Delay – The overall size of the congestion problem. Measured by the total travel time above that
needed to complete a trip at free-flow speeds. The ranking of total delay usually follows the population
ranking (larger regions usually have more delay).
Free-Flow Speeds – These values are derived from overnight speeds in the INRIX speed database. They
are used as the national comparison thresholds. Other speed thresholds may be appropriate for urban
project evaluations or sub-region studies.
Excess Fuel Consumed – Increased fuel consumption due to travel in congested conditions rather than free-
flow conditions.
Congestion Cost – Value of travel delay for 2014 (estimated at $17.67 per hour of person travel and $94.04
per hour of truck time) and excess fuel consumption estimated using state average cost per gallon.
Urban Area – The developed area (population density more than 1,000 persons per square mile) within a
metropolitan region. The urban area boundaries change frequently (every year for most growing areas), so
increases include both new growth and development that was previously in areas designated as rural.
Number of Rush Hours – Time when the road system might have congestion.
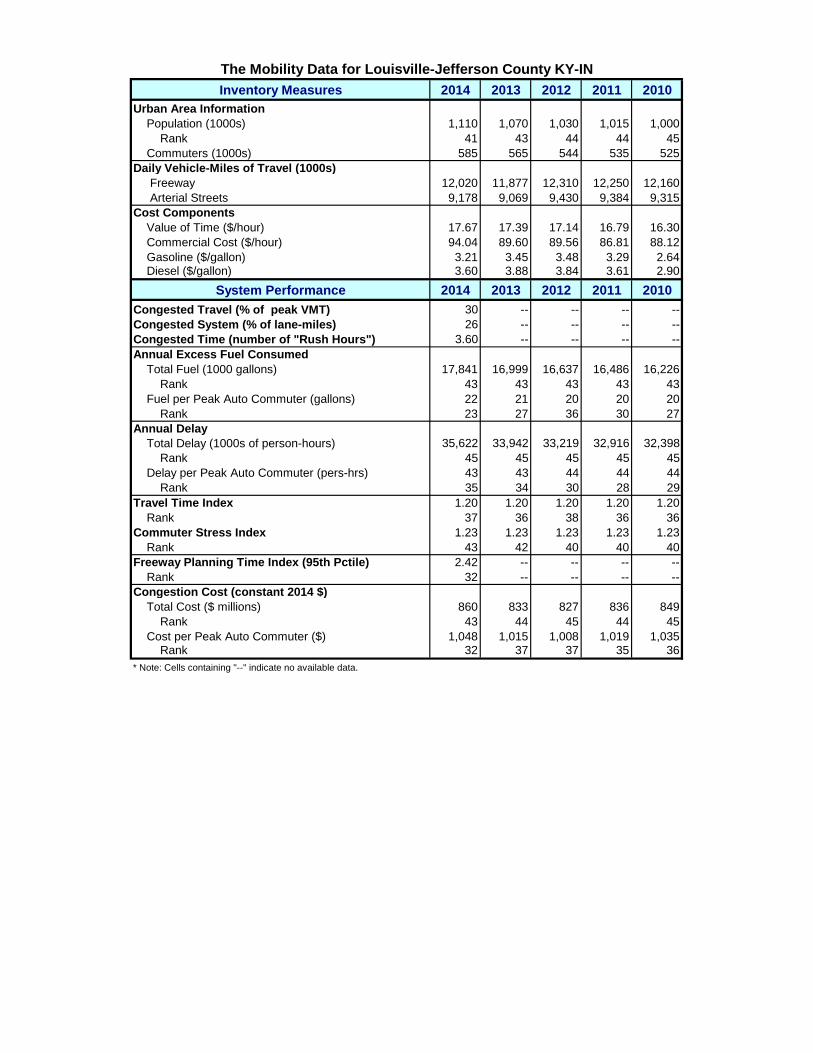
Inventory Measures 2014 2013 2012 2011 2010
Urban Area Information
Population (1000s) 1,110 1,070 1,030 1,015 1,000
Rank 41 43 44 44 45
Commuters (1000s) 585 565 544 535 525
Daily Vehicle-Miles of Travel (1000s)
Freeway 12,020 11,877 12,310 12,250 12,160
Arterial Streets 9,178 9,069 9,430 9,384 9,315
Cost Components
Value of Time ($/hour) 17.67 17.39 17.14 16.79 16.30
Commercial Cost ($/hour) 94.04 89.60 89.56 86.81 88.12
Gasoline ($/gallon) 3.21 3.45 3.48 3.29 2.64 Diesel ($/gallon) 3.60 3.88 3.84 3.61 2.90
System Performance 2014 2013 2012 2011 2010
Congested Travel (% of peak VMT) 30 -- -- -- --
Congested System (% of lane-miles) 26 -- -- -- --
Congested Time (number of "Rush Hours") 3.60 -- -- -- --
Annual Excess Fuel Consumed
Total Fuel (1000 gallons) 17,841 16,999 16,637 16,486 16,226
Rank 43 43 43 43 43
Fuel per Peak Auto Commuter (gallons) 22 21 20 20 20
Rank 23 27 36 30 27
Annual Delay
Total Delay (1000s of person-hours) 35,622 33,942 33,219 32,916 32,398
Rank 45 45 45 45 45
Delay per Peak Auto Commuter (pers-hrs) 43 43 44 44 44
Rank 35 34 30 28 29
Travel Time Index 1.20 1.20 1.20 1.20 1.20
Rank 37 36 38 36 36
Commuter Stress Index 1.23 1.23 1.23 1.23 1.23
Rank 43 42 40 40 40
Freeway Planning Time Index (95th Pctile) 2.42 -- -- -- --
Rank 32 -- -- -- --
Congestion Cost (constant 2014 $)
Total Cost ($ millions) 860 833 827 836 849
Rank 43 44 45 44 45
Cost per Peak Auto Commuter ($) 1,048 1,015 1,008 1,019 1,035 Rank 32 37 37 35 36
* Note: Cells containing "--" indicate no available data.
The Mobility Data for Louisville-Jefferson County KY-IN

Inventory Measures 2009 2008 2007 2006 2005
Urban Area Information
Population (1000s) 990 980 970 960 950
Rank 44 44 45 45 46
Commuters (1000s) 518 511 502 494 485
Daily Vehicle-Miles of Travel (1000s)
Freeway 12,050 12,000 12,085 11,925 11,800
Arterial Streets 8,900 8,780 8,730 8,700 8,645
Cost Components
Value of Time ($/hour) 16.01 16.10 15.47 15.06 14.58
Commercial Cost ($/hour) 89.75 81.52 82.56 80.43 78.05
Gasoline ($/gallon) 2.18 3.43 2.92 2.56 2.24 Diesel ($/gallon) 2.48 4.05 3.21 2.73 2.38
System Performance 2009 2008 2007 2006 2005
Congested Travel (% of peak VMT) -- -- -- -- --
Congested System (% of lane-miles) -- -- -- -- --
Congested Time (number of "Rush Hours") -- -- -- -- --
Annual Excess Fuel Consumed
Total Fuel (1000 gallons) 15,328 16,304 15,434 15,242 15,050
Rank 44 44 44 43 43
Fuel per Peak Auto Commuter (gallons) 19 20 19 19 18
Rank 35 30 41 33 39
Annual Delay
Total Delay (1000s of person-hours) 30,605 32,553 30,817 30,434 30,049
Rank 45 45 47 44 45
Delay per Peak Auto Commuter (pers-hrs) 42 45 43 44 44
Rank 32 30 36 31 29
Travel Time Index 1.20 1.21 1.20 1.20 1.20
Rank 35 37 38 37 36
Commuter Stress Index 1.22 1.24 1.23 1.23 1.23
Rank 44 42 43 43 41
Freeway Planning Time Index (95th Pctile) -- -- -- -- --
Rank -- -- -- -- --
Congestion Cost (constant 2014 $)
Total Cost ($ millions) 815 864 850 862 879
Rank 45 45 45 43 44
Cost per Peak Auto Commuter ($) 994 1,053 1,036 1,051 1,072 Rank 40 37 44 39 37
* Note: Cells containing "--" indicate no available data.
The Mobility Data for Louisville-Jefferson County KY-IN
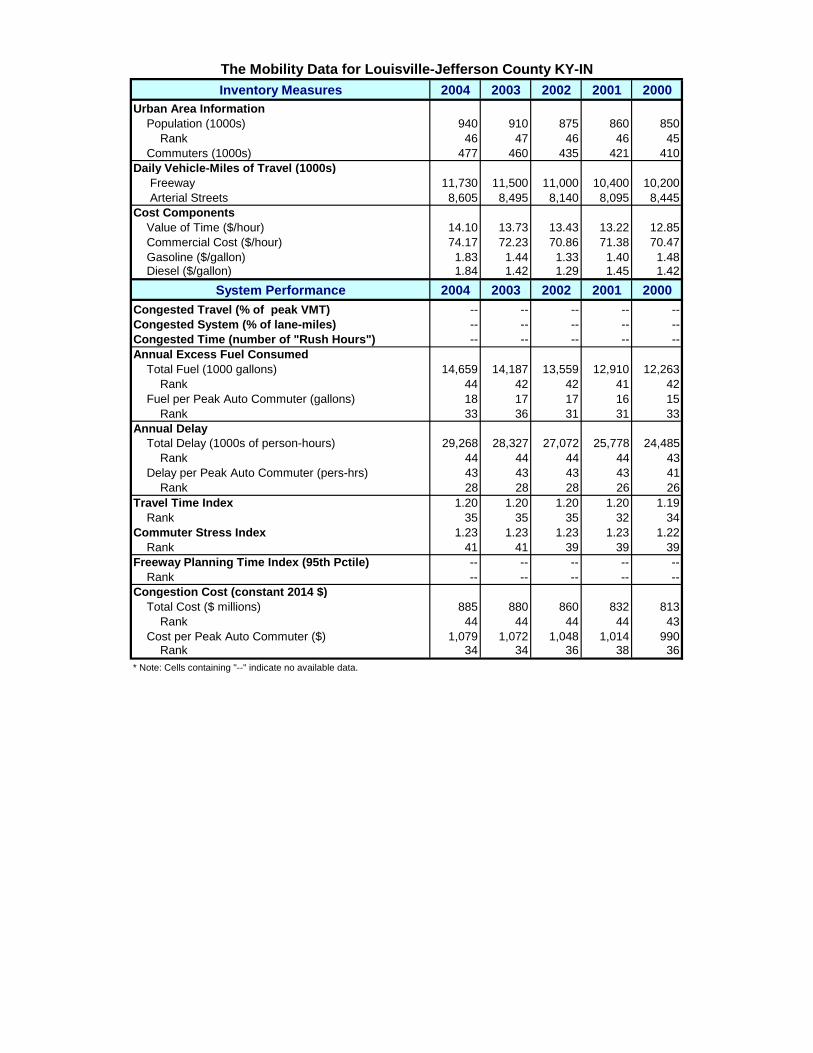
Inventory Measures 2004 2003 2002 2001 2000
Urban Area Information
Population (1000s) 940 910 875 860 850
Rank 46 47 46 46 45
Commuters (1000s) 477 460 435 421 410
Daily Vehicle-Miles of Travel (1000s)
Freeway 11,730 11,500 11,000 10,400 10,200
Arterial Streets 8,605 8,495 8,140 8,095 8,445
Cost Components
Value of Time ($/hour) 14.10 13.73 13.43 13.22 12.85
Commercial Cost ($/hour) 74.17 72.23 70.86 71.38 70.47
Gasoline ($/gallon) 1.83 1.44 1.33 1.40 1.48 Diesel ($/gallon) 1.84 1.42 1.29 1.45 1.42
System Performance 2004 2003 2002 2001 2000
Congested Travel (% of peak VMT) -- -- -- -- --
Congested System (% of lane-miles) -- -- -- -- --
Congested Time (number of "Rush Hours") -- -- -- -- --
Annual Excess Fuel Consumed
Total Fuel (1000 gallons) 14,659 14,187 13,559 12,910 12,263
Rank 44 42 42 41 42
Fuel per Peak Auto Commuter (gallons) 18 17 17 16 15
Rank 33 36 31 31 33
Annual Delay
Total Delay (1000s of person-hours) 29,268 28,327 27,072 25,778 24,485
Rank 44 44 44 44 43
Delay per Peak Auto Commuter (pers-hrs) 43 43 43 43 41
Rank 28 28 28 26 26
Travel Time Index 1.20 1.20 1.20 1.20 1.19
Rank 35 35 35 32 34
Commuter Stress Index 1.23 1.23 1.23 1.23 1.22
Rank 41 41 39 39 39
Freeway Planning Time Index (95th Pctile) -- -- -- -- --
Rank -- -- -- -- --
Congestion Cost (constant 2014 $)
Total Cost ($ millions) 885 880 860 832 813
Rank 44 44 44 44 43
Cost per Peak Auto Commuter ($) 1,079 1,072 1,048 1,014 990 Rank 34 34 36 38 36
* Note: Cells containing "--" indicate no available data.
The Mobility Data for Louisville-Jefferson County KY-IN

Inventory Measures 1999 1998 1997 1996 1995
Urban Area Information
Population (1000s) 840 830 830 825 825
Rank 45 45 44 43 43
Commuters (1000s) 398 387 381 372 366
Daily Vehicle-Miles of Travel (1000s)
Freeway 10,035 9,900 9,600 9,210 8,665
Arterial Streets 8,350 8,210 7,985 7,855 7,690
Cost Components
Value of Time ($/hour) 12.43 12.17 11.98 11.71 11.37
Commercial Cost ($/hour) 66.76 65.76 66.83 66.20 64.27
Gasoline ($/gallon) 1.09 1.06 1.12 1.25 1.14 Diesel ($/gallon) 1.04 1.10 1.19 1.34 1.22
System Performance 1999 1998 1997 1996 1995
Congested Travel (% of peak VMT) -- -- -- -- --
Congested System (% of lane-miles) -- -- -- -- --
Congested Time (number of "Rush Hours") -- -- -- -- --
Annual Excess Fuel Consumed
Total Fuel (1000 gallons) 11,616 10,971 10,479 9,957 9,512
Rank 41 40 40 40 40
Fuel per Peak Auto Commuter (gallons) 14 13 13 12 12
Rank 34 34 27 31 20
Annual Delay
Total Delay (1000s of person-hours) 23,194 21,906 20,923 19,880 18,993
Rank 43 42 42 42 40
Delay per Peak Auto Commuter (pers-hrs) 40 39 37 36 35
Rank 26 23 22 21 20
Travel Time Index 1.19 1.18 1.17 1.17 1.16
Rank 30 29 32 30 32
Commuter Stress Index 1.21 1.21 1.20 1.19 1.19
Rank 39 39 39 41 40
Freeway Planning Time Index (95th Pctile) -- -- -- -- --
Rank -- -- -- -- --
Congestion Cost (constant 2014 $)
Total Cost ($ millions) 796 768 745 724 712
Rank 43 41 41 41 39
Cost per Peak Auto Commuter ($) 970 936 908 883 868 Rank 35 34 32 30 30
* Note: Cells containing "--" indicate no available data.
The Mobility Data for Louisville-Jefferson County KY-IN

Inventory Measures 1994 1993 1992 1991 1990
Urban Area Information
Population (1000s) 825 820 815 810 810
Rank 42 42 42 41 41
Commuters (1000s) 361 353 345 337 332
Daily Vehicle-Miles of Travel (1000s)
Freeway 8,175 7,850 7,110 6,560 6,265
Arterial Streets 7,770 7,495 7,215 6,810 6,305
Cost Components
Value of Time ($/hour) 11.06 10.78 10.47 10.17 9.75
Commercial Cost ($/hour) 62.23 60.84 59.01 57.31 55.03
Gasoline ($/gallon) 1.01 1.05 1.03 1.04 1.06 Diesel ($/gallon) 1.08 1.13 1.12 1.15 1.06
System Performance 1994 1993 1992 1991 1990
Congested Travel (% of peak VMT) -- -- -- -- --
Congested System (% of lane-miles) -- -- -- -- --
Congested Time (number of "Rush Hours") -- -- -- -- --
Annual Excess Fuel Consumed
Total Fuel (1000 gallons) 9,031 8,535 8,212 7,397 6,536
Rank 40 40 39 38 38
Fuel per Peak Auto Commuter (gallons) 11 10 10 9 8
Rank 20 24 16 22 25
Annual Delay
Total Delay (1000s of person-hours) 18,033 17,041 16,398 14,769 13,051
Rank 40 40 39 39 39
Delay per Peak Auto Commuter (pers-hrs) 33 32 31 29 26
Rank 23 22 23 24 27
Travel Time Index 1.16 1.15 1.15 1.13 1.12
Rank 30 30 26 33 34
Commuter Stress Index 1.18 1.18 1.17 1.16 1.15
Rank 42 40 41 41 42
Freeway Planning Time Index (95th Pctile) -- -- -- -- --
Rank -- -- -- -- --
Congestion Cost (constant 2014 $)
Total Cost ($ millions) 695 674 668 620 571
Rank 39 39 38 37 38
Cost per Peak Auto Commuter ($) 848 821 814 755 696 Rank 29 24 23 26 29
* Note: Cells containing "--" indicate no available data.
The Mobility Data for Louisville-Jefferson County KY-IN
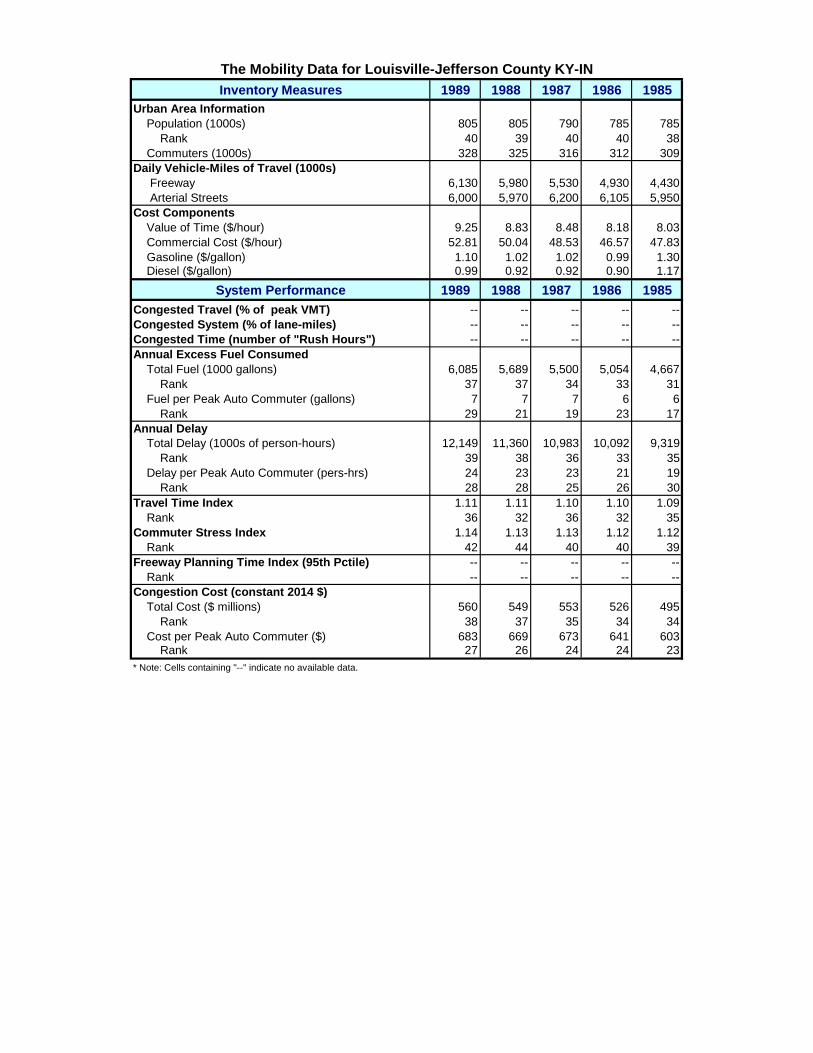
Inventory Measures 1989 1988 1987 1986 1985
Urban Area Information
Population (1000s) 805 805 790 785 785
Rank 40 39 40 40 38
Commuters (1000s) 328 325 316 312 309
Daily Vehicle-Miles of Travel (1000s)
Freeway 6,130 5,980 5,530 4,930 4,430
Arterial Streets 6,000 5,970 6,200 6,105 5,950
Cost Components
Value of Time ($/hour) 9.25 8.83 8.48 8.18 8.03
Commercial Cost ($/hour) 52.81 50.04 48.53 46.57 47.83
Gasoline ($/gallon) 1.10 1.02 1.02 0.99 1.30 Diesel ($/gallon) 0.99 0.92 0.92 0.90 1.17
System Performance 1989 1988 1987 1986 1985
Congested Travel (% of peak VMT) -- -- -- -- --
Congested System (% of lane-miles) -- -- -- -- --
Congested Time (number of "Rush Hours") -- -- -- -- --
Annual Excess Fuel Consumed
Total Fuel (1000 gallons) 6,085 5,689 5,500 5,054 4,667
Rank 37 37 34 33 31
Fuel per Peak Auto Commuter (gallons) 7 7 7 6 6
Rank 29 21 19 23 17
Annual Delay
Total Delay (1000s of person-hours) 12,149 11,360 10,983 10,092 9,319
Rank 39 38 36 33 35
Delay per Peak Auto Commuter (pers-hrs) 24 23 23 21 19
Rank 28 28 25 26 30
Travel Time Index 1.11 1.11 1.10 1.10 1.09
Rank 36 32 36 32 35
Commuter Stress Index 1.14 1.13 1.13 1.12 1.12
Rank 42 44 40 40 39
Freeway Planning Time Index (95th Pctile) -- -- -- -- --
Rank -- -- -- -- --
Congestion Cost (constant 2014 $)
Total Cost ($ millions) 560 549 553 526 495
Rank 38 37 35 34 34
Cost per Peak Auto Commuter ($) 683 669 673 641 603 Rank 27 26 24 24 23
* Note: Cells containing "--" indicate no available data.
The Mobility Data for Louisville-Jefferson County KY-IN

Inventory Measures 1984 1983 1982
Urban Area Information
Population (1000s) 780 780 770
Rank 38 38 39
Commuters (1000s) 305 303 296
Daily Vehicle-Miles of Travel (1000s)
Freeway 4,330 4,415 4,045
Arterial Streets 5,670 5,610 5,845
Cost Components
Value of Time ($/hour) 7.75 7.43 7.20
Commercial Cost ($/hour) 46.47 44.23 43.08
Gasoline ($/gallon) 1.31 1.34 1.41 Diesel ($/gallon) 1.19 1.21 1.27
System Performance 1984 1983 1982
Congested Travel (% of peak VMT) -- -- --
Congested System (% of lane-miles) -- -- --
Congested Time (number of "Rush Hours") -- -- --
Annual Excess Fuel Consumed
Total Fuel (1000 gallons) 4,333 4,074 3,936
Rank 32 31 29
Fuel per Peak Auto Commuter (gallons) 5 5 5
Rank 22 19 16
Annual Delay
Total Delay (1000s of person-hours) 8,653 8,135 7,859
Rank 33 32 31
Delay per Peak Auto Commuter (pers-hrs) 18 17 17
Rank 30 29 24
Travel Time Index 1.09 1.08 1.08
Rank 29 33 28
Commuter Stress Index 1.11 1.11 1.10
Rank 39 38 37
Freeway Planning Time Index (95th Pctile) -- -- --
Rank -- -- --
Congestion Cost (constant 2014 $)
Total Cost ($ millions) 476 467 465
Rank 32 32 30
Cost per Peak Auto Commuter ($) 580 569 567 Rank 23 21 19
* Note: Cells containing "--" indicate no available data.
The Mobility Data for Louisville-Jefferson County KY-IN