Louisiana Specialty Crop Program Final …...1 Louisiana Specialty Crop Program Final Performance...
57
1 Louisiana Specialty Crop Program Final Performance Report Agreement # 12-25-B-1673 December 15, 2016 CONTACTS Program Administration: Michelle Estay, Director of Commodity Promotion & Research Louisiana Department of Agriculture & Forestry 47076 N. Morrison Blvd. Hammond, LA 70401-7308 Financial Officer: Dane Morgan, Assistant Commissioner Office of Management & Finance Louisiana Department of Agriculture & Forestry P.O. Box 3481 Baton Rouge, LA 70821-3481 CONTENTS Abstract ......................................................................................................... 2 Project One..................................................................................................... 2 Project Two .................................................................................................... 11 Project Three .................................................................................................. 11 Project Four………………………………………………………………… 18 Project Five…………………………………………………………………. 29 LOUISIANA DEPARTMENT OF AGRICULTURE & FORESTRY MIKE STRAIN DVM, COMMISSIONER
Transcript of Louisiana Specialty Crop Program Final …...1 Louisiana Specialty Crop Program Final Performance...
1
Louisiana Specialty Crop Program Final Performance Report
Agreement # 12-25-B-1673 December 15, 2016
CONTACTS Program Administration: Michelle Estay, Director of Commodity Promotion & Research Louisiana Department of Agriculture & Forestry 47076 N. Morrison Blvd. Hammond, LA 70401-7308 Financial Officer: Dane Morgan, Assistant Commissioner Office of Management & Finance
Louisiana Department of Agriculture & Forestry P.O. Box 3481 Baton Rouge, LA 70821-3481
CONTENTS Abstract ......................................................................................................... 2
Project One..................................................................................................... 2
Project Two .................................................................................................... 11
Project Three .................................................................................................. 11
Project Four………………………………………………………………… 18
Project Five…………………………………………………………………. 29
LOUISIANA DEPARTMENT OF AGRICULTURE & FORESTRY MIKE STRAIN DVM, COMMISSIONER
2
PROGRAM OVERVIEW
The Louisiana Department of Agriculture and Forestry (LDAF) was awarded $326,171.71 in funding for the FY 2013 Specialty Crop Block Grant Program (SCBGP). LDAF implemented projects to enhance the competitiveness of specialty crops throughout the state. Louisiana’s projects focused on programs working to inform consumers of the availability of Louisiana specialty crops, where they can be purchased for increased sales and consumption, and how to easily prepare them. Projects also focused on specific specialty crop research to improve herbicide management to address crop growth development and yield, the study of new cultivars for production and tolerances to increase landscape sod production, and specific specialty crop commodity promotions to increase consumption and sales. These projects were chosen for their importance to Louisiana’s specialty crop industries and to help add money into the local economy. LDAF projects were designed to improve the competitiveness of Louisiana’s specialty crops and educate the consumer. LDAF staff monitored each project by requiring quarterly activity reports and maintaining periodic phone calls, site visits and email update discussions. All invoicing and grant fund payments were completed.
PROJECT ONE TITLE: “COOKING UP LOUISIANA TREASURES” CONSUMER EDUCATION
PROJECT SUMMARY: The project “Cooking Up Louisiana Treasures” came from a need in our area to educate families on how to select and prepare great Louisiana specialty crops and where to find them, as an alternative to the fast food and less healthy choices that are inundating consumers on a nearly hourly basis. With this project, we focused on explaining how fresh produce being grown and harvested that month could become a staple in the home and on the dining table. We brought to the consumer the reality that fresh produce could move from the farmer’s field, to the market, into the kitchen, and served for a meal, all within 24 to 72 hours. The timeliness of this farm-to-table initiative results in the freshest fruits and vegetables being prepared, while most of the nutritious elements are still in the produce so that families get the benefit of the freshness.
3
PROJECT APPROACH: Each episode involved filming on-site, in the fields of farmers around the entire state of Louisiana. From the bright green spinach growing at Frank Fekete Farm in the city of Hammond, to the beautifully plump watermelons, ready for picking at Plunkett Farms in Womack, Louisiana, to the deliciously sweet and easy-to-peel satsumas on Simon Citrus Farm in the town of Kaplan, the project showed how local farmers can make shopping for healthy food easy and convenient.
The project, in order to help educate the consumer, presented easy, quick ways of preparing great dishes that only involve a few minutes of prep time, yet yield results that taste like the consumer spent hours preparing.
Throughout the project we partnered with LSU Nutrition and Food Science Instructor Judy Myhand for detailed nutritional information for each of the chosen specialty crops. Her segments became a popular part of the show, in which she would include facts about cooking methods and how they affect the nutritional value of a specific vegetable, or how adding something to a crop can improve body absorption of a specific nutrient. Also, there was information provided to help educate the consumer with tips on how to clean and handle food safely.
The farmers were so important to the project, as they presented hands-on demonstrations of harvesting fruits and vegetables, explained how easy or difficult it is to grow a specific crop, how to choose a ripe item, and when the optimal time is to pick your own produce or to purchase at the market. Farmers also graciously allowed our cameras to go in the field, showing beautiful produce at the various stages of growth.
Louisiana Department of Agriculture and Forestry Commissioner Mike Strain was an integral part of the project, supplying information on agricultural facts and financial benefits of special crops sold and consumed in Louisiana as well as nutritional benefits of special crop consumption. His participation went a long way in making the presentation of this educational information understandable and relatable. With his help in the kitchen, the consumer could see how a non-professional cook could prepare healthy, fresh foods easily in their own kitchens.
GOALS AND OUTCOMES ACHIEVED: Our goal was to increase the awareness of Louisiana consumers about the great selection of specialty crops being grown in Louisiana, where to find them, and
4
increase consumption of specialty crops by educating with easy recipes, and the importance of the nutritional benefits of consumption. To measure this, we introduced an online survey that viewers could complete, that included such questions as: “Do you have a better understanding of the Louisiana specialty crop featured in the program?” and “Do you plan to purchase one or more Louisiana specialty crops within the next week?” From these questions, as well as other questions asked in the survey, we were able to assess a measurable of the program’s activities. The goal target was that 50% of those taking the survey would respond that they had an increase in knowledge of specialty crops and planned to consume more specialty crops as a result of the project’s specialty crop educational show. The goal was achieved and surpassed.
The survey was developed and available in April of 2015. The survey was available for the public to respond and was advertised to participate in the survey during each episode through the end of the year for measuring purposes. Survey results showed only two did not answer in the affirmative on the question about a better understanding of Louisiana specialty crops. Those two did not answer that question at all. Survey results showed 93% answered in the affirmative that they had an increase in knowledge of specialty crops.
We did find that nearly 80% of the respondents did plan to cook the main recipe featured in the episode and 85% of the respondents also planned to purchase at least one of the Louisiana specialty crops featured in the episode.
Our goal from the outset was to increase the awareness and knowledge of our Louisiana consumers about these amazing Louisiana specialty crops that are growing right here and increase their intention to consume more specialty crops by 50%. This goal was achieved. The results of the survey showed that we were reaching these people and that they were learning from the programming, both in where to look for Louisiana specialty crops, but also how easy it is to find prepare and serve them to their families. They learned about alternative recipes that are healthier and more nutritious than other food source alternatives.
The question “Have you ever bought local, fresh produce directly from a farmer?” had a positive response of only 48%, yet the question “After watching the program would you say you are more likely to purchase fresh produce directly from a farmer?”, had a positive result of nearly 91%, showing that more than 81% of those who had not previously purchased produce from a farmer were more likely to do so in the future, and 68% of those planned to do so within the next week.
5
Beneficiaries of the project were the more than 765,000 Louisiana consumers and their families that were exposed to the seven educational specialty crop episodes through local and cable channels. Even more were exposed to the educational activities of this project through online viewing ability that is still available today on YouTube and LDAF online website. More than 165 farmers selling at roadside stands and farmer’s markets were also beneficiaries of this project’s educational activities of informing the consumer of their trade and information as to where to find their local farmer and farm stand to purchase direct. The grant was written to originally cover six episodes. We were very pleased to be able surpass that goal by producing a seventh educational program. Project activities were accomplished under budget and ahead of schedule. The television partners who aired episodes of “Cooking Up Louisiana Treasures” include: St. Tammany Parish Government Channel - 250,000 Viscom – Houma and LaRose - 41,000 Metro 21 - Greater Baton Rouge -150,000 Bossier Parish Community College - 70,000 Channel 13 - Educational Access St. Tammany Parish - 250,000 St. Charles Parish Government Channel - 53,000 Kenner TV - New Orleans - 67,000 SELU Channel 199 - Hammond, Tangipahoa, -134,000 Livingston Parishes YouTube Video Access and LDAF online access - Still Running
LESSONS LEARNED: In conducting this project, we learned to plan in advance several different filming locations in case a problem arose at one location, then there would be a backup ready to go. Sometimes a farmer has a problem come up last minute or bad weather conditions could cancel a shooting. This helped to stay on time since programing and featuring seasonal crops need to stay on schedule. In speaking with consumers at farmer’s market locations, when asked shoppers if they had ever tried certain kinds of crops, many answered no, they didn’t know how to cook them or clean them. (ex: greens) To help address this reality, we included handling/cleaning tips.
6
CONTACT: Chef Celeste Gill 225-324-5616 Chefceleste.com ADDITIONAL INFORMATION:
All episodes of “Cooking Up Louisiana Treasures” can be found by visiting: http://cookinguplouisianatreasures.com/ http://www.ldaf.state.la.us/multimedia/ https://www.facebook.com/CookingUpLouisianaTreasures and our YouTube channel: https://www.youtube.com/channel/UCpOPeHN5K8rcj0IRX4nieuQ
An episode-by-episode breakdown, including images from the show, can be found on the following pages.
In late February we started planning the shows we would film in March, for airing in April. Episode 1
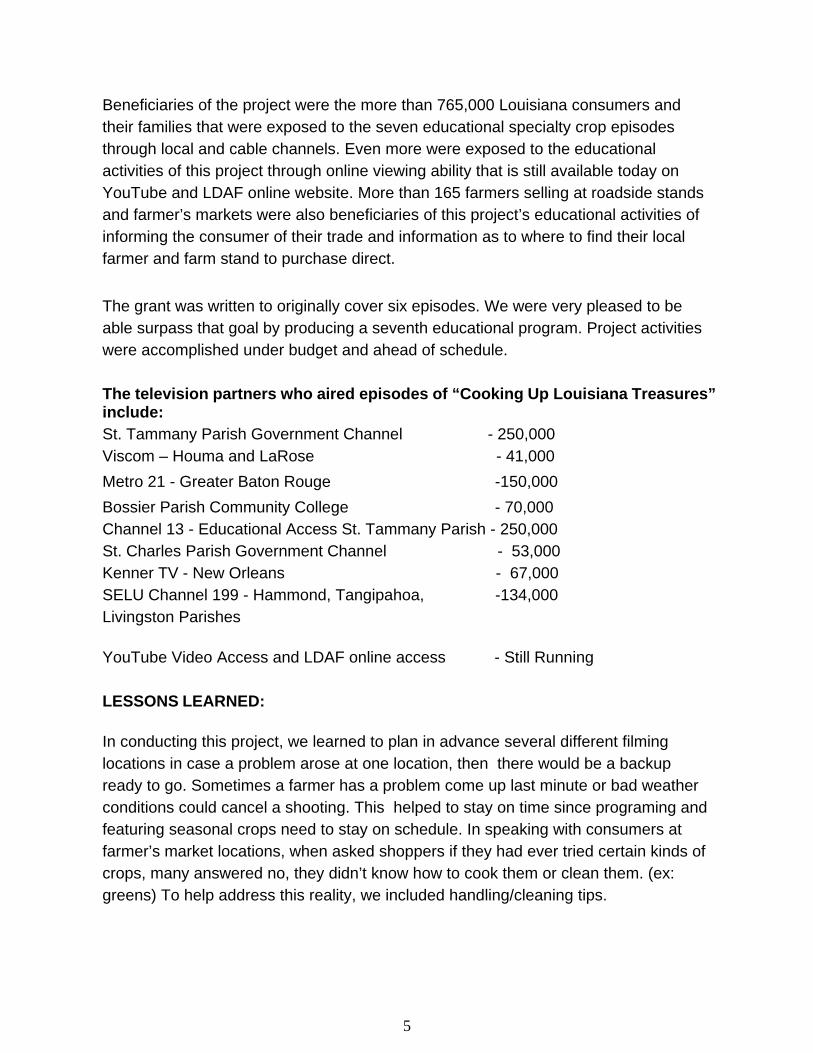
The crop we focused on for the first episode was spinach. We went to Frank Fekete Farm in Hammond, Louisiana to film spinach growing in the field. We filmed a segment on the proper way to clean and store spinach, to reduce the risk of diseases.
We also had a nutrition segment, by LSU Nutrition and Food Science instructor, Judy Myhand, which focused on the health benefits of spinach.
7
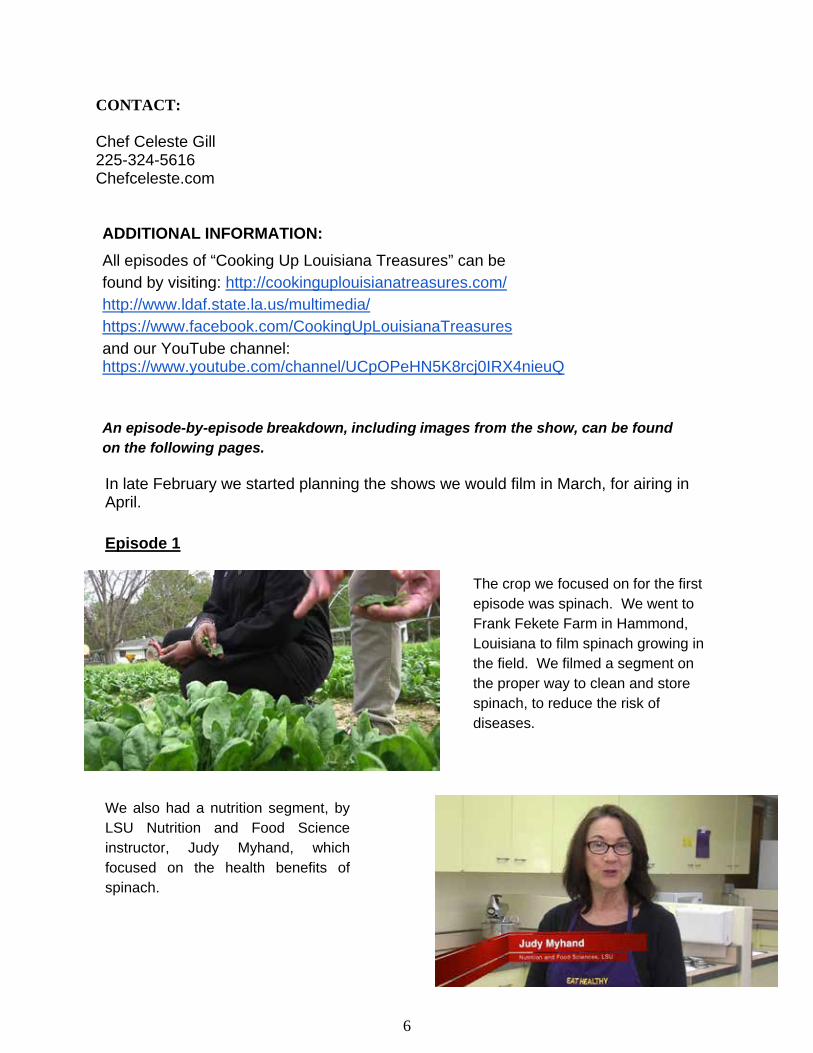
Our second crop focused on Louisiana strawberries, with video shot at the Baton Rouge Farmers’ Market and Liuzza produce farm in the town of Amite, Louisiana.
A segment discussing the nutritional and agricultural value of strawberries was voiced-over by Dr. Mike Strain, Commissioner of Agriculture and Forestry in Louisiana.
This episode was hosted by Chef Celeste Gill and Louisiana Agriculture and Forestry Commissioner, Dr. Mike Strain. The episode aired on television stations in Louisiana, throughout the month of April 2015. The episode was also made available for viewing online at YouTube, the Louisiana Department of Agriculture and Forestry website, and the Cooking Up Louisiana Treasures website. This episode is still available on these internet platforms. https://www.youtube.com/watch?v=sPdmongDrjc
Episode 2
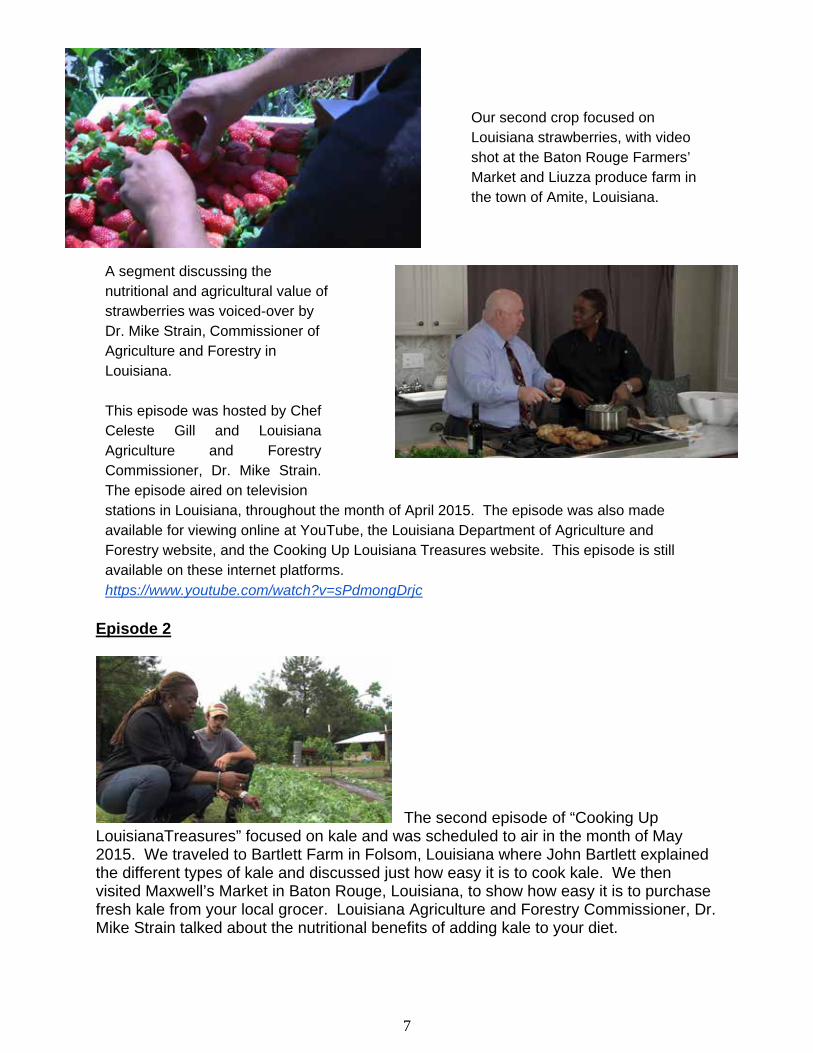
The second episode of “Cooking Up LouisianaTreasures” focused on kale and was scheduled to air in the month of May 2015. We traveled to Bartlett Farm in Folsom, Louisiana where John Bartlett explained the different types of kale and discussed just how easy it is to cook kale. We then visited Maxwell’s Market in Baton Rouge, Louisiana, to show how easy it is to purchase fresh kale from your local grocer. Louisiana Agriculture and Forestry Commissioner, Dr. Mike Strain talked about the nutritional benefits of adding kale to your diet.
5
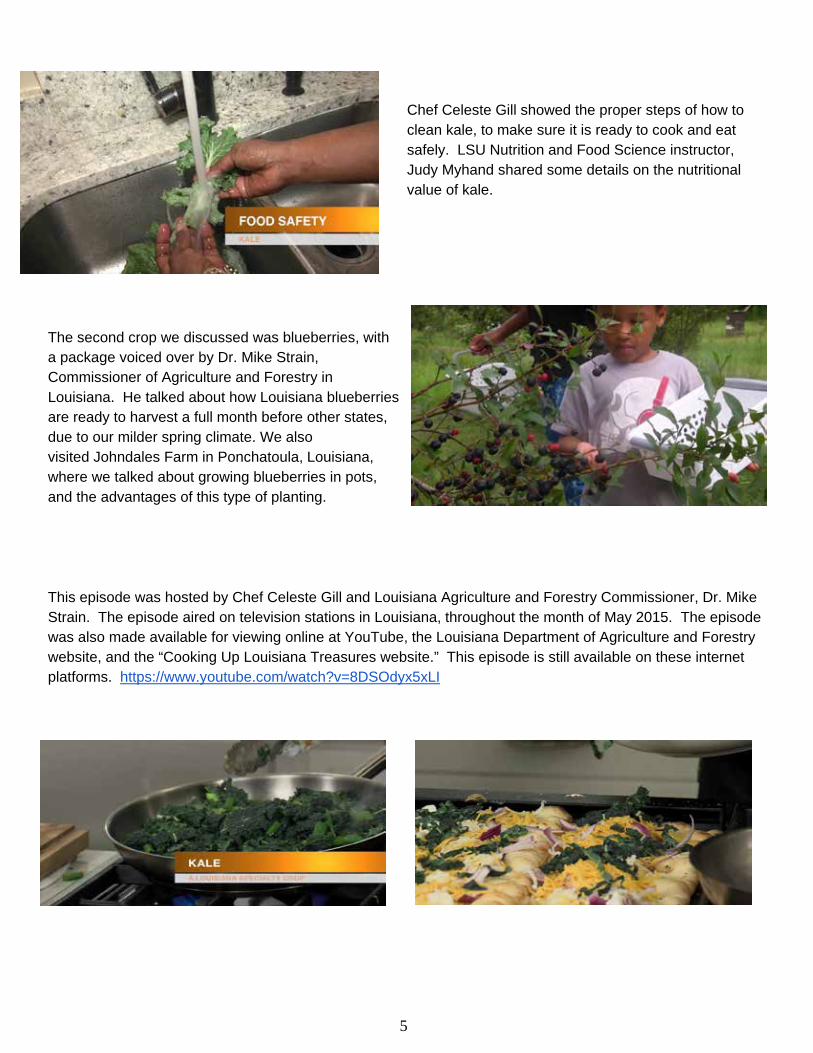
Chef Celeste Gill showed the proper steps of how to clean kale, to make sure it is ready to cook and eat safely. LSU Nutrition and Food Science instructor, Judy Myhand shared some details on the nutritional value of kale.
The second crop we discussed was blueberries, with a package voiced over by Dr. Mike Strain, Commissioner of Agriculture and Forestry in Louisiana. He talked about how Louisiana blueberries are ready to harvest a full month before other states, due to our milder spring climate. We also visited Johndales Farm in Ponchatoula, Louisiana, where we talked about growing blueberries in pots, and the advantages of this type of planting.
This episode was hosted by Chef Celeste Gill and Louisiana Agriculture and Forestry Commissioner, Dr. Mike Strain. The episode aired on television stations in Louisiana, throughout the month of May 2015. The episode was also made available for viewing online at YouTube, the Louisiana Department of Agriculture and Forestry website, and the “Cooking Up Louisiana Treasures website.” This episode is still available on these internet platforms. https://www.youtube.com/watch?v=8DSOdyx5xLI
6
Episode 3
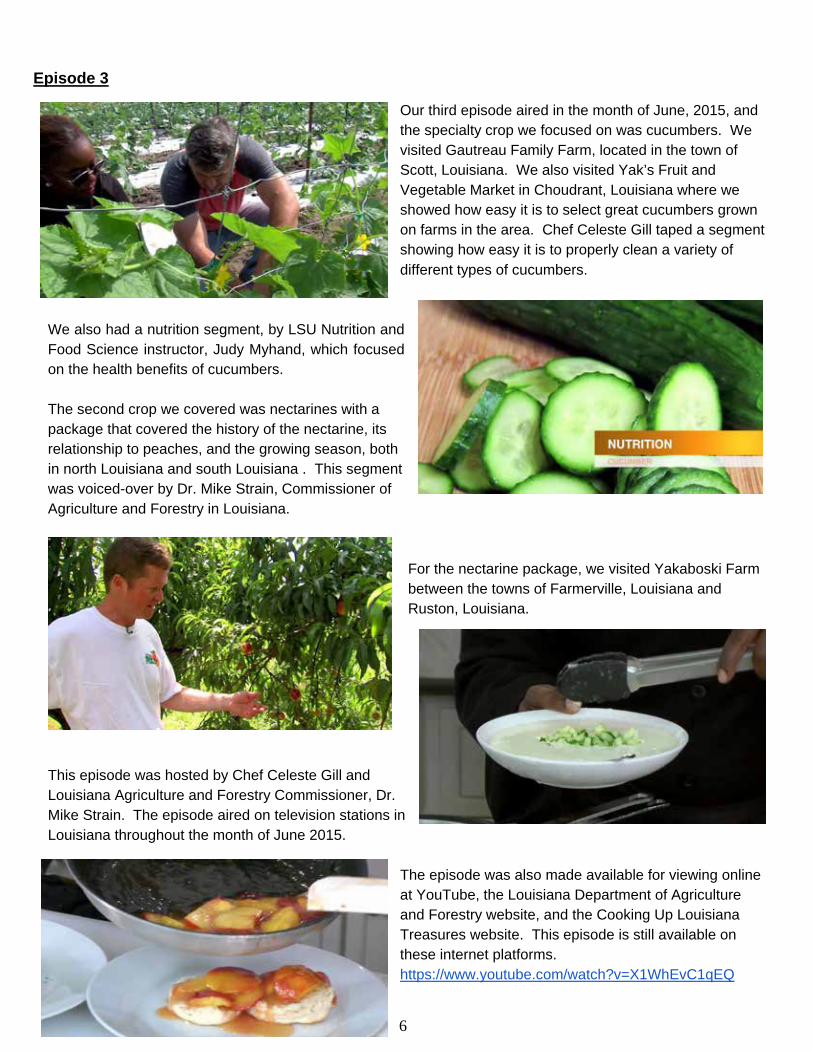
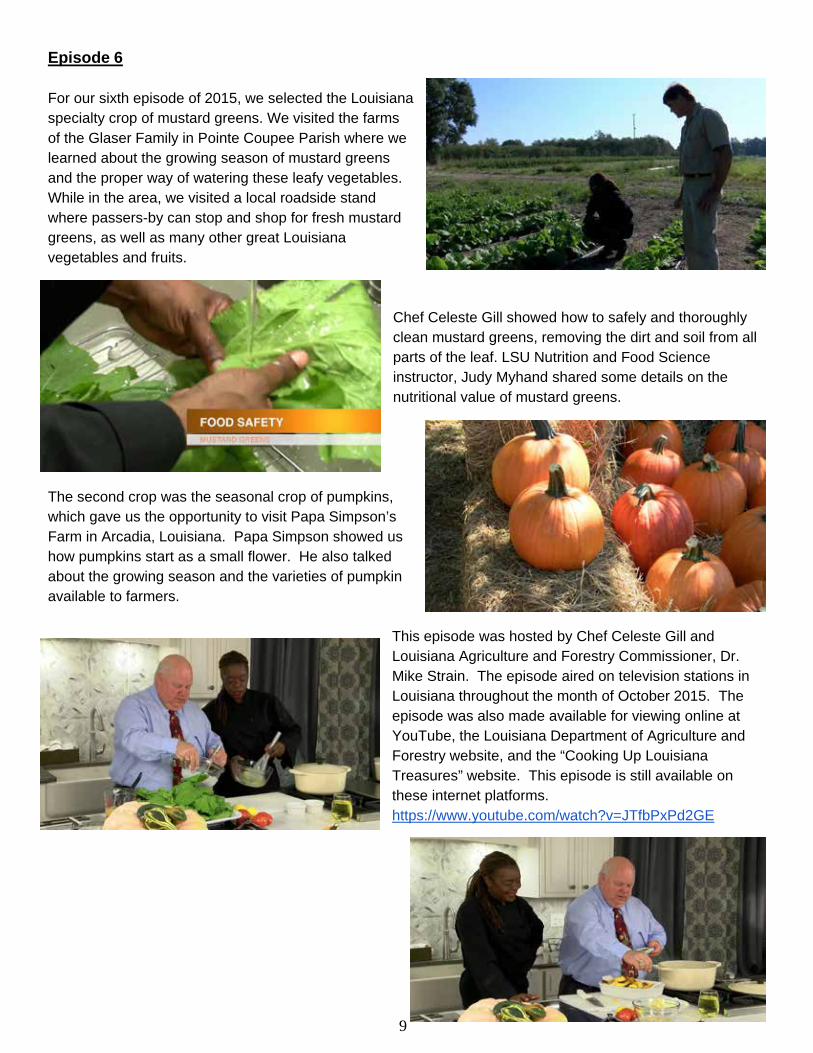
Our third episode aired in the month of June, 2015, and the specialty crop we focused on was cucumbers. We visited Gautreau Family Farm, located in the town of Scott, Louisiana. We also visited Yak’s Fruit and Vegetable Market in Choudrant, Louisiana where we showed how easy it is to select great cucumbers grown on farms in the area. Chef Celeste Gill taped a segment showing how easy it is to properly clean a variety of different types of cucumbers.
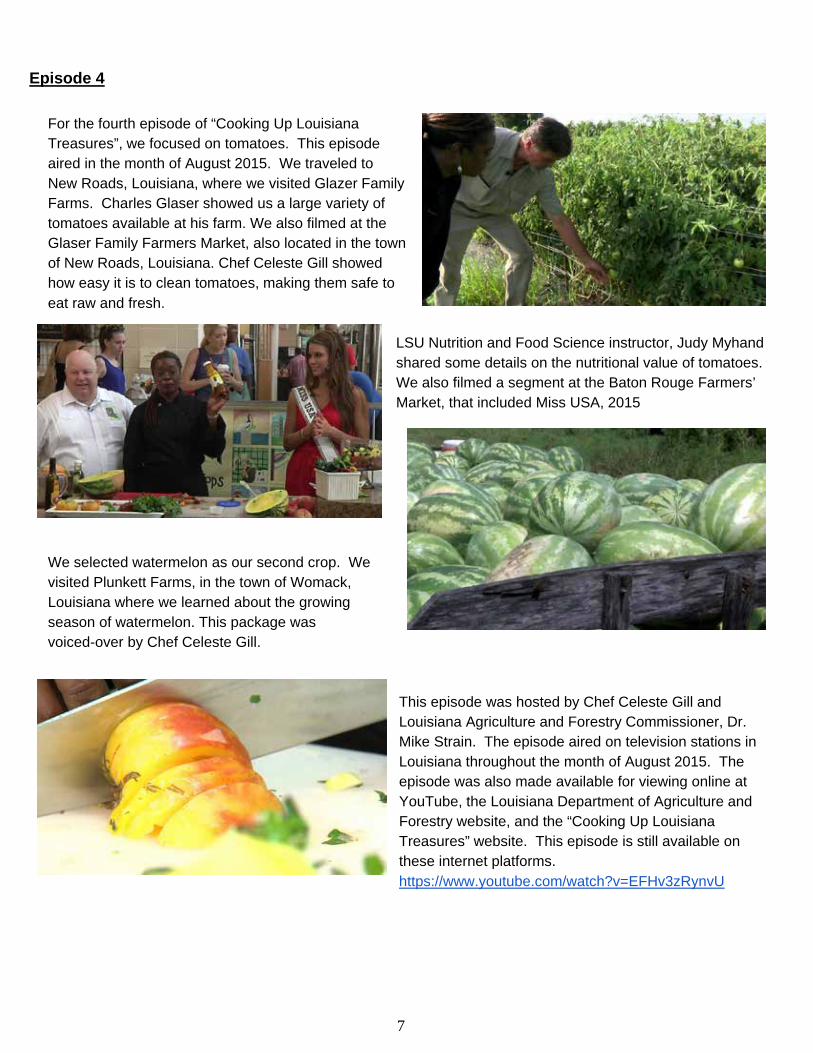
We also had a nutrition segment, by LSU Nutrition and Food Science instructor, Judy Myhand, which focused on the health benefits of cucumbers.
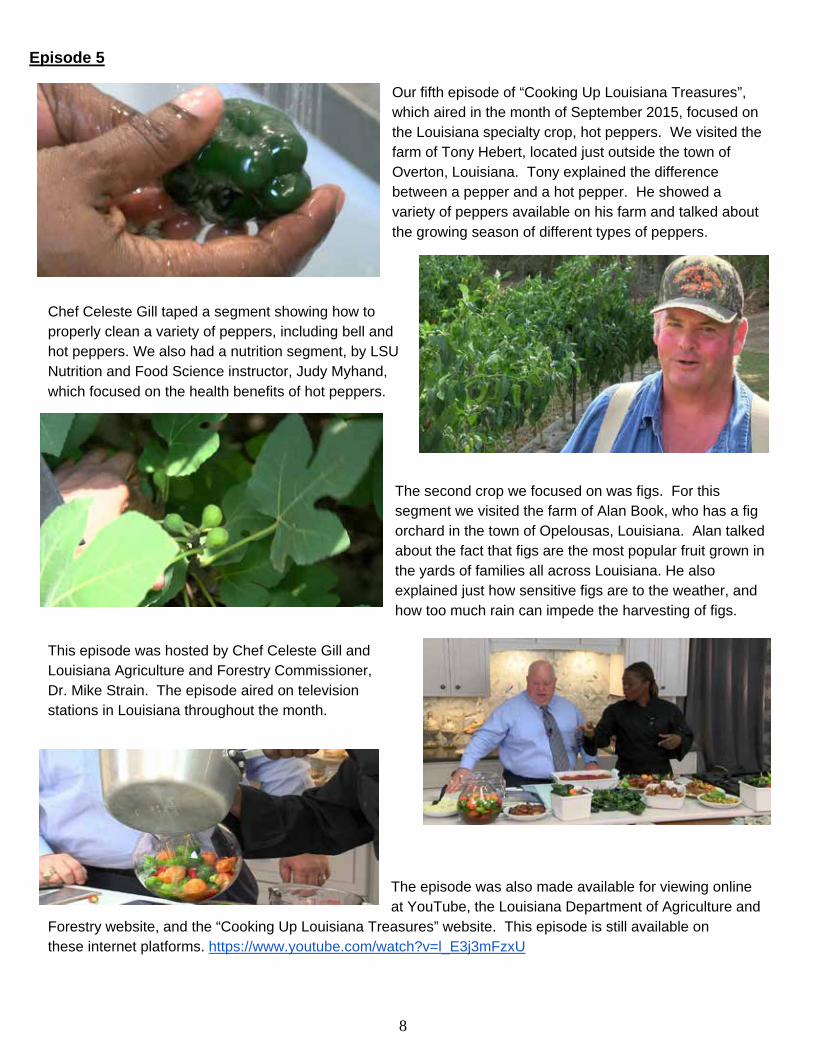
The second crop we covered was nectarines with a package that covered the history of the nectarine, its relationship to peaches, and the growing season, both in north Louisiana and south Louisiana . This segment was voiced-over by Dr. Mike Strain, Commissioner of Agriculture and Forestry in Louisiana.
This episode was hosted by Chef Celeste Gill and Louisiana Agriculture and Forestry Commissioner, Dr. Mike Strain. The episode aired on television stations in Louisiana throughout the month of June 2015.
For the nectarine package, we visited Yakaboski Farm between the towns of Farmerville, Louisiana and Ruston, Louisiana.
The episode was also made available for viewing online at YouTube, the Louisiana Department of Agriculture and Forestry website, and the Cooking Up Louisiana Treasures website. This episode is still available on these internet platforms. https://www.youtube.com/watch?v=X1WhEvC1qEQ
7
Episode 4
For the fourth episode of “Cooking Up Louisiana Treasures”, we focused on tomatoes. This episode aired in the month of August 2015. We traveled to New Roads, Louisiana, where we visited Glazer Family Farms. Charles Glaser showed us a large variety of tomatoes available at his farm. We also filmed at the Glaser Family Farmers Market, also located in the town of New Roads, Louisiana. Chef Celeste Gill showed how easy it is to clean tomatoes, making them safe to eat raw and fresh.
We selected watermelon as our second crop. We visited Plunkett Farms, in the town of Womack, Louisiana where we learned about the growing season of watermelon. This package was voiced-over by Chef Celeste Gill.
LSU Nutrition and Food Science instructor, Judy Myhand shared some details on the nutritional value of tomatoes. We also filmed a segment at the Baton Rouge Farmers’ Market, that included Miss USA, 2015
This episode was hosted by Chef Celeste Gill and Louisiana Agriculture and Forestry Commissioner, Dr. Mike Strain. The episode aired on television stations in Louisiana throughout the month of August 2015. The episode was also made available for viewing online at YouTube, the Louisiana Department of Agriculture and Forestry website, and the “Cooking Up Louisiana Treasures” website. This episode is still available on these internet platforms. https://www.youtube.com/watch?v=EFHv3zRynvU
8
Episode 5
Our fifth episode of “Cooking Up Louisiana Treasures”, which aired in the month of September 2015, focused on the Louisiana specialty crop, hot peppers. We visited the farm of Tony Hebert, located just outside the town of Overton, Louisiana. Tony explained the difference between a pepper and a hot pepper. He showed a variety of peppers available on his farm and talked about the growing season of different types of peppers.
Chef Celeste Gill taped a segment showing how to properly clean a variety of peppers, including bell and hot peppers. We also had a nutrition segment, by LSU Nutrition and Food Science instructor, Judy Myhand, which focused on the health benefits of hot peppers.
This episode was hosted by Chef Celeste Gill and Louisiana Agriculture and Forestry Commissioner, Dr. Mike Strain. The episode aired on television stations in Louisiana throughout the month.
The second crop we focused on was figs. For this segment we visited the farm of Alan Book, who has a fig orchard in the town of Opelousas, Louisiana. Alan talked about the fact that figs are the most popular fruit grown in the yards of families all across Louisiana. He also explained just how sensitive figs are to the weather, and how too much rain can impede the harvesting of figs.
The episode was also made available for viewing online at YouTube, the Louisiana Department of Agriculture and
Forestry website, and the “Cooking Up Louisiana Treasures” website. This episode is still available on these internet platforms. https://www.youtube.com/watch?v=l_E3j3mFzxU
9
Episode 6
For our sixth episode of 2015, we selected the Louisiana specialty crop of mustard greens. We visited the farms of the Glaser Family in Pointe Coupee Parish where we learned about the growing season of mustard greens and the proper way of watering these leafy vegetables. While in the area, we visited a local roadside stand where passers-by can stop and shop for fresh mustard greens, as well as many other great Louisiana vegetables and fruits.
Chef Celeste Gill showed how to safely and thoroughly clean mustard greens, removing the dirt and soil from all parts of the leaf. LSU Nutrition and Food Science instructor, Judy Myhand shared some details on the nutritional value of mustard greens.
The second crop was the seasonal crop of pumpkins, which gave us the opportunity to visit Papa Simpson’s Farm in Arcadia, Louisiana. Papa Simpson showed us how pumpkins start as a small flower. He also talked about the growing season and the varieties of pumpkin available to farmers.
This episode was hosted by Chef Celeste Gill and Louisiana Agriculture and Forestry Commissioner, Dr. Mike Strain. The episode aired on television stations in Louisiana throughout the month of October 2015. The episode was also made available for viewing online at YouTube, the Louisiana Department of Agriculture and Forestry website, and the “Cooking Up Louisiana Treasures” website. This episode is still available on these internet platforms. https://www.youtube.com/watch?v=JTfbPxPd2GE
10
Episode 7 Due to careful budgeting of expenses, we were able to have enough grant funding available to film a seventh episode of “Cooking Up Louisiana Treasures”.
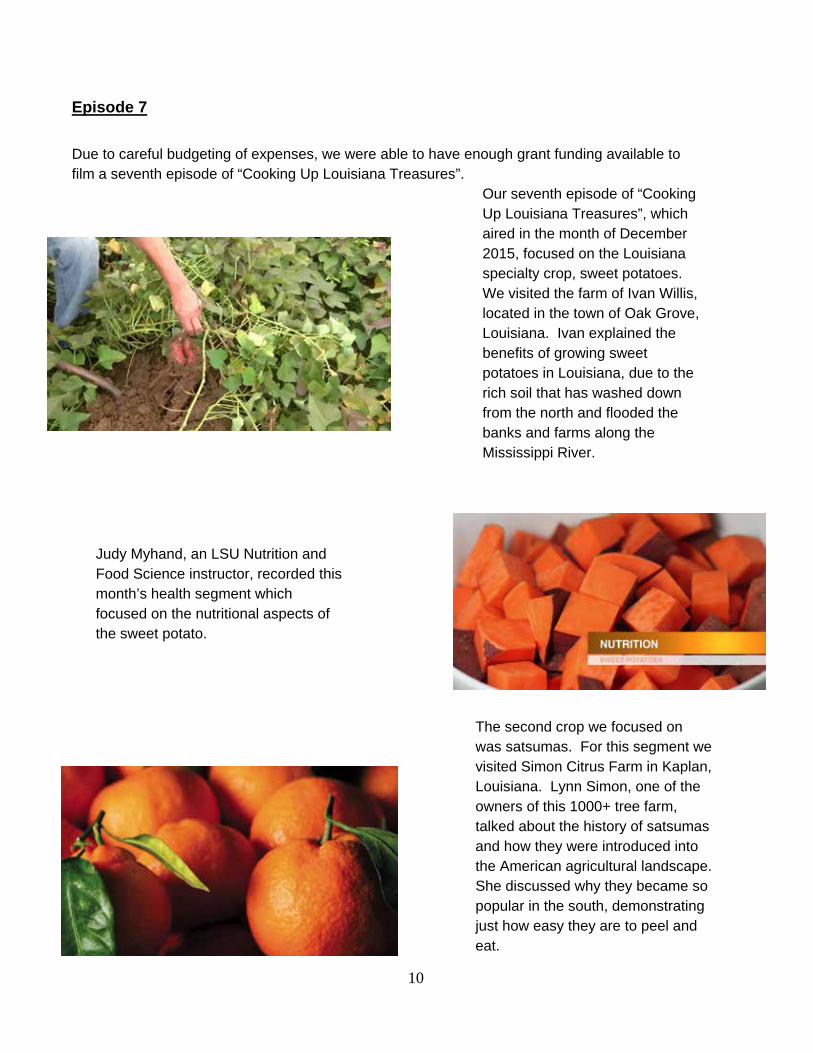
Our seventh episode of “Cooking Up Louisiana Treasures”, which aired in the month of December 2015, focused on the Louisiana specialty crop, sweet potatoes. We visited the farm of Ivan Willis, located in the town of Oak Grove, Louisiana. Ivan explained the benefits of growing sweet potatoes in Louisiana, due to the rich soil that has washed down from the north and flooded the banks and farms along the Mississippi River.
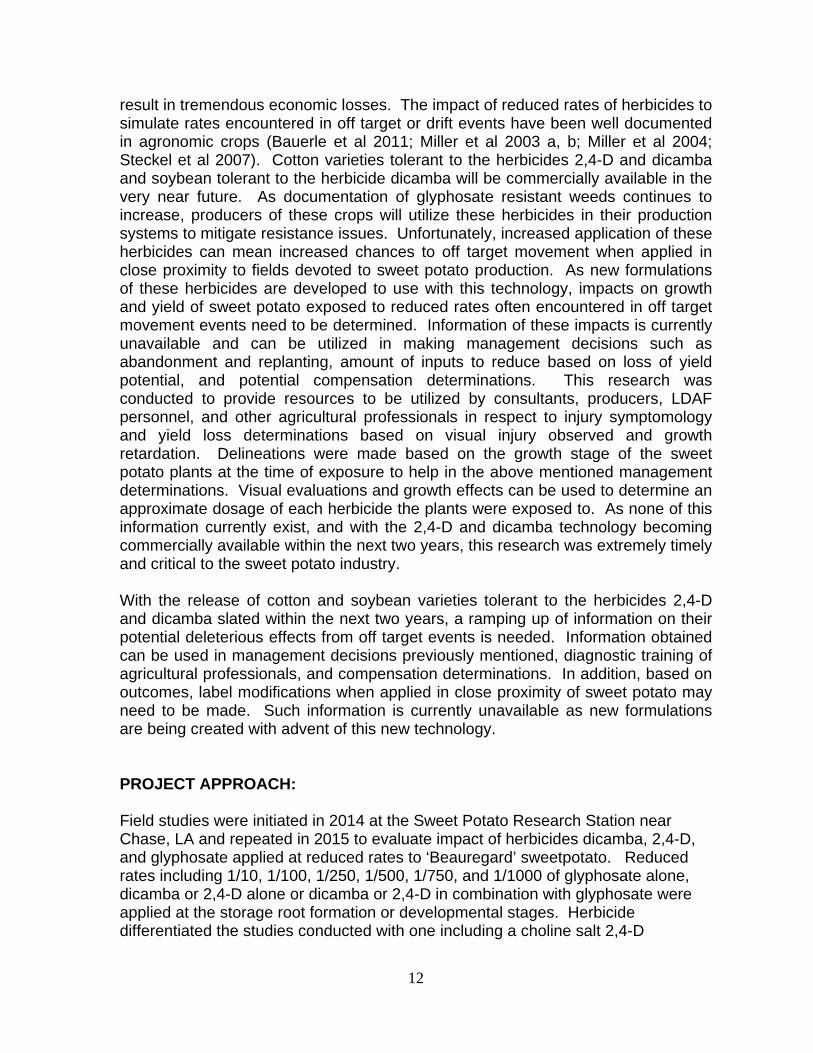
Judy Myhand, an LSU Nutrition and Food Science instructor, recorded this month’s health segment which focused on the nutritional aspects of the sweet potato.
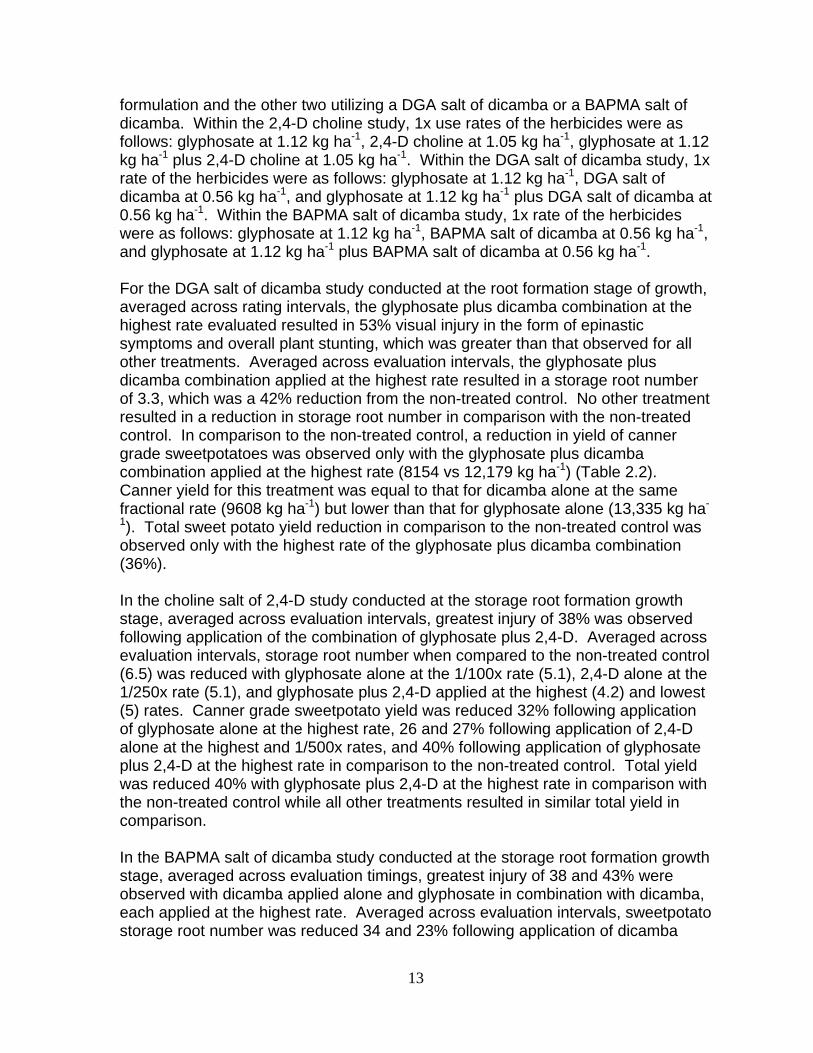
The second crop we focused on was satsumas. For this segment we visited Simon Citrus Farm in Kaplan, Louisiana. Lynn Simon, one of the owners of this 1000+ tree farm, talked about the history of satsumas and how they were introduced into the American agricultural landscape. She discussed why they became so popular in the south, demonstrating just how easy they are to peel and eat.

11
This episode was hosted by Chef Celeste Gill and Louisiana Agriculture and Forestry Commissioner, Dr. Mike Strain. The episode aired on television stations in Louisiana throughout the month of December 2015. The episode was also made available for viewing online at YouTube, the Louisiana Department of Agriculture and Forestry website, and the Cooking Up Louisiana Treasures website. This episode is still available on these Internet platforms. https://www.youtube.com/watch?v=QZam9QoSwgE
PROJECT TWO TITLE_ - SPECIALTY CROP DEMONSTRATION FARM AND EDUCATION CAMPAIGN SUBGRANTEE: LAFAYETTE CONSOLIDATED GOVERNMENT
(CANCELLED)
PROJECT THREE TITLE_ - DOCUMENTING THE IMPACT OF HORMONAL HERBICIDES ON SWEET POTATO GROWTH AND YIELD AS INFLUENCED BY REDUCED RATE AND GROWTH STAGE PROJECT SUMMARY : This project’s activities document the effects of reduced rates of hormonal herbicides 2,4-D and dicamba encountered in an off target event on the growth and yield of commonly grown sweet potato varieties in Louisiana. Given the cost per acre of producing sweet potato in Louisiana, maximum yield potential needs to be reached to realize profit margins necessary for producers to remain in business. Even when a producer optimizes use of all tools at his disposal to produce a successful crop (fertility rate, pest management, irrigation), events beyond his control such as environmental disasters or off target movement from sensitive herbicides to crops grown in close proximity can severely reduce yield and
12
result in tremendous economic losses. The impact of reduced rates of herbicides to simulate rates encountered in off target or drift events have been well documented in agronomic crops (Bauerle et al 2011; Miller et al 2003 a, b; Miller et al 2004; Steckel et al 2007). Cotton varieties tolerant to the herbicides 2,4-D and dicamba and soybean tolerant to the herbicide dicamba will be commercially available in the very near future. As documentation of glyphosate resistant weeds continues to increase, producers of these crops will utilize these herbicides in their production systems to mitigate resistance issues. Unfortunately, increased application of these herbicides can mean increased chances to off target movement when applied in close proximity to fields devoted to sweet potato production. As new formulations of these herbicides are developed to use with this technology, impacts on growth and yield of sweet potato exposed to reduced rates often encountered in off target movement events need to be determined. Information of these impacts is currently unavailable and can be utilized in making management decisions such as abandonment and replanting, amount of inputs to reduce based on loss of yield potential, and potential compensation determinations. This research was conducted to provide resources to be utilized by consultants, producers, LDAF personnel, and other agricultural professionals in respect to injury symptomology and yield loss determinations based on visual injury observed and growth retardation. Delineations were made based on the growth stage of the sweet potato plants at the time of exposure to help in the above mentioned management determinations. Visual evaluations and growth effects can be used to determine an approximate dosage of each herbicide the plants were exposed to. As none of this information currently exist, and with the 2,4-D and dicamba technology becoming commercially available within the next two years, this research was extremely timely and critical to the sweet potato industry. With the release of cotton and soybean varieties tolerant to the herbicides 2,4-D and dicamba slated within the next two years, a ramping up of information on their potential deleterious effects from off target events is needed. Information obtained can be used in management decisions previously mentioned, diagnostic training of agricultural professionals, and compensation determinations. In addition, based on outcomes, label modifications when applied in close proximity of sweet potato may need to be made. Such information is currently unavailable as new formulations are being created with advent of this new technology. PROJECT APPROACH: Field studies were initiated in 2014 at the Sweet Potato Research Station near Chase, LA and repeated in 2015 to evaluate impact of herbicides dicamba, 2,4-D, and glyphosate applied at reduced rates to ‘Beauregard’ sweetpotato. Reduced rates including 1/10, 1/100, 1/250, 1/500, 1/750, and 1/1000 of glyphosate alone, dicamba or 2,4-D alone or dicamba or 2,4-D in combination with glyphosate were applied at the storage root formation or developmental stages. Herbicide differentiated the studies conducted with one including a choline salt 2,4-D
13
formulation and the other two utilizing a DGA salt of dicamba or a BAPMA salt of dicamba. Within the 2,4-D choline study, 1x use rates of the herbicides were as follows: glyphosate at 1.12 kg ha-1, 2,4-D choline at 1.05 kg ha-1, glyphosate at 1.12 kg ha-1 plus 2,4-D choline at 1.05 kg ha-1. Within the DGA salt of dicamba study, 1x rate of the herbicides were as follows: glyphosate at 1.12 kg ha-1, DGA salt of dicamba at 0.56 kg ha-1, and glyphosate at 1.12 kg ha-1 plus DGA salt of dicamba at 0.56 kg ha-1. Within the BAPMA salt of dicamba study, 1x rate of the herbicides were as follows: glyphosate at 1.12 kg ha-1, BAPMA salt of dicamba at 0.56 kg ha-1, and glyphosate at 1.12 kg ha-1 plus BAPMA salt of dicamba at 0.56 kg ha-1. For the DGA salt of dicamba study conducted at the root formation stage of growth, averaged across rating intervals, the glyphosate plus dicamba combination at the highest rate evaluated resulted in 53% visual injury in the form of epinastic symptoms and overall plant stunting, which was greater than that observed for all other treatments. Averaged across evaluation intervals, the glyphosate plus dicamba combination applied at the highest rate resulted in a storage root number of 3.3, which was a 42% reduction from the non-treated control. No other treatment resulted in a reduction in storage root number in comparison with the non-treated control. In comparison to the non-treated control, a reduction in yield of canner grade sweetpotatoes was observed only with the glyphosate plus dicamba combination applied at the highest rate (8154 vs 12,179 kg ha-1) (Table 2.2). Canner yield for this treatment was equal to that for dicamba alone at the same fractional rate (9608 kg ha-1) but lower than that for glyphosate alone (13,335 kg ha-
1). Total sweet potato yield reduction in comparison to the non-treated control was observed only with the highest rate of the glyphosate plus dicamba combination (36%). In the choline salt of 2,4-D study conducted at the storage root formation growth stage, averaged across evaluation intervals, greatest injury of 38% was observed following application of the combination of glyphosate plus 2,4-D. Averaged across evaluation intervals, storage root number when compared to the non-treated control (6.5) was reduced with glyphosate alone at the 1/100x rate (5.1), 2,4-D alone at the 1/250x rate (5.1), and glyphosate plus 2,4-D applied at the highest (4.2) and lowest (5) rates. Canner grade sweetpotato yield was reduced 32% following application of glyphosate alone at the highest rate, 26 and 27% following application of 2,4-D alone at the highest and 1/500x rates, and 40% following application of glyphosate plus 2,4-D at the highest rate in comparison to the non-treated control. Total yield was reduced 40% with glyphosate plus 2,4-D at the highest rate in comparison with the non-treated control while all other treatments resulted in similar total yield in comparison. In the BAPMA salt of dicamba study conducted at the storage root formation growth stage, averaged across evaluation timings, greatest injury of 38 and 43% were observed with dicamba applied alone and glyphosate in combination with dicamba, each applied at the highest rate. Averaged across evaluation intervals, sweetpotato storage root number was reduced 34 and 23% following application of dicamba
14
alone at the two highest rates and 23% following application of the glyphosate plus dicamba combination at the lowest rate in comparison to the non-treated control. Total yield of sweet potato was reduced following application of glyphosate alone at the 1/750x rate (27,965 kg ha-1), dicamba applied alone at the 1/500x rate (28,683 kg ha-1), and the glyphosate plus dicamba combination at the 1/10 (22,888 kg ha-1) and 1/250 (27,299 kg ha-1) x rates when compared to the non-treated control (35,227 kg ha-1). In the DGA salt of dicamba study conducted at the storage root development growth stage, at 7 DAT, glyphosate plus dicamba at the highest rate resulted in 40% injury, which was greater than that observed with all other treatments. At 14 DAT, both dicamba alone or in combination with glyphosate applied at the highest rate resulted in similar and greatest injury of 39 and 43%, respectively. By 28 DAT, injury was greatest for dicamba applied alone (42%) or in combination with glyphosate (46%) at the highest rate. These same treatments at the 1/100x rate were also the only ones to result in greater than 10% visual injury (22 and 18%, respectively). When compared to the non-treated control, jumbo grade yield was reduced 82% following application of dicamba alone at the 1/10x rate and 98, 72, and 63% with glyphosate plus dicamba at 1/10, 1/100, and 1/250 x rates, respectively. US no. 1 sweetpotato yield was reduced 70 and 91% following application of dicamba alone and plus glyphosate at the highest rate, respectively, when compared to the non-treated control. Total yield was reduced 46 and 64% with dicamba applied alone and glyphosate plus dicamba applied at the highest rate, respectively, when compared to the non-treated control. In the Choline salt of 2,4-D study conducted at the storage root development growth stage, at 7 DAT, glyphosate plus 2,4-D applied at the highest rate resulted in 80% injury, which was greater than all other treatments. At 14 DAT, glyphosate plus 2,4-D at the highest rate resulted in 93% injury, which was greater than all other treatments. By 28 DAT, with the exception of 2,4-D applied alone (69%) and in combination with glyphosate (98%), injury for all treatments was no greater than 6%. Compared to the non-treated control, jumbo grade sweetpotato yield was reduced 90 and 94% with 2,4-D applied alone and in combination with glyphosate at the highest rate, respectively. When compared with the non-treated control, yield of U.S. no. 1 sweetpotatoes was reduced 67 and 54% following application of 2,4-D alone at the two highest rates, and 87 and 62% following application of 2,4-D in combination with glyphosate at the same rates. When compared to the non-treated control (8347 kg ha-1), canner grade yield was reduced only following application of the glyphosate plus 2,4-D combination at 1/10 x rate (2100 kg ha-1). Total yield was reduced 60 and 85% with 2,4-D applied alone and the glyphosate plus 2,4-D combination at the highest rate, respectively, when compared to the non-treated control. In the BAPMA salt of dicamba study conducted at the storage root development growth stage, at 7 DAT, injury was 37% with glyphosate plus dicamba applied at the highest rate, which was equal to the 33% observed with dicamba applied alone
15
at the high rate, and greater than all other treatments. At 14 DAT, dicamba applied alone (39%) or in combination with glyphosate at the highest rate (38%) resulted in similar injury that was greater than all other treatments. By 28 DAT, with the exception of dicamba applied alone at the 1/10 (42%) and 1/100 (14%) x rate or in combination with glyphosate at 1/10 (40%) and 1/100 (18%) x rates, all treatments resulted in no greater than 9% injury. Jumbo grade sweetpotato yield was reduced 78% by dicamba applied alone at 1/10x rate and 93 and 48% in combination with glyphosate at the 1/10 and 1/100x rate when compared to the non-treated control. U.S. no. 1 sweetpotato yield was reduced following application of glyphosate at the highest rate (31%), dicamba at the highest (68%) and 1/500 (37%) x rate, and the 1/10 (83%), 1/250 (34%), and 1/1000 (30%) x rate of glyphosate plus dicamba when compared to the non-treated control. When compared to the non-treated control (39,480 kg ha-1), total sweetpotato yield was reduced following application of glyphosate alone at the 1/100x rate (32,637 kg ha-1), dicamba alone at 1/10 (15,925 kg ha-1) and 1/750 (32,530 kg ha-1) x rates, and the combination herbicide applied at 1/10 (13,213 kg ha-1), 1/100 (31,008 kg ha-1), 1/250 (31,290 kg ha-1), and 1/500 (32,654 kg ha-1) x rates. In general, injury to sweetpotato at the storage root formation growth stage with each combination herbicide evaluated was greatest at the highest rate of 1/10 x of the anticipated labeled use rate, although injury observed at lower rates (especially toward the upper end range) would be cause for concern after initial observation by sweetpotato producers. In all studies conducted at the storage root formation growth stage, yield of U.S. no. 1 sweetpotato was not reduced following application of the herbicide combination or its individual components. This is of especial importance to producers of sweetpotatoes intended for fresh market use where production of U.S. no. 1 grade sweetpotatoes is most desirable. Likewise yield of jumbo grade sweetpotatoes was unaffected. The 1/10x rate of each combination herbicide did, however, reduce both canner grade and total sweetpotato yield. This is of concern to producers who intend to sell the crop for processing use, where total tonnage is most important. In the studies conducted at the storage root development growth stages, yield of U.S. no. 1 sweetpotato was reduced with the 1/10, the 1/10 and 1/100, and the 1/10, 1/250, and 1/1000 x rates of glyphosate in combination with either the DGA salt of dicamba, the choline salt of 2,4-D, or the BAPMA salt of dicamba, respectively. In addition, total yield was reduced following application of the highest rate of glyphosate plus either the DGA salt of dicamba or the choline salt of 2,4-D and at the two highest rates when applied in combination with the BAPMA salt of dicamba. This is of especial importance to producers of sweetpotatoes intended for fresh market and processor use, where production of U.S. no. 1 grade sweetpotatoes and total tonnage are both important, respectively. The data suggest that injury and subsequent total yield reduction concerns from the combination herbicides evaluated are valid with sublethal rates as low as 1/1000 x that may be encountered in sprayer contamination events and off-target spray applications during storage root development. Based on cumulative results,
16
producers with multi-crop farming operations are cautioned to thoroughly follow all sprayer cleanout procedures when previously spraying one of the combination herbicides evaluated or to devote different equipment to spraying Xtend® and Enlist® crops. In addition, proper consideration should be given to planting these crops in close proximity to sweetpotato production fields and make herbicide applications under environmental conditions that are not conducive to off-target spray movement. All project partners were heavily involved with their stated roles in the project proposal. Project Directors were heavily involved in the protocol establishment and evaluation after each year of the project. In addition, Project Directors were heavily involved in the analysis of the data collected and will be heavily involved in the dissemination of results to appropriate audiences in the sweet potato industry now that the project is complete and data is analyzed. Project leaders were also involved in varying degrees throughout the project in such activities as trial implementation and data collection. Other support staff listed on the project were heavily involved in the trail implementation and data collection phase of the project. GOALS AND OUTCOMES ACHIEVED: The measurable outcome established in the project protocol was to establish a set of diagnostics on the symptomology and growth and yield impacts of 2, 4-D and dicamba on sweet potato. This was acheived. The findings were recorded and were disseminated to industry stakeholders. The actual accomplishments were directly in line with those established. Field trails,data collection and analysis were completed and dissemination of the information was accomplished. 1). Protocol Establishment: During the first year of the project, project leaders developed a protocol for the project that included specific treatments to be evaluated and data to be collected at defined evaluation intervals. Development was based on what was needed to achieve the most practical information to meet the project objectives and provide the most pertinent information to be utilized by sweet potato producers and industry. 2). Trial implementation, data collection, and analysis: As mentioned previously, field trials were implemented over a two year period in order to establish outcomes that are in line with objectives set out in the original proposal. Both qualitative (crop response ratings) and quantitative data (growth, development, and yield assessment) were collected over various intervals within each trial year to assess effect of treatments. Data collected were entered into data management programs and appropriate statistical analysis was conducted to detect treatment differences within each year of the project. 3). Dissemination of information to the sweet potato industry: At various local producer meetings and Sweet Potato Association meetings, along with individual
17
contact with producers, the industry was made aware in the first year of the project that implementation was underway and results/recommendations would be forthcoming. As sound scientific research requires data that is repeatable and replicated, a final set of recommendations are currently being prepared following the completion of the project with two years of data. Data results and project progress were/are being relayed to various personnel of the industry through presentations at producer and Association meetings (W. Carroll Sweet Potato Producers Mtg. Feb 2015; Avoyelles/St. Landry Production Mtg. March 2015; Sweet Potato Association Mtg. Jan 2015 and 2016), Sweet Potato Research Station Field days (Sweet Potato Research Station Field Day Aug 2015), and professional meetings (Sweet Potato Collaborators Mtg. Jan 2015 and Southern Weed Science Society Mtg. Feb 2016) during the project duration and beyond. As the new technology is still awaiting necessary approvals, the data will continue to be disseminated beyond the contracted date as most meetings of relevance to share the results are not held until the Jan-March timeframe. As the final year of data collection and analysis occurred in late Fall/early winter 2015, the need for dissemination of the data will continue past the contracted date to essential stakeholders. 4). Project Evaluation: The proposed survey of producers to evaluate implementation of recommendations did not occur as planned in the fall of 2016 due to non-approval of the new technologies to date. The herbicide technologies evaluated in this project are still awaiting full approval by EPA and other state regulatory agencies for commercial use by producers in row crops. This was anticipated for the spring of 2016. As a result of this delay, full impact of this research cannot be gauged until the new technology is approved and in commercial use by producers. Due to regulatory non-approval of these technologies in time for commercial use by producers in the 2016 growing season which was beyond our control, the proposed survey could not be completed within the timeframe of the project. However, we are committed to evaluation of the impact of this project once full commercialization of these technologies occurs and the impact on sweet potato growers can be assessed. BENEFICIARIES: The primary beneficiaries of the project are the 70 sweet potato producers throughout the state that have been presented the research findings as result of this project’s activities. In addition to producers, consultants to the producers that are heavily involved with every aspect of their operation are beneficiaries. Secondary beneficiaries are County Agents and LDAF personnel who are usually the first responders in situations where off target movement of herbicides has occurred and impacts need to be assessed.
18
The data from this project that has the potential for greatest economic impact to the beneficiaries is identification of level of negative impacts of off target movement of herbicides evaluated. Producers will be able to use the data to determine the best corrective course of action (ie replant, reduce future inputs due to yield loss potential and reduced profit margin as a result etc.) should such scenarios occur. In addition, producers will also use the information to ensure as best possible that off target movement is limited in their production systems. LESSONS LEARNED: The primary lesson learned through completion of the project is that a great deal of pre-planning prior to implementation will ensure that all objectives and outcomes are realized in a timely manner. In order to maximize the amount of pertinent information obtained, a great deal of manpower and land were required in the studies therefore included the proper personnel was essential. For the most part, the outcomes and results that were achieved with respect to the research aspects were as expected. Yield impacts from the treatments evaluated were perhaps expected to be greater at the root initiation versus root development growth stage however that turned out not to be the case in all instances. CONTACT PERSON: Dr. Donnie Miller 318-766-4607 [email protected] PROJECT FOUR TITLE – LOUISIANA STRAWBERRY INDUSTRY CONSUMER AWARENESS PROGRAM PROJECT SUMMARY: The purpose of the project was to promote and increase public awareness of the high quality and nutritional value of Louisiana strawberries, thereby increasing strawberry sales by Louisiana producers. Through the project, we intended to enhance the marketability of Louisiana strawberries by educating consumers. Louisiana’s strawberry harvest has decreased over the last few years due to inclement weather conditions and acreage has gone down significantly from a decade ago.
19
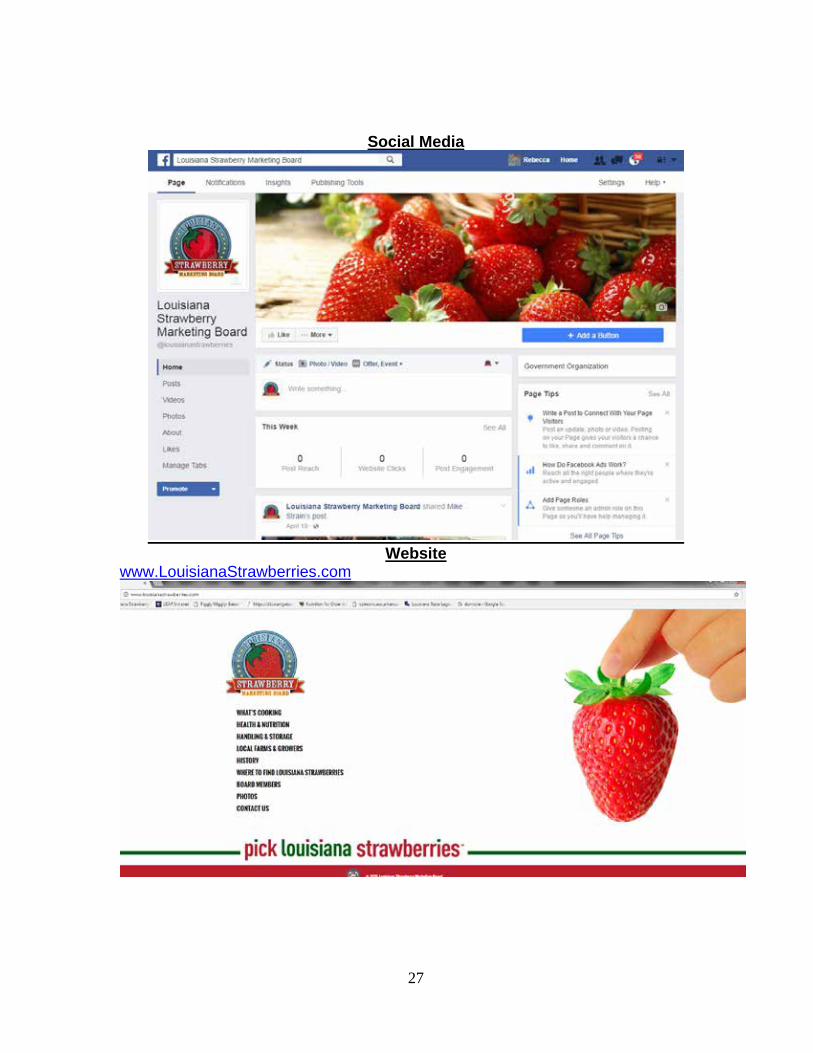
Louisiana producers needed the public to know that they had reinvested in their crops and were producing quality strawberries for harvest. This campaign focused on informing the consumer that strawberries were once again growing and available in Louisiana, thereby increasing awareness, demand and sales. The “Louisiana Strawberry Industry Consumer Awareness Program” was extremely important because it informed the consuming public of the availability of Louisiana strawberries after the crop suffered from a few seasons of harsh weather, focusing on the nutritional benefits and quality of berries from this state and resulting in increased sales. This project was needed to raise awareness of the industry and its harvest in time for peak strawberry season so demand and sales would be higher. This project was an educational marketing campaign consisting of print advertising, outdoor advertising, television advertising, internet marketing/social media and promotional/collateral material that built on previously funded activities funded by a prior year Specialty Crop Grant in 2009. While the previous funding was successful in raising awareness of the Louisiana strawberry industry and its harvest season, the additional funding further increased the public’s knowledge and increased sales. Through additional ads, more consumers were reached and additional sales were generated during peak harvest season. PROJECT APPROACH: The Strawberry Marketing Board Director solicited bids from advertising agencies by means of a Request for Proposals (RFP) process for consulting services to administer the Board’s advertising, promotion and public relations program. The Board’s director met with the ad agency to discuss the advertising campaign and making updates to the website. The ad agency set the website up for monitoring via Google Analytics. Updates were made to www.LouisianaStrawberries.com. Facebook and Twitter accounts for the Board were developed and went live. The print ads were designed and placed in Louisiana Cookin’ Magazine and newspapers in year one of the grant. The television commercial was filmed on a strawberry farm and in studio and began running on television (in addition to airtime the Board purchased with their funds) in year one. The billboards were designed and outdoor advertising placed in years one through three of the grant. Additional funding was received for year three of the grant and was used to purchase promotional and collateral material to support additional advertising and consumer awareness campaign efforts. Outdoor advertising proved to be very beneficial during this campaign, and billboards stayed up for months, often longer than the time period that the Board paid for if no one else had leased the space. The purchase of some of the collateral material (feather flags) was especially positive because it can be used several times over in years to come.

20
Overall, the Louisiana Strawberry Industry Consumer Awareness Program was a success and resulted in increased demand and sales for Louisiana strawberry producers. Board Director worked closely with the advertising agency to coordinate the services being provided and ensure the timely implementation of those services to benefit Louisiana producers the most during peak strawberry season. Louisiana strawberry growers provided feedback on advertising proofs and when the campaign should begin, and board members attended meetings in subsequent years to approve advertising plans and proofs. A grower allowed the television commercial to be filmed on his farm and provided strawberries for the studio filming. The Board Director created and updated the Board’s Facebook and Twitter accounts. LDAF Commissioner Mike Strain DVM promoted the Board’s Facebook page by sharing it with his Facebook friends and having the LDAF Facebook page share it. The Board Director coordinated the use of promotional and collateral material at events in year three of the grant. Board Director conducted surveys for measurables each year after the completion of the media ad campaign. The Board Director and advertising agency attended Strawberry Marketing Board meetings each year in which the ad agency discussed the results of the advertising campaign. GOALS AND OUTCOMES ACHIEVED: All of the activities in the work plan were completed and goals achieved: an advertising agency was chosen; advertising plans and proofs were approved each year; a television commercial was developed and aired in year one of the grant; print ads were developed and ran in magazines and newspapers in year one of the grant; billboards were developed and placed in years one through three of the grant; promotional and collateral material to support additional advertising and consumer awareness campaign efforts was purchased and used at events in year three of the grant; the website was updated; Facebook and Twitter accounts were created and updated; and data was gathered and assessed comparing the number of “hits” on the website. Surveys were conducted after the completion of the media ad campaign each year. The expected measurable outcome goal was the increased demand of strawberries and their increase of sales by 10% during the peak season ads compared to last season’s sales. This goal was achieved. Surveys for year one measurable were conducted after the completion of the media ad campaign. They were sent to a database of Louisiana strawberry producers requesting information on demand and sales. Of the surveys returned and questions answered, 80% of producers said that they experienced increased demand of strawberries as a result of this advertising campaign; producers said
21
they had increased sales averaging 10%; and 100% said they think the industry would benefit from future ads. Surveys for year two measurable were conducted after the completion of the media ad campaign. They were sent to a database of Louisiana strawberry producers requesting information on demand and sales. Of the surveys returned and questions answered, 50% of producers said that they experienced increased demand of strawberries as a result of this advertising campaign; producers said they had increased sales averaging 17.5%; and 100% said they think the industry would benefit from future ads. Surveys for year three measurable were conducted after the completion of the media ad campaign. They were sent to a database of Louisiana strawberry producers requesting information on demand and sales. Of the surveys returned and questions answered, 86% of producers said that they experienced increased demand of strawberries as a result of this advertising campaign; producers said they had increased sales averaging 15%; and 100% said they think the industry would benefit from future ads. The targets for this project were achieved. See pictures and links below for examples of advertising efforts.
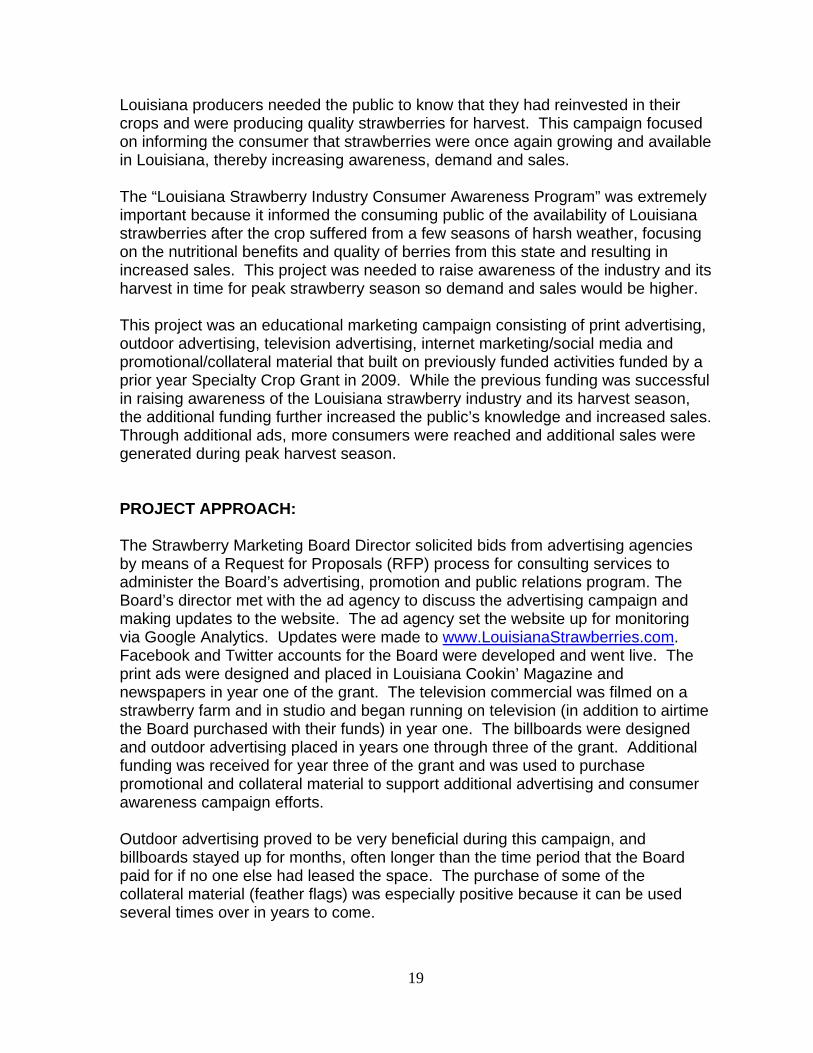
Outdoor Advertising
22
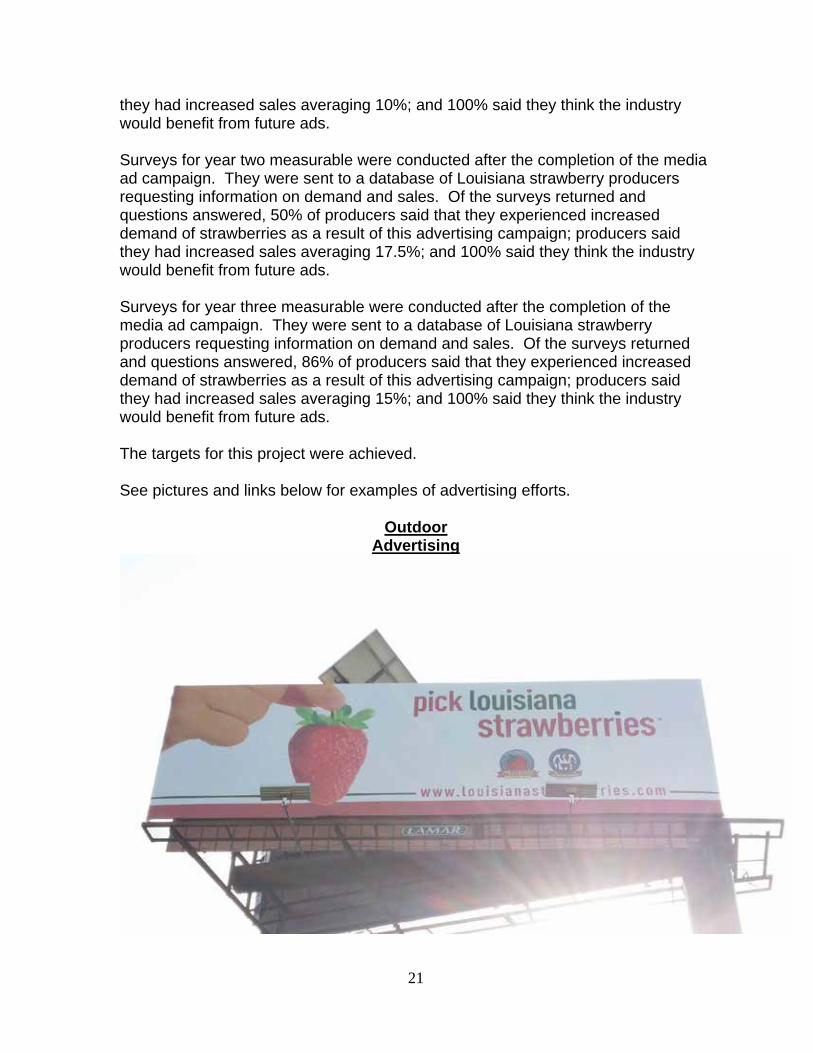
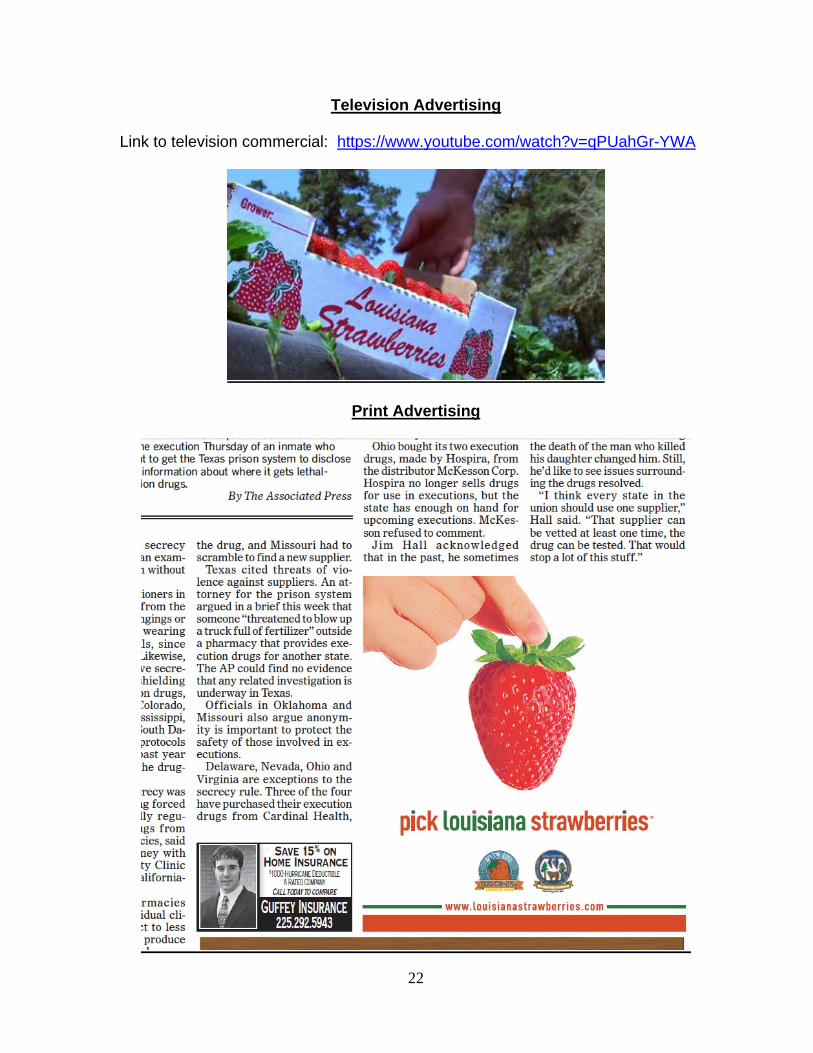
Television Advertising
Link to television commercial: https://www.youtube.com/watch?v=qPUahGr-YWA
Print Advertising
23
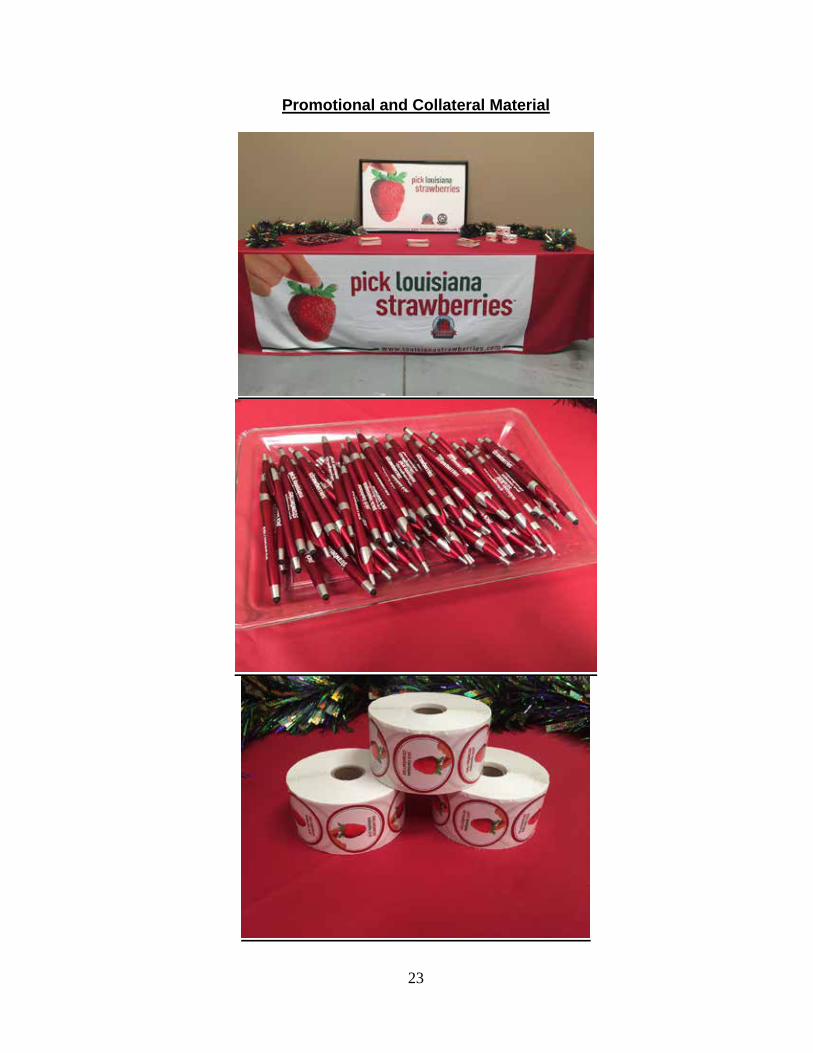
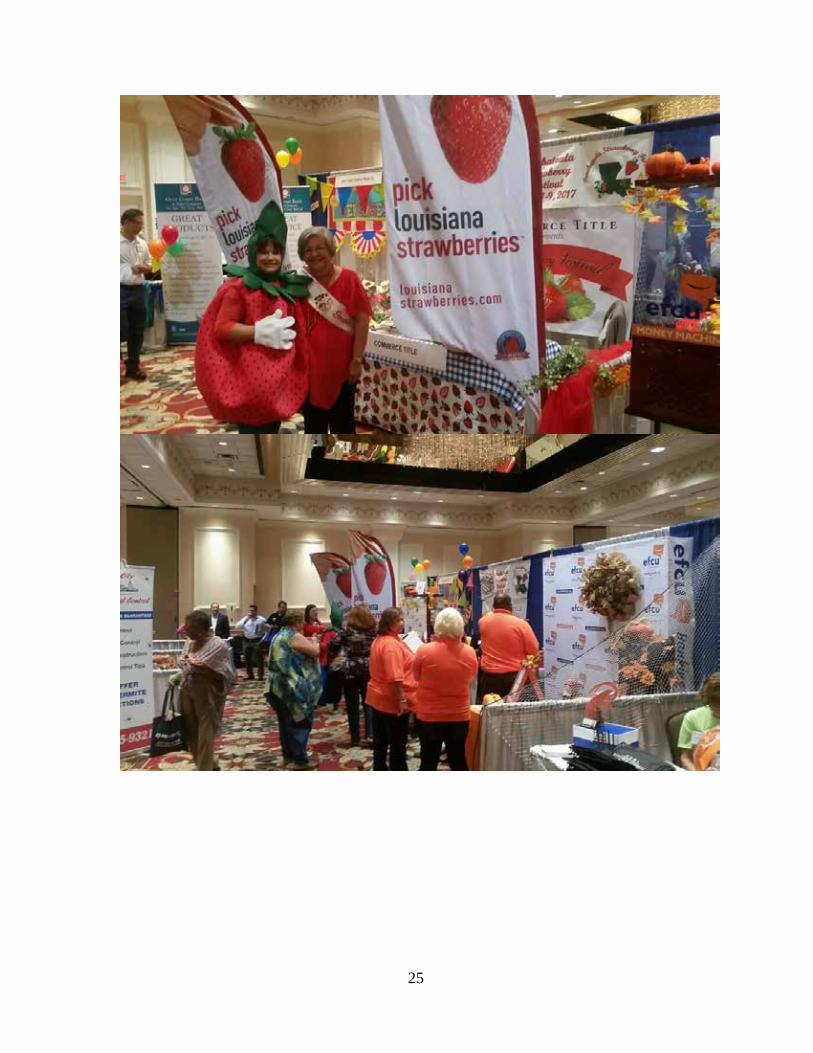
Promotional and Collateral Material
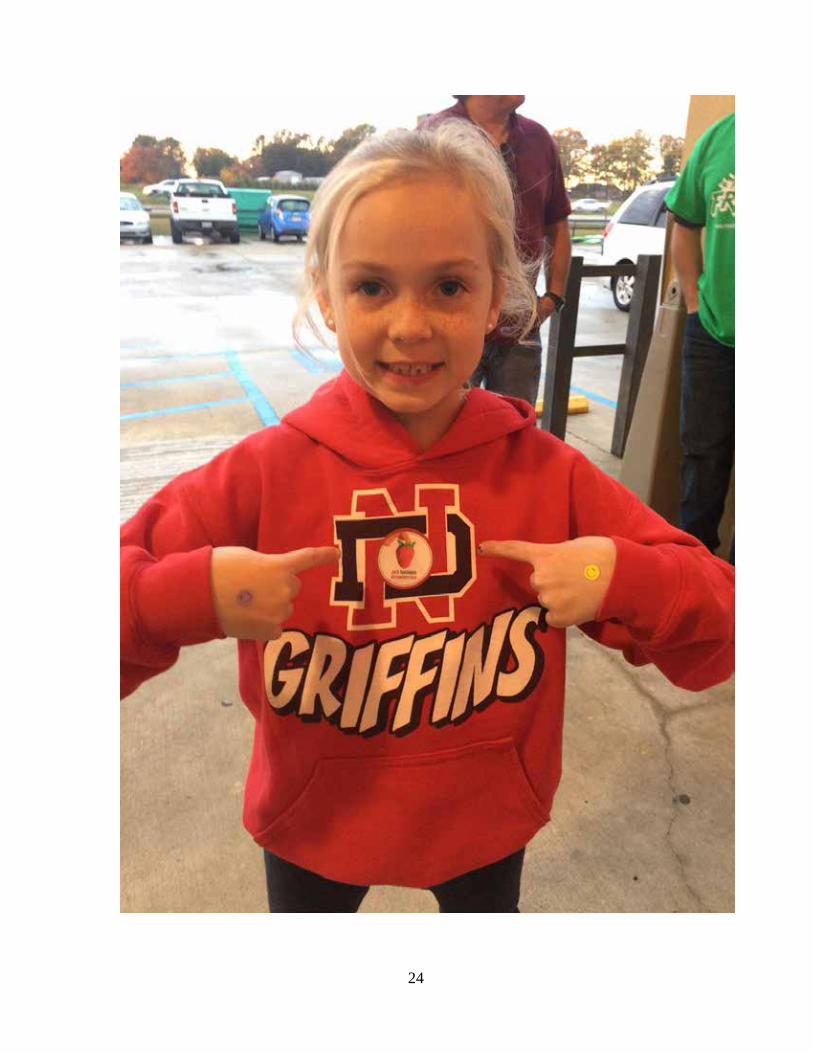
24
25

26
27
Social Media
Website
www.LouisianaStrawberries.com
28
BENEFICIARIES: Beneficiaries of this project’s activates were the 81 Louisiana strawberry producers as well as Louisiana’s consuming public. The campaign increased public awareness of the nutritional value of strawberries while enjoying the fresh, great taste, in addition to the healthful benefits. The enhanced awareness increased purchases and consumption of Louisiana strawberries. Heightened awareness of strawberries and their valuable qualities increased sales for Louisiana strawberries, benefitting the producers. Based on surveys sent to Louisiana strawberry producers over the course of three years, an average of 72% of producers said they experienced increased demand of strawberries as a result of this advertising campaign; producers said they had increased sales averaging 14%; and 100% said they think the industry would benefit from future ads. Strawberry growers were the main beneficiaries of this project due to increased sales. LESSONS LEARNED: Several lessons were learned as a result of completing this project, both positive and negative. One of these lessons is that outdoor advertising proved to be a very effective avenue of advertising for Louisiana strawberries. Billboards were able to stay up for months, many times longer than the period the Board paid for if no one else leased that space. Board members found them more beneficial than television or print advertising. Another lesson was that the purchase of collateral material (feather flags) was a good advertising choice because it can be used at numerous events for the next several years to promote the Louisiana strawberry industry. Another lesson learned is that inclement weather such as a freeze can delay the strawberry crop, and the advertising campaign must be pushed back as a result so it can be most effective during peak strawberry season. It is important to have some flexibility with the timing of the advertising and get feedback from growers as to when it should begin. The number of strawberry growers that experienced increased demand as a result of the advertising campaign was greater than anticipated. CONTACT PERSON Rebecca Riecke, Louisiana Strawberry Marketing Board Director (985) 345-9483 [email protected]
29
PROJECT FIVE TITLE_ - ZOYSIAGRASS SOD PRODUCTION FOR SHADED LAWNS IN LOUISIANA PROJECT SUMMARY: Many landscapes in Louisiana are subject to some shading due to trees, buildings, or other obstructions. Shaded turfgrass has reduced photosynthesis that results in poor plant growth, decreased sward coverage, and unacceptable aesthetics over time. Most of the turfgrass species grown in Louisiana for commercial and home landscapes include St. Augustinegrass [Stenotaphrum secundatum (Walter) Kuntze] and centipedegrass [Eremochloa ophiuroides (Munro) Hack.]. St. Augustinegrass is considered to have better shade tolerance compared to centipedegrass but is typically more susceptible to insects, drought, and cold temperatures. Centipedegrass is a low maintenance species that is characterized as having moderate shade tolerance with susceptibility to low temperature stress and droughty conditions. Zoysiagrass (Zoysia spp.) has the potential to be an alternative shade tolerant turfgrass species to St. Augustinegrass and centipedegrass. In addition, zoysiagrass is characterized with good drought and winter hardiness. Zoysiagrass is a slow growing turfgrass that forms a dense canopy that is subject to increased thatch deposition. In the past zoysiagrass production and use in Louisiana has lagged St. Augustinegrass and centipedegrass. Characterizing the shade tolerance of several zoysiagrass cultivars as well as examining factors that affect zoysiagrass establishment, Louisianans may be more willing to accept the use of zoysiagrass as a turfgrass species for commercial and home landscapes. PROJECT APPROACH: Study 1. Shade Tolerance The first study examined shade tolerance of several zoysiagrass cultivars at continuous shade levels of 0%, 30%, 50%, and 70% for the cultivars emerald, el toro, empire; palisades, and geo. Zoysiagrass cultivars selected for the study were based on information obtained from professionals in the turfgrass and landscape industries through interactions with Ron Strahan, LSU Agricultural Center Turfgrass Specialist,. Zenith, the only seeded zoysiagrass cultivar, was removed from testing because it was not grown commercially for sod production. In addition to the zoysiagrass cultivars selected, common cultivars of St. Augustinegrass and centipedegrass, the two most commonly grown turfgrass species in Louisiana landscapes, were used as standards for performance comparisons.
30
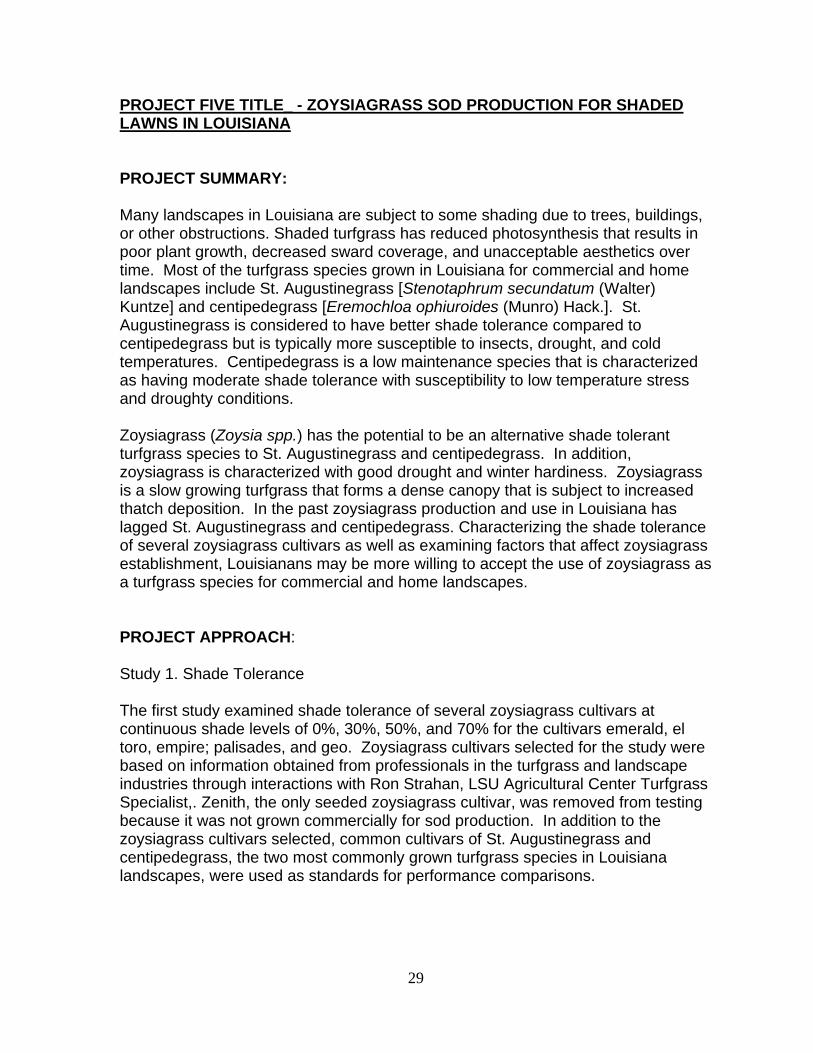
Sod was obtained from several sod producers throughout Louisiana for the species and cultivars listed above and established according to a plot plan as illustrated below in Baton Rouge and Hammond, Louisiana: Figure 1. Shade study layout for Baton Rouge, Louisiana
107 114 121 128
207 214 221 228
307 314 321 328 St Aug Empire Z Geo Z El Toro Z
Palisades Z St Aug Empire Z Emerald Z
El Toro Z El Toro Z El Toro Z El Toro Z
106 113 120 127
206 213 220 227
306 313 320 327 Geo Z Emerald Z Centipede Palisades Z
El Toro Z Empire Z El Toro Z Geo Z
Geo Z Geo Z Geo Z Geo Z
105 112 119 126
205 212 219 226
305 312 319 326 Centipede St Aug St Aug Empire Z
Emerald Z Palisades Z Centipede Centipede
Emerald Z Emerald Z Emerald Z Emerald Z
104 111 118 125
204 211 218 225
304 311 318 325 Empire Z Geo Z Emerald Z Geo Z
St Aug Geo Z Emerald Z Palisades Z
Palisades Z Palisades Z Palisades Z Palisades Z
103 110 117 124
203 210 217 224
303 310 317 324 Palisades Z El Toro Z El Toro Z Centipede
Empire Z Emerald Z Palisades Z St Aug
Empire Z Empire Z Empire Z Empire Z
102 109 116 123
202 209 216 223
302 309 316 323 Emerald Z Centipede Empire Z St Aug
Centipede El Toro Z St Aug El Toro Z
Centipede Centipede Centipede Centipede
101 108 115 122
201 208 215 222
301 308 315 322 El Toro Z Palisades Z Palisades Z Emerald Z
Geo Z Centipede Geo Z Empire Z
St Aug St Aug St Aug St Aug
0% 70% 30% 50%
50% 0% 70% 30%
0% 30% 50% 70%
Sod was established in split-plot design with shade level (0%, 30%, 50%, and 70%) as the main plots and species or cultivar as the subplots. Sod was allowed to establish for several months to provide a healthy mature stand before imposing shade cloth and initiating measurements.
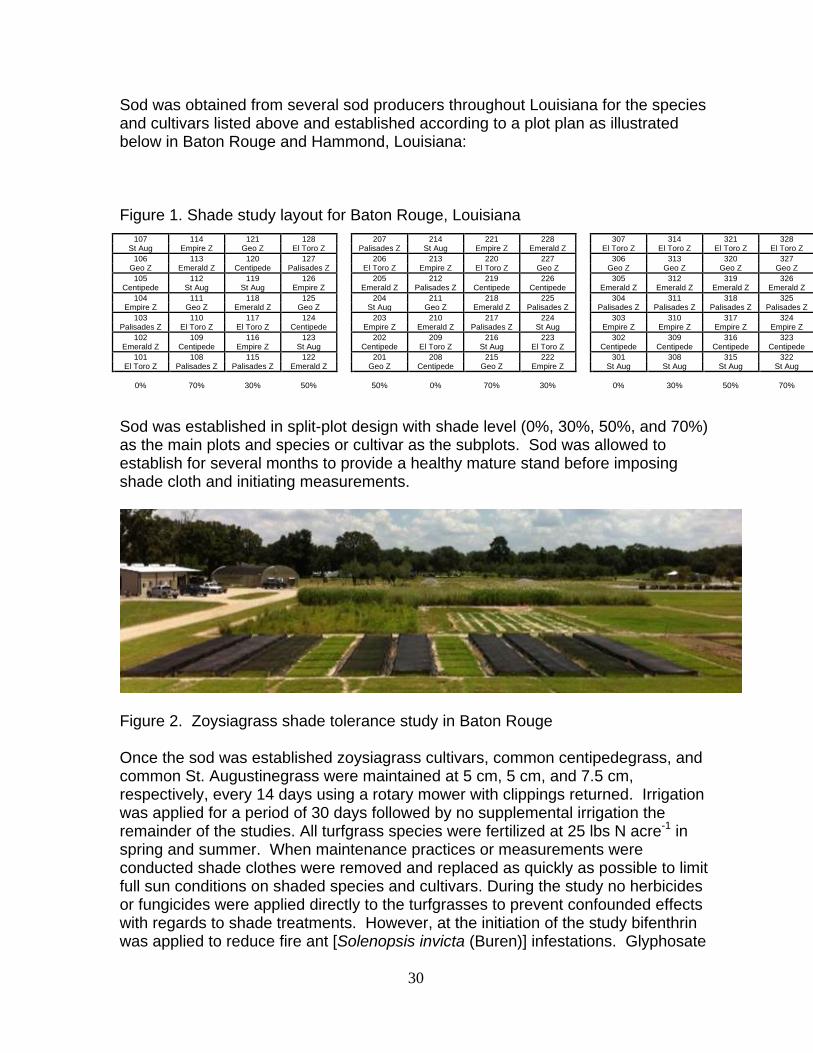
Figure 2. Zoysiagrass shade tolerance study in Baton Rouge Once the sod was established zoysiagrass cultivars, common centipedegrass, and common St. Augustinegrass were maintained at 5 cm, 5 cm, and 7.5 cm, respectively, every 14 days using a rotary mower with clippings returned. Irrigation was applied for a period of 30 days followed by no supplemental irrigation the remainder of the studies. All turfgrass species were fertilized at 25 lbs N acre-1 in spring and summer. When maintenance practices or measurements were conducted shade clothes were removed and replaced as quickly as possible to limit full sun conditions on shaded species and cultivars. During the study no herbicides or fungicides were applied directly to the turfgrasses to prevent confounded effects with regards to shade treatments. However, at the initiation of the study bifenthrin was applied to reduce fire ant [Solenopsis invicta (Buren)] infestations. Glyphosate
31
was also applied as a 5% solution (v/v) by backpack sprayer periodically between species and cultivars to maintain borders between experimental units. During the course of the study turfgrass quality, canopy groundcover, leaf width, canopy height and biomass were measured. Turfgrass quality was rated on a 1 to 9 scale (1 = dead turfgrass; 5 = minimal acceptable; and 9 = ideal quality). Canopy coverage was assessed visually on a scale of 0 to 100%. Leaf width was measured on a mature leaf blade at the widest point midway between the tip and base of the leaf blade. Canopy height was measured from the base of the soil to the uniform height of the turfgrass canopy. Shoot biomass was assessed by removing a shoot tissue at the shoot-soil interface within 11.4 cm2 and dried at 60 C for 72 hrs before being gravimetrically determined. At the first location in Baton Rouge, turfgrass quality, canopy coverage, leaf width, and canopy height were measured monthly during the growing season with no data recorded once turfgrasses entered dormant conditions. Shoot biomass and tiller density was collected in October, November, May, and July. At the second location in Hammond, Louisiana, turfgrass quality, canopy groundcover, tiller density, biomass and leaf width height were measured in June, July, and August. Results of the shade tolerance study: As shade increased from full sunlight to 30, 50, and 70%, all turfgrass species and zoysiagrass cultivars decreased in quality and ground coverage over time. As was expected all turfgrass species and zoysiagrass cultivars canopies visibly thinned with leaves becoming chlorotic. For example all zoysiagrass cultivars had initial ground coverages of >90% but decreased to 51.7, 43.3, 50, 41.7, and 56.7% for El Toro, Emerald, Empire, Geo, and Palisade, respectively, at 70% shade compared to 56.7 and 45% for centipedegrass and St. Augustinegrass by July (12 months after shade initiation). Similar declines were also noted in turfgrass quality with all species and zoysiagrass cultivars with initial quality >7, but declined to 3.2, 3.2, 4, 3.3, 4.5 for El Toro, Emerald, Empire, Geo, and Palisade, respectively, at 70% shade compared to 4.7 and 3.5 for centipedegrass and St. Augustinegrass in July. No turfgrass species or zoysiagrass cultivar displayed acceptable shade tolerance at 50 to 70%. These finding indicate irradiance (quantity) is not sufficient to sustain growth of the turfgrass species and cultivars tested. These results for all the turfgrass species and zoysiagrass cultivars tested are also supported by declines in leaf width, tiller density, and biomass as shade levels increased. It was also found that all turfgrass species and zoysiagrass cultivars had etiolating leaves (increase in turfgrass vertical growth) as shade increased to 50 and 70%. This condition is common for plants experiencing shaded conditions. Therefore, shade tolerance assessment of the turfgrass species and zoysiagrass cultivars should be conducted at the 30% shade level. Based on this criterion, all turfgrass species and zoysiagrass cultivars were able to sustain ground coverages between 76.7 and 81.7% and quality from 6.2 to 6.8 after 12 months of continuous

32
shade. All turfgrass species and zoysiagrass cultivars were able to sustain canopy density, leaf width, and biomass over the period of observation. Although, it was not statistically significant it is important to note that there appears to be a pattern of increased canopy height as shade level increases. This suggests that over time, beyond the observational period of this study, the turfgrasses were altering growth to maximize leaf area for greater irradiance capture and photosynthesis. Cultural practices such as increased mowing height may be advantageous when managing zoysiagrass under shade. Overall, the five zoysiagrass cultivars tested provided similar shade tolerance to the standard turfgrass species, centipedegrass and St. Augustinegrass, commonly grown in shaded Louisiana landscapes. Each of the cultivars tested would be a suitable alternative to centipedgrass and St. Augustinegrass. Therefore, differences in selection by consumers would most likely be the result of characteristics such as leaf width, density, and quality – parameters that can be easily distinguished by sod purchasers. For the zoysiagrass cultivars tested, Geo and Emerald had the narrowest leaves and densest canopies compared to El Toro, Empire, and Palisades. However, Geo, Emerald, and Palisades were able to maintain high turf quality during the study. Customers who prefer fine bladed leaf textures and dense swards will opt for Geo and Emerald zoysiagrass cultivars while customers that prefer coarser textured zoysiagrass will opt for El Toro, Empire, and Palisades zoysiagrasses. Final Recommendations:
1. The zoysiagrass cultivars El Toro, Emerald, Empire, Geo, and Palisades are suitable alternatives to centipedegrass and St. Augustinegrass at shade levels at or below 30%.
2. No turfgrass species or zoysiagrass cultivar tested provided acceptable performance at the 50 and 70% shade levels.
33
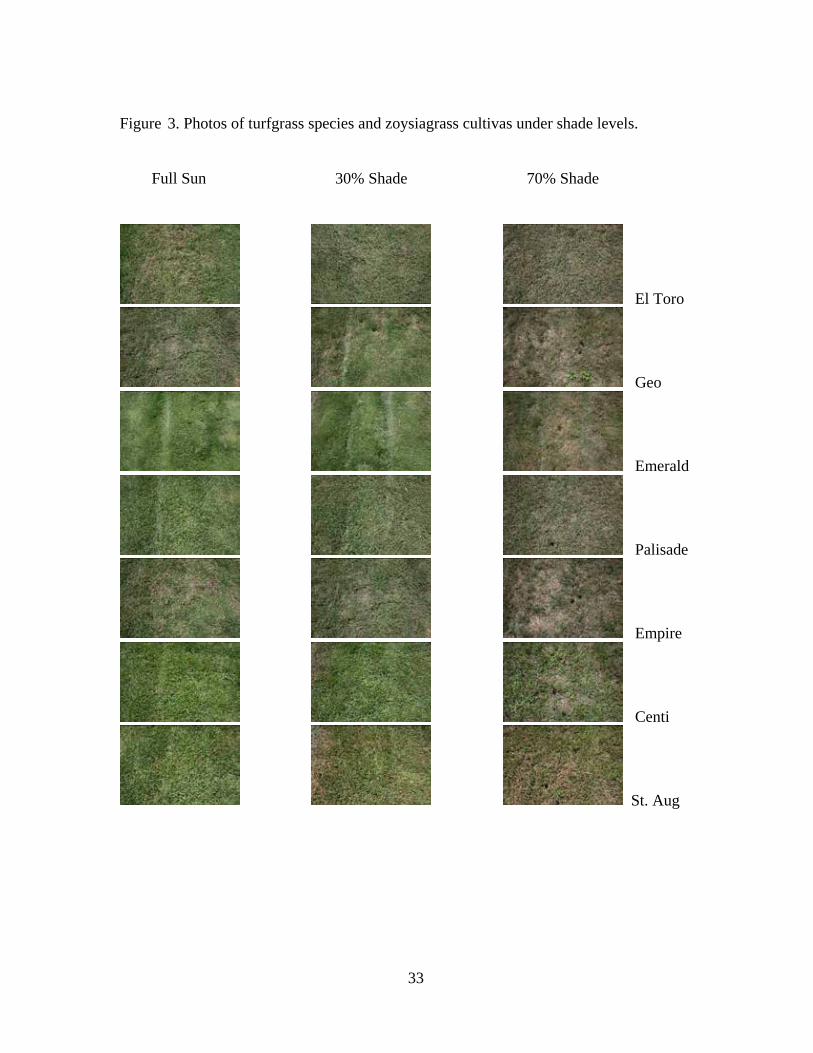
Figure 3. Photos of turfgrass species and zoysiagrass cultivas under shade levels. Full Sun 30% Shade 70% Shade
El Toro
Geo
Emerald
Palisade
Empire
Centi
St. Aug
34
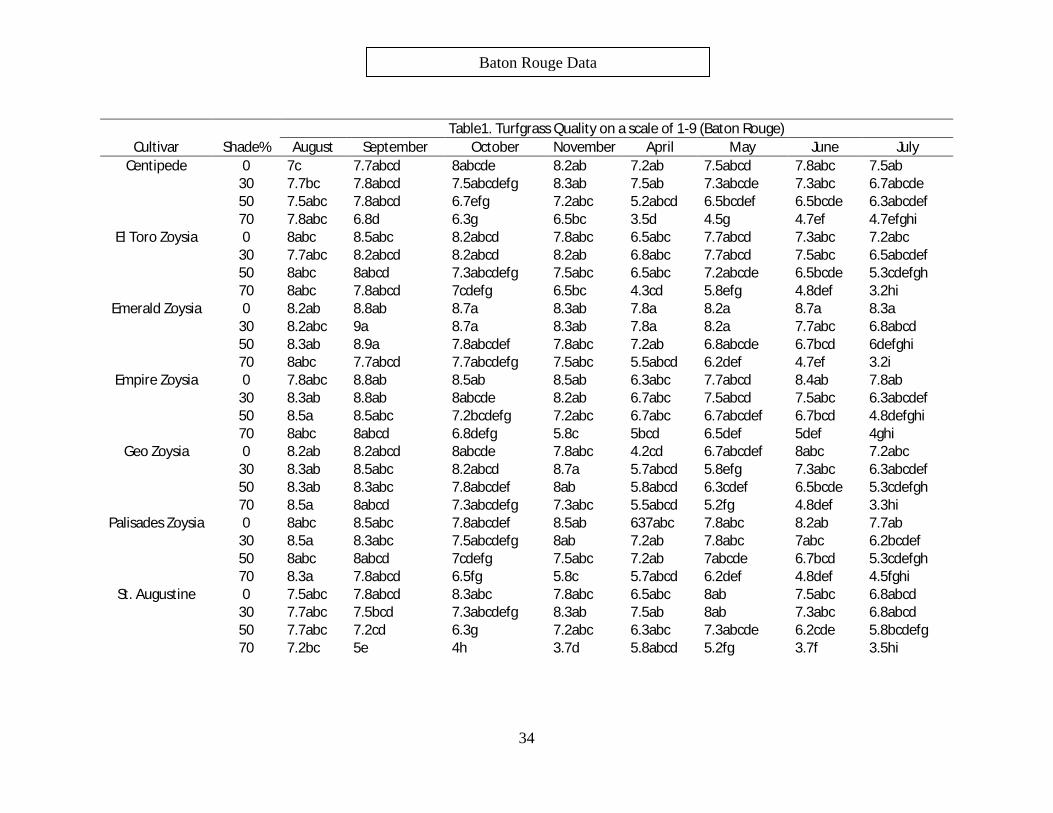
Table1. Turfgrass Quality on a scale of 1-9 (Baton Rouge) Cultivar Shade% August September October November April May June July
Centipede 0 7c 7.7abcd 8abcde 8.2ab 7.2ab 7.5abcd 7.8abc 7.5ab
30 7.7bc 7.8abcd 7.5abcdefg 8.3ab 7.5ab 7.3abcde 7.3abc 6.7abcde
50 7.5abc 7.8abcd 6.7efg 7.2abc 5.2abcd 6.5bcdef 6.5bcde 6.3abcdef
70 7.8abc 6.8d 6.3g 6.5bc 3.5d 4.5g 4.7ef 4.7efghi
El Toro Zoysia 0 8abc 8.5abc 8.2abcd 7.8abc 6.5abc 7.7abcd 7.3abc 7.2abc
30 7.7abc 8.2abcd 8.2abcd 8.2ab 6.8abc 7.7abcd 7.5abc 6.5abcdef
50 8abc 8abcd 7.3abcdefg 7.5abc 6.5abc 7.2abcde 6.5bcde 5.3cdefgh
70 8abc 7.8abcd 7cdefg 6.5bc 4.3cd 5.8efg 4.8def 3.2hi
Emerald Zoysia 0 8.2ab 8.8ab 8.7a 8.3ab 7.8a 8.2a 8.7a 8.3a
30 8.2abc 9a 8.7a 8.3ab 7.8a 8.2a 7.7abc 6.8abcd
50 8.3ab 8.9a 7.8abcdef 7.8abc 7.2ab 6.8abcde 6.7bcd 6defghi
70 8abc 7.7abcd 7.7abcdefg 7.5abc 5.5abcd 6.2def 4.7ef 3.2i
Empire Zoysia 0 7.8abc 8.8ab 8.5ab 8.5ab 6.3abc 7.7abcd 8.4ab 7.8ab
30 8.3ab 8.8ab 8abcde 8.2ab 6.7abc 7.5abcd 7.5abc 6.3abcdef
50 8.5a 8.5abc 7.2bcdefg 7.2abc 6.7abc 6.7abcdef 6.7bcd 4.8defghi
70 8abc 8abcd 6.8defg 5.8c 5bcd 6.5def 5def 4ghi
Geo Zoysia 0 8.2ab 8.2abcd 8abcde 7.8abc 4.2cd 6.7abcdef 8abc 7.2abc
30 8.3ab 8.5abc 8.2abcd 8.7a 5.7abcd 5.8efg 7.3abc 6.3abcdef
50 8.3ab 8.3abc 7.8abcdef 8ab 5.8abcd 6.3cdef 6.5bcde 5.3cdefgh
70 8.5a 8abcd 7.3abcdefg 7.3abc 5.5abcd 5.2fg 4.8def 3.3hi
Palisades Zoysia 0 8abc 8.5abc 7.8abcdef 8.5ab 637abc 7.8abc 8.2ab 7.7ab
30 8.5a 8.3abc 7.5abcdefg 8ab 7.2ab 7.8abc 7abc 6.2bcdef
50 8abc 8abcd 7cdefg 7.5abc 7.2ab 7abcde 6.7bcd 5.3cdefgh
70 8.3a 7.8abcd 6.5fg 5.8c 5.7abcd 6.2def 4.8def 4.5fghi
St. Augustine 0 7.5abc 7.8abcd 8.3abc 7.8abc 6.5abc 8ab 7.5abc 6.8abcd
30 7.7abc 7.5bcd 7.3abcdefg 8.3ab 7.5ab 8ab 7.3abc 6.8abcd
50 7.7abc 7.2cd 6.3g 7.2abc 6.3abc 7.3abcde 6.2cde 5.8bcdefg
70 7.2bc 5e 4h 3.7d 5.8abcd 5.2fg 3.7f 3.5hi
Baton Rouge Data
35
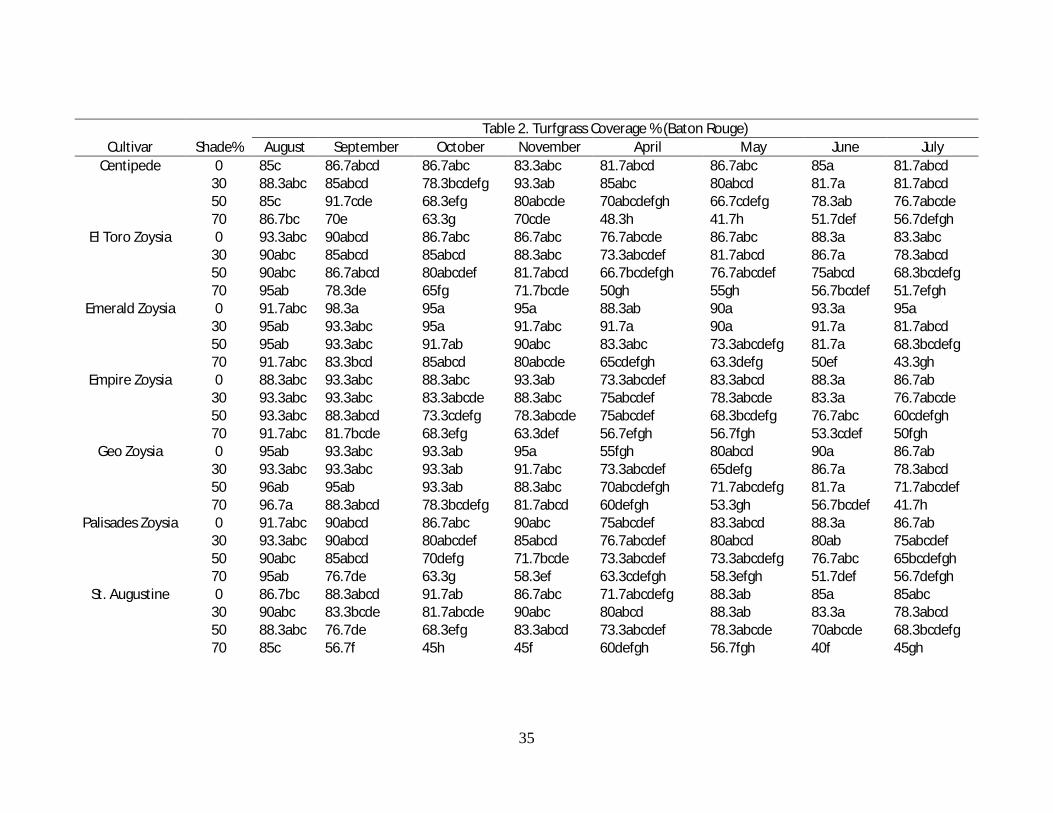
Table 2. Turfgrass Coverage % (Baton Rouge) Cultivar Shade% August September October November April May June July
Centipede 0 85c 86.7abcd 86.7abc 83.3abc 81.7abcd 86.7abc 85a 81.7abcd
30 88.3abc 85abcd 78.3bcdefg 93.3ab 85abc 80abcd 81.7a 81.7abcd
50 85c 91.7cde 68.3efg 80abcde 70abcdefgh 66.7cdefg 78.3ab 76.7abcde
70 86.7bc 70e 63.3g 70cde 48.3h 41.7h 51.7def 56.7defgh
El Toro Zoysia 0 93.3abc 90abcd 86.7abc 86.7abc 76.7abcde 86.7abc 88.3a 83.3abc
30 90abc 85abcd 85abcd 88.3abc 73.3abcdef 81.7abcd 86.7a 78.3abcd
50 90abc 86.7abcd 80abcdef 81.7abcd 66.7bcdefgh 76.7abcdef 75abcd 68.3bcdefg
70 95ab 78.3de 65fg 71.7bcde 50gh 55gh 56.7bcdef 51.7efgh
Emerald Zoysia 0 91.7abc 98.3a 95a 95a 88.3ab 90a 93.3a 95a
30 95ab 93.3abc 95a 91.7abc 91.7a 90a 91.7a 81.7abcd
50 95ab 93.3abc 91.7ab 90abc 83.3abc 73.3abcdefg 81.7a 68.3bcdefg
70 91.7abc 83.3bcd 85abcd 80abcde 65cdefgh 63.3defg 50ef 43.3gh
Empire Zoysia 0 88.3abc 93.3abc 88.3abc 93.3ab 73.3abcdef 83.3abcd 88.3a 86.7ab
30 93.3abc 93.3abc 83.3abcde 88.3abc 75abcdef 78.3abcde 83.3a 76.7abcde
50 93.3abc 88.3abcd 73.3cdefg 78.3abcde 75abcdef 68.3bcdefg 76.7abc 60cdefgh
70 91.7abc 81.7bcde 68.3efg 63.3def 56.7efgh 56.7fgh 53.3cdef 50fgh
Geo Zoysia 0 95ab 93.3abc 93.3ab 95a 55fgh 80abcd 90a 86.7ab
30 93.3abc 93.3abc 93.3ab 91.7abc 73.3abcdef 65defg 86.7a 78.3abcd
50 96ab 95ab 93.3ab 88.3abc 70abcdefgh 71.7abcdefg 81.7a 71.7abcdef
70 96.7a 88.3abcd 78.3bcdefg 81.7abcd 60defgh 53.3gh 56.7bcdef 41.7h
Palisades Zoysia 0 91.7abc 90abcd 86.7abc 90abc 75abcdef 83.3abcd 88.3a 86.7ab
30 93.3abc 90abcd 80abcdef 85abcd 76.7abcdef 80abcd 80ab 75abcdef
50 90abc 85abcd 70defg 71.7bcde 73.3abcdef 73.3abcdefg 76.7abc 65bcdefgh
70 95ab 76.7de 63.3g 58.3ef 63.3cdefgh 58.3efgh 51.7def 56.7defgh
St. Augustine 0 86.7bc 88.3abcd 91.7ab 86.7abc 71.7abcdefg 88.3ab 85a 85abc
30 90abc 83.3bcde 81.7abcde 90abc 80abcd 88.3ab 83.3a 78.3abcd
50 88.3abc 76.7de 68.3efg 83.3abcd 73.3abcdef 78.3abcde 70abcde 68.3bcdefg
70 85c 56.7f 45h 45f 60defgh 56.7fgh 40f 45gh
36
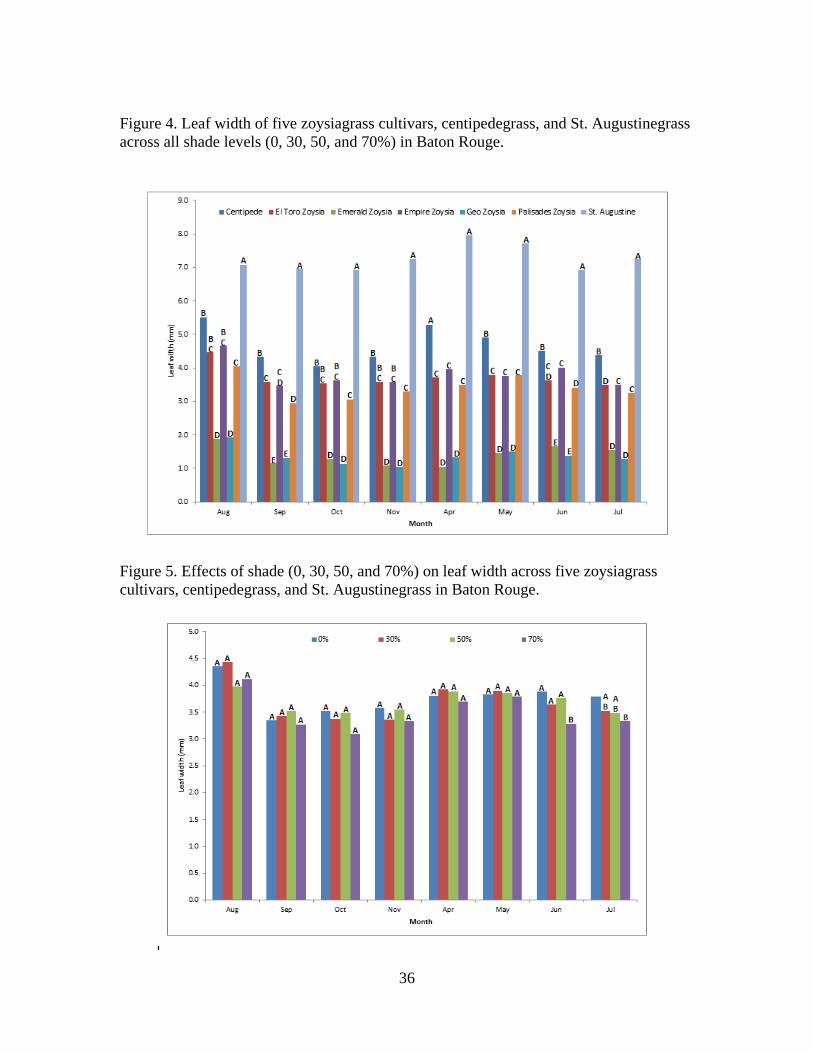
Figure 4. Leaf width of five zoysiagrass cultivars, centipedegrass, and St. Augustinegrass across all shade levels (0, 30, 50, and 70%) in Baton Rouge.
Figure 5. Effects of shade (0, 30, 50, and 70%) on leaf width across five zoysiagrass cultivars, centipedegrass, and St. Augustinegrass in Baton Rouge.

37
Table 3. Turfgrass Canopy Height (mm) (Baton Rouge) Cultivar Shade % August September October November April May June July
Centipede 0 45bcd 162.5cdefgh 125defghij 72.5efg 129.2ghijk 98.3hijkl 99.2def 105bcdef
30 60ab 204.2abc 158.3abcdef 112.5abcdefg 175defghij 154.2abcdefgh 110.8bcdef 126.7abcdef
50 48.3bcd 204.2abc 155abcdef 91.7cdefg 186.7bcdefgh 151.7bcdefgh 145.8abcd 146.7abc
70 47.7bcd 202.5abcd 151.7abcdef 116.7abcdef 169.2defghij 128.3cdefghijkl 117.5bcdef 133.3abcde
El Toro Zoysia 0 39cdef 112.5ghi 97.5hij 73.3defg 100.8k 80.8l 87.5f 89.2def
30 40cdef 167.5cdefgh 142.5abcdefghi 99.2abcdefg 131.7hijk 123.3defghijkl 116.7bcdef 114.2abcdef
50 33.3def 211.7abc 135bcdefghij 113.3abcdefg 188.3bcdefgh 147.5bcdefghij 123.3bcdef 107.5bcdef
70 48bcd 192.5abcdef 165abcde 113.3abcdefg 202.5bcdef 150bcdefghi 114.2bcdef 100.8cdef
Emerald Zoysia 0 43.3bcdef 86.7i 88.3j 75.8defg 110.8jk 87.5kl 90.8f 97.5cdef
30 45bcde 110.8hi 110.8fghij 81.7cdefg 134.2ghijk 115.8efghijkl 121.7abcdef 120.8abcdef
50 58.3abc 122.5fghi 102.5ghij 70fg 140.8fghijk 121.7defghijkl 120bcdef 109.2bcdef
70 46.7bcd 131.7efghi 119.2efghij 74.2defg 163.3defghijk 120.8defghijkl 101.7def 102.5cdef
Empire Zoysia 0 48.3bcd 130efghi 116.7efghij 88.3bcdefg 126.7hijk 95ijkl 88.3f 95.8cdef
30 55abc 160cdefgh 127.5cdefghij 97.5bcdefg 141.7fghijk 1119.2defghijkl 117.7bcdef 101.7bcdef
50 45bcde 183.3bcdefg 150.8abcdefg 120abcde 188.3bcdefgh 140.8bcdefghijk 133.3abcdef 104.2bcdef
70 54abc 195abcde 143.3abcdefgh 128.3abc 210.8abcde 161.7abcdef 125abcdef 12abcdef
Geo Zoysia 0 25f 85.5i 94.2ij 64.7g 101.7k 93.3jkl 88.3f 87.5ef
30 26.7ef 108.3hi 128.3bcdefghij 90bcdefg 148.3efghijk 111.7fghijkl 105.8cdef 89.2ef
50 26.7ef 130.8defghi 93.3j 85cdefg 151.7efghijk 120defghijkl 103.3def 99.2bcdef
70 25.7ef 122.5ghi 100hij 81.7defg 179.2cdefgh 119.2efghijkl 94.2f 85f
Palisades Zoysia 0 46.7bcd 159.2cdefgh 114.2fghij 98.3bcdefg 125.8hijk 103.3ghijkl 96.7def 118.3abcdef
30 53.3abc 200abcde 155.8abcdef 124.2abcd 189.2bcdefgh 157.5abcdefg 131.7abcdef 113.3bcdef
50 45bcde 224.2abc 176.7ab 138.3ab 240.8abc 183.3abc 151.7abc 140abcdef
70 50.7abcd 195.8abcde 170abcd 150a 243.3ab 172.5abcd 140.8abcde 142.5abcde
St. Augustine 0 60ab 157.5cdefgh 111.7fghij 82.5cdefg 119.2ijk 104.2ghijkl 95ef 95.8cdef
30 68.3a 241.7ab 170abcd 100.8abcdefg 191.7bcdefg 190.8ab 135.8abcdef 143.3abcd
50 58.3abc 254.2a 174.2abc 121.7abcde 220abcd 170.8abcde 170.8a 169.2a
70 52.7abcd 209.2abc 185.8a 108.3abcdefg 264.2a 209.2a 157.5ab 154.2ab
38
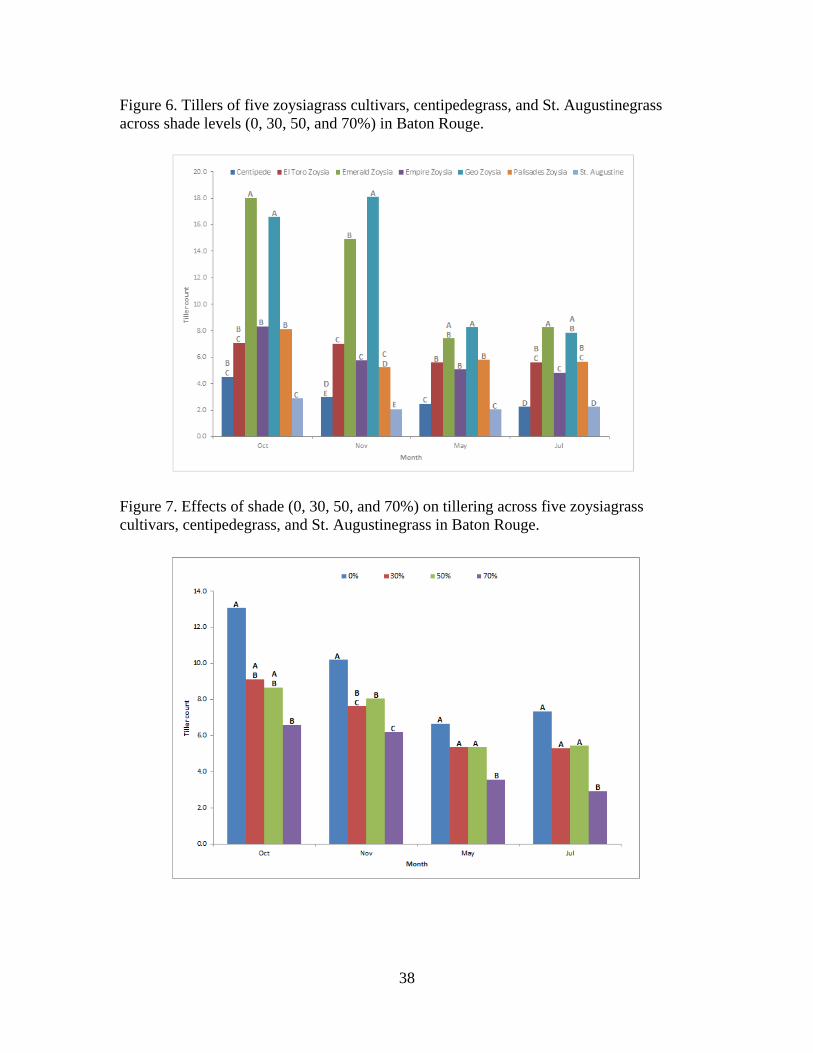
Figure 6. Tillers of five zoysiagrass cultivars, centipedegrass, and St. Augustinegrass across shade levels (0, 30, 50, and 70%) in Baton Rouge.
Figure 7. Effects of shade (0, 30, 50, and 70%) on tillering across five zoysiagrass cultivars, centipedegrass, and St. Augustinegrass in Baton Rouge.
39
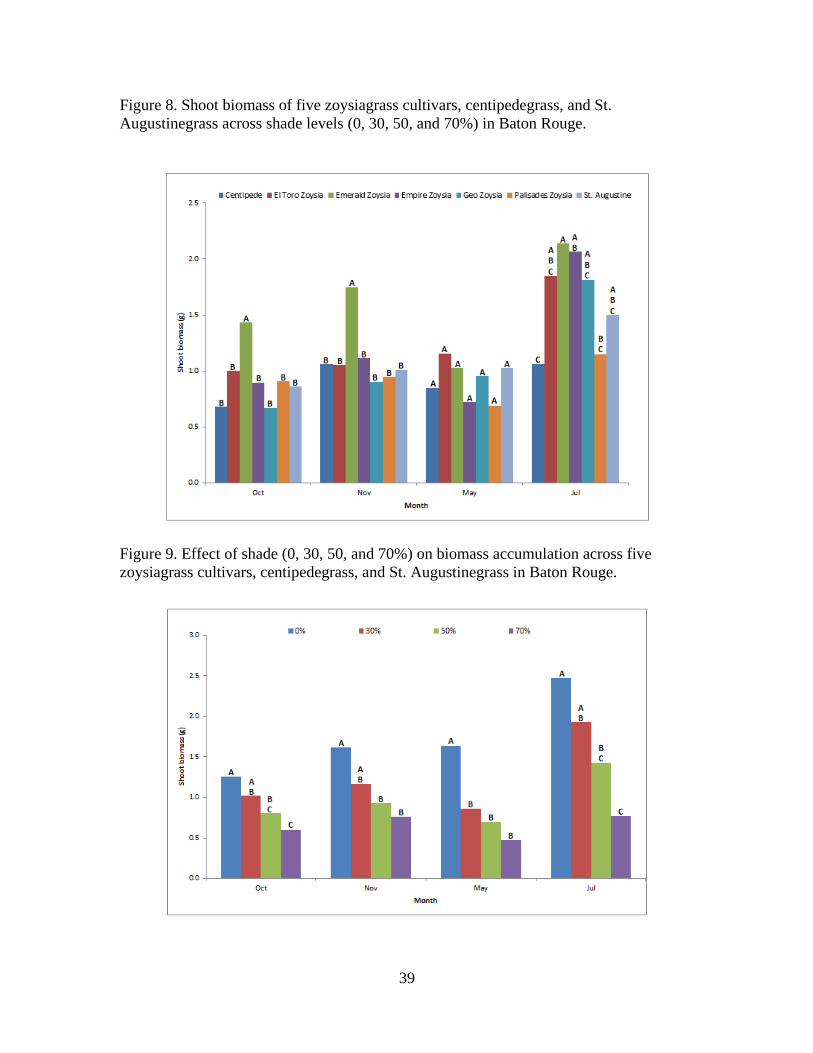
Figure 8. Shoot biomass of five zoysiagrass cultivars, centipedegrass, and St. Augustinegrass across shade levels (0, 30, 50, and 70%) in Baton Rouge.
Figure 9. Effect of shade (0, 30, 50, and 70%) on biomass accumulation across five zoysiagrass cultivars, centipedegrass, and St. Augustinegrass in Baton Rouge.
40
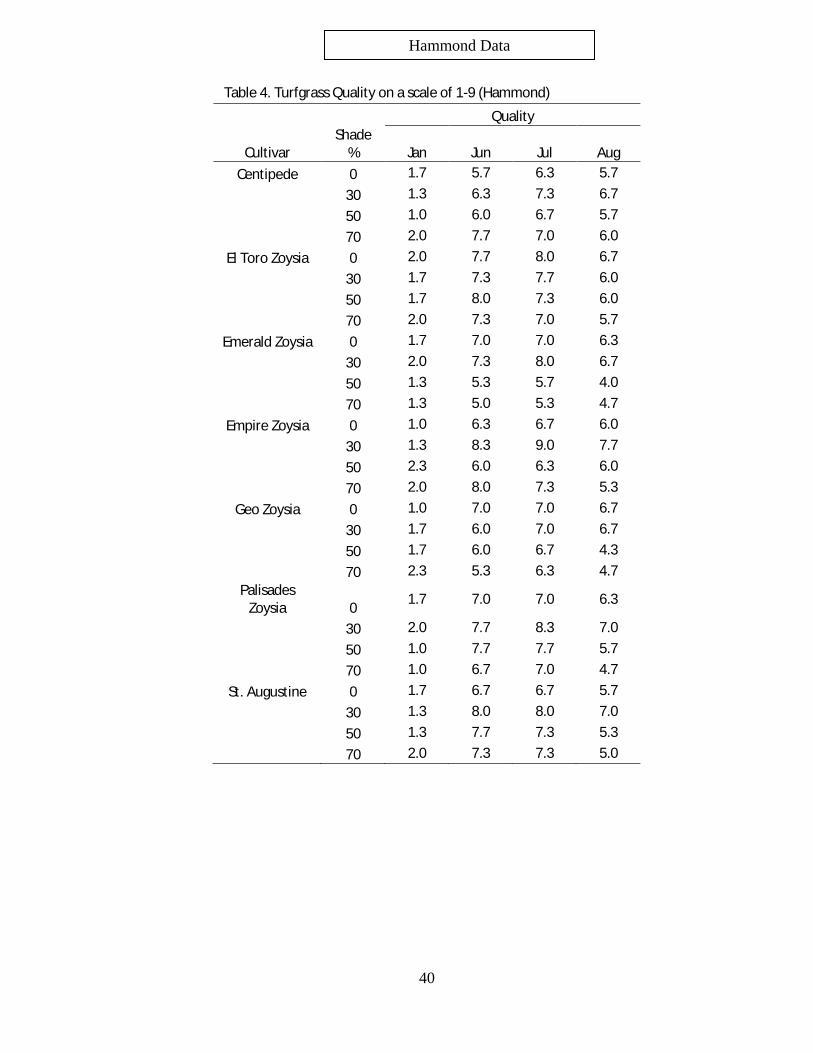
Table 4. Turfgrass Quality on a scale of 1-9 (Hammond)
Quality
Cultivar Shade
% Jan Jun Jul Aug Centipede 0 1.7 5.7 6.3 5.7
30 1.3 6.3 7.3 6.7
50 1.0 6.0 6.7 5.7
70 2.0 7.7 7.0 6.0
El Toro Zoysia 0 2.0 7.7 8.0 6.7
30 1.7 7.3 7.7 6.0
50 1.7 8.0 7.3 6.0
70 2.0 7.3 7.0 5.7
Emerald Zoysia 0 1.7 7.0 7.0 6.3
30 2.0 7.3 8.0 6.7
50 1.3 5.3 5.7 4.0
70 1.3 5.0 5.3 4.7
Empire Zoysia 0 1.0 6.3 6.7 6.0
30 1.3 8.3 9.0 7.7
50 2.3 6.0 6.3 6.0
70 2.0 8.0 7.3 5.3
Geo Zoysia 0 1.0 7.0 7.0 6.7
30 1.7 6.0 7.0 6.7
50 1.7 6.0 6.7 4.3
70 2.3 5.3 6.3 4.7
Palisades Zoysia 0 1.7 7.0 7.0 6.3
30 2.0 7.7 8.3 7.0
50 1.0 7.7 7.7 5.7
70 1.0 6.7 7.0 4.7
St. Augustine 0 1.7 6.7 6.7 5.7
30 1.3 8.0 8.0 7.0
50 1.3 7.7 7.3 5.3
70 2.0 7.3 7.3 5.0
Hammond Data
41
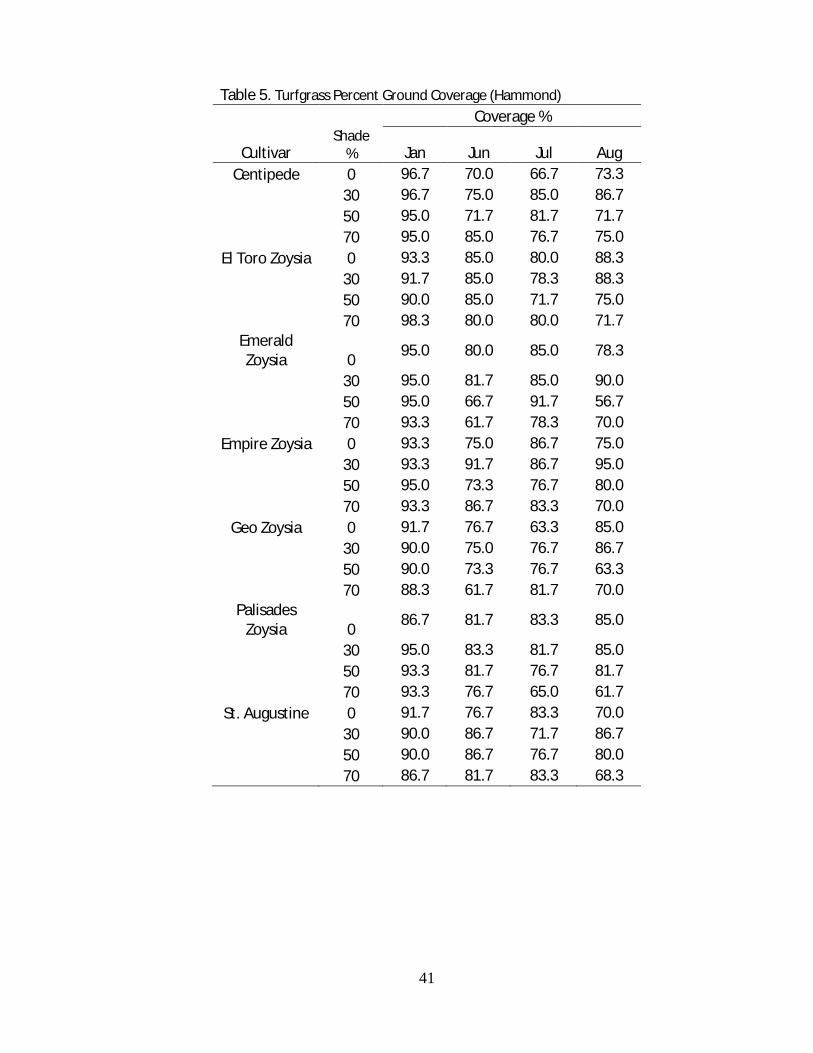
Table 5. Turfgrass Percent Ground Coverage (Hammond) Coverage %
Cultivar Shade
% Jan Jun Jul Aug Centipede 0 96.7 70.0 66.7 73.3
30 96.7 75.0 85.0 86.7
50 95.0 71.7 81.7 71.7
70 95.0 85.0 76.7 75.0
El Toro Zoysia 0 93.3 85.0 80.0 88.3
30 91.7 85.0 78.3 88.3
50 90.0 85.0 71.7 75.0
70 98.3 80.0 80.0 71.7
Emerald Zoysia 0 95.0 80.0 85.0 78.3
30 95.0 81.7 85.0 90.0
50 95.0 66.7 91.7 56.7
70 93.3 61.7 78.3 70.0
Empire Zoysia 0 93.3 75.0 86.7 75.0
30 93.3 91.7 86.7 95.0
50 95.0 73.3 76.7 80.0
70 93.3 86.7 83.3 70.0
Geo Zoysia 0 91.7 76.7 63.3 85.0
30 90.0 75.0 76.7 86.7
50 90.0 73.3 76.7 63.3
70 88.3 61.7 81.7 70.0
Palisades Zoysia 0 86.7 81.7 83.3 85.0
30 95.0 83.3 81.7 85.0
50 93.3 81.7 76.7 81.7
70 93.3 76.7 65.0 61.7
St. Augustine 0 91.7 76.7 83.3 70.0
30 90.0 86.7 71.7 86.7
50 90.0 86.7 76.7 80.0
70 86.7 81.7 83.3 68.3
42
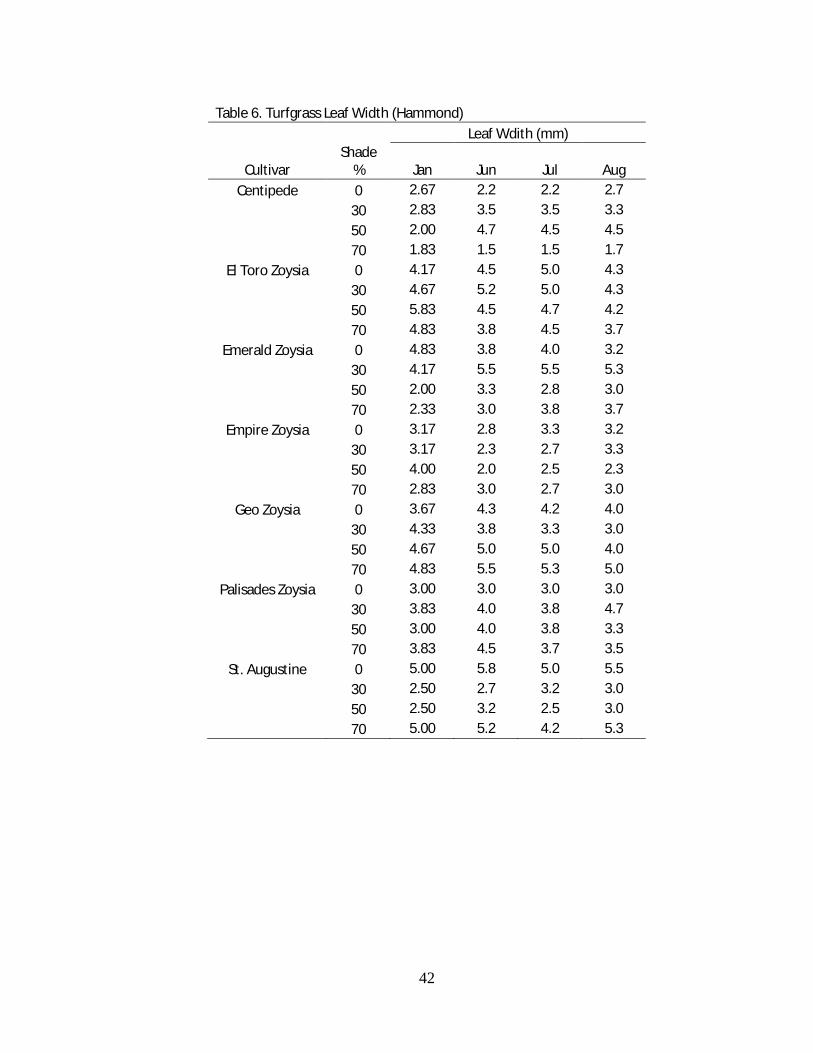
Table 6. Turfgrass Leaf Width (Hammond)
Leaf Wdith (mm)
Cultivar Shade
% Jan Jun Jul Aug Centipede 0 2.67 2.2 2.2 2.7
30 2.83 3.5 3.5 3.3
50 2.00 4.7 4.5 4.5
70 1.83 1.5 1.5 1.7
El Toro Zoysia 0 4.17 4.5 5.0 4.3
30 4.67 5.2 5.0 4.3
50 5.83 4.5 4.7 4.2
70 4.83 3.8 4.5 3.7
Emerald Zoysia 0 4.83 3.8 4.0 3.2
30 4.17 5.5 5.5 5.3
50 2.00 3.3 2.8 3.0
70 2.33 3.0 3.8 3.7
Empire Zoysia 0 3.17 2.8 3.3 3.2
30 3.17 2.3 2.7 3.3
50 4.00 2.0 2.5 2.3
70 2.83 3.0 2.7 3.0
Geo Zoysia 0 3.67 4.3 4.2 4.0
30 4.33 3.8 3.3 3.0
50 4.67 5.0 5.0 4.0
70 4.83 5.5 5.3 5.0
Palisades Zoysia 0 3.00 3.0 3.0 3.0
30 3.83 4.0 3.8 4.7
50 3.00 4.0 3.8 3.3
70 3.83 4.5 3.7 3.5
St. Augustine 0 5.00 5.8 5.0 5.5
30 2.50 2.7 3.2 3.0
50 2.50 3.2 2.5 3.0
70 5.00 5.2 4.2 5.3
43
Table 7. Turfgrass Density (Hammond) Tiller no.
Cultivar Shade
% Jan Jun Jul Aug Centipede 0 6.0 3.3 5.67 18.0
30 3.7 7.7 8.67 23.3
50 2.0 4.0 5.67 13.7
70 4.3 10.7 8.00 28.3
El Toro Zoysia 0 5.0 7.0 6.33 21.3
30 4.0 4.7 4.33 20.7
50 4.0 6.3 4.00 37.3
70 3.3 9.3 7.33 24.3
Emerald Zoysia 0 5.7 6.7 5.00 35.3
30 6.3 4.3 6.00 19.0
50 5.0 2.3 2.33 19.7
70 3.0 8.0 3.67 17.3
Empire Zoysia 0 5.7 7.0 7.33 36.7
30 5.7 9.7 6.67 44.0
50 7.0 7.7 4.67 31.7
70 3.3 5.7 4.33 19.7
Geo Zoysia 0 2.0 4.3 3.33 15.0
30 2.0 5.3 4.33 18.3
50 3.3 5.0 4.00 11.7
70 0.7 3.0 3.33 7.7
Palisades Zoysia 0 5.7 6.0 4.67 17.7
30 4.7 6.7 6.33 25.0
50 2.7 6.7 5.67 15.7
70 4.0 6.0 5.00 12.7
St. Augustine 0 3.3 2.3 4.00 13.3
30 6.0 8.0 5.67 30.3
50 4.7 4.0 3.33 19.0
70 3.3 3.3 4.00 14.0
44
Table 8. Turfgrass Biomass (Hammond) Shoot Biomass (g)
Cultivar Shade
% Jan Jun Jul Aug Centipede 0 1.1 1.1 1.1 1.0
30 1.3 1.3 1.2 0.7
50 1.3 1.3 1.2 0.7
70 0.9 2.0 1.1 1.4
El Toro Zoysia 0 0.8 1.9 0.8 1.0
30 0.7 1.2 0.9 0.4
50 1.0 1.4 1.1 0.8
70 1.0 1.6 1.4 1.1
Emerald Zoysia 0 0.9 1.1 1.3 0.9
30 1.0 1.6 1.3 0.6
50 2.0 1.1 0.5 0.6
70 1.4 2.1 0.5 0.5
Empire Zoysia 0 1.0 2.4 1.1 1.0
30 1.1 2.0 1.1 0.9
50 1.8 1.6 0.8 1.0
70 1.9 1.5 0.8 0.6
Geo Zoysia 0 0.9 1.4 1.2 1.0
30 1.1 1.3 1.1 0.8
50 0.4 1.5 0.8 0.4
70 1.0 1.4 0.8 0.2
Palisades Zoysia 0 0.9 1.1 1.1 0.7
30 0.6 1.2 1.0 0.9
50 1.0 1.1 0.8 0.3
70 2.2 1.5 1.2 0.8
St. Augustine 0 0.7 1.3 1.0 0.7
30 1.1 2.0 1.0 0.9
50 1.3 1.0 0.5 0.6
70 1.0 2.3 1.1 1.0
45
Study 2. Establishment In the zoysiagrass establishment study zoysiagrass cultivars Emerald, El toro, Empire; Palisades, and Geo selected for the shade tolerance study were evaluated. The study areas were treated with a 5% glyphosate [N-(Phosphonomethyl)glycine; 1071-83-6; Glyphosphate; Glycine, N-(phosphonomethyl)] solution using a backpack sprayer to eliminate any existing vegetation before tilling the areas in preparation for zoysiagrass vegetative planting. All zoysiagrass cultivars were sprigged at 200, 400, or 600 bu/acre. The conversions for areas sprigged are represented in the following table: Table 9. Zoysiagrass sprig establishment rates.
Weight (g) Variety Weight of 1 yd2 (g) 200 bu/ac 400 bu/ac 600 bu/ac
Empire 2529 72.5 145.1 217.7 Palisades 2571 73.8 147.6 221.3 Emerald 4181 120 240 360 Geo 4077 117 234 351 El Toro 2562 73.5 147 220 Sprigs were rolled to increase sprig-to-soil contact followed by soil topdressing to allow for greater moisture retention. Sprigs were immediately irrigated post planting and as needed until canopy closure was achieved. The study area was treated with oxadiazon (3-[2,4-dichloro-5-(1-methylethoy)phenyl]-5-(1,1-dimethylethyl)-1,3,4-oxadiaxol-2(3H)-one) at 2 lbs ai acre-1 the day zoysiagrass sprigs were planted in order to control germinating weeds. Zoysiagrass sprigs were fertilized with granular fertilizer (13-13-13) at 0, 25, or 50 lbs N acre-1 using a drop spreader. During the study, zoysiagrass was maintained at 2 inches using a rotary mower. Experimental units of sprigging rates of each zoysiagrass cultivar were separated using glyphosate applied using a backpack sprayer as needed. The design of the study was a split-split-plot with zoysiagrass cultivar as the main plot, nitrogen application as the sub plot, and sprigging rate as the sub-sub plot (Figure 9). During the course of the study canopy groundcover, tiller number, and biomass were measured. Canopy coverage was assessed visually on a scale of 0 to 100%. Shoot biomass was assessed by removing a shoot tissue at the shoot-soil interface within 11.4 cm2 and dried at 60 C for 72 hrs before being gravimetrically determined. Tiller numbers were also assessed. In the initial study zoysiagrass canopy groundcover was measured monthly for three months and biomass measured at three months. The second study of the experiment measurements were recorded at 15, 28, 42, 56, 98, and 112 days after planting.
46
115 130 145
215 230 245
315 330 345
114 129 144
214 229 244
314 329 344
113 128 143
213 228 243
313 328 343
El Toro
Empire
Geo
112 127 142
212 227 242
312 327 342
111 126 140
211 226 241
311 326 341
110 125 140
210 225 240
310 325 340
Geo
El Toro
Palisades
109 124 139
209 224 239
309 324 339
108 123 138
208 223 238
308 323 338
107 122 137
207 222 237
307 322 337
Emerald
Geo
El Toro
106 121 136
206 221 236
306 321 336
105 120 135
205 220 235
305 320 335
104 119 134
204 219 234
304 319 334
Palisades
Emerald
Empire
103 118 133
203 218 233
303 318 333
102 117 132
202 217 232
302 317 332
101 116 131
201 216 231
301 316 331
Empire
Palisades
Emerald
Figure 10. Study layout for zoysiagrass establishment (above) and establishment study in the field (below).
Results of the zoysiagrass establishment study. Zoysiagrass establishment was affected by cultivar and sprigging rate and to a lesser extent N application rate. Within a 90 day period the majority of zoysiagrass cultivars and sprigging rates were able to result in >80% groundcover with the most notable exception of Emerald at the lower sprigging rates and N applications.

47
In general, as the sprigging rate increased from 200 to 400 to 600 bu acre-1 zoysiagrass establishment was slightly accelerated for all cultivars. Increasing the amount of plant material resulted in slightly higher initial ground coverages. For example, Emerald had ground coverages of 11.7-15%, 13.3-16.7%, and 21.7-23.3% for sprigging rates of 200, 400, and 600 bu acre-1, respectively, in June but increased to 65-81.7, 75-86.7, and 80-90% by August (Table 5). This trend was also observed in the second study as well. Differences in the ranges of zoysiagrass ground coverage were the result of increasing N applications. In the case of N, application of N was mixed in accelerating zoysiagrass establishment. This suggests that zoysiagrass may not be as affected by N application as other warm-season turfgrasses established by sprigs such as bermudagrass. For example, El Toro within the 200 sprigging rate had ground coverages of 25, 30, and 31.7% for N application rates of 0, 25, and 50 lbs N acre-1 in June (Table 1) and 83.3, 90, and 93.3% by August, respectively. The control with no N fertility increased in ground coverage. Therefore moderate applications of N (25 lbs N acre-1) are sufficient during the establishment of zoysiagrass. The last portion of the study examined the strength of the zoysiagrass sod. Early attempts to perform this were unsuccessful. Even though zoysiagrass had achieved >90% ground cover, zoysiagrass had not formed enough of a mat to allow the tests to be performed. Therefore, the test was held 14 months after establishment for the first study. Results showed all zoysiagrasses could be tested after 14 months. Additionally, finer blade zoysiagrass cultivars, Emerald and Geo, appear to have stronger tensile strength compared to coarser zoysiagrasses. Final recommendations:
1. Increasing sprigging rate can accelerate zoysiagrass canopy closure, but the moderate sprigging rate was sufficient (400 bu acre-1).
2. Moderate application of N (25 lbs N acre-1) is sufficient during zoysiagrass establishment from sprigs.
48
Figure 11. Example of the effects of sprigging rates (200, 400, and 600 bu acre-1) on a coarse and fine bladed zoysiagrass cultivar.
June
200 bu acre-1 400 bu acre-1 600 bu acre-1
El Toro
Emerald
September
200 bu acre-1 400 bu acre-1 600 bu acre-1
El Toro
Emerald
49
Table 10. Zoysiagrass establishment for the first study
Coverage % Cultivar Sprig Rate N Rate June July August
El Toro Zoysia 200 0 25ghijkl 60egijl 83.3abcdefh
25 30defghijkl 71.7abcdefgi 90abcdef
50 31.7defghijkl 73.3abcdefgi 93.3abcde
400 0 28.3defghijkl 66.7bdefgijk 83.3abcdefh
25 35cdefghij 73.3abcdefgi 91.7abcdef
50 33.3defghijk 85abcdf 90abcdef
600 0 30defghijkl 71.7abcdefgi 83.3abcdefh
25 41.7abcdefgh 85abcdf 95abcd
50 40bcdefgh 93.3ac 96.7abcd
Emerald Zoysia 200 0 11.7l 36.7l 65i
25 15jkl 43.3jl 70hi
50 15jkl 46.7ijl 81.7cdefh
400 0 13.3kl 58.3fgijl 75fghi
25 13.3kl 58.3fgijl 76.7efhi
50 16.7ijkl 56.7ghijl 86.7abcdef
600 0 21.7hijkl 70abcdefgi 80defhi
25 23.3ghijkl 76.7abcdefg 88.3abcdef
50 21.7hijkl 71.7abcdefg 90abcdef
Empire Zoysia 200 0 26.7fghijklm 66.7cdefgijk 81.7cdefhi
25 30fghijklm 80abcdefg 86.7abcdefh
50 30fghijklm 88.3abcd 95abcd
400 0 36.7defghi 78.3abcdefg 85abcdefh
25 48.3abcde 83.3abcdefg 95abcd
50 55abc 91.7ab 96.7abcd
600 0 38.3cdefgh 81.7abcdefg 85bcdefh
25 61.7a 93.3ab 95abcd
50 58.3ab 93.3ab 100a
Geo Zoysia 200 0 15jkl 56.7gijl 75fhi
25 23.3hijkl 68.3abcdefgij 90abcdeg
50 26.7fghijklm 70abcdefgij 93.3abcde
400 0 25hijkl 73.3abcdefgi 81.7cdefhi
25 30defghijkl 76.7abcdefg 85abcdefh
50 31.7defghijkl 81.7abcdefh 95abcd
600 0 28.3defghijkl 73.3abcdefgi 81.7cdefhi
25 36.7cdefghi 85abcdef 93.3abcde
50 43.3abcdefg 88.3abcd 100ab
Palisades Zoysia 200 0 25ghijkl 61.7dfgijl 85abcdefh
25 23.3ghijkl 73.3abcdefgi 86.7abcdefh
50 28.3eghijklm 78.3abcdefg 96.7abcd
400 0 30defghijkl 71.7abcdefgi 88.3abcdef

50
25 38.3bcdefgh 88.3abcd 93.3abcde
50 35cdefghij 86.7abce 95abcd
600 0 36.7cdefghi 76.7abcdefg 88.3abcdef
25 46.7abcdf 83.3abcdefg 96.7abcd
50 46.7abcdf 90abc 98.3abc Table 11. Zoysia establishment for the second study
Coverage %
Cultivar Sprig Rate N
Rate 28
DAP 42
DAP 56
DAP 98
DAP 112 DAP
El Toro Zoysia 200 0 33.3abc 38.3dghi 51.7dfghi 100a 96.7a
25 31.7abc 56.7abcdefg 60abcdefgh 91.7a 100a
50 40abc 80abce 90abce 91.7a 100a
400 0 53.3abc 76.7abcef 78.3abcdefgh 100a 100a
25 48.3abc 58.3abcdefg 86.7abcdefg 96.7a 100a
50 50abc 83.3abc 96.7abc 98.3a 100a
600 0 50abc 73.3abcdefg 76.7abcdefgh 100a 100a
25 55ac 78.3abcef 93.3abc 98.3a 100a
50 61.7a 83.3abc 98.3a 98.3a 100a
Emerald Zoysia 200 0 13.3c 25gh 41.7fgh 81.7a 91.7a
25 15bc 40abcdefg 46.7efghi 75a 81.7a
50 18.3bc 30fgh 51.7bcdefgh 81.7a 90a
400 0 13.3c 35abcdefg 46.7efghi 78.3a 83.3a
25 18.3bc 50abcdefg 45efghi 70a 78.3a
50 18.3bc 36.7abcdefg 61.7abcdefgh 75a 78.3a
600 0 16.7bc 46.7abcdefg 61.7abcdefgh 73.3a 86.7a
25 16.7bc 45abcdefg 45efghi 85a 95a
50 13.3c 36.7abcdefg 63.3abcdefgh 81.7a 90a
Empire Zoysia 200 0 28.3abc 38.3cghij 41.7gh 86.7a 90a
25 23.3abc 35cghij 58.3abcdefgh 96.7a 100a
50 20bc 45abcdefg 65abcdefgh 90a 95a
400 0 30abc 43.3bcfgi 70abcdefgh 91.7a 98.3a
25 35abc 50abcdefg 71.7abcdefgh 95a 100a
50 40abc 63.3abcdefg 83.3abcdef 100a 100a
600 0 46.7abc 65abcdefg 73.3abcdefgh 95a 100a
25 45abc 78.3abdef 88.3abcde 96.7a 100a
50 45abc 80ade 90abcde 100a 100a
Geo Zoysia 200 0 35abc 48.3abcdefg 60abcdefgh 86.7a 86.7a
25 25abc 60abcdefg 71.7abcdefgh 91.7a 95a
50 36.7abc 65abcdefg 78.3abcdefgh 91.7a 91.7a
400 0 48.3abc 68.3abcdefg 78.3abcdefgh 88.3a 93.3a
25 36.7abc 75abcdef 83.3abcdefg 98.3a 98.3a
50 33.3abc 70abcdefg 83.3abcdefg 91.7a 96.7a
600 0 35abc 66.7abcdefg 68.3abcdefgh 83.3a 90a
25 41.7abc 76.7abcdef 86.7abcdefg 93.3a 95a
50 51.7abc 81.7abcd 98abcd 98.3a 98.3a
Palisades Zoysia 200 0 18.3bc 30fgij 35h 70a 80a
25 15bc 31.7efgi 63.3abcdefgh 75a 90a
50 16.7bc 25gh 70abcdefgh 93.3a 100a
51
400 0 18.3bc 30fgij 55abcdefgh 91.7a 98.3a
25 18.3bc 51.7abcdefg 76.7abcdefgh 81.7a 90a
50 33.3abc 60abcdefg 86.7abcdefg 100a 100a
600 0 28.3abc 45abcdefg 51.7cfghi 85a 91.7a
25 23.3abc 53.3abcdefg 70abcdefgh 76.7a 93.3a
50 40abc 68.3abcdh 90abde 98.3a 100a
Table 12. Zoysiagrass shoot biomass (g) and tiller number
Shoot Biomass Study 1 Shooot Biomass Study 2 Tiller No. Study 2
Cultivar Sprig Rate
N Rate Aug Jul Jul
El Toro Zoysia 200 0 0.4a 2.1a 2.3ab
25 0.8ab 2.3a 3.3ab
50 0.9ab 1.8a 5ab
400 0 0.9ab 1.3a 2.3ab
25 0.9ab 2.1a 4.3ab
50 1.4ab 2.2a 5.3ab
600 0 1.3ab 1.4a 4ab
25 1ab 2a 3.3ab
50 0.8ab 1.4a 4.3ab
Emerald Zoysia 200 0 0.8a 0.8a 3ab
25 0.7ab 1.2a 3.3ab
50 1.3ab 0.6a 3.3ab
400 0 1.2ab 0.9a 2.7ab
25 1.1ab 1.1a 1.7ab
50 0.8ab 1.6a 4.7ab
600 0 0.9ab 0.8a 2ab
25 0.6ab 1.3a 2.7ab
50 0.8ab 1a 5ab
Empire Zoysia 200 0 0.7ab 1.2a 2.3ab
25 1.4ab 2.1a 1.7ab
50 1.2zb 2.2a 2ab
400 0 11.2ab 1.6a 3ab
25 1.1ab 1.6a 3ab
50 1.5ab 1.4a 3ab
600 0 1.1ab 1.4a 2ab
25 1ab 1.9a 3ab
50 2.2a 1.5a 4.3ab
Geo Zoysia 200 0 12ab 1.4a 3ab
25 0.7ab 2a 3.7ab
50 0.8ab 1a 7a
400 0 0.9ab 1.8a 3.3ab
25 0.9ab 1.7a 5.3ab
50 1.2ab 2a 6ab
600 0 1.1ab 1.6a 3ab
25 1ab 1.3a 4.7ab
50 0.9ab 1.6a 5.7ab
Palisades Zoysia 200 0 0.5b 0.9a 1.7ab
25 10ab 0.3a 0.7b
50 11ab 1.4a 2ab
400 0 1.5ab 0.9a 3ab
25 0.7ab 0.9a 1.7ab
50 0.8ab 1.5a 3.3ab
52
600 0 0.7ab 0.7a 2.3ab
25 0.9ab 1.7a 2.3ab
50 1ab 1.3a 2.3ab
Figure 12. Tensile strength of five zoysiagrass cultivars at 14 months.
GOALS AND OUTCOMES ACHIEVED: According to the results from the shade tolerance study, all of the zoysiagrass cultivars El Toro, Emerald, Empire, Geo, and Palisades are suitable alternative turfgrass species to the commonly grown turfgrass species centipedegrass and St. Augustinegrass for shade levels at 30% or less. At shade levels 50 and 70% no turfgrass species or zoysiagrass cultivar tested provided acceptable ground coverage or quality after 12 months. The establishment study showed increasing sprigging rate of zoysiagrass can increase ground cover quicker, but that the addition of moderate N (25 lbs N acre-1) is sufficient during zoysiagrass sprig establishment. The research has been presented or made available at: two field days at the LSU AgCenter Station in Hammond (2015 and 2016); two annual conferences for the Louisiana Turfgrass Association (2015 and 2016); a presentation for the Horticulture Industry at the LSU Agricultural Center at Burden Botanic Gardens and Museum (2015); Results have been incorporated in turfgrass Master Gardener classes when presented in New Orleans; an abstract and poster were presented at the annual conference for Agronomy Society of America (Minneapolis, MN; 2015). In addition, an article has been submitted to the Louisiana Agriculture magazine for
53
publication to disseminate the results as well as a simple fact sheet for shade tolerance has been written and will be provided to the extension service. Based on data collected from the industry prior to the initiation of the study, 8 out of the 14 (53%) responding sod producers grew zoysiagrass with Empire and Palisades as the most grown cultivars. At the conclusion of the study 10 (67%) sod producers were growing zoysiagrass of the 14 respondents. This was an increase of 14% in sod producers growing zoysiagrass. However, if the data were adjusted to remove closed sod producers, the increase in sod producers was up from 53% to 75%. It was thought an increase of 15% would occur. In terms of zoysiagrass use in the industry, based on 34 respondents zoysiagrass use increased from 7.5% prior to the study to 13.5%. However, zoysiagrass use among those that had used zoysiagrass prior to the study did not decrease and increased from 12% to 20%. Today, the majority of sod producers in Louisiana are producing zoysiagrass. We expect this acreage to increase over time as landscapers, landscape architects, and consumers become aware of the benefits of zoysiagrass as a turfgrass species in Louisiana. Therefore, this research serves as an educational component that can be used to demonstrate the shade tolerance of zoysiagrass compared to commonly grown turfgrass species such as centipedegrass and St. Augustinegrass. BENEFICIARIES: Several entities are benefiting and can continue to benefit from the activities performed. Sod producers (16), landscapers (300+), landscape architects (30+), and consumers have access to information regarding the suitability of zoysiagrass cultivars El Toro, Emerald, Empire, Geo, and Palisades as alternative turfgrass species to the commonly grown turfgrass species centipedegrass and St. Augustinegrass for shade levels at 30% or less. Sod producers will also be aware that increasing sprigging rates can lead to faster ground coverage at moderate N application (25 lbs N acre-1). As noted, the number of sod producers growing zoysiagrass increased from 8 to 10 (14 respondents) and the use in the industry increased from 7.5% to 13.5% with those previously using zoysigrass increasing from 12% to 20%. Although the target of 15% was not achieved for use in the industry, the increase in sod production and length of time to produce saleable sod indicate a lag in zoysiagrass growth between sod producers and industry users. Data to support these findings are available in table and figure formats in the Project Approach section with final findings reported at the end of the results subsection. Also presentations and materials have and will be available to aforementioned groups. LESSONS LEARNED: The purposes of these studies were to characterize zoysiagrass in shaded conditions as well as examine the effects sprigging rate and nitrogen fertility have during zoysiagrass establishment. However, the methods used in the shade study applied changes to light quantity to the species and cultivars tested. Although this is a primary component of most shaded conditions, we did not examine the effects of changes in light quality (e.g. infrared). Examining the relationship between light quantity and quality would be difficult under field conditions. However, further
54
studies that examine the effects of light quality and quantity may provide some insight as well as greater characterization of zoysiagrass cultivars shade tolerances. Another important lesson learned while conducting this research was the amount of irrigation needed to achieve zoysiagrass establishment. Because the zoysiagrass cultivars tested could only be established vegetatively, irrigation proved to be extremely important to prevent desiccation until active growth initiated. In fact, after failed attempts in Northern Louisiana the studies were moved south in order to allow for daily assessment of irrigation needs. Unlike bermudagrass (Cynodon spp.) that is commonly established vegetatively from sprigs within a period of 4 to 6 weeks after planting, zoysiagrass required more time and thus an extended period of supplemental irrigation between planting and canopy closure. Although once zoysiagrass exited the initial transplant shock, growth increased more rapidly to achieve canopy closure. This was especially true for the fine bladed zoysiagrass cultivars that appeared to require longer durations between planting and visible growth. The findings of this research and observations during studies suggest irrigation during zoysiagrass establishment from sprigs may be an important area for further research. CONTACT PERSON: Jeffrey Beasley, Associate Professor School of Plant, Environmental, and Soil Sciences LSU AgCenter, 226 J. C. Miller Hall Baton Rouge, LA 70803