Loudspeaker Phase Measurements, Transient Response And Audible Quality (Brüel & Kjaer)
16
LiVUVIaMVUi\vl Ul ICIOv 111vuvilI vl I Ivl llwt ■ ■ ■ ■ j ■ i_ i i ■ ■ Tr^iiiQi^riT rPQn^^^A JIWO ^iiioiniA ni iiiTv mm Ul 11^11^ I I I I ^7^9 |w IT#I 1^?*^ Gmh m%~M WiWiWi 11^1^7 Wf^-^CIa 1 Sa W 17—198 Expanded version of the original paper presented at the 48th Audio Engineering Society Convention California, USA
-
Upload
tichoberahe -
Category
Documents
-
view
71 -
download
6
description
Loudspeaker Phase Measurements, Transient Response And Audible Quality (Brüel & Kjaer)
Transcript of Loudspeaker Phase Measurements, Transient Response And Audible Quality (Brüel & Kjaer)
LiVUVIaMVUi\vl Ul ICIOv 111vuvilI vl I Ivl llwt ■ ■ ■ ■ j ■ i_ i i ■ ■ Tr^iiiQi^riT rPQn^^^A JIWO ^iiioiniA n i iiiTv mm U l 11^11^ I I I I ^7^9 |w IT# I 1^?*^ Gmh m%~M WiWiWi 11^1^7 Wf^-^CIa 1 Sa W
17—198
Expanded version of the original paper presented at the 48th Audio Engineering Society Convention California, USA
Loudspeaker phase measurements, transient response and audible quality
By Henning Moiler, BrueJ & Kjaer
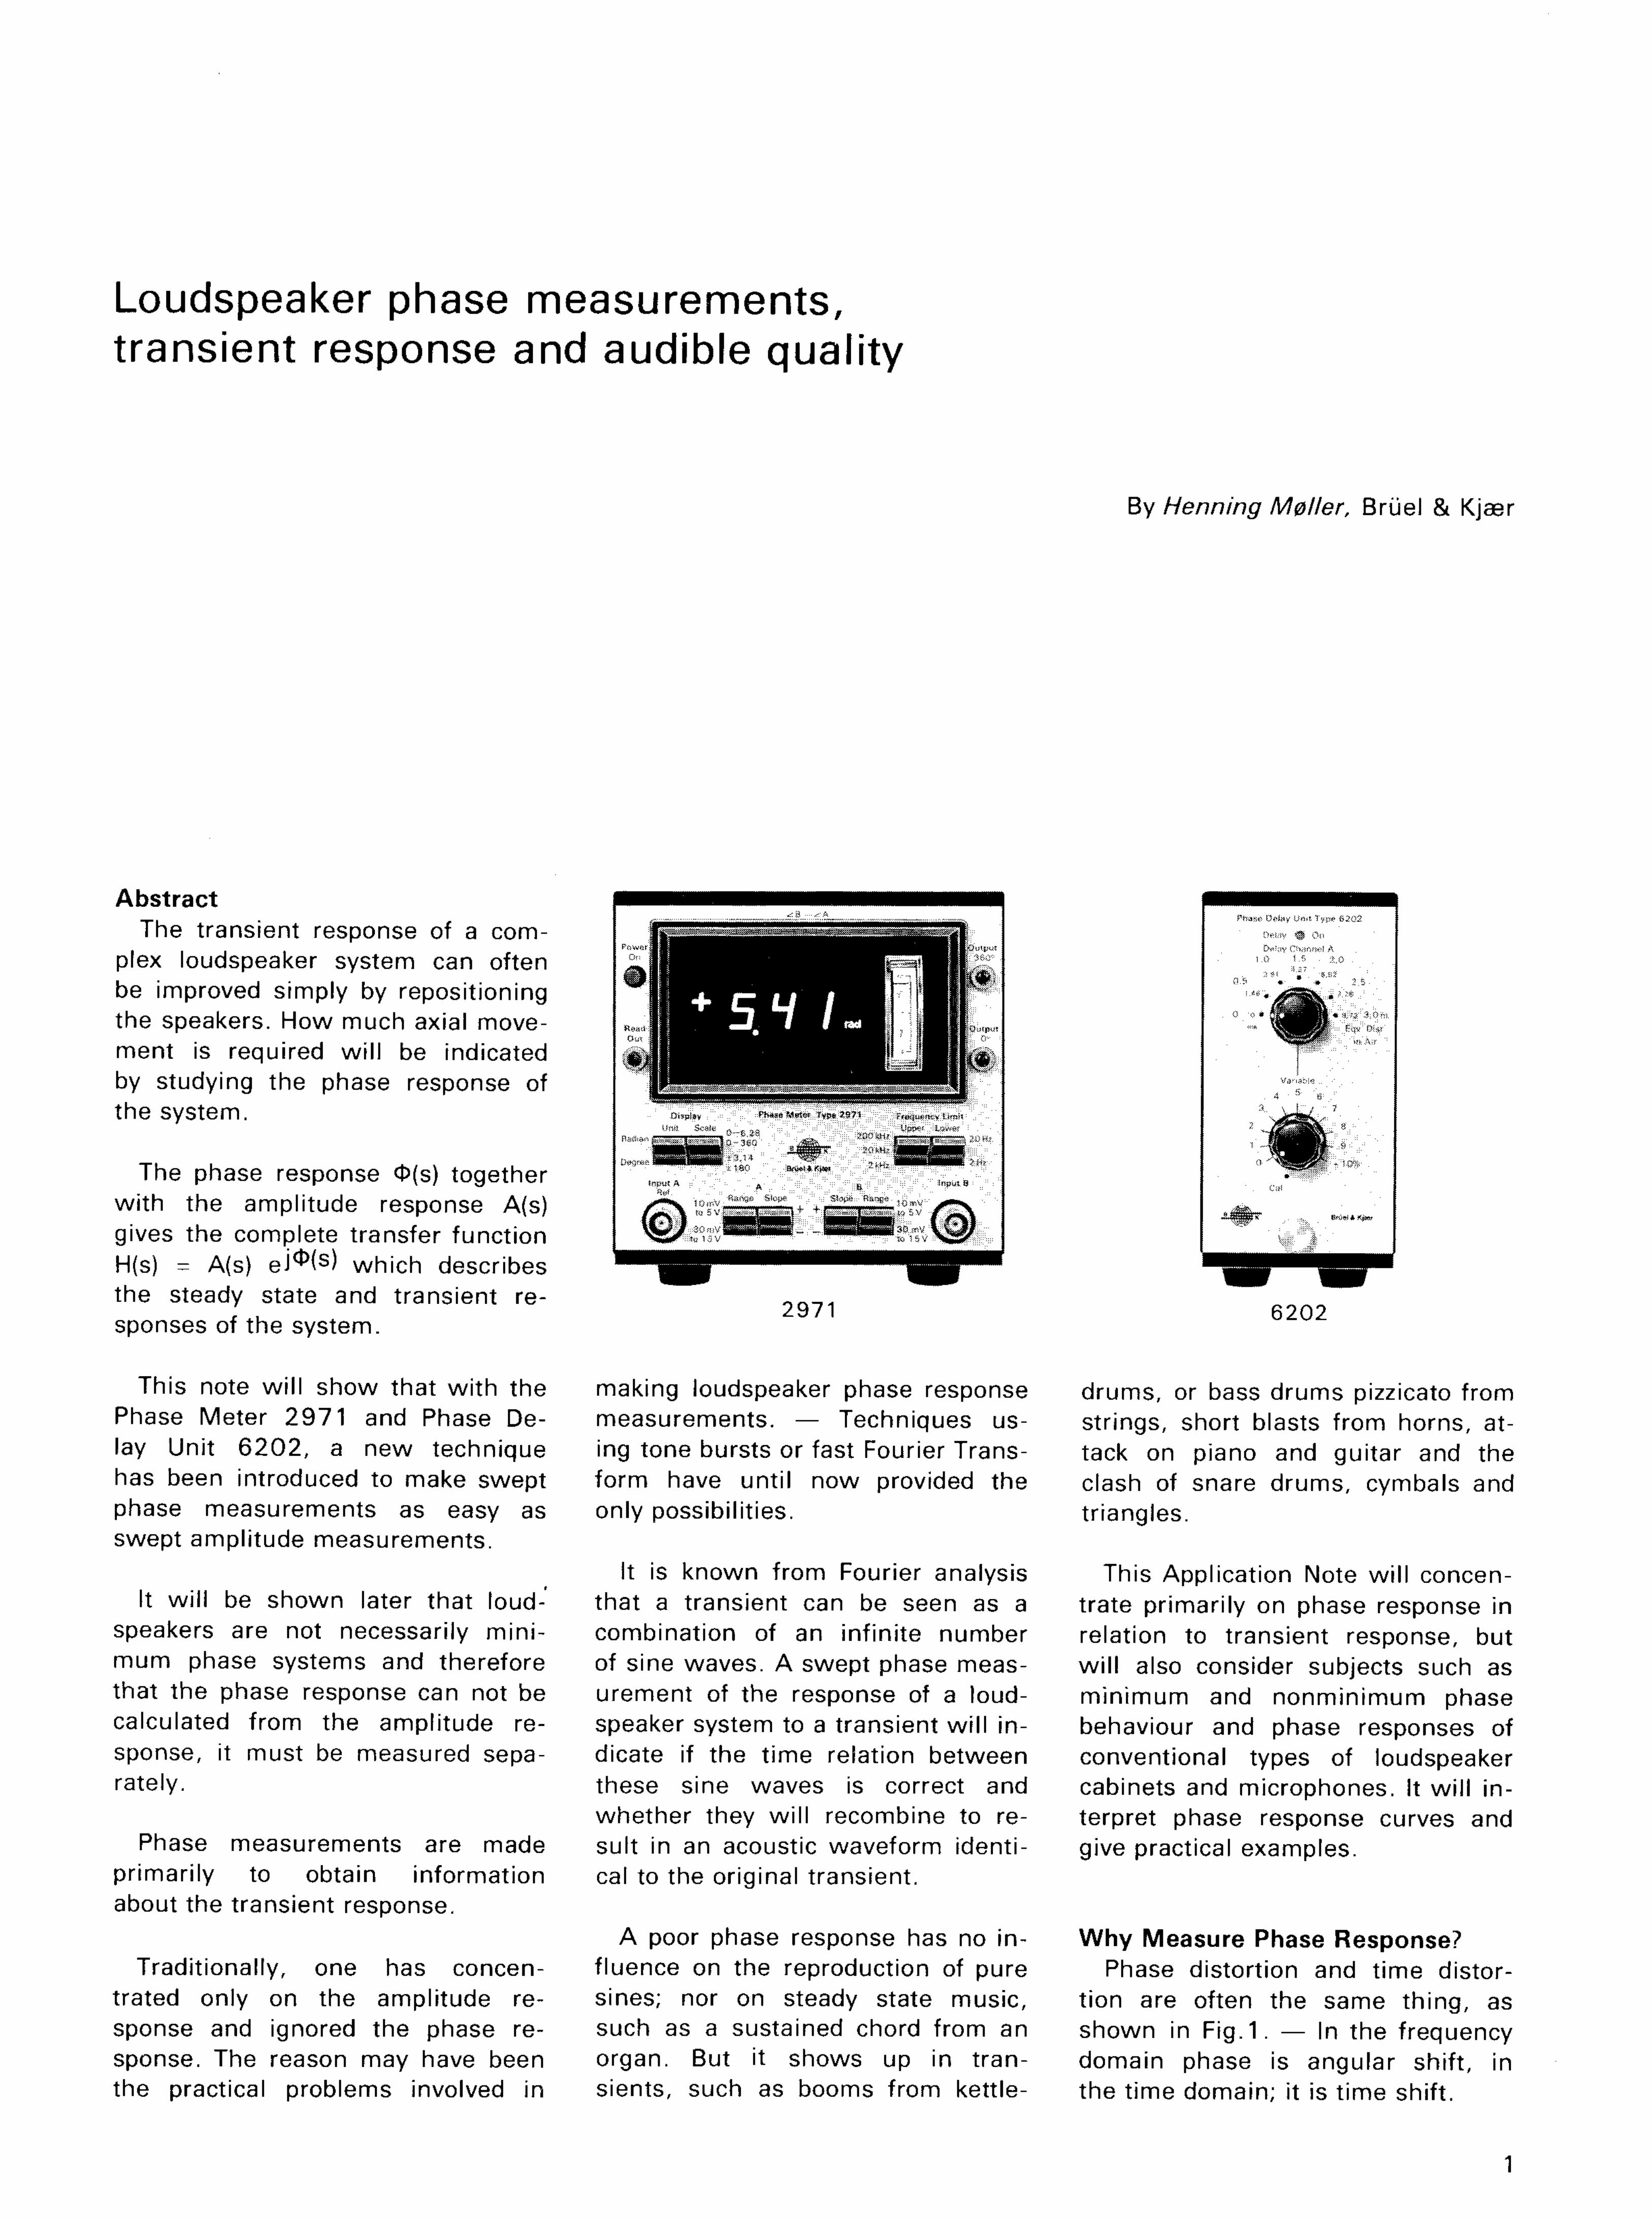
Abstract The transient response of a com
plex loudspeaker system can often be improved simply by repositioning the speakers. How much axial movement is required wi l l be indicated by studying the phase response of the system.
The phase response O(s) together wi th the amplitude response A(s) gives the complete transfer funct ion H(s) = A(s) eJ^fs) which describes the steady state and transient responses of the system.
This note wi l l show that w i th the Phase Meter 2 9 7 1 and Phase Delay Unit 6 2 0 2 , a new technique has been introduced to make swept phase measurements as easy as swept amplitude measurements.
It wi l l be shown later that loudspeakers are not necessarily min i mum phase systems and therefore that the phase response can not be calculated from the amplitude response, it must be measured separately.
Phase measurements are made primarily to obtain information about the transient response.
Traditionally, one has concentrated only on the amplitude response and ignored the phase response. The reason may have been the practical problems involved in
2971 6202
making loudspeaker phase response drums, or bass drums pizzicato from measurements. — Techniques us- strings, short blasts from horns, at-ing tone bursts or fast Fourier Trans- tack on piano and guitar and the form have unti l now provided the clash of snare drums, cymbals and only possibilities. triangles.
It is known from Fourier analysis This Application Note wi l l concen-that a transient can be seen as a trate primarily on phase response in combination of an infinite number relation to transient response, but of sine waves. A swept phase meas- wi l l also consider subjects such as urement of the response of a loud- min imum and nonmin imum phase speaker system to a transient wi l l in- behaviour and phase responses of dicate if the t ime relation between conventional types of loudspeaker these sine waves is correct and cabinets and microphones. It wi l l in-whether they wi l l recombine to re- terpret phase response curves and suit in an acoustic waveform identi- give practical examples. cal to the original transient.
A poor phase response has no in- Why Measure Phase Response? f luence on the reproduction of pure Phase distortion and time distor-sines; nor on steady state music, t ion are often the same th ing, as such as a sustained chord from an shown in Fig. 1. — In the frequency organ. But it shows up in t ran- domain phase is angular shift, in sients, such as booms from kettle- the t ime domain; it is t ime shift.
1
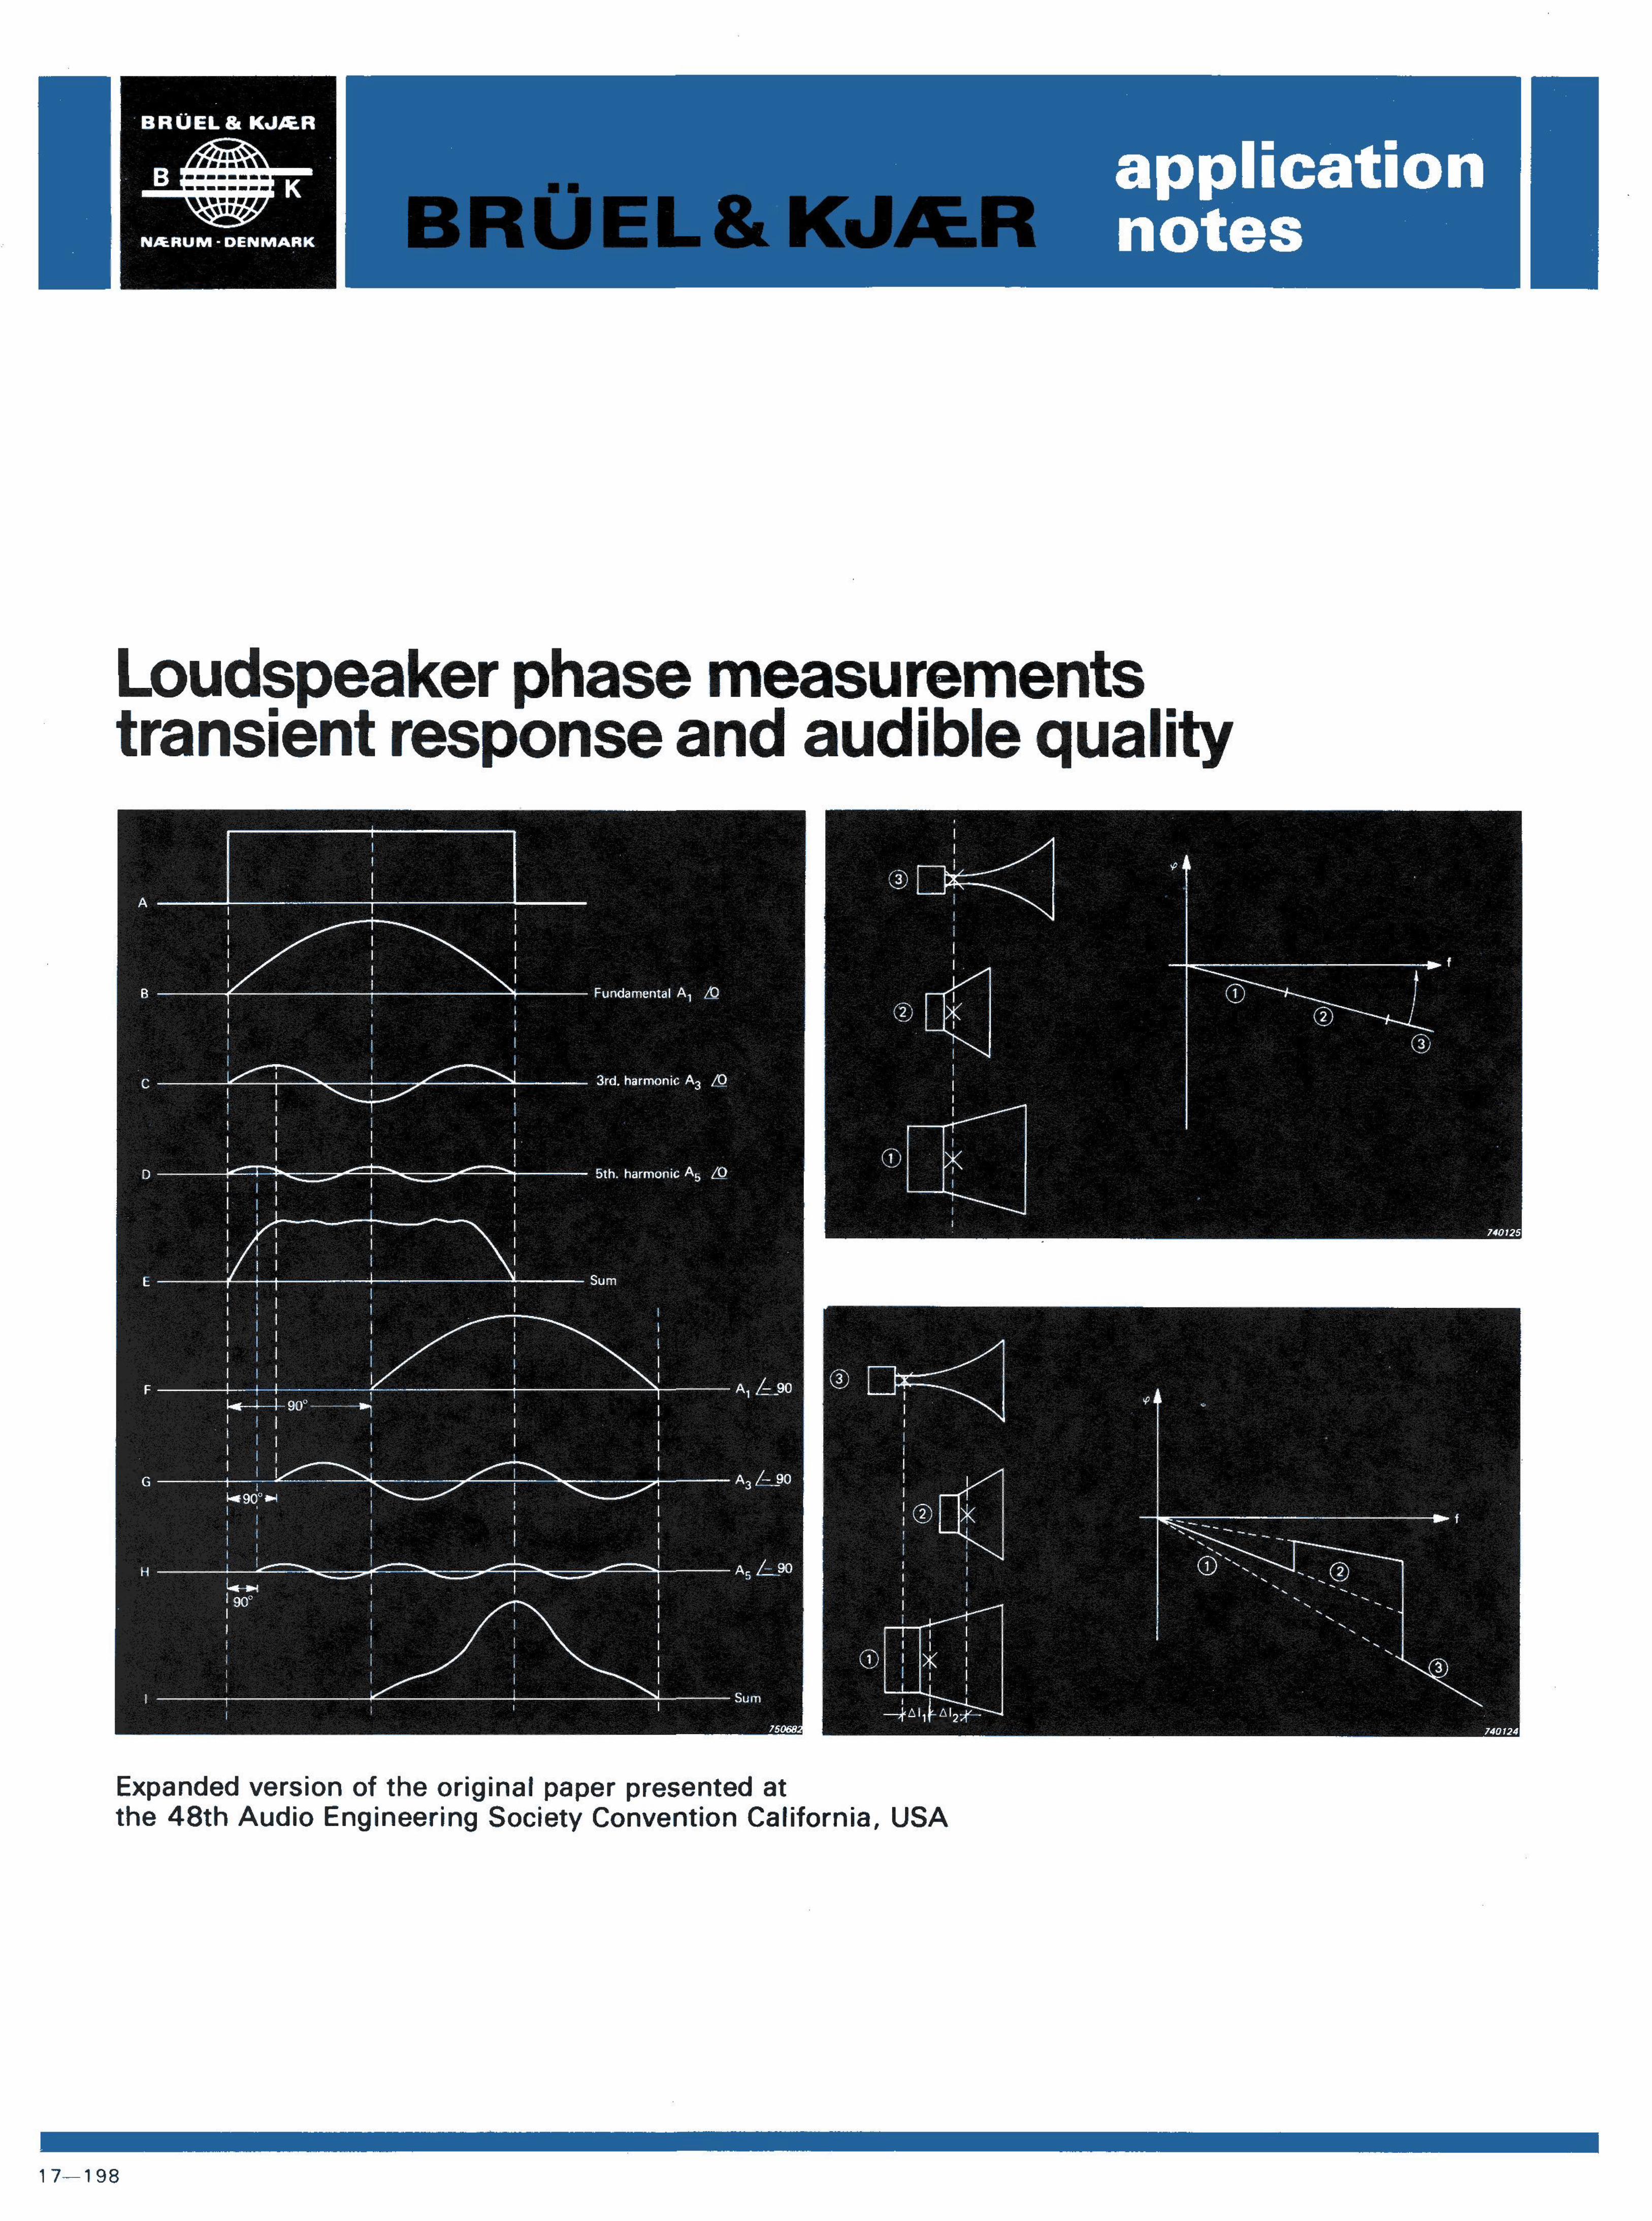
! Fig.2. A "cont inuous t ransient" a square wave consists of a fundamental sine wave and a num-; ber of harmonic components. When in phase (B-D) these can recombine (E) almost as
the original signal (A). When shifted 90° (F-H) the recombined signal (I) is very different f rom the original. Good transient response requires that the components are in phase
j nation F, G and H wi l l have a sum This simple example indicates the i (F) which is shifted 90° in t ime, but importance of swept phase measure-j wi th a waveform very different from ments as they make it possible to
the ideal square wave (A), and read the relative phase shifts be-» therefore the system wi l l have a tween different frequencies and
poor transient response. therefore also between a fundamen-
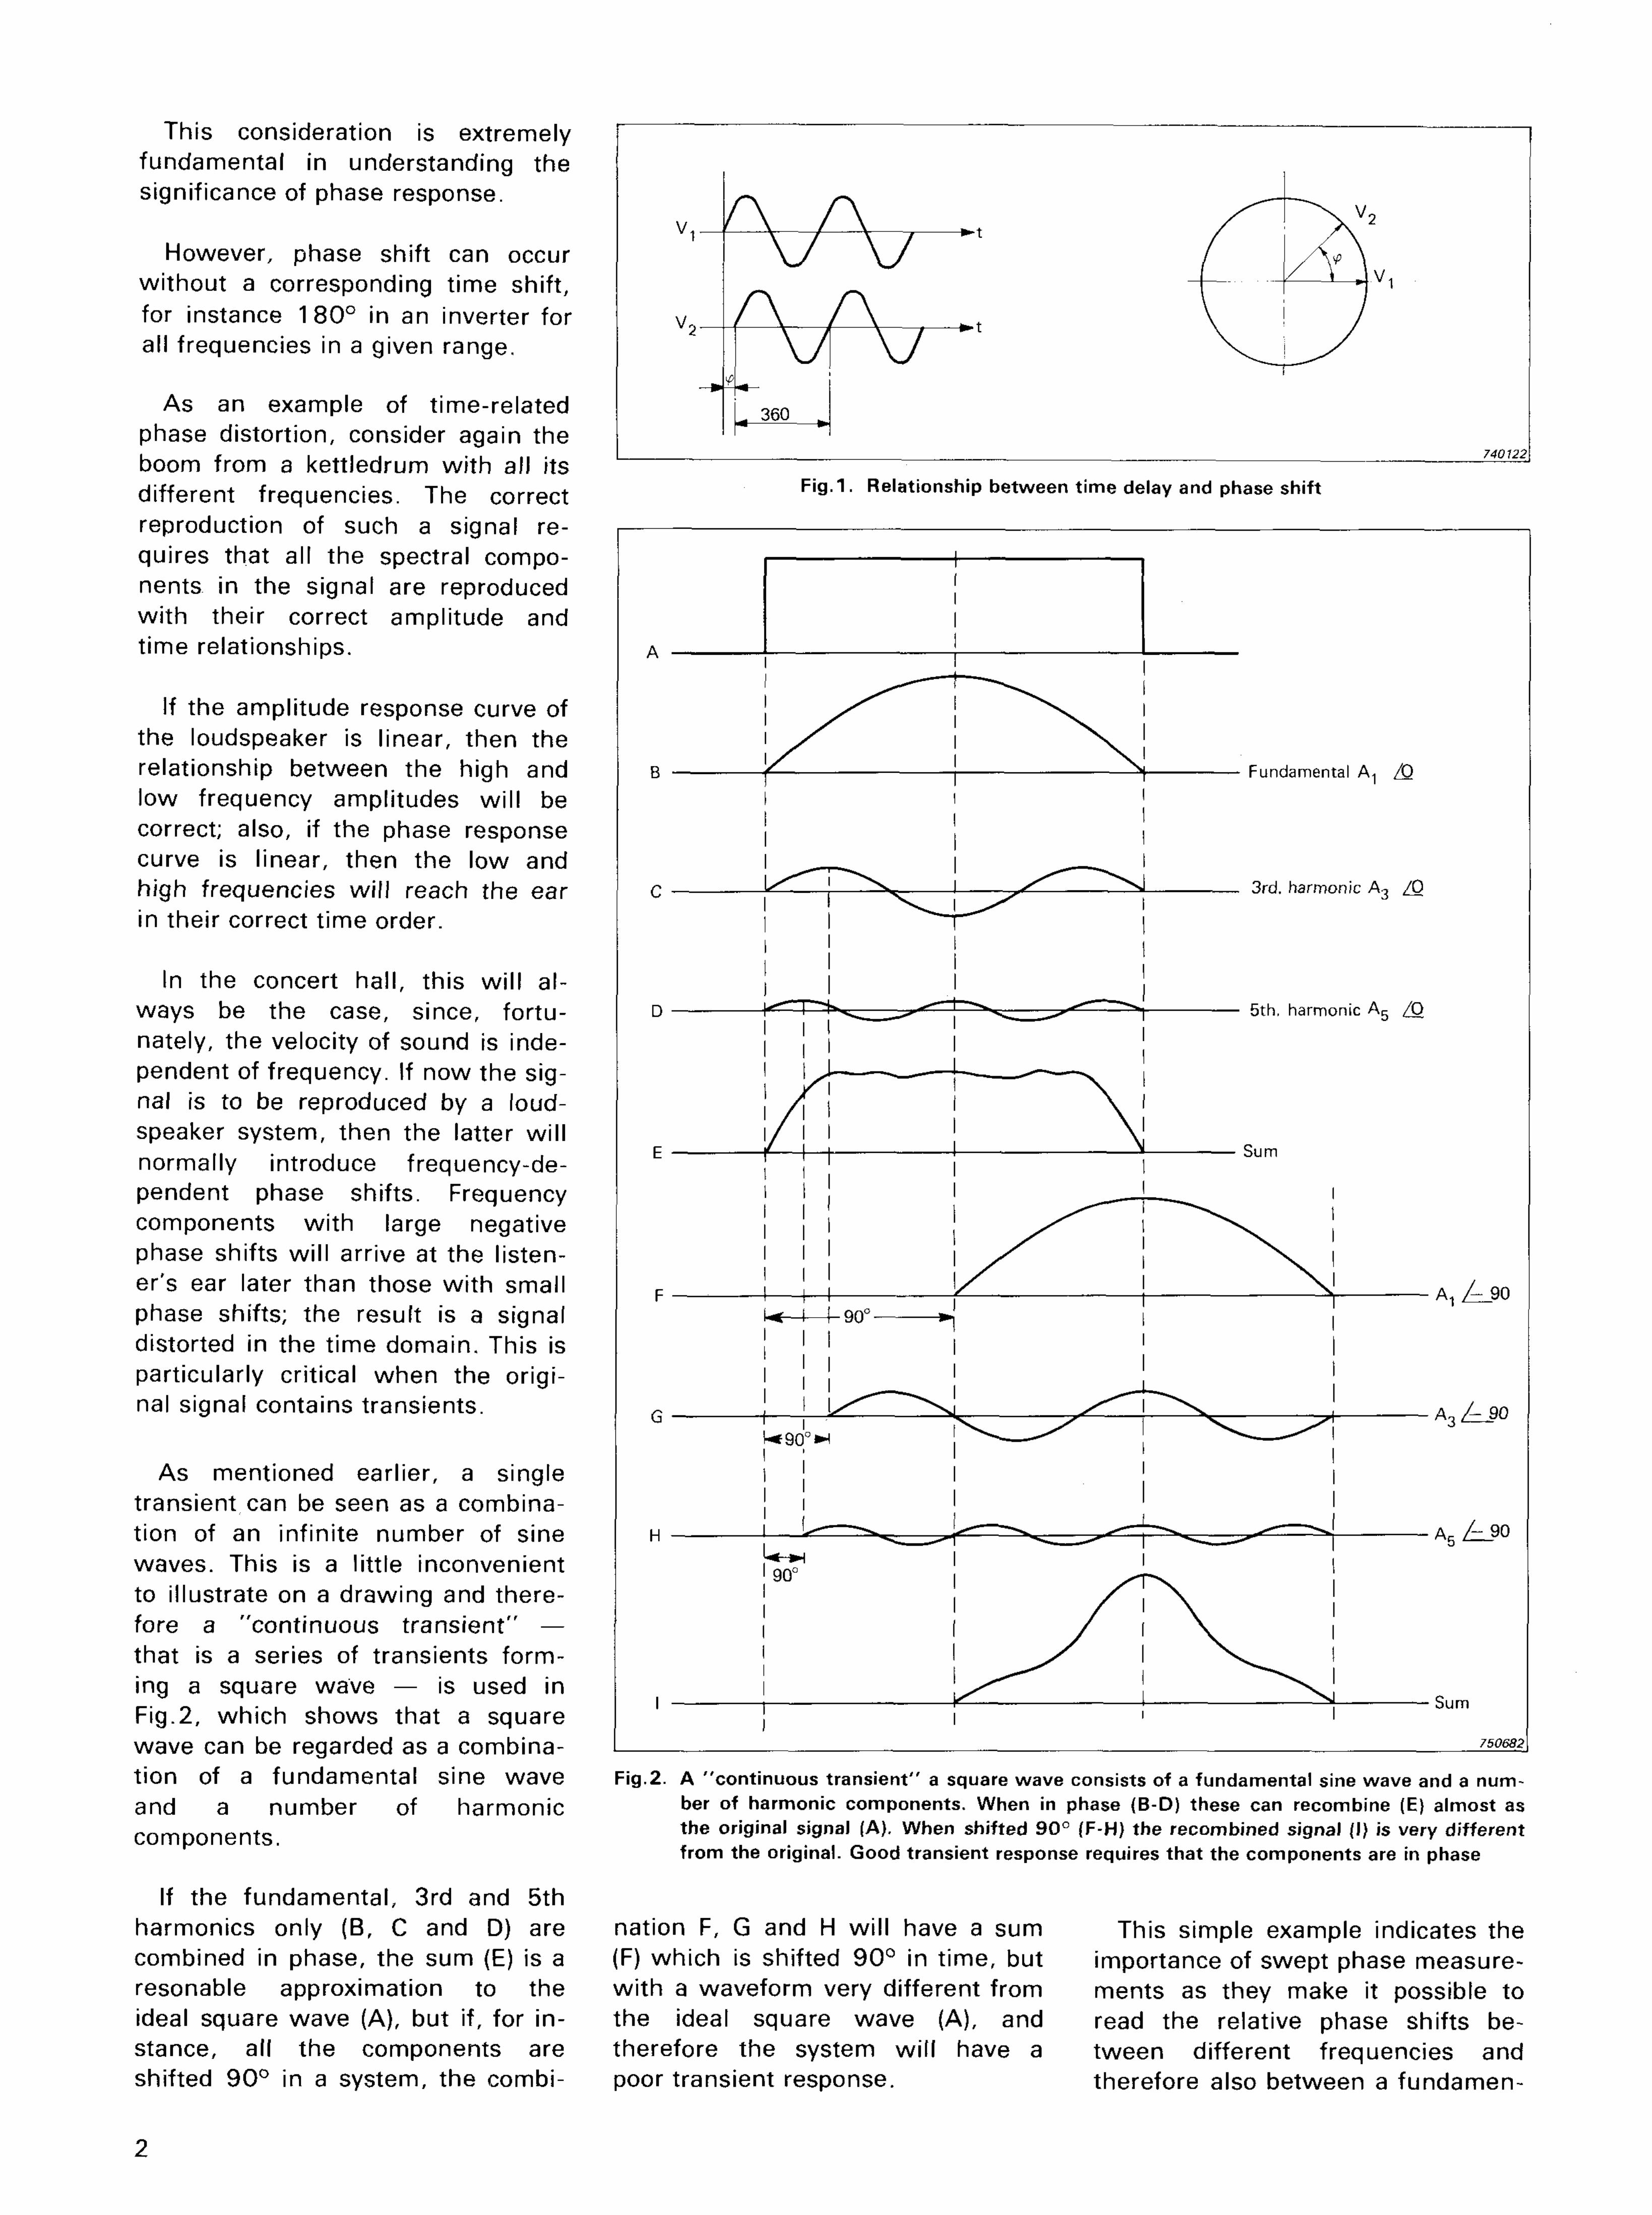
This consideration is extremely fundamental in understanding the significance of phase response.
However, phase shift can occur without a corresponding time shift, for instance 180° in an inverter for all frequencies in a given range.
As an example of time-related phase distortion, consider again the boom from a kettledrum wi th all its different frequencies. The correct reproduction of such a signal requires that all the spectral components in the signal are reproduced wi th their correct amplitude and time relationships.
If the amplitude response curve of the loudspeaker is linear, then the relationship between the high and low frequency amplitudes wi l l be correct; also, if the phase response curve is linear, then the low and high frequencies wi l l reach the ear in their correct time order.
In the concert hall, this wi l l always be the case, since, fortunately, the velocity of sound is independent of frequency. If now the signal is to be reproduced by a loudspeaker system, then the latter wi l l normally introduce frequency-dependent phase shifts. Frequency components wi th large negative phase shifts wil l arrive at the listener's ear later than those wi th small phase shifts; the result is a signal distorted in the time domain. This is particularly critical when the original signal contains transients.
As mentioned earlier, a single transient can be seen as a combination of an infinite number of sine waves. This is a little inconvenient to illustrate on a drawing and therefore a "continuous transient" — that is a series of transients forming a square wave — is used in Fig.2, which shows that a square wave can be regarded as a combination of a fundamental sine wave and a number of harmonic components.
If the fundamental, 3rd and 5th harmonics only (B, C and D) are combined in phase, the sum (E) is a resonable approximation to the ideal square wave (A), but if, for instance, all the components are shifted 90° in a system, the combi-
2
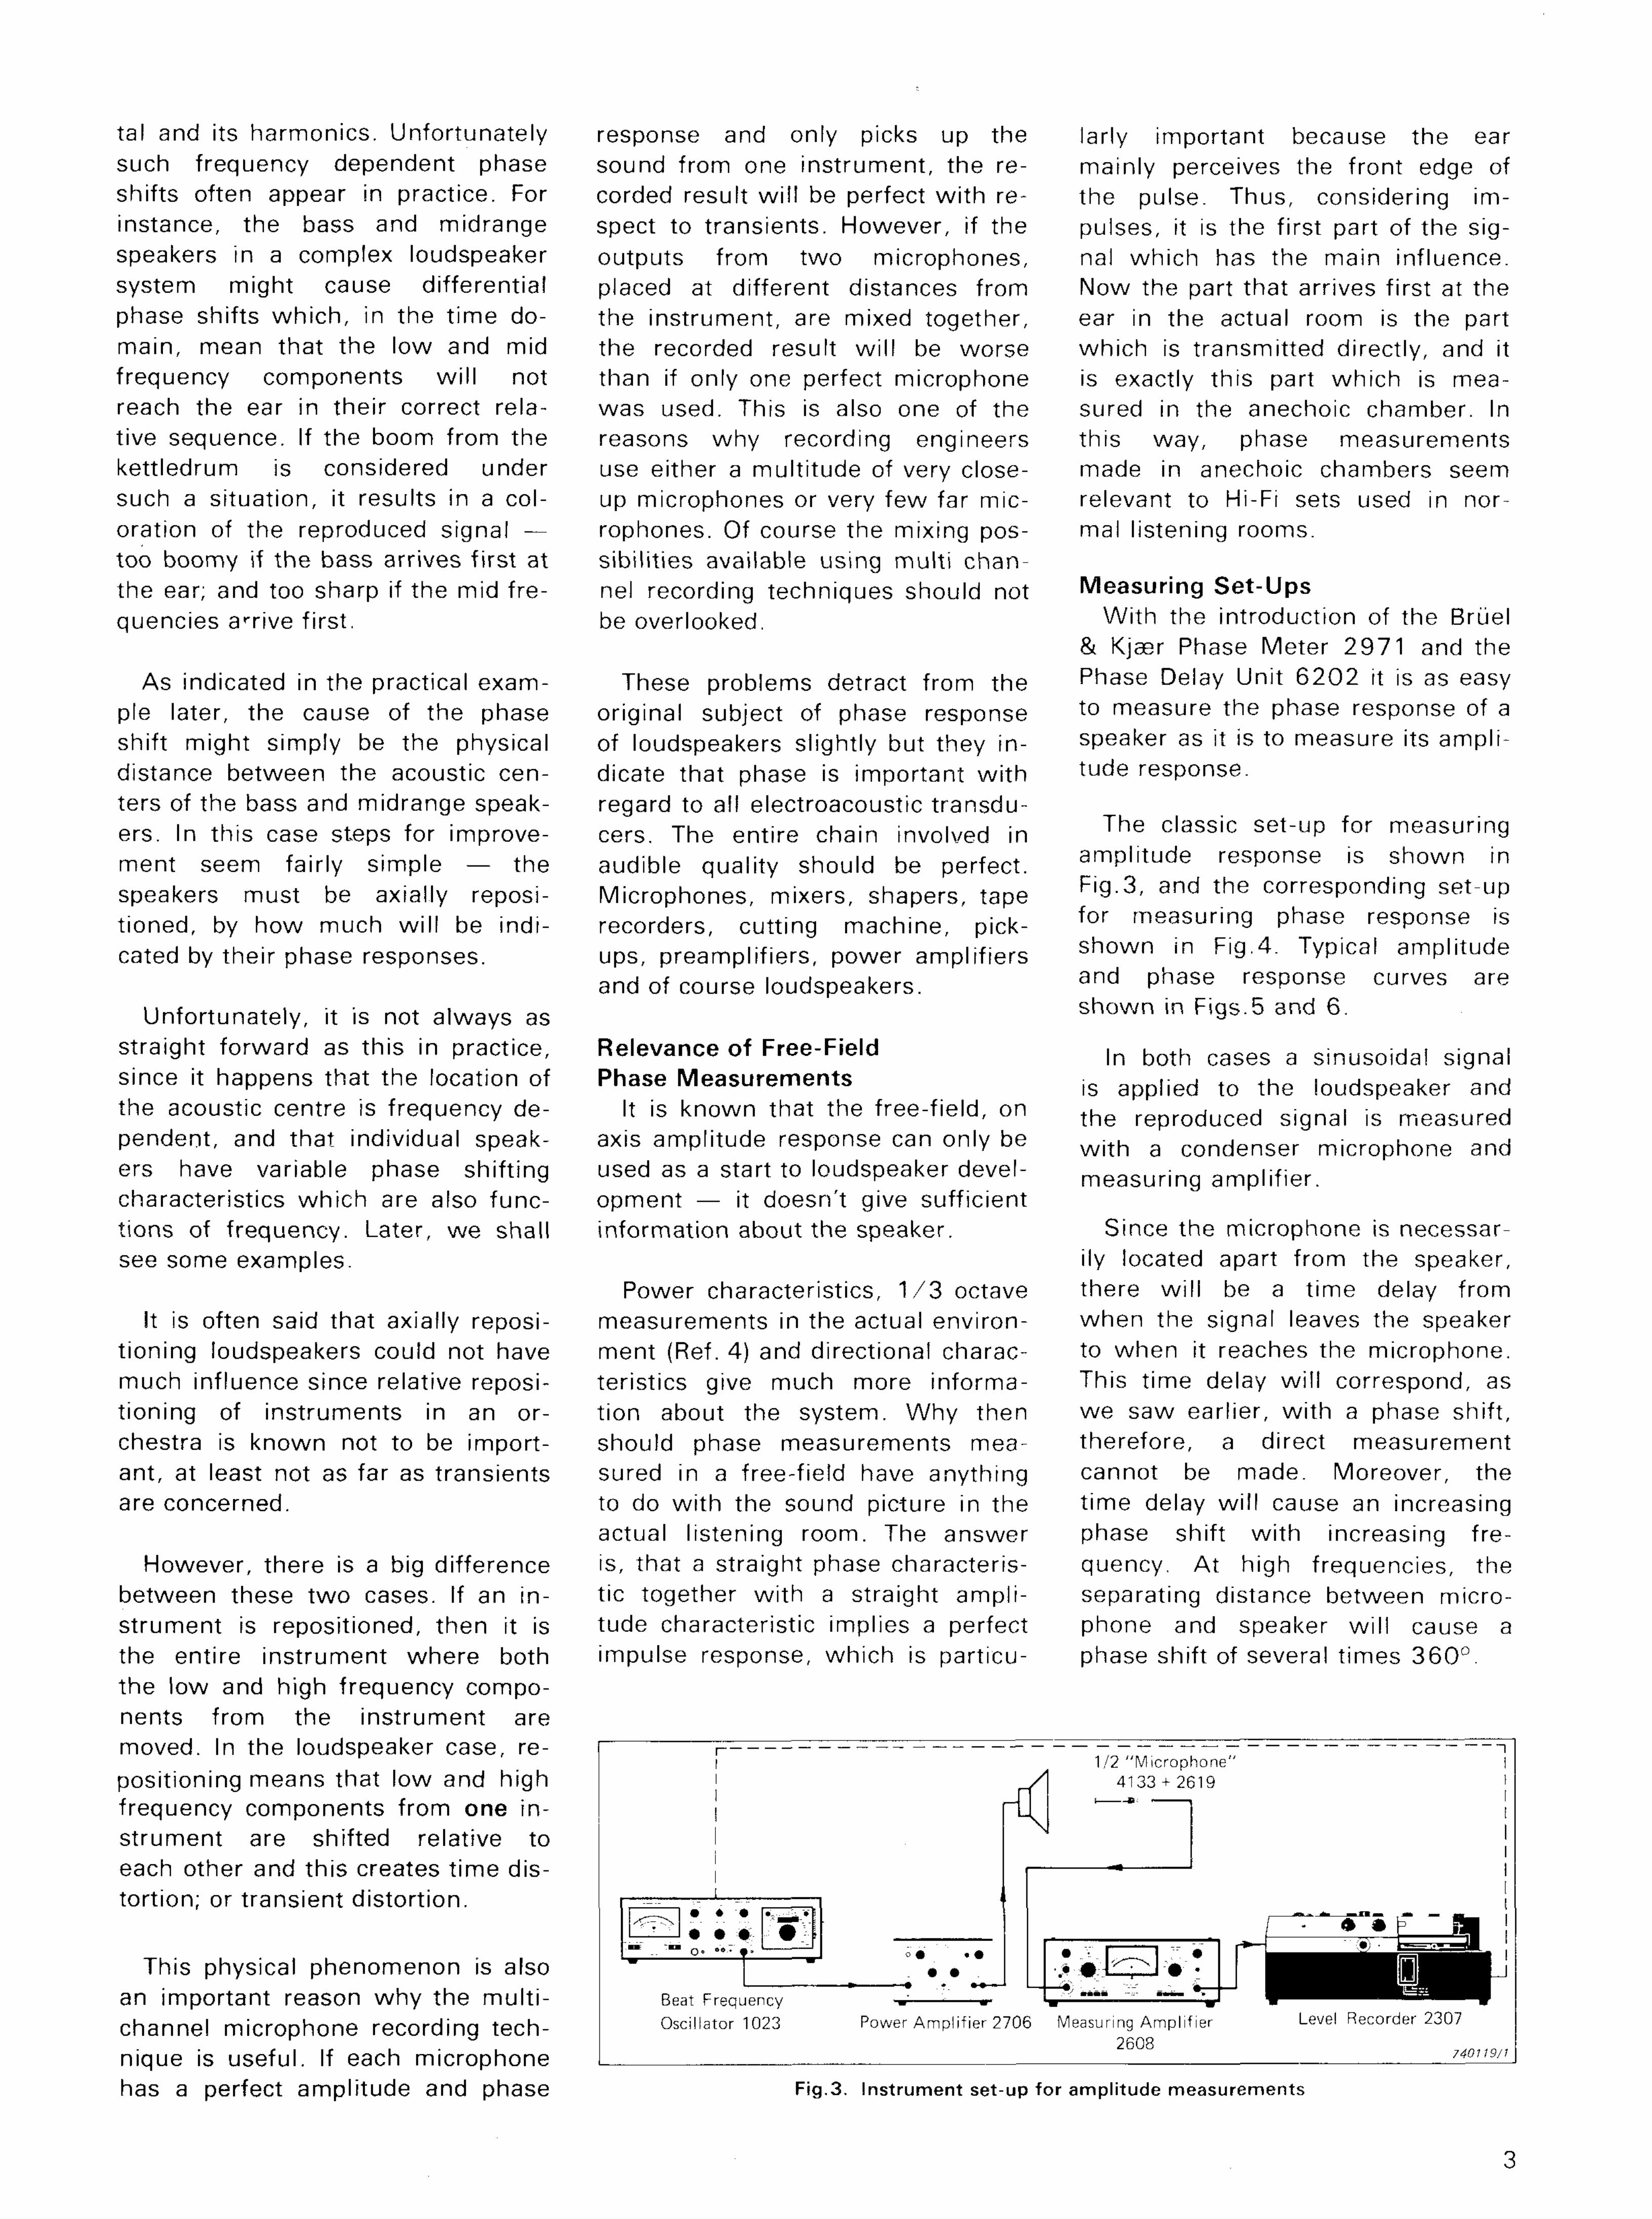
Fig.3. Instrument set-up for amplitude measurements
3
tal and its harmonics. Unfortunately such frequency dependent phase shifts often appear in practice. For instance, the bass and midrange speakers in a complex loudspeaker system might cause differential phase shifts wh ich , in the t ime domain, mean that the low and mid frequency components wi l l not reach the ear in their correct relative sequence. If the boom from the kettledrum is considered under such a situation, it results in a coloration of the reproduced signal — too boomy if the bass arrives first at the ear; and too sharp if the mid frequencies a rrive first.
As indicated in the practical example later, the cause of the phase shift might simply be the physical distance between the acoustic centers of the bass and midrange speakers. In this case steps for improvement seem fairly simple — the speakers must be axially reposi-t ioned, by how much wi l l be indicated by their phase responses.
Unfortunately, it is not always as straight forward as this in practice, since it happens that the location of the acoustic centre is frequency dependent, and that individual speakers have variable phase shift ing characteristics which are also functions of frequency. Later, we shall see some examples.
!t is often said that axially reposit ioning loudspeakers could not have much influence since relative reposit ioning of instruments in an orchestra is known not to be important, at least not as far as transients are concerned.
However, there is a big difference between these two cases. If an instrument is repositioned, then it is the entire instrument where both the low and high frequency components from the instrument are moved. In the loudspeaker case, repositioning means that low and high frequency components from one instrument are shifted relative to each other and this creates t ime distort ion; or transient distort ion.
This physical phenomenon is also an important reason why the mul t i channel microphone recording technique is useful. If each microphone has a perfect amplitude and phase
response and only picks up the larly important because the ear sound from one instrument, the re- mainly perceives the front edge of corded result wi l l be perfect w i th re- the pulse. Thus, considering im-spect to transients. However, if the pulses, it is the first part of the sig-outputs from two microphones, nal which has the main influence. placed at different distances from Now the part that arrives first at the the instrument, are mixed together, ear in the actual room is the part the recorded result wi l l be worse which is transmitted directly, and it than if only one perfect microphone is exactly this part wh ich is mea-was used. This is also one of the sured in the anechoic chamber. In reasons why recording engineers this way, phase measurements use either a mult i tude of very close- made in anechoic chambers seem up microphones or very few far mic- relevant to Hi-Fi sets used in nor-rophones. Of course the mixing pos- mal listening rooms. sibilities available using mult i channel recording techniques should not Measuring Set-Ups be overlooked. With the introduction of the Briiel
& Kjaer Phase Meter 2971 and the These problems detract from the P h a s e Delay Unit 6 2 0 2 it is as easy
original subject of phase response t 0 measure the phase response of a of loudspeakers slightly but they in- speaker as it is to measure its ampli-dicate that phase is important w i th t u d e response. regard to all electroacoustic transducers. The entire chain involved in T h e c l a s s i c s e t " u P f o r measuring audible quality should be perfect. amplitude response is shown in Microphones, mixers, shapers, tape F | 9 - 3 ' a n d t h e corresponding set-up recorders, cutting machine, pick- f o r measuring phase response is ups, preamplif iers, power amplifiers s h o w n i n F | 9 - 4 - T yP | C a l amplitude and of course loudspeakers. a n d P h a s e response curves are
shown in Figs.5 and 6.
Relevance of Free-Field ,n b o t h c a s e s a s m u s o i d a ( s i g n a | Phase Measurements |S a p p l j e d t 0 t h e ! o u d s p e a k e r and
It is known that the free-f ield, on t h e r e p r o d u c e d signal is measured axis amplitude response can only be w j t h g c o n d e n s e r m jC rophone and used as a start to loudspeaker devel- measuring amplif ier. opment — it doesn't give sufficient information about the speaker. Since the microphone is necessar
ily located apart from the speaker, Power characteristics, 1 /3 octave there wi l l be a t ime delay from
measurements in the actual environ- when the signal leaves the speaker ment (Ref. 4) and directional charac- to when it reaches the microphone. teristics give much more informa- This time delay wi l l correspond, as t ion about the system. Why then we saw earlier, w i th a phase shift, should phase measurements mea- therefore, a direct measurement sured in a free-field have anything cannot be made. Moreover, the to do wi th the sound picture in the t ime delay wi l l cause an increasing actual listening room. The answer phase shift w i th increasing fre-is, that a straight phase characteris- quency. At high frequencies, the tic together wi th a straight ampli- separating distance between micro-tude characteristic implies a perfect phone and speaker wi l l cause a impulse response, which is particu- phase shift of several t imes 3 6 0 ° .
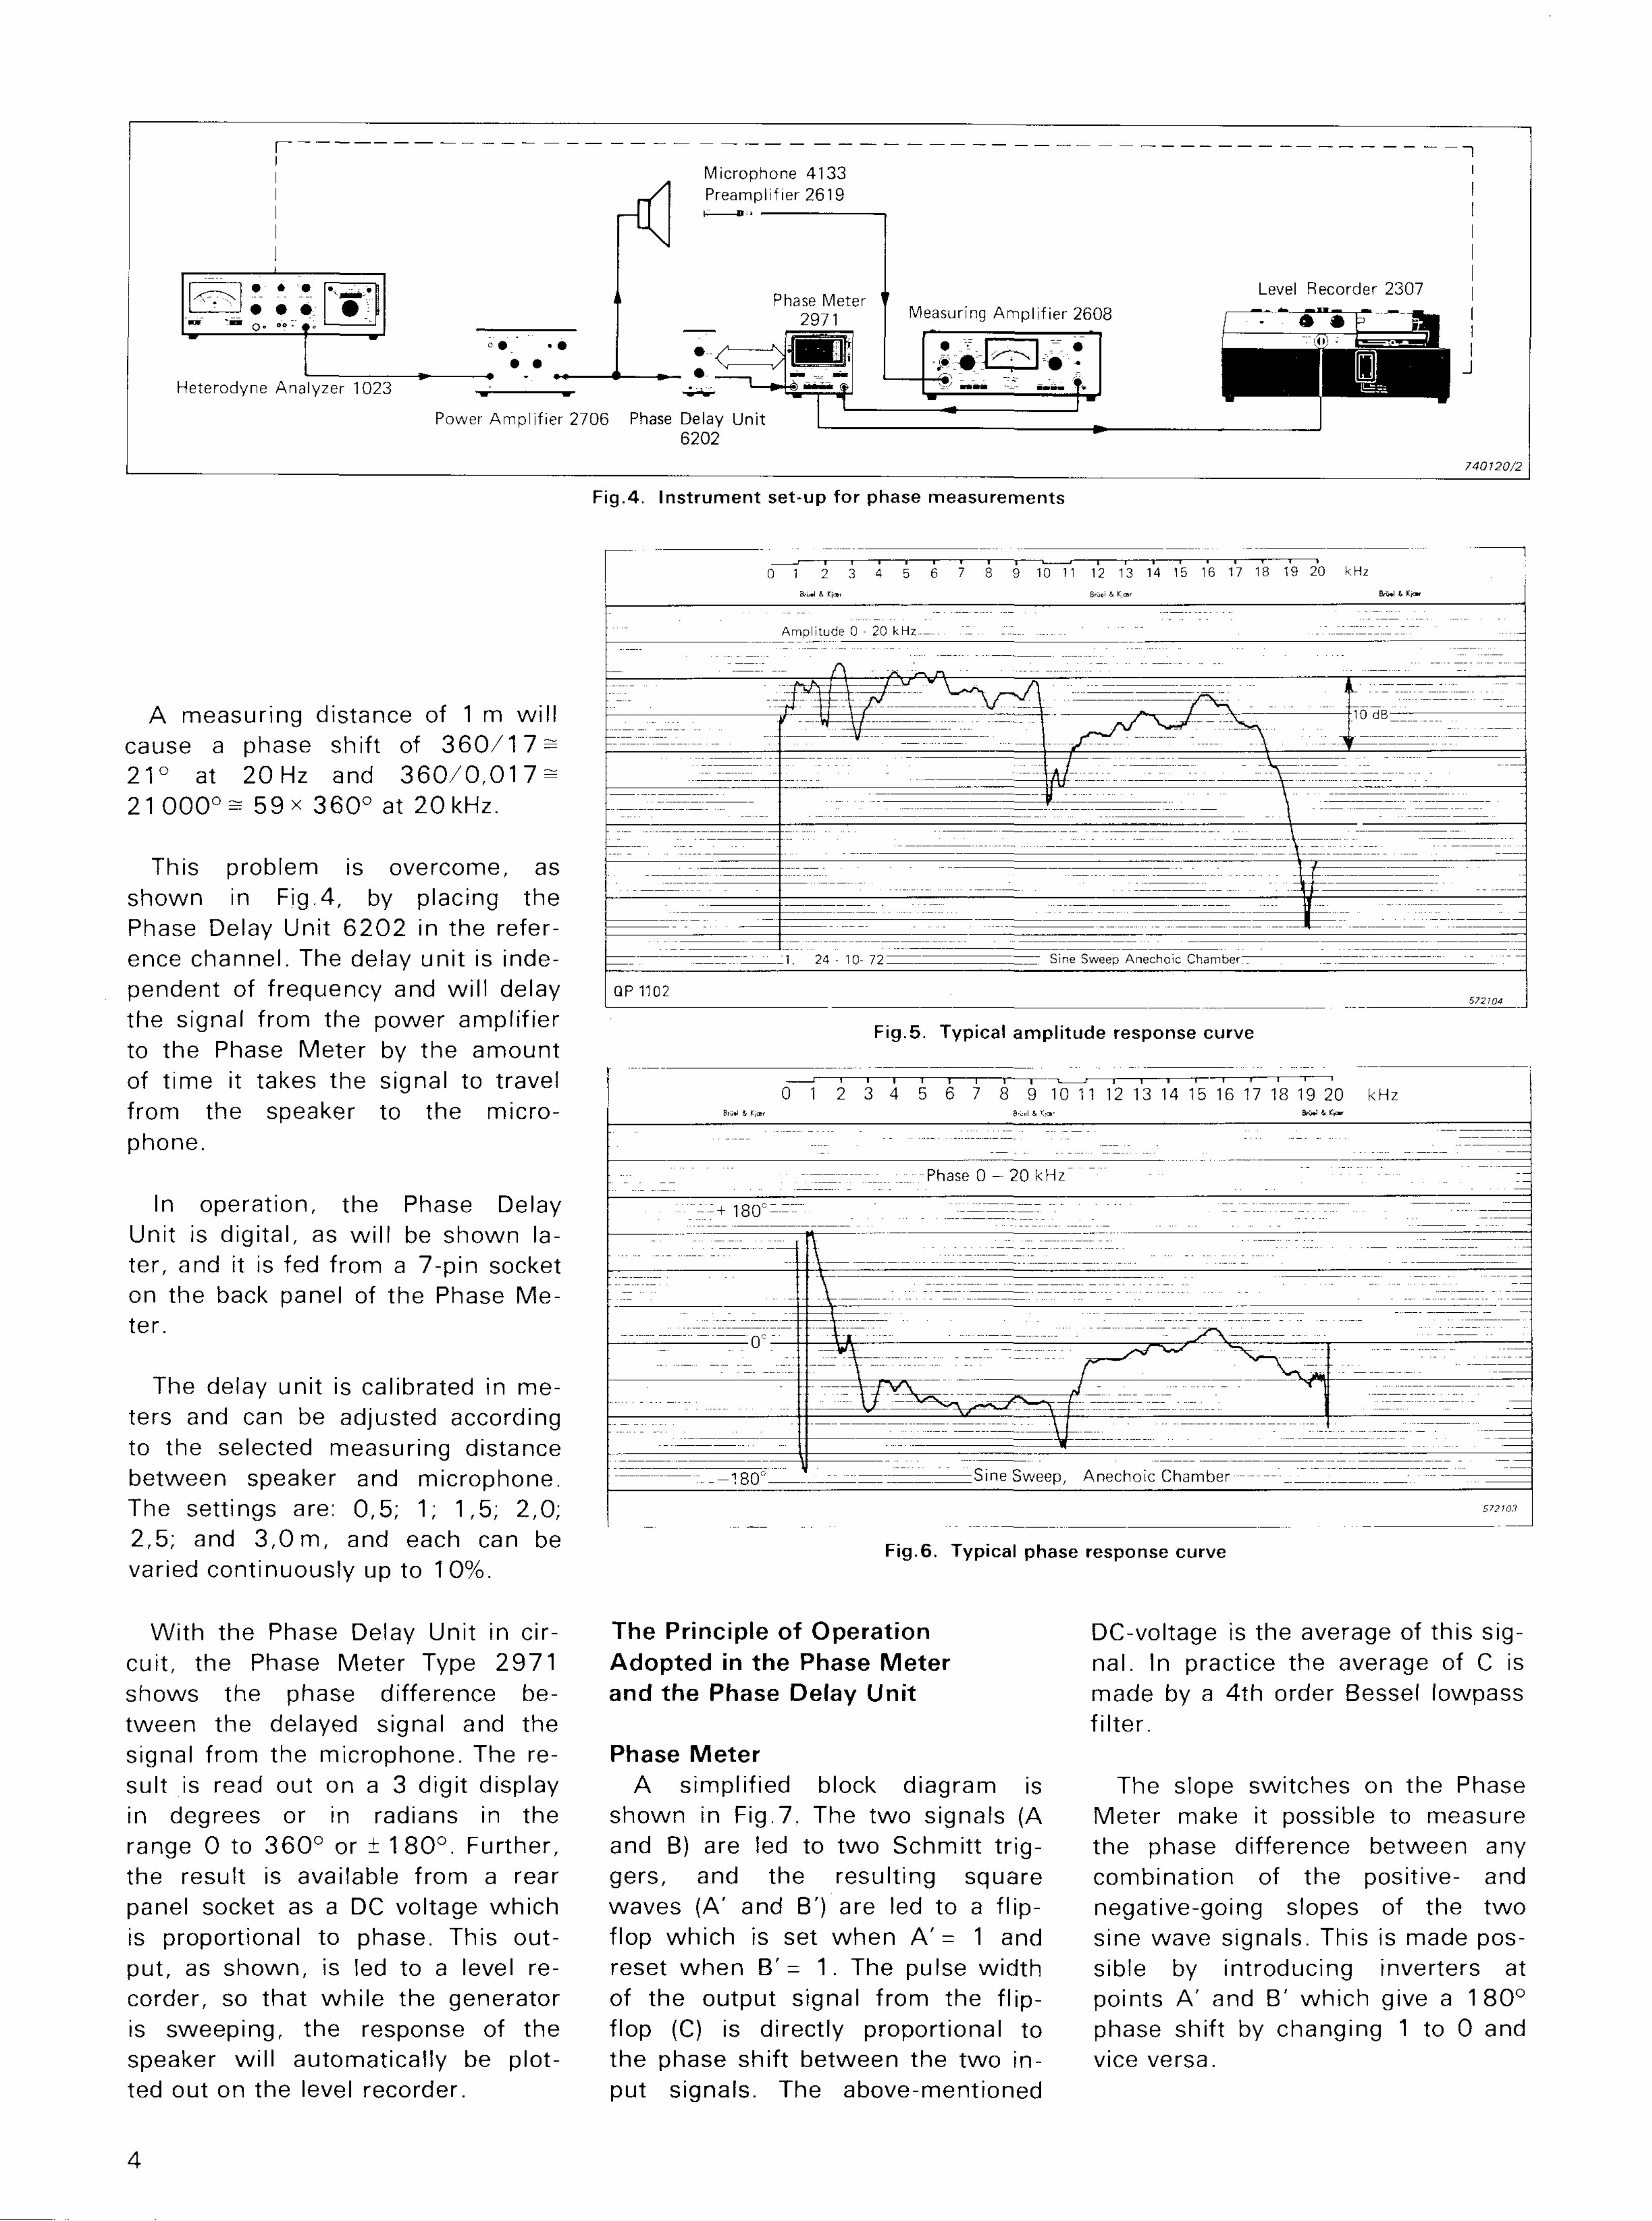
Fig.6. Typical phase response curve
The Principle of Operation DC-voltage is the average of this sig-Adopted in the Phase Meter nal. In practice the average of C is and the Phase Delay Unit made by a 4th order Bessel lowpass
fi l ter. Phase Meter
A simplif ied block diagram is The slope switches on the Phase shown in Fig.7. The two signals (A Meter make it possible to measure and B) are !ed to two Schmitt t r ig- the phase difference between any gers, and the resulting square combination of the positive- and waves (A' and B') are led to a f l ip- negative-going slopes of the two flop which is set when A ' = 1 and sine wave signals. This is made pos-reset when B'= 1. The pulse width sible by introducing inverters at of the output signal from the f l ip- points A' and B' which give a 180° flop (C) is directly proportional to phase shift by changing 1 to 0 and the phase shift between the two in- vice versa. put signals. The above-mentioned
A measuring distance of 1 m wi l l cause a phase shift of 3 6 0 / 1 7 = 21° at 20Hz and 3 6 0 / 0 , 0 1 7 = 21 0 0 0 ° = 5 9 x 3 6 0 ° at 20kHz.
This problem is overcome, as shown in Fig.4, by placing the Phase Delay Unit 6 2 0 2 in the reference channel. The delay unit is independent of frequency and wi l l delay the signal from the power amplifier to the Phase Meter by the amount of t ime it takes the signal to travel from the speaker to the microphone.
In operation, the Phase Delay Unit is digital, as wi l l be shown later, and it is fed from a 7-pin socket on the back panel of the Phase Meter.
The delay unit is calibrated in meters and can be adjusted according to the selected measuring distance between speaker and microphone. The settings are: 0,5; 1; 1,5; 2,0; 2,5; and 3 , 0 m , and each can be varied continuously up to 10%.
With the Phase Delay Unit in circuit, the Phase Meter Type 2971 shows the phase difference between the delayed signal and the signal from the microphone. The result is read out on a 3 digit display in degrees or in radians in the range 0 to 3 6 0 ° or ± 180° . Further, the result is available from a rear panel socket as a DC voltage which is proportional to phase. This output, as shown, is led to a level recorder, so that whi le the generator is sweeping, the response of the speaker wi l l automatically be plotted out on the level recorder.
4
Fig.4. Instrument set-up for phase measurements
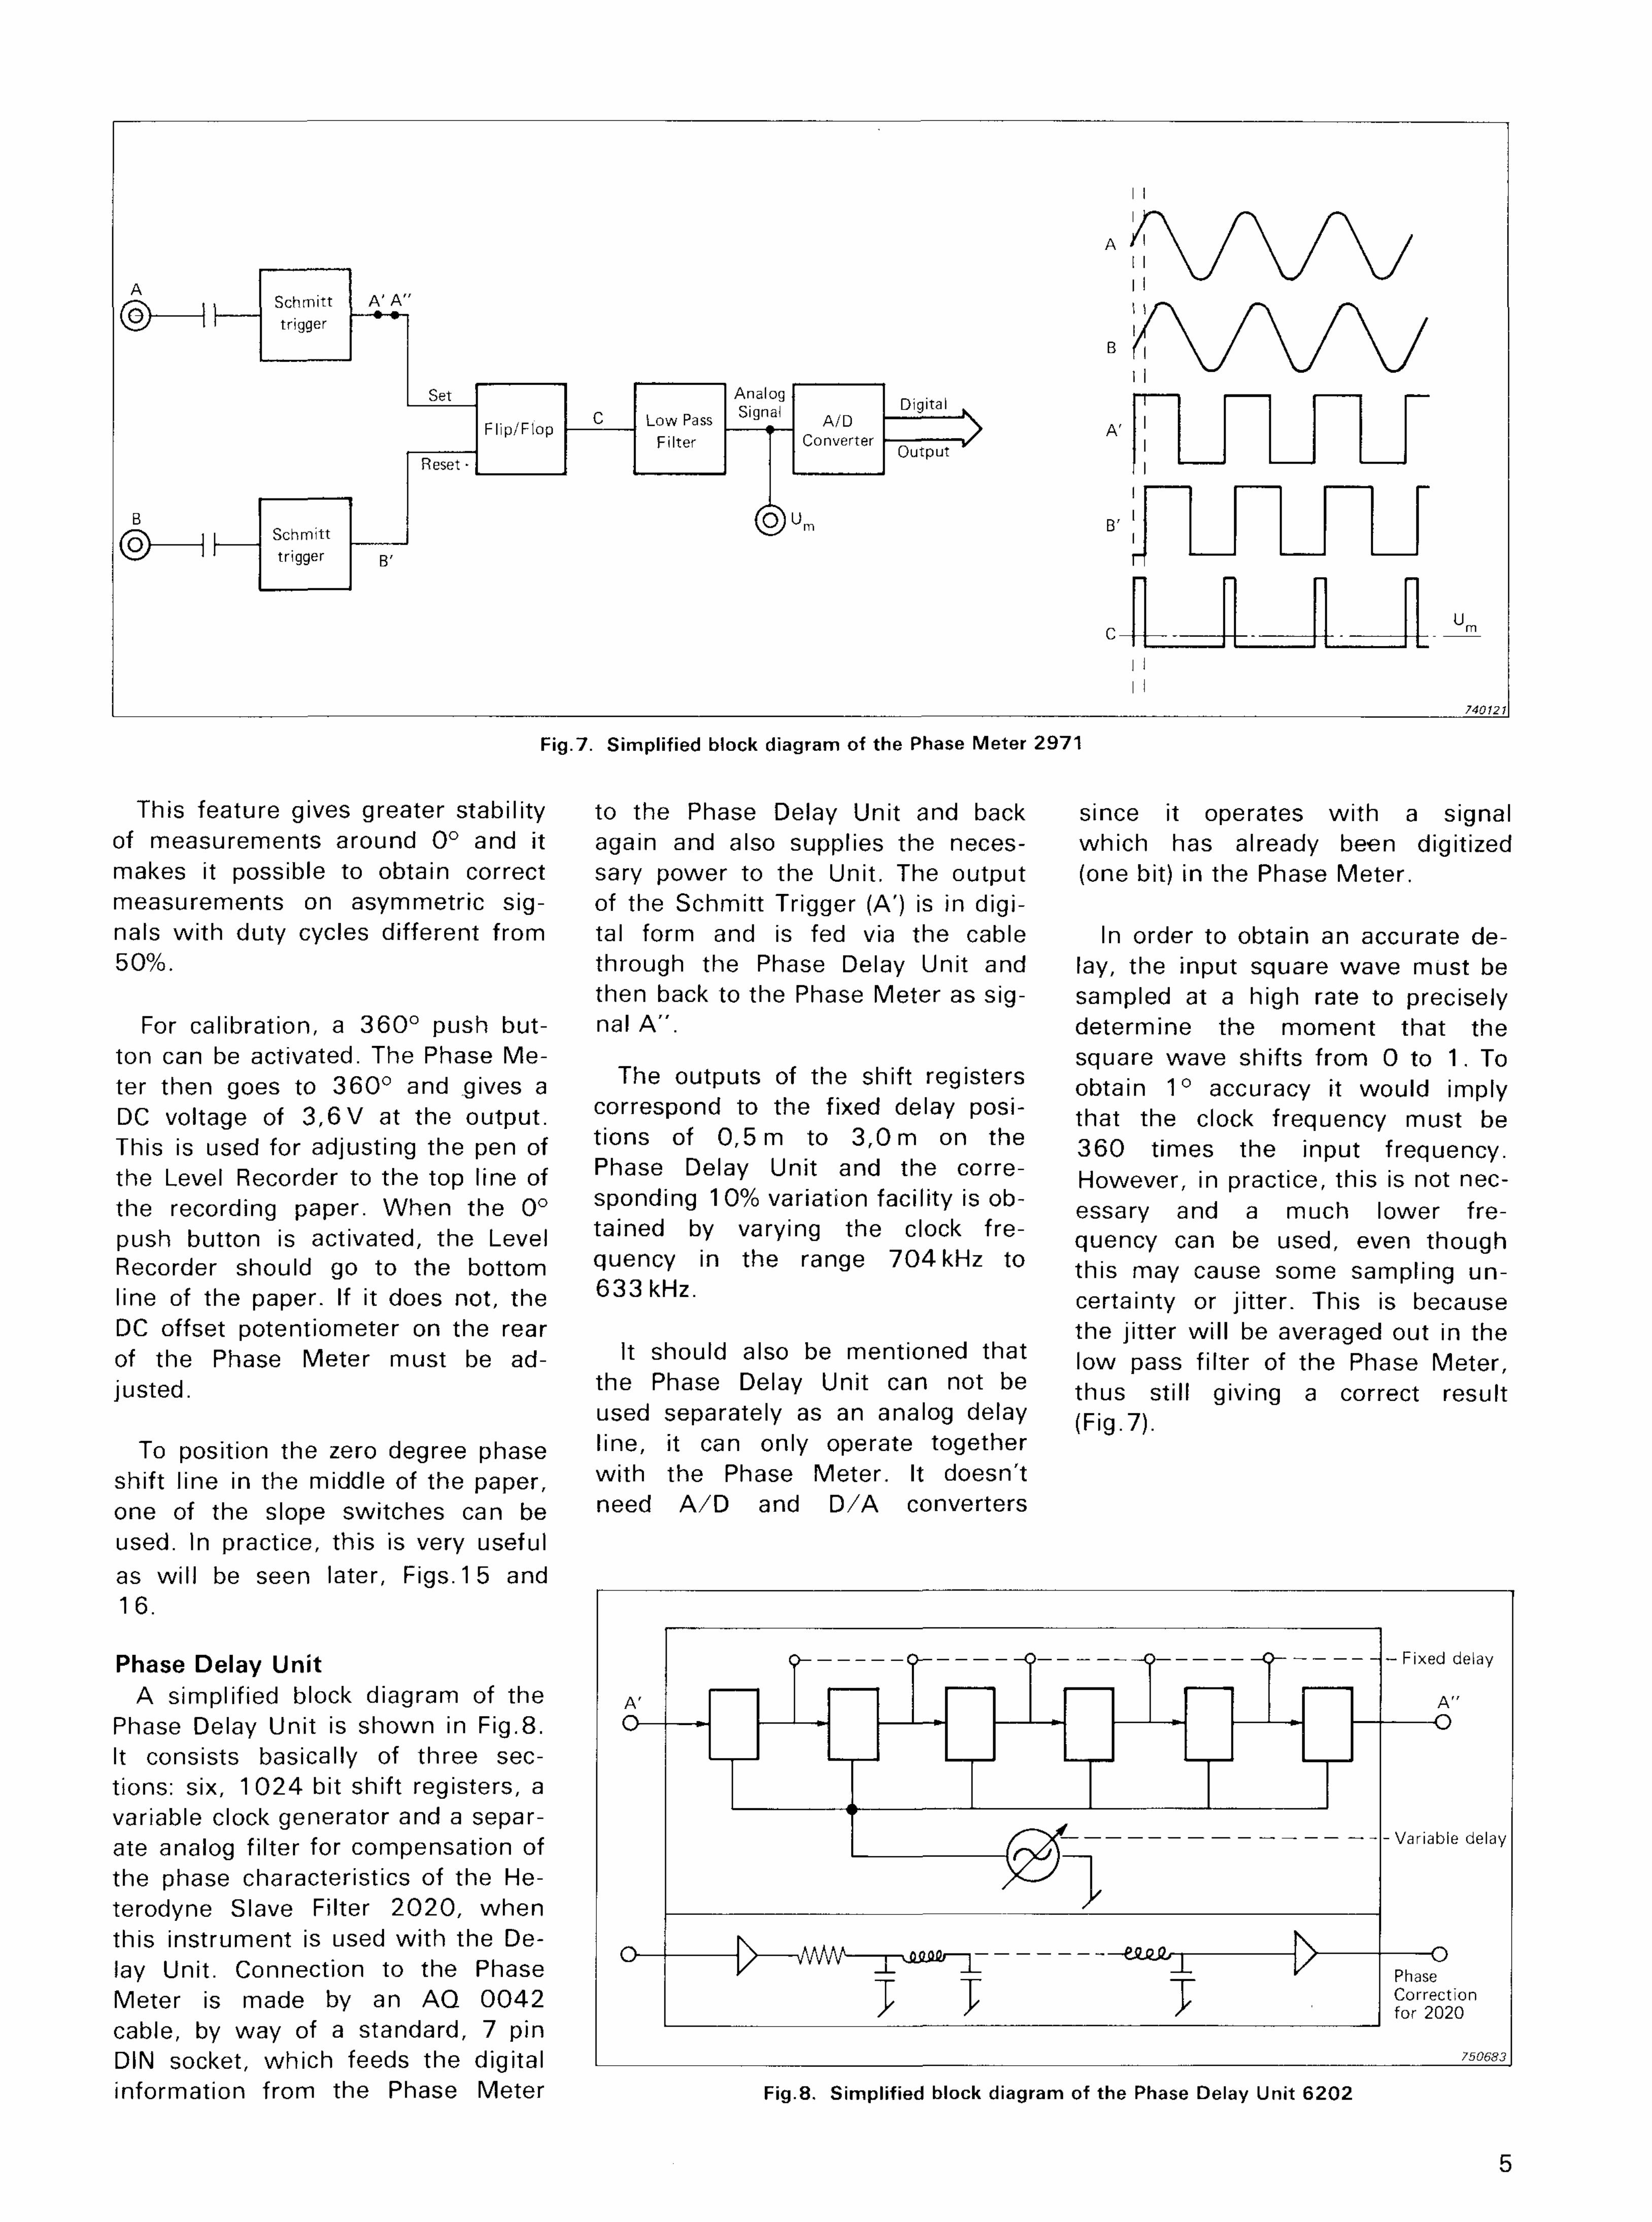
Fig.8. Simplif ied block diagram of the Phase Delay Unit 6202
5
This feature gives greater stability of measurements around 0° and it makes it possible to obtain correct measurements on asymmetric signals w i th duty cycles different from 5 0%.
For calibration, a 3 6 0 ° push button can be activated. The Phase Meter then goes to 3 6 0 ° and gives a DC voltage of 3 , 6 V at the output. This is used for adjusting the pen of the Level Recorder to the top line of the recording paper. When the 0° push button is activated, the Level Recorder should go to the bottom line of the paper. If it does not, the DC offset potentiometer on the rear of the Phase Meter must be adjusted.
To position the zero degree phase shift line in the middle of the paper, one of the slope switches can be used. In practice, this is very useful as wi l l be seen later, Figs. 15 and 16.
Phase Delay Unit A simplif ied block diagram of the
Phase Delay Unit is shown in Fig.8. It consists basically of three sections: six, 1 0 2 4 bit shift registers, a variable clock generator and a separate analog filter for compensation of the phase characteristics of the Heterodyne Slave Filter 2 0 2 0 , when this instrument is used w i th the Delay Unit. Connection to the Phase Meter is made by an AQ 0 0 4 2 cable, by way of a standard, 7 pin DIN socket, which feeds the digital information from the Phase Meter
Fig.7. Simplif ied block diagram of the Phase Meter 2971
to the Phase Delay Unit and back since it operates w i th a signal again and also supplies the neces- which has already been digitized sary power to the Unit. The output (one bit) in the Phase Meter. of the Schmitt Trigger (A') is in digital form and is fed via the cable In order to obtain an accurate de-through the Phase Delay Unit and lay, the input square wave must be then back to the Phase Meter as sig- sampled at a high rate to precisely nal A " . determine the moment that the
square wave shifts from 0 to 1. To The outputs of the shift registers o b t a m 1 0 a c c u r a c y i t w o u l d j m ,
correspond to the fixed delay posi- t h a t t h e d o c k f r e q u e n c y m u s t b e
t ions of 0,5 m to 3,0 m on the 36Q t j m e s t h e j n p u t f r e q u e n c y
Phase Delay Unit and the corre- H o w e v e r ; i n p r a c t i c e , t h i s i s n o t n e c -sponding 10% variation facility is ob- e s s g r y a n d g m u c h | Q w e r f r e_ tamed by varying the clock fre- q u e n c y c a n b e u s e d e v e n t h o u g h
quency in the range 7 0 4 kHz to t h j s m a y c a u s e S Q m e s a m p | i n g u n _ z ' certainty or j i t ter. This is because
the jitter wi l l be averaged out in the It should also be mentioned that | o w p a s s f j | t e r o f t h e p h a s e M e t ^
the Phase Delay Unit can not be t h u s s t j | | g j v j n g g c o r r e c t r e s u | t
used separately as an analog delay ,p- 7v l ine, it can only operate together wi th the Phase Meter. It doesn't need A / D and D/A converters
Interpretation of The first thing to note f rom these Phase Response Curves curves is the linear frequency
Ampl i tude response curves are scales. The linear y-scale made us-wel l known. Here it is the shape of ing a linear potentiometer ZR 0 0 0 2 the curve which is important whi le in the Level Recorder doesn't seem it does not matter if the whole surprising, but the linear x-scale curve is for instance, shifted 10dB may seem a little unusual. higher or lower as long as it does not go down into noise or up into On amplitude response curves, log-distort ion. arithmic scales are almost always
used simply because the ear re-Interpretation of phase response sponds logarithmically to frequency
curves, however, is somewhat dif- changes, and although logarithmic ferent, and cannot be viewed in the phase response curves could be same manner as an amplitude re- drawn as easily as amplitude response curve. sponse curves, they are often diff i
cult to interpret. Greater ease of in-Practical examples of correspond- terpretation is the only reason for
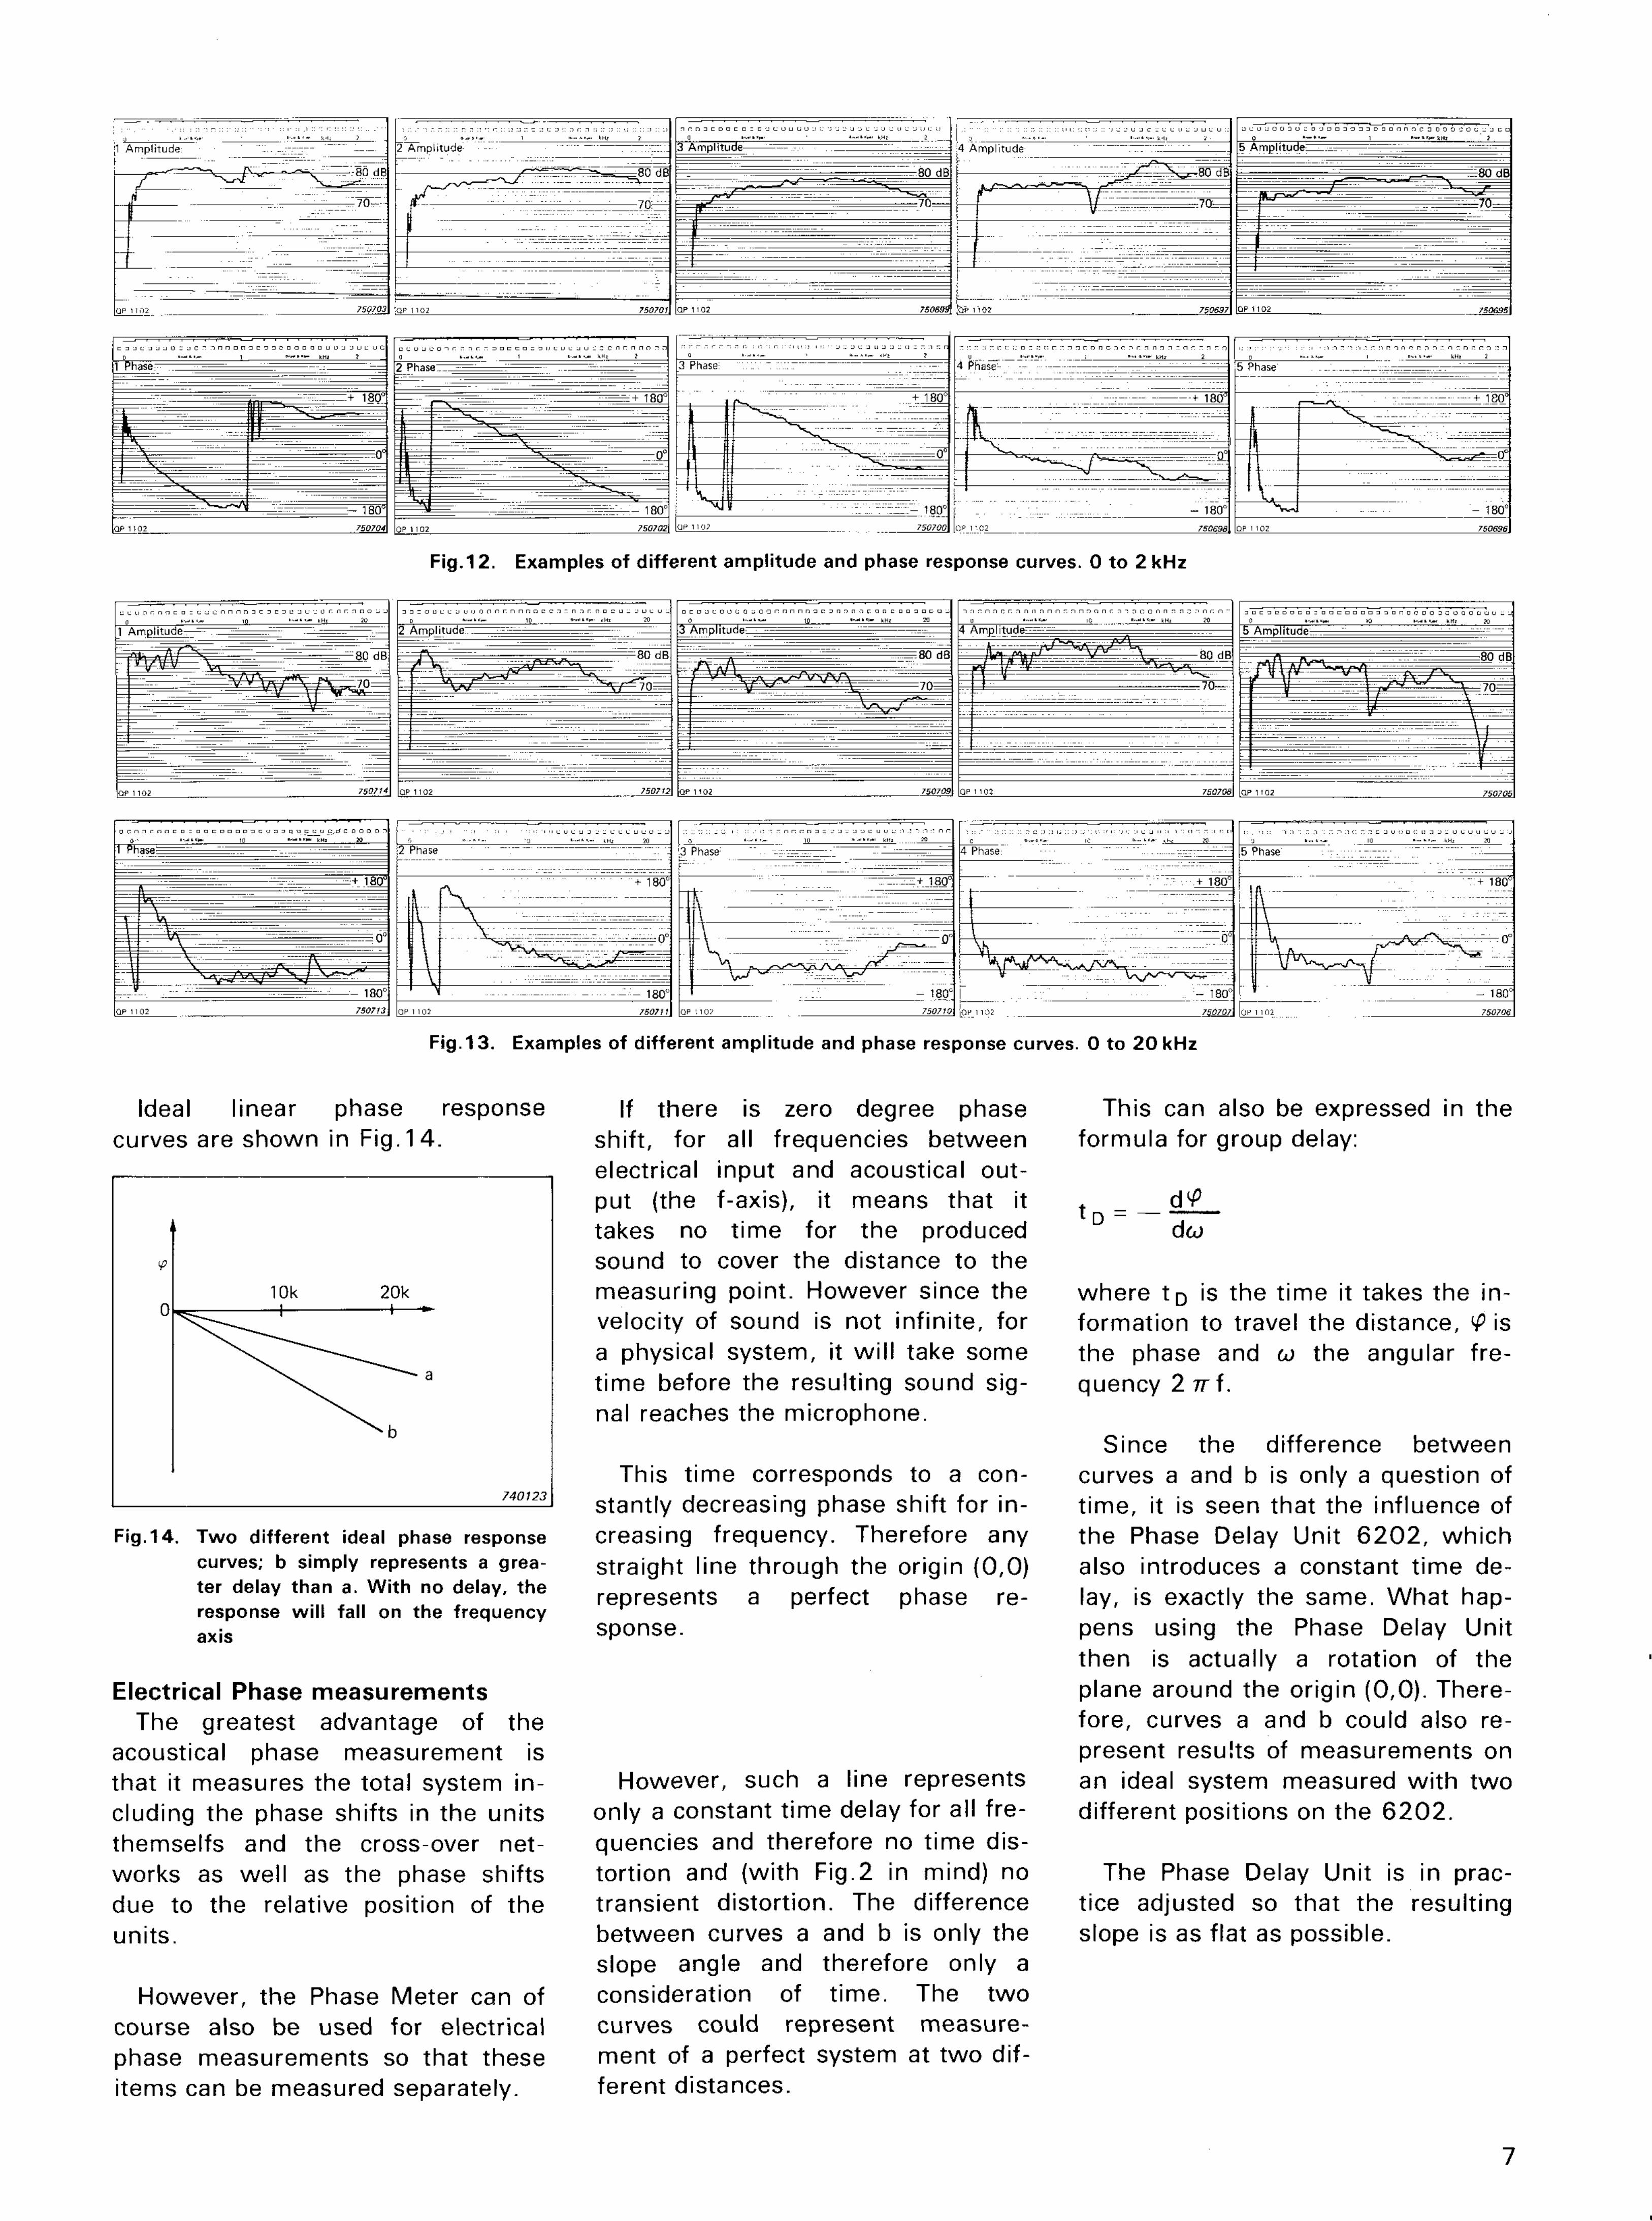
ing amplitude and phase response linear phase response curves. curves are shown in the range 0 to 2 kHz in Fig.12 and in the range 0 to 20kHz in Fig. 13. These curves are taken from Staffeldts "Hojttaler-unders0gelse" (Ref.3).
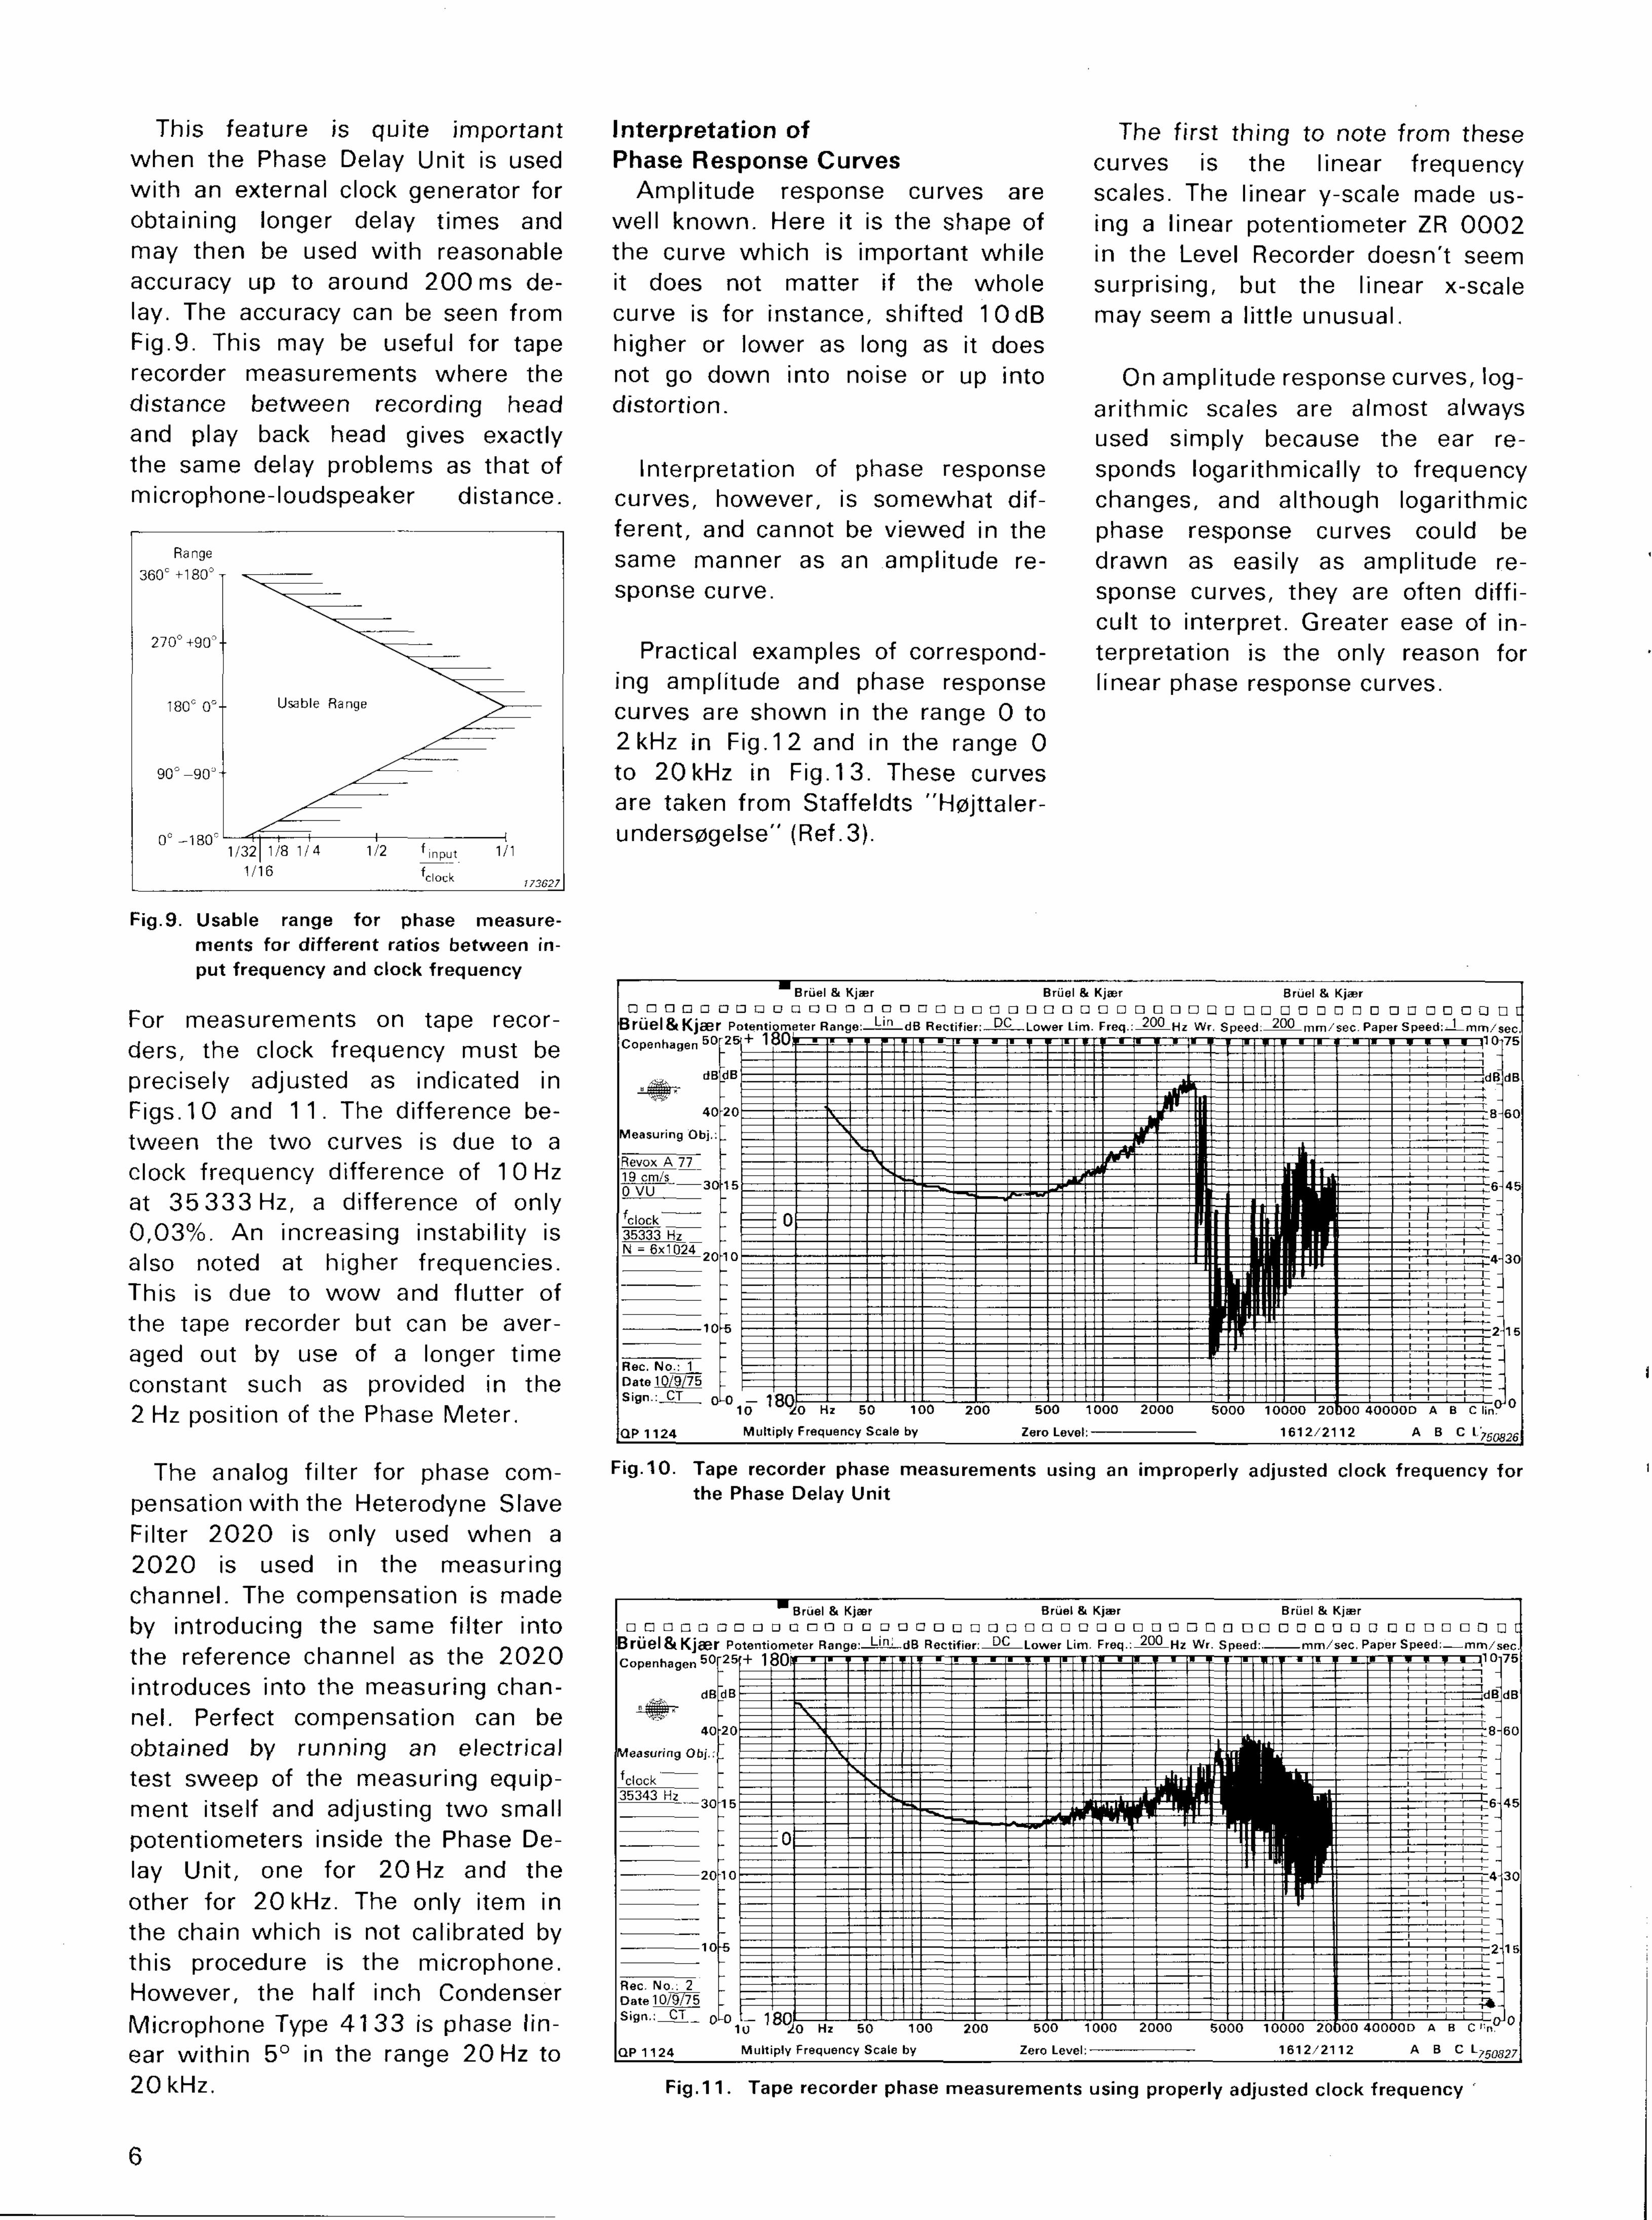
This feature is quite important when the Phase Delay Unit is used w i th an external clock generator for obtaining longer delay times and may then be used w i th reasonable accuracy up to around 2 0 0 ms delay. The accuracy can be seen from Fig.9. This may be useful for tape recorder measurements where the distance between recording head and play back head gives exactly the same delay problems as that of microphone-loudspeaker distance.
Fig.9. Usable range for phase measurements for different ratios between input frequency and clock frequency
For measurements on tape recorders, the clock frequency must be precisely adjusted as indicated in Figs. 10 and 1 1 . The difference between the two curves is due to a clock frequency difference of 1 0 Hz at 35 333 Hz, a difference of only 0 ,03%. An increasing instability is also noted at higher frequencies. This is due to w o w and flutter of the tape recorder but can be averaged out by use of a longer t ime constant such as provided in the 2 Hz position of the Phase Meter.
The analog filter for phase compensation w i th the Heterodyne Slave Filter 2 0 2 0 is only used when a 2 0 2 0 is used in the measuring channel. The compensation is made by introducing the same filter into the reference channel as the 2 0 2 0 introduces into the measuring channel. Perfect compensation can be obtained by running an electrical test sweep of the measuring equipment itself and adjusting two small potentiometers inside the Phase Delay Unit, one for 20 Hz and the other for 20 kHz. The only item in the chain which is not calibrated by this procedure is the microphone. However, the half inch Condenser Microphone Type 41 33 is phase l inear w i th in 5° in the range 20 Hz to 20 kHz.
6
Fig.10. Tape recorder phase measurements using an improperly adjusted clock frequency for the Phase Delay Unit
F ig .11 . Tape recorder phase measurements using properly adjusted clock frequency
r i g . 1 3 . Examples ot di f ferent ampl i tude and phase response curves. 0 to 2 0 kHz
Ideal linear phase response If there is zero degree phase This can also be expressed in the curves are shown in Fig. 14. shift, for all frequencies between formula for group delay:
Fig.12. Examples of d i f ferent ampl i tude and phase response curves. 0 to 2 kHz
If there is zero degree phase This can also be expressed in the shift, for all frequencies between formula for group delay: electrical input and acoustical output (the f-axis), it means that it t d l takes no time for the produced dco sound to cover the distance to the measuring point. However since the where t D is the time it takes the in-velocity of sound is not infinite, for formation to travel the distance, ^ is a physical system, it wi l l take some the phase and co the angular fre-time before the resulting sound sig- quency 2ni. nal reaches the microphone.
Since the difference between This time corresponds to a con- curves a and b is only a question of
stantly decreasing phase shift for in- t ime, it is seen that the influence of creasing frequency. Therefore any the Phase Delay Unit 6202 , which straight line through the origin (0,0) also introduces a constant time de-represents a perfect phase re- lay, is exactly the same. What hap-sponse. pens using the Phase Delay Unit
then is actually a rotation of the plane around the origin (0,0). Therefore, curves a and b could also represent results of measurements on
However, such a line represents an ideal system measured wi th two only a constant time delay for all fre- different positions on the 6202 . quencies and therefore no time distortion and (with Fig.2 in mind) no The Phase Delay Unit is in prac-transient distortion. The difference tice adjusted so that the resulting between curves a and b is only the slope is as flat as possible. slope angle and therefore only a consideration of t ime. The two curves could represent measurement of a perfect system at two different distances.
7
Fig. 14. T w o di f ferent ideal phase response curves; b simply represents a greater delay than a. Wi th no delay, the response w i l l fal l on the frequency axis
Electrical Phase measurements The greatest advantage of the
acoustical phase measurement is that it measures the total system including the phase shifts in the units themselfs and the cross-over networks as well as the phase shifts due to the relative position of the units.
However, the Phase Meter can of course also be used for electrical phase measurements so that these items can be measured separately.
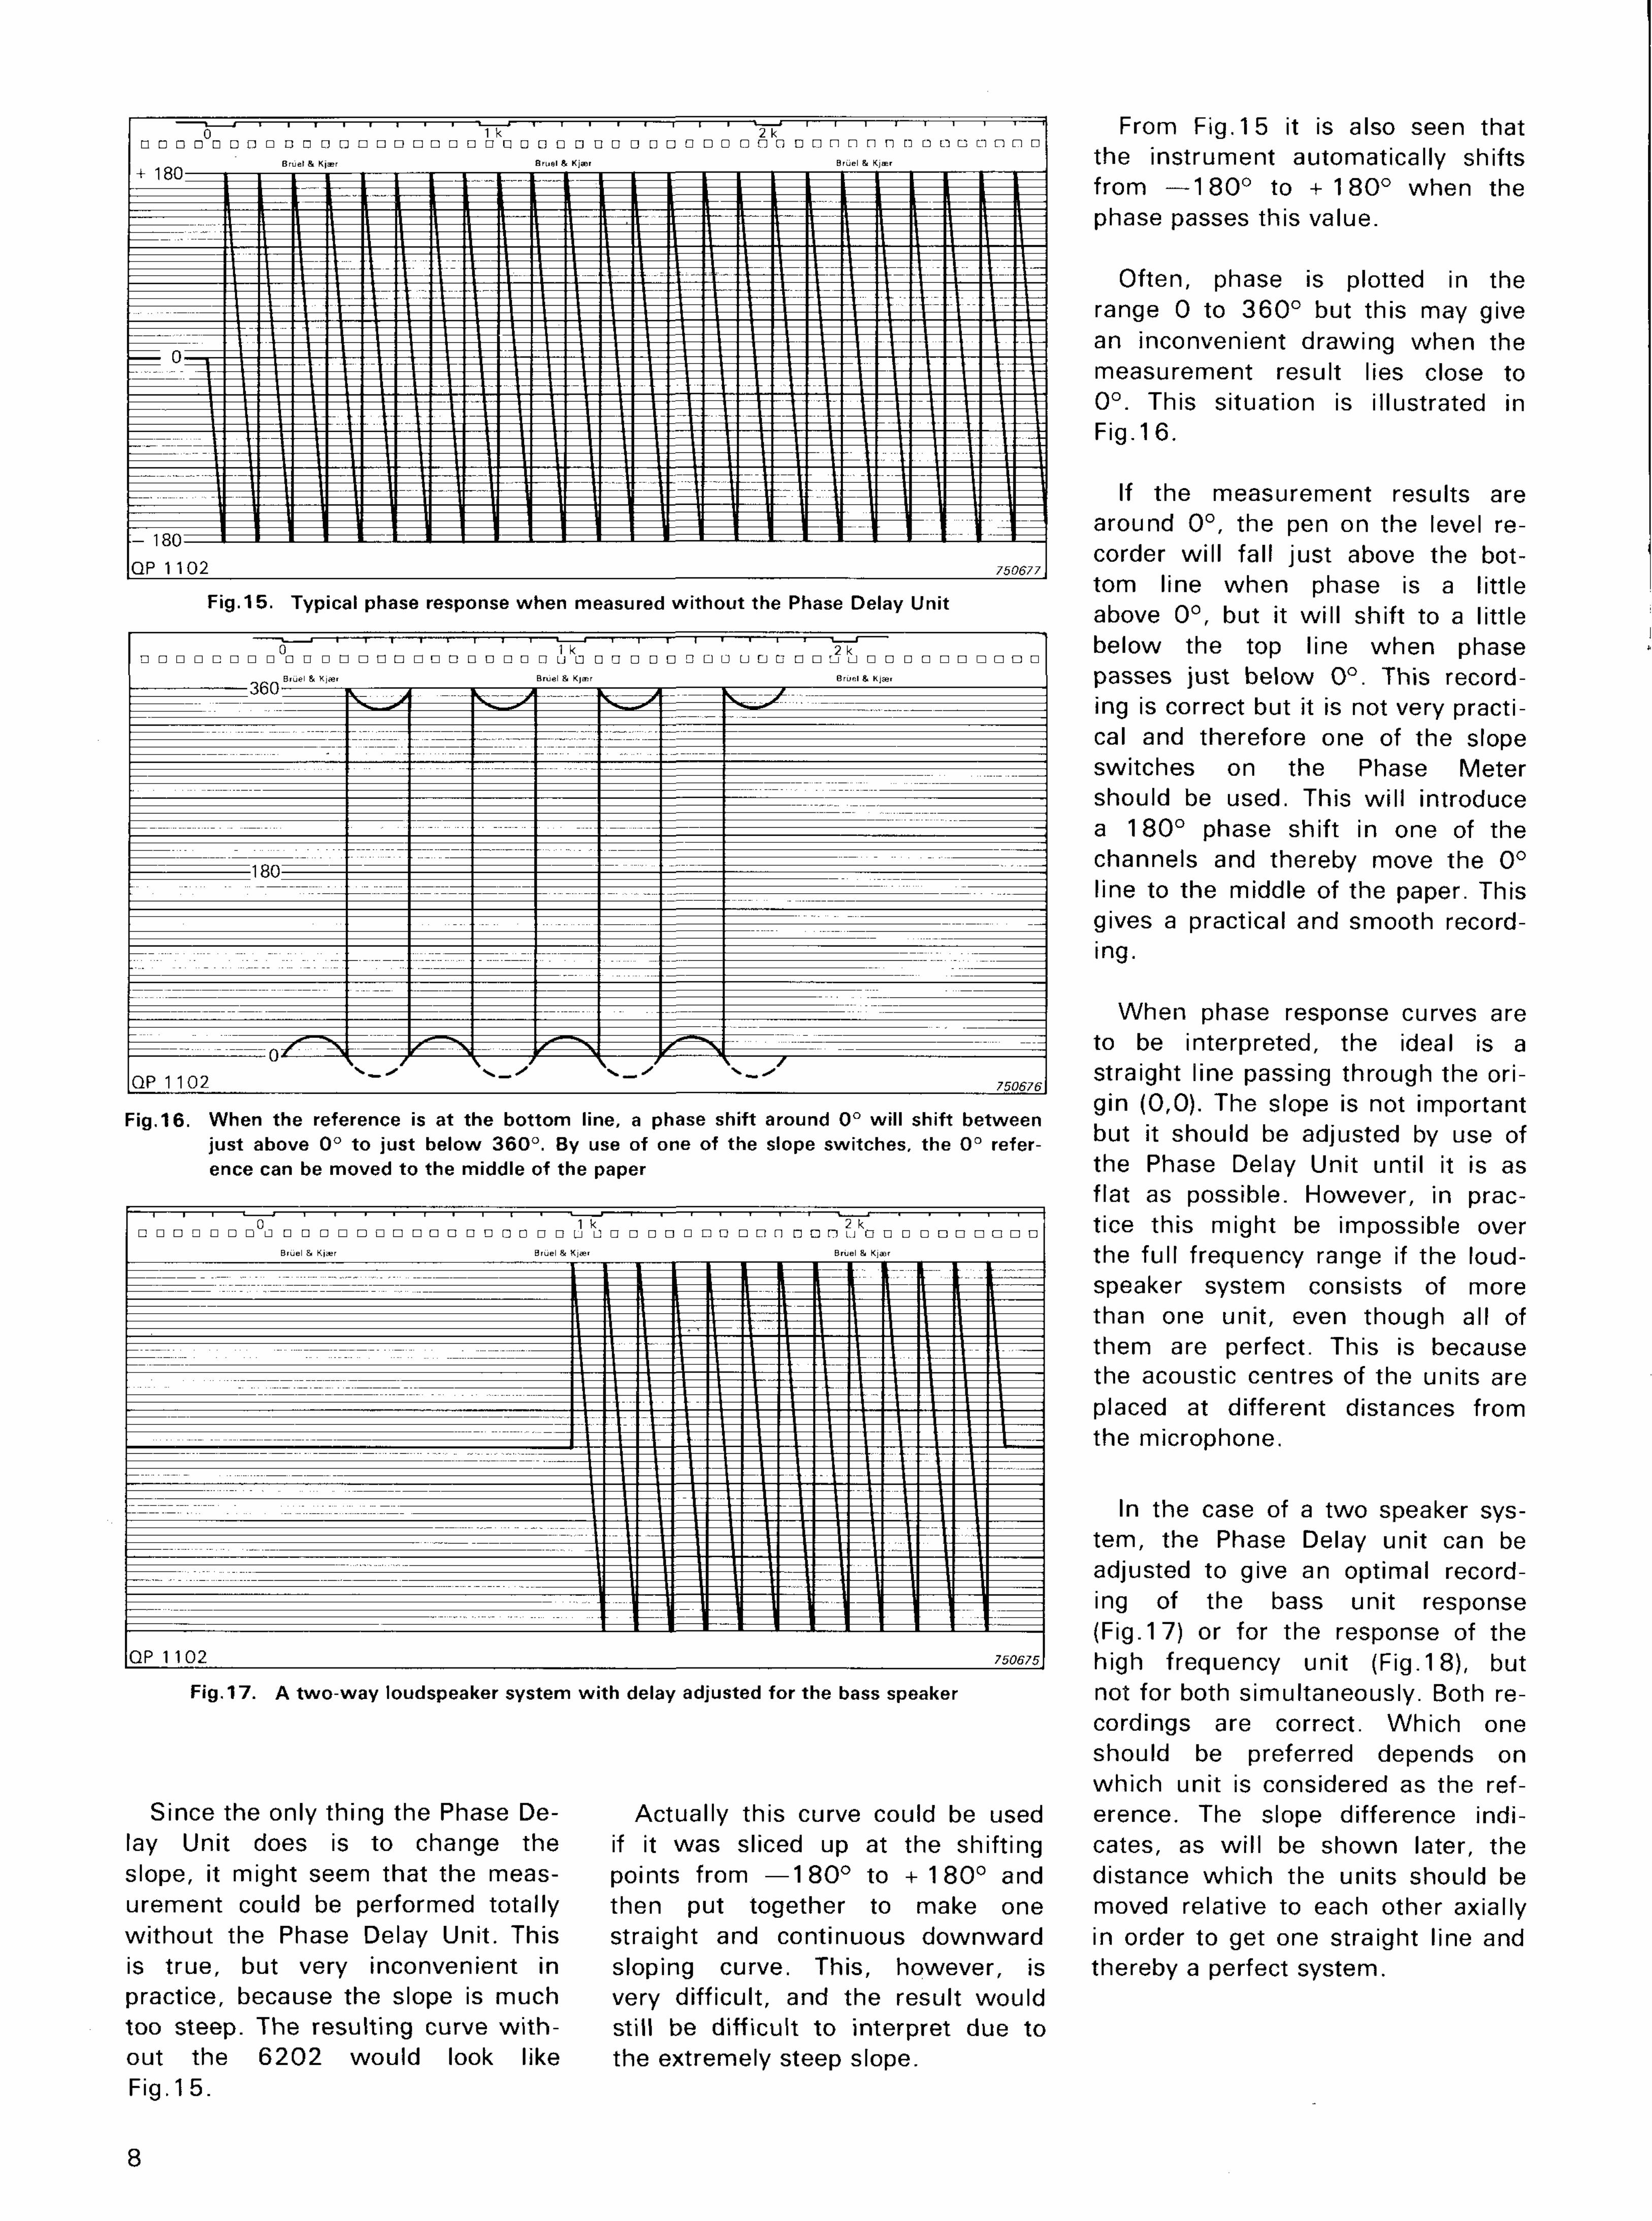
From Fig. 15 it is also seen that the instrument automatically shifts from — 1 8 0 ° to + 1 8 0 ° when the phase passes this value.
Often, phase is plotted in the range 0 to 360° but this may give an inconvenient drawing when the measurement result lies close to 0° . This situation is illustrated in Fig.16.
If the measurement results are around 0 ° , the pen on the level recorder wil l fall just above the bottom line when phase is a little above 0 ° , but it wi l l shift to a little below the top line when phase passes just below 0 ° . This recording is correct but it is not very practical and therefore one of the slope switches on the Phase Meter should be used. This wil l introduce a 180° phase shift in one of the channels and thereby move the 0° line to the middle of the paper. This gives a practical and smooth recording.
When phase response curves are to be interpreted, the ideal is a straight line passing through the origin (0,0). The slope is not important but it should be adjusted by use of the Phase Delay Unit until it is as flat as possible. However, in practice this might be impossible over the full frequency range if the loudspeaker system consists of more than one unit, even though all of them are perfect. This is because the acoustic centres of the units are placed at different distances from the microphone.
In the case of a two speaker system, the Phase Delay unit can be adjusted to give an optimal recording of the bass unit response (Fig.17) or for the response of the high frequency unit (Fig.18), but not for both simultaneously. Both recordings are correct. Which one should be preferred depends on which unit is considered as the reference. The slope difference indicates, as wi l l be shown later, the distance which the units should be moved relative to each other axially in order to get one straight line and thereby a perfect system.
Fig. 17. A two-way loudspeaker system wi th delay adjusted for the bass speaker
Since the only thing the Phase De- Actually this curve could be used lay Unit does is to change the if it was sliced up at the shifting slope, it might seem that the meas- points from — 1 8 0 ° to + 180° and urement could be performed totally then put together to make one without the Phase Delay Unit. This straight and continuous downward is true, but very inconvenient in sloping curve. This, however, is practice, because the slope is much very difficult, and the result would too steep. The resulting curve w i th - still be difficult to interpret due to out the 6202 would look like the extremely steep slope. Fig.15.
8
Fig. 15. Typical phase response when measured wi thout the Phase Delay Unit
Fig. 16. When the reference is at the bottom line, a phase shift around 0° wi l l shift between just above 0° to just below 360° . By use of one of the slope switches, the 0° reference can be moved to the middle of the paper
F ig .21 . Ampl i tude and phase response for high-pass f i l ter
9
Fig.20. Ampl i tude and phase response for low-pass f i l ter ■ ■ ■ ■ ■ ■ ■ ■ ■ ■ ■ ■ ■ ■ ■ ■ n - H i ■ ■ i I B ^ ^ ^ ^ V ■■ H v—■—^BI—I-^H ■ ■ ■ i i i i i i ■ i i i i ■ H ■ ■■ i ■ i i ■ ■ ■ ■ ■ ■ ■ mmwrn-^^—i-n—m ■ ■ ■ ^ n - ^ H - ^ > i - B — ^ ^ r ^ B - B ¥ ^ ^ ^ t ^ ^ ^ r ^ ^ m ^ ^ ^ ^ ^ r w ^ ^ ^ f ^ B - ^ ^ ^ n ^ ^ r ^ r r b ^ ^ ^ ^ ^ ^ ^ r ^ ^ ^ ^ ^ ^ ^ ^ ^ ^ ^ H . ^ ^ ^ ^ ^ ^ ^ ^ ^ ^ ^ ^ ^ ^ ^ H _ ^ B ^ U A U ^
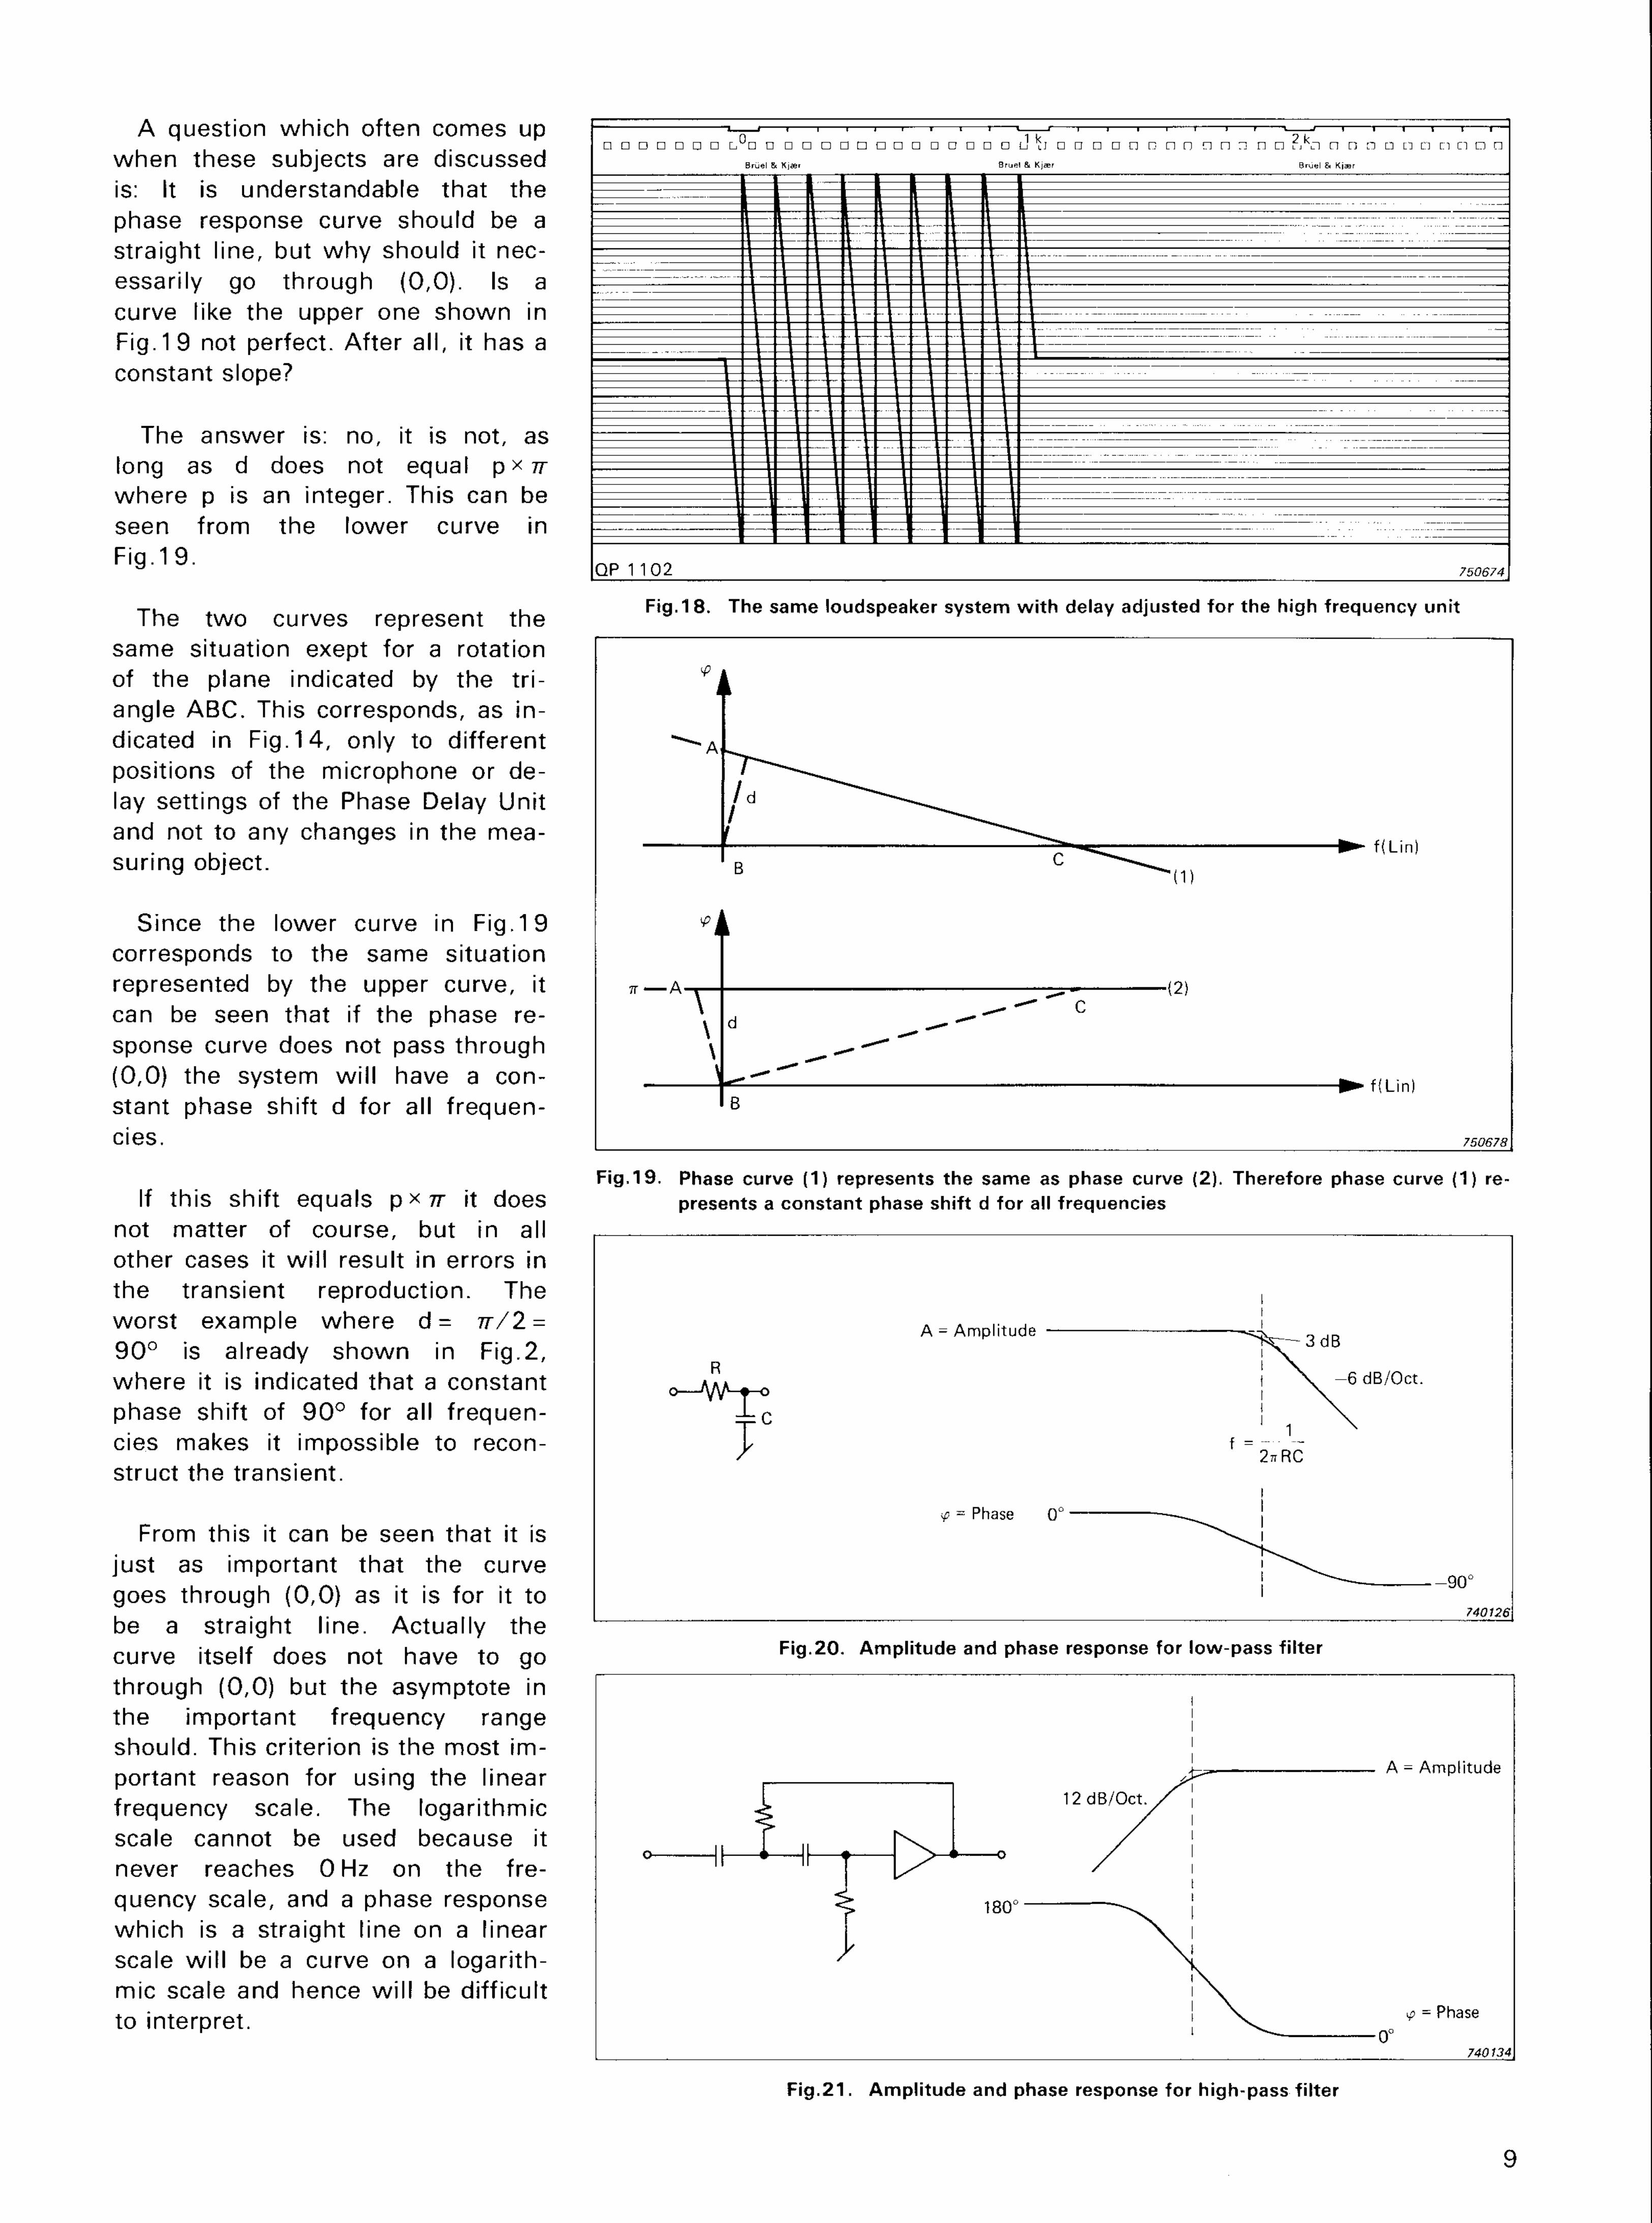
Fig,19. Phase curve (1) represents the same as phase curve (2). Therefore phase curve (1) represents a constant phase shift d for all frequencies
Fig. 18. The same loudspeaker system w i t h delay adjusted for the high frequency unit
I I
A question which often comes up when these subjects are discussed is: It is understandable that the phase response curve should be a straight line, but why should it necessarily go through (0,0). Is a curve like the upper one shown in Fig. 19 not perfect. After all, it has a constant slope?
The answer is: no, it is not, as long as d does not equal p x IT where p is an integer. This can be seen from the lower curve in Fig.19.
The two curves represent the same situation exept for a rotation of the plane indicated by the tr i angle ABC. This corresponds, as indicated in Fig. 14, only to different positions of the microphone or delay settings of the Phase Delay Unit and not to any changes in the measuring object.
Since the lower curve in Fig.19 corresponds to the same situation represented by the upper curve, it can be seen that if the phase response curve does not pass through (0,0) the system wi l l have a constant phase shift d for all frequencies.
If this shift equals p><7r it does not matter of course, but in all other cases it wi l l result in errors in the transient reproduction. The worst example where d = TT/2 = 90° is already shown in Fig.2, where it is indicated that a constant phase shift of 90° for all frequencies makes it impossible to reconstruct the transient.
From this it can be seen that it is just as important that the curve goes through (0,0) as it is for it to be a straight line. Actually the curve itself does not have to go through (0,0) but the asymptote in the important frequency range should. This criterion is the most important reason for using the linear frequency scale. The logarithmic scale cannot be used because it never reaches 0 Hz on the frequency scale, and a phase response which is a straight line on a linear scale wi l l be a curve on a logarithmic scale and hence wi l l be difficult to interpret.
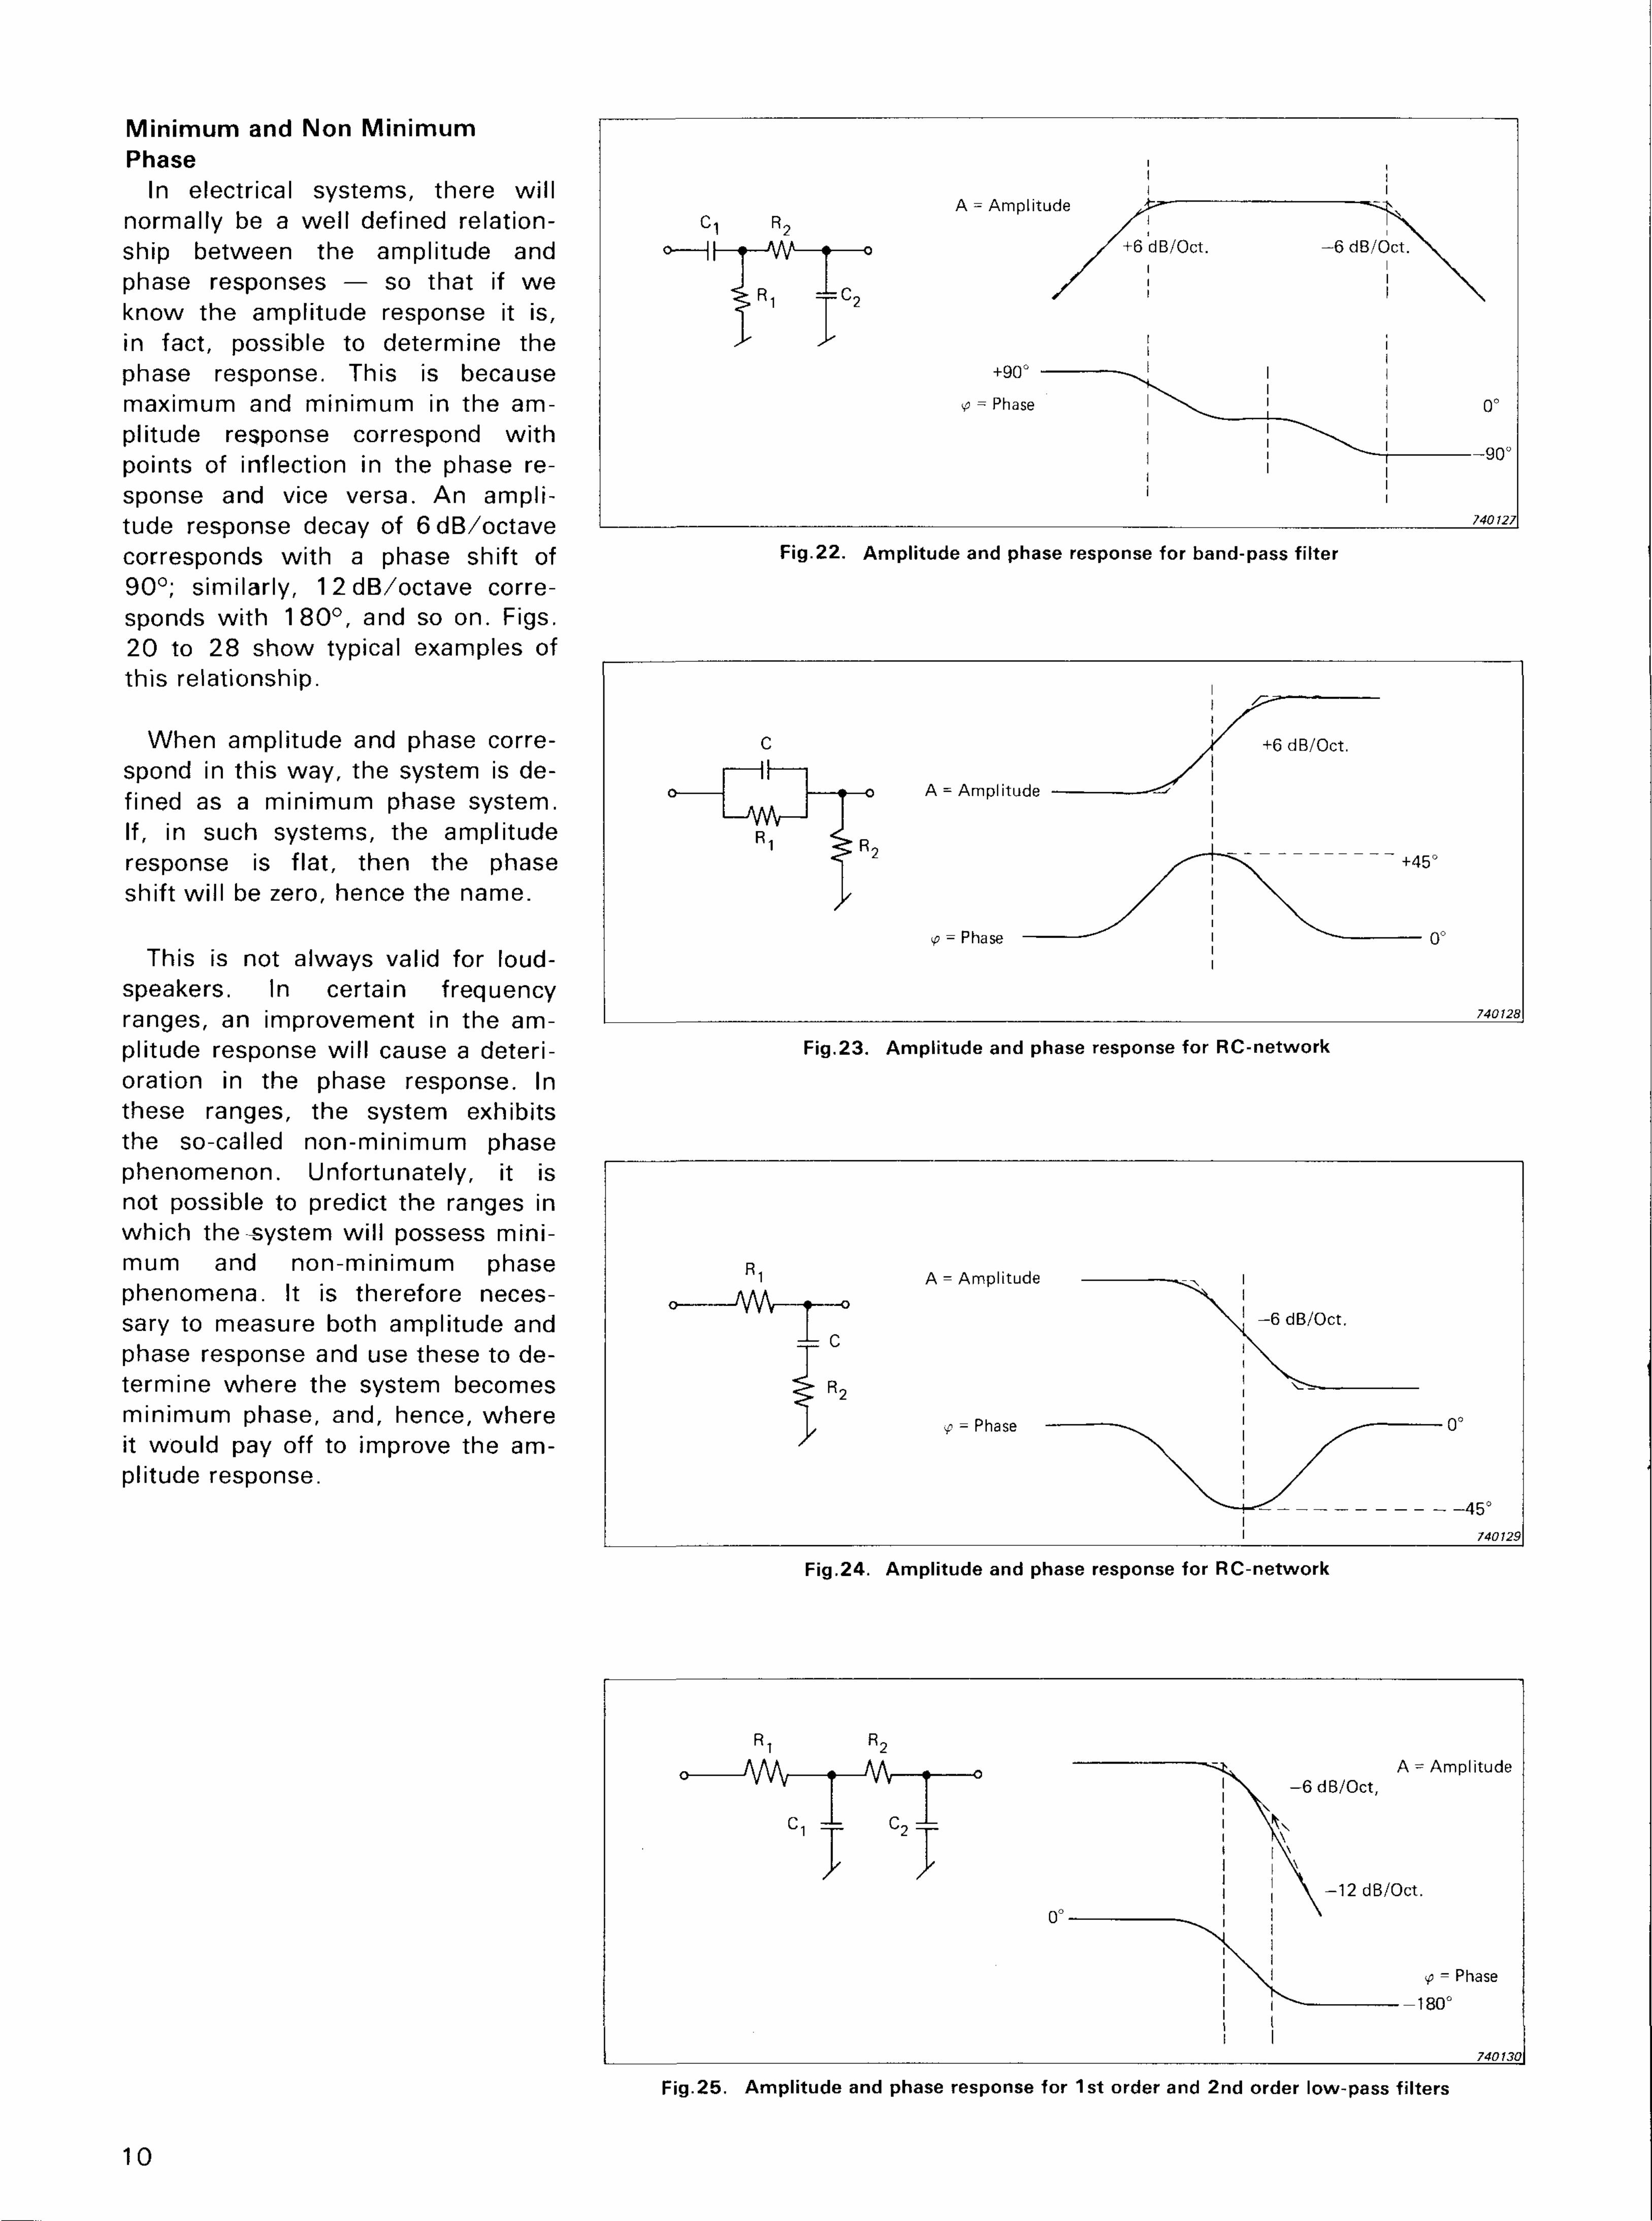
Fig.25. Ampl i tude and phase response for 1st order and 2nd order low-pass fi lters
Fig.24. Ampli tude and phase response for RC-network
Fig.23. Ampli tude and phase response for RC-network
Fig.22. Ampl i tude and phase response for band-pass fi lter
Minimum and Non Minimum Phase
In electrical systems, there wil l normally be a wel l defined relationship between the amplitude and phase responses — so that if we know the amplitude response it is, in fact, possible to determine the phase response. This is because maximum and minimum in the amplitude response correspond wi th points of inflection in the phase response and vice versa. An amplitude response decay of 6dB/octave corresponds wi th a phase shift of 90°; similarly, 12dB/octave corresponds wi th 180° , and so on. Figs. 20 to 28 show typical examples of this relationship.
When amplitude and phase correspond in this way, the system is defined as a minimum phase system. If, in such systems, the amplitude response is flat, then the phase shift wi l l be zero, hence the name.
This is not always valid for loudspeakers. In certain frequency ranges, an improvement in the amplitude response wi l l cause a deterioration in the phase response. In these ranges, the system exhibits the so-called non-minimum phase phenomenon. Unfortunately, it is not possible to predict the ranges in which the system wil l possess minimum and non-minimum phase phenomena. It is therefore necessary to measure both amplitude and phase response and use these to determine where the system becomes minimum phase, and, hence, where it would pay off to improve the amplitude response.
10
11
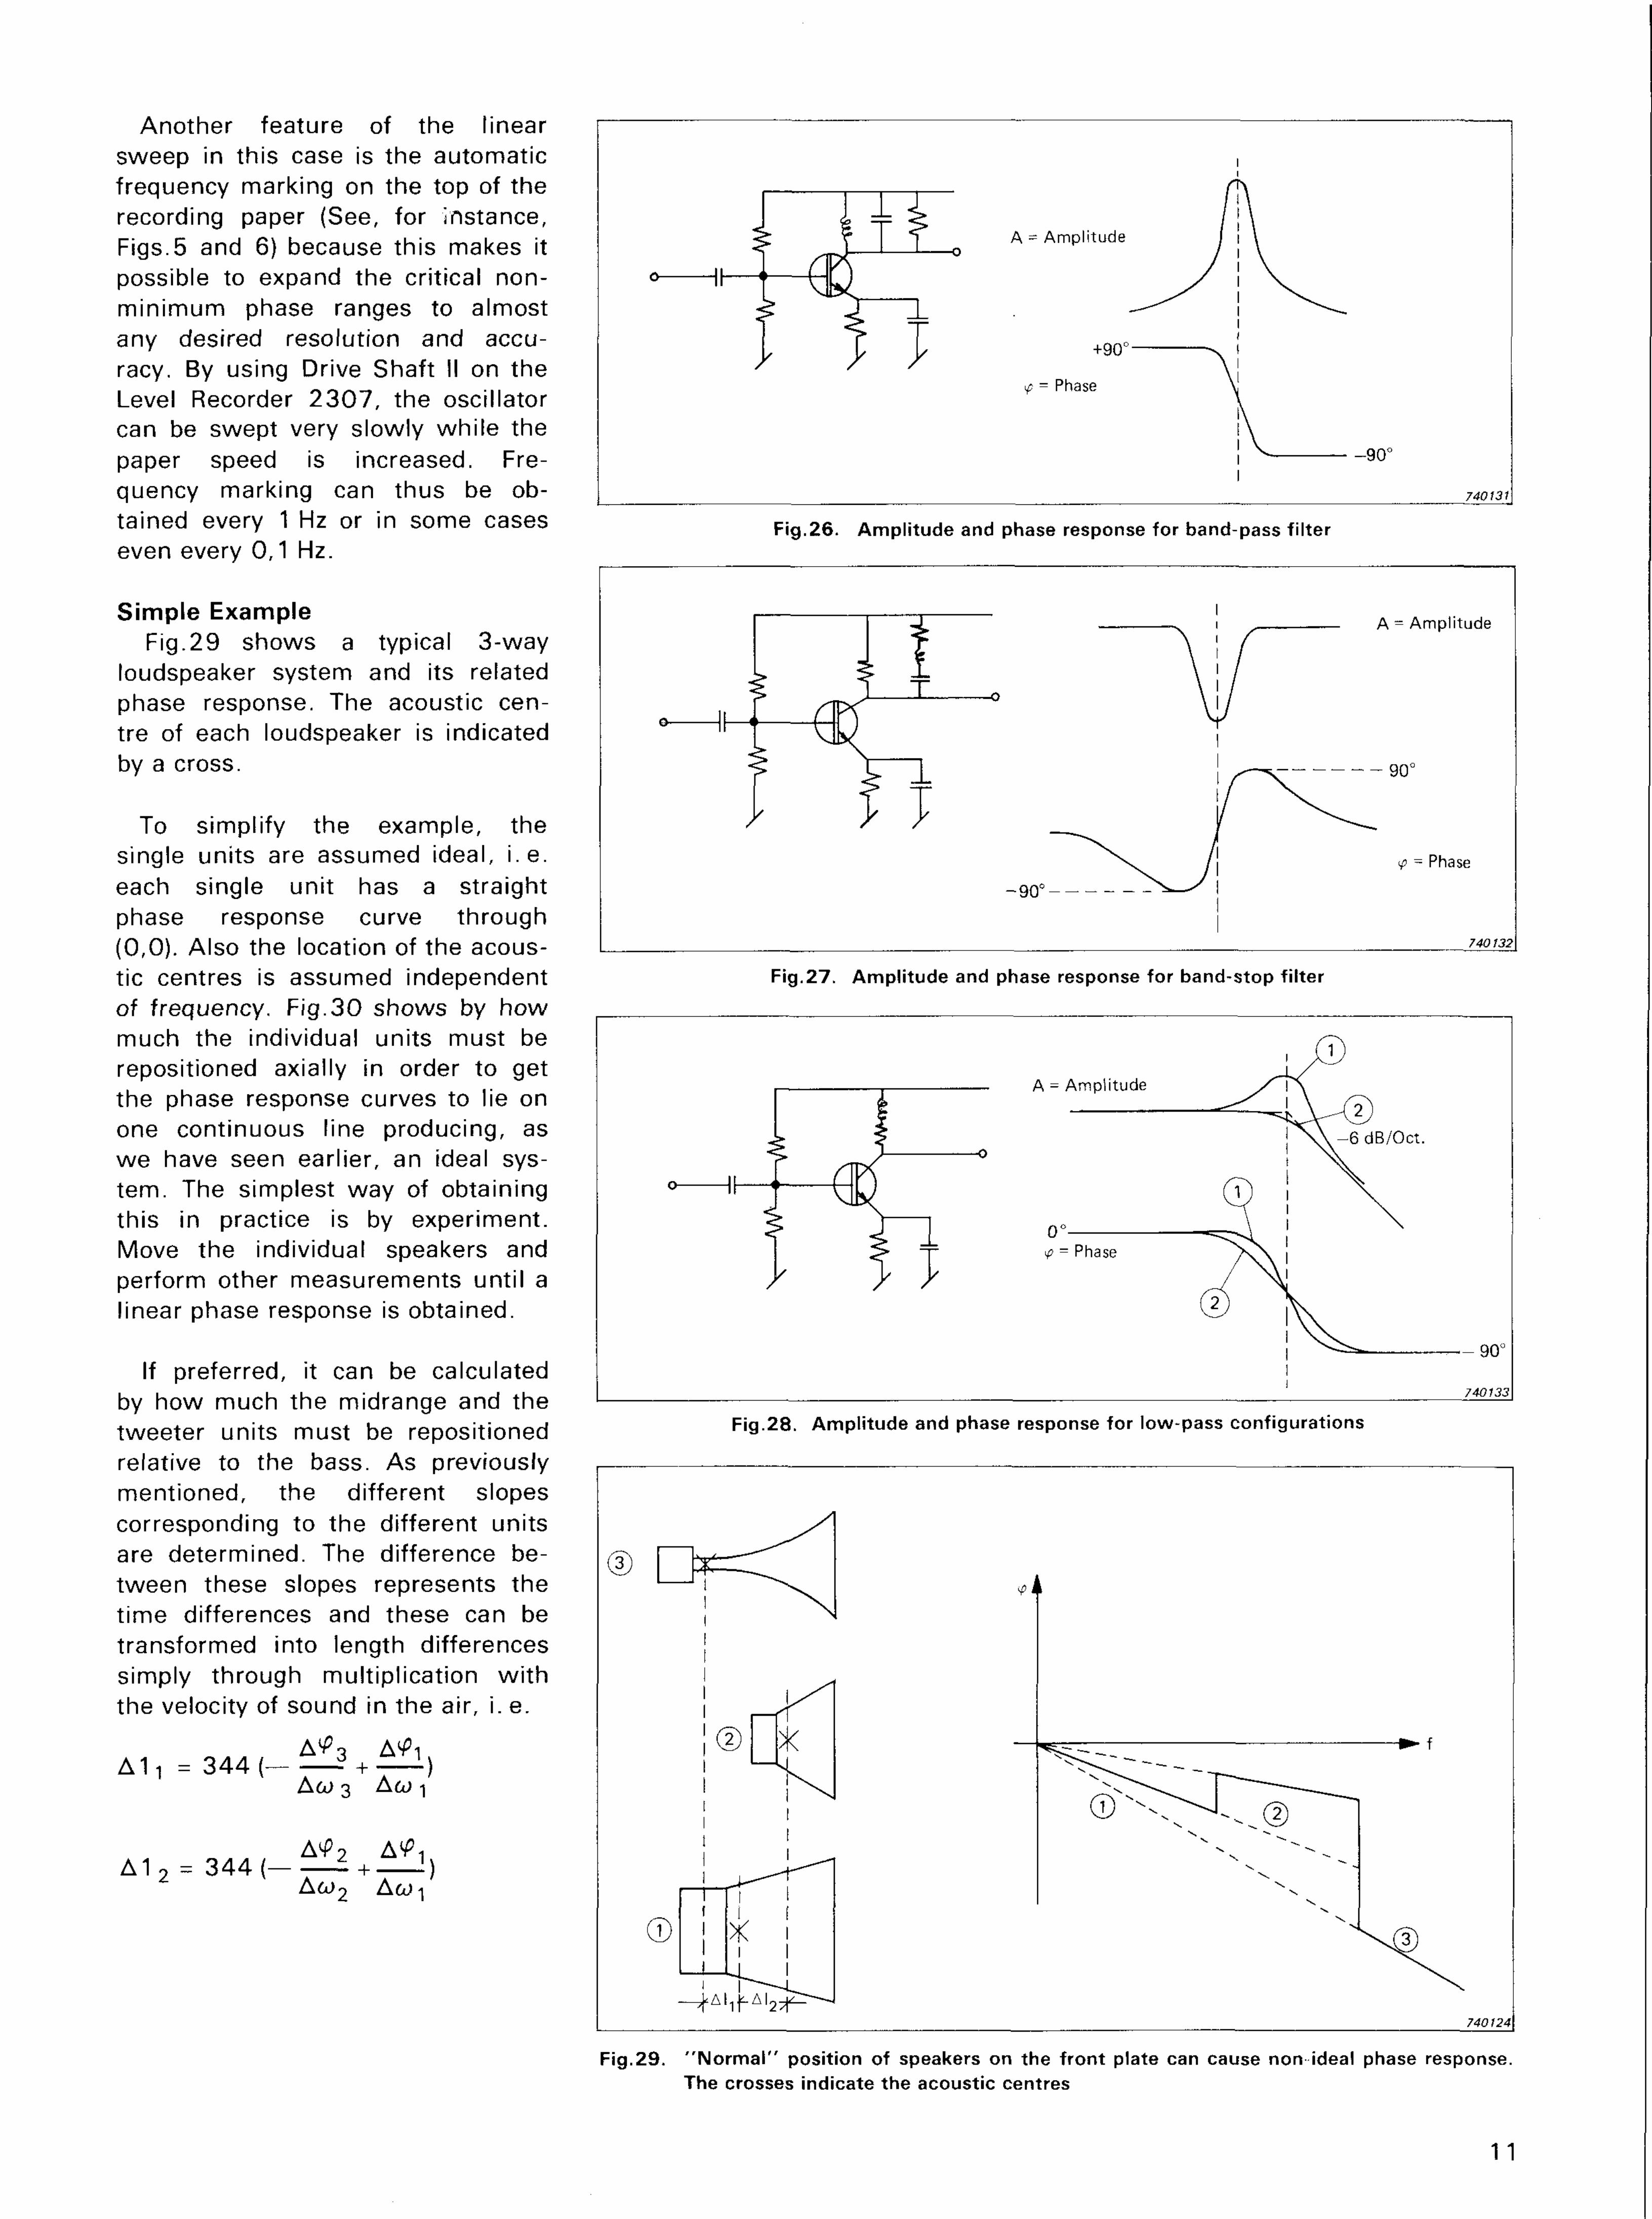
Fig.29. " N o r m a l " posi t ion of speakers on the f ron t plate can cause non ideal phase response. The crosses indicate the acoustic centres
Fig.28. Ampl i tude and phase response for low-pass conf igurat ions
Fig.27. Ampl i tude and phase response for band-stop f i l ter
F ig.26. Ampl i tude and phase response for band-pass f i l ter
Another feature of the linear sweep in this case is the automatic frequency marking on the top of the recording paper (See, for instance, Figs.5 and 6) because this makes it possible to expand the critical non-minimum phase ranges to almost any desired resolution and accuracy. By using Drive Shaft II on the Level Recorder 2307 , the oscillator can be swept very slowly while the paper speed is increased. Frequency marking can thus be obtained every 1 Hz or in some cases even every 0,1 Hz.
Simple Example Fig.29 shows a typical 3-way
loudspeaker system and its related phase response. The acoustic centre of each loudspeaker is indicated by a cross.
To simplify the example, the single units are assumed ideal, i .e. each single unit has a straight phase response curve through (0,0). Also the location of the acoustic centres is assumed independent of frequency. Fig.30 shows by how much the individual units must be repositioned axially in order to get the phase response curves to lie on one continuous line producing, as we have seen earlier, an ideal system. The simplest way of obtaining this in practice is by experiment. Move the individual speakers and perform other measurements until a linear phase response is obtained.
If preferred, it can be calculated by how much the midrange and the tweeter units must be repositioned relative to the bass. As previously mentioned, the different slopes corresponding to the different units are determined. The difference between these slopes represents the time differences and these can be transformed into length differences simply through multiplication wi th the velocity of sound in the air, i. e.
Mi = 344 ( -_ 3 + _ I )
Ad) 3 Aco i
A 1 2 = 344 ( - — ± + —1) Aco2 Aw-i
12
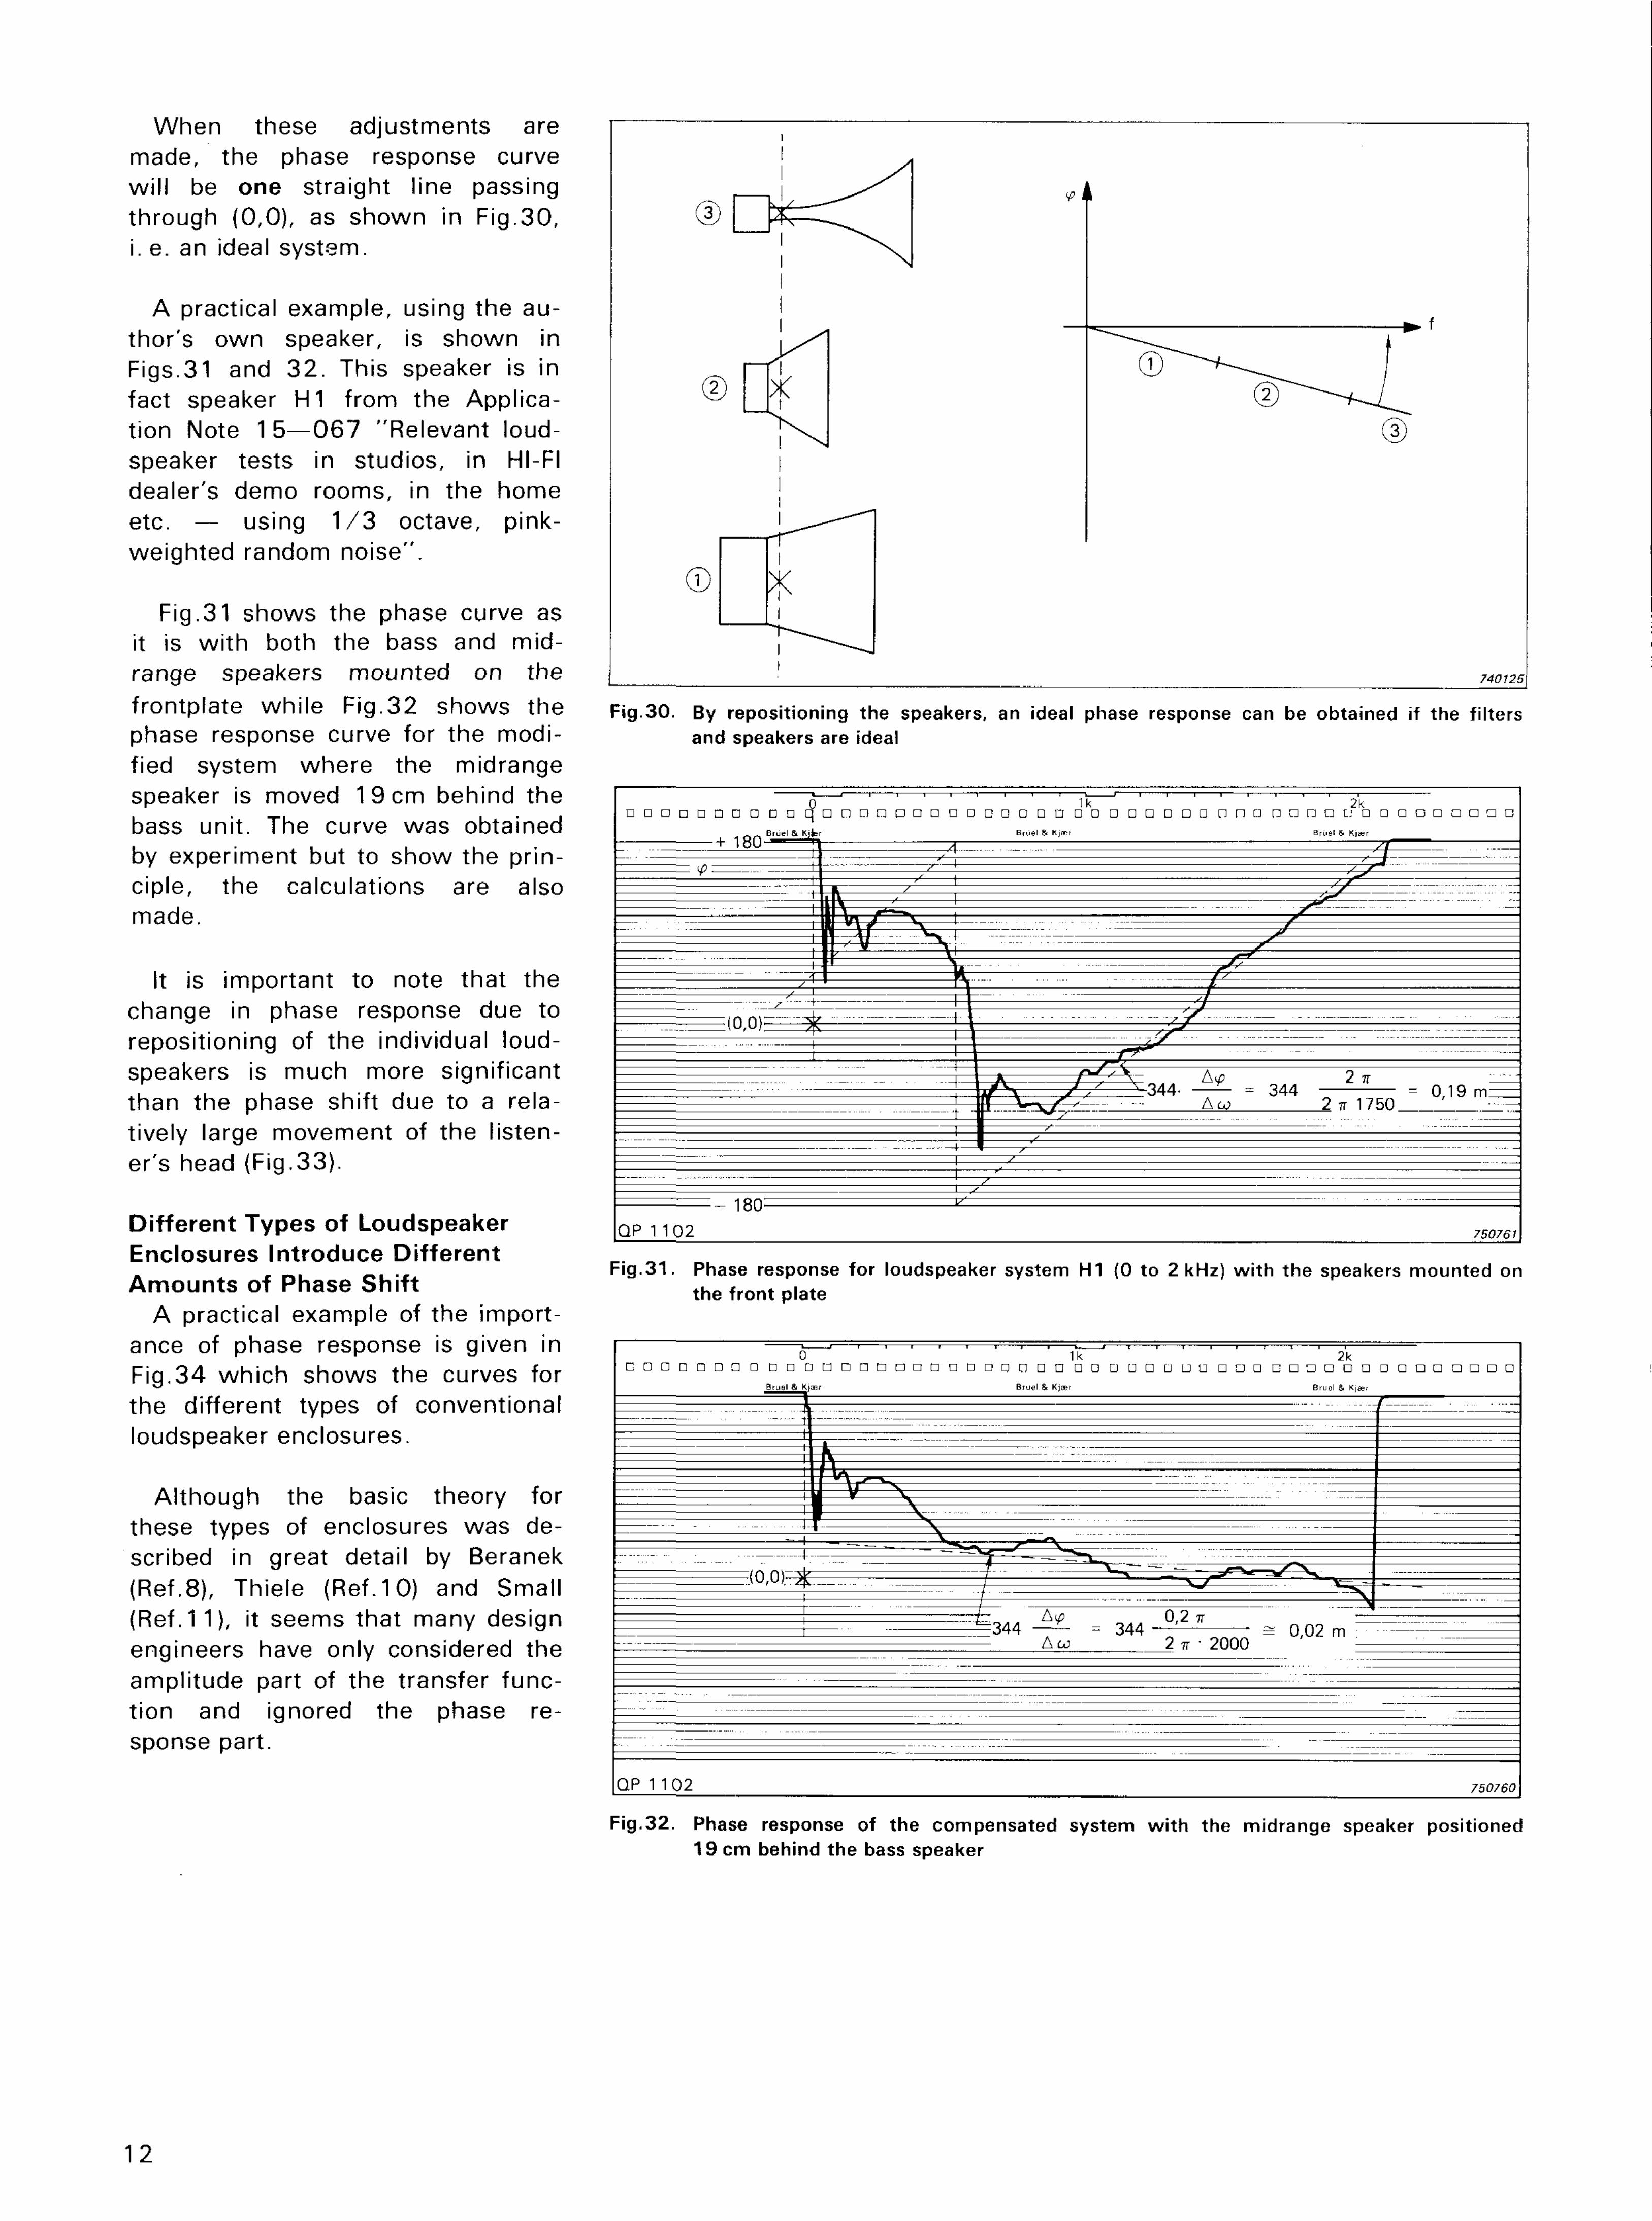
Fig.32. Phase response of the compensated system w i t h the midrange speaker posit ioned 19 cm behind the bass speaker
F ig .31 . Phase response for loudspeaker system H1 {0 to 2 kHz) w i th the speakers mounted on the f ront plate
Fig.30. By reposit ioning the speakers, an ideal phase response can be obtained if the f i l ters and speakers are ideal
When these adjustments are made, the phase response curve wi l l be one straight line passing through (0,0), as shown in Fig.30, i. e. an ideal system.
A practical example, using the author's own speaker, is shown in Figs.31 and 32 . This speaker is in fact speaker H1 from the Application Note 15—067 "Relevant loudspeaker tests in studios, in HI-FI dealer's demo rooms, in the home etc. — using 1 / 3 octave, pink-weighted random noise".
Fig.31 shows the phase curve as it is wi th both the bass and mid-range speakers mounted on the frontplate whi le Fig.32 shows the phase response curve for the modified system where the midrange speaker is moved 19 cm behind the bass unit. The curve was obtained by experiment but to show the principle, the calculations are also made.
It is important to note that the change in phase response due to repositioning of the individual loudspeakers is much more significant than the phase shift due to a relatively large movement of the listener's head (Fig.33).
Different Types of Loudspeaker Enclosures Introduce Different Amounts of Phase Shift
A practical example of the importance of phase response is given in Fig.34 which shows the curves for the different types of conventional loudspeaker enclosures.
Al though the basic theory for these types of enclosures was described in great detail by Beranek (Ref.8), Thiele (Ref.10) and Small (Ref. 11), it seems that many design engineers have only considered the amplitude part of the transfer function and ignored the phase response part.
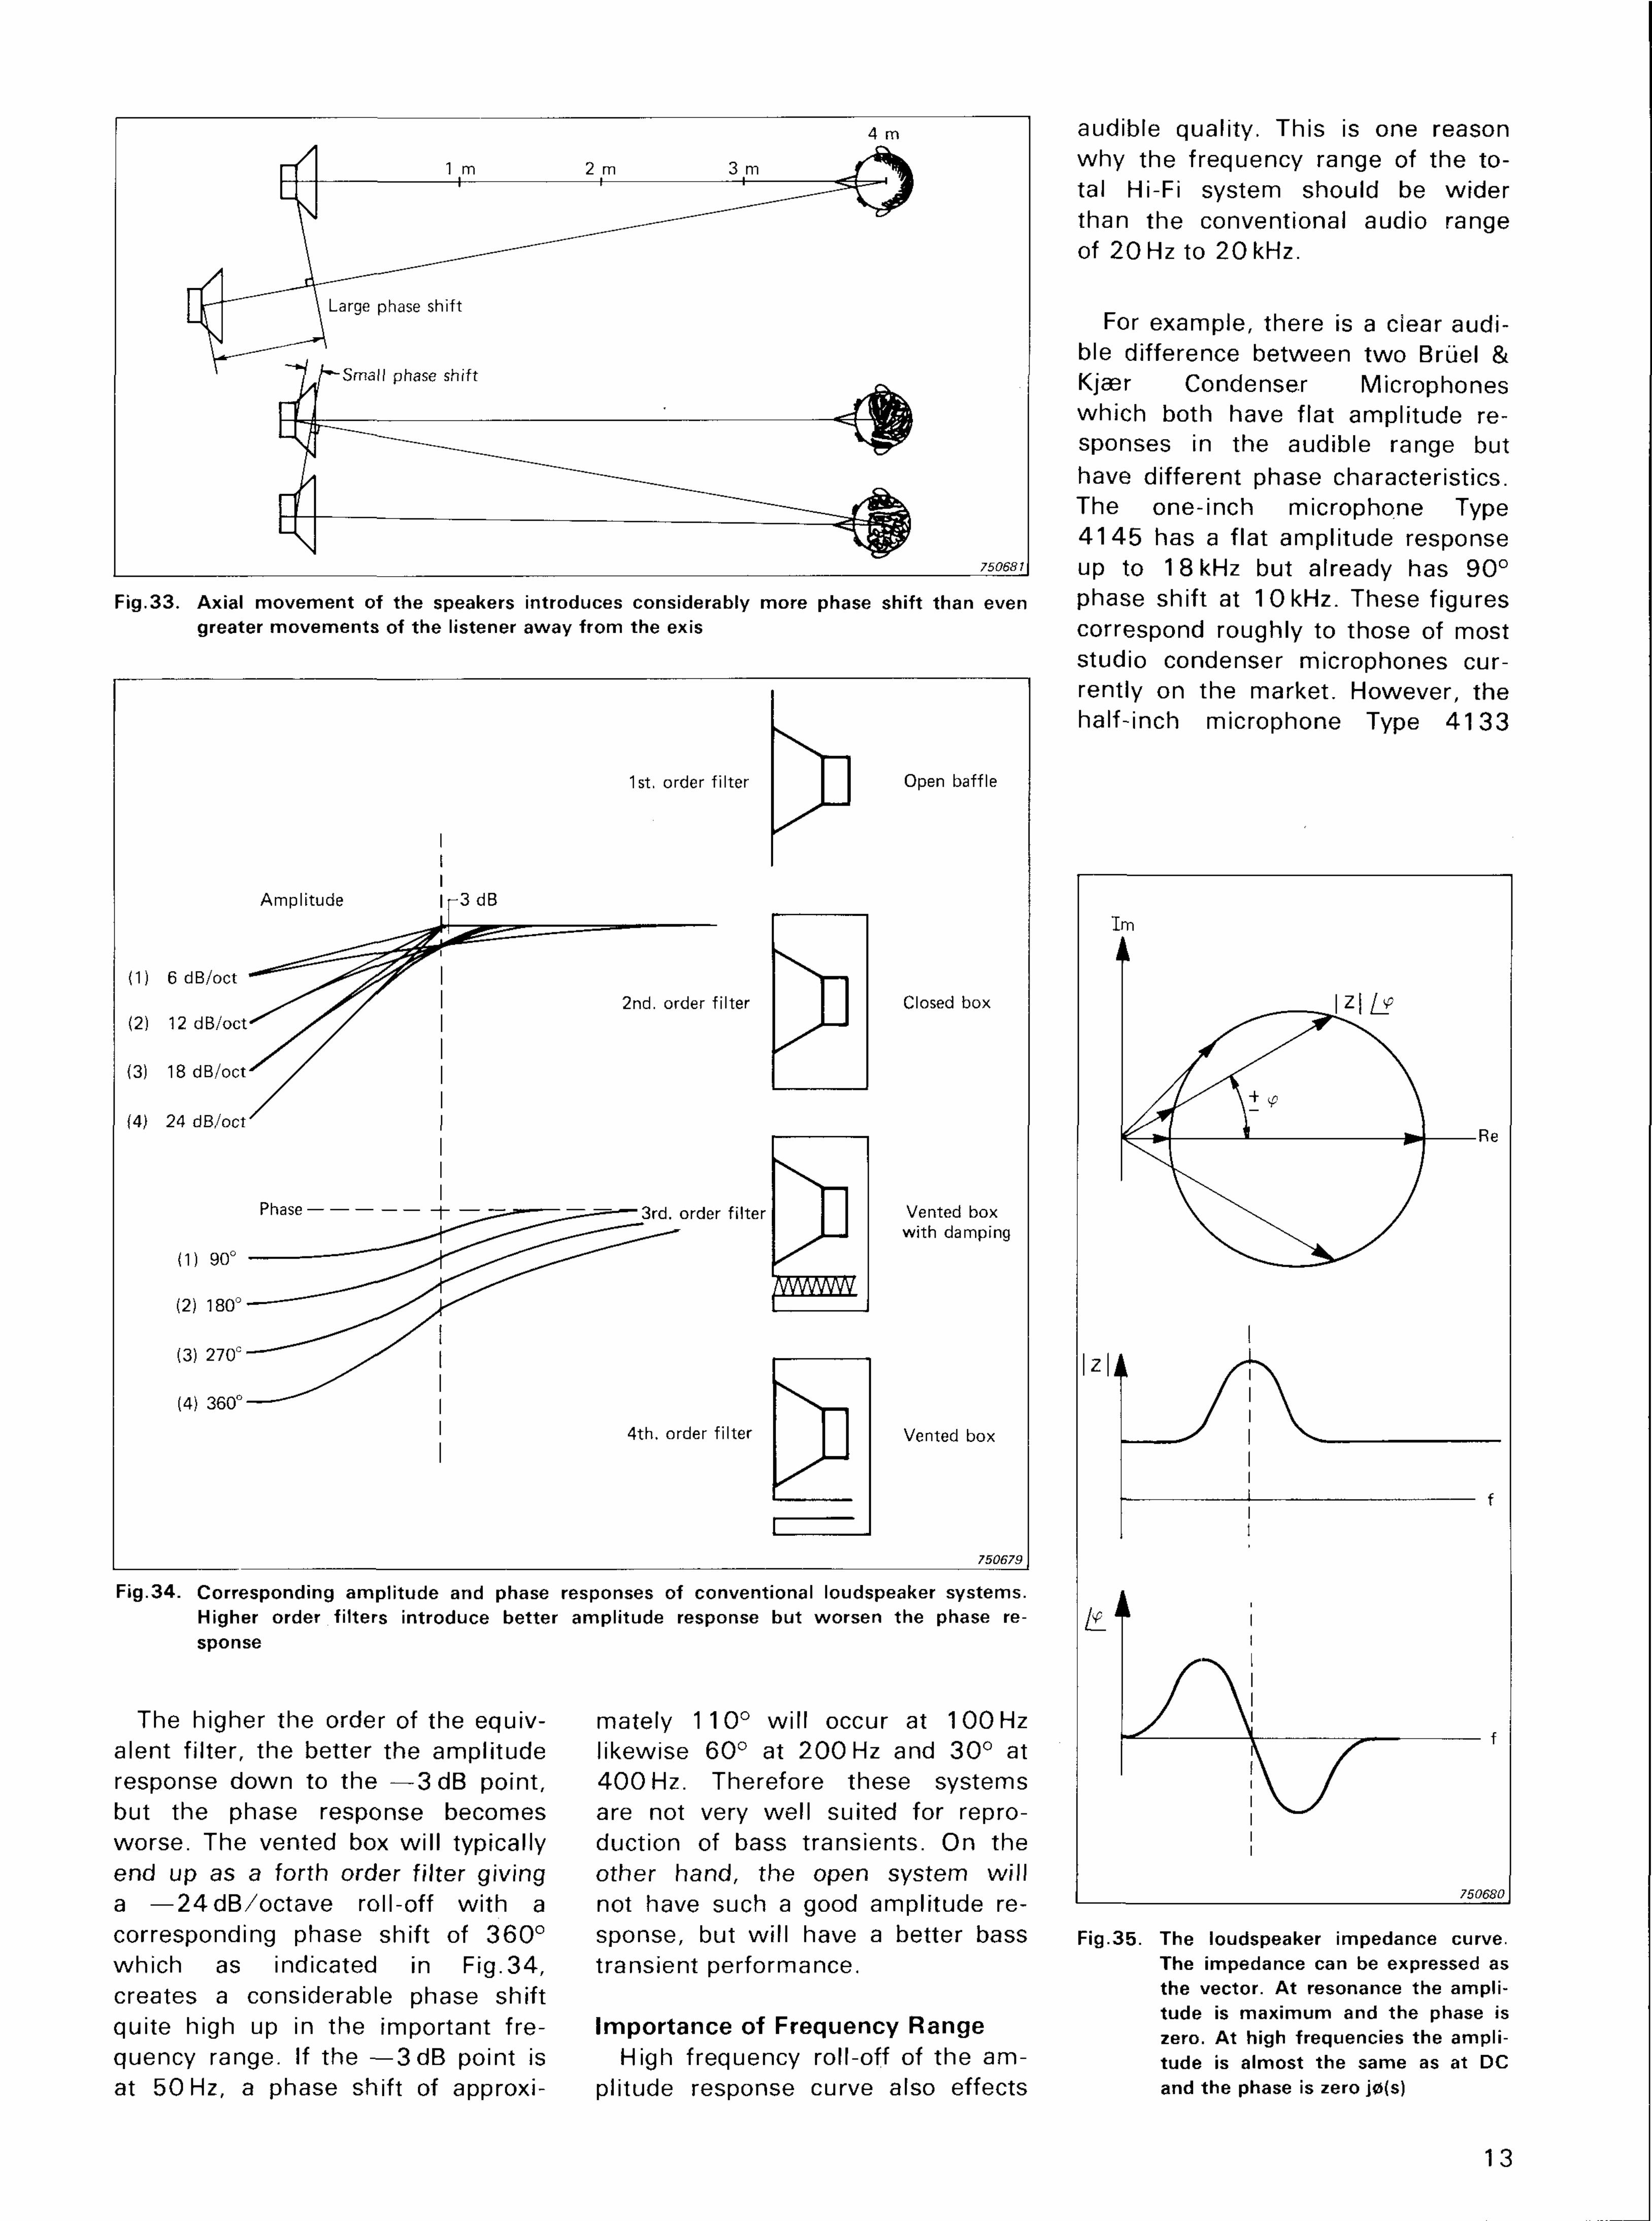
Fig.35. The loudspeaker impedance curve. The impedance can be expressed as the vector. A t resonance the ampl i tude is max imum and the phase is zero. A t high frequencies the ampl i tude is almost the same as at DC and the phase is zero j0(s)
13
Fig.34. Corresponding ampl i tude and phase responses of conventional loudspeaker systems. Higher order f i l ters introduce better ampl i tude response but worsen the phase response
The higher the order of the equiv- mately 110° wi l l occur at 100 Hz alent fi lter, the better the amplitude likewise 60° at 2 0 0 Hz and 30° at response down to the — 3 d B point, 4 0 0 Hz. Therefore these systems but the phase response becomes are not very wel l suited for repro-worse. The vented box wi l l typically duction of bass transients. On the end up as a forth order fi lter giving other hand, the open system wi l l a —24dB /oc tave roll-off w i th a not have such a good amplitude re-corresponding phase shift of 3 6 0 ° sponse, but wi l l have a better bass which as indicated in Fig.34, transient performance. creates a considerable phase shift quite high up in the important fre- Importance of Frequency Range quency range. If the — 3 d B point is High frequency roll-off of the am-at 50 Hz, a phase shift of approxi- plitude response curve also effects
Fig.33. Axial movement of the speakers introduces considerably more phase shift than even greater movements of the listener away f rom the exis
audible quality. This is one reason why the frequency range of the total Hi-Fi system should be wider than the conventional audio range of 20 Hz to 20 kHz.
For example, there is a clear audible difference between two Briiel & Kjaer Condenser Microphones which both have flat amplitude responses in the audible range but have different phase characteristics. The one-inch microphone Type 4 1 4 5 has a flat amplitude response up to 18 kHz but already has 90° phase shift at 10 kHz. These figures correspond roughly to those of most studio condenser microphones currently on the market. However, the half-inch microphone Type 4 1 3 3
has flat amplitude response up to been considered important — that cle. |Z| continues to increase until 4 0 kHz which is wel l above the is in the impedance of a speaker. resonance where it is maximum range of human hearing, and its This is not just resistive but also in- and resistive. Above resonance, it 90° phase shift occurs first at ductive as can be seen from the decreases and ends up wi th a value 25 kHz. A subjective comparison of loudspeaker impedance curve in the close to the DC value. these two microphones on transient complex plane w i th the real axis fi ltered music indicates a more (Re) and the imaginary axis (Im) Impedance can be measured wi th transparent and precise transient Fig.35. all B & K oscillators using the corn-reproduction for the half-inch micro- pressor circuit to maintain a con-phone. This, of course, is due to the The impedance can be described stant current in the circuit. Then negligible phase shift of the half- as the vector | Z | Z ^ f r o m the origin the voltage across the speaker is inch microphone in the audible (0,0) to a point on the circle. The proportional to the impedance. Z^ range, which is the result of its closest point to the origin corre- can be plotted using the Phase Me-wide frequency range. sponds to DC where the amplitude ter Type 2 9 7 1 . These last examples
|Z| is min imum and the phase shift indicate that amplitude and phase Complex Impedance is zero. When passing around the should be seen together, — they
This application note wi l l con- circle, it is seen, as indicated on the are interrelated and not isolated elude w i th one more example f igure, that both |Z| and / ^ i n c r e a s e phenomena. where phase unti l now has not until the vector is tangent to the cir-
Conclusion The phase response together w i th sure the phase response of a is easy to calculate how much
the amplitude response give the speaker as it is to measure its ampli- these units should be moved axially complete transfer funct ion which de- tude response. w i th respect to each other to im-scribes the steady state and t ran- prove the phase response, the transient responses of the system. Wi th If the bass speaker and the mid- sient response, and as a conse-the Phase Meter and the Phase De- range speaker have different quence, also the audible quality. lay Unit, it is just as easy to mea- slopes in a linear phase response, it
References Ref .1 . Richard C. Heyser in Hi-Fi dealers' demo Ref.8. L. L. Beranek
Loudspeaker Phase Charac- rooms, in the home etc., — Acoustics: McGraw-Hi l l , teristics and Time Delay using 1 / 3 octave, pink- New York 1 9 5 4 Distortion: Part 1 weighted, January 1 9 6 9 , Part 2 Apri l random noise Ref.9. Franklyn F. Kuo 1969 B & K Application Note Network analysis and syn-Journal of the Audio 17—197 thesis Engineering Society r_ ■ »« „ , John Wiley and Sons, Inc.
Ref.5. Hennmg Moller and . . e A r» t n r>- u „i ^ 11 Carsten Thomsen Ref.2. Richard C. Heyser i-. * . , .. , ,
_ . . , Electroacoustic free-field „ , . „ . .. T U . . Determination of Loud- .. Ref.1 0. A. N. Thiele
_. . A measurements in ordinary . , . . , A , speaker Signal Arrival . Loudspeakers in Vented « ^ -,„ rooms — using gating tech- ,., Times: Part 1 October 7 1 , y y y Boxes Part 2 November 7 1 , Part H ' O ^ A ■■ ■ ». P r o c - I R E E (Australia) vol. o r» u -7i B & K Application Note 0 0 A ,rt 1 Q CM ^ , , u r . u ^ 3 December 71 1 7 i q ^ 22 Aug. 1 9 6 1 , republished Journal of the Audio in AES Journal , May 1971 Engineering Society R e f 6 Carsten Thomsen and Hen- and June 1971
ning M0ller Ref.3. E. Rorbaek Madsen and H. Swept measurements of Ref.1 1 . Richard H. Small
Staffeldt harmonic, difference fre- Vented-Box Loudspeaker Hojttalerundersogelser: quency and intermodula- Systems Akademiet for de tekniske t j o n distortion Journal of the Audio videnskaber, Denmark B & K Application Note Engineering Society, Parts I-1972 15__098 ' " ' J u n e 1 9 7 3 t 0 S e P t e m " Short English version pre- ber 1973 sented at the 47th AES Ref.7. E. Rorbask Madsen Convention 26 — 29 Feb. Threshold of Phase Ref.1 2. Henning Moller 1974 Detection by Hearing Electro Acoustic Measure-
Audio Engineering Society, ments Ref.4. Henning Moller Inc. B & K 16—035
Relevant loudspeaker tests Paper of the 44th AES Con-in studios vention Rotterdam 1 973 .
14
. . . first in Sound and Vibration
Bruel & Kjaer DK-2850 N/ERUM, DENMARK Telephone: + 4 5 2 80 05 00 TELEX: 37316 bruka dk