Lottery Scratch-Off Sales Increase; Options - Florida Monitor
16
Office of Program Policy Analysis & Government Accountability an office of the Florida Legislature February 2007 Report No. 07-09 Lottery Scratch-Off Sales Increase; Options Available to Enhance Transfers to Education at a glance In Fiscal Year 2005-06, the Lottery achieved record scratch-off ticket sales and transfers to the Educational Enhancement Trust Fund. This increase is attributable to the Legislature’s authorization of variable prize payouts and transfer rates for scratch-off games. However, the Lottery continues to face the challenge of maintaining revenue growth as scratch-off sales are expected to level off, and competition continues from other forms of entertainment and gambling. To address this challenge, the Lottery should continue to expand its retailer network to increase sales distribution and revenues and expand its multi-priced on-line games. The Lottery also could consider adding a super jackpot game or joining a multi-state game. The Legislature could consider expanding Lottery games by authorizing video lottery terminals and a keno on-line game. However, this would entail an expansion of legalized gambling in the state. The Lottery’s operating expense rate continues to decline, making it among the most efficient U.S. lotteries. It could realize additional efficiencies and increase transfers to education by ensuring that contract terms represent the best value for the state, and continuing to explore ways to reduce costs for leasing office space and providing field support functions. Enhancements to the department’s performance management system could help the Lottery identify further operational efficiencies. Scope ___________________ The Joint Legislative Auditing Committee directed OPPAGA to examine the Department of the Lottery and identify options to enhance its earning capability and improve its efficiency. Our report also tracks the Lottery’s implementation of prior OPPAGA recommendations. 1 Background _____________ Following voter approval of a constitutional amendment, the 1987 Legislature enacted the Florida Public Education Lottery Act. The act created the Department of the Lottery to generate funds for education. Recent legislative action includes initiatives to increase Lottery revenues and reduce operating costs. Chapter 2002-227 , Laws of Florida, authorized variable prize payout and transfer rates for scratch-off games. 2 Chapter 2005-84 , Laws of Florida, authorized variable prize payout and transfer rates for on-line games, and provided that 80% of all unclaimed prize money be transferred to the Educational 1 Florida Lottery Responding to Revenue, Efficiency, and Minority Retailer Challenges, OPPAGA Report No. 06-04 , January 2006; Lottery Faces Challenges Meeting Future Revenue Demands, Continues Work to Improve Efficiency, OPPAGA Report No. 04-80 , December 2004; Progress Report: Florida Lottery Makes Progress By Implementing Many Justification Review Recommendations, OPPAGA Report No. 04-01 , January 2004; Justification Review: Sale of Lottery Products Program, OPPAGA Report No. 02-11 , February 2002. 2 Section 24.121 , F.S. Variable prize payouts afford the Lottery flexibility to offer larger prizes to attract more sales.
Transcript of Lottery Scratch-Off Sales Increase; Options - Florida Monitor

Office of Program Policy Analysis & Government Accountability an office of the Florida Legislature
February 2007 Report No. 07-09
Lottery Scratch-Off Sales Increase; Options Available to Enhance Transfers to Education at a glance In Fiscal Year 2005-06, the Lottery achieved record scratch-off ticket sales and transfers to the Educational Enhancement Trust Fund. This increase is attributable to the Legislature’s authorization of variable prize payouts and transfer rates for scratch-off games. However, the Lottery continues to face the challenge of maintaining revenue growth as scratch-off sales are expected to level off, and competition continues from other forms of entertainment and gambling.
To address this challenge, the Lottery should continue to expand its retailer network to increase sales distribution and revenues and expand its multi-priced on-line games. The Lottery also could consider adding a super jackpot game or joining a multi-state game. The Legislature could consider expanding Lottery games by authorizing video lottery terminals and a keno on-line game. However, this would entail an expansion of legalized gambling in the state.
The Lottery’s operating expense rate continues to decline, making it among the most efficient U.S. lotteries. It could realize additional efficiencies and increase transfers to education by ensuring that contract terms represent the best value for the state, and continuing to explore ways to reduce costs for leasing office space and providing field support functions. Enhancements to the department’s performance management system could help the Lottery identify further operational efficiencies.
Scope___________________ The Joint Legislative Auditing Committee directed OPPAGA to examine the Department of the Lottery and identify options to enhance its earning capability and improve its efficiency. Our report also tracks the Lottery’s implementation of prior OPPAGA recommendations. 1
Background _____________ Following voter approval of a constitutional amendment, the 1987 Legislature enacted the Florida Public Education Lottery Act. The act created the Department of the Lottery to generate funds for education. Recent legislative action includes initiatives to increase Lottery revenues and reduce operating costs. Chapter 2002-227, Laws of Florida, authorized variable prize payout and transfer rates for scratch-off games. 2 Chapter 2005-84, Laws of Florida, authorized variable prize payout and transfer rates for on-line games, and provided that 80% of all unclaimed prize money be transferred to the Educational
1 Florida Lottery Responding to Revenue, Efficiency, and Minority
Retailer Challenges, OPPAGA Report No. 06-04, January 2006; Lottery Faces Challenges Meeting Future Revenue Demands, Continues Work to Improve Efficiency, OPPAGA Report No. 04-80, December 2004; Progress Report: Florida Lottery Makes Progress By Implementing Many Justification Review Recommendations, OPPAGA Report No. 04-01, January 2004; Justification Review: Sale of Lottery Products Program, OPPAGA Report No. 02-11, February 2002.
2 Section 24.121, F.S. Variable prize payouts afford the Lottery flexibility to offer larger prizes to attract more sales.
OPPAGA Report Report No. 07-09
2
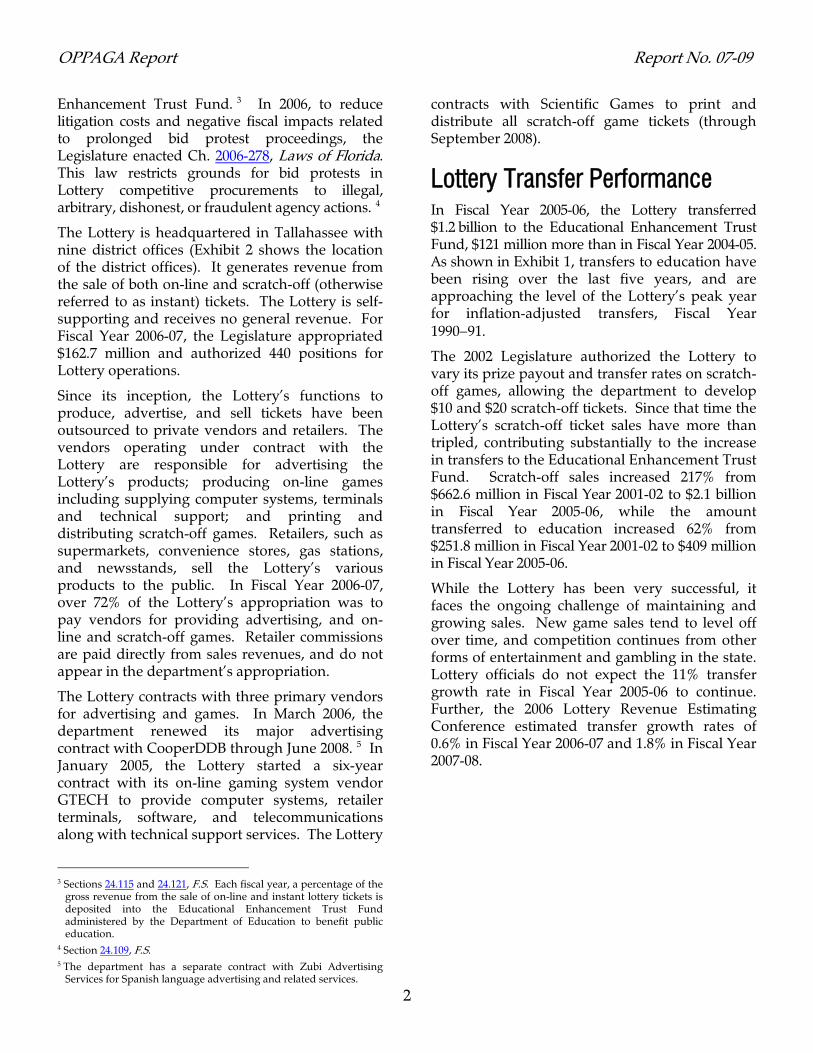
Enhancement Trust Fund. 3 In 2006, to reduce litigation costs and negative fiscal impacts related to prolonged bid protest proceedings, the Legislature enacted Ch. 2006-278, Laws of Florida. This law restricts grounds for bid protests in Lottery competitive procurements to illegal, arbitrary, dishonest, or fraudulent agency actions. 4
The Lottery is headquartered in Tallahassee with nine district offices (Exhibit 2 shows the location of the district offices). It generates revenue from the sale of both on-line and scratch-off (otherwise referred to as instant) tickets. The Lottery is self-supporting and receives no general revenue. For Fiscal Year 2006-07, the Legislature appropriated $162.7 million and authorized 440 positions for Lottery operations.
Since its inception, the Lottery’s functions to produce, advertise, and sell tickets have been outsourced to private vendors and retailers. The vendors operating under contract with the Lottery are responsible for advertising the Lottery’s products; producing on-line games including supplying computer systems, terminals and technical support; and printing and distributing scratch-off games. Retailers, such as supermarkets, convenience stores, gas stations, and newsstands, sell the Lottery’s various products to the public. In Fiscal Year 2006-07, over 72% of the Lottery’s appropriation was to pay vendors for providing advertising, and on-line and scratch-off games. Retailer commissions are paid directly from sales revenues, and do not appear in the department’s appropriation.
The Lottery contracts with three primary vendors for advertising and games. In March 2006, the department renewed its major advertising contract with CooperDDB through June 2008. 5 In January 2005, the Lottery started a six-year contract with its on-line gaming system vendor GTECH to provide computer systems, retailer terminals, software, and telecommunications along with technical support services. The Lottery
3 Sections 24.115 and 24.121, F.S. Each fiscal year, a percentage of the
gross revenue from the sale of on-line and instant lottery tickets is deposited into the Educational Enhancement Trust Fund administered by the Department of Education to benefit public education.
4 Section 24.109, F.S. 5 The department has a separate contract with Zubi Advertising
Services for Spanish language advertising and related services.
contracts with Scientific Games to print and distribute all scratch-off game tickets (through September 2008).
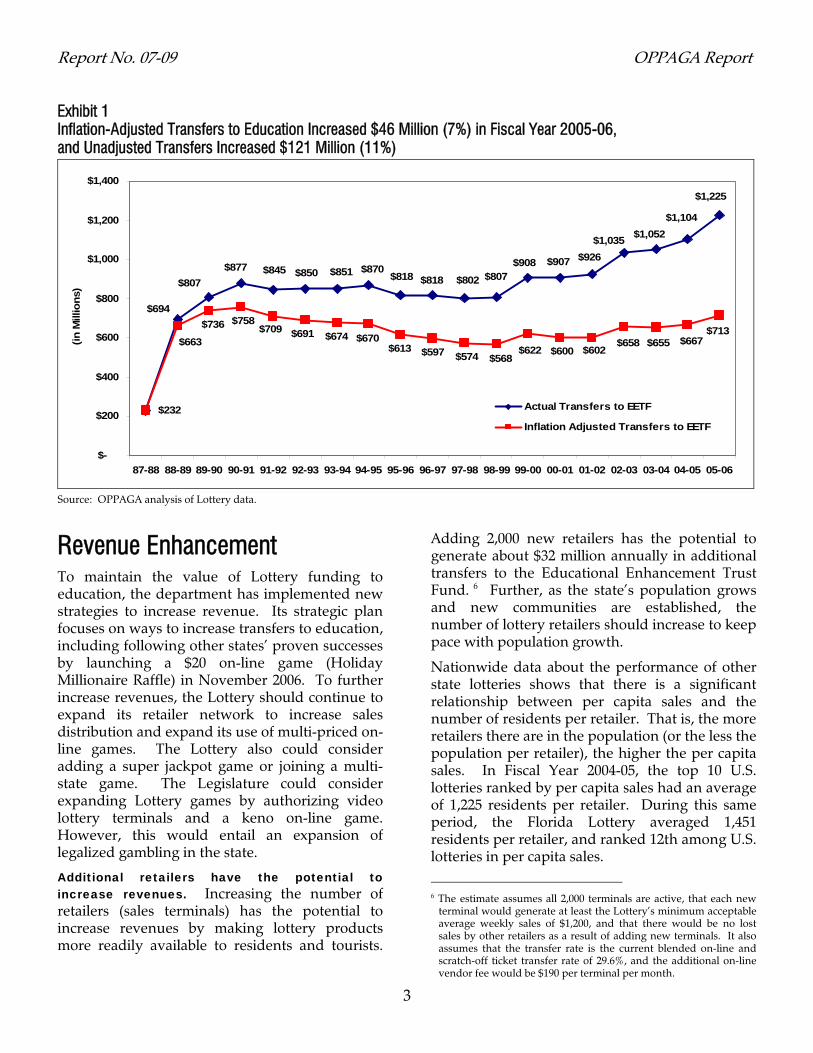
Lottery Transfer Performance In Fiscal Year 2005-06, the Lottery transferred $1.2 billion to the Educational Enhancement Trust Fund, $121 million more than in Fiscal Year 2004-05. As shown in Exhibit 1, transfers to education have been rising over the last five years, and are approaching the level of the Lottery’s peak year for inflation-adjusted transfers, Fiscal Year 1990−91.
The 2002 Legislature authorized the Lottery to vary its prize payout and transfer rates on scratch-off games, allowing the department to develop $10 and $20 scratch-off tickets. Since that time the Lottery’s scratch-off ticket sales have more than tripled, contributing substantially to the increase in transfers to the Educational Enhancement Trust Fund. Scratch-off sales increased 217% from $662.6 million in Fiscal Year 2001-02 to $2.1 billion in Fiscal Year 2005-06, while the amount transferred to education increased 62% from $251.8 million in Fiscal Year 2001-02 to $409 million in Fiscal Year 2005-06.
While the Lottery has been very successful, it faces the ongoing challenge of maintaining and growing sales. New game sales tend to level off over time, and competition continues from other forms of entertainment and gambling in the state. Lottery officials do not expect the 11% transfer growth rate in Fiscal Year 2005-06 to continue. Further, the 2006 Lottery Revenue Estimating Conference estimated transfer growth rates of 0.6% in Fiscal Year 2006-07 and 1.8% in Fiscal Year 2007-08.
Report No. 07-09 OPPAGA Report
Exhibit 1 Inflation-Adjusted Transfers to Education Increased $46 Million (7%) in Fiscal Year 2005-06, and Unadjusted Transfers Increased $121 Million (11%)
$232
$1,225
$1,104$1,052$1,035
$926$907$908$807$802$818$818
$870$851$850$845$877$807
$694
$713$667$655$658
$602$600$622$568$574$597$613
$670$674$691$709$758$736
$663
$-
$200
$400
$600
$800
$1,000
$1,200
$1,400
87-88 88-89 89-90 90-91 91-92 92-93 93-94 94-95 95-96 96-97 97-98 98-99 99-00 00-01 01-02 02-03 03-04 04-05 05-06
Actual Transfers to EETF
Inflation Adjusted Transfers to EETF
(in M
illio
ns)
Source: OPPAGA analysis of Lottery data.
Revenue Enhancement To maintain the value of Lottery funding to education, the department has implemented new strategies to increase revenue. Its strategic plan focuses on ways to increase transfers to education, including following other states’ proven successes by launching a $20 on-line game (Holiday Millionaire Raffle) in November 2006. To further increase revenues, the Lottery should continue to expand its retailer network to increase sales distribution and expand its use of multi-priced on-line games. The Lottery also could consider adding a super jackpot game or joining a multi-state game. The Legislature could consider expanding Lottery games by authorizing video lottery terminals and a keno on-line game. However, this would entail an expansion of legalized gambling in the state.
Additional retailers have the potential to increase revenues. Increasing the number of retailers (sales terminals) has the potential to increase revenues by making lottery products more readily available to residents and tourists.
Adding 2,000 new retailers has the potential to generate about $32 million annually in additional transfers to the Educational Enhancement Trust Fund. 6 Further, as the state’s population grows and new communities are established, the number of lottery retailers should increase to keep pace with population growth.
Nationwide data about the performance of other state lotteries shows that there is a significant relationship between per capita sales and the number of residents per retailer. That is, the more retailers there are in the population (or the less the population per retailer), the higher the per capita sales. In Fiscal Year 2004-05, the top 10 U.S. lotteries ranked by per capita sales had an average of 1,225 residents per retailer. During this same period, the Florida Lottery averaged 1,451 residents per retailer, and ranked 12th among U.S. lotteries in per capita sales.
6 The estimate assumes all 2,000 terminals are active, that each new
terminal would generate at least the Lottery’s minimum acceptable average weekly sales of $1,200, and that there would be no lost sales by other retailers as a result of adding new terminals. It also assumes that the transfer rate is the current blended on-line and scratch-off ticket transfer rate of 29.6%, and the additional on-line vendor fee would be $190 per terminal per month.
3

OPPAGA Report Report No. 07-09
The Lottery’s long-term statewide goal is to reduce the population per retailer ratio to 1,200 to 1 by increasing the number of retailers (sales terminals) from 13,000 to 15,000. 7 As shown in Exhibit 2, the market penetration of lottery retailers varies across the state. In Fiscal Year 2005-06, the Lottery met its retailer goal in less than a quarter of the counties (15 of 67). In addition, in 31 counties the population per retailer is above the average for the state (1,457:1) and substantially above the Lottery’s long-term goal. The Lottery’s Fort Myers district has the most (9) counties above the average population per retailer likely due to the population growing faster than businesses in the area.
4
The department is actively soliciting retailers through advertising and direct contact and by pursuing leads developed through trade organizations and gaming system vendors, and accessing state agency data on businesses operating in the state. A particular focus is on recruiting more minority retailers to diversify
7 Currently, the Lottery has the spending authority to operate up to
13,000 sales terminals.
minority representation in an effort to comply with Florida statutes. 8
Variable prize payout for on-line games modestly boosts revenues; further expansion is possible. The department reports it does not expect the same increased rate of return from using variable prize payouts for on-line games as it experienced with scratch-off games, but does expect to see an overall positive return from using this strategy. The Lottery used the variable prize payout strategy to increase the percentage of sales that goes to prizes so that players have more opportunities to win. This results in players buying more tickets and increasing the transfer of dollars into the Educational Enhancement Trust Fund.
To initiate the new variable prize strategy to stimulate on-line sales, the Lottery launched Cash for the Holidays during November and December 2005 as an add-on promotion to its existing on-line games. Players who purchased a Florida LOTTO,
8 Section 24.113, F.S., requires that 15% of the retailers shall be
minority business enterprises; however, no more than 35% of such retailers shall be owned by the same type of minority person.
Exhibit 2 Florida Resident Population per Lottery Retailer Varies Across the State With Only 15 Counties Meeting the Lottery’s Long-Term Market Penetration Goal of 1,200 Residents per Retailer
Resident Population per Retailer (n = 12,223)
Meets Lottery Goal (under 1,200:1 )
Between Lottery Goal and Average (1,200:1 to 1,457:1)
Above Lottery Average (over 1,457:1)
Tallahassee District
GainesvilleDistrict
JacksonvilleDistrict
OrlandoDistrict
TampaDistrict
Fort Myers
District
West Palm
BeachDistrict
MiamiDistrict
PensacolaDistrict
Lottery district offices
Source: OPPAGA analysis of Lottery data.

Report No. 07-09 OPPAGA Report
5
Mega Money, or Fantasy 5 ticket of $5 or more could “play, listen and win”. If the terminal played a special holiday tune they would be instant winners of cash prizes from $25 to $1,000, entry vouchers for the Million Dollar New Year’s Eve Drawing, or free Florida LOTTO tickets. The Lottery used a 52% prize payout structure for this game (above the Lottery’s usual 50% for on-line games). The additional 2% was used to pay prizes for the add-on game. The Lottery reports the promotion yielded a net $4.5 million to $5 million in additional transfers to the Educational Enhancement Trust Fund.
In March 2006, the Lottery launched EZmatch, which is an add-on game to Fantasy 5 using a 68% prize payout structure. With the purchase of a Fantasy 5 ticket, players may also purchase a $1 EZmatch play for a chance to win up to $500 instantly. The Lottery reports sales exceeded projections and proved that players are willing to pay more to play the add-on games. During the first week of sales, 43% of Fantasy 5 players also purchased EZmatch with an average of 30% during the first three months, resulting in an additional $9 million in education funding less lost sales from other games.
Based on the success of the EZmatch add-on game with Fantasy 5, the Lottery is considering expanding EZmatch to other on-line games in 2007. Other possible on-line game innovations the Lottery should consider include a multi-price strategy perhaps along with larger guaranteed jackpots similar to Lotto Silver+TM. Lotto Silver+TM is a patented game sold by Lottery Dynamics that offers player’s choice in the price of the on-line game for the chance to win larger jackpots. Lottery Dynamics reports success in increasing sales while maintaining lottery profit margins. The Lottery’s market research indicates there is potential to expand games in this area.
New games have the potential to substantially increase revenues. New games that attract new players have the greatest potential to substantially increase revenues to the Lottery. For example, introducing video lottery terminals could increase transfers to education between $1.1 billion and $1.4 billion while a keno-type game, i.e., a “quick draw” game, could generate between $39 million
and $241 million. 9 These options also would require an expansion of the Lottery’s current operations. Adding a multi-state game, which tend to have large jackpots (such as Mega Millions), could produce between $43 million and $86 million. A super-jackpot game could earn between $24 million and $46 million a year. 10
It should be noted that options such as introducing video terminals or keno would represent a significant expansion of legalized gambling in Florida and would require legislative authorization if terminals were player activated. Also, games such as video lottery terminals and keno-type games are considered to be more addictive than traditional lottery games and could contribute to a problem of pathological gambling.
Operational Efficiency The Lottery continues to improve on a key indicator of operational efficiency, expenses as a percentage of sales. However, it could realize additional efficiencies by ensuring that contract terms represent the best value for the state, and continuing to explore ways to reduce costs for leasing office space and providing field support functions. Improved monitoring of vendor performance could help the Lottery identify further operational efficiencies.
9 OPPAGA revenue estimates for super-jackpot, multi-state, and keno
are based on per capita performance, while revenue estimates for video lottery terminals are based on net income per machine. The super-jackpot range is based on New York’s Millennium game with and without a rollover. The multi-state range is based on cannibalization rates (the amount Lotto sales would decline) from 40% to 70%. The keno range is based on high and low state per capita sales after excluding the outlier states from the upper and lower quartiles. The video lottery terminal range is based on other state’s lowest net income per machine to the highest net income per machine. For super-jackpot, multi-state and keno, the current on-line transfer rate to the Educational Enhancement Trust Fund of 41.3% was used and 50% for video lottery terminal estimates. Lottery administrative costs for operating video lottery terminals at pari-mutuel facilities are assumed to be covered by licensing fees.
10 Keno is an on-line lottery game in which players choose as many as 10 numbers from a panel of 80 numbers in the hope of matching their choices to those drawn by a central computer. Keno is similar in principle to other on-line games, but it is more frequent (normally every five minutes) and normally played in a social setting such as a bar or restaurant. Video lottery terminals are player activated and can be programmed to play casino-style games such as poker, blackjack, keno, and bingo; or simulate mechanical slot machines or roulette wheels.

OPPAGA Report Report No. 07-09
The Lottery’s administrative expense rate is lower than the legislative standard and has continued to decline. Between Fiscal Years 2001-02 and 2005-06, the department reduced total expenses as a percentage of sales revenue from 10.9% to 9.46%. 11 As shown in Exhibit 3, it has consistently kept expense rates below the legislative performance standard. Compared to other state lotteries, the Lottery had the sixth lowest expense rate in Fiscal Year 2004-05. 12
While the Lottery’s administrative expense rate has declined, the actual dollars spent on administrative operations has increased. Between Fiscal Years 2001-02 and 2005-06, total administrative expenses increased 46% from $254 million to $372 million. As shown in Exhibit 4, commissions account for this increase while the remaining Lottery operating expenses remained relatively flat. 13
6
11 Expenses include all costs incurred in the operation and
administration of the Lottery including advertising fees and vendor and retailer commissions.
12 Florida Lottery’s ranking is based on the latest fiscal year data available from La Fleur’s 2006 World Lottery Almanac. The 2007 edition of the almanac will be published in April 2007.
13 Operating expenses include in-house functions such as information services, marketing, public affairs, finance and budget, games administration, product development, security, field support, and other contracted services such as advertising.
Exhibit 3 The Lottery Administrative Expense Rate Continued to Decline in Fiscal Year 2005-06
10.91%
10.21% 10.11%9.81%
9.46%
11.31% 11.19% 11%10.60%
10%
2001-02 2002-03 2003-04 2004-05 2005-06Fiscal Year
Total Administrative Expense RateLegislative Standard
Source: OPPAGA analysis of Lottery performance information submitted to the Legislature.
Alternative contract terms and payment methods could reduce administrative costs. To respond to revenue maximization opportunities, the Lottery has made changes to its product mix. However, contract terms for commissions to vendors and retailers have not changed with the new mix of lottery games and may not provide the most cost-effective way to implement these changes.
Exhibit 4 Commissions Increased While Other Lottery Operating Expenses Remained Relatively Flat
$132
$17$32
$73
$161
$26 $36
$70
$174
$32 $34
$71
$198
$43$28
$71
$225
$49$26
$72
$0
$50
$100
$150
$200
$250
Retailer Commissions Scratch-off VendorCommissions
On-Line VendorCommissions
Operating Expenses
FY 2001-02FY 2002-03FY 2003-04
FY 2004-05FY 2005-06
(in M
illio
ns)
Source: OPPAGA analysis of Lottery financial statements.

Report No. 07-09 OPPAGA Report
In future contracts the Lottery should consider that commissions to vendors and retailers should be structured in such a way to reward them for performance that reflects the volume of tickets sold and their contribution to the Lottery’s bottom line, transfers to the Educational Enhancement Trust Fund.
Commissions to vendors and retailers have increased substantially and disproportionately to the volume of tickets sold. Commissions to vendors and retailers have increased by 190% and 191% respectively, while the number of tickets sold has increased by only 30%. This has occurred because commissions are tied to the dollar value of tickets sold rather than to the number of tickets sold.
When the Lottery introduced higher priced scratch-off games into its product mix, scratch-off ticket vendor commission rates were fixed in the contract and could not be changed. While the Lottery had previously sold only $1, $2, and $5 scratch off-tickets; it began selling $10 and $20 scratch-off games in Fiscal Year 2002-03. With this change, the amount the Lottery paid in commissions for scratch-off tickets increased at a pace that was not commensurate with the number of tickets sold (see Exhibit 5).
Exhibit 5 Scratch-Off Ticket Commissions Increased Disproportionately to the Volume of Tickets Sold
190% 191%
30%
Vendor Scratch-OffTicket Commissions
Retailer Scratch-OffTicket Commissions
Number of Scratch-Off Tickets Sold
% Change Between Fiscal Years 2001-02 and 2005-06
Source: OPPAGA analysis of Lottery financial and ticket sales data.
The number of scratch-off tickets sold between Fiscal Year 2001-02 and 2005-06 increased only 30% from 439 million to 572 million. However, during the same time, the Lottery’s commission paid to vendors who provide the scratch-off
tickets increased by a much larger 190% from $16.8 million to $48.8 million. 14
The Lottery’s contract with the vendor that provides scratch-off games currently requires a commission of 2.25% of scratch-off ticket sales. That is, for each $1 scratch-off ticket manufactured, delivered, and sold the vendor is paid 2.25 cents commission. Correspondingly, for each $20 scratch-off ticket sold, the vendor is paid 45 cents, or 20 times the commission for selling a $1 ticket. While the $5, $10, and $20 scratch-off tickets are more than twice the size of a $1 scratch-off ticket and so would be more costly to produce and transport to retailers, vendor costs for higher dollar value tickets may not fully justify the significantly higher commission paid on these tickets.
Likewise, scratch-off sales commissions paid to the retailers for selling scratch-off tickets increased 191% from $42.5 million to $123.4 million during this same period. The Lottery pays its retailers a 5% commission on tickets sold. That is, for each $1 scratch-off ticket sold, the retailer is paid five cents commission but for each $20 scratch-off ticket is paid $1. Although retailers may provide additional display space in an effort to sell the more expensive $20 scratch-off tickets, their additional efforts may not fully justify the 20 times higher commission.
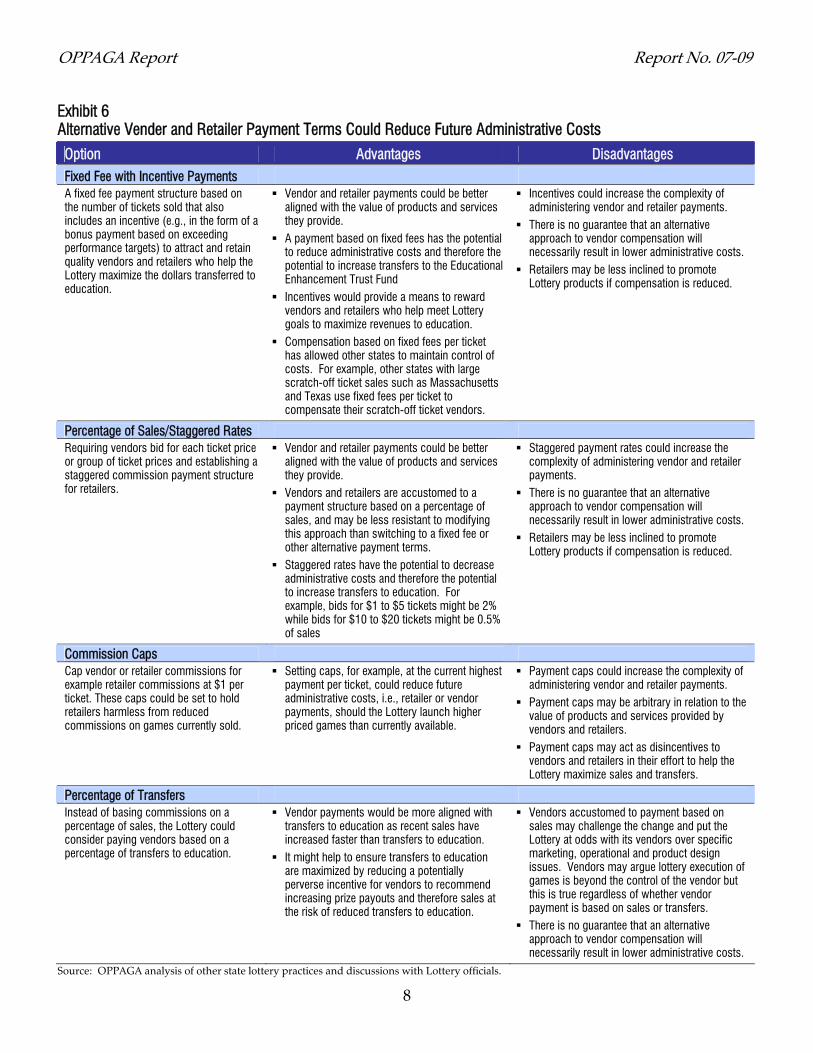
Contract payment terms should be structured to reward vendors and retailers for delivering agreed-upon services and provide incentives to encourage vendors and retailers to help maximize the dollars transferred to the Educational Enhancement Trust Fund. Because the Lottery cannot always predict its future operations, such as if it will sell $25, $30, or higher priced scratch-off tickets or to what extent it will expand the use of multi-priced on-line games, it needs to consider payment arrangements for its vendors and retailers that will allow it to respond to new opportunities without disproportionate increases in administrative costs such as commissions. Exhibit 6 lists alternative vendor and retailer contract payment terms and their associated advantages and disadvantages.
14 Scratch-off ticket vender commission rates were bid at a declining
rate over time from 2.4375% to 2.3% effective January 1, 2003, and to 2.25% effective October 1, 2006.
7
OPPAGA Report Report No. 07-09
8
Exhibit 6 Alternative Vender and Retailer Payment Terms Could Reduce Future Administrative Costs
Option Advantages Disadvantages Fixed Fee with Incentive Payments
A fixed fee payment structure based on the number of tickets sold that also includes an incentive (e.g., in the form of a bonus payment based on exceeding performance targets) to attract and retain quality vendors and retailers who help the Lottery maximize the dollars transferred to education.
Vendor and retailer payments could be better aligned with the value of products and services they provide.
A payment based on fixed fees has the potential to reduce administrative costs and therefore the potential to increase transfers to the Educational Enhancement Trust Fund
Incentives would provide a means to reward vendors and retailers who help meet Lottery goals to maximize revenues to education.
Compensation based on fixed fees per ticket has allowed other states to maintain control of costs. For example, other states with large scratch-off ticket sales such as Massachusetts and Texas use fixed fees per ticket to compensate their scratch-off ticket vendors.
Incentives could increase the complexity of administering vendor and retailer payments.
There is no guarantee that an alternative approach to vendor compensation will necessarily result in lower administrative costs.
Retailers may be less inclined to promote Lottery products if compensation is reduced.
Percentage of Sales/Staggered Rates Requiring vendors bid for each ticket price or group of ticket prices and establishing a staggered commission payment structure for retailers.
Vendor and retailer payments could be better aligned with the value of products and services they provide.
Vendors and retailers are accustomed to a payment structure based on a percentage of sales, and may be less resistant to modifying this approach than switching to a fixed fee or other alternative payment terms.
Staggered rates have the potential to decrease administrative costs and therefore the potential to increase transfers to education. For example, bids for $1 to $5 tickets might be 2% while bids for $10 to $20 tickets might be 0.5% of sales
Staggered payment rates could increase the complexity of administering vendor and retailer payments.
There is no guarantee that an alternative approach to vendor compensation will necessarily result in lower administrative costs.
Retailers may be less inclined to promote Lottery products if compensation is reduced.
Commission Caps Cap vendor or retailer commissions for example retailer commissions at $1 per ticket. These caps could be set to hold retailers harmless from reduced commissions on games currently sold.
Setting caps, for example, at the current highest payment per ticket, could reduce future administrative costs, i.e., retailer or vendor payments, should the Lottery launch higher priced games than currently available.
Payment caps could increase the complexity of administering vendor and retailer payments.
Payment caps may be arbitrary in relation to the value of products and services provided by vendors and retailers.
Payment caps may act as disincentives to vendors and retailers in their effort to help the Lottery maximize sales and transfers.
Percentage of Transfers Instead of basing commissions on a percentage of sales, the Lottery could consider paying vendors based on a percentage of transfers to education.
Vendor payments would be more aligned with transfers to education as recent sales have increased faster than transfers to education.
It might help to ensure transfers to education are maximized by reducing a potentially perverse incentive for vendors to recommend increasing prize payouts and therefore sales at the risk of reduced transfers to education.
Vendors accustomed to payment based on sales may challenge the change and put the Lottery at odds with its vendors over specific marketing, operational and product design issues. Vendors may argue lottery execution of games is beyond the control of the vendor but this is true regardless of whether vendor payment is based on sales or transfers.
There is no guarantee that an alternative approach to vendor compensation will necessarily result in lower administrative costs.
Source: OPPAGA analysis of other state lottery practices and discussions with Lottery officials.
Report No. 07-09 OPPAGA Report
Leased headquarters space still exceeds Lottery needs. Over the past five years the Lottery has paid almost $5 million to lease excess office and warehouse space at the Lottery’s Tallahassee headquarters location; funds that otherwise could have been transferred to the Educational Enhancement Trust Fund. Currently, the Lottery leases more than twice the Department of Management Services (DMS) recommended amount of office space needed per full-time equivalent employee at an annual cost of $929,000. Since the late 1990s the Lottery has reduced its need for office and warehouse space at its headquarters location through staff reductions of 50% and outsourcing of in-house functions including telemarketing and scratch-off ticket distribution. However, the Lottery has not commensurately lowered its operational costs by reducing the amount of space it leases.
The Lottery’s headquarters lease is for 157,653 square feet of space including 129,042 square feet of office space (located mostly on its top two floors of a four-story building) and 28,611 square feet of air-conditioned warehouse space (located on the bottom floor and two stories high). In its ninth year of the 10-year lease (with two 5-year extension options available) the Lottery pays a combined office and warehouse rate of $15.80 per square foot per year for a total of $2.5 million in Fiscal Year 2006-07. 15
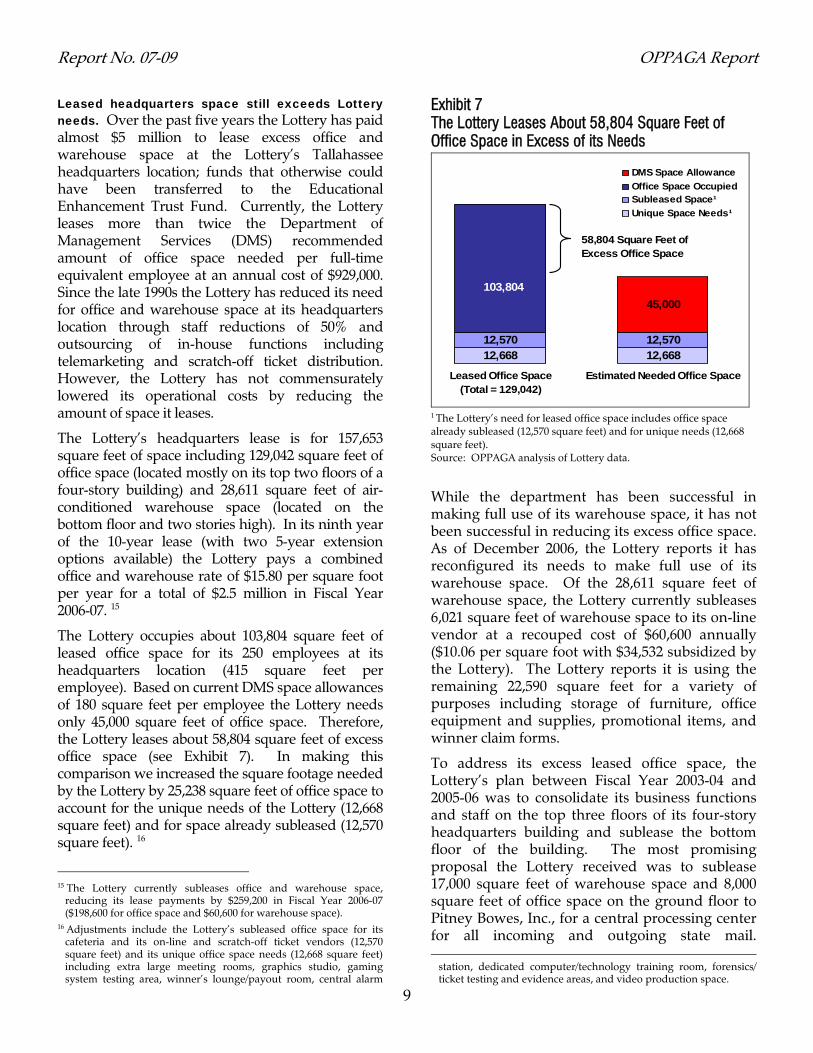
The Lottery occupies about 103,804 square feet of leased office space for its 250 employees at its headquarters location (415 square feet per employee). Based on current DMS space allowances of 180 square feet per employee the Lottery needs only 45,000 square feet of office space. Therefore, the Lottery leases about 58,804 square feet of excess office space (see Exhibit 7). In making this comparison we increased the square footage needed by the Lottery by 25,238 square feet of office space to account for the unique needs of the Lottery (12,668 square feet) and for space already subleased (12,570 square feet). 16
9
15 The Lottery currently subleases office and warehouse space,
reducing its lease payments by $259,200 in Fiscal Year 2006-07 ($198,600 for office space and $60,600 for warehouse space).
16 Adjustments include the Lottery’s subleased office space for its cafeteria and its on-line and scratch-off ticket vendors (12,570 square feet) and its unique office space needs (12,668 square feet) including extra large meeting rooms, graphics studio, gaming system testing area, winner’s lounge/payout room, central alarm
Exhibit 7 The Lottery Leases About 58,804 Square Feet of Office Space in Excess of its Needs
12,668 12,66812,570 12,570
45,000
Leased Office Space(Total = 129,042)
Estimated Needed Office Space
DMS Space AllowanceOffice Space OccupiedSubleased Space¹Unique Space Needs¹
58,804 Square Feet of Excess Office Space
103,804
1 The Lottery’s need for leased office space includes office space already subleased (12,570 square feet) and for unique needs (12,668 square feet). Source: OPPAGA analysis of Lottery data.
While the department has been successful in making full use of its warehouse space, it has not been successful in reducing its excess office space. As of December 2006, the Lottery reports it has reconfigured its needs to make full use of its warehouse space. Of the 28,611 square feet of warehouse space, the Lottery currently subleases 6,021 square feet of warehouse space to its on-line vendor at a recouped cost of $60,600 annually ($10.06 per square foot with $34,532 subsidized by the Lottery). The Lottery reports it is using the remaining 22,590 square feet for a variety of purposes including storage of furniture, office equipment and supplies, promotional items, and winner claim forms.
To address its excess leased office space, the Lottery’s plan between Fiscal Year 2003-04 and 2005-06 was to consolidate its business functions and staff on the top three floors of its four-story headquarters building and sublease the bottom floor of the building. The most promising proposal the Lottery received was to sublease 17,000 square feet of warehouse space and 8,000 square feet of office space on the ground floor to Pitney Bowes, Inc., for a central processing center for all incoming and outgoing state mail.
station, dedicated computer/technology training room, forensics/ ticket testing and evidence areas, and video production space.

OPPAGA Report Report No. 07-09
10
This plan could have generated lease payment savings of more than $350,000 annually. However, Lottery negotiations with Pitney Bowes ended when DMS and Pitney Bowes were unable to finalize an agreement.
In its most recent report to the Legislature, the Lottery indicates it has continued to be unsuccessful in finding tenants to sublease its ground floor office space. The Lottery reports its current plan is to make more efficient and appropriate use of its headquarters office and warehouse space and continue to work with DMS to assist in locating suitable tenants. The Lottery reports it will also consider a possible sub-lease with its advertising vendor and future scratch-off ticket vendor and relocate its nightly draw studio to the headquarters location.
Given the Lottery’s lease for its headquarters building will expire in July 2008, the Lottery should take this opportunity to develop a detailed cost-benefit analysis and plan including options to make efficient use of its headquarters building. We recommend the Lottery continue to work with DMS on a plan to consolidate its lease of office space to current DMS standards where economical, recognizing there would likely be some renovations costs and sublease the excess office space to suitable tenants.
However, if the Lottery finds subleasing to be impractical, it should explore other options including moving to state-owned space, requesting bids for other private leased space, or negotiating with its current landlord for a substantial reduction in cost or reduction in leased space. The Lottery should continue to submit progress reports at least annually to the Governor, Legislature, and OPPAGA.
The Lottery should continue to develop strategies to reduce administrative expenses for its field support function. The Lottery’s estimates based on actual bids showed that it could reduce administrative expenses by $820,000 in the first year and $24 million over 10 years by outsourcing field support services. 17 Savings are mainly attributed to avoiding district lease, employee salary, and vehicle expenses.
17 Field support services include sales representative visits to retailers, delivering new point-of-sale materials, and recruiting and training retailers.
Pursuant to OPPAGA recommendations and proviso language in the 2004 General Appropriations Act, in September 2004 the Lottery submitted a draft business case proposal to the Legislature to competitively source its field support operations. The Lottery also submitted this preliminary business case proposal to the Center for Efficient Government, which was established in March 2004 by Executive Order 04-45.
The Lottery’s proposal evaluated five options: use the results of the open and competitive
bidding process that selected the new on-line vendor and utilize the winning proposal;
reengineer current field support operations; conduct a new open and competitive bid; conduct a separate open and competitive bid
with limited vendor participation (excluding Lottery game vendors); and
maintain the status quo.
The Lottery recommended conducting a new open and competitive bid for two reasons. First, the Lottery planned to increase from 12,000 to 15,000 full-service retailers to increase sales, which may warrant a new bid. Second, the Lottery identified other vendors besides its usual contractors that could effectively provide field support services at a savings to the state. The Lottery was given approval by the Center for Efficient Government to proceed.
Although the Center for Efficient Government approved the Lottery to proceed in February 2005, the Lottery has since not made significant progress on this issue. We recommend the Lottery continue to explore strategies to reduce in-house field support function costs such as adjusting sales representative to retailer ratios. If the Lottery finds it cannot reduce in-house field support costs to be competitive with vendor proposals, the Lottery should continue to develop its proposal and seek advice from the Council on Efficient Government to competitively source its field support function. 18
18 The Legislature enacted Ch. 2006-224, Laws of Florida (s. 287.0571,
F.S.), the Florida Efficient Government Act, creating the Council on Efficient Government, which essentially codifies the Governor’s 2004 initiative and is intended to help state agencies evaluate the feasibility, cost-effectiveness, and efficiency before proceeding with any outsourcing of services.

Report No. 07-09 OPPAGA Report
11
Enhancements to the department’s performance management system could allow the Lottery to identify additional operational efficiencies. While the department monitors key vendor functions, it needs to improve its monitoring and analysis to ensure that the state receives maximum value for its investment in department operations. This could help the department ensure that contracted services are being delivered as specified, identify areas needing improvement, and set performance improvement targets. It could also be used to help identify future service needs that represent a good balance between gaming system performance levels and cost-effective operations for the state.
The Lottery sets performance requirements for contractors by defining deliverables and liquidated damages in contract documents. 19 For example, contract documents specify deliverables such as reports on communication failures that result in down time for lottery gaming systems. The contract documents also set expected levels of performance on the primary indicators that can affect game sales such as timeliness for delivering the scratch-off ticket products to retailers, and on-line ticket terminal failures. Liquidated damages, which are financial penalties for not meeting performance requirements, are also defined in contract documents.
Lottery staff members provide contract oversight by reviewing vendor invoices and reports on system functioning on a regular basis. They also meet with vendors to review the status of items specified in contracts that are pending implementation. 20 In addition, contract managers prepare liquidated damages assessments every six months. These assessments summarize information from daily and monthly reports of vendor performance on key indicators, and assign financial penalties for not meeting the performance expectations specified in contracts.
19 Contractual requirements are specified in four separate kinds of documents: the actual contract between the state and the vendor, including any amendments thereto; memoranda of understanding detailing specific contract provisions; the Request for Proposals (RFP) issued by the department when it initiated the procurement process; and vendor proposals in response to the RFP.
20 Implementation of contract items can be delayed while the department and vendor finalize plans, such as plans for the design of ticket stations.
However, the Lottery does not have a performance management strategy that monitors the delivery of all services, while also assessing performance and looking to future business needs. 21 For example, the department does not have a formalized contract monitoring plan that itemizes all contract provisions, deliverables associated with each provision, and timeframes for assessing vendor performance related to each provision. Lacking this kind of plan, the department has found that while it monitors key performance indicators, it does not have systems in place to know if vendors are delivering all of the services specified in contracts.
In addition to monitoring service delivery, a performance management system should be designed to ensure that contracts for gaming systems and support services offer ongoing value for the money the state spends. Currently, the department does not use all available data to track vendor performance and identify areas where improvement could lead to better outcomes. For example, it does not require vendors to regularly report on the results of retailer satisfaction surveys.
Further, the department does not fully use tracking information to identify areas needing improvement. While performance information on key indicators is compiled every six months, financial and trend analyses are not conducted. For example, the department currently tracks liquidated damages related to contractually specified timeframes for servicing lottery terminals, but it does not analyze actual department costs of performance that does not meet standards set in contracts. Thus, the department does not know the degree to which terminal upkeep affects functioning and, in turn, the availability and capacity of terminals to process lottery sales. This type of analysis for all key indicators would enable the department to target improvement efforts on those areas most likely to affect the Lottery’s ability to generate dollars for education.
A structured approach to tracking the effects of performance trends could also help the Lottery
21 Current contract management approaches, such as the Gateway
Process developed by the British government’s Office of Government Commerce, provide guidance and best practices for developing comprehensive performance management strategies. Florida’s Council on Efficient Government also provides information on best practices.
OPPAGA Report Report No. 07-09
12
define its future service needs. For example, the analyses described above could clarify the effects of performance at levels below those set in contracts and inform the establishment of appropriate liquidated damages levels for future contracts. This information could be used to ensure that future procurements for lottery gaming systems include terms that represent an optimal balance between the desired level of gaming system performance and cost-effective operations for the state.
Recommendations _______ In Fiscal Year 2005-06, the Lottery transferred $1.2 billion to the Educational Enhancement Trust Fund, $121 million more than in Fiscal Year 2004-05. Despite this success, the Lottery continues to face the challenge of sustaining revenue growth and ensuring operational efficiency.
The Lottery and the Legislature have several options to enhance revenues. The department should continue to expand its retailer network to
increase sales distribution and revenues by routinely acquiring information on potential retailers in order to improve its recruitment efforts;
expand its use of multi-priced on-line games; and
consider adding a super jackpot game and joining a multi-state game.
The Legislature could consider expanding Lottery games by authorizing video lottery terminals and a keno on-line game, but this would entail an expansion of legalized gambling in the state.
In order to enhance operational efficiency, the Lottery should take additional steps described below. Consider using alternative vendor and retailer
payment terms in its future contracts to attract and retain quality vendors and retailers while maximizing revenues to the state.
Continue to explore ways to reduce costs for leasing office space by developing a detailed cost-benefit analysis and plan including options to make efficient use of its headquarters building as well as to move to another location.
Continue to explore ways to provide in-house field support functions most efficiently. Alternatively, the department should continue to develop its business case proposal to competitively source its field support function.
Enhance monitoring of vendor performance to help identify further operational efficiencies.
Agency Response_________
In accordance with the provisions of s. 11.51(5), Florida Statutes, a draft of our report was submitted to the Secretary of the Department of the Lottery for review and response.
The Secretary’s written response to this report is in Appendix A.

Report No. 07-09 OPPAGA Report
Appendix A
13

OPPAGA Report Report No. 07-09
14

Report No. 07-09 OPPAGA Report
15
The Florida Legislature
Office of Program Policy Analysis and Government Accountability
OPPAGA provides performance and accountability information about Florida government in several ways.
OPPAGA publications and contracted reviews deliver program evaluation, policy analysis, and justification reviews of state programs to assist the Legislature in overseeing government operations, developing policy choices, and making Florida government better, faster, and cheaper.
Florida Government Accountability Report (FGAR) is an Internet encyclopedia, www.oppaga.state.fl.us/government, that provides descriptive, evaluative, and performance information on more than 200 Florida state government programs.
Florida Monitor Weekly, an electronic newsletter, delivers brief announcements of research reports, conferences, and other resources of interest for Florida's policy research and program evaluation community.
Visit OPPAGA’s website, the Florida Monitor, at www.oppaga.state.fl.us
OPPAGA supports the Florida Legislature by providing evaluative research and objective analyses to promote government accountability and the efficient and effective use of public resources. This project was conducted in accordance with applicable evaluation standards. Copies of this report in print or alternate accessible format may be obtained by telephone (850/488-0021 or 800/531-2477), by FAX (850/487-3804), in person, or by mail (OPPAGA Report Production, Claude Pepper Building, Room 312, 111 W. Madison St., Tallahassee, FL 32399-1475). Cover photo by Mark Foley.
Project conducted by Mark Frederick (850/487-9251), Susan Munley, Ph.D. (850/487-9221), and Rich Woerner
Jane Fletcher, Education Staff Director (850/487-9255) Gary R. VanLandingham, Ph. D., OPPAGA Director