Loss in Carrying Capacity of Water Mains due to ... · Biofouling, and Application to Wslkerton,...
22
19 Loss in Carrying Capacity of Water Mains due to Encrustation and Biofouling, and Application to Wslkerton, Ontario Arif Shahzad and WiiiJam James Encrustation and biofoulin.g causes loss in carrying capacity of water mains and impacts water quality. Encrustation is a build-up of a slimy orange.brown deposit due to precipitation of calcium, iron and magnesium carbonates. Biofouling is the undesirable accumulation of a microbiological deposits in a biofilm layer. Biofilm accumulation is the result of physical, chemical, and biological processes, which play a major part in the microbial characterization of drinking water quality in distnoution networks. In this work, the decrease in pipe diameter and increased pipe roughness are computed as a function of service age of water mains. The method is then applied to the water distribution network in Walkerton, Ontario and the effects of encrustation and biofilm build-up with age and their effects on the hydraulics are investigated. Hydraulic analysis was performed by simulating the flow through the water supply network, assumed to be 100 years old, using EP ANET2. The results indicate that changes in the hydraulic parameters of a network can cause: 1. a change in a flow pattern from reservoirs, 2. water to take a longer time to reach the far end of network, and 3. increased energy cost. It is also concluded that the available empirical model to compute pipe roughness and decrease in pipe diameter after a certain service time cannot be standardized, because of its dependence on the local and transient quality of water from various supply sources. Shahzad, A and W. James. 2002. "Loss in Carrying Capacity of Water Mains due to Encrustation and Biofouling, and Application to Walkerton, Ontario." Journal of Water Management Modeling R208-19. doi: 10.14796/JWMM.R208-19. ©CHI 2002 www.chijoumal.org ISSN: 2292-6062 (Formerly in Best modeling practices for Urban Water Systems. ISBN: 0-9683681-6-6)
-
Upload
nguyenquynh -
Category
Documents
-
view
218 -
download
0
Transcript of Loss in Carrying Capacity of Water Mains due to ... · Biofouling, and Application to Wslkerton,...

19 Loss in Carrying Capacity of Water
Mains due to Encrustation and Biofouling, and Application to
Wslkerton, Ontario
Arif Shahzad and WiiiJam James
Encrustation and biofoulin.g causes loss in carrying capacity of water mains and impacts water quality. Encrustation is a build-up of a slimy orange.brown deposit due to precipitation of calcium, iron and magnesium carbonates. Biofouling is the undesirable accumulation of a microbiological deposits in a biofilm layer. Biofilm accumulation is the result of physical, chemical, and biological processes, which play a major part in the microbial characterization of drinking water quality in distnoution networks.
In this work, the decrease in pipe diameter and increased pipe roughness are computed as a function of service age of water mains. The method is then applied to the water distribution network in Walkerton, Ontario and the effects of encrustation and biofilm build-up with age and their effects on the hydraulics are investigated. Hydraulic analysis was performed by simulating the flow through the water supply network, assumed to be 100 years old, using EP ANET2. The results indicate that changes in the hydraulic parameters of a network can cause:
1. a change in a flow pattern from reservoirs, 2. water to take a longer time to reach the far end of network, and 3. increased energy cost.
It is also concluded that the available empirical model to compute pipe roughness and decrease in pipe diameter after a certain service time cannot be standardized, because of its dependence on the local and transient quality of water from various supply sources.
Shahzad, A and W. James. 2002. "Loss in Carrying Capacity of Water Mains due to Encrustation and Biofouling, and Application to Walkerton, Ontario." Journal of Water Management Modeling R208-19. doi: 10.14796/JWMM.R208-19. ©CHI 2002 www.chijoumal.org ISSN: 2292-6062 (Formerly in Best modeling practices for Urban Water Systems. ISBN: 0-9683681-6-6)

304 Loss in Carrying Capacity of Water Mains due to Encrustation ...
19.1 Introduction
Water distribution networks themselves strongly influence changes in the microbiological quality of the distributed water. These quality changes can cause corrosion and sediment deposition, which in tum enhances the ability of microorganisms to colonize within the encrustation on the interior surface of the distribution system. Previous studies have reported that water main deposits (i.e. encrustation, tubercles and biofilms) contain appreciably higher bacterial populations than are present in the distribution water (Allen et al., 1980; Martin et al., 1982).
Encrustation, a build-up of a slimy orange-brown deposit (Allen et al., 1980), seems to be a major water quality problem in water distribution networks. The kind and amount of dissolved minerals and gases in natural waters determines their tendency to deposit mineral matter as encrustation. The major forms of encrustation include:
1. encrustation from precipitation of calcium and magnesium carbonates or their sulfates,
2. encrustation from precipitation of iron and manganese compounds, primarily their hydroxides or hydrated oxides, and
3. scales caused by slime-producing iron bacteria or other slimeforming organjsms.
Biofoulingis the undesirable accumulation of microbiological deposits on a surface (Characklis, 199Ob). Biofilm accumulation is the result of physical, chemical, and biological processes. These films establish in sediments, corrosion tubercles, static areas of slow water flow, dead ends, and storage tanks (Geldreich and LeCheva1lier, 1999). Biofilms playa majorpart in the microbial characterization of drinking water quality in distribution networks (Mamba et al., 1999a). The deposits may contain micro and macro organisms. Momba et al. (1999b) reported various pathogens including E-coli occurring within biofilms. Fouling deposits in a conduit cause increased fluid frictional resistance by decreasing the effective diameter of pipes and by increasing the effective roughness of the substratum (Characklis, 1990&).
It has been reported by various authors that aging ductile and cast iron pipes show extensive encrustation and biofoulingin watersupplypipes, causing low and negative pressures. Encrustation of a pipe inhibits water flow through the system, overworking pumps and increasing energy costs. Hydraulic losses result in increased pump loads and reduced:fire fighting capacity. Low pressure results from the rough or cracked pipe walls, and corrosion internally on cast iron or steel pipe affects water quality and flow. Pitting on pipe surfaces leads to sediment laden water and fouling of the system. Chlorination requirements rise steadily as pipes become further contaminated and customer complaints

19.2 Flow Through Pipes 305
increase as water quality and pressure deteriorate (Tuovinen et al., 1980; Qasim et aI., 2000). A continuation of this condition can cause rupture of the pipeline and loss of treated water in the distribution system. In this study encrustation and biofilm build-upwithage and its etIecton thehydraulics is investigated, and the findings then applied to the Walkerton, Ontario water distribution system.
19.2 Flow Through Pipes
Conventional design of water supply networks has two primary objectives: 1. tomaiDtainthedesiredpressureandtlowrateatspecific locations
in the system for all conditions of water demand, and 2. to meet the hydraulic requirements with the minimum expense
(MoGhee, 1991). When wateri10ws throuP a pipe, a head loss hloccurs, whicll is the difference in total head betw_ the beginning and end Of the pipe. The head loss hi is explained by boundary layer theory. When a fluid moves over a solid surface, the fluid im.mediate1y in contact with the surface has the same velocity as the surface, which is zero. This "no slip" condition gives rise to a velocity gradient in which fluid further from a surface has a larger velocity relative to the velocity at the surface, thus establishing a shear stress in the fluid. Fluid further away from the solid surface, but adjacent to the slower moving tluid closer to the surface, is decelerated because of, among other things, fluid internal cohesion. Across the pipe centerline the shear stress is zero, and it increases closer to the wall. Most of the time flow in pipes is turbulent When encountering an irregular wall surface, eddies that transfer momentum between faster and slowermoving fluid are generated. This random motion of fluid increases as the mean velocity increases. Thus, in addition to the shear stress that exists for viscous flow, an apparent shear stress exists because of the exchange of fluid during turbulent flow (Qasim et al., 2000).
The flow regime, whether laminar, turbulent, or transitional, is classified by referring to the dimensionless Reynolds's number (Re). For turbulent flow: Re>4000. The most common headloss relations between discharge Q (m3/sec) andheadloss hAm) in pipeline design are theChezy-Manning, Darcy-Weisbach and Hazen-William equations (Qasim et aI., 2000). In this study we use the last equation because of:
1. readily available data on encrustation, and 2. its availability in the EP ANET program (Rossman, 2000), which
we use later in an application to the Walkerton pipe network.

306 Loss in Carrying Capacity o/Water Mains due to Encrustation ...
19.2.1 Hazen-Williams Equation
The Hazen -William equation can be written:
(19.1) where:
CII = unit coefficient (CII = 0.314 for English units, 0.278 for metric units)
Q = discharge in pipes, (gallons/s or m3/s) L = length of pipe, (ft orm) d = internal diameter of pipe, (inches or mm) C = Hazen-Williams roughness coefficient S = the slope of the energy line hiL
The Hazen-Williams coefficient Cis assumed to be constant and independent of discharge. Its value ranges from 140 for smooth straight pipes to 90 or 80 for old, unlined, tuberculated pipe (McGhee, 1991). Values near 100 are typical for average conditions. In SI units, the Hazen-William relation for head loss can be written: 1
{ Q)7ii4 1 hf,lfW = 10.65 C D 4•87 L (19.2)
Use of the Hazen-Williams equation has been discouraged by Liou (1998) because of its limited applicability due to ignoring Reynolds number in establishing Cvalues for different sizes of pipes. Christensen (2000) and Locher (2000) supported Liou (1998) but concluded that the Hazen-Williams formula can be applied over a range of Reynolds number and relative roughness. The Hazen-Williams equation is only valid for water and is not valid for C < 100 (Locher,2000). Swamee (1976 & 2000) demonstrated that the Hazen-Williams equation is conceptually incorrect, because it leads to the illogical inference that in pipe flow the pressure drop depends on the gravitational acceleration. However we have used the Hazen-Williams equation mainly because of the availability of the Sharp and Walski (1988) C-factor relation to pipe age.
19.2.2 C - factor
Sharp and Walski (1988) describe various methods to determine the C-factor, and present a review of pipe roughness data and develop a procedure for computing the C-factor. They took into account work previously done by Colebrook and White (1937) who reported values of roughness growth rate ranging from 0.000005625 mfy to 0.0000532 mfy.

19.2 F10w Through Pipes 307
NEWW A (1935) based on the data collected proposed an equation:
where: a "'" 0.0253 exp (1.9 - 0.5 pH)
a "" roughness growth rate (m/y) pH "'" pH of water
(19.3)
Lamont (1981) took into consideration the water quality and proposed an equation:
where:
a= 10 -(4.08 +o.38El) for U<O (19.4)
a "'" roughness growth rate (ft/y) LI Langelier Index, an indicator of the saturation of
water by calcium carbonate.
Equation 19.4 is only applicable to corrosive water and cannot be used with water of scale-fomling tendencies. Negative values of the Langelier Index (LI) are used in this equation. As there are fewer data available to compute the growth rate for such waters this equation is not applicable to positive LI. Table 19.1 shows the growth rate of roughness with respect to the LI.
Table 19.1 Roughness growth rate for various LI. (From: Lamont, 1981)
Trend Description Growth Rate ftly (mm/y) LJ
1 Slight attack 0.000082 (0.025) 0.0 2 Moderate attack 0.00025 (0.078) -1.3 3 Appreciable attack 0.00082 (0.256) -2.6 4 Severe attack 0.~.~5 (0.779) -3.9
'lrr .
Sharp and Walski (1988) modified the Colebrook-White equation and presented an equation to calculate the C-factor:
C = 18.0 - 37.2 log (X) (19.5) where:
X :::: (eo + at) / D eo initial roughness height (m) a growth rate in roughness height (m/y) t time (y) e = eo + at

308 Loss in Carrying Capacity o/Water Mains due to Encrustation ...
In this equation e is assumed to be a linear function of t. To calculate the growth rate ofrougbness, the engineer must have values of C and pipe age. The slope of the plot between roughness e and age t gives the growth rate a, which can than be used in Equation 19.5 to calculate the Cofactor. If values of C at different ages ofpipe are not available, but the year the pipe was laid is known, Equation 19.4 can be used for known LI to calculate the growth rate which can then be used in Equation 19.5 to calculate the C-factor.
Walski et al. (1989) condu(lted a study of the water supply network in Austin, T~. Tb.e data collected from pipes of age less than 3S y, indicated that eo is 0.001 inches (0.0254 mm) and a is 0.00125 inly (0.03175 mmIy). For pipes older than 3S Y they proposed the following equation:
e "" 0.044 + 0.10 (t-35), t>35 (19.6)
They tUrther modified the Walski and Sharp (1988) Cofactor of Equation 19.4 and presented the Cofactor as a linear function of time:
C"" 145 -1.8 t (19.7)
By comparing C-factors calculated by Equation 19.5 and Equation 19.7, it was observed that the C values are similar in the early life of the pipe, but Equation 19.7 for older ages gives unreasonable roughness (Walski and Sharp, 1988). The decrease in C-factor based on the data from Walkerton is presented in Figure 19.1.
140
110
I . u 80
o
c-tactor VII. of Pipe
20 40 60 80
Age (Years)
Figure 19.1 Decrease in C-factor with age.
- - --100(nm) _150(mn)
_. -··200 (nm)
- - --250(mn) •••• 300(mn)
-··-·400(mn)
120
19.4 Pipe Deterioration 309
19.3 Pipe Material and Water Quality
Pipe materials may be any combination of: cast iron, steel, cement mortar linings, organic linings, reinforced concrete, asbestos-cement, galvanized steel, lead, copper, brass, stainless steel or plastic (pVC.). Throughout the world, it is observed that the inner walls of pipes are corroded or deteriorated by water flowingtbrough the network. The reaction of water with the inner walls of pipe can lead to deposits in the pipes. These deposits contain calcium carbonate if the walls are made of steel, cast iron, galvanized steel or a cement based material.
Water contains various elements in the form ofmolecu1es, ions, microor~ ganisms, and under natural conditions may contain suspended matter such as sand. Water elements maybe classified as major and mlnore1em.ents. The major elements include dissolved atmospheric gases, ions drawn from mineral compounds and ions produced by dissociation of water. All elements other than major elements are categorized as minor elements. These include clayparticles, organic compounds such as humic acids, bacteria, algae, ammonium ions, and the elements that make up divalent ions ordivalentmagnesium. In a distribution system, both major and minor elements are of equal importance, because the treatment used to lower the concentration of some minor elements may influence pH, which is itself a major element. The overall condition of the distribution network is greatly dependent on the composition of major elements. If this composition is unfavorable, it can lead to damage of the inner walls of pipes and can also influence the quality of the water. These factors were important in the well water supplied to Walkerton.
19.4 Pipe Deterioration
Pipe deterioration has been investigated by various authors. Corrosion, encrus~ tation, and biofouling are responsible for the decrease and distortion of the pipe cro.section, increases in surface roughness and reduction of the quality of water. An increase in the hydraulic resistance of pipes (particularly steel or cast iron) is frequently attributed to encrustation of their walls by pipe corrosion or precipitation :from water.
19.4.1 Corrosion
Corrosion may be defined as ''the conversion of a metal to salt or oxide with a loss of desirable properties such as mechanical strength". Internal corrosion is the deterioration of the inside wall or wall lining of a pipe caused by reactions

310 Loss in Carrying Capacity of Water Mains due to Encrustation ...
with water. Internal corrosion plays an important role in the lifespan of the pipe and quality of water in the conveyance system. The process of internal corrosion is very complex and depends on the installed materials, the properties of the distributed water and also on the operating conditions (Wagner, 1993). Pipe deterioration can be the result of physical corrosion of the lining or surface coating of a pipe, chemical dissolution that leaches a pipe's lining or wall material, or electrochemical reactions that remove metal from the wall of the pipe. Corrosion of cast iron or steel may be the result of the formation of anodic and cathodic areas fOrming electrochemical couples on the pipe wall.
19.4.2 Encrustation and Tubercles
Encrustation and tubercle formation is partly a by-product of corrosion. Corrosioainside apipe canlead:to formation offemc hydroxidedeposits on the walls. Pettie hydroxide deposits have a very loose structure tilled with water. This deposit may contain deposits of calcium carbonate. pH and the calcium carbonate saturatioaratio are two major parameters to be considered during the evolution of fettiealcic deposits. The major forms of encrustation include:
1. encrustation from precipitation of calcium and magnesium carboaates or their sulfates,
2. encrustation from precipitation of iron and manganese compounds, primarily their hydroxides or hydrated oxides, and
3. plugging caused by slime-producing iron bacteria or other slime-forming organisms.
Chemical encrustation usually res. from the precipitation of carbonates, principally calcium from groundwatclin the proximity of the well screen. Other substances, such as aluminum silicates and iron compounds, may also be entrapped in the scale-like carbonates that cement sand grains together. Use of chlorine and monochloramine in a distribution system significantly raises the accumulation rate in pipes. Iron and manganese encrustation is another common problem in pumping wells. During pumping, velocity-induced pressure changes can disturb thechemic~equilibrium of the groundwater and result in the deposition of insoluble iron and,tmanganesehydroxides. Thesehydroxides have the consistency of a gel, and $y occupy relatively large volumes; over time, they ultimately harden into scale deposits.
Indicators of encrusting water include: 1. pH above 7.5, 2. if the carbonate hardness of the groundwater exceeds 300 ppm,
encrustation due to deposition of calcium carbonate is likely, 3. if the iron content of the water exceeds 2 ppm, encrustation due
to precipitation of iron is likely, and
19.5 Bio/ouling 311
4. if the manganese content of the water exceeds 1 ppm, coupled withhigh pH, encrustation is extremely likely if oxygenis present
Tubercles fonn under deposit and then become self sustaining (Tuovinen et al., 1980). A3 the metal under the deposit becomes deficient in oxygen it works as an anode and the metal surface outside works as a cathode and thus a corrosion cen is created. This is a common problem in non-flowing water lines like fire water networks. Larson and Skold (1957) condueted laboratory experiments and concluded that tubercles form under conditions of complete protection within pitting corrosion. This is due to the deposition of a supporting structure of calcium cubonate or in the normal corrosion product offerric hydroxide in ae.q.ted waters. If the saturation index or Langelier Index is not zero or the con.centration of calcium or alkalinity are too low, the supportingsttueture will not develop. The process of tubercle formation is complex. The tubercle ~ often starts with a deposit of slime-forming and iron-oxidizing bacteria at a point of low flow velocity. This creates an oxygen concentration cell, thus promoting dissolution of iron under the deposit. As the Fe2+ move outward, they are oxidized to Fe3+; this occurs electrochemically as they encounter a higher oxygen concentration. The resulting corrosion product, Fe{OH)3 mingles with the biodeposit to form the wall of the tubercle. In the presence ofbacteria, the tubercle structure is usually less brittle and less easily removed from the metal surface. A3 the cathodic dissolved oxygen reduction continues, precipitation of calcium carbonate, pH and calcium carbonate saturation ratio decrease, calcium carbonate microcrystals will develop and become m.acrocrystals when they come into contact with each other.
19.5 Biofouling
Biofouling is the undesirable accumulation of microbiological deposits on a surface (Characklis, 1990b). The deposits may contain micro and macro organisms. Fouling deposits cause increased fluid frictional resistance by decreasing the effective diameter of pipes and by increasing the effective roughness of the sub-stratum. Fouling can be a health risk in water supply mains. Biofilms accelerate corrosion due to microbial processes at the biofilm sub-stratum interface, which cause material deterioration and reduce equipment life. Biofilms are ubiquitous, they form for example on sensors, submarine periscopes, sight glasses, heat exchanger tubes and cooling towers. They increase heat transfer resistance, energy losses, and affect performance. In the human body biofilm accumulation on teeth and gums, urinary tract, and the intestine can cause severe health problems (Characldis, 1990a). The fouling process ofbiofilms is described below.
312 Loss in Carrying Capacity o/Water Mains due to Encrustation ...
19.5.1 BiofIfm Processes
Characklis (199Oa) grouped biofilm processes into transport, interfacial transfer, and transformation processes which contribute to biomass accumulation at a substratum. Biofilm accumulation is theresultofthephysical, chemical, and biological processes (Characldis, 19901; Bryers and Characklis, 1992).
It has been illustrated in an experiment that tlow velocity has no impact on ~iofilm formation, but may have an effect on mineral depositionlformation (Delaaoue et aI., 1999). The accumulation rate of a biofilm cell reported by Characldis (199O&) under quiescent conditions is 4170*104 ceDlm2/s and cell concentration is 10.0"1013 cel1Im3• Under laminar tlow conditions the accumulationrateis3*t()4cels/m2/s andtheceRCOJ:1C$1:trationrem.ains 10.0"1013 ceU/ m3 (powen aa4 Slater. 1983). Dryers and Chotacldis (1992) illustrated the increase in cell deposition wllenexposed to biofiltns¢aces. The accumulation rate ofbiofilm cells and attachment of cells to thebiotihns varies with the type of organic moleeules on the substratum, as . weU as temperature of the substratum (Cbaracldis, 1990a; Dryers and Characldis, 1992). The thickness of the biofilm deposits is an important parameter, but is difticult to determine. It has been concluded &om experimental studies that the maximum·thickness ofbiofilm is l00mm(C1laracklis, 199Oa). Duringturbulenttlow conditions part of the biofilm detacl1es &om the surface and the rate of detachment increases as the thickness of the biofilm increases. Sloughing is the random removal of biological film generally due to oxygen and nutrient depletion deep within the biological film. Sloughing of deposits in pipes usually occurs due to sudden changes in hydrodynamic conditions, such as an abrupt increase in velocity.
19.6 Biofllms in Water Distribution Networks
Biofilms playa major part in the microbial characterization of drinking water quality in distribution networks (Momba et al., 1999a). These films establish in sediments, corrosion tubercles, static areas of slow water flow, dead ends, and storage tanks (Geldreich and LeChevallier, 1997). Delanoue et aI. (1999) in an experiment ranked exposed iron pipe highest for deposit accumulation and bacterial growth. Water distribution networks act as a two-phase system with one phase in water and second as the pipe wall and the solid suspended cell particles entrained in the flowing water (Block, 1992). It has been reported by various scientists that at least 50% of bacteria carried by the water are present as aggregates of dimensions greater than 5 mm or attached to the non-biological particles of over 5 mm diameter (Block, 1992). Further information is provided by Wilson (1950), Percival (1998) and Piriou (1999).

19.7 Loss in Carrying Capacity o/Water Mains
19.6.1 Iron Bacteria
313
Iron bacteria cause one type ofbiofouling among several, including the white sulfur slime of sulfur springs (Smith, 1999). Manganese, and even aluminum biofouling is also found in ground water systems (Starkey, 1945). Better descn'bed as iron biofouling, the problem popularly known as ''iron bacteria" is both complex and widespread. It attacks wells and water systems around the world in all sorts of aquifer environments. In some places it causes great damage. in others it is considered a minor nuisance. Iron and other biofouling consists ofbiotilms which inciudelivinganddead bacteria, their sheaths, stalks, secretions and other leavings, and embedded metal oxihydroxide particles (Staltcey, 1945). Galione1la, Ctenotbrix and Leptotbrix are the most commonly recovered iron oxidizing bacteria found in wells and iron pipes of water systems.
Biofouling can be a nuisance. Mineral iron encrustation without the involvement of bacteria is rare in normal ground water environments (Smith, 1999), Generally, iron biofoulingis the cause of iron build-up in wells andpipes. Bacterial iron may build-up quickly compared to mineral encrustation (Smith 1999). In addition to causingproblem.s in wells, the bacteria may colonize tanks and watertreatm.entdevices, as well as spring outfa1ls. Iron biofouling generally causes side effects such as slight and intermittent sulfide odor, breakthroughs of red water, and pitting-type corrosion of iron and steel.
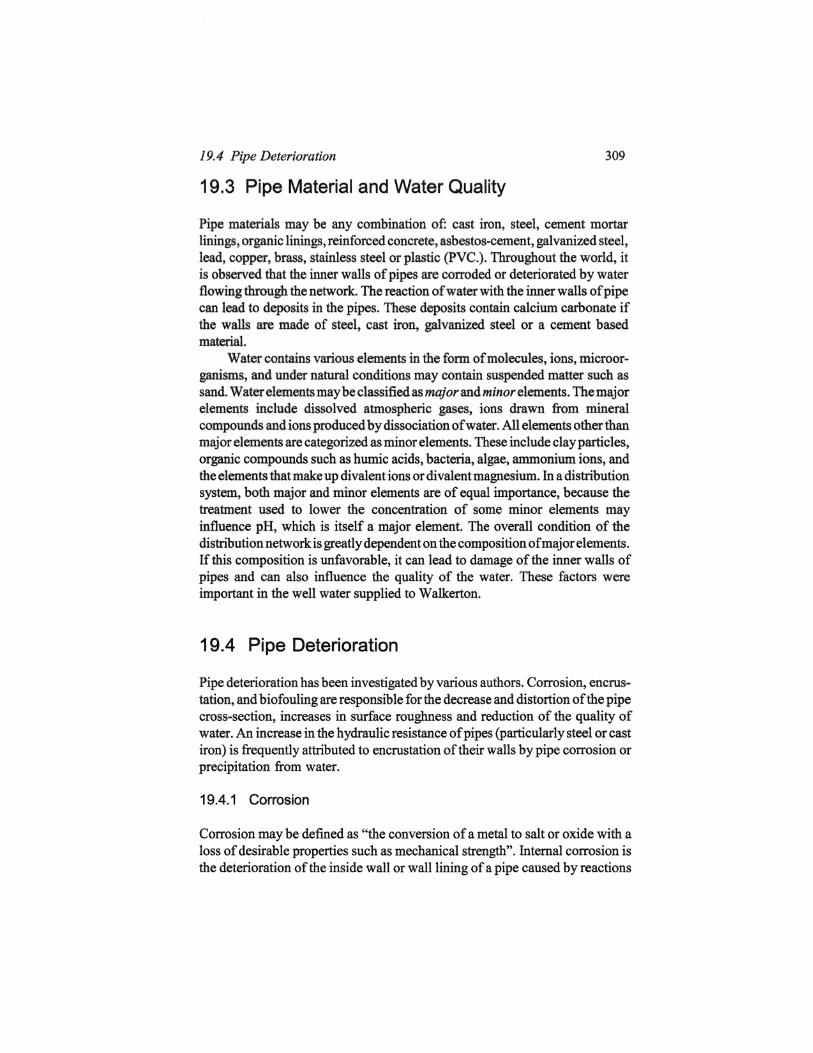
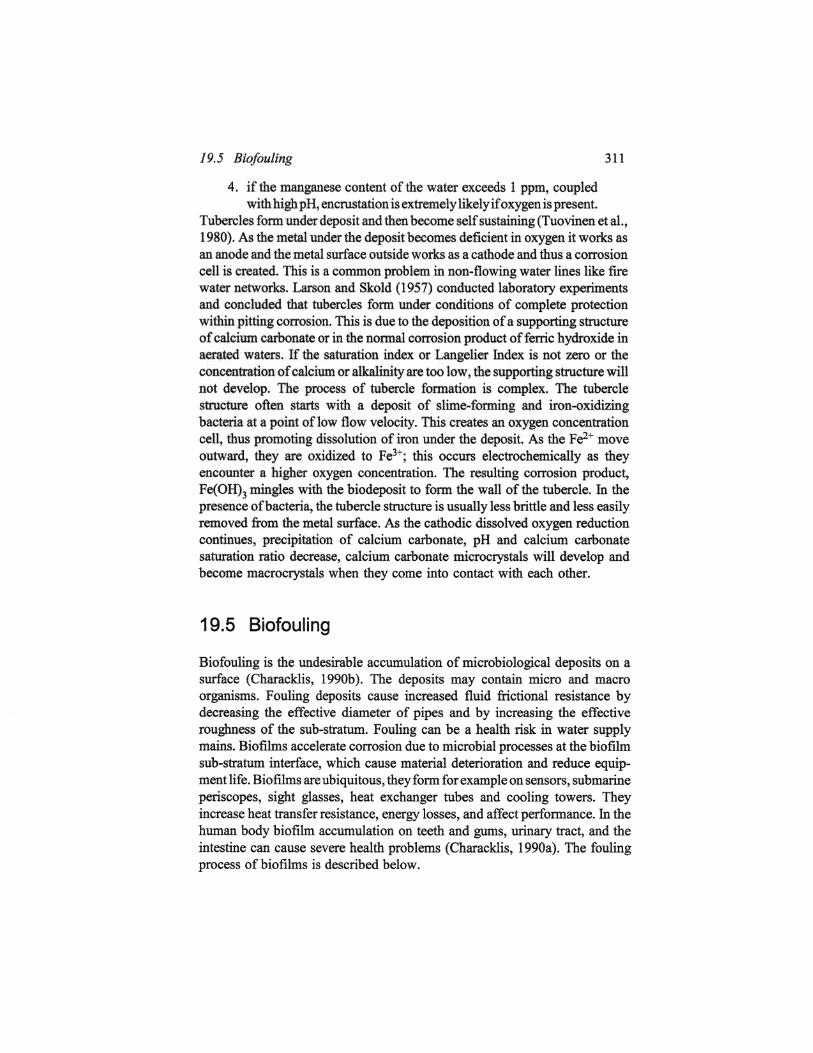
Examples of pipe encrustation, corrosion and biofouling are given in Figures 19.2 to 19.7, photographs of pipes in Walkerton taken in early 2000 and collected by Health Canada.
19.7 Loss in Carrying Capacity of Water Mains
Aging potable water distribution pipe systems are becoming a major concern throughout the world. Deterioration of water quality and service as a result of microbiological tuberculation and corrosion continues to increase (Characklis, 199Ob). Major costs for replacement or rehabilitation of distnbution systems are being faced by most communities. Over the years, microbiological activity has caused pipes to scale with iron oxide deposits that reduce the pipe diameter causing chronic red water discoloration, taste and odor, turbidity and reduced pressure and flow (Starkey, 1945; Larson and Skold, 1957; AWWA, 1962; Larson and So110, 1967; Lamont, 1981; Sharp and Walski, 1988; Mielcarzewicz and Pelka, 1997).
Encrustation and biofouling of pipes inhibits water flow through the system, overworking pumps and increasing energy costs. Low pressure results

314 Loss in Carrying Capacity of Water Mains due to Encrustation ...
from the rou.gh or cracked pipe walls, and corrosion internally on cast iron or steel pipe affects water quality and flow. Pitting on pipe surfaces leads to sediment-laden water and fouling of the system. Hydraulic losses result in increased pump loads and reduced fire fighting capacity. Chlorination requirements rise steadily as pipes become further contaminated and customer complaintsincreaseas waterqu.alityand pressure deteriorate (Qasim et aI., 2000),
Colebrook and White (1937) suggest that the loss of carrying capacity is more due to the increase in piperou.ghness than to the decrease in pipe diameter caused by the roughness elements. Lamont (1981) investigated the increase in MlJlmesaofcastiron pipe walls usingColebrook, Moodyand Hazen.. Williams formu.Its and reported that tubereu1ations can reduce the ~ of cast iron tsains at. 30 y between 15% to 70%, depending upon the desree of COD'OSive attaek and diameter of pipe. Encrustation does not continue to grow indefinitely until it clog the pipes oflarger diameter, but remains stationary after reaching 25-49 mm in thickness (Colebrook and White, 1937). They suggested a uniform growth rate of roughness to predict loss in carrying capacity. Sharp and Walski (1988) using the conceptofLamont (1981 ) developed arelationship between C·factor and roughness height, which was than used to determine the decrease in C with age.
Mielcarzewicz and Pelka (1997) demonstrated. a correlation between the thiclmess of encrustation and pipe diameter with respect to time:
where: St = 0.0169 t 0.439 do 0.84/
St = thickness of encrustation (mm) do = initialdiameterofpipe(mm.)
t = age of pipe (y)
(19.8)
The standard error reported is 3.42 mm., correlation coefficient 0.66 and significance level 0.00093. Without considering the effect of pipe diameter, the following equation was found to have an estimation error of 3.56 mm. and significance level of 0.0001:
(19.9)
Mielcarzewicz and Pelka (1997) further assumed. that the absolute pipe wall roughness is a function of age of pipe and initial roughness. Initial roughness was taken to be 0.6 mm.. By statistically analyzing the available data, they presented the following equation:
kt = 0.6 + 0.104 t (19.10)

19.7 Loss in Carrying Capacity o/Water Mains
Figure 19.3 Encrustation and biofouling in 150 mm cast iron pipe of unknown age. (Source: Health Canada)
315

316 Loss in Carrying Capacity of Water Mains due to Encrustation ...
Ffpre19A~_~in.mm iron pipe. (Souree: HeaIdt Canada)
Figure 19.5 Encrustation and biofouling in iron pipe of unknown age. (Source: Health Canada)
19.7 Loss in Carryin, Capacity of Water Mains
.li1pre *,"' Encrutation and ~ in iron pipe of wdcnownase. (Source: ~Qmada)
%
Figure 19.7 Encrustation and biofouling in copper pipe of unknown age. (Source: Health Canada)
317

318 Loss in Carrying Capacity o/Water Mains due to Encrustation ...
where: kt == roughness in (mm) t == time (y)
The significance level of the correlation in the above equation is 0.0001. the standard deviation error is 2.72 mm. To develop a universal empirical equation, Mielcarzewicz and Pe1ka (1997) correlated roughness of the pipe (kt), age (t), initial diameter (dJ and stability index (ls/' and finally arrived at the following empirical equation:
kt == 0.6 + (0.119 - 0.000203 do - 0.1211,1 t (19.11)
with a si&oificance level ofO.GOOI and a standard estimation error of2.70 mm. Significance levels for t do and t 1st are 0.006 and 0.001, respectively.
The stability index 1st is presented in terms of Strohecker relation (Mielcarzewicz and Pelka, 1997) as follows:
1st = pH -11.39 + 2Jog A (19.12) where:
A == total alkalinity (g of CO2 1m3 )
Limitations which apply to the above equations are as follows: · age of the pipe must be less than 100 y, · initial diameter should be between 100 and 400 mm, and · stability index should be between -1.51 and 0.25. Absolute pipe wall roughness based on Equation 19.12 is demonstrated in
Figure 19.8. Figure 19.9 shows computed pipe roughness as a function of age.
25~------------------------~
O+----r--~----r---~--~--~
o 20 40 60 80 100 120 PIpe Age (yr)
Figure 19.8 Pipe age vs. encrustation thickness.
--100 (mm)
--150 (mm)
-200 (mm) .......... _._- 250 (mm)
- •• 300(mm) ....... 400(mm)

19.8 Hydraulic Analysis of Walkerton Distribution Network 319
12
10
I 8
I 8
'8 4
f 2
20 40 80 80
Absollte Rlughnaaa (mn)
Pipre 19.9 Age vs roughness.
100 120
19.8 Hydraulic Analysis of Walkerton Distribution Network
A hydraulic analysis was performed using EP ANET2 to observe the effects of increasing age of Walkerton distnbution network. on the following variables:
carrying capacity of the network friction factor head loss change in flow rate energy cost
Physical and flow data were obtained from several reports (BGOSU, 2000; Dyke et a1., 2000; Ross, 1992 & 2000). Flow through the Walkerton water distribution network was simulated for a period of one month considering the pipes to be new. Figure 19.10 illustrates the system flow at 7:00 am on the 28th of the month.
At each time period, the "Produced" line on the System Flow plot is the sum of the demands at nodes for which demand is negative (i.e., water is entering the system). The ''Consumed'' line is the sum of demands which are positive. All nodes (junctions, tanks, and reservoirs) are considered in these sums. The difference between water produced and consumed in Figure 19.10 is water enteringlleaving the system from storage.
Simulation was continued for 100 y, by manually changing the biofouling parameters after every 10 y. Figure 19.11 illustrates the flow balance in the distribution network at 90 y of age. The system flow showed obvious changes

320 Loss in Carrying Capacity o/Water Mains due to Encrustation ...
1::::=tJ
FIpre f'.18 System flow at Age'" 0 y.
Figure 19.11 System flow at Age = 90 y.
due to decrease in pipe diameter and increasing roughness. Pressure in the distribution system does not show any significant change with respect to aging pipes over a one month run.
From the above system flow plots it can be seen that the flow rate through the system changes with increasing age. When pumps are off, flow from standpipes to consumers is reduced. Flow through the network is dependent upon the headloss caused by friction between flow of fluid and the pipe wall. As the pipe roughness increases, pumping head increases which results in more energy cost.

19.9 Conclusions 321
19.8.1 Cost of Energy
Total cost of energy was computed after every 10 y of service life of the distnbution network assuming the cost of energy to be $0.08 per kWh. There is a significant increase of$4916 (39.4%) in 40 y and nominal increase ofS1175 (6.31 %) in the remaining 60 y. This is due to the fact that pipe diameter and Cfactor decrease more rapidly in early years.
19.9 Conclusions
This chapter covers an exploration of possible physical changes caused by encrustation, tuberculation and biofilms of pipes in a water distribution pipe network and its effects on the carrying capacity and energy cost over time. Increase in the hydraulic resistance of pipes of cast iron or ductile iron has been attributed to the encrustation of the inside wall and biofouling. Encrustation and biofoulingis evidently responsible for both a decrease in pipe cross section and the deterioration of water quality.
Loss in the carrying capacity of water pipes has been reported by various authors. This study is based on available empirical models. Changes in the diameter, roughness factor C, growth rate of roughness and thickness of encrustation with respect to time were estimated for Walkerton ON. The estimated physical changes in pipes, when compared with the existing (May, 2000) water pipes in Walkerton, revealed variations from pipe to pipe. It is concluded that encrustation, tuberculation, biofouling, corrosion and biofilms in a pipe network cannot be modeled simply, because of its dependence on the transient quality of water supplied. Available models do not consider gradual tuberculation and biofouling as a time-dependent variable. Biofilm growth and corrosion are interrelated processes in a water distribution system. Energy cost rises due to increased resistance in pipes and headloss. It is estimated that for Walkerton there would be an increase of $4916 (39.4%) in 40 y and nominal increase of $1175 (6.31 %) in the remaining 60 y. The higher rate of increase is because pipe diameter and C-factor decrease more rapidly in early years.
Acknowledgments
Bill James supplied the original idea to study the physics of water distribution network biofouling, and Arif conducted the literature review and computer runs under the advisement of Bill. Rob Myers at Health Canada

322 Loss in Carrying Capacity o/Water Mains due to Encrustation ...
supplied the raw data and photographs for Walkerton. Bill developed the EP ANET2 data file and interpreted the results. Arif wrote and successfully defended his report for the M.Eng degree at the University of Guelph a few months after the tragic contamination of the Walkerton network, and before the enquiry ended. Thanks to Health Canada for providing the opportunity to apply the ideas to a real water problem.
References
Allen, MJ .• R.H. Taylor, and B.B. Geldreich, (1980). Occurrence of Microorganisms in Water Main Encrustations. Journal 0/ the American Water WorA;, Association, Vol. 72, 11, pp. 614 -625.
AWWA California Section, (1962). Loss of Carrying Capacity in Water mains. JOU1'1Ull o/the American Water Worb Association, Vol. 54, 10, pp. 1293.
BOOSU, (2000). The Investigative Report of the Walkerton Outbreak: of Waterborne Gastroenteritis, May-June, 2000. By Bruce-Grey-Owen Sound Health Unit.
Block, J.C. (1992). Biofilms in Drinking Water Distribution Systems. Bio:films-Science and Technology. Ed. L.F. Melo et al. Kluwer Academic Publisher, pp. 469-485.
Bryers, J.D., and W.O. Characklis, (1992). Biofilms Accumulation and Activity: A process Analysis Approach. Biofilms-Science and Technology, Ed. L.F. Melo et al. KJuwer AcademiC Publisher, pp. 221-237.
Characldis, W.O. (19908). BiofilmProce:sses. Biofilms, Ed. Characldis, W.O. andK..C. Marshall. Published by John Wiley & Sons, Inc. pp. 195-231.
Characklis, W.O. (1990b). Microbial Fouling. Biofilms, Ed. Characklis, W.O. andK..C. Marshall. Published by John Wiley & Sons, Inc. pp. 523-584.
Christensen, B.A., (2000). Discussion on "Limitations and proper Use of the HazenWilliam Equation." Journal 0/ Hydraulic Engineering. Vol. 126, pp. 167-170.
Colebrook, C.F. and C.M. White, (1937). The Reduction of the Carrying Capacity of Pipes with Age. Journal Institute 0/ Civil Engineers, London, Vo1.10, no. 99.
Delanoue, A., D.M. Holt, H.A. Anderson, S.M. McMath, S.E. Smith, C.A. Woodward, A.R. Fraser and M. Roe, (1999). Analysis of Material(Biofilm) Present on the Internal Surfaces of a Drinking Water Distribution System. Special Publications o/Royal Society o/Chemistry, 1999,.Vol. 242, pp. 202-209.
Dyke, M.V., A. Scott, D.V. Bakel, L. Gin, and O. Palmateer, (2000). Investigations to Trace the Source of Contamination and Monitor Disinfection of the Drinking Water System in Walkerton, Ontario. GAP EnviroMicrobial Services Inc.
Oeldreich, E.E and M. LeChevallier, (1999). Microbiological Quality Control in Distribution System. Water Quality and Treatment, A handbook of Community Water Supplies. Ed. R.D. Letterman, 5th edition. McGraw-Hill, Inc. 1999.
Lamont, P.A. (1981). Common Pipe Flow formulas compared with the theory of Roughness. Journal o/the American Water Works Association, Vol. 73, 5, pp. 274-279.
References 323
Larson, T.E., and R. V. Skold, (1957). Corrosion and Tuberculation of Cast Iron. Journal oftM American Water Works Association, Vol.49, 10, pp. 1294-1302.
Larson. T.E and F.W. 80110, (1967). Loss in Water Main Carrying Capacity. Journal oftM American Water Wol'ks Association, Vol. 59, 12, pp. 1565.
Le Chevallier M.W. (1997). Biofilms in water distribution systems: control and remediation. Proc. Of a Conf. at the Univ. of Warwick, UK.
Liou,C. P.,(1998). Limitations and ProperUseoftheHazen-William Equation. Journal of Hydraulic Engineering. Vol. 124, no. 9, pp. 951-954.
Loeber, F.A •• (2000). Discussion on "Limitations and Proper Use of the HazenWilliams Equation" Journal of Hydraultc Engineering. Vol. 126, pp. 167-170.
Martin, ltS., W.H. Gates, R.S. Tobin, D. Grantham, and I.. Sumarab, (1982). Factors Affecting Coliform Baoteria Orowth in Distribution systems, Journal of the .A.msrlcan Water works. As6OClation. Vol. 74,1. pp 34-37.
McGhee, T.J. (1991), Water Supply and SeweraBe. 6th edition, McGraw Hill series in Water Resources and Environlneata1 engineering. McGraw Hill Inc.
Mie1carzcwicz, E.W. and H. Pelka, (1997). Hydranlic characterization of old water pipelines. Environment Protection Engineering, no. 1-2, Pl'. 71·84.
Momba, MasgyN. B., T. E. Cloete, S. N. Venter, andR. Kfir, (1999a). Disinfection Processes on the Formation of Biofilms in Potable Surface Water Distribution System. Water Science Technology. Vol. 38, no. 8-9, 283-289.
Momba,MasgyN. B., T. E. Cloete, S. N. Venter, andR. Kfir.(l999b). Examination of the Behavior of Escherichia Coli in Biofilms Establishment in Laboratory-Scale Units Receiving Chlorinated and Chlorominated.. Water Science Technology. Vol. 33, no. 13, pp. 2937-2940.
NEWWA, (1935).New England Water Works association. Committee on Pipeline Friction Coefficients. Swnmary of Report. Journal NEWW A. Vol. 49, no 239.
Percival, S.L. (1998). Review of Potable Water Biofilms in Engineered System. British Co1'1'OSion Journal. Vol. 33, no. 2, pp. 130-139.
Piriou, P., D. Dukan and Y. Levi, (1999). Modeling Biofilms Dynamics in Drinking Water Distribution System. Special Publications of Royal Society of ChemiStry, 1999,.VoI.242,pp.61-71.
Powell, M.S. and N .K.H. Slater, (1983). Biotechnology, Bioengineering, Vol. 25, 891-900.
Qasim, S.R., E.M. Motley, G. Zhu, (2000). Water Works Engineering, Planning Design & Operation. Published by Prentice HallPTR. Prentice - Hall, Inc.
Ross and Associates Ltd. (1992). Town of Walkerton Public Utilities Commission Water Distribution System Rehabilitation Needs Study.
Ross and Associates Ltd. (2000). Municipality of Brockton. Contamination of Walkerton water Supply. http://www.brocktonbuzz.comlreportlreporttoc.html
Rossman, L.A., (2000). EP ANET2 User Manual. National Risk Management Research Laboratory. Offlce of Research and Development, U.S. E. P. A.
Sharp, W.W., and Walski, T.M. (1988). Predicting Internal Roughness in Water Mains. Journal of the American Water Works Association, Vol. 80, II, pp 3440.
Smith, S.A., (1999). Primer on Microbial Problems in Water Wells. http:// www.groundwatersvstems.coml

324 Loss in Carrying Capacity of Water Mains due to Encrustation ...
Starkey, R.L., (1945), Transformation of Iron Bacteria in water. Journal 0/ the Amerlcan Water WorkY Association, Vol. 37, 10, pp. 963-984.
Swamee, P.K.. (2000). Discussion on "Limitations and proper Use of the HazenWilliam Equation." Journal o/Hydraulic Engineering. Vol. 126, pp. 167-170.
Swamee. P.K. and Iain, A.K. (1976). ExplicitEquation for Pipe-Flow Problems. Journal o/Hydraulics division. Vol. 102, p. 657.
Tuovinen, O.H.,K.S. Button,A. Vuorinen, L. Carlson, and D.M. Mair (1 980). Bacterial, Chemical, and Mineralogical Characteristics of Tubercles in Distribution Pipelines. Journal o/the American Water Works Association, Vol. 72, 11, pp 626-635.
Wagner, I. (1993). International report: Internal corrosion of pipes in public water distribution networks. Water Supply, Vol. 12, no. 1-2, pp. 1R.7-1-1R.7-S.
Walski, T .M.,I.D. Edwards. and V.M. Hearne, (1989). Loss of Carrying Capacity in Pipes. Environmental Engineering Proceedings 01 the 1989. Specialty Conference, Austin, Texas, July 1fJ..12. PublishM. by ASCE.
Wilson, C. (1950), Control of Growths in California Distribution System-Panel Discussion. Journal o/the Amerlcan Water Works Association, Vol. 42, 9, p. 849.