Los Angeles: Haves and Have-Nots Lead to a Divided System · 2018. 1. 2. · Los Angeles: Haves and...
12
C ALIFORNIA HEALTHCARE FOUNDATION california Health Care Almanac July 2009 regional markets issue brief Los Angeles: Haves and Have-Nots Lead to a Divided System Los Angeles Market Background Los Angeles (L.A.) County’s population of 9.9 million comprises more than a quarter of all state residents (see Table 1 on page 2). The market’s population growth rate has been below the state average (8 percent in the past decade compared with the state average of 14 percent), but it represents a significant number of new residents given the large population base. Besides population size, the L.A. region is remarkable for its diversity. It has a lower proportion of whites, and a higher proportion of African Americans, Latinos, Asians, foreign-born residents, and adults with limited or no English language skills compared with California as a whole. Los Angelinos face considerable educational, economic, and health challenges. Educational attainment among L.A. residents is somewhat lower than for California as a whole. The proportion of households with annual incomes above $50,000 is lower than the state average, and the proportion of the population living in poverty is significantly higher than for California overall. Unemployment in L.A. reached 10.8 percent in January 2009, nearly two-thirds higher than a year ago and slightly higher than the state average of 10.6 percent. Los Angeles residents are more likely to be uninsured or covered by Medi-Cal than residents of the state as a whole, and they are more likely to report fair or poor health than Californians generally. Many large employers have left Los Angeles, leaving a market of largely mid- to small-sized firms, although several large firms with headquarters elsewhere do have significant operations in the area. Labor unions are strong in L.A., especially those in the entertainment, health care, and public sectors. Health care unions exercise strong influence over policy decisions such as proposed closures of hospitals and county clinics. A Fragmented Hospital Market of Haves and Have-Nots In contrast to hospital markets in northern California, the fragmented L.A. hospital market is not dominated by any one health system, and has not moved toward greater consolidation. In addition to a large safety-net hospital (Los Angeles County + USC Medical Center), the market includes several large and successful institutions that have a corner on the tertiary and quaternary care markets (including three of the market’s teaching hospitals: Cedars-Sinai Medical Center, Ronald Reagan UCLA Medical Center, and USC University Hospital), and many small- to mid-sized independent community hospitals that fairly evenly divide the remainder of the market. On average, hospitals in L.A. are not doing well financially. However, financial well-being is not distributed equally among L.A. hospitals, as they break down into two distinct financial performance categories: the haves and the have-nots. Much of the divergence in fortune is related to geography. Hospitals on the west side of the county tend to serve a predominantly affluent population, and hospitals in other areas of the county serve predominantly low-income people. Of the nearly dozen hospitals that have closed since 2003, most have been in the southern part of the county, where there are higher rates of poverty and fewer health care resources. Financially weak hospitals outnumber financially strong hospitals in the market, and the gap between the two groups is widening. As a hospital respondent explained,
Transcript of Los Angeles: Haves and Have-Nots Lead to a Divided System · 2018. 1. 2. · Los Angeles: Haves and...

CAL I FORNIAHEALTHCAREFOUNDATION
californiaHealth Care Almanac
J u l y 2 0 0 9r e g i o n a l m a r k e t s i s s u e b r i e f
Los Angeles: Haves and Have-Nots Lead to a Divided SystemLos Angeles Market BackgroundLos Angeles (L.A.) County’s population of 9.9 million
comprises more than a quarter of all state residents (see
Table 1 on page 2). The market’s population growth rate
has been below the state average (8 percent in the past
decade compared with the state average of 14 percent),
but it represents a significant number of new residents
given the large population base. Besides population size,
the L.A. region is remarkable for its diversity. It has a lower
proportion of whites, and a higher proportion of African
Americans, Latinos, Asians, foreign-born residents, and
adults with limited or no English language skills compared
with California as a whole.
Los Angelinos face considerable educational, economic,
and health challenges. Educational attainment among L.A.
residents is somewhat lower than for California as a whole.
The proportion of households with annual incomes above
$50,000 is lower than the state average, and the proportion
of the population living in poverty is significantly higher than
for California overall. Unemployment in L.A. reached 10.8
percent in January 2009, nearly two-thirds higher than a year
ago and slightly higher than the state average of 10.6 percent.
Los Angeles residents are more likely to be uninsured or
covered by Medi-Cal than residents of the state as a whole,
and they are more likely to report fair or poor health than
Californians generally.
Many large employers have left Los Angeles, leaving a
market of largely mid- to small-sized firms, although several
large firms with headquarters elsewhere do have significant
operations in the area. Labor unions are strong in L.A.,
especially those in the entertainment, health care, and public
sectors. Health care unions exercise strong influence over
policy decisions such as proposed closures of hospitals and
county clinics.
A Fragmented Hospital Market of Haves and Have-NotsIn contrast to hospital markets in northern California,
the fragmented L.A. hospital market is not dominated by
any one health system, and has not moved toward greater
consolidation. In addition to a large safety-net hospital (Los
Angeles County + USC Medical Center), the market includes
several large and successful institutions that have a corner on
the tertiary and quaternary care markets (including three of
the market’s teaching hospitals: Cedars-Sinai Medical Center,
Ronald Reagan UCLA Medical Center, and USC University
Hospital), and many small- to mid-sized independent
community hospitals that fairly evenly divide the remainder
of the market.
On average, hospitals in L.A. are not doing well
financially. However, financial well-being is not distributed
equally among L.A. hospitals, as they break down into two
distinct financial performance categories: the haves and the
have-nots. Much of the divergence in fortune is related to
geography. Hospitals on the west side of the county tend to
serve a predominantly affluent population, and hospitals in
other areas of the county serve predominantly low-income
people. Of the nearly dozen hospitals that have closed since
2003, most have been in the southern part of the county,
where there are higher rates of poverty and fewer health care
resources. Financially weak hospitals outnumber financially
strong hospitals in the market, and the gap between the
two groups is widening. As a hospital respondent explained,
©2009 California HealthCare Foundation 2
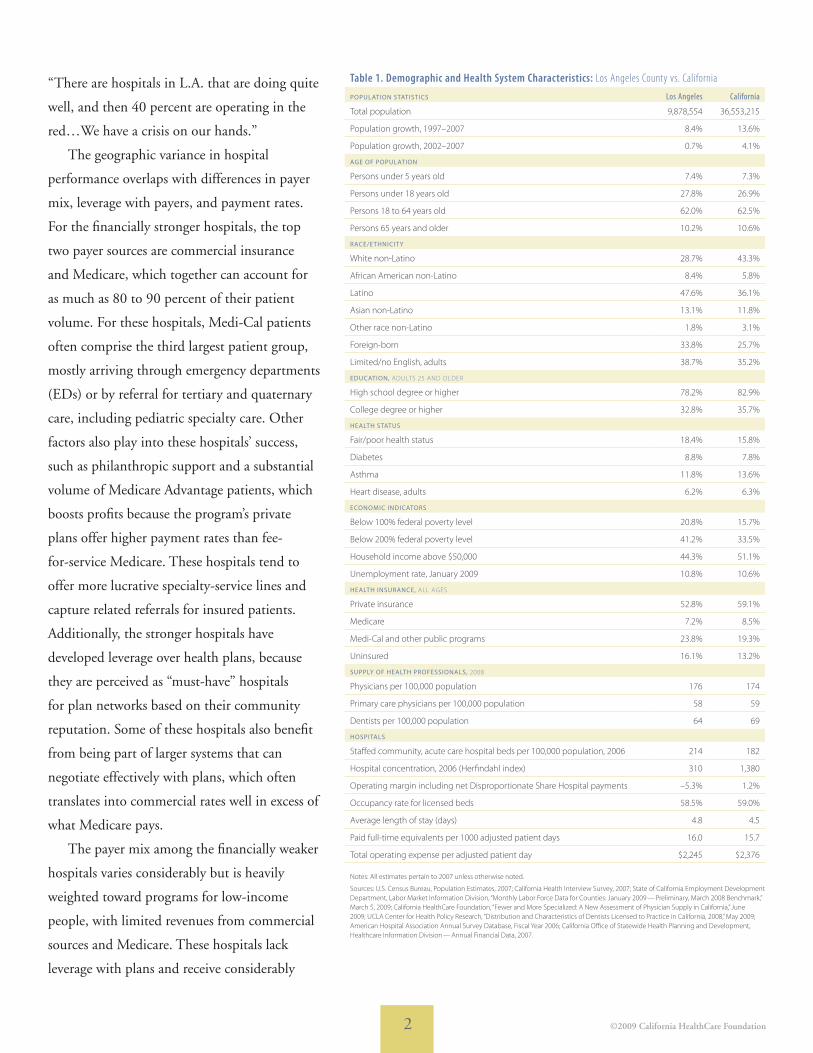
Table 1. Demographic and Health System Characteristics: Los Angeles County vs. California
PoPulation StatiSticS Los Angeles California
Total population 9,878,554 36,553,215
Population growth, 1997–2007 8.4% 13.6%
Population growth, 2002–2007 0.7% 4.1%
age of PoPulation
Persons under 5 years old 7.4% 7.3%
Persons under 18 years old 27.8% 26.9%
Persons 18 to 64 years old 62.0% 62.5%
Persons 65 years and older 10.2% 10.6%
Race/ethnicit y
White non-Latino 28.7% 43.3%
African American non-Latino 8.4% 5.8%
Latino 47.6% 36.1%
Asian non-Latino 13.1% 11.8%
Other race non-Latino 1.8% 3.1%
Foreign-born 33.8% 25.7%
Limited/no English, adults 38.7% 35.2%
education, AduLTs 25 And OLdEr
High school degree or higher 78.2% 82.9%
College degree or higher 32.8% 35.7%
health StatuS
Fair/poor health status 18.4% 15.8%
diabetes 8.8% 7.8%
Asthma 11.8% 13.6%
Heart disease, adults 6.2% 6.3%
economic indicatoRS
Below 100% federal poverty level 20.8% 15.7%
Below 200% federal poverty level 41.2% 33.5%
Household income above $50,000 44.3% 51.1%
unemployment rate, January 2009 10.8% 10.6%
health inSuRance, ALL AgEs
Private insurance 52.8% 59.1%
Medicare 7.2% 8.5%
Medi-Cal and other public programs 23.8% 19.3%
uninsured 16.1% 13.2%
SuPPly of health PRofeSSionalS, 2008
Physicians per 100,000 population 176 174
Primary care physicians per 100,000 population 58 59
dentists per 100,000 population 64 69
hoSPitalS
staffed community, acute care hospital beds per 100,000 population, 2006 214 182
Hospital concentration, 2006 (Herfindahl index) 310 1,380
Operating margin including net disproportionate share Hospital payments –5.3% 1.2%
Occupancy rate for licensed beds 58.5% 59.0%
Average length of stay (days) 4.8 4.5
Paid full-time equivalents per 1000 adjusted patient days 16.0 15.7
Total operating expense per adjusted patient day $2,245 $2,376
notes: All estimates pertain to 2007 unless otherwise noted.
sources: u.s. Census Bureau, Population Estimates, 2007; California Health Interview survey, 2007; state of California Employment development department, Labor Market Information division, “Monthly Labor Force data for Counties: January 2009 — Preliminary, March 2008 Benchmark,” March 5, 2009; California HealthCare Foundation, “Fewer and More specialized: A new Assessment of Physician supply in California,” June 2009; uCLA Center for Health Policy research, “distribution and Characteristics of dentists Licensed to Practice in California, 2008,” May 2009; American Hospital Association Annual survey database, Fiscal Year 2006; California Office of statewide Health Planning and development, Healthcare Information division — Annual Financial data, 2007.
“There are hospitals in L.A. that are doing quite
well, and then 40 percent are operating in the
red…We have a crisis on our hands.”
The geographic variance in hospital
performance overlaps with differences in payer
mix, leverage with payers, and payment rates.
For the financially stronger hospitals, the top
two payer sources are commercial insurance
and Medicare, which together can account for
as much as 80 to 90 percent of their patient
volume. For these hospitals, Medi-Cal patients
often comprise the third largest patient group,
mostly arriving through emergency departments
(EDs) or by referral for tertiary and quaternary
care, including pediatric specialty care. Other
factors also play into these hospitals’ success,
such as philanthropic support and a substantial
volume of Medicare Advantage patients, which
boosts profits because the program’s private
plans offer higher payment rates than fee-
for-service Medicare. These hospitals tend to
offer more lucrative specialty-service lines and
capture related referrals for insured patients.
Additionally, the stronger hospitals have
developed leverage over health plans, because
they are perceived as “must-have” hospitals
for plan networks based on their community
reputation. Some of these hospitals also benefit
from being part of larger systems that can
negotiate effectively with plans, which often
translates into commercial rates well in excess of
what Medicare pays.
The payer mix among the financially weaker
hospitals varies considerably but is heavily
weighted toward programs for low-income
people, with limited revenues from commercial
sources and Medicare. These hospitals lack
leverage with plans and receive considerably
©2009 California HealthCare Foundation 3
lower payment rates; one respondent cited a lower-end
medical-surgical commercial rate of 55 to 60 percent of what
Medicare pays. Financially weaker hospitals actively compete
for Medi-Cal patients, even though Medi-Cal reportedly
pays only 60 to 70 percent of costs, as it may be their only
major third-party payer. In addition, serving Medi-Cal
patients is a strategy for have-not hospitals to receive Medi-
Cal disproportionate share hospital (DSH) funds, which can
mean the difference between being profitable or not.
Small community hospitals (many of them have-nots)
are reportedly undercapitalized and consequently face
difficulty funding construction to comply with the state’s
seismic requirements, a significant issue for L.A. hospitals.
In contrast, some of the larger teaching hospitals either do
not need retrofitting or have already completed any necessary
renovations or new construction, in part supported by
philanthropy.
Prime Healthcare Services has a particularly controversial
strategy in L.A. (and elsewhere in California). The firm
buys financially ailing hospitals — including three in L.A.
County in the past three years — cancels existing commercial
contracts, encourages admissions of patients through the ED,
and then bills health plans full charges. Prime Healthcare’s
strategy also included billing patients if the hospital was not
paid in full, but a January 2009 state Supreme Court ruling
now precludes hospitals from billing ED patients for charges
their plans do not pay. While Prime Healthcare’s approach
has been contentious, it appears to have been successful. For
example, it was viewed by some respondents as responsible
for the rapid financial turnaround of Centinela Hospital
Medical Center. One respondent explained that the root of
Prime Healthcare’s business model is in the haves/have-nots
dichotomy: “If these hospitals had been getting rates from
plans and Medi-Cal that [were] the same as those with the
clout, this wouldn’t have been necessary. The haves and have-
nots are causing this.”
Overall hospital capacity in the Los Angeles market has
shrunk, a trend viewed with concern by respondents amid
predictions that the local population will continue to grow
substantially. Still, L.A. has a comparatively higher acute care
bed ratio per 100,000 residents than the state overall (214
versus 182). The fact that two major teaching hospitals —
Ronald Reagan UCLA Medical Center and Los Angeles
County + USC Medical Center (LAC+USC) — recently
were rebuilt with fewer beds has contributed to concerns
about inadequate bed supply. LAC+USC, for instance, was
downsized by about 100 beds.
Among the region’s hospital closures, the 2007 closure
of the county’s Martin Luther King Jr.-Harbor Hospital
particularly stressed the health care system in L.A. and was
widely viewed as poorly planned. The closure was criticized
both for having large negative effects on access to care for
residents in South L.A. and for burdening neighboring
hospitals that these patients turned to for services. Although
the county contracted with a number of community
hospitals to provide services for the former hospital’s patients,
respondents suggested that these hospitals may not have had
sufficient bed capacity to cope with the increased demand.
At some capacity-strapped hospitals, emergency
department wait times are increasing as patients awaiting
hospital beds remain in the ED. At these hospitals, walk-in
patients experience long wait times and paramedics face long
“wall times” as they must “stand at the wall,” sometimes for
hours, unable to relinquish care until the hospital can admit
their patient.
Some respondents suggested that in addition to a
shortage of beds, a lack of staff also contributes to hospitals’
capacity constraints. As in other areas of the state, L.A.
hospitals struggle to maintain a sufficient and affordable
supply of nurses. The state-mandated nurse staffing ratios
and high levels of unionized workers reportedly create
additional staffing pressures for hospitals.
©2009 California HealthCare Foundation 4
Fiscal Pressures Prompt Physicians to Seek New OpportunitiesThe supply of physicians in the Los Angeles market
is comparable to that of the state on average. There
are 58 primary care physicians per 100,000 residents,
compared with 59 statewide, and 176 physicians overall
per 100,000 residents, compared with 174 statewide.
Solo and small-group practice is the dominant physician
practice arrangement in Los Angeles. Some specialists have
consolidated into single-specialty groups to be better able
to support specialized cancer services, such as transfusion
centers and radiation therapy. However, such consolidation is
often not successful; as one physician respondent explained,
“Every time you get five to seven doctors [together], they
split apart the next year. There was a cardiology group…of
12 and they fragmented. It seems to be a cultural thing. We
don’t trust anyone in Los Angeles.”
The L.A. market’s largest multi-specialty groups are those
affiliated with HMOs and include the Kaiser Permanente
Medical Group and Healthcare Partners Medical Group.
Somewhat smaller, but still large, are the multi-specialty
groups affiliated with Cedars-Sinai Medical Center and
the UCLA Health System. Most of Cedars-Sinai Medical
Center’s approximately 2,000 affiliated physicians are part
of either the Cedars-Sinai Medical Group or a foundation-
model independent practice association (IPA). The UCLA
Medical Group serves as the contracting entity for physicians
within the UCLA Health System.
How groups and IPAs compensate affiliated physicians
varies greatly and no clear “best” way has emerged. IPAs
variously use both delegated capitation and fee for service
to pay primary care physicians, while several large medical
groups typically pay their primary care physicians a salary
and a bonus. Common forms of specialist payment include
capitation or some form of fee for service.
The delegated capitation model — where a medical group
receives fixed per-patient, per-month payments for a specified
set of services from health plans and assumes financial risk
for delivering care to those enrollees — persists in the market,
although its sustainability is unclear as enrollment shifts from
HMO to PPO products. Nationally, Healthcare Partners is
one of the largest groups outside of Kaiser that continues to
engage in delegated capitation. This model is considered a
viable strategy for many IPAs in the market and is viewed
positively by many physicians who believe it gives them more
leverage with plans and more control over patient care.
The L.A. market has numerous IPAs, many of which are
relatively small. Physicians tend to align with multiple IPAs,
which in turn pressures IPAs to sign up as many physicians
as possible to capture sufficient patient volume to ensure
financial viability. The larger IPAs divide the market into
niches based in part on geography and hospital affiliation,
but most strikingly on the insurance status of patients. For
example, Physicians’ Healthways represents physicians who
treat Medi-Cal and Healthy Families patients and is aligned
with Cedars-Sinai and Ronald Reagan UCLA medical centers
for tertiary care. This does not conflict with the medical
centers’ affiliated physician organizations, whose interests are
predominantly in the commercial market.
Like the hospital market, the physician market in Los
Angeles is divided by the financial status of the haves and the
have-nots. The have-nots typically include solo practitioners
and small groups that lack the efficiencies available to large
group practices and the leverage to negotiate good rates with
health plans. The haves, mainly the large multi-specialty
groups, typically have greater leverage with health plans and
enjoy higher reimbursement rates.
LA physicians face a number of pressures that are largely
financial: reimbursement not keeping pace with costs, a
declining economy, and difficulties with Medicare and
Medi-Cal payments (the former, the result of a change in
Medicare carriers; the latter, the result of the recent state
budget impasse, which delayed payments). To cope with
the financial pressures, physicians reportedly have taken out
lines of credit, laid off employees, or dropped Medicare and
Medi-Cal patients. Specialists are reportedly seeking new

©2009 California HealthCare Foundation 5
business or compensation opportunities, including accepting
capitated payment arrangements that they may have refused
several years ago.
Physicians are also looking to hospitals for opportunities
to generate additional income. Although alignment between
hospitals and physicians has historically been weak in L.A.,
physicians increasingly are looking to work more closely with
hospitals to preserve or bolster their incomes. Los Angeles has
had a long tradition of physician-owned ambulatory surgery
centers (ASCs), and it is not a new trend for physicians to
draw routine ancillary services away from hospitals by doing
their own laboratory and imaging services. While hospital-
physician joint ventures around ASCs and ancillary services
have not been prevalent, interest in partnerships appears to
be increasing as changes in federal reimbursement make these
enterprises less profitable for physicians and hospitals seek to
curtail the loss of patient volume.
Health Plans Face Increasing Costs and Growing Employer Expectations The health plan market in Los Angeles is not highly
concentrated, but mergers and acquisitions have given
plans leverage with employers. Anthem’s acquisition of
WellPoint (Blue Cross of California’s parent company),
UnitedHealthcare’s acquisition of PacifiCare, Health Net’s
purchase of Universal Care, and Cigna’s purchase of Great-
West Healthcare have reduced the number of competing
plans in the market. These changes have left few plans in the
L.A. market with local knowledge and local decision-making
authority — only Kaiser, Health Net, and Blue Shield of
California.
Kaiser has a significant presence in L.A., reflecting the
continued popularity of HMOs in southern California. The
general perception in the market is that Kaiser has improved
its quality of care and data management capabilities based on
a heavy investment in new information technology, including
full implementation of an electronic health record (EHR)
system. On the other hand, Kaiser’s unique, integrated
delivery system model creates challenges. Kaiser has faced
considerable competition for the business of large national
employers that want more product options and prefer to
self-fund. In response, Kaiser has devoted substantial effort to
developing and offering third-party administrative services to
self-insured employers. Kaiser also reportedly faces very high
costs for members treated in non-Kaiser facilities, a particular
issue for members served in Prime Healthcare Services’
hospitals.
Anthem Blue Cross remains strong in Los Angeles,
although observers noted some challenges in the process
of rebranding itself from Blue Cross of California and
moving its headquarters outside of California, particularly
staff turnover and a resulting loss of local knowledge.
UnitedHealthcare gained a larger footprint in southern
California through the acquisition of PacifiCare and is
reportedly beginning to rebound from earlier problems with
converting provider contracts and claims administration that
negatively impacted its reputation and market share. Aetna
and Cigna are fairly strong players with national accounts
in L.A. because of their well-developed provider networks.
Blue Shield of California has a more limited presence in
the L.A. market, particularly among national employers.
However, Blue Shield has been increasing its presence among
small employers by competing more aggressively on price
and improving its infrastructure and service. Health Net is
respected for its local market knowledge, but reports of its
financial fragility led some respondents to question whether
it would survive.
With the exception of Kaiser, health plans’ provider
networks in Los Angeles generally are inclusive and broad.
Plans often offer a narrow-network product, which includes
a subset of the full network’s providers—those providers
deemed by the plan to be higher quality and/or lower cost.
Anthem offers a narrow-network HMO called Power Select,
and Aetna has a “high- performance” specialty network
called Aexcel. Health Net offers Salud, a product that targets
Latinos and includes a limited network of providers in

©2009 California HealthCare Foundation 6
L.A., as well as about 200 physicians in Mexico. According
to some respondents, these narrow-network products can
reduce premiums by about 10 percent.
The main pressures on health plans are to manage costs
effectively, compete on price, and maintain or expand
enrollment. Plan respondents noted that soaring rates of
obesity and multiple chronic diseases pose challenges to
managing costs and moderating premium increases. Some
employers are demanding wellness programs to address
rising costs and want health plans to demonstrate that the
financial return on these programs justifies the investment.
Plans — particularly for-profit plans faced with shareholders’
expectations — also face pressure to increase enrollment,
which is a challenge when, for example, employers are
reducing dependent coverage.
Health plans use similar strategies to respond to
these challenges, and observers noted a distinct lack of
differentiation across plans. As one benefits consultant stated,
“I would love to say that innovation is a differentiator, but
it’s not.” Plans are reportedly focused on doing a better job of
managing the total health care needs of employees through
a combination of identifying those who might benefit from
more intensive care management, and integrating wellness
and disease management programs.
For example, Aetna offers a program — MedQuery — that
compares patient claims and other data to evidence-based
clinical guidelines to identify omission/commission gaps
in care; Aetna guarantees certain rates of return on the
fees it charges employers to participate in the program.
Anthem purchased Resolution Health, a vendor that
mines data to identify inconsistencies in care compared to
established clinical guidelines; for example, identifying a
member who is not using a clinically recommended drug
for the treatment of a chronic disease. Kaiser is emphasizing
wellness and prevention, which are cornerstones of its Thrive
marketing campaign. Views on the effectiveness of plans’
disease management and wellness programs are mixed, and
methodologies for measuring return on investment vary
significantly.
Employee Benefits Emphasize HMOs, But Other Options Make HeadwayEmployers continue to use health care benefits as an
important recruitment and retention strategy, but the
recession has given employers more leverage to make benefit
changes with minimal employee pushback. Unions are
seen as fostering more robust health benefits and are very
influential in the public sector in Los Angeles. In the private
sector, unions maintain some influence in the entertainment
industry (TV/film), aerospace, and health care.
The popularity of HMOs continues in the L.A. market,
as in much of southern California. As of 2006, HMO
commercial penetration was 45 percent, comparable to the
commercial HMO penetration of 46 percent for California
as a whole.1 Respondents, however, have noted a gradual
shift in enrollment from HMOs to PPOs as the premium
differential between the two has narrowed. As one health
plan executive noted, “We are primarily selling only on a
PPO platform. Some are still on HMO, but it’s dwindling,
primarily because of costs.” The difference in cost, according
to observers, is in part a result of the higher levels of patient
cost sharing in PPOs compared with HMOs.
Another factor behind the erosion of the HMO price
advantage has been more stringent interpretation of benefit
mandates and broader regulatory scope by the Department
of Managed Health Care (DMHC), which oversees HMOs,
than by the California Department of Insurance (CDI),
which oversees most fully insured PPOs.2, 3 HMOs are at
an even greater disadvantage compared with self-insured
PPOs, which are not subject to benefit mandates and are
minimally regulated by the U.S. Department of Labor.
Upcoming implementation of additional mandates, such as
those concerning timely access to care and autism treatment,
is expected to further affect the costs and competitive
position of HMOs. In response, health plans have moved to

©2009 California HealthCare Foundation 7
create insured PPO products outside the regulatory reach of
DMHC. One approach is to buy a life insurance company
and create health insurance products under that subsidiary,
under much less stringent CDI oversight.
Most large employers offer what has been characterized
as the standard dual option: a fixed copayment option in
an HMO product, and a PPO option with a deductible
of $300 to $500 and 80 percent coinsurance for use of
in-network providers. Large employers have increasingly
consolidated these offerings to one carrier with the exception
that a Kaiser HMO product is also frequently offered.
Employers are increasingly moving to products with higher
deductibles and reduced benefits to mitigate cost increases.
This is particularly true of smaller firms, many of which are
struggling to maintain coverage at all. Traditionally, smaller
firms have offered HMOs, but these products are becoming
less popular with employees because of the increasing cost.
As small employers struggle to maintain benefits, they are
looking to plans to offer a variety of product and benefit
options so they can make changes — increasing patient cost-
sharing amounts, for example — without switching plans.
Small companies are more willing now than in the past to
drop or decrease coverage for spouses or dependents.
Public employee health benefits differ from those in
the private sector. Public-sector decisions are largely driven
by labor negotiations, so the benefits are generally much
richer than for private firms. Los Angeles County, the area’s
largest public employer, has 100,000 employees with nearly
90 percent represented by unions. The county offers a variety
of HMO and PPO options, but most county employees are
enrolled in HMOs with fixed-dollar copayments.
Some employers in the Los Angeles market are offering
consumer-directed health plans (CDHPs) alongside HMO
and PPO options. CDHPs are high-deductible plans with
(or eligible for) a health savings account (HSA) or a health
reimbursement arrangement (HRA).4 However, take up of
these products is quite low, which is not surprising given the
popularity and, at least until recently, relative affordability
of HMOs. CDHPs are also less attractive in California than
in other states because California does not offer the same
favorable tax treatment for HSA contributions as offered by
the federal government.
County Anchors Local Safety NetThe Los Angeles County Department of Health Services
is the single largest actor in the safety net, operating
LAC+USC, the main safety-net hospital, as well as Olive
View-UCLA Medical Center, Harbor-UCLA Medical
Center, one rehabilitation hospital, two multi-service
ambulatory care centers, six comprehensive health centers
(offering specialty care and some outpatient surgery), and
11 primary care clinics. A few other private, nonprofit
hospitals also provide a fair amount of charity care, especially
those located near the former Martin Luther King Jr.-
Harbor Hospital. A network of independent community
health centers (CHCs) has gained strength over the last
ten years, as most of the 42 members of the Community
Clinic Association of Los Angeles County have now attained
federally qualified health center (FQHC) status and contract
with the county for the provision of indigent care.
As in all of California, the county is required to be the
provider of last resort for low-income uninsured people
who are not eligible for coverage through public programs.
In addition, a legal settlement in the 1970s and a more
recent lawsuit concerning the downsizing of LAC+USC
further established the county’s obligations to provide care
for low-income residents. The county fulfills this mandate
by operating its own health care system and managing
several financial access programs for medically indigent
people — those with incomes below 133 percent of the
federal poverty level and who are not eligible for full Medi-
Cal benefits. Of these, a key program is the Public-Private
Partnership (PPP), which was developed under a Medicaid
waiver that provided federal funding and required the county
to create stronger connections between county hospitals and
private community health centers. Through the PPP, the
©2009 California HealthCare Foundation 8
county pays participating clinics to provide primary care for
medically indigent individuals.
Local health care is a high priority among county
supervisors. Unlike some California counties, L.A. did not
divest its county hospitals, which both demonstrates an
inherent support of health care and compels local policy
makers to be involved in local health care issues as the
administrators of a large delivery system.
Moreover, Los Angeles County’s somewhat unusual
form of government heightens the importance of health care
services for local policy makers. Historically, the five county
supervisors have had both legislative and executive powers,
not only representing their respective districts but also
directly overseeing county departments. In this combined
role, each supervisor has sought to influence county services
(of which health care is among the largest) to the benefit
of her/his constituency. Two years ago, the supervisors
transformed the county administrator position into a chief
executive officer (CEO) position, responsible to the Board
of Supervisors for managing all county departments. County
departments now report to deputy CEOs (who report to
the county CEO); the Health Services, Mental Health,
and Public Health agencies report to a single deputy CEO.
Respondents suggested that this new model is still a work
in progress, as supervisors continue at times to involve
themselves in administrative matters.
As a result of lower than expected revenues from state
realignment funds (from vehicle license fees and sales
taxes) as well as rising costs, the county Department of
Health Services faces a projected cumulative deficit of
$344 million through fiscal year 2009 – 10 out of a total
budget of $3.5 billion.5, 6 Although the county is reportedly
committed to providing care, one respondent said, “They
find themselves in such a deficit with aging facilities that they
can’t keep going, and three hospitals that have to be brought
up to seismic standards by 2013.”
The county supervisors have considered expanding
the PPP program by transferring more primary care from
county-owned clinics to contracted CHCs. The experiences
with the Martin Luther King Jr.-Harbor Hospital closure
and a previous closure of some county clinics, however, have
made many wary of this proposal, because of fears —
heightened by the budget crisis — that services will just
disappear. In addition, the unions that represent public
employees are reportedly resistant to closing county clinics.
So the county is starting slowly, issuing a request for a
statement of interest for an organization to provide services
in one area, Glendale, north of downtown L.A., instead of
the existing county clinic.
In addition, the supervisors decided to make a one-
time allocation of approximately $45 million from tobacco
settlement funds to the PPP program to rectify inequities in
county safety-net funding. Much of this money is to be used
for physical plant and information technology improvements
and expanded services in “under-equity” areas: districts of the
county, notably South L.A., that have historically received
proportionately less funding. To be used over three years,
this allocation represents the largest single infusion of county
funds into the PPP program since its inception in 1997.
Efforts to Strengthen Safety Net Amid Rising DemandBy most accounts, the safety net in Los Angeles is well
developed and stronger than it was ten years ago. Overall
demand for care by low-income people, however, has
been increasing in Los Angeles County. Given the
economic downturn, demand is expected to increase across
populations, including the newly unemployed and lower-
middle-income workers whose employers have dropped
insurance or who are unable to pay for the coverage offered.
Increased demand is stretching safety-net resources, which
already are strained, to provide access to such services as
mental health care, dental care, and urgent and emergency
care. Specialty medical care for low-income and uninsured
residents is particularly difficult to access, with appointment
wait times for some services reportedly averaging six to nine
months. As one respondent explained, “Once people get into

©2009 California HealthCare Foundation 9
the system it works for them. It is getting into the system [in
the first place that is difficult].”
The Los Angeles Healthy Kids program is one of
more than 20 similar initiatives across California that uses
government and charitable grants to provide coverage for
uninsured children. The program targets all uninsured
children through age 18 who are ineligible for public
programs such as Medi-Cal. About 30,000 children in
L.A. reportedly have coverage through the program, but
enrollment is currently closed for children ages 6 to 18
because of limited funding.
Among local efforts to strengthen the safety net is a plan
by county officials to renovate and reopen Martin Luther
King Jr.-Harbor Hospital by 2012 to include inpatient and
emergency department services. The University of California
has tentatively agreed to form a new nonprofit corporation
with the county to operate the hospital. If approved by the
UC Board of Regents, UCLA would provide physician
services and medical oversight but no financial support.
In April 2009, the Los Angeles Healthcare Options Task
Force published its proposal for “achieving a high-quality,
integrated safety net healthcare delivery system in L.A.
County,” which included a recommendation that a reopened
Martin Luther King Jr.-Harbor Hospital be part of an
integrated safety-net system.7
Safety-net providers are engaged in several initiatives
that aim to increase the efficiency and capacity of the
overall system. Notable among these efforts are increased
collaborations among organizations. For example, the
Southside Coalition of Community Health Centers, a
group of seven CHCs with a total of 15 to 20 sites and a
member of the countywide CHC association, has developed
a model to strengthen specialty referrals. The coalition
coordinates which organization will be the focus of specific
specialty services—podiatry, speech therapy, cardiology,
ophthalmology, and perinatology—and then coordinates
referrals accordingly, providing transportation between
CHCs as needed. Camino de Salud, a partnership between
LAC+USC hospital and 10 clinics in the surrounding area,
is working to increase access to primary and specialty care
through a medical-home pilot. The pilot includes a dedicated
case manager to connect patients needing frequent hospital
visits to a CHC and to ensure these patients are treated more
effectively by training clinic family practitioners through
“mini-fellowships.” To facilitate the pilot, the California
HealthCare Foundation funded COPE Health Solutions, a
local consulting firm.
LA Health Action, initiated about five years ago by
the California Endowment, also has several efforts aimed
at strengthening the safety net, including the LA Health
Collaborative. Involving about 80 organizations, the
collaborative is focused on improving working relationships
between the public and private sectors of the safety net; as
one respondent put it, “The county doesn’t have a strong
history of that.” In the midst of the state budget crisis, the
collaborative reportedly was developing a plan to prepare
L.A. for health care reform. “In some ways, when you have
crises, that’s when you have your moments and people come
together,” observed one respondent.
Medi-Cal Managed Care Garners SupportManaged care for Medi-Cal beneficiaries is mandatory for
families and voluntary for the aged, blind, and disabled
population. About half of L.A. residents covered by
Medi-Cal are in managed care, which is provided through a
two-plan model. In the two-plan model, Medi-Cal enrollees
have a choice of a public health plan or a private one. In
Los Angeles, L.A. Care, the public plan, has about two-thirds
of the Medi-Cal managed care enrollees, and Health Net, the
commercial plan, has the remainder. This enrollment split
reportedly has been stable over recent years. L.A. Care is an
umbrella organization that subcontracts with several private
health plans: Anthem Blue Cross (the largest with 346,000
Medi-Cal members), Care First (a privately held plan that
was created to participate in L.A. Care), Community Health

©2009 California HealthCare Foundation 10
Plan, and Kaiser. In 2006, L.A. Care also began offering its
own product, L.A. Care Health Plan, under the umbrella.
The intent of the two-plan model is to provide enrollees
with a choice of plans and promote competition, while
also supporting safety-net providers. Safety-net providers
in L.A. largely support the two-plan model for a variety of
reasons; for example, representatives of FQHCs sit on the
board of L.A. Care, and safety-net providers can benefit
from the competition, playing one plan against another. In
addition, L.A. Care is viewed as a strong partner with safety-
net providers, giving grants for infrastructure and service-
delivery innovations; steering Medi-Cal patients to safety-
net providers; and supporting community public health
programs. This positive view of L.A. Care, however,
is not universal; some observers pointed to the plan’s
umbrella structure — in which L.A. Care coordinates but
also competes with the other plans — as being a conflict
of interest.
The state’s low Medi-Cal provider payment rates are
a major concern in Los Angeles, adversely affecting the
willingness of providers to serve Medi-Cal patients. The
state reduced Medi-Cal fee-for-service rates for many
providers and services (excluding some inpatient acute care
service providers and FQHCs) by 10 percent in July 2008.
A court injunction stalled the cuts until March 2009, and
a federal judge has since blocked them from taking effect.
But worsening budget problems may result in further cuts,
including services such as dental care, that have been spared
so far. Any payment cuts are expected to reduce already
inadequate provider participation in Medi-Cal.
Issues to TrackThe hospital and physician markets in L.A. are highly
fragmented, with no single dominant organization. Hospitals
and physicians do compete, but the competition has not
been aggressive and numerous examples of collaboration
exist, including a new trend toward hospital-physician joint
ventures. HMOs remain dominant in L.A., but PPOs are
gradually gaining ground as purchasers seek lower premiums
and health plans seek the less stringent regulatory oversight
that PPOs enjoy in California. The safety net is stronger than
it was a decade ago, largely because of the efforts of local
leadership, but financial and other challenges persist. The
following are among the key issues to track:
Will the gap continue to widen between have and have-▶▶
not providers? Will there be more hospital consolidation
in response to increasing financial and other pressures,
including the hospitals’ need to secure capital to fund
construction to meet state seismic requirements?
Will the recession result in tighter alignment between ▶▶
hospitals and physicians? What influence will the
recession have on hospital-physician relationships?
Will the shift from HMO to PPO products continue? ▶▶
What impact will it have on hospital-physician
relationships? On costs?
As the Los Angeles safety net evolves, what will be the ▶▶
impact on access by residents and demand on other area
providers? Will Martin Luther King Jr.-Harbor Hospital
reopen? To what degree will there be a shift of primary
care from county clinics to FQHCs via the PPP program?
EndnotEs
1. Cattaneo & Stroud, Inc., 2006 California Statewide HMO & Special
Programs Enrollment Study, Burlingame, CA (2008).
2. While most PPOs are regulated by CDI, most Blue Cross and Blue Shield
PPO products operate under Knox-Keene licensure, putting them under
DMHC regulatory control. See Roth, Debra L. and Kelch, Deborah Reidy,
Making Sense of Managed Care Regulation in California, California
HealthCare Foundation Report, The California HealthCare Foundation
(CHCF), Oakland, CA (November 2001).
3. For example, DMHC’s regulatory scope includes quality of care while
CDI’s does not. Also, products under DMHC jurisdiction are required
to provide all “medically necessary basic health care services,” including
services such as maternity; products under CDI jurisdiction have no
equivalent requirement.

©2009 California HealthCare Foundation 11
DelNor te
Alameda
Fresno
Los Angeles
Riverside
Sacramento
Bay Area
San Bernardino
San Diego
San Francisco
Kings
Madera
Mariposa
Tulare
Placer
Yolo El Dorado
MarinContra
Costa
San Mateo
Regional Markets Study: Los Angeles
In december 2008, a team of researchers from the Center for studying Health system Change
(HsC) visited the Los Angeles region to study that market’s local health care system. The
Los Angeles market encompasses the Los Angeles-Long Beach-glendale, California, Metropolitan
division and includes Los Angeles County. Los Angeles is one of six markets being studied
on behalf of the California HealthCare Foundation to gain important insights into regional
characteristics in health care affordability, access, and quality. The six markets included in
the study — Fresno, Los Angeles, Oakland/san Francisco, riverside/san Bernardino,
sacramento, and san diego — reflect a range of economic, demographic, health
care delivery, and financing conditions in California. Fifty-two interviews of
leaders in the Los Angeles health care market were conducted to inform
this report.
access the entire regional markets series here. ▶▶▶
About tHE AutHors
Aaron B. Katz, Allison Liebhaber, Robert A. Berenson, Elizabeth A.
November, and Johanna R. Lauer, Center for studying Health system
Change (HsC). HSC is a nonpartisan policy research organization that
designs and conducts studies focused on the U.S. health care system to inform
the thinking and decisions of policy makers in government and private
industry. More information is available at www.hschange.org.
About tHE FoundAtion
The California HealthCare Foundation is an independent philanthropy
committed to improving the way health care is delivered and financed
in California. By promoting innovations in care and broader access to
information, our goal is to ensure that all Californians can get the care
they need, when they need it, at a price they can afford. For more
information, visit www.chcf.org.
California Health Care Almanac is an online clearinghouse for key data and
analysis examining the state’s health care system. For more information, go to
www.chcf.org/topics/almanac.
4. HSAs are tax-favored accounts that must be linked to health plans with
minimum deductibles of $1,100 for self-only coverage and $2,200 for
family coverage in 2008; HRAs are accounts funded and owned by the
employer; no companion health plan is required. HRA contributions
are not subject to business income tax, and unused funds revert to the
employer when the employee retires or leaves the company.
5. Realignment funds, derived from sales tax and vehicle license fees,
were allocated to the counties when the state shifted responsibility for
health and social services to the county governments. The formula for
distribution of the funds was based on historical spending levels and is not
updated each year based on population and population in poverty.
6. On April 2, 2009, the supervisors received an updated budget outlook
memorandum that estimated the total deficit for this fiscal year and next
at $344 million.
7. Los Angeles Healthcare Options Task Force, Achieving the Vision:
Healthcare Options for Los Angeles County (April 2009), www.calendow.org
(accessed May 29, 2009).
©2009 California HealthCare Foundation
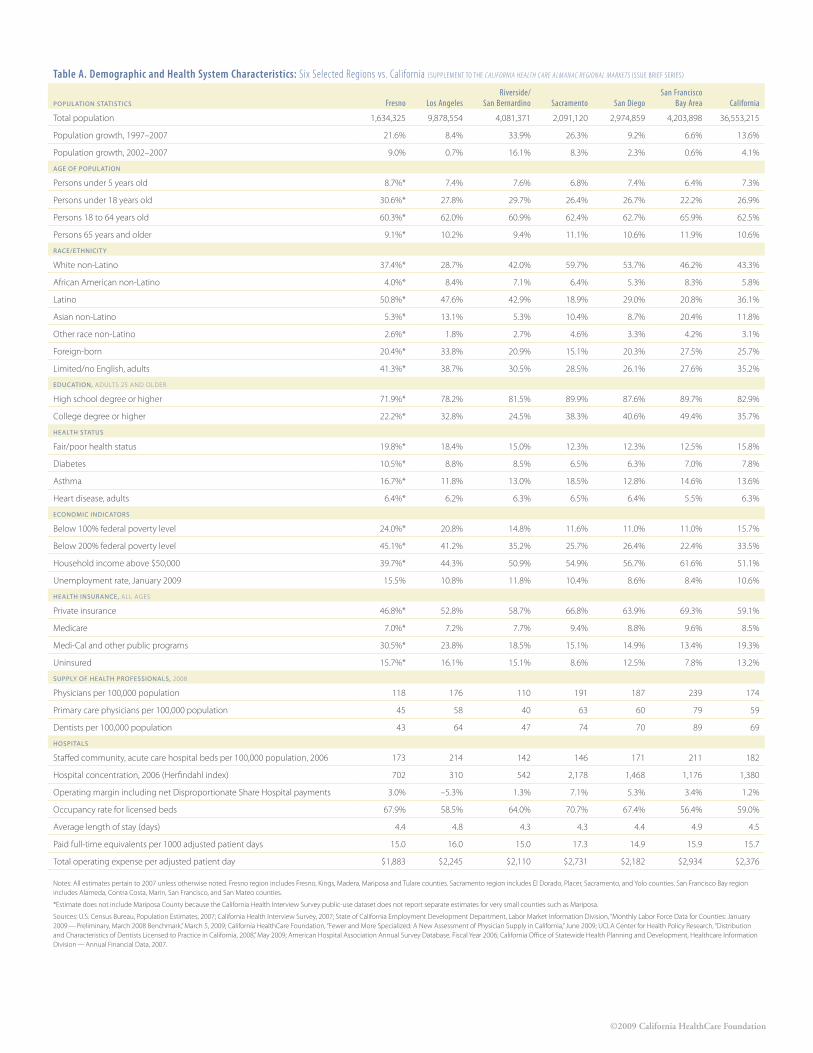
Table A. Demographic and Health System Characteristics: Six Selected Regions vs. California (Supplement to the California health Care almanaC regional markets ISSue BRIef SeRIeS)
PoPulation StatiSticS Fresno Los AngelesRiverside/
San Bernardino Sacramento San DiegoSan Francisco
Bay Area California
Total population 1,634,325 9,878,554 4,081,371 2,091,120 2,974,859 4,203,898 36,553,215
Population growth, 1997–2007 21.6% 8.4% 33.9% 26.3% 9.2% 6.6% 13.6%
Population growth, 2002–2007 9.0% 0.7% 16.1% 8.3% 2.3% 0.6% 4.1%
age of PoPulation
Persons under 5 years old 8.7%* 7.4% 7.6% 6.8% 7.4% 6.4% 7.3%
Persons under 18 years old 30.6%* 27.8% 29.7% 26.4% 26.7% 22.2% 26.9%
Persons 18 to 64 years old 60.3%* 62.0% 60.9% 62.4% 62.7% 65.9% 62.5%
Persons 65 years and older 9.1%* 10.2% 9.4% 11.1% 10.6% 11.9% 10.6%
Race/ethnicit y
White non-Latino 37.4%* 28.7% 42.0% 59.7% 53.7% 46.2% 43.3%
African American non-Latino 4.0%* 8.4% 7.1% 6.4% 5.3% 8.3% 5.8%
Latino 50.8%* 47.6% 42.9% 18.9% 29.0% 20.8% 36.1%
Asian non-Latino 5.3%* 13.1% 5.3% 10.4% 8.7% 20.4% 11.8%
Other race non-Latino 2.6%* 1.8% 2.7% 4.6% 3.3% 4.2% 3.1%
Foreign-born 20.4%* 33.8% 20.9% 15.1% 20.3% 27.5% 25.7%
Limited/no English, adults 41.3%* 38.7% 30.5% 28.5% 26.1% 27.6% 35.2%
education, AduLTs 25 And OLdEr
High school degree or higher 71.9%* 78.2% 81.5% 89.9% 87.6% 89.7% 82.9%
College degree or higher 22.2%* 32.8% 24.5% 38.3% 40.6% 49.4% 35.7%
health StatuS
Fair/poor health status 19.8%* 18.4% 15.0% 12.3% 12.3% 12.5% 15.8%
diabetes 10.5%* 8.8% 8.5% 6.5% 6.3% 7.0% 7.8%
Asthma 16.7%* 11.8% 13.0% 18.5% 12.8% 14.6% 13.6%
Heart disease, adults 6.4%* 6.2% 6.3% 6.5% 6.4% 5.5% 6.3%
economic indicatoRS
Below 100% federal poverty level 24.0%* 20.8% 14.8% 11.6% 11.0% 11.0% 15.7%
Below 200% federal poverty level 45.1%* 41.2% 35.2% 25.7% 26.4% 22.4% 33.5%
Household income above $50,000 39.7%* 44.3% 50.9% 54.9% 56.7% 61.6% 51.1%
unemployment rate, January 2009 15.5% 10.8% 11.8% 10.4% 8.6% 8.4% 10.6%
health inSuRance, ALL AgEs
Private insurance 46.8%* 52.8% 58.7% 66.8% 63.9% 69.3% 59.1%
Medicare 7.0%* 7.2% 7.7% 9.4% 8.8% 9.6% 8.5%
Medi-Cal and other public programs 30.5%* 23.8% 18.5% 15.1% 14.9% 13.4% 19.3%
uninsured 15.7%* 16.1% 15.1% 8.6% 12.5% 7.8% 13.2%
SuPPly of health PRofeSSionalS, 2008
Physicians per 100,000 population 118 176 110 191 187 239 174
Primary care physicians per 100,000 population 45 58 40 63 60 79 59
dentists per 100,000 population 43 64 47 74 70 89 69
hoSPitalS
staffed community, acute care hospital beds per 100,000 population, 2006 173 214 142 146 171 211 182
Hospital concentration, 2006 (Herfindahl index) 702 310 542 2,178 1,468 1,176 1,380
Operating margin including net disproportionate share Hospital payments 3.0% –5.3% 1.3% 7.1% 5.3% 3.4% 1.2%
Occupancy rate for licensed beds 67.9% 58.5% 64.0% 70.7% 67.4% 56.4% 59.0%
Average length of stay (days) 4.4 4.8 4.3 4.3 4.4 4.9 4.5
Paid full-time equivalents per 1000 adjusted patient days 15.0 16.0 15.0 17.3 14.9 15.9 15.7
Total operating expense per adjusted patient day $1,883 $2,245 $2,110 $2,731 $2,182 $2,934 $2,376
notes: All estimates pertain to 2007 unless otherwise noted. Fresno region includes Fresno, Kings, Madera, Mariposa and Tulare counties. sacramento region includes El dorado, Placer, sacramento, and Yolo counties. san Francisco Bay region includes Alameda, Contra Costa, Marin, san Francisco, and san Mateo counties.
*Estimate does not include Mariposa County because the California Health Interview survey public-use dataset does not report separate estimates for very small counties such as Mariposa.
sources: u.s. Census Bureau, Population Estimates, 2007; California Health Interview survey, 2007; state of California Employment development department, Labor Market Information division, “Monthly Labor Force data for Counties: January 2009 — Preliminary, March 2008 Benchmark,” March 5, 2009; California HealthCare Foundation, “Fewer and More specialized: A new Assessment of Physician supply in California,” June 2009; uCLA Center for Health Policy research, “distribution and Characteristics of dentists Licensed to Practice in California, 2008,” May 2009; American Hospital Association Annual survey database, Fiscal Year 2006; California Office of statewide Health Planning and development, Healthcare Information division — Annual Financial data, 2007.