Los Angeles County Sexually Transmitted Diseasepublichealth.lacounty.gov/ · Los Angeles County...
98
Transcript of Los Angeles County Sexually Transmitted Diseasepublichealth.lacounty.gov/ · Los Angeles County...


Los Angeles County Sexually Transmitted Disease
Morbidity Report, 2009
Volume 1: Summary
2615 South Grand Avenue, Room 500 Los Angeles, CA 90007
Tel: (213) 744-3070 Fax: (213) 749-9606
http://publichealth.lacounty.gov/std
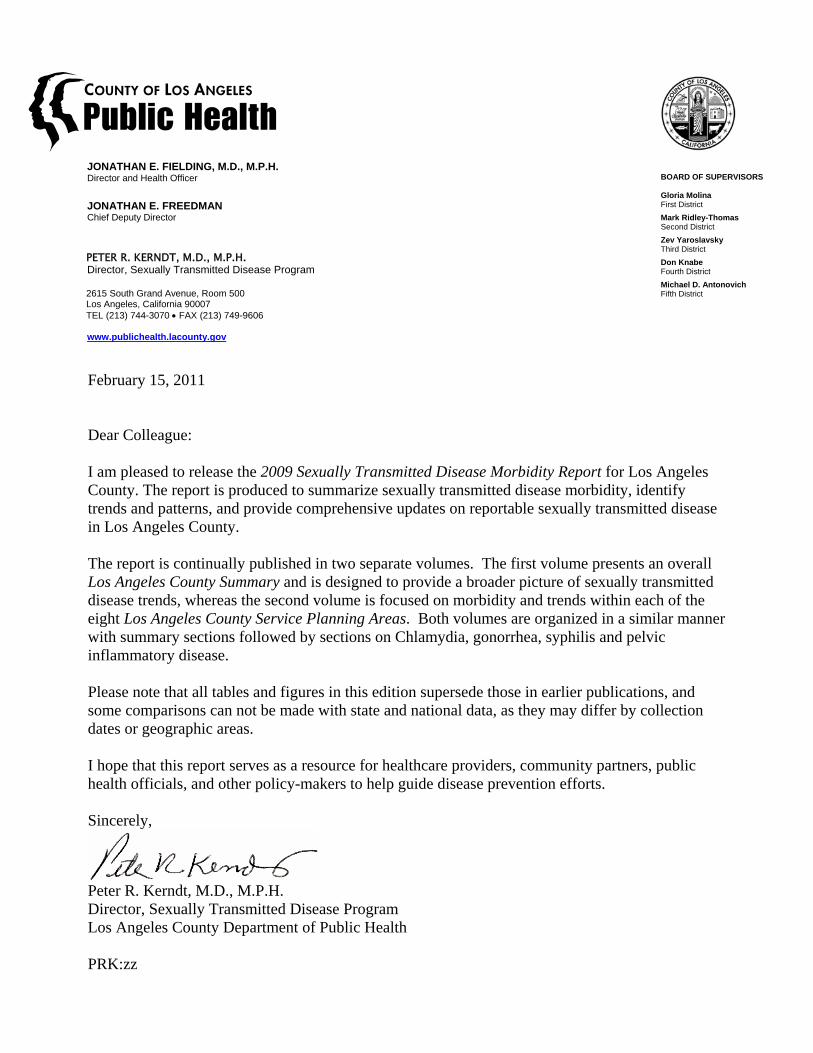
February 15, 2011
Dear Colleague: I am pleased to release the 2009 Sexually Transmitted Disease Morbidity Report for Los Angeles County. The report is produced to summarize sexually transmitted disease morbidity, identify trends and patterns, and provide comprehensive updates on reportable sexually transmitted disease in Los Angeles County. The report is continually published in two separate volumes. The first volume presents an overall Los Angeles County Summary and is designed to provide a broader picture of sexually transmitted disease trends, whereas the second volume is focused on morbidity and trends within each of the eight Los Angeles County Service Planning Areas. Both volumes are organized in a similar manner with summary sections followed by sections on Chlamydia, gonorrhea, syphilis and pelvic inflammatory disease. Please note that all tables and figures in this edition supersede those in earlier publications, and some comparisons can not be made with state and national data, as they may differ by collection dates or geographic areas. I hope that this report serves as a resource for healthcare providers, community partners, public health officials, and other policy-makers to help guide disease prevention efforts. Sincerely,
Peter R. Kerndt, M.D., M.P.H. Director, Sexually Transmitted Disease Program Los Angeles County Department of Public Health PRK:zz
BOARD OF SUPERVISORS
Gloria Molina First District Mark Ridley-Thomas Second District Zev Yaroslavsky Third District Don Knabe Fourth District Michael D. Antonovich Fifth District
JONATHAN E. FIELDING, M.D., M.P.H. Director and Health Officer
JONATHAN E. FREEDMAN Chief Deputy Director
PETER R. KERNDT, M.D., M.P.H. Director, Sexually Transmitted Disease Program 2615 South Grand Avenue, Room 500 Los Angeles, California 90007 TEL (213) 744-3070 FAX (213) 749-9606 www.publichealth.lacounty.gov
The Sexually Transmitted Disease Morbidity Report is published on a yearly basis by the Sexually Transmitted Disease Program of the Los Angeles County Department of Public Health. This report is also available in PDF format, at http://publichealth.lacounty.gov/std/ If you would like to receive surveillance reports and other information from the STD Program, register for the STDInfo listserv. To subscribe send an email to: [email protected] and type SUBSCRIBE STDINFO anywhere in the body of the email.
SUGGESTED CITATION
Sexually Transmitted Disease Program, Los Angeles County Department of Public Health.
2009 Sexually Transmitted Disease Morbidity Report. Volume 1: County Summary.
Department of Public Health
Jonathan E. Fielding, M.D., M.P.H.
Director, Public Health and Health Officer
Jonathan Freedman, M.S.P.H. Chief Deputy Director
Robert Kim-Farley, M.D., M.P.H.
Director, Communicable Disease Control and Prevention
~ Sexually Transmitted Disease Program
Peter R. Kerndt, M.D., M.P.H.
Director, Sexually Transmitted Disease Program
Sarah Guerry, M.D. Medical/Clinical Services Unit
Melina Boudov, Monica Munoz, Ali Stirland, Susan Walker, Christine Wigen
Melina Boudov, M.A.
Clinical Unit : Infertility Prevention Project Sara Alvarez, Kimberly Coffee, Kimberly Givan,
Zakiya Hill, Marisol Mejia, Judith Melendez, Kirsten Wilson
Monica Munoz, R.N., B.S.N., M.P.H.
Clinical Unit: Nursing Services Jeanette Wilson-Brown, Raquel Fernandez, Fayga
Greiner, Lenita Johnson, Aineeh Montano Lee, Alicia Magbanua, Ramon Mendoza, Terry Miller,
Audrey Miyahira, Franklin Villacres, Jennifer Vonghack
Jorge A. Montoya, Ph.D. Outreach,Research, Communications,
and Assessment John Copeland, Oscar Dimas, James Martinez,
Aaron Plant, Harlan Rotblatt
Getahun Aynalem, M.D., M.P.H. Epidemiology and Surveillance
Michael Chien, Binh Goldstein, Ellen Rudy
Frank Ramirez Field Operations
Felipe Arevalo, John Cabeso, Mario Campana, Guillermo Campos, Yee Chan, Johnny Cross,
Yvonne Curtis, Patricia Dominguez, Katrin Eskandary, Janae Kingcade, Thelma McClinton,
Jenny Mckinney, Gabriel Montano, Anna Orujyan, Sevana Pirjan, Nancy Ramos, Roberto Rocha, Monireh Seino, Willie Sledge, Funmi Thomas,
Eleanor Tupas, Jessica Utley, Elizabeth Valencia, Tasha Wagner, Akia Wilburn, Jolene Yoneoka,
Leslie Zuniga
Jane Steinberg, Ph.D., M.P.H Policy, Programs and Health Education
Ana Hernandez, Phoebe Macon, Philip Phan, Araceli (Sally) Villanueva
Kai-Jen Cheng, M.S.
Information Systems and Data Management Rosa Babalian, Mark Banks, Yetimwork
Campbell, Debra Campos, Seda Garibyan, Cynthia Carr, Susanna Chalikyan, Teofuldo Cruz,
Seda Garibyan, Mildred Gonzales, Alice Gonzalez, Nawal Habashi, Peter He, Lan Lam,
Julius Lim, Yun-Baw (Albert) Lin, Debra Liscano, Jackie Moore, Shakeh Novagian, Issa Ortuna,
Ramon Reyes, Harry Rollins, Terrie Ross, Joselene Samson, Michael Saucedo, Lillian Tom,
Vanessa Tran, Xiaomei Tong, Adeline Umboh, Chi-Ngai (David) Yu, Waley Zeng
Yolanda Cavalier
Quality Assurance and Special Projects Maria Arevalo, Sandra Chacon, Cynthia Davison, Michael Granado, Zakiya Hill, Natalie Kelley, Lori
Laubacher, Vince Lewis, Carol Magee, Judith Melendez, Margarita Melgoza, Kenneth Myers,
Leanne Olea, Tracey Smith,
Sexually Transmitted Disease Morbidity Report – 2009 (Volume 1)
CONTENTS _____________________________________________________________________________
I. Summary
Table 1.1
Surveillance Summary of Sexually Transmitted Diseases Reported to the Los Angeles County Sexually Transmitted Disease Program, 2009
1
Table 1.2 Trend of Chlamydia, Gonorrhea, Syphilis and PID Reported for Los Angeles County Residents, 2005-2009
2
Figure 1.1 Distribution of Reported Sexually Transmitted Diseases in Los Angeles County, 2009.
3
● Among Males
Table 1.3
Surveillance Summary of Chlamydia, Gonorrhea and Early Syphilis Reported to the Los Angeles County Sexually Transmitted Disease Program, By Race/Ethnicity and Age Group among Males, 2009
4
Figure 1.2 Reported Chlamydia Rates per 100,000 Population Among Males in Los Angeles County, by Age Group and Race/Ethnicity, 2009
5
Figure 1.3 Reported Chlamydia Cases Among Males in Los Angeles County, by Age Group and Race/Ethnicity, 2009
6
Figure 1.4 Reported Gonorrhea Rates per 100,000 Population Among Males in Los Angeles County, by Age Group and Race/Ethnicity, 2009
7
Figure 1.5 Reported Gonorrhea Cases Among Males in Los Angeles County, by Age Group and Race/Ethnicity, 2009
8
Figure 1.6 Reported Early Syphilis Rates per 100,000 Population Among Males in Los Angeles County, by Age Group and Race/Ethnicity, 2009
9
Figure 1.7 Reported Early Syphilis Cases Among Males in Los Angeles County, by Age Group and Race/Ethnicity, 2009
10
● Among Females
Table 1.4
Surveillance Summary of Chlamydia, Gonorrhea and Early Syphilis Reported to the Los Angeles County Sexually Transmitted Disease Program, By Race/Ethnicity and Age Group among Females, 2009
11
Figure 1.8 Reported Chlamydia Rates per 100,000 Population Among Females in Los Angeles County, by Age Group and Race/Ethnicity, 2009
12
Figure 1.9 Reported Chlamydia Cases Among Females in Los Angeles County, by Age Group and Race/Ethnicity, 2009
13
Figure 1.10 Reported Gonorrhea Rates per 100,000 Population Among Females in Los Angeles County, by Age Group and Race/Ethnicity, 2009
14
Figure 1.11 Reported Gonorrhea Cases Among Females in Los Angeles County, by Age Group and Race/Ethnicity, 2009
15
i

Sexually Transmitted Disease Morbidity Report – 2009 (Volume 1)
Figure 1.12 Reported Early Syphilis Rates per 100,000 Population Among Females in Los Angeles County, by Age Group and Race/Ethnicity, 2009
16
Figure 1.13 Reported Early Syphilis Cases Among Females in Los Angeles County, by Age Group and Race/Ethnicity, 2009
17
II. Chlamydia
● National, State and County Comparisons
Figure 2.1 Reported Chlamydia Rates per 100,000 Population by Year, United States, California, and Los Angeles County (LAC), 2005-2009
18
● By Age
Table 2.1 Reported Chlamydia Cases and Rates per 100,000 Population by Age Group, Los Angeles County, 2005-2009
19
Figure 2.2 Reported Chlamydia Rates per 100,000 in Los Angeles County, by Age Group, 2009
20
● By Gender
Table 2.2 Reported Chlamydia Cases and Rates per 100,000 Population by Gender and Age Group, Los Angeles County, 2005-2009
21
Figure 2.3 Reported Chlamydia Rates per 100,000 Population in Los Angeles County, by Gender and Year
22
Figure 2.4 Reported Chlamydia Rates per 100,000 Population in Los Angeles County, by Gender and Age Group, 2009
23
● By Race/Ethnicity
Table 2.3 Reported Chlamydia Cases and Rates per 100,000 Population by Gender and Race/Ethnicity, Los Angeles County, 2005-2009
24
Figure 2.5 Reported Chlamydia Rates per 100,000 Population in Los Angeles County, by Gender and Race/Ethnicity, 2009
25
● By Service Planning Area and Health District
Table 2.4 Reported Chlamydia Cases and Rates per 100,000 Population by Service Planning Area (SPA) and Health District (HD), Los Angeles County, 2005-2009
26
Figure 2.6 Reported Chlamydia Rates per 100,000 Population in Los Angeles County, by Service Planning Area, 2009
27
III. Gonorrhea
● National, State and County Comparisons
Figure 3.1 Reported Gonorrhea Rates per 100,000 Population by Year, United States, California, and Los Angeles County (LAC), 2005-2009
28
ii

Sexually Transmitted Disease Morbidity Report – 2009 (Volume 1)
● By Age
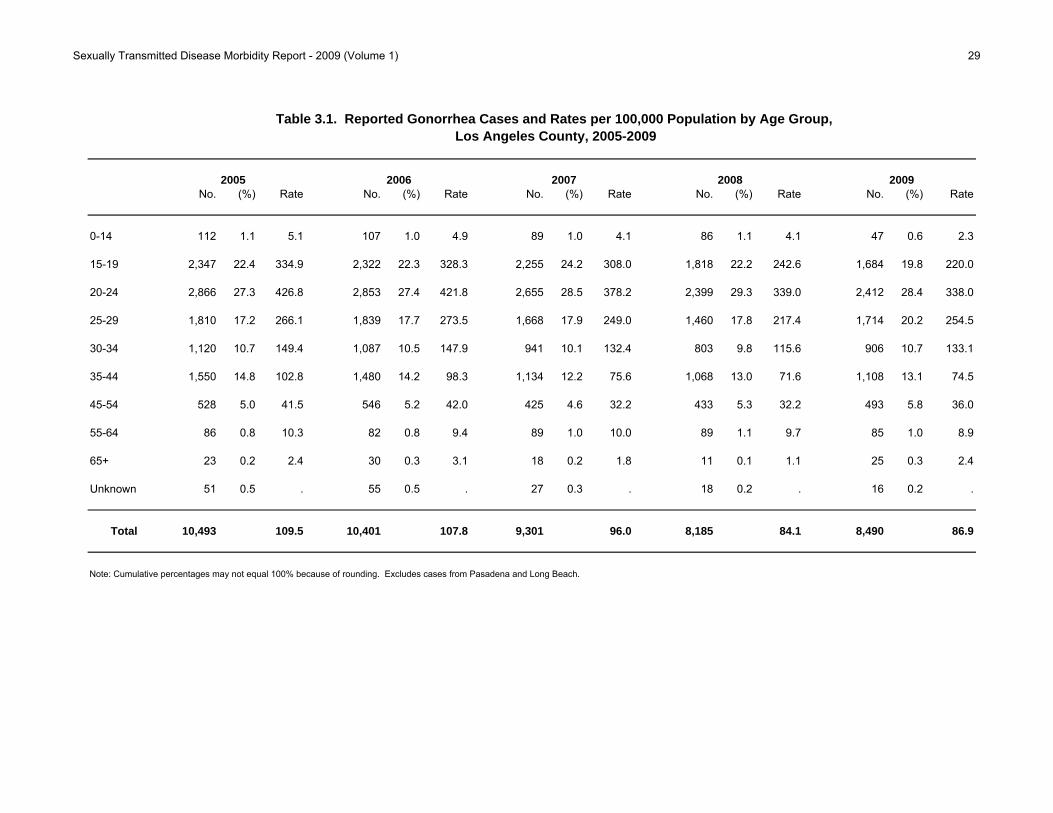
Table 3.1 Reported Gonorrhea Cases and Rates per 100,000 Population by Age Group, Los Angeles County, 2005-2009
29
Figure 3.2 Reported Gonorrhea Rates per 100,000 in Los Angeles County, by Age Group, 2009
30
● By Gender
Table 3.2 Reported Gonorrhea Cases and Rates per 100,000 Population by Gender and Age Group, Los Angeles County, 2005-2009
31
Figure 3.3 Reported Gonorrhea Rates per 100,000 Population in Los Angeles County, by Gender and Year
32
Figure 3.4 Reported Gonorrhea Rates per 100,000 Population in Los Angeles County, by Gender and Age Group, 2009
33
● By Race/Ethnicity
Table 3.3 Reported Gonorrhea Cases and Rates per 100,000 Population by Gender and Race/Ethnicity, Los Angeles County, 2005-2009
34
Figure 3.5 Reported Gonorrhea Rates per 100,000 Population in Los Angeles County, by Gender and Race/Ethnicity, 2009
35
● By Service Planning Area and Health District
Table 3.4 Reported Gonorrhea Cases and Rates per 100,000 Population by Service Planning Area (SPA) and Health District (HD), Los Angeles County, 2005-2009
36
Figure 3.6 Reported Gonorrhea Rates per 100,000 Population in Los Angeles County, by Service Planning Area, 2009
37
IV. Primary and Secondary Syphilis
● National, State and County Comparisons
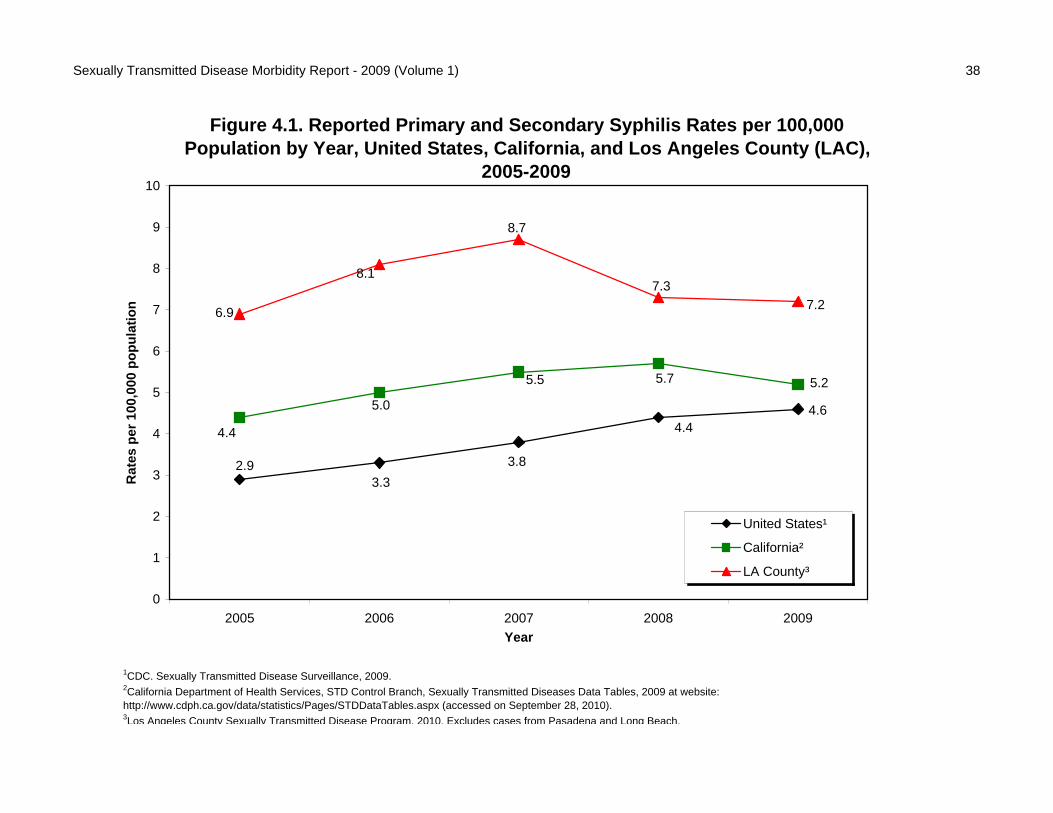
Figure 4.1 Reported Primary and Secondary Syphilis Rates per 100,000 Population by Year, United States, California, and Los Angeles County (LAC), 2005-2009
38
● By Age
Table 4.1 Reported Primary and Secondary Syphilis Cases and Rates per 100,000 Population by Age Group, Los Angeles County, 2005-2009
39
Figure 4.2 Reported Primary and Secondary Syphilis Rates per 100,000 in Los Angeles County, by Age Group, 2009
40
● By Gender
Table 4.2 Reported Primary and Secondary Syphilis Cases and Rates per 100,000 Population by Gender and Age Group, Los Angeles County, 2005-2009
41
iii

Sexually Transmitted Disease Morbidity Report – 2009 (Volume 1)
Figure 4.3 Reported Primary and Secondary Syphilis Rates per 100,000 Population in Los Angeles County, by Gender and Year
42
Figure 4.4 Reported Primary and Secondary Syphilis Rates per 100,000 Population in Los Angeles County, by Gender and Age Group, 2009
43
● By Race/Ethnicity
Table 4.3 Reported Primary and Secondary Syphilis Cases and Rates per 100,000 Population by Gender and Race/Ethnicity, Los Angeles County, 2005-2009
44
Figure 4.5 Reported Primary and Secondary Syphilis Rates per 100,000 Population in Los Angeles County, by Gender and Race/Ethnicity, 2009
45
● By Service Planning Area and Health District
Table 4.4 Reported Primary and Secondary Syphilis Cases and Rates per 100,000 Population by Service Planning Area (SPA) and Health District (HD), Los Angeles County, 2005-2009
46
Figure 4.6 Reported Primary and Secondary Syphilis Rates per 100,000 Population in Los Angeles County, by Service Planning Area, 2009
47
V. Early Latent Syphilis
● National, State and County Comparisons
Figure 5.1 Reported Early Latent Syphilis Rates per 100,000 Population by Year, United States, California, and Los Angeles County (LAC), 2005-2009
48
● By Age
Table 5.1 Reported Early Latent Syphilis Cases and Rates per 100,000 Population by Age Group, Los Angeles County, 2005-2009
49
Figure 5.2 Reported Early Latent Syphilis Rates per 100,000 in Los Angeles County, by Age Group, 2009
50
● By Gender
Table 5.2 Reported Early Latent Syphilis Cases and Rates per 100,000 Population by Gender and Age Group, Los Angeles County, 2005-2009
51
Figure 5.3 Reported Early Latent Syphilis Rates per 100,000 Population in Los Angeles County, by Gender and Year
52
Figure 5.4 Reported Early Latent Syphilis Rates per 100,000 Population in Los Angeles County, by Gender and Age Group, 2009
53
● By Race/Ethnicity
Table 5.3 Reported Early Latent Syphilis Cases and Rates per 100,000 Population by Gender and Race/Ethnicity, Los Angeles County, 2005-2009
54
iv
Sexually Transmitted Disease Morbidity Report – 2009 (Volume 1)
Figure 5.5 Reported Early Latent Syphilis Rates per 100,000 Population in Los Angeles County, by Gender and Race/Ethnicity, 2009
55
● By Service Planning Area and Health District
Table 5.4 Reported Early Latent Syphilis Cases and Rates per 100,000 Population by Service Planning Area (SPA) and Health District (HD), Los Angeles County, 2005-2009
56
Figure 5.6 Reported Early Latent Syphilis Rates per 100,000 Population in Los Angeles County, by Service Planning Area, 2009
57
VI. Late and Late Latent Syphilis
● National, State and County Comparisons
Figure 6.1 Reported Late and Late Latent Syphilis Rates by Year, United States, California, and Los Angeles County (LAC), 2005-2009
58
● By Age
Table 6.1 Reported Late and Late Latent Syphilis Cases and Rates per 100,000 Population by Age Group, Los Angeles County, 2005-2009
59
● By Gender
Table 6.2 Reported Late and Late Latent Syphilis Cases and Rates per 100,000 Population by Gender and Age Group, Los Angeles County, 2005-2009
60
● By Race/Ethnicity
Table 6.3 Reported Late and Late Latent Syphilis Cases and Rates per 100,000 Population by Gender and Race/Ethnicity, Los Angeles County, 2005-2009
61
● By Service Planning Area and Health District
Table 6.4 Reported Late and Late Latent Syphilis Cases and Rates per 100,000 Population by Service Planning Area (SPA) and Health District (HD), Los Angeles County, 2005-2009
62
Figure 6.2 Reported Late and Late Latent Syphilis Cases and Rates per 100,000 Population by Service Planning Area (SPA), Los Angeles County, 2005-2009
63
VII. Congenital Syphilis
● National, State and County Comparisons
Figure 7.1 Reported Presumptive Congenital Syphilis Rates by Year, United States, California, and Los Angeles County (LAC), 2005-2009
64
v

Sexually Transmitted Disease Morbidity Report – 2009 (Volume 1)
vi
● By Race/Ethnicity
Table 7.1 Reported Presumptive Congenital Syphilis Cases and Rates per 100,000 Live Births by Race/Ethnicity, Los Angeles County, 2005-2009
65
● By Service Planning Area and Health District
Table 7.2 Reported Presumptive Congenital Syphilis Cases and Rates per 100,000 Live Births by Service Planning Area (SPA) and Health District (HD), Los Angeles County, 2005-2009
66
VIII. All Pelvic Inflammatory Disease (PID)
● By Age
Table 8.1 Reported All Pelvic Inflammatory Disease (PID) Cases and Rates per 100,000 Female Population by Age Group, Los Angeles County, 2005-2009
67
Figure 8.1
Reported All Pelvic Inflammatory Disease (PID) Rates per 100,000 Female Population in Los Angeles County, by Age Group, 2009
68
● By Race/Ethnicity
Table 8.2 Reported All Pelvic Inflammatory Disease (PID) Cases and Rates per 100,000 Female Population by Race/Ethnicity, Los Angeles County, 2005-2009
69
Figure 8.2
Reported All Pelvic Inflammatory Disease (PID) Rates per 100,000 Female Population in Los Angeles County, by Race/Ethnicity, 2009
70
● By Service Planning Area and Health District
Table 8.3 Reported All Pelvic Inflammatory Disease (PID) Cases and Rates per 100,000 Female Population by Service Planning Area (SPA) and Health District (HD), Los Angeles County, 2005-2009
71
Figure 8.3
Reported All Pelvic Inflammatory Disease (PID) Rates per 100,000 Population in Los Angeles County, by Service Planning Area, 2009
72
IX. Technical Notes and Appendices
Technical Notes IX-1
Appendix A: Where to Report Communicable Diseases in Los Angeles County IX-5
Appendix B: Title 17, California Code of Regulations (CCR) §2500, §2593, §2641-2643, and §2800-2812 Reportable Disease and Conditions
IX-6
Sexually Transmitted Disease Morbidity Report, 2009
Section I: Summary
Sexually Transmitted Disease Morbidity Report - 2009 (Volume 1) 1
n % Rate1n % Rate1
n % Rate1n % Rate1
n % Rate1n % Rate N2
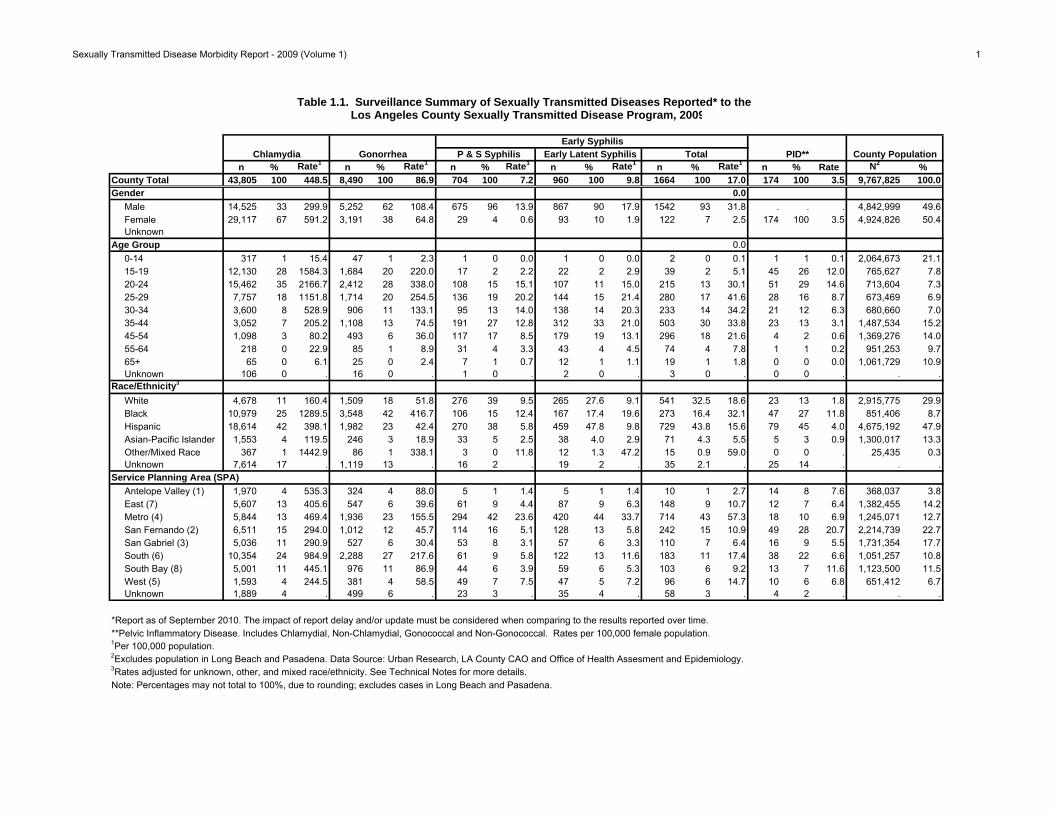
%County Total 43,805 100 448.5 8,490 100 86.9 704 100 7.2 960 100 9.8 1664 100 17.0 174 100 3.5 9,767,825 100.0Gender 0.0
Male 14,525 33 299.9 5,252 62 108.4 675 96 13.9 867 90 17.9 1542 93 31.8 . . . 4,842,999 49.6 Female 29,117 67 591.2 3,191 38 64.8 29 4 0.6 93 10 1.9 122 7 2.5 174 100 3.5 4,924,826 50.4 UnknownAge Group 0.0 0-14 317 1 15.4 47 1 2.3 1 0 0.0 1 0 0.0 2 0 0.1 1 1 0.1 2,064,673 21.1 15-19 12,130 28 1584.3 1,684 20 220.0 17 2 2.2 22 2 2.9 39 2 5.1 45 26 12.0 765,627 7.8 20-24 15,462 35 2166.7 2,412 28 338.0 108 15 15.1 107 11 15.0 215 13 30.1 51 29 14.6 713,604 7.3 25-29 7,757 18 1151.8 1,714 20 254.5 136 19 20.2 144 15 21.4 280 17 41.6 28 16 8.7 673,469 6.9 30-34 3,600 8 528.9 906 11 133.1 95 13 14.0 138 14 20.3 233 14 34.2 21 12 6.3 680,660 7.0 35-44 3,052 7 205.2 1,108 13 74.5 191 27 12.8 312 33 21.0 503 30 33.8 23 13 3.1 1,487,534 15.2 45-54 1,098 3 80.2 493 6 36.0 117 17 8.5 179 19 13.1 296 18 21.6 4 2 0.6 1,369,276 14.0 55-64 218 0 22.9 85 1 8.9 31 4 3.3 43 4 4.5 74 4 7.8 1 1 0.2 951,253 9.7 65+ 65 0 6.1 25 0 2.4 7 1 0.7 12 1 1.1 19 1 1.8 0 0 0.0 1,061,729 10.9 Unknown 106 0 . 16 0 . 1 0 . 2 0 . 3 0 . 0 0 . . .Race/Ethnicity3
White 4,678 11 160.4 1,509 18 51.8 276 39 9.5 265 27.6 9.1 541 32.5 18.6 23 13 1.8 2,915,775 29.9 Black 10,979 25 1289.5 3,548 42 416.7 106 15 12.4 167 17.4 19.6 273 16.4 32.1 47 27 11.8 851,406 8.7 Hispanic 18,614 42 398.1 1,982 23 42.4 270 38 5.8 459 47.8 9.8 729 43.8 15.6 79 45 4.0 4,675,192 47.9 Asian-Pacific Islander 1,553 4 119.5 246 3 18.9 33 5 2.5 38 4.0 2.9 71 4.3 5.5 5 3 0.9 1,300,017 13.3 Other/Mixed Race 367 1 1442.9 86 1 338.1 3 0 11.8 12 1.3 47.2 15 0.9 59.0 0 0 . 25,435 0.3 Unknown 7,614 17 . 1,119 13 . 16 2 . 19 2 . 35 2.1 . 25 14 . . .Service Planning Area (SPA)
Antelope Valley (1) 1,970 4 535.3 324 4 88.0 5 1 1.4 5 1 1.4 10 1 2.7 14 8 7.6 368,037 3.8 East (7) 5,607 13 405.6 547 6 39.6 61 9 4.4 87 9 6.3 148 9 10.7 12 7 6.4 1,382,455 14.2 Metro (4) 5,844 13 469.4 1,936 23 155.5 294 42 23.6 420 44 33.7 714 43 57.3 18 10 6.9 1,245,071 12.7 San Fernando (2) 6,511 15 294.0 1,012 12 45.7 114 16 5.1 128 13 5.8 242 15 10.9 49 28 20.7 2,214,739 22.7 San Gabriel (3) 5,036 11 290.9 527 6 30.4 53 8 3.1 57 6 3.3 110 7 6.4 16 9 5.5 1,731,354 17.7 South (6) 10,354 24 984.9 2,288 27 217.6 61 9 5.8 122 13 11.6 183 11 17.4 38 22 6.6 1,051,257 10.8 South Bay (8) 5,001 11 445.1 976 11 86.9 44 6 3.9 59 6 5.3 103 6 9.2 13 7 11.6 1,123,500 11.5 West (5) 1,593 4 244.5 381 4 58.5 49 7 7.5 47 5 7.2 96 6 14.7 10 6 6.8 651,412 6.7 Unknown 1,889 4 . 499 6 . 23 3 . 35 4 . 58 3 . 4 2 . . .
*Report as of September 2010. The impact of report delay and/or update must be considered when comparing to the results reported over time. **Pelvic Inflammatory Disease. Includes Chlamydial, Non-Chlamydial, Gonococcal and Non-Gonococcal. Rates per 100,000 female population.1Per 100,000 population. 2Excludes population in Long Beach and Pasadena. Data Source: Urban Research, LA County CAO and Office of Health Assesment and Epidemiology.3Rates adjusted for unknown, other, and mixed race/ethnicity. See Technical Notes for more details.Note: Percentages may not total to 100%, due to rounding; excludes cases in Long Beach and Pasadena.
Table 1.1. Surveillance Summary of Sexually Transmitted Diseases Reported* to the Los Angeles County Sexually Transmitted Disease Program, 2009
GonorrheaChlamydia County Population P & S Syphilis Early Latent Syphilis PID** TotalEarly Syphilis
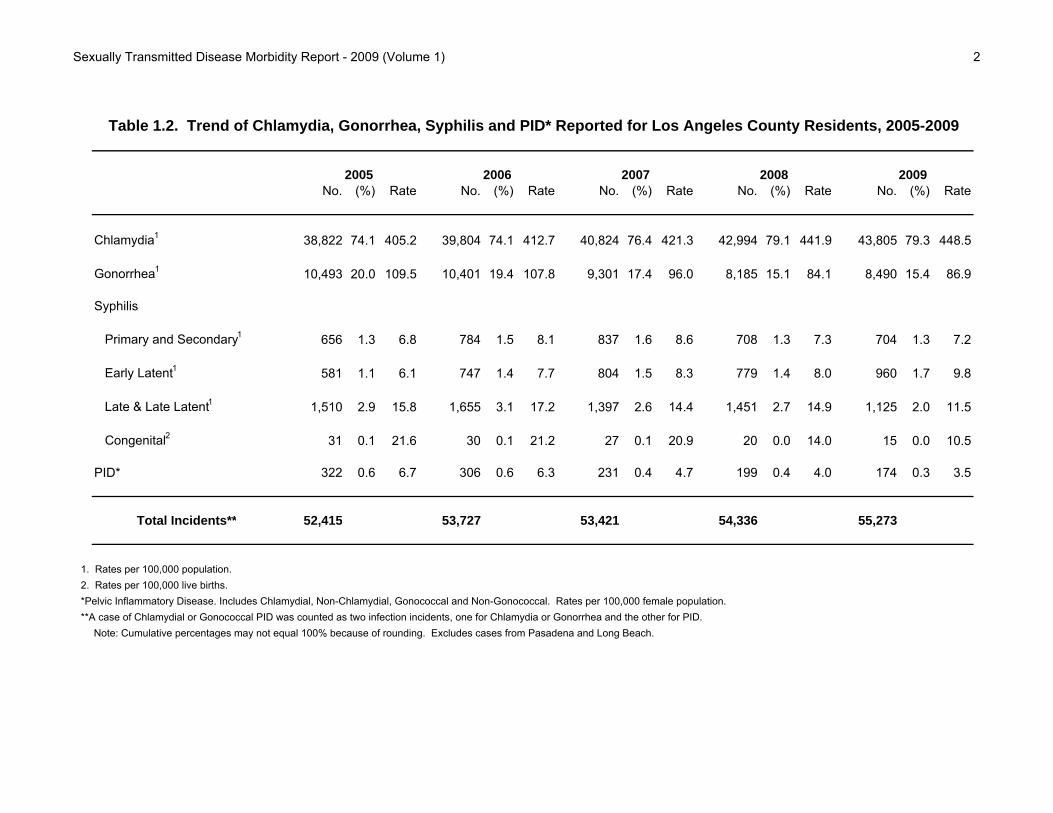
Sexually Transmitted Disease Morbidity Report - 2009 (Volume 1) 2
No. (%) Rate No. (%) Rate No. (%) Rate No. (%) Rate No. (%) Rate
Chlamydia1 38,822 74.1 405.2 39,804 74.1 412.7 40,824 76.4 421.3 42,994 79.1 441.9 43,805 79.3 448.5
Gonorrhea1 10,493 20.0 109.5 10,401 19.4 107.8 9,301 17.4 96.0 8,185 15.1 84.1 8,490 15.4 86.9
Syphilis
Primary and Secondary1 656 1.3 6.8 784 1.5 8.1 837 1.6 8.6 708 1.3 7.3 704 1.3 7.2
Early Latent1 581 1.1 6.1 747 1.4 7.7 804 1.5 8.3 779 1.4 8.0 960 1.7 9.8
Late & Late Latent1 1,510 2.9 15.8 1,655 3.1 17.2 1,397 2.6 14.4 1,451 2.7 14.9 1,125 2.0 11.5
Congenital2 31 0.1 21.6 30 0.1 21.2 27 0.1 20.9 20 0.0 14.0 15 0.0 10.5
PID* 322 0.6 6.7 306 0.6 6.3 231 0.4 4.7 199 0.4 4.0 174 0.3 3.5
Total Incidents** 52,415 53,727 53,421 54,336 55,273
1. Rates per 100,000 population.2. Rates per 100,000 live births.*Pelvic Inflammatory Disease. Includes Chlamydial, Non-Chlamydial, Gonococcal and Non-Gonococcal. Rates per 100,000 female population.**A case of Chlamydial or Gonococcal PID was counted as two infection incidents, one for Chlamydia or Gonorrhea and the other for PID.
Note: Cumulative percentages may not equal 100% because of rounding. Excludes cases from Pasadena and Long Beach.
Table 1.2. Trend of Chlamydia, Gonorrhea, Syphilis and PID* Reported for Los Angeles County Residents, 2005-2009
2005 2009200820072006

Sexually Transmitted Disease Morbidity Report - 2009 (Volume 1) 3
Gonorrhea8490
15.4%
Early Latent Syphilis960
1.7%
P & S Syphilis704
1.3%
PID*174
0.3%
Congenital Syphilis15
0.0%
Late Latent Syphilis11252.0%
Chlamydia4380579.3%
Figure 1.1. Distribution of Reported Sexually Transmitted Diseases in Los Angeles County, 2009
*Pelvic Inflammatory Disease. Includes Chlamydia, Non-Chlamydial, Gonococcal and Non-Gonococcal.Note: Excludes cases in Long Beach and Pasadena
Sexually Transmitted Disease Morbidity Report - 2009 (Volume 1) 4
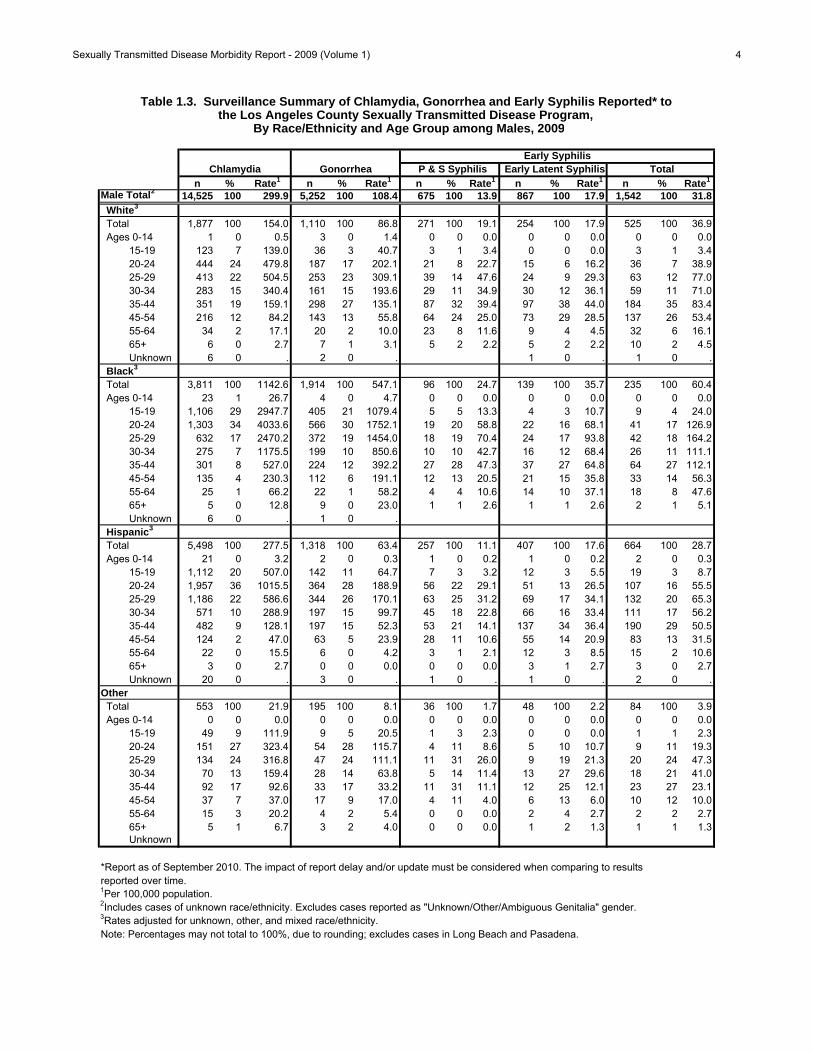
n % Rate1 n % Rate1 n % Rate1 n % Rate1 n % Rate1
Male Total214,525 100 299.9 5,252 100 108.4 675 100 13.9 867 100 17.9 1,542 100 31.8
White3
Total 1,877 100 154.0 1,110 100 86.8 271 100 19.1 254 100 17.9 525 100 36.9 Ages 0-14 1 0 0.5 3 0 1.4 0 0 0.0 0 0 0.0 0 0 0.0 15-19 123 7 139.0 36 3 40.7 3 1 3.4 0 0 0.0 3 1 3.4 20-24 444 24 479.8 187 17 202.1 21 8 22.7 15 6 16.2 36 7 38.9 25-29 413 22 504.5 253 23 309.1 39 14 47.6 24 9 29.3 63 12 77.0 30-34 283 15 340.4 161 15 193.6 29 11 34.9 30 12 36.1 59 11 71.0 35-44 351 19 159.1 298 27 135.1 87 32 39.4 97 38 44.0 184 35 83.4 45-54 216 12 84.2 143 13 55.8 64 24 25.0 73 29 28.5 137 26 53.4 55-64 34 2 17.1 20 2 10.0 23 8 11.6 9 4 4.5 32 6 16.1 65+ 6 0 2.7 7 1 3.1 5 2 2.2 5 2 2.2 10 2 4.5 Unknown 6 0 . 2 0 . 1 0 . 1 0 . Black3
Total 3,811 100 1142.6 1,914 100 547.1 96 100 24.7 139 100 35.7 235 100 60.4 Ages 0-14 23 1 26.7 4 0 4.7 0 0 0.0 0 0 0.0 0 0 0.0 15-19 1,106 29 2947.7 405 21 1079.4 5 5 13.3 4 3 10.7 9 4 24.0 20-24 1,303 34 4033.6 566 30 1752.1 19 20 58.8 22 16 68.1 41 17 126.9 25-29 632 17 2470.2 372 19 1454.0 18 19 70.4 24 17 93.8 42 18 164.2 30-34 275 7 1175.5 199 10 850.6 10 10 42.7 16 12 68.4 26 11 111.1 35-44 301 8 527.0 224 12 392.2 27 28 47.3 37 27 64.8 64 27 112.1 45-54 135 4 230.3 112 6 191.1 12 13 20.5 21 15 35.8 33 14 56.3 55-64 25 1 66.2 22 1 58.2 4 4 10.6 14 10 37.1 18 8 47.6 65+ 5 0 12.8 9 0 23.0 1 1 2.6 1 1 2.6 2 1 5.1 Unknown 6 0 . 1 0 . Hispanic3
Total 5,498 100 277.5 1,318 100 63.4 257 100 11.1 407 100 17.6 664 100 28.7 Ages 0-14 21 0 3.2 2 0 0.3 1 0 0.2 1 0 0.2 2 0 0.3 15-19 1,112 20 507.0 142 11 64.7 7 3 3.2 12 3 5.5 19 3 8.7 20-24 1,957 36 1015.5 364 28 188.9 56 22 29.1 51 13 26.5 107 16 55.5 25-29 1,186 22 586.6 344 26 170.1 63 25 31.2 69 17 34.1 132 20 65.3 30-34 571 10 288.9 197 15 99.7 45 18 22.8 66 16 33.4 111 17 56.2 35-44 482 9 128.1 197 15 52.3 53 21 14.1 137 34 36.4 190 29 50.5 45-54 124 2 47.0 63 5 23.9 28 11 10.6 55 14 20.9 83 13 31.5 55-64 22 0 15.5 6 0 4.2 3 1 2.1 12 3 8.5 15 2 10.6 65+ 3 0 2.7 0 0 0.0 0 0 0.0 3 1 2.7 3 0 2.7 Unknown 20 0 . 3 0 . 1 0 . 1 0 . 2 0 .Other Total 553 100 21.9 195 100 8.1 36 100 1.7 48 100 2.2 84 100 3.9 Ages 0-14 0 0 0.0 0 0 0.0 0 0 0.0 0 0 0.0 0 0 0.0 15-19 49 9 111.9 9 5 20.5 1 3 2.3 0 0 0.0 1 1 2.3 20-24 151 27 323.4 54 28 115.7 4 11 8.6 5 10 10.7 9 11 19.3 25-29 134 24 316.8 47 24 111.1 11 31 26.0 9 19 21.3 20 24 47.3 30-34 70 13 159.4 28 14 63.8 5 14 11.4 13 27 29.6 18 21 41.0 35-44 92 17 92.6 33 17 33.2 11 31 11.1 12 25 12.1 23 27 23.1 45-54 37 7 37.0 17 9 17.0 4 11 4.0 6 13 6.0 10 12 10.0 55-64 15 3 20.2 4 2 5.4 0 0 0.0 2 4 2.7 2 2 2.7 65+ 5 1 6.7 3 2 4.0 0 0 0.0 1 2 1.3 1 1 1.3 Unknown
reported over time.1Per 100,000 population. 2Includes cases of unknown race/ethnicity. Excludes cases reported as "Unknown/Other/Ambiguous Genitalia" gender.3Rates adjusted for unknown, other, and mixed race/ethnicity. Note: Percentages may not total to 100%, due to rounding; excludes cases in Long Beach and Pasadena.
*Report as of September 2010. The impact of report delay and/or update must be considered when comparing to results
Table 1.3. Surveillance Summary of Chlamydia, Gonorrhea and Early Syphilis Reported* to
By Race/Ethnicity and Age Group among Males, 2009
Chlamydia Gonorrhea P & S Syphilis Total Early Latent SyphilisEarly Syphilis
the Los Angeles County Sexually Transmitted Disease Program,

Sexually Transmitted Disease Morbidity Report - 2009 (Volume 1) 5
0-14 15-19 20-24 25-29 30-34 35-44 45-54 55-64 65+
OtherWhite
BlackHispanic0
500
1000
1500
2000
2500
3000
3500
4000
4500R
ate
pe
r 1
00
,00
0 p
op
ula
tio
n
Age Group
Figure 1.2. Reported Chlamydia Rates per 100,000 Population Among Males in Los Angeles County, by Age Group and Race/Ethnicity, 2009
Note: Excludes cases in Long Beach and Pasadena
Sexually Transmitted Disease Morbidity Report - 2009 (Volume 1) 6
0-14 15-19 20-24 25-29 30-34 35-44 45-54 55-64 65+
OtherWhite
BlackHispanic0
200
400
600
800
1000
1200
1400
1600
1800
2000N
um
be
r o
f C
as
es
Age Group
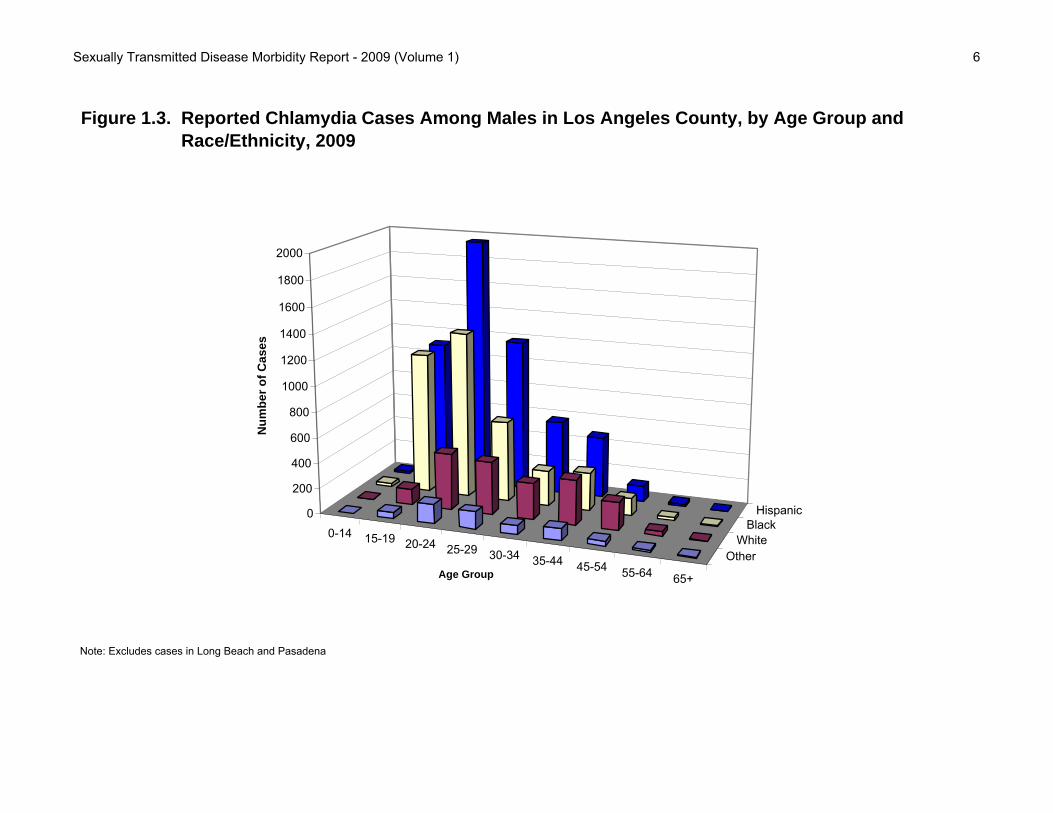
Figure 1.3. Reported Chlamydia Cases Among Males in Los Angeles County, by Age Group and Race/Ethnicity, 2009
Note: Excludes cases in Long Beach and Pasadena

Sexually Transmitted Disease Morbidity Report - 2009 (Volume 1) 7
0-14 15-19 20-24 25-29 30-34 35-44 45-54 55-64 65+
OtherWhite
BlackHispanic0
200
400
600
800
1000
1200
1400
1600
1800R
ate
pe
r 1
00
,00
0 p
op
ula
tio
n
Age Group
Figure 1.4. Reported Gonorrhea Rates per 100,000 Population Among Males in Los Angeles County, by Age Group and Race/Ethnicity, 2009
Note: Excludes cases in Long Beach and Pasadena
Sexually Transmitted Disease Morbidity Report - 2009 (Volume 1) 8
0-14 15-19 20-24 25-29 30-34 35-44 45-54 55-64 65+
OtherWhite
BlackHispanic0
100
200
300
400
500
600N
um
be
r o
f C
as
es
Age Group
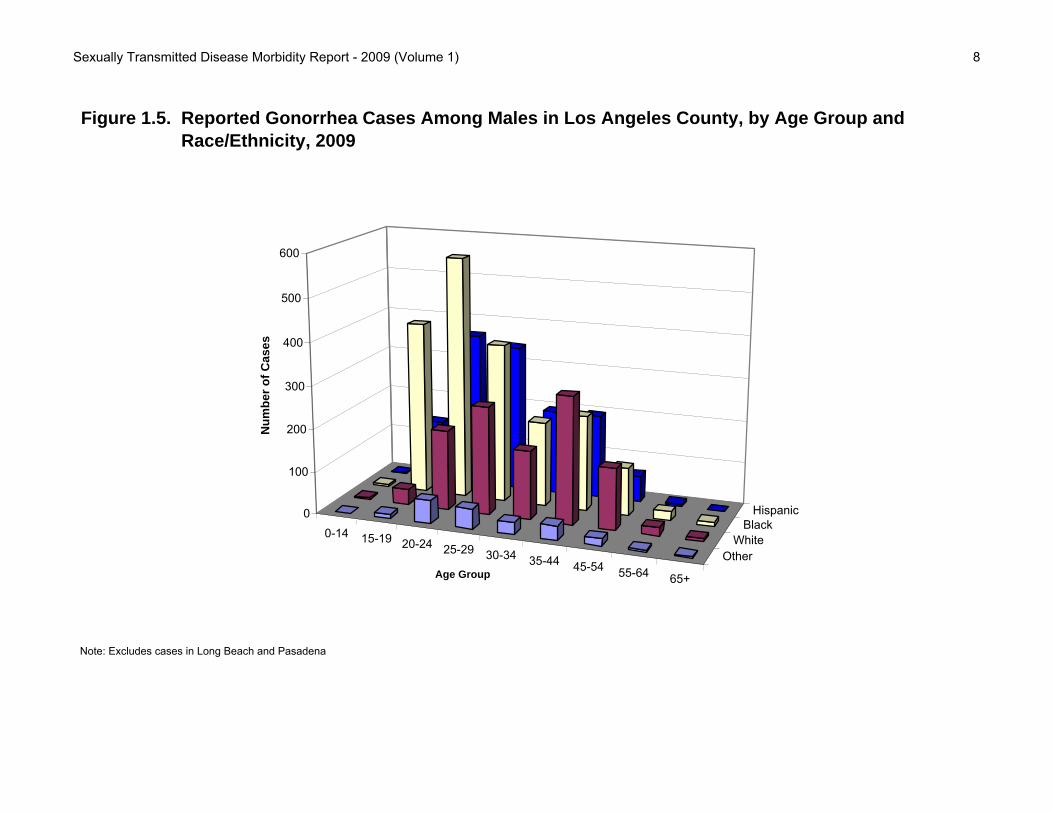
Figure 1.5. Reported Gonorrhea Cases Among Males in Los Angeles County, by Age Group and Race/Ethnicity, 2009
Note: Excludes cases in Long Beach and Pasadena

Sexually Transmitted Disease Morbidity Report - 2009 (Volume 1) 9
0-14 15-19 20-24 25-29 30-34 35-44 45-54 55-64 65+
OtherWhite
BlackHispanic0
20
40
60
80
100
120
140
160
180R
ate
pe
r 1
00
,00
0 p
op
ula
tio
n
Age Group
Figure 1.6. Reported Early Syphilis Rates per 100,000 Population Among Males in Los Angeles County, by Age Group and Race/Ethnicity, 2009
Note: Excludes cases in Long Beach and Pasadena

Sexually Transmitted Disease Morbidity Report - 2009 (Volume 1) 10
0-14 15-19 20-24 25-29 30-34 35-44 45-54 55-64 65+
OtherWhite
BlackHispanic0
20
40
60
80
100
120
140
160
180
200N
um
be
r o
f C
as
es
Age Group
Figure 1.7. Reported Early Syphilis Cases Among Males in Los Angeles County, by Age Group and Race/Ethnicity, 2009
Note: Excludes cases in Long Beach and Pasadena
Sexually Transmitted Disease Morbidity Report - 2009 (Volume 1) 11
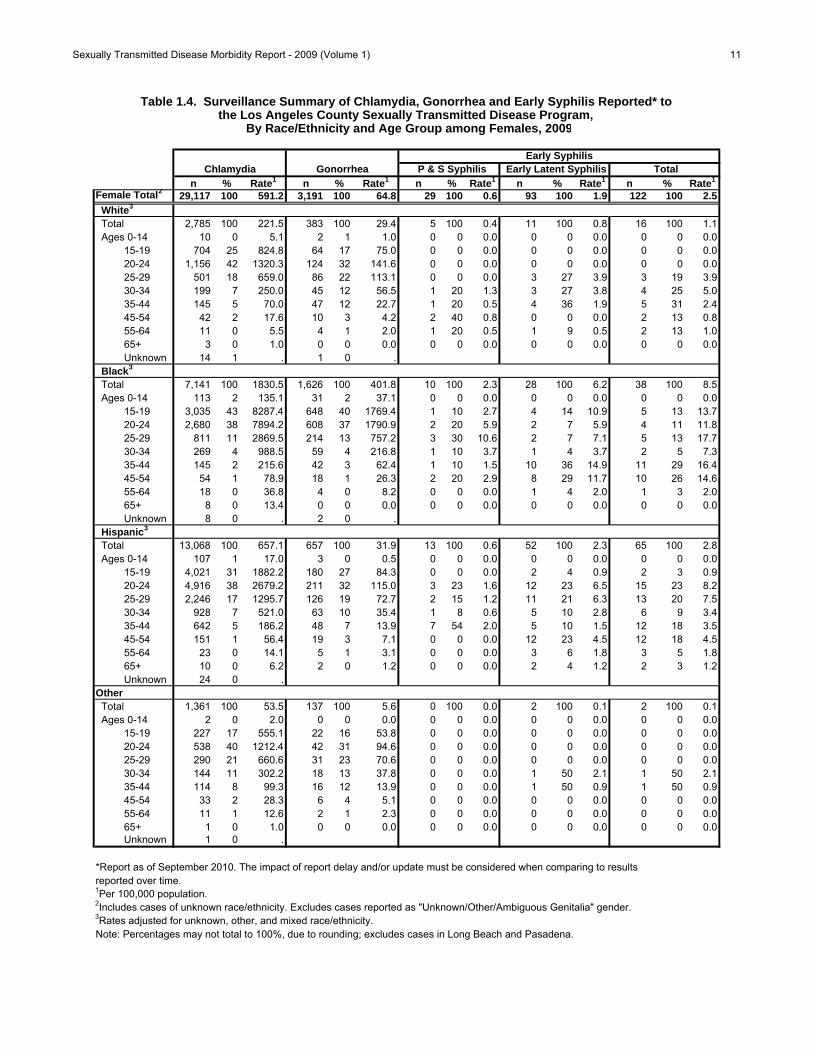
n % Rate1 n % Rate1 n % Rate1 n % Rate1 n % Rate1
Female Total229,117 100 591.2 3,191 100 64.8 29 100 0.6 93 100 1.9 122 100 2.5
White3
Total 2,785 100 221.5 383 100 29.4 5 100 0.4 11 100 0.8 16 100 1.1 Ages 0-14 10 0 5.1 2 1 1.0 0 0 0.0 0 0 0.0 0 0 0.0 15-19 704 25 824.8 64 17 75.0 0 0 0.0 0 0 0.0 0 0 0.0 20-24 1,156 42 1320.3 124 32 141.6 0 0 0.0 0 0 0.0 0 0 0.0 25-29 501 18 659.0 86 22 113.1 0 0 0.0 3 27 3.9 3 19 3.9 30-34 199 7 250.0 45 12 56.5 1 20 1.3 3 27 3.8 4 25 5.0 35-44 145 5 70.0 47 12 22.7 1 20 0.5 4 36 1.9 5 31 2.4 45-54 42 2 17.6 10 3 4.2 2 40 0.8 0 0 0.0 2 13 0.8 55-64 11 0 5.5 4 1 2.0 1 20 0.5 1 9 0.5 2 13 1.0 65+ 3 0 1.0 0 0 0.0 0 0 0.0 0 0 0.0 0 0 0.0 Unknown 14 1 . 1 0 . Black3
Total 7,141 100 1830.5 1,626 100 401.8 10 100 2.3 28 100 6.2 38 100 8.5 Ages 0-14 113 2 135.1 31 2 37.1 0 0 0.0 0 0 0.0 0 0 0.0 15-19 3,035 43 8287.4 648 40 1769.4 1 10 2.7 4 14 10.9 5 13 13.7 20-24 2,680 38 7894.2 608 37 1790.9 2 20 5.9 2 7 5.9 4 11 11.8 25-29 811 11 2869.5 214 13 757.2 3 30 10.6 2 7 7.1 5 13 17.7 30-34 269 4 988.5 59 4 216.8 1 10 3.7 1 4 3.7 2 5 7.3 35-44 145 2 215.6 42 3 62.4 1 10 1.5 10 36 14.9 11 29 16.4 45-54 54 1 78.9 18 1 26.3 2 20 2.9 8 29 11.7 10 26 14.6 55-64 18 0 36.8 4 0 8.2 0 0 0.0 1 4 2.0 1 3 2.0 65+ 8 0 13.4 0 0 0.0 0 0 0.0 0 0 0.0 0 0 0.0 Unknown 8 0 . 2 0 . Hispanic3
Total 13,068 100 657.1 657 100 31.9 13 100 0.6 52 100 2.3 65 100 2.8 Ages 0-14 107 1 17.0 3 0 0.5 0 0 0.0 0 0 0.0 0 0 0.0 15-19 4,021 31 1882.2 180 27 84.3 0 0 0.0 2 4 0.9 2 3 0.9 20-24 4,916 38 2679.2 211 32 115.0 3 23 1.6 12 23 6.5 15 23 8.2 25-29 2,246 17 1295.7 126 19 72.7 2 15 1.2 11 21 6.3 13 20 7.5 30-34 928 7 521.0 63 10 35.4 1 8 0.6 5 10 2.8 6 9 3.4 35-44 642 5 186.2 48 7 13.9 7 54 2.0 5 10 1.5 12 18 3.5 45-54 151 1 56.4 19 3 7.1 0 0 0.0 12 23 4.5 12 18 4.5 55-64 23 0 14.1 5 1 3.1 0 0 0.0 3 6 1.8 3 5 1.8 65+ 10 0 6.2 2 0 1.2 0 0 0.0 2 4 1.2 2 3 1.2 Unknown 24 0 .Other Total 1,361 100 53.5 137 100 5.6 0 100 0.0 2 100 0.1 2 100 0.1 Ages 0-14 2 0 2.0 0 0 0.0 0 0 0.0 0 0 0.0 0 0 0.0 15-19 227 17 555.1 22 16 53.8 0 0 0.0 0 0 0.0 0 0 0.0 20-24 538 40 1212.4 42 31 94.6 0 0 0.0 0 0 0.0 0 0 0.0 25-29 290 21 660.6 31 23 70.6 0 0 0.0 0 0 0.0 0 0 0.0 30-34 144 11 302.2 18 13 37.8 0 0 0.0 1 50 2.1 1 50 2.1 35-44 114 8 99.3 16 12 13.9 0 0 0.0 1 50 0.9 1 50 0.9 45-54 33 2 28.3 6 4 5.1 0 0 0.0 0 0 0.0 0 0 0.0 55-64 11 1 12.6 2 1 2.3 0 0 0.0 0 0 0.0 0 0 0.0 65+ 1 0 1.0 0 0 0.0 0 0 0.0 0 0 0.0 0 0 0.0 Unknown 1 0 .
*Report as of September 2010. The impact of report delay and/or update must be considered when comparing to results reported over time.1Per 100,000 population. 2Includes cases of unknown race/ethnicity. Excludes cases reported as "Unknown/Other/Ambiguous Genitalia" gender.3Rates adjusted for unknown, other, and mixed race/ethnicity.Note: Percentages may not total to 100%, due to rounding; excludes cases in Long Beach and Pasadena.
Table 1.4. Surveillance Summary of Chlamydia, Gonorrhea and Early Syphilis Reported* to
By Race/Ethnicity and Age Group among Females, 2009
Chlamydia Gonorrhea P & S Syphilis Total Early Latent SyphilisEarly Syphilis
the Los Angeles County Sexually Transmitted Disease Program,

Sexually Transmitted Disease Morbidity Report - 2009 (Volume 1) 12
0-14 15-19 20-24 25-29 30-34 35-44 45-54 55-64 65+
OtherWhite
BlackHispanic0
1000
2000
3000
4000
5000
6000
7000
8000
9000R
ate
pe
r 1
00
,00
0 p
op
ula
tio
n
Age Group
Figure 1.8. Reported Chlamydia Rates per 100,000 Population Among Females in Los Angeles County, by Age Group and Race/Ethnicity, 2009
Note: Excludes cases in Long Beach and Pasadena
Sexually Transmitted Disease Morbidity Report - 2009 (Volume 1) 13
0-14 15-19 20-24 25-29 30-34 35-44 45-54 55-64 65+
OtherWhite
BlackHispanic0
500
1000
1500
2000
2500
3000
3500
4000
4500
5000N
um
be
r o
f C
as
es
Age Group
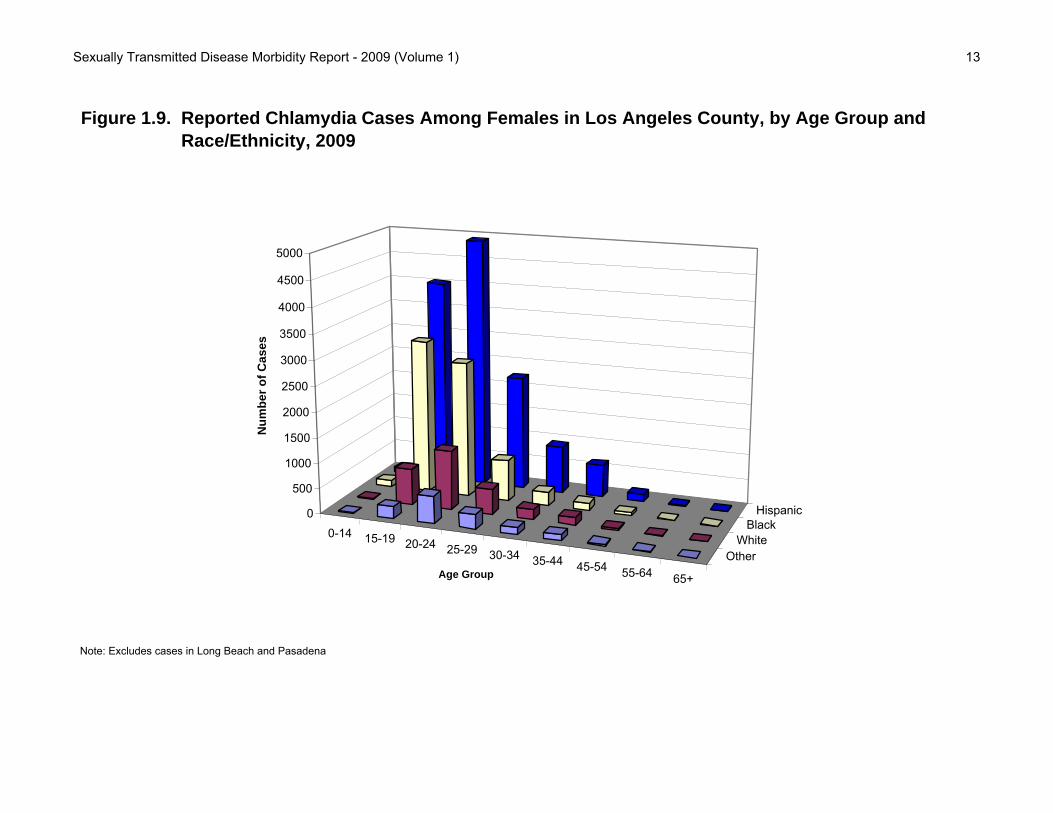
Figure 1.9. Reported Chlamydia Cases Among Females in Los Angeles County, by Age Group and Race/Ethnicity, 2009
Note: Excludes cases in Long Beach and Pasadena
Sexually Transmitted Disease Morbidity Report - 2009 (Volume 1) 14
0-14 15-19 20-24 25-29 30-34 35-44 45-54 55-64 65+
OtherWhite
BlackHispanic0
200
400
600
800
1000
1200
1400
1600
1800R
ate
pe
r 1
00
,00
0 p
op
ula
tio
n
Age Group
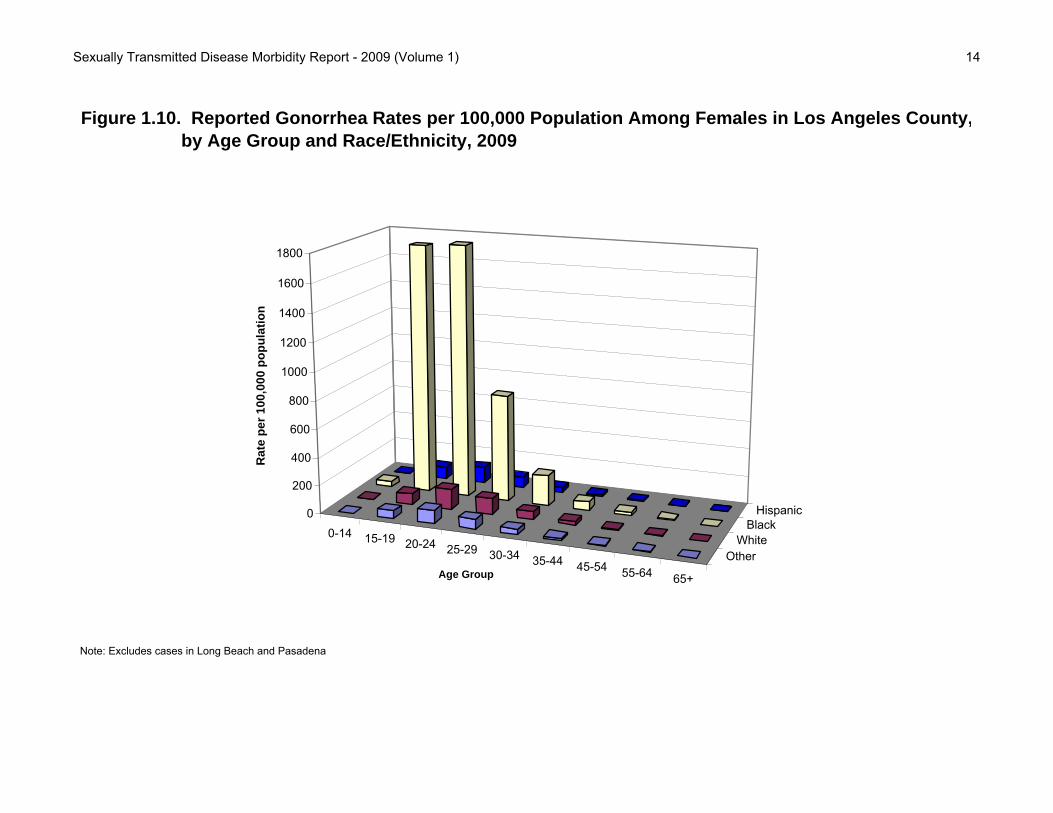
Figure 1.10. Reported Gonorrhea Rates per 100,000 Population Among Females in Los Angeles County, by Age Group and Race/Ethnicity, 2009
Note: Excludes cases in Long Beach and Pasadena

Sexually Transmitted Disease Morbidity Report - 2009 (Volume 1) 15
0-14 15-19 20-24 25-29 30-34 35-44 45-54 55-64 65+
OtherWhite
BlackHispanic0
100
200
300
400
500
600
700N
um
be
r o
f C
as
es
Age Group
Figure 1.11. Reported Gonorrhea Cases Among Females in Los Angeles County, by Age Group and Race/Ethnicity, 2009
Note: Excludes cases in Long Beach and Pasadena

Sexually Transmitted Disease Morbidity Report - 2009 (Volume 1) 16
0-14 15-19 20-24 25-29 30-34 35-44 45-54 55-64 65+
OtherWhite
BlackHispanic0
2
4
6
8
10
12
14
16
18R
ate
pe
r 1
00
,00
0 p
op
ula
tio
n
Age Group
Figure 1.12. Reported Early Syphilis Rates per 100,000 Population Among Females in Los Angeles County, by Age Group and Race/Ethnicity, 2009
Note: Excludes cases in Long Beach and Pasadena
Sexually Transmitted Disease Morbidity Report - 2009 (Volume 1) 17
0-14 15-19 20-24 25-29 30-34 35-44 45-54 55-64 65+
OtherWhite
BlackHispanic0
2
4
6
8
10
12
14
16N
um
be
r o
f C
as
es
Age Group
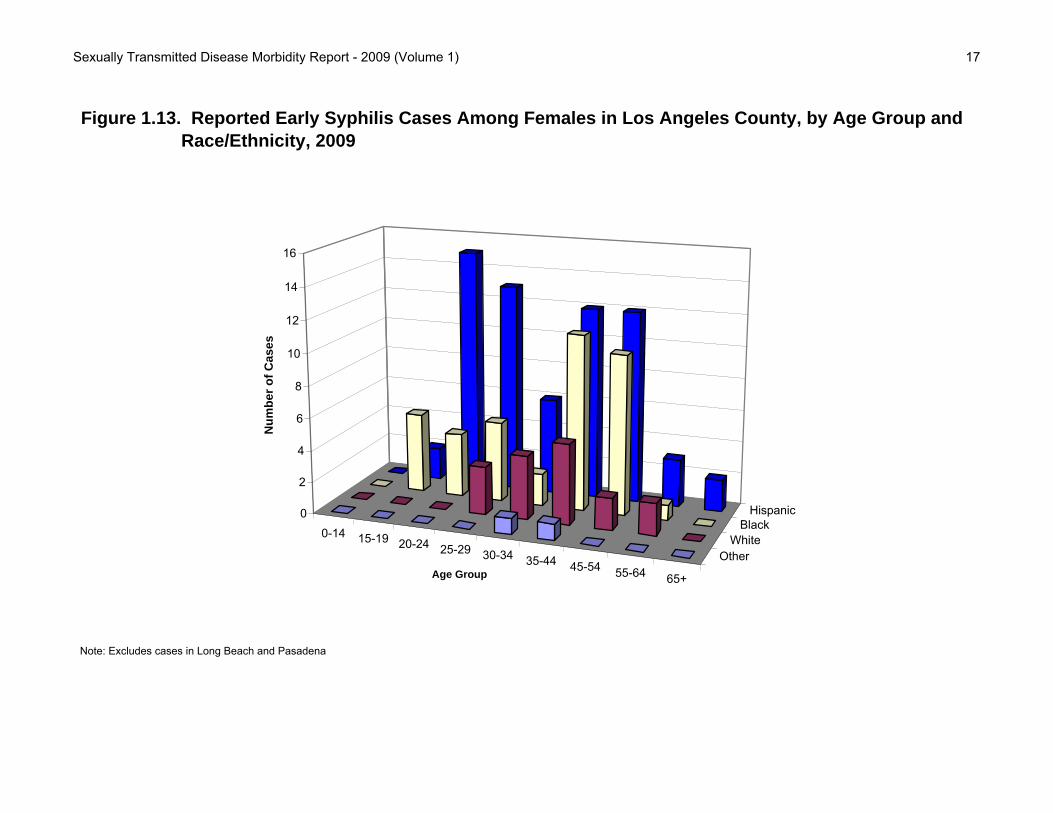
Figure 1.13. Reported Early Syphilis Cases Among Females in Los Angeles County, by Age Group and Race/Ethnicity, 2009
Note: Excludes cases in Long Beach and Pasadena

Sexually Transmitted Disease Morbidity Report, 2009
Section II: Chlamydia
Sexually Transmitted Disease Morbidity Report - 2009 (Volume 1) 18
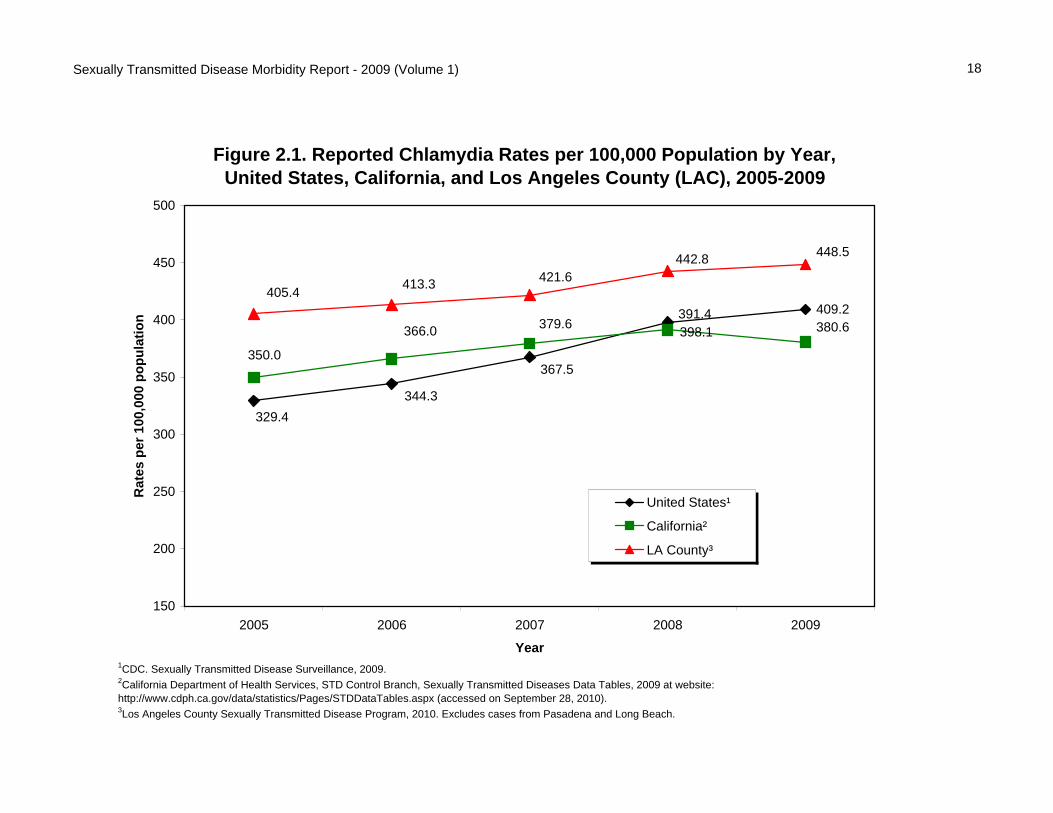
Figure 2.1. Reported Chlamydia Rates per 100,000 Population by Year, United States, California, and Los Angeles County (LAC), 2005-2009
409.2
398.1
367.5
344.3329.4
350.0
366.0 379.6391.4
380.6
405.4 413.3 421.6442.8 448.5
150
200
250
300
350
400
450
500
2005 2006 2007 2008 2009
Year
Rat
es p
er 1
00,0
00 p
op
ula
tio
n
United States¹
California²
LA County³
1CDC. Sexually Transmitted Disease Surveillance, 2009.2California Department of Health Services, STD Control Branch, Sexually Transmitted Diseases Data Tables, 2009 at website: http://www.cdph.ca.gov/data/statistics/Pages/STDDataTables.aspx (accessed on September 28, 2010). 3Los Angeles County Sexually Transmitted Disease Program, 2010. Excludes cases from Pasadena and Long Beach.
Sexually Transmitted Disease Morbidity Report - 2009 (Volume 1) 19
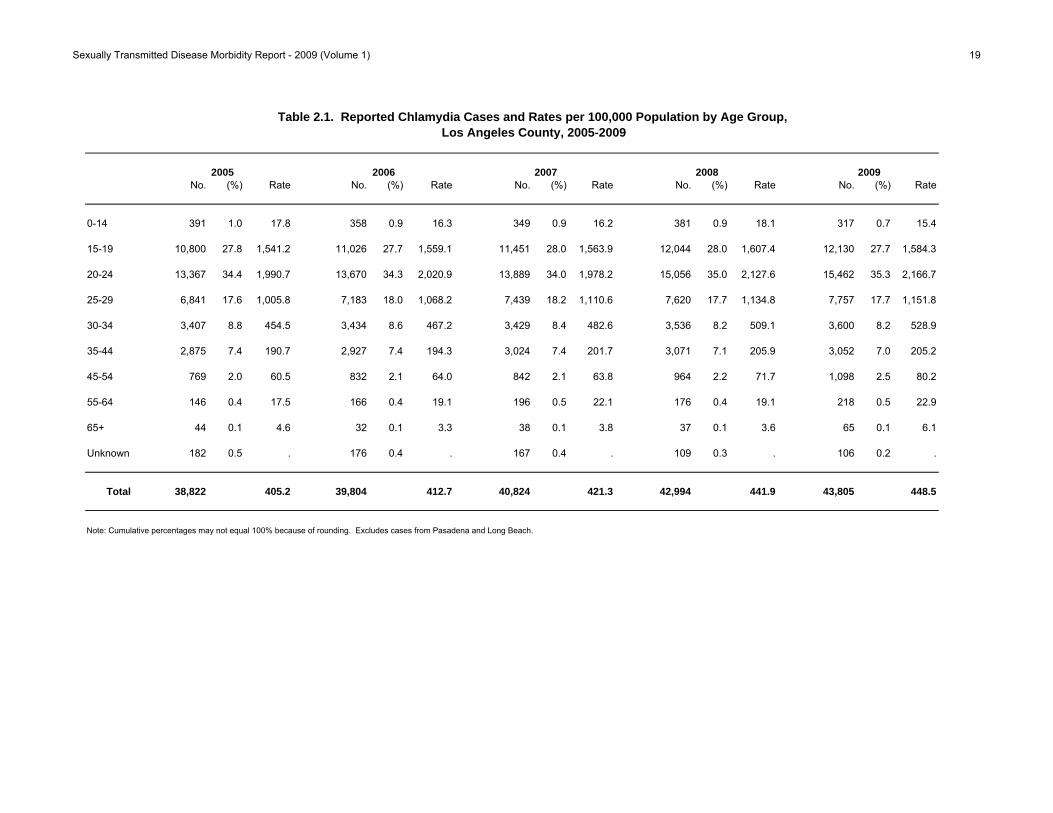
No. (%) Rate No. (%) Rate No. (%) Rate No. (%) Rate No. (%) Rate
0-14 391 1.0 17.8 358 0.9 16.3 349 0.9 16.2 381 0.9 18.1 317 0.7 15.4
15-19 10,800 27.8 1,541.2 11,026 27.7 1,559.1 11,451 28.0 1,563.9 12,044 28.0 1,607.4 12,130 27.7 1,584.3
20-24 13,367 34.4 1,990.7 13,670 34.3 2,020.9 13,889 34.0 1,978.2 15,056 35.0 2,127.6 15,462 35.3 2,166.7
25-29 6,841 17.6 1,005.8 7,183 18.0 1,068.2 7,439 18.2 1,110.6 7,620 17.7 1,134.8 7,757 17.7 1,151.8
30-34 3,407 8.8 454.5 3,434 8.6 467.2 3,429 8.4 482.6 3,536 8.2 509.1 3,600 8.2 528.9
35-44 2,875 7.4 190.7 2,927 7.4 194.3 3,024 7.4 201.7 3,071 7.1 205.9 3,052 7.0 205.2
45-54 769 2.0 60.5 832 2.1 64.0 842 2.1 63.8 964 2.2 71.7 1,098 2.5 80.2
55-64 146 0.4 17.5 166 0.4 19.1 196 0.5 22.1 176 0.4 19.1 218 0.5 22.9
65+ 44 0.1 4.6 32 0.1 3.3 38 0.1 3.8 37 0.1 3.6 65 0.1 6.1
Unknown 182 0.5 . 176 0.4 . 167 0.4 . 109 0.3 . 106 0.2 .
Total 38,822 405.2 39,804 412.7 40,824 421.3 42,994 441.9 43,805 448.5
Note: Cumulative percentages may not equal 100% because of rounding. Excludes cases from Pasadena and Long Beach.
2008
Table 2.1. Reported Chlamydia Cases and Rates per 100,000 Population by Age Group, Los Angeles County, 2005-2009
200720062005 2009

Sexually Transmitted Disease Morbidity Report - 2009 (Volume 1) 20
15.4
1584.3
2166.7
1151.8
528.9
205.2
80.222.9 6.1
0
500
1000
1500
2000
2500
0-14 15-19 20-24 25-29 30-34 35-44 45-54 55-64 65+
Age Group
Ra
te p
er
10
0,0
00
po
pu
lati
on
Figure 2.2. Reported Chlamydia Rates per 100,000 Population in Los Angeles County, by Age
Group, 2009
Note: Excludes cases in Long Beach and Pasadena

Sexually Transmitted Disease Morbidity Report - 2009 (Volume 1) 21
No. (%) Rate No. (%) Rate No. (%) Rate No. (%) Rate No. (%) Rate
MALE
0-14 58 0.5 5.2 54 0.5 4.8 67 0.5 6.1 75 0.6 7.0 56 0.4 5.315-19 2,258 19.8 633.8 2,380 20.0 662.0 2,569 20.5 689.4 2,778 20.5 729.1 2,862 19.7 735.520-24 3,567 31.2 1,033.8 3,769 31.6 1,091.8 3,899 31.1 1,079.9 4,294 31.6 1,184.3 4,569 31.5 1,254.425-29 2,259 19.8 647.1 2,430 20.4 699.9 2,601 20.8 749.1 2,736 20.2 782.8 2,948 20.3 837.730-34 1,327 11.6 348.2 1,310 11.0 350.8 1,291 10.3 357.0 1,415 10.4 399.3 1,579 10.9 453.635-44 1,392 12.2 182.0 1,371 11.5 179.2 1,457 11.6 191.4 1,556 11.5 205.7 1,613 11.1 214.145-54 393 3.4 63.2 427 3.6 66.9 455 3.6 70.0 551 4.1 82.9 694 4.8 102.355-64 76 0.7 19.3 96 0.8 23.4 112 0.9 26.7 103 0.8 23.6 132 0.9 29.265+ 24 0.2 6.0 21 0.2 5.1 20 0.2 4.7 17 0.1 3.9 31 0.2 6.9Unknown 61 0.5 . 61 0.5 . 55 0.4 . 51 0.4 . 41 0.3 .
Subtotal 11,415 29.4 240.9 11,919 30.0 249.8 12,526 30.8 260.9 13,576 31.8 281.6 14,525 33.3 299.9
FEMALE
0-14 332 1.2 30.9 302 1.1 28.1 278 1.0 26.4 306 1.0 29.7 260 0.9 25.815-19 8,530 31.2 2,476.0 8,612 31.0 2,477.0 8,843 31.4 2,459.4 9,209 31.6 2,500.6 9,220 31.7 2,448.820-24 9,793 35.8 2,999.9 9,869 35.6 2,979.3 9,957 35.4 2,919.5 10,695 36.7 3,099.2 10,853 37.3 3,106.525-29 4,571 16.7 1,380.7 4,735 17.1 1,455.9 4,812 17.1 1,491.6 4,832 16.6 1,500.8 4,776 16.4 1,485.430-34 2,074 7.6 562.8 2,112 7.6 584.0 2,122 7.5 608.2 2,084 7.1 612.6 2,005 6.9 602.935-44 1,479 5.4 199.2 1,543 5.6 208.1 1,551 5.5 210.0 1,488 5.1 202.3 1,426 4.9 194.345-54 373 1.4 57.5 402 1.4 60.7 381 1.4 56.9 400 1.4 58.8 395 1.4 57.255-64 68 0.2 15.4 70 0.3 15.3 82 0.3 17.5 73 0.3 15.1 86 0.3 17.365+ 20 0.1 3.6 11 0.0 1.9 18 0.1 3.1 20 0.1 3.3 34 0.1 5.5Unknown 114 0.4 . 99 0.4 . 95 0.3 . 48 0.2 . 62 0.2 .
Subtotal 27,354 70.6 565.0 27,755 70.0 569.6 28,139 69.2 575.5 29,155 68.2 594.2 29,117 66.7 591.2
Total1,2 38,822 405.2 39,804 412.7 40,824 421.3 42,994 441.9 43,805 448.5
1. Includes cases reported as "Unknown" gender and age.2. Includes cases reported as "Unknown/Other/Ambiguous Genitalia" gender and known age.Note: Cumulative percentages may not equal 100% because of rounding. Excludes cases from Pasadena and Long Beach. Includes Transgender cases.
Table 2.2. Reported Chlamydia Cases and Rates per 100,000 Population by Gender and Age Group, Los Angeles County, 2005-2009
2005 2006 2007 2008 2009
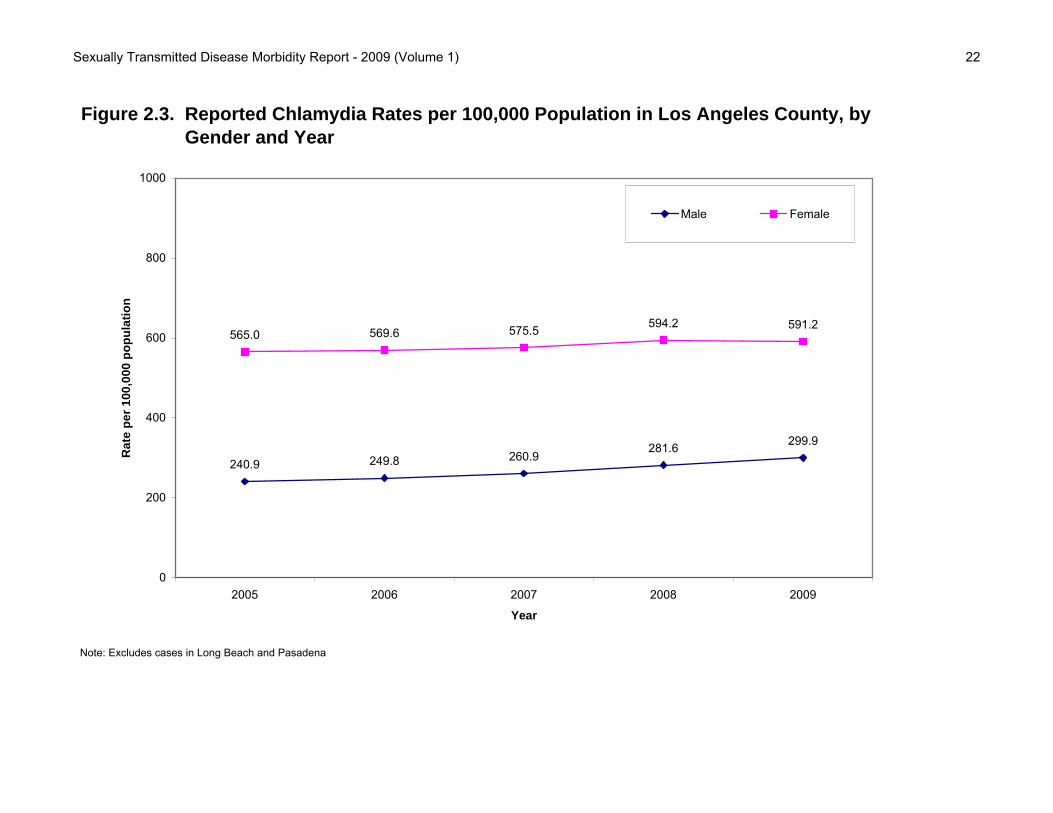
Sexually Transmitted Disease Morbidity Report - 2009 (Volume 1) 22
240.9 249.8 260.9281.6 299.9
565.0 569.6 575.5 594.2 591.2
0
200
400
600
800
1000
2005 2006 2007 2008 2009
Year
Ra
te p
er
10
0,0
00
po
pu
lati
on
Male Female
Figure 2.3. Reported Chlamydia Rates per 100,000 Population in Los Angeles County, by Gender and Year
Note: Excludes cases in Long Beach and Pasadena

Sexually Transmitted Disease Morbidity Report - 2009 (Volume 1) 23
5.3
735.5
1254.4
837.7
453.6
214.1
102.3
29.2
6.9
0500100015002000250030003500
0-14
15-19
20-24
25-29
30-34
35-44
45-54
55-64
65+
25.8
2448.8
3106.5
1485.4
602.9
194.3
57.2
17.3
5.5
0 500 1000 1500 2000 2500 3000 3500
0-14
15-19
20-24
25-29
30-34
35-44
45-54
55-64
65+
Figure 2.4. Reported Chlamydia Rates per 100,000 Population in Los Angeles County, by Gender and Age Group, 2009
Note: Excludes cases in Long Beach and Pasadena
Male Rate per 100,000 population Female Age
Sexually Transmitted Disease Morbidity Report - 2009 (Volume 1) 24
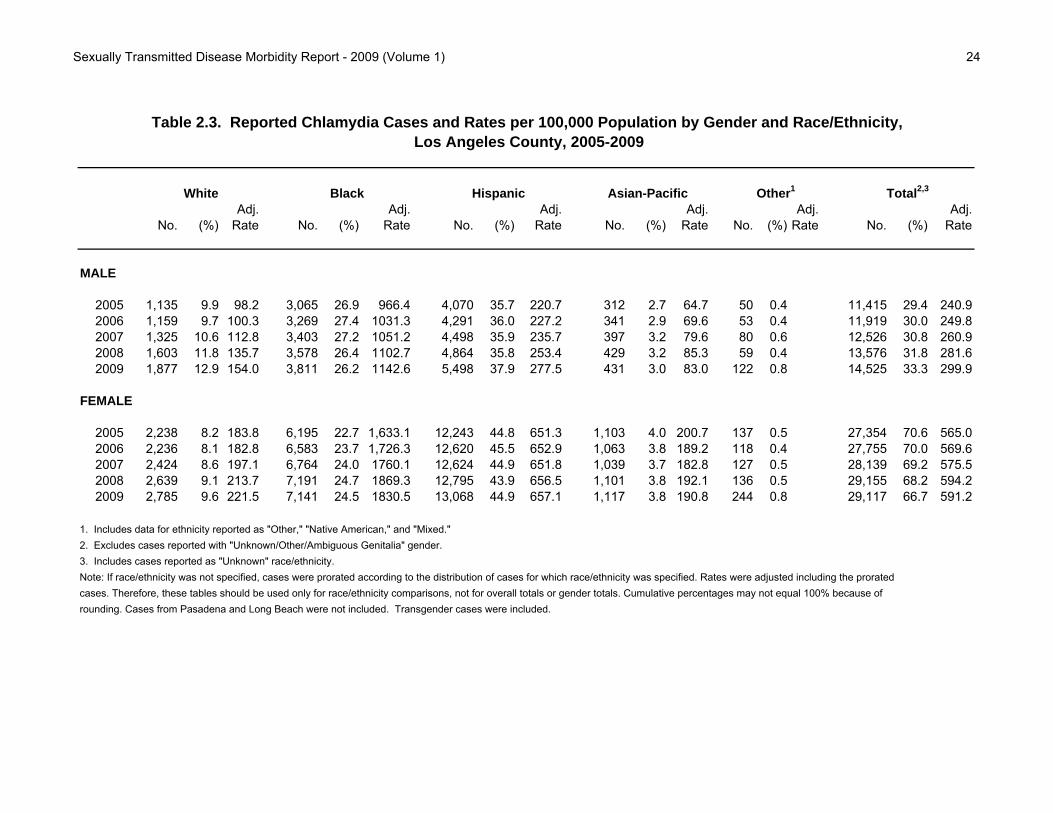
Adj. Adj. Adj. Adj. Adj. Adj.No. (%) Rate No. (%) Rate No. (%) Rate No. (%) Rate No. (%) Rate No. (%) Rate
MALE
2005 1,135 9.9 98.2 3,065 26.9 966.4 4,070 35.7 220.7 312 2.7 64.7 50 0.4 11,415 29.4 240.92006 1,159 9.7 100.3 3,269 27.4 1031.3 4,291 36.0 227.2 341 2.9 69.6 53 0.4 11,919 30.0 249.82007 1,325 10.6 112.8 3,403 27.2 1051.2 4,498 35.9 235.7 397 3.2 79.6 80 0.6 12,526 30.8 260.92008 1,603 11.8 135.7 3,578 26.4 1102.7 4,864 35.8 253.4 429 3.2 85.3 59 0.4 13,576 31.8 281.62009 1,877 12.9 154.0 3,811 26.2 1142.6 5,498 37.9 277.5 431 3.0 83.0 122 0.8 14,525 33.3 299.9
FEMALE
2005 2,238 8.2 183.8 6,195 22.7 1,633.1 12,243 44.8 651.3 1,103 4.0 200.7 137 0.5 27,354 70.6 565.02006 2,236 8.1 182.8 6,583 23.7 1,726.3 12,620 45.5 652.9 1,063 3.8 189.2 118 0.4 27,755 70.0 569.62007 2,424 8.6 197.1 6,764 24.0 1760.1 12,624 44.9 651.8 1,039 3.7 182.8 127 0.5 28,139 69.2 575.52008 2,639 9.1 213.7 7,191 24.7 1869.3 12,795 43.9 656.5 1,101 3.8 192.1 136 0.5 29,155 68.2 594.22009 2,785 9.6 221.5 7,141 24.5 1830.5 13,068 44.9 657.1 1,117 3.8 190.8 244 0.8 29,117 66.7 591.2
1. Includes data for ethnicity reported as "Other," "Native American," and "Mixed."
Note: If race/ethnicity was not specified, cases were prorated according to the distribution of cases for which race/ethnicity was specified. Rates were adjusted including the prorated cases. Therefore, these tables should be used only for race/ethnicity comparisons, not for overall totals or gender totals. Cumulative percentages may not equal 100% because of rounding. Cases from Pasadena and Long Beach were not included. Transgender cases were included.
Other1
Table 2.3. Reported Chlamydia Cases and Rates per 100,000 Population by Gender and Race/Ethnicity, Los Angeles County, 2005-2009
White Black Hispanic Asian-Pacific Total2,3
2. Excludes cases reported with "Unknown/Other/Ambiguous Genitalia" gender. 3. Includes cases reported as "Unknown" race/ethnicity.

Sexually Transmitted Disease Morbidity Report - 2009 (Volume 1) 25
154.0
1142.6
277.5
83.0
221.5
1830.5
657.1
190.8
0
200
400
600
800
1000
1200
1400
1600
1800
2000
White Black Hispanic Asian-Pacific
Ra
te p
er
10
0,0
00
po
pu
lati
on
Male Female
Figure 2.5. Reported Chlamydia Rates per 100,000 Population in Los Angeles County, by
Gender and Race/Ethnicity, 2009
Note: Adjusted for unknown race. Excludes cases in Long Beach and Pasadena

Sexually Transmitted Disease Morbidity Report - 2009 (Volume 1) 26
No. (%) Rate No. (%) Rate No. (%) Rate No. (%) Rate No. (%) Rate
SPA2/HD3
Antelope Valley (1) 1,354 3.5 397.4 1,448 3.6 416.3 1,723 4.2 480.8 1,803 4.2 496.3 1,970 4.5 535.3 Antelope Valley 1,354 3.5 397.4 1,448 3.6 416.3 1,723 4.2 480.8 1,803 4.2 496.3 1,970 4.5 535.3
East (7) 4,732 12.2 344.8 5,013 12.6 363.4 5,157 12.6 373.8 5,432 12.6 393.3 5,607 12.8 405.6 Bellflower 1,247 3.2 338.3 1,284 3.2 347.5 1,383 3.4 373.8 1,465 3.4 395.8 1,426 3.3 385.1 East Los Angeles 815 2.1 367.6 874 2.2 388.3 789 1.9 354.6 896 2.1 403.2 945 2.2 426.0 San Antonio 1,778 4.6 395.9 1,881 4.7 417.6 1,954 4.8 432.9 1,951 4.5 431.3 2,078 4.7 458.4 Whittier 892 2.3 267.9 974 2.4 291.2 1,031 2.5 307.1 1,120 2.6 332.9 1,158 2.6 343.7
Metro (4) 4,909 12.6 393.2 4,937 12.4 391.8 5,043 12.4 399.6 5,603 13.0 447.2 5,844 13.3 469.4 Central 1,555 4.0 425.0 1,607 4.0 434.3 1,685 4.1 456.2 1,802 4.2 490.6 1,807 4.1 494.1 Hollywood-Wilshire 2,098 5.4 390.0 2,139 5.4 395.6 2,249 5.5 415.6 2,540 5.9 473.9 2,719 6.2 511.7 Northeast 1,256 3.2 364.6 1,191 3.0 340.8 1,109 2.7 315.4 1,261 2.9 360.8 1,318 3.0 378.7
San Fernando (2) 5,503 14.2 258.1 5,481 13.8 255.3 5,795 14.2 268.4 6,418 14.9 293.4 6,511 14.9 294.0 East Valley 1,496 3.9 330.1 1,499 3.8 327.8 1,476 3.6 322.8 1,666 3.9 359.2 1,721 3.9 366.0 Glendale 482 1.2 136.6 534 1.3 151.0 556 1.4 156.9 709 1.6 199.8 709 1.6 199.5 San Fernando 1,125 2.9 246.8 1,092 2.7 237.2 1,167 2.9 250.8 1,208 2.8 255.4 1,253 2.9 261.4 West Valley 2,400 6.2 275.6 2,356 5.9 269.2 2,596 6.4 294.3 2,835 6.6 316.4 2,828 6.5 310.9
San Gabriel (3) 4,636 11.9 270.9 4,859 12.2 282.5 4,737 11.6 274.3 4,958 11.5 286.8 5,036 11.5 290.9 Alhambra 695 1.8 194.0 649 1.6 181.2 589 1.4 163.8 628 1.5 173.7 727 1.7 200.1 El Monte 1,635 4.2 345.1 1,663 4.2 348.1 1,430 3.5 297.4 1,655 3.8 344.8 1,765 4.0 368.1 Foothill 763 2.0 243.7 705 1.8 224.3 779 1.9 247.4 828 1.9 263.4 809 1.8 257.7 Pomona 1,543 4.0 272.6 1,842 4.6 323.2 1,939 4.7 339.3 1,847 4.3 322.3 1,735 4.0 301.9
South (6) 8,914 23.0 863.8 9,664 24.3 927.7 9,635 23.6 922.1 10,126 23.6 966.4 10,354 23.6 984.9 Compton 2,277 5.9 783.2 2,448 6.2 836.1 2,432 6.0 829.9 2,672 6.2 917.7 2,676 6.1 924.6 South 2,129 5.5 1154.7 2,259 5.7 1203.4 2,262 5.5 1211.5 2,514 5.8 1322.3 2,335 5.3 1206.9 Southeast 1,247 3.2 708.3 1,362 3.4 760.0 1,342 3.3 750.8 1,263 2.9 693.6 1,393 3.2 750.7 Southwest 3,261 8.4 856.4 3,595 9.0 941.2 3,599 8.8 931.4 3,677 8.6 956.7 3,950 9.0 1031.8
South Bay (8) 4,309 11.1 389.2 4,321 10.9 388.4 4,612 11.3 412.5 4,853 11.3 433.0 5,001 11.4 445.1 Harbor 485 1.2 232.3 483 1.2 230.5 517 1.3 243.9 586 1.4 273.2 589 1.3 271.7 Inglewood 2,710 7.0 626.8 2,751 6.9 631.5 2,975 7.3 680.9 3,011 7.0 690.7 2,986 6.8 686.4 Torrance 1,114 2.9 239.0 1,087 2.7 232.7 1,120 2.7 238.8 1,256 2.9 267.0 1,426 3.3 302.3 West (5) 1,348 3.5 211.9 1,262 3.2 198.3 1,339 3.3 209.0 1,529 3.6 236.6 1,593 3.6 244.5 West 1,348 3.5 211.9 1,262 3.2 198.3 1,339 3.3 209.0 1,529 3.6 236.6 1,593 3.6 244.5
Unknown 3,117 8.0 . 2,819 7.1 . 2,783 6.8 . 2,272 5.3 . 1,889 4.3 .
Total 38,822 405.2 39,804 412.7 40,824 421.3 42,994 441.9 43,805 448.5
1. Excludes cases from Pasadena (SPA 3) and Long Beach (SPA 8).2. Main categories.3. Subcategories.Note: Cumulative percentages may not equal 100% because of rounding.
Table 2.4. Reported Chlamydia Cases and Rates per 100,000 Population by Service Planning Area (SPA)1
and Health District (HD), Los Angeles County, 2005-2009
2005 2006 2007 2008 2009

Sexually Transmitted Disease Surveillance Report - 2009 (Volume I) 27
0 8 164 Miles
Figure 2.6 Reported Chlamydia Rates per 100,000 Population by Service Planning Area (SPA), Los Angeles County, 2009.
Excludes cases from Pasadena (SPA 3) and Long Beach (SPA 8).
Antelope Valley (SPA 1)535.3
East (SPA 7)405.6
Metro (SPA 4)469.4
San Fernando (SPA 2)294.0
San Gabriel (SPA 3)290.9
South (SPA 6)984.9
South Bay (SPA 8)445.1
West (SPA 5)244.5

Sexually Transmitted Disease Morbidity Report, 2009
Section III: Gonorrhea
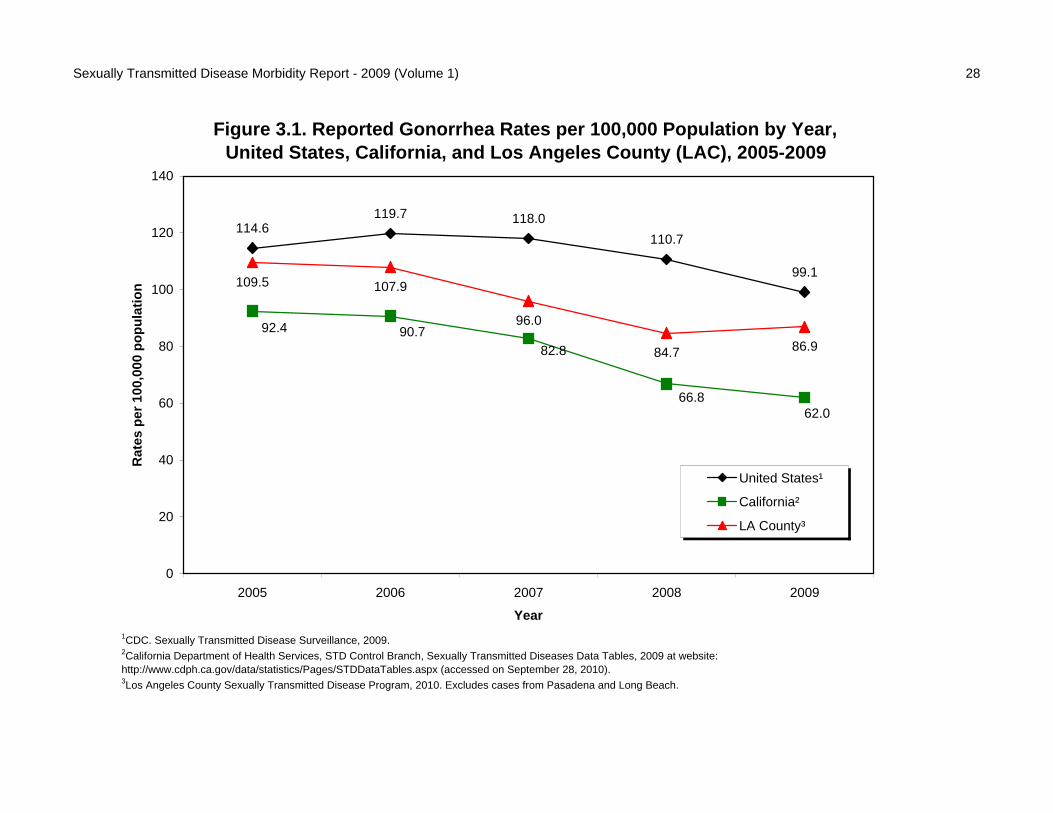
Sexually Transmitted Disease Morbidity Report - 2009 (Volume 1) 28
Figure 3.1. Reported Gonorrhea Rates per 100,000 Population by Year, United States, California, and Los Angeles County (LAC), 2005-2009
99.1
114.6119.7 118.0
110.7
62.066.8
82.890.792.4
86.984.7
96.0
107.9109.5
0
20
40
60
80
100
120
140
2005 2006 2007 2008 2009
Year
Rat
es p
er 1
00,0
00 p
op
ula
tio
n
United States¹
California²
LA County³
1CDC. Sexually Transmitted Disease Surveillance, 2009.2California Department of Health Services, STD Control Branch, Sexually Transmitted Diseases Data Tables, 2009 at website: http://www.cdph.ca.gov/data/statistics/Pages/STDDataTables.aspx (accessed on September 28, 2010). 3Los Angeles County Sexually Transmitted Disease Program, 2010. Excludes cases from Pasadena and Long Beach.
Sexually Transmitted Disease Morbidity Report - 2009 (Volume 1) 29
No. (%) Rate No. (%) Rate No. (%) Rate No. (%) Rate No. (%) Rate
0-14 112 1.1 5.1 107 1.0 4.9 89 1.0 4.1 86 1.1 4.1 47 0.6 2.3
15-19 2,347 22.4 334.9 2,322 22.3 328.3 2,255 24.2 308.0 1,818 22.2 242.6 1,684 19.8 220.0
20-24 2,866 27.3 426.8 2,853 27.4 421.8 2,655 28.5 378.2 2,399 29.3 339.0 2,412 28.4 338.0
25-29 1,810 17.2 266.1 1,839 17.7 273.5 1,668 17.9 249.0 1,460 17.8 217.4 1,714 20.2 254.5
30-34 1,120 10.7 149.4 1,087 10.5 147.9 941 10.1 132.4 803 9.8 115.6 906 10.7 133.1
35-44 1,550 14.8 102.8 1,480 14.2 98.3 1,134 12.2 75.6 1,068 13.0 71.6 1,108 13.1 74.5
45-54 528 5.0 41.5 546 5.2 42.0 425 4.6 32.2 433 5.3 32.2 493 5.8 36.0
55-64 86 0.8 10.3 82 0.8 9.4 89 1.0 10.0 89 1.1 9.7 85 1.0 8.9
65+ 23 0.2 2.4 30 0.3 3.1 18 0.2 1.8 11 0.1 1.1 25 0.3 2.4
Unknown 51 0.5 . 55 0.5 . 27 0.3 . 18 0.2 . 16 0.2 .
Total 10,493 109.5 10,401 107.8 9,301 96.0 8,185 84.1 8,490 86.9
Note: Cumulative percentages may not equal 100% because of rounding. Excludes cases from Pasadena and Long Beach.
2008
Table 3.1. Reported Gonorrhea Cases and Rates per 100,000 Population by Age Group, Los Angeles County, 2005-2009
200720062005 2009
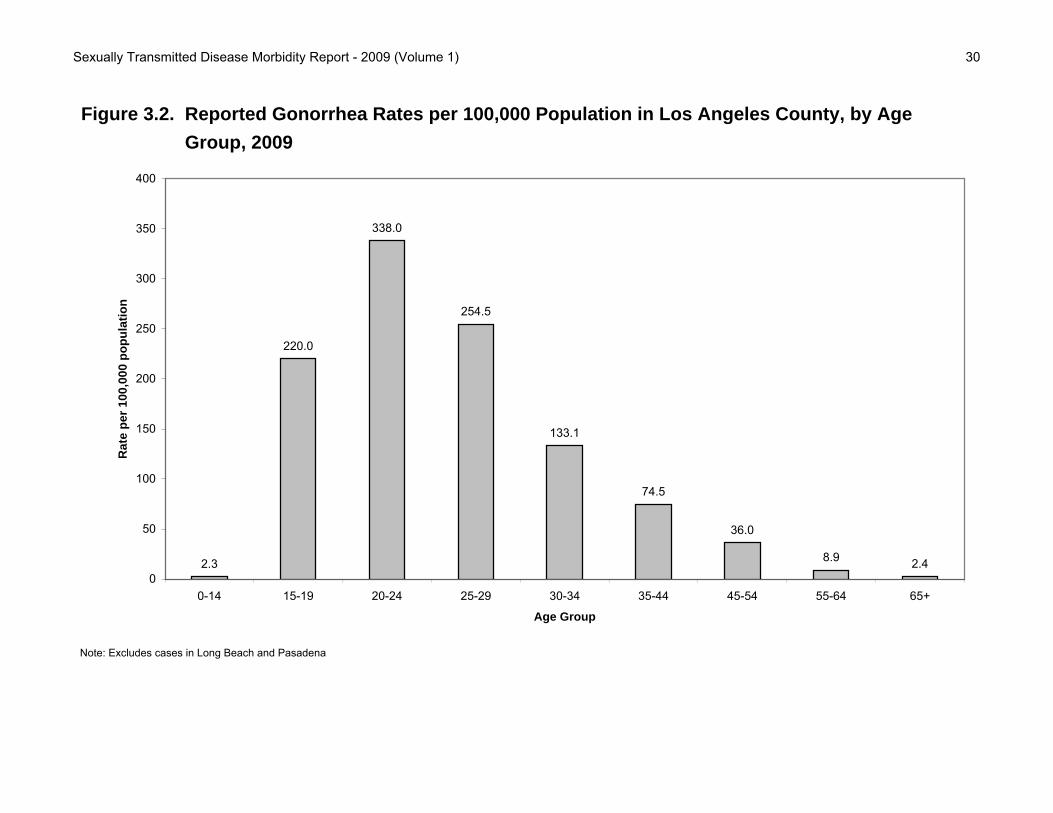
Sexually Transmitted Disease Morbidity Report - 2009 (Volume 1) 30
2.3
220.0
338.0
254.5
133.1
74.5
36.0
8.9 2.40
50
100
150
200
250
300
350
400
0-14 15-19 20-24 25-29 30-34 35-44 45-54 55-64 65+
Age Group
Ra
te p
er
10
0,0
00
po
pu
lati
on
Figure 3.2. Reported Gonorrhea Rates per 100,000 Population in Los Angeles County, by Age
Group, 2009
Note: Excludes cases in Long Beach and Pasadena

Sexually Transmitted Disease Morbidity Report - 2009 (Volume 1) 31
No. (%) Rate No. (%) Rate No. (%) Rate No. (%) Rate No. (%) Rate
MALE
0-14 25 0.4 2.2 29 0.5 2.6 22 0.4 2.0 17 0.4 1.6 10 0.2 0.915-19 771 13.4 216.4 725 13.1 201.7 742 14.8 199.1 650 14.2 170.6 675 12.9 173.520-24 1,326 23.1 384.3 1,310 23.8 379.5 1,319 26.2 365.3 1,249 27.2 344.5 1,317 25.1 361.625-29 1,072 18.7 307.1 1,069 19.4 307.9 1,002 19.9 288.6 881 19.2 252.1 1,169 22.3 332.230-34 794 13.8 208.4 712 12.9 190.7 629 12.5 173.9 527 11.5 148.7 672 12.8 193.135-44 1,194 20.8 156.1 1,115 20.2 145.7 862 17.1 113.3 812 17.7 107.4 899 17.1 119.345-54 429 7.5 69.0 437 7.9 68.5 350 7.0 53.8 363 7.9 54.6 416 7.9 61.355-64 72 1.3 18.3 63 1.1 15.4 73 1.5 17.4 73 1.6 16.7 65 1.2 14.465+ 21 0.4 5.2 24 0.4 5.9 18 0.4 4.2 7 0.2 1.6 22 0.4 4.9Unknown 32 0.6 . 31 0.6 . 12 0.2 . 11 0.2 . 7 0.1 .
Subtotal 5,736 54.8 121.0 5,515 53.2 115.6 5,029 54.2 104.8 4,590 56.6 95.2 5,252 62.2 108.4
FEMALE
0-14 87 1.8 8.1 78 1.6 7.3 66 1.6 6.3 69 2.0 6.7 37 1.2 3.715-19 1,574 33.2 456.9 1,591 32.8 457.6 1,509 35.5 419.7 1,163 33.0 315.8 1,005 31.5 266.920-24 1,535 32.4 470.2 1,537 31.7 464.0 1,332 31.3 390.6 1,131 32.1 327.7 1,088 34.1 311.425-29 736 15.5 222.3 763 15.7 234.6 664 15.6 205.8 566 16.1 175.8 528 16.5 164.230-34 323 6.8 87.6 372 7.7 102.9 307 7.2 88.0 263 7.5 77.3 226 7.1 68.035-44 352 7.4 47.4 360 7.4 48.6 269 6.3 36.4 244 6.9 33.2 204 6.4 27.845-54 98 2.1 15.1 105 2.2 15.9 75 1.8 11.2 65 1.8 9.6 76 2.4 11.055-64 14 0.3 3.2 18 0.4 3.9 15 0.4 3.2 14 0.4 2.9 20 0.6 4.065+ 2 0.0 0.4 5 0.1 0.9 0 0.0 0.0 4 0.1 0.7 3 0.1 0.5Unknown 14 0.3 . 17 0.4 . 14 0.3 . 6 0.2 . 4 0.1 .
Subtotal 4,735 45.2 97.8 4,846 46.8 99.5 4,251 45.8 86.9 3,525 43.4 71.8 3,191 37.8 64.8
Total1,2 10,493 109.5 10,401 107.8 9,301 96.0 8,185 84.1 8,490 86.9
1. Includes cases reported as "Unknown" gender and age.2. Includes cases reported as "Unknown/Other/Ambiguous Genitalia" gender and known age.Note: Cumulative percentages may not equal 100% because of rounding. Excludes cases from Pasadena and Long Beach. Includes Transgender cases.
Table 3.2. Reported Gonorrhea Cases and Rates per 100,000 Population by Gender and Age Group, Los Angeles County, 2005-2009
2005 2006 2007 2008 2009
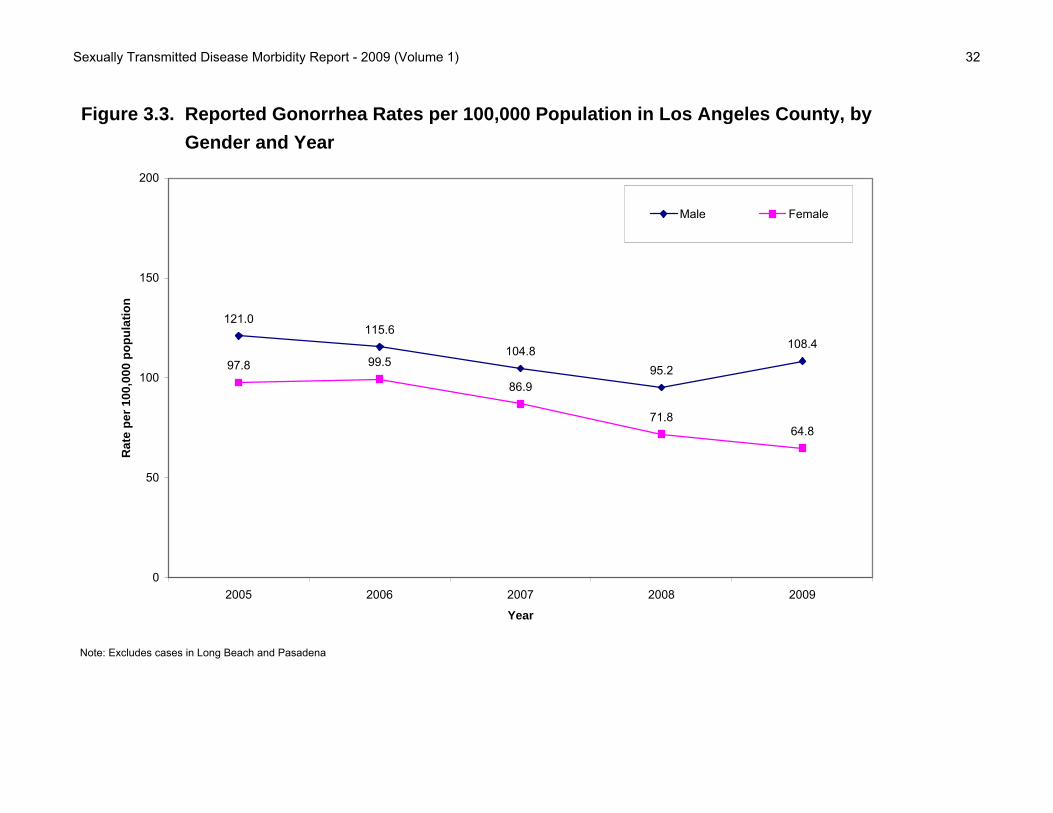
Sexually Transmitted Disease Morbidity Report - 2009 (Volume 1) 32
121.0115.6
104.895.2
108.4
97.8 99.5
86.9
71.864.8
0
50
100
150
200
2005 2006 2007 2008 2009
Year
Ra
te p
er
10
0,0
00
po
pu
lati
on
Male Female
Figure 3.3. Reported Gonorrhea Rates per 100,000 Population in Los Angeles County, by
Gender and Year
Note: Excludes cases in Long Beach and Pasadena

Sexually Transmitted Disease Morbidity Report - 2009 (Volume 1) 33
0.9
173.5
361.6
332.2
193.1
119.3
61.3
14.4
4.9
0100200300400500
0-14
15-19
20-24
25-29
30-34
35-44
45-54
55-64
65+
3.7
266.9
311.4
164.2
68.0
27.8
11.0
4.0
0.5
0 50 100 150 200 250 300 350
0-14
15-19
20-24
25-29
30-34
35-44
45-54
55-64
65+
Figure 3.4. Reported Gonorrhea Rates per 100,000 Population in Los Angeles County, by Gender and Age Group, 2009
Note: Excludes cases in Long Beach and Pasadena
Male Rate per 100,000 population Female Age

Sexually Transmitted Disease Morbidity Report - 2009 (Volume 1) 34
Adj. Adj. Adj. Adj. Adj. Adj.No. (%) Rate No. (%) Rate No. (%) Rate No. (%) Rate No. (%) Rate No. (%) Rate
MALE
2005 957 16.7 80.0 2,222 38.7 677.1 1,282 22.4 67.2 85 1.5 17.0 31 0.5 5,736 54.8 121.02006 857 15.5 71.9 2,272 41.2 694.7 1,182 21.4 60.7 91 1.7 18.0 25 0.5 5,515 53.2 115.62007 871 17.3 70.6 1,988 39.5 584.4 1,204 23.9 60.0 97 1.9 18.5 33 0.7 5,029 54.2 104.82008 871 19.0 70.0 1,792 39.0 524.2 1,033 22.5 51.1 118 2.6 22.3 33 0.7 4,590 56.6 95.22009 1,110 21.1 86.8 1,914 36.4 547.1 1,318 25.1 63.4 146 2.8 26.8 49 0.9 5,252 62.2 108.4
FEMALE
2005 523 11.1 41.7 2,144 45.3 549.2 1,136 24.0 58.7 122 2.6 21.6 29 0.6 4,735 45.2 97.82006 500 10.3 39.8 2,209 45.6 563.6 1,231 25.4 62.0 138 2.9 23.9 27 0.6 4,846 46.8 99.52007 445 10.5 34.8 2,116 49.8 529.5 990 23.3 49.2 90 2.1 15.2 23 0.5 4,251 45.8 86.92008 364 10.3 28.3 1,788 50.7 446.1 774 22.0 38.1 108 3.1 18.1 19 0.5 3,525 43.4 71.82009 383 12.0 29.4 1,626 51.0 401.8 657 20.6 31.9 100 3.1 16.5 37 1.2 3,191 37.8 64.8
1. Includes data for ethnicity reported as "Other," "Native American," and "Mixed."
Note: If race/ethnicity was not specified, cases were prorated according to the distribution of cases for which race/ethnicity was specified. Rates were adjusted including the prorated cases. Therefore, these tables should be used only for race/ethnicity comparisons, not for overall totals or gender totals. Cumulative percentages may not equal 100% because of
2. Excludes cases reported with "Unknown/Other/Ambiguous Genitalia" gender. 3. Includes cases reported as "Unknown" race/ethnicity.
rounding. Cases from Pasadena and Long Beach were not included. Transgender cases were included.
Table 3.3. Reported Gonorrhea Cases and Rates per 100,000 Population by Gender and Race/Ethnicity, Los Angeles County, 2005-2009
White Black Hispanic Asian-Pacific Other1 Total2,3

Sexually Transmitted Disease Morbidity Report - 2009 (Volume 1) 35
86.8
547.1
63.4
26.829.4
401.8
31.916.5
0
100
200
300
400
500
600
White Black Hispanic Asian-Pacific
Ra
te p
er
10
0,0
00
po
pu
lati
on
Male Female
Figure 3.5. Reported Gonnorhea Rates per 100,000 Population in Los Angeles County, by
Gender and Race/Ethnicity, 2009
Note: Adjusted for unknown race. Excludes cases in Long Beach and Pasadena

Sexually Transmitted Disease Morbidity Report - 2009 (Volume 1) 36
No. (%) Rate No. (%) Rate No. (%) Rate No. (%) Rate No. (%) Rate
SPA2/HD3
Antelope Valley (1) 408 3.9 119.7 330 3.2 94.9 376 4.0 104.9 283 3.5 77.9 324 3.8 88.0 Antelope Valley 408 3.9 119.7 330 3.2 94.9 376 4.0 104.9 283 3.5 77.9 324 3.8 88.0
East (7) 724 6.9 52.8 747 7.2 54.1 711 7.6 51.5 588 7.2 42.6 547 6.4 39.6 Bellflower 246 2.3 66.7 207 2.0 56.0 247 2.7 66.8 194 2.4 52.4 151 1.8 40.8 East Los Angeles 95 0.9 42.8 96 0.9 42.7 85 0.9 38.2 77 0.9 34.7 71 0.8 32.0 San Antonio 243 2.3 54.1 247 2.4 54.8 239 2.6 52.9 215 2.6 47.5 232 2.7 51.2 Whittier 140 1.3 42.0 197 1.9 58.9 140 1.5 41.7 102 1.2 30.3 93 1.1 27.6
Metro (4) 1,735 16.5 139.0 1,673 16.1 132.8 1,633 17.6 129.4 1,438 17.6 114.8 1,936 22.8 155.5 Central 456 4.3 124.6 476 4.6 128.6 410 4.4 111.0 345 4.2 93.9 468 5.5 128.0 Hollywood-Wilshire 1,108 10.6 206.0 1,008 9.7 186.4 1,014 10.9 187.4 928 11.3 173.2 1,288 15.2 242.4 Northeast 171 1.6 49.6 189 1.8 54.1 209 2.2 59.4 165 2.0 47.2 180 2.1 51.7
San Fernando (2) 1,126 10.7 52.8 983 9.5 45.8 985 10.6 45.6 934 11.4 42.7 1,012 11.9 45.7 East Valley 318 3.0 70.2 276 2.7 60.4 286 3.1 62.5 247 3.0 53.3 303 3.6 64.4 Glendale 118 1.1 33.5 120 1.2 33.9 137 1.5 38.7 111 1.4 31.3 159 1.9 44.7 San Fernando 198 1.9 43.4 144 1.4 31.3 151 1.6 32.4 165 2.0 34.9 160 1.9 33.4 West Valley 492 4.7 56.5 443 4.3 50.6 411 4.4 46.6 411 5.0 45.9 390 4.6 42.9
San Gabriel (3) 791 7.5 46.2 782 7.5 45.5 680 7.3 39.4 574 7.0 33.2 527 6.2 30.4 Alhambra 114 1.1 31.8 87 0.8 24.3 103 1.1 28.6 97 1.2 26.8 85 1.0 23.4 El Monte 213 2.0 45.0 201 1.9 42.1 166 1.8 34.5 152 1.9 31.7 136 1.6 28.4 Foothill 165 1.6 52.7 139 1.3 44.2 138 1.5 43.8 97 1.2 30.9 108 1.3 34.4 Pomona 299 2.8 52.8 355 3.4 62.3 273 2.9 47.8 228 2.8 39.8 198 2.3 34.5
South (6) 3,020 28.8 292.7 3,209 30.9 308.1 2,822 30.3 270.1 2,602 31.8 248.3 2,288 26.9 217.6 Compton 696 6.6 239.4 715 6.9 244.2 679 7.3 231.7 585 7.1 200.9 479 5.6 165.5 South 761 7.3 412.7 829 8.0 441.6 730 7.8 391.0 646 7.9 339.8 539 6.3 278.6 Southeast 290 2.8 164.7 329 3.2 183.6 276 3.0 154.4 263 3.2 144.4 248 2.9 133.7 Southwest 1,273 12.1 334.3 1,336 12.8 349.8 1,137 12.2 294.2 1,108 13.5 288.3 1,022 12.0 267.0
South Bay (8) 1,281 12.2 115.7 1,351 13.0 121.5 1,161 12.5 103.8 945 11.5 84.3 976 11.5 86.9 Harbor 92 0.9 44.1 115 1.1 54.9 74 0.8 34.9 73 0.9 34.0 84 1.0 38.7 Inglewood 930 8.9 215.1 955 9.2 219.2 865 9.3 198.0 694 8.5 159.2 663 7.8 152.4 Torrance 259 2.5 55.6 281 2.7 60.1 222 2.4 47.3 178 2.2 37.8 229 2.7 48.5 West (5) 408 3.9 64.1 442 4.2 69.5 408 4.4 63.7 368 4.5 57.0 381 4.5 58.5 West 408 3.9 64.1 442 4.2 69.5 408 4.4 63.7 368 4.5 57.0 381 4.5 58.5
Unknown 1,000 9.5 . 884 8.5 . 525 5.6 . 453 5.5 . 499 5.9 .
Total 10,493 109.5 10,401 107.8 9,301 96.0 8,185 84.1 8,490 86.9
1. Excludes cases from Pasadena (SPA 3) and Long Beach (SPA 8).2. Main categories.3. Subcategories.Note: Cumulative percentages may not equal 100% because of rounding.
Table 3.4. Reported Gonorrhea Cases and Rates per 100,000 Population by Service Planning Area (SPA)1
and Health District (HD), Los Angeles County, 2005-2009
2005 2006 2007 2008 2009

Sexually Transmitted Disease Surveillance Report - 2009 (Volume I) 37
0 8 164 Miles
Figure 3.6 Reported Gonorrhea Rates per 100,000 Population by Service Planning Area (SPA), Los Angeles County, 2009.
Excludes cases from Pasadena (SPA 3) and Long Beach (SPA 8).
Antelope Valley (SPA 1)88.0
East (SPA 7)39.6
Metro (SPA 4)155.5
San Fernando (SPA 2)45.7
San Gabriel (SPA 3)30.4
South (SPA 6)217.6
South Bay (SPA 8)86.9
West (SPA 5)58.5
Sexually Transmitted Disease Morbidity Report, 2009
Section IV: Primary and Secondary Syphilis
Sexually Transmitted Disease Morbidity Report - 2009 (Volume 1) 38
Figure 4.1. Reported Primary and Secondary Syphilis Rates per 100,000 Population by Year, United States, California, and Los Angeles County (LAC),
2005-2009
2.93.3
3.8
4.44.6
5.25.75.5
5.0
4.4
7.27.3
8.7
8.1
6.9
0
1
2
3
4
5
6
7
8
9
10
2005 2006 2007 2008 2009Year
Rat
es p
er 1
00,0
00 p
op
ula
tio
n
United States¹
California²
LA County³
1CDC. Sexually Transmitted Disease Surveillance, 2009.2California Department of Health Services, STD Control Branch, Sexually Transmitted Diseases Data Tables, 2009 at website: http://www.cdph.ca.gov/data/statistics/Pages/STDDataTables.aspx (accessed on September 28, 2010). 3Los Angeles County Sexually Transmitted Disease Program, 2010. Excludes cases from Pasadena and Long Beach.

Sexually Transmitted Disease Morbidity Report - 2009 (Volume 1) 39
No. (%) Rate No. (%) Rate No. (%) Rate No. (%) Rate No. (%) Rate
0-14 0 0.0 0.0 0 0.0 0.0 0 0.0 0.0 0 0.0 0.0 1 0.1 0.0
15-19 11 1.7 1.6 20 2.6 2.8 21 2.5 2.9 29 4.1 3.9 17 2.4 2.2
20-24 63 9.6 9.4 68 8.7 10.1 114 13.6 16.2 113 16.0 16.0 108 15.3 15.1
25-29 83 12.7 12.2 114 14.5 17.0 133 15.9 19.9 120 16.9 17.9 136 19.3 20.2
30-34 114 17.4 15.2 93 11.9 12.7 120 14.3 16.9 110 15.5 15.8 95 13.5 14.0
35-44 249 38.0 16.5 323 41.2 21.4 272 32.5 18.1 220 31.1 14.7 191 27.1 12.8
45-54 102 15.5 8.0 130 16.6 10.0 138 16.5 10.5 100 14.1 7.4 117 16.6 8.5
55-64 28 4.3 3.4 26 3.3 3.0 32 3.8 3.6 14 2.0 1.5 31 4.4 3.3
65+ 6 0.9 0.6 7 0.9 0.7 6 0.7 0.6 2 0.3 0.2 7 1.0 0.7
Unknown 3 0.4 . 1 0.1 . 1 0.1 .
Total 656 6.8 784 8.1 837 8.6 708 7.3 704 7.2
Note: Cumulative percentages may not equal 100% because of rounding. Excludes cases from Pasadena and Long Beach.
2008
Table 4.1. Reported Primary and Secondary Syphilis Cases and Rates per 100,000 Population by Age Group, Los Angeles County, 2005-2009
200720062005 2009
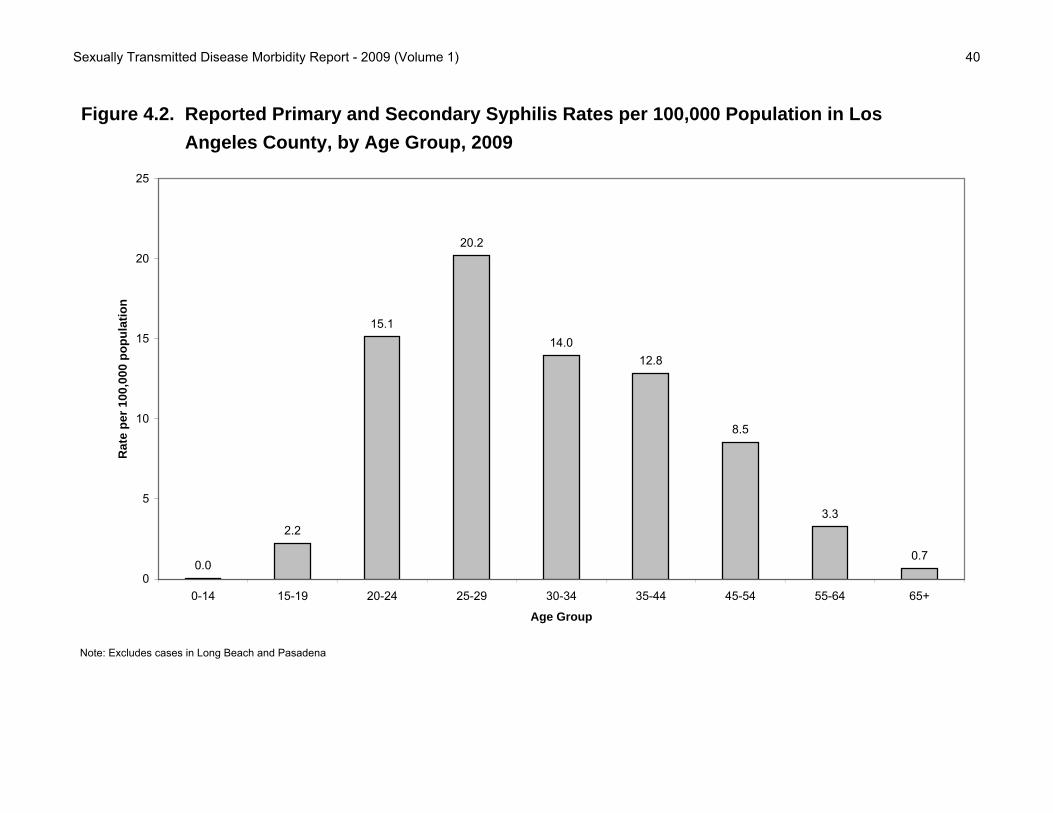
Sexually Transmitted Disease Morbidity Report - 2009 (Volume 1) 40
0.0
2.2
15.1
20.2
14.012.8
8.5
3.3
0.7
0
5
10
15
20
25
0-14 15-19 20-24 25-29 30-34 35-44 45-54 55-64 65+
Age Group
Ra
te p
er
10
0,0
00
po
pu
lati
on
Figure 4.2. Reported Primary and Secondary Syphilis Rates per 100,000 Population in Los
Angeles County, by Age Group, 2009
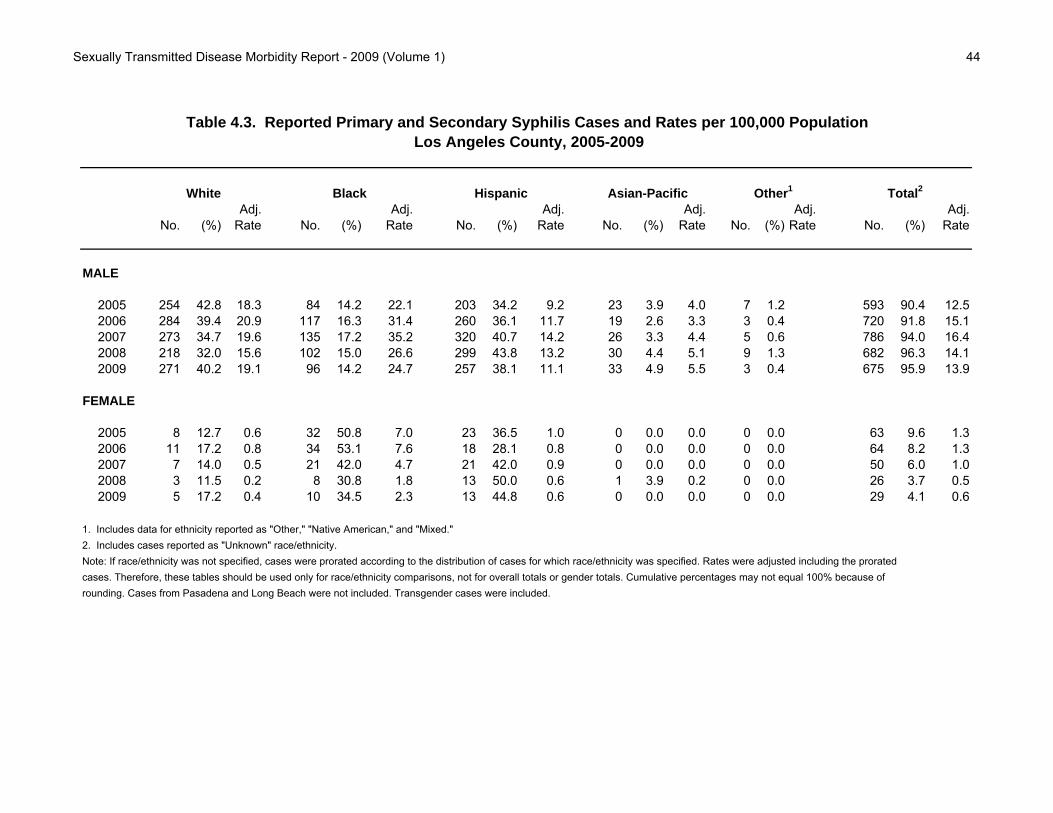
Note: Excludes cases in Long Beach and Pasadena
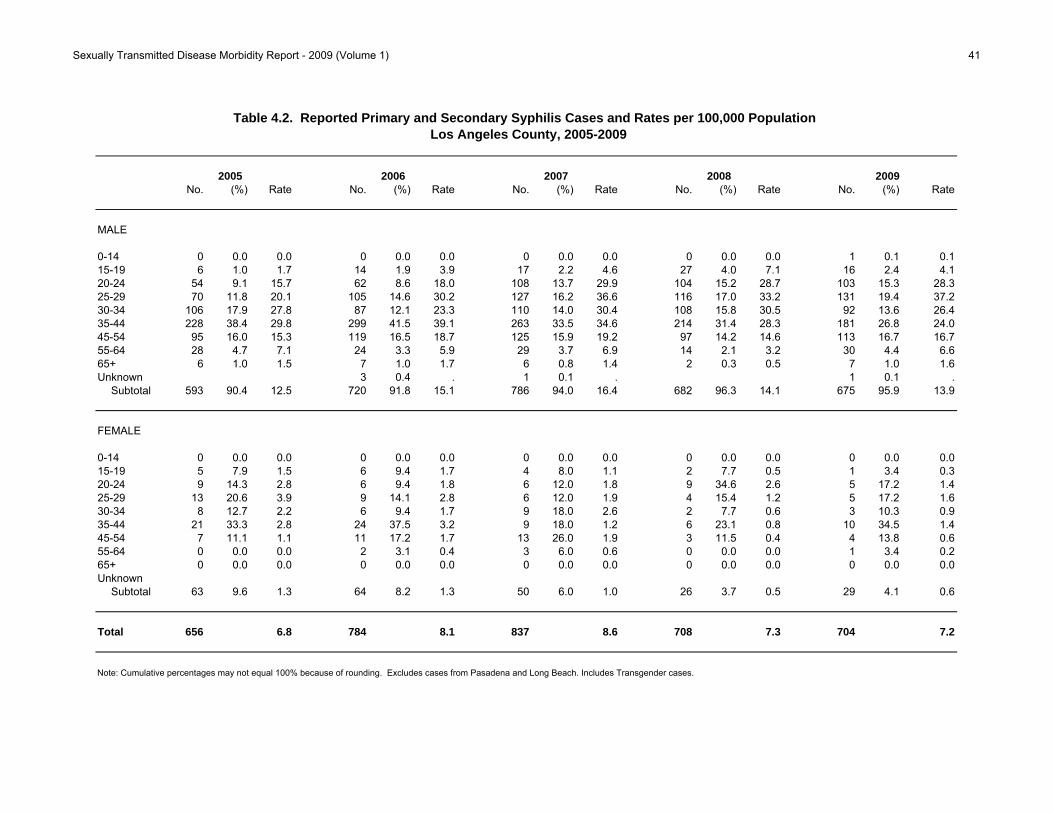
Sexually Transmitted Disease Morbidity Report - 2009 (Volume 1) 41
No. (%) Rate No. (%) Rate No. (%) Rate No. (%) Rate No. (%) Rate
MALE
0-14 0 0.0 0.0 0 0.0 0.0 0 0.0 0.0 0 0.0 0.0 1 0.1 0.115-19 6 1.0 1.7 14 1.9 3.9 17 2.2 4.6 27 4.0 7.1 16 2.4 4.120-24 54 9.1 15.7 62 8.6 18.0 108 13.7 29.9 104 15.2 28.7 103 15.3 28.325-29 70 11.8 20.1 105 14.6 30.2 127 16.2 36.6 116 17.0 33.2 131 19.4 37.230-34 106 17.9 27.8 87 12.1 23.3 110 14.0 30.4 108 15.8 30.5 92 13.6 26.435-44 228 38.4 29.8 299 41.5 39.1 263 33.5 34.6 214 31.4 28.3 181 26.8 24.045-54 95 16.0 15.3 119 16.5 18.7 125 15.9 19.2 97 14.2 14.6 113 16.7 16.755-64 28 4.7 7.1 24 3.3 5.9 29 3.7 6.9 14 2.1 3.2 30 4.4 6.665+ 6 1.0 1.5 7 1.0 1.7 6 0.8 1.4 2 0.3 0.5 7 1.0 1.6Unknown 3 0.4 . 1 0.1 . 1 0.1 .
Subtotal 593 90.4 12.5 720 91.8 15.1 786 94.0 16.4 682 96.3 14.1 675 95.9 13.9
FEMALE
0-14 0 0.0 0.0 0 0.0 0.0 0 0.0 0.0 0 0.0 0.0 0 0.0 0.015-19 5 7.9 1.5 6 9.4 1.7 4 8.0 1.1 2 7.7 0.5 1 3.4 0.320-24 9 14.3 2.8 6 9.4 1.8 6 12.0 1.8 9 34.6 2.6 5 17.2 1.425-29 13 20.6 3.9 9 14.1 2.8 6 12.0 1.9 4 15.4 1.2 5 17.2 1.630-34 8 12.7 2.2 6 9.4 1.7 9 18.0 2.6 2 7.7 0.6 3 10.3 0.935-44 21 33.3 2.8 24 37.5 3.2 9 18.0 1.2 6 23.1 0.8 10 34.5 1.445-54 7 11.1 1.1 11 17.2 1.7 13 26.0 1.9 3 11.5 0.4 4 13.8 0.655-64 0 0.0 0.0 2 3.1 0.4 3 6.0 0.6 0 0.0 0.0 1 3.4 0.265+ 0 0.0 0.0 0 0.0 0.0 0 0.0 0.0 0 0.0 0.0 0 0.0 0.0Unknown
Subtotal 63 9.6 1.3 64 8.2 1.3 50 6.0 1.0 26 3.7 0.5 29 4.1 0.6
Total 656 6.8 784 8.1 837 8.6 708 7.3 704 7.2
Note: Cumulative percentages may not equal 100% because of rounding. Excludes cases from Pasadena and Long Beach. Includes Transgender cases.
Table 4.2. Reported Primary and Secondary Syphilis Cases and Rates per 100,000 Population Los Angeles County, 2005-2009
2005 2006 2007 2008 2009
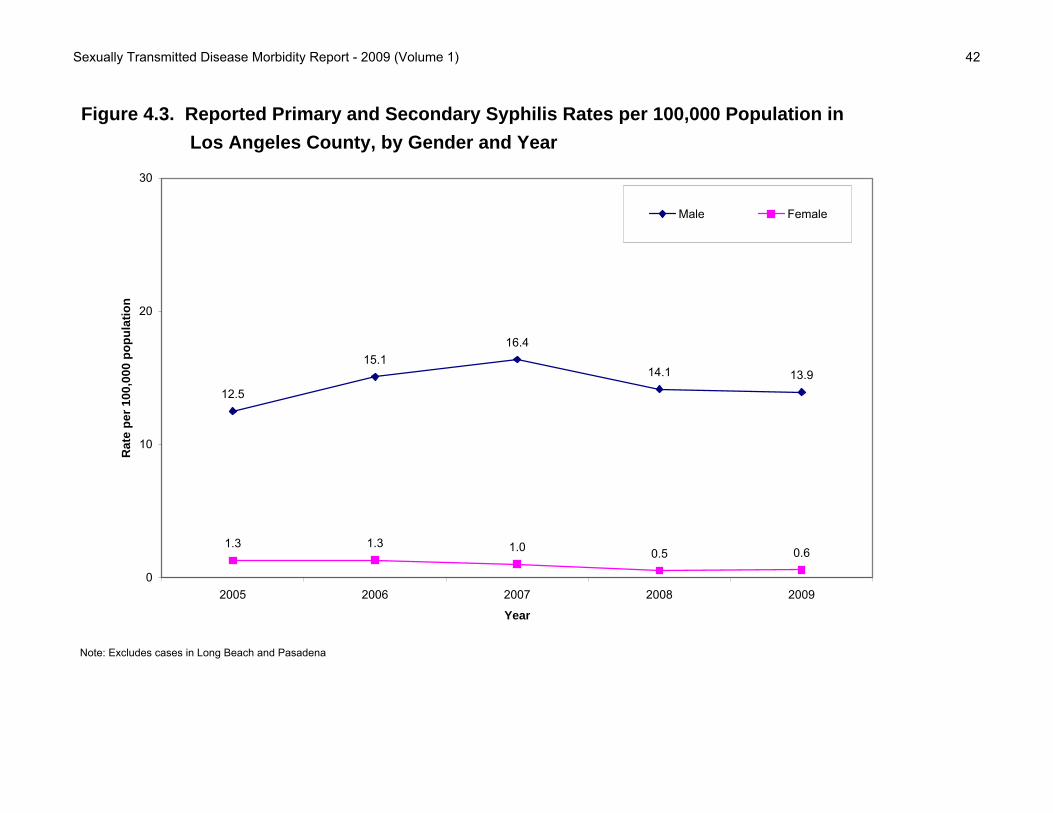
Sexually Transmitted Disease Morbidity Report - 2009 (Volume 1) 42
12.5
15.116.4
14.1 13.9
1.3 1.3 1.0 0.5 0.6
0
10
20
30
2005 2006 2007 2008 2009
Year
Ra
te p
er
10
0,0
00
po
pu
lati
on
Male Female
Figure 4.3. Reported Primary and Secondary Syphilis Rates per 100,000 Population in
Los Angeles County, by Gender and Year
Note: Excludes cases in Long Beach and Pasadena

Sexually Transmitted Disease Morbidity Report - 2009 (Volume 1) 43
0.1
4.1
28.3
37.2
26.4
24.0
16.7
6.6
1.6
0510152025303540
0-14
15-19
20-24
25-29
30-34
35-44
45-54
55-64
65+
0.0
0.3
1.4
1.6
0.9
1.4
0.6
0.2
0.0
0 5 10 15 20 25 30 35 40
0-14
15-19
20-24
25-29
30-34
35-44
45-54
55-64
65+
Figure 4.4. Reported Primary and Secondary Syphilis Rates per 100,000 Population in Los Angeles County, by Gender and Age Group, 2009
Note: Excludes cases in Long Beach and Pasadena
Male Rate per 100,000 population Female Age
Sexually Transmitted Disease Morbidity Report - 2009 (Volume 1) 44
Adj. Adj. Adj. Adj. Adj. Adj.No. (%) Rate No. (%) Rate No. (%) Rate No. (%) Rate No. (%) Rate No. (%) Rate
MALE
2005 254 42.8 18.3 84 14.2 22.1 203 34.2 9.2 23 3.9 4.0 7 1.2 593 90.4 12.52006 284 39.4 20.9 117 16.3 31.4 260 36.1 11.7 19 2.6 3.3 3 0.4 720 91.8 15.12007 273 34.7 19.6 135 17.2 35.2 320 40.7 14.2 26 3.3 4.4 5 0.6 786 94.0 16.42008 218 32.0 15.6 102 15.0 26.6 299 43.8 13.2 30 4.4 5.1 9 1.3 682 96.3 14.12009 271 40.2 19.1 96 14.2 24.7 257 38.1 11.1 33 4.9 5.5 3 0.4 675 95.9 13.9
FEMALE
2005 8 12.7 0.6 32 50.8 7.0 23 36.5 1.0 0 0.0 0.0 0 0.0 63 9.6 1.32006 11 17.2 0.8 34 53.1 7.6 18 28.1 0.8 0 0.0 0.0 0 0.0 64 8.2 1.32007 7 14.0 0.5 21 42.0 4.7 21 42.0 0.9 0 0.0 0.0 0 0.0 50 6.0 1.02008 3 11.5 0.2 8 30.8 1.8 13 50.0 0.6 1 3.9 0.2 0 0.0 26 3.7 0.52009 5 17.2 0.4 10 34.5 2.3 13 44.8 0.6 0 0.0 0.0 0 0.0 29 4.1 0.6
1. Includes data for ethnicity reported as "Other," "Native American," and "Mixed."
Note: If race/ethnicity was not specified, cases were prorated according to the distribution of cases for which race/ethnicity was specified. Rates were adjusted including the prorated cases. Therefore, these tables should be used only for race/ethnicity comparisons, not for overall totals or gender totals. Cumulative percentages may not equal 100% because of rounding. Cases from Pasadena and Long Beach were not included. Transgender cases were included.
Total2
2. Includes cases reported as "Unknown" race/ethnicity.
Table 4.3. Reported Primary and Secondary Syphilis Cases and Rates per 100,000 Population Los Angeles County, 2005-2009
White Black Hispanic Asian-Pacific Other1

Sexually Transmitted Disease Morbidity Report - 2009 (Volume 1) 45
19.1
24.7
11.1
5.5
0.4
2.3
0.6 0.00
5
10
15
20
25
30
White Black Hispanic Asian-Pacific
Ra
te p
er
10
0,0
00
po
pu
lati
on
Male Female
Figure 4.5. Reported Primary and Secondary Syphilis Rates per 100,000 Population in
Los Angeles County, by Gender and Race/Ethnicity, 2009
Note: Adjusted for unknown race. Excludes cases in Long Beach and Pasadena

Sexually Transmitted Disease Morbidity Report - 2009 (Volume 1) 46
No. (%) Rate No. (%) Rate No. (%) Rate No. (%) Rate No. (%) Rate
SPA2/HD3
Antelope Valley (1) 7 1.1 2.1 8 1.0 2.3 9 1.1 2.5 0 0.0 0.0 5 0.7 1.4 Antelope Valley 7 1.1 2.1 8 1.0 2.3 9 1.1 2.5 5 0.7 1.4
0 0.00 0.0East (7) 45 6.9 3.3 46 5.9 3.3 75 9.0 5.4 63 8.9 4.6 61 8.7 4.4 Bellflower 7 1.1 1.9 9 1.1 2.4 23 2.7 6.2 21 3.0 5.7 18 2.6 4.9 East Los Angeles 7 1.1 3.2 10 1.3 4.4 9 1.1 4.0 6 0.8 2.7 13 1.8 5.9 San Antonio 23 3.5 5.1 20 2.6 4.4 24 2.9 5.3 18 2.5 4.0 14 2.0 3.1 Whittier 8 1.2 2.4 7 0.9 2.1 19 2.3 5.7 18 2.5 5.4 16 2.3 4.7
Metro (4) 307 46.8 24.6 347 44.3 27.5 372 44.4 29.5 289 40.8 23.1 294 41.8 23.6 Central 72 11.0 19.7 102 13.0 27.6 102 12.2 27.6 70 9.9 19.1 64 9.1 17.5 Hollywood-Wilshire 213 32.5 39.6 216 27.6 39.9 231 27.6 42.7 196 27.7 36.6 203 28.8 38.2 Northeast 22 3.4 6.4 29 3.7 8.3 39 4.7 11.1 23 3.2 6.6 27 3.8 7.8
San Fernando (2) 96 14.6 4.5 117 14.9 5.5 132 15.8 6.1 120 16.9 5.5 114 16.2 5.1 East Valley 42 6.4 9.3 45 5.7 9.8 48 5.7 10.5 41 5.8 8.8 34 4.8 7.2 Glendale 18 2.7 5.1 16 2.0 4.5 18 2.2 5.1 19 2.7 5.4 17 2.4 4.8 San Fernando 4 0.6 0.9 7 0.9 1.5 19 2.3 4.1 22 3.1 4.7 12 1.7 2.5 West Valley 32 4.9 3.7 49 6.3 5.6 47 5.6 5.3 38 5.4 4.2 51 7.2 5.6
San Gabriel (3) 28 4.3 1.6 42 5.4 2.4 41 4.9 2.4 62 8.8 3.6 53 7.5 3.1 Alhambra 9 1.4 2.5 8 1.0 2.2 6 0.7 1.7 8 1.1 2.2 14 2.0 3.9 El Monte 6 0.9 1.3 14 1.8 2.9 10 1.2 2.1 20 2.8 4.2 16 2.3 3.3 Foothill 5 0.8 1.6 7 0.9 2.2 8 1.0 2.5 13 1.8 4.1 8 1.1 2.5 Pomona 8 1.2 1.4 13 1.7 2.3 17 2.0 3.0 21 3.0 3.7 15 2.1 2.6
South (6) 83 12.7 8.0 89 11.4 8.5 87 10.4 8.3 90 12.7 8.6 61 8.7 5.8 Compton 9 1.4 3.1 12 1.5 4.1 15 1.8 5.1 21 3.0 7.2 13 1.8 4.5 South 16 2.4 8.7 15 1.9 8.0 16 1.9 8.6 12 1.7 6.3 14 2.0 7.2 Southeast 10 1.5 5.7 13 1.7 7.3 15 1.8 8.4 12 1.7 6.6 7 1.0 3.8 Southwest 48 7.3 12.6 49 6.3 12.8 41 4.9 10.6 45 6.4 11.7 27 3.8 7.1
South Bay (8) 38 5.8 3.4 45 5.7 4.0 45 5.4 4.0 34 4.8 3.0 44 6.3 3.9 Harbor 8 1.2 3.8 6 0.8 2.9 3 0.4 1.4 6 0.8 2.8 1 0.1 0.5 Inglewood 20 3.0 4.6 25 3.2 5.7 29 3.5 6.6 18 2.5 4.1 31 4.4 7.1 Torrance 10 1.5 2.1 14 1.8 3.0 13 1.6 2.8 10 1.4 2.1 12 1.7 2.5 West (5) 35 5.3 5.5 48 6.1 7.5 45 5.4 7.0 35 4.9 5.4 49 7.0 7.5 West 35 5.3 5.5 48 6.1 7.5 45 5.4 7.0 35 4.9 5.4 49 7.0 7.5
Unknown 17 2.6 . 42 5.4 . 31 3.7 . 15 2.1 . 23 3.3 .
Total 656 6.8 784 8.1 837 8.6 708 7.3 704 7.2
1. Excludes cases from Pasadena (SPA 3) and Long Beach (SPA 8).2. Main categories.3. Subcategories.Note: Cumulative percentages may not equal 100% because of rounding.
Table 4.4. Reported Primary and Secondary Syphilis Cases and Rates per 100,000 Population by Service and Health District (HD), Los Angeles County, 2005-2009
2005 2006 2007 2008 2009

Sexually Transmitted Disease Surveillance Report - 2009 (Volume I) 47
0 8 164 Miles
Figure 4.6 Reported Primary and Secondary Syphilis Rates per 100,000 Population by Service Planning Area (SPA), Los Angeles County, 2009.
Excludes cases from Pasadena (SPA 3) and Long Beach (SPA 8).
Antelope Valley (SPA 1)1.4
East (SPA 7)4.4
Metro (SPA 4)23.6
San Fernando (SPA 2)5.1
San Gabriel (SPA 3)3.1
South (SPA 6)5.8
South Bay (SPA 8)3.9
West (SPA 5)7.5

Sexually Transmitted Disease Morbidity Report, 2009
Section V: Early Latent Syphilis

Sexually Transmitted Disease Morbidity Report - 2009 (Volume 1) 48
Figure 5.1. Reported Early Latent Syphilis Rates per 100,000 Population by Year, United States, California, and Los Angeles County (LAC), 2005-2009
4.34.13.6
3.12.83.2
3.7
3.94.3 4.4
6.1
7.8
8.3
7.9
9.8
0
1
2
3
4
5
6
7
8
9
10
2005 2006 2007 2008 2009
Year
Rat
es p
er 1
00,0
00 p
op
ula
tio
n
United States¹
California²
LA County³
1CDC. Sexually Transmitted Disease Surveillance, 2009.2California Department of Health Services, STD Control Branch, Sexually Transmitted Diseases Data Tables, 2009 at website: http://www.cdph.ca.gov/data/statistics/Pages/STDDataTables.aspx (accessed on September 28, 2010). 3Los Angeles County Sexually Transmitted Disease Program, 2010. Excludes cases from Pasadena and Long Beach.
Sexually Transmitted Disease Morbidity Report - 2009 (Volume 1) 49
No. (%) Rate No. (%) Rate No. (%) Rate No. (%) Rate No. (%) Rate
0-14 0 0.0 0.0 1 0.1 0.0 0 0.0 0.0 1 0.1 0.0 1 0.1 0.0
15-19 17 2.9 2.4 19 2.5 2.7 28 3.5 3.8 22 2.8 2.9 22 2.3 2.9
20-24 57 9.8 8.5 59 7.9 8.7 104 12.9 14.8 84 10.8 11.9 107 11.1 15.0
25-29 59 10.2 8.7 100 13.4 14.9 124 15.4 18.5 136 17.5 20.3 144 15.0 21.4
30-34 87 15.0 11.6 92 12.3 12.5 125 15.5 17.6 90 11.6 13.0 138 14.4 20.3
35-44 251 43.2 16.7 295 39.5 19.6 264 32.8 17.6 274 35.2 18.4 312 32.5 21.0
45-54 80 13.8 6.3 139 18.6 10.7 122 15.2 9.2 134 17.2 10.0 179 18.6 13.1
55-64 20 3.4 2.4 32 4.3 3.7 27 3.4 3.0 26 3.3 2.8 43 4.5 4.5
65+ 9 1.5 0.9 8 1.1 0.8 8 1.0 0.8 9 1.2 0.9 12 1.3 1.1
Unknown 1 0.2 . 2 0.3 . 2 0.2 . 3 0.4 . 2 0.2 .
Total 581 6.1 747 7.7 804 8.3 779 8.0 960 9.8
Note: Cumulative percentages may not equal 100% because of rounding. Excludes cases from Pasadena and Long Beach.
2008
Table 5.1. Reported Early Latent Syphilis Cases and Rates per 100,000 Population by Age Group, Los Angeles County, 2005-2009
200720062005 2009
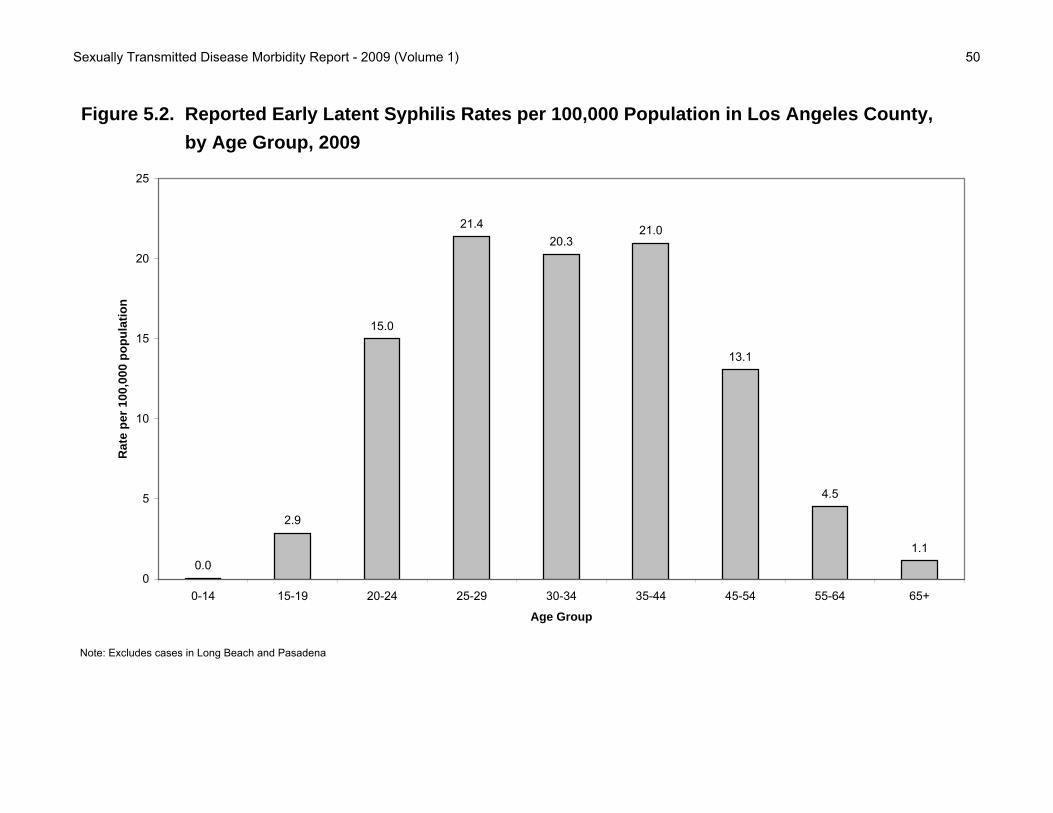
Sexually Transmitted Disease Morbidity Report - 2009 (Volume 1) 50
0.0
2.9
15.0
21.420.3
21.0
13.1
4.5
1.1
0
5
10
15
20
25
0-14 15-19 20-24 25-29 30-34 35-44 45-54 55-64 65+
Age Group
Ra
te p
er
10
0,0
00
po
pu
lati
on
Figure 5.2. Reported Early Latent Syphilis Rates per 100,000 Population in Los Angeles County,
by Age Group, 2009
Note: Excludes cases in Long Beach and Pasadena

Sexually Transmitted Disease Morbidity Report - 2009 (Volume 1) 51
No. (%) Rate No. (%) Rate No. (%) Rate No. (%) Rate No. (%) Rate
MALE
0-14 0 0.0 0.0 0 0.0 0.0 0 0.0 0.0 1 0.1 0.1 1 0.1 0.115-19 5 1.0 1.4 14 2.2 3.9 20 2.9 5.4 13 1.8 3.4 16 1.8 4.120-24 44 8.8 12.8 45 7.1 13.0 82 12.0 22.7 69 9.8 19.0 93 10.7 25.525-29 47 9.4 13.5 83 13.2 23.9 101 14.8 29.1 118 16.8 33.8 128 14.8 36.430-34 80 15.9 21.0 79 12.5 21.2 103 15.1 28.5 81 11.5 22.9 128 14.8 36.835-44 229 45.6 29.9 255 40.4 33.3 236 34.6 31.0 264 37.6 34.9 292 33.7 38.745-54 71 14.1 11.4 121 19.2 19.0 107 15.7 16.5 122 17.4 18.4 159 18.3 23.455-64 18 3.6 4.6 25 4.0 6.1 24 3.5 5.7 24 3.4 5.5 38 4.4 8.465+ 7 1.4 1.7 7 1.1 1.7 8 1.2 1.9 8 1.1 1.8 10 1.2 2.2Unknown 1 0.2 . 2 0.3 . 1 0.1 . 3 0.4 . 2 0.2 .
Subtotal 502 86.4 10.6 631 84.5 13.2 682 84.8 14.2 703 90.2 14.6 867 90.3 17.9
FEMALE
0-14 0 0.0 0.0 1 0.9 0.1 0 0.0 0.0 0 0.0 0.0 0 0.0 0.015-19 12 15.2 3.5 5 4.3 1.4 8 6.6 2.2 9 11.8 2.4 6 6.5 1.620-24 13 16.5 4.0 14 12.1 4.2 22 18.0 6.5 15 19.7 4.3 14 15.1 4.025-29 12 15.2 3.6 17 14.7 5.2 23 18.9 7.1 18 23.7 5.6 16 17.2 5.030-34 7 8.9 1.9 13 11.2 3.6 22 18.0 6.3 9 11.8 2.6 10 10.8 3.035-44 22 27.8 3.0 40 34.5 5.4 28 23.0 3.8 10 13.2 1.4 20 21.5 2.745-54 9 11.4 1.4 18 15.5 2.7 15 12.3 2.2 12 15.8 1.8 20 21.5 2.955-64 2 2.5 0.5 7 6.0 1.5 3 2.5 0.6 2 2.6 0.4 5 5.4 1.065+ 2 2.5 0.4 1 0.9 0.2 0 0.0 0.0 1 1.3 0.2 2 2.2 0.3Unknown 1 0.8 .
Subtotal 79 13.6 1.6 116 15.5 2.4 122 15.2 2.5 76 9.8 1.5 93 9.7 1.9
Total 581 6.1 747 7.7 804 8.3 779 8.0 960 9.8
Note: Cumulative percentages may not equal 100% because of rounding. Excludes cases from Pasadena and Long Beach. Includes Transgender cases.
Table 5.2. Reported Early Latent Syphilis Cases and Rates per 100,000 Population Los Angeles County, 2005-2009
2005 2006 2007 2008 2009
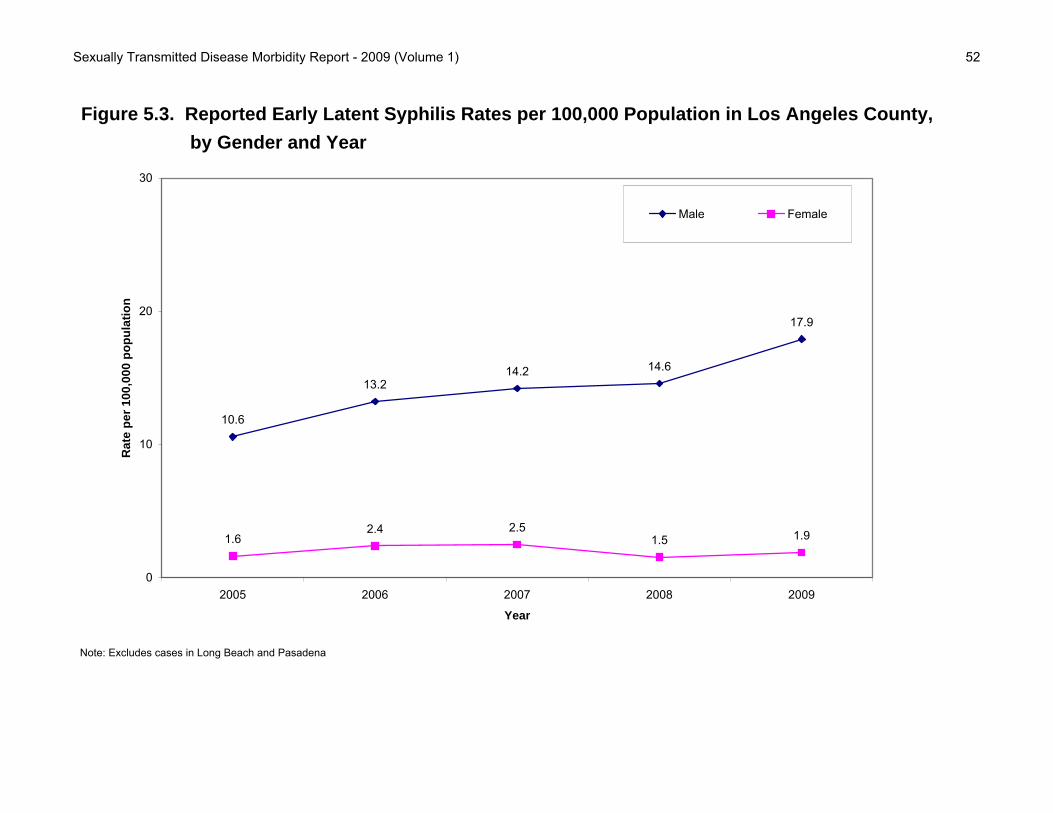
Sexually Transmitted Disease Morbidity Report - 2009 (Volume 1) 52
10.6
13.214.2 14.6
17.9
1.62.4 2.5
1.5 1.9
0
10
20
30
2005 2006 2007 2008 2009
Year
Ra
te p
er
10
0,0
00
po
pu
lati
on
Male Female
Figure 5.3. Reported Early Latent Syphilis Rates per 100,000 Population in Los Angeles County,
by Gender and Year
Note: Excludes cases in Long Beach and Pasadena

Sexually Transmitted Disease Morbidity Report - 2009 (Volume 1) 53
0.1
4.1
25.5
36.4
36.8
38.7
23.4
8.4
2.2
0.010.020.030.040.050.0
0-14
15-19
20-24
25-29
30-34
35-44
45-54
55-64
65+
0.0
1.6
4.0
5.0
3.0
2.7
2.9
1.0
0.3
0.0 5.0 10.0 15.0 20.0 25.0 30.0 35.0
0-14
15-19
20-24
25-29
30-34
35-44
45-54
55-64
65+
Figure 5.4. Reported Early Latent Syphilis Rates per 100,000 Population in Los Angeles County, by Gender and Age Group, 2009
Note: Excludes cases in Long Beach and Pasadena
Male Rate per 100,000 population Female Age

Sexually Transmitted Disease Morbidity Report - 2009 (Volume 1) 54
Adj. Adj. Adj. Adj. Adj. Adj.No. (%) Rate No. (%) Rate No. (%) Rate No. (%) Rate No. (%) Rate No. (%) Rate
MALE
2005 176 35.1 12.7 91 18.1 23.9 196 39.0 8.9 19 3.8 3.3 2 0.4 502 86.4 10.62006 184 29.2 13.3 119 18.9 31.4 290 46.0 12.8 10 1.6 1.7 8 1.3 631 84.5 13.22007 187 27.4 13.2 118 17.3 30.3 333 48.8 14.5 25 3.7 4.2 6 0.9 682 84.8 14.22008 225 32.0 16.1 105 14.9 27.4 326 46.4 14.4 15 2.1 2.5 6 0.9 703 90.2 14.62009 254 29.3 17.9 139 16.0 35.7 407 46.9 17.6 36 4.2 5.9 12 1.4 867 90.3 17.9
FEMALE
2005 9 11.4 0.7 28 35.4 6.7 34 43.0 1.6 1 1.3 0.2 0 0.0 79 13.6 1.62006 14 12.1 1.0 31 26.7 7.1 61 52.6 2.8 3 2.6 0.5 3 2.6 116 15.5 2.42007 13 10.7 0.9 36 29.5 8.3 64 52.5 2.9 2 1.6 0.3 1 0.8 122 15.2 2.52008 3 4.0 0.2 20 26.3 4.4 50 65.8 2.2 3 4.0 0.4 0 0.0 76 9.8 1.52009 11 11.8 0.8 28 30.1 6.2 52 55.9 2.3 2 2.2 0.3 0 0.0 93 9.7 1.9
1. Includes data for ethnicity reported as "Other," "Native American," and "Mixed."2. Includes cases reported as "Unknown" race/ethnicity.Note: If race/ethnicity was not specified, cases were prorated according to the distribution of cases for which race/ethnicity was specified. Rates were adjusted including the prorated cases. Therefore, these tables should be used only for race/ethnicity comparisons, not for overall totals or gender totals. Cumulative percentages may not equal 100% because of rounding. Cases from Pasadena and Long Beach were not included. Transgender cases were included.
Table 5.3. Reported Early Latent Syphilis Cases and Rates per 100,000 Population Los Angeles County, 2005-2009
White Black Hispanic Asian-Pacific Other1 Total2

Sexually Transmitted Disease Morbidity Report - 2009 (Volume 1) 55
17.9
35.7
17.6
5.9
0.8
6.2
2.30.3
0
5
10
15
20
25
30
35
40
White Black Hispanic Asian-Pacific
Ra
te p
er
10
0,0
00
po
pu
lati
on
Male Female
Figure 5.5. Reported Early Latent Syphilis Rates per 100,000 Population in Los Angeles County,
by Gender and Race/Ethnicity, 2009
Note: Adjusted for unknown race. Excludes cases in Long Beach and Pasadena
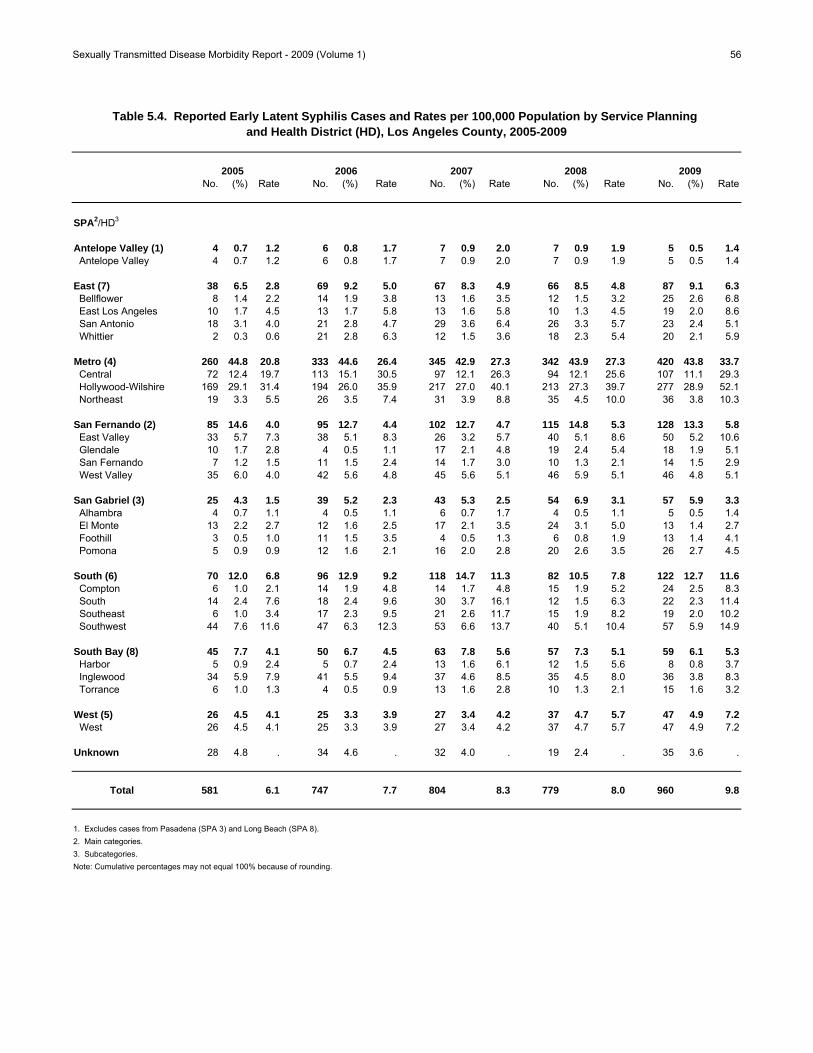
Sexually Transmitted Disease Morbidity Report - 2009 (Volume 1) 56
No. (%) Rate No. (%) Rate No. (%) Rate No. (%) Rate No. (%) Rate
SPA2/HD3
Antelope Valley (1) 4 0.7 1.2 6 0.8 1.7 7 0.9 2.0 7 0.9 1.9 5 0.5 1.4 Antelope Valley 4 0.7 1.2 6 0.8 1.7 7 0.9 2.0 7 0.9 1.9 5 0.5 1.4
East (7) 38 6.5 2.8 69 9.2 5.0 67 8.3 4.9 66 8.5 4.8 87 9.1 6.3 Bellflower 8 1.4 2.2 14 1.9 3.8 13 1.6 3.5 12 1.5 3.2 25 2.6 6.8 East Los Angeles 10 1.7 4.5 13 1.7 5.8 13 1.6 5.8 10 1.3 4.5 19 2.0 8.6 San Antonio 18 3.1 4.0 21 2.8 4.7 29 3.6 6.4 26 3.3 5.7 23 2.4 5.1 Whittier 2 0.3 0.6 21 2.8 6.3 12 1.5 3.6 18 2.3 5.4 20 2.1 5.9
Metro (4) 260 44.8 20.8 333 44.6 26.4 345 42.9 27.3 342 43.9 27.3 420 43.8 33.7 Central 72 12.4 19.7 113 15.1 30.5 97 12.1 26.3 94 12.1 25.6 107 11.1 29.3 Hollywood-Wilshire 169 29.1 31.4 194 26.0 35.9 217 27.0 40.1 213 27.3 39.7 277 28.9 52.1 Northeast 19 3.3 5.5 26 3.5 7.4 31 3.9 8.8 35 4.5 10.0 36 3.8 10.3
San Fernando (2) 85 14.6 4.0 95 12.7 4.4 102 12.7 4.7 115 14.8 5.3 128 13.3 5.8 East Valley 33 5.7 7.3 38 5.1 8.3 26 3.2 5.7 40 5.1 8.6 50 5.2 10.6 Glendale 10 1.7 2.8 4 0.5 1.1 17 2.1 4.8 19 2.4 5.4 18 1.9 5.1 San Fernando 7 1.2 1.5 11 1.5 2.4 14 1.7 3.0 10 1.3 2.1 14 1.5 2.9 West Valley 35 6.0 4.0 42 5.6 4.8 45 5.6 5.1 46 5.9 5.1 46 4.8 5.1
San Gabriel (3) 25 4.3 1.5 39 5.2 2.3 43 5.3 2.5 54 6.9 3.1 57 5.9 3.3 Alhambra 4 0.7 1.1 4 0.5 1.1 6 0.7 1.7 4 0.5 1.1 5 0.5 1.4 El Monte 13 2.2 2.7 12 1.6 2.5 17 2.1 3.5 24 3.1 5.0 13 1.4 2.7 Foothill 3 0.5 1.0 11 1.5 3.5 4 0.5 1.3 6 0.8 1.9 13 1.4 4.1 Pomona 5 0.9 0.9 12 1.6 2.1 16 2.0 2.8 20 2.6 3.5 26 2.7 4.5
South (6) 70 12.0 6.8 96 12.9 9.2 118 14.7 11.3 82 10.5 7.8 122 12.7 11.6 Compton 6 1.0 2.1 14 1.9 4.8 14 1.7 4.8 15 1.9 5.2 24 2.5 8.3 South 14 2.4 7.6 18 2.4 9.6 30 3.7 16.1 12 1.5 6.3 22 2.3 11.4 Southeast 6 1.0 3.4 17 2.3 9.5 21 2.6 11.7 15 1.9 8.2 19 2.0 10.2 Southwest 44 7.6 11.6 47 6.3 12.3 53 6.6 13.7 40 5.1 10.4 57 5.9 14.9
South Bay (8) 45 7.7 4.1 50 6.7 4.5 63 7.8 5.6 57 7.3 5.1 59 6.1 5.3 Harbor 5 0.9 2.4 5 0.7 2.4 13 1.6 6.1 12 1.5 5.6 8 0.8 3.7 Inglewood 34 5.9 7.9 41 5.5 9.4 37 4.6 8.5 35 4.5 8.0 36 3.8 8.3 Torrance 6 1.0 1.3 4 0.5 0.9 13 1.6 2.8 10 1.3 2.1 15 1.6 3.2 West (5) 26 4.5 4.1 25 3.3 3.9 27 3.4 4.2 37 4.7 5.7 47 4.9 7.2 West 26 4.5 4.1 25 3.3 3.9 27 3.4 4.2 37 4.7 5.7 47 4.9 7.2
Unknown 28 4.8 . 34 4.6 . 32 4.0 . 19 2.4 . 35 3.6 .
Total 581 6.1 747 7.7 804 8.3 779 8.0 960 9.8
1. Excludes cases from Pasadena (SPA 3) and Long Beach (SPA 8).2. Main categories.3. Subcategories.Note: Cumulative percentages may not equal 100% because of rounding.
Table 5.4. Reported Early Latent Syphilis Cases and Rates per 100,000 Population by Service Planning and Health District (HD), Los Angeles County, 2005-2009
2005 2006 2007 2008 2009

Sexually Transmitted Disease Surveillance Report - 2009 (Volume I) 57
0 8 164 Miles
Figure 5.6 Reported Early Latent Syphilis Rates per 100,000 Population by Service Planning Area (SPA), Los Angeles County, 2009.
Excludes cases from Pasadena (SPA 3) and Long Beach (SPA 8).
Antelope Valley (SPA 1)1.4
East (SPA 7)6.3
Metro (SPA 4)33.7
San Fernando (SPA 2)5.8
San Gabriel (SPA 3)3.3
South (SPA 6)11.6
South Bay (SPA 8)5.3
West (SPA 5)7.2

Sexually Transmitted Disease Morbidity Report, 2009
Section VI: Late and Late Latent Syphilis

Sexually Transmitted Disease Morbidity Report - 2009 (Volume 1) 58
Figure 6.1. Reported Late and Late Latent Syphilis Rates per 100,000 Population by Year, United States, California, and Los Angeles County (LAC), 2005-2009
5.76.6
6.15.9
5.47.4
7.9 7.68.1
6.4
15.7
17.1
14.4 14.7
11.5
0
5
10
15
20
2005 2006 2007 2008 2009Year
Ra
tes
pe
r 1
00
,00
0 p
op
ula
tio
n
United States¹
California²
LA County³
1CDC. Sexually Transmitted Disease Surveillance, 2009.2California Department of Health Services, STD Control Branch, Sexually Transmitted Diseases Data Tables, 2009 at website: http://www.cdph.ca.gov/data/statistics/Pages/STDDataTables.aspx (accessed on September 28, 2010). 3Los Angeles County Sexually Transmitted Disease Program, 2010. Excludes cases from Pasadena and Long Beach.Note: Late and late latent syphilis is classified as late latent, latent unknown duration, and late syphilis with clinical manifestations (including neurosyphilis).

Sexually Transmitted Disease Morbidity Report - 2009 (Volume 1) 59
No. (%) Rate No. (%) Rate No. (%) Rate No. (%) Rate No. (%) Rate
0-14 0 0.0 0.0 0 0.0 0.0 2 0.1 0.1 2 0.1 0.1 0 0.0 0.0
15-19 42 2.8 6.0 39 2.4 5.5 25 1.8 3.4 40 2.8 5.3 39 3.5 5.1
20-24 119 7.9 17.7 130 7.9 19.2 125 8.9 17.8 116 8.0 16.4 84 7.5 11.8
25-29 157 10.4 23.1 194 11.7 28.9 162 11.6 24.2 173 11.9 25.8 128 11.4 19.0
30-34 183 12.1 24.4 175 10.6 23.8 168 12.0 23.6 165 11.4 23.8 161 14.3 23.7
35-44 448 29.7 29.7 518 31.3 34.4 377 27.0 25.1 369 25.4 24.7 301 26.8 20.2
45-54 268 17.7 21.1 314 19.0 24.2 248 17.8 18.8 284 19.6 21.1 221 19.6 16.1
55-64 139 9.2 16.7 158 9.5 18.2 163 11.7 18.4 155 10.7 16.8 121 10.8 12.7
65+ 144 9.5 14.9 123 7.4 12.6 124 8.9 12.3 135 9.3 13.0 67 6.0 6.3
Unknown 10 0.7 . 4 0.2 . 3 0.2 . 12 0.8 . 3 0.3 .
Total 1,510 15.8 1,655 17.2 1,397 14.4 1,451 14.9 1,125 11.5
Note: Cumulative percentages may not equal 100% because of rounding. Excludes cases from Pasadena and Long Beach.1. Late and late latent syphilis is classified as late latent, latent unknown duration, and late syphilis with clinical manifestations (including neurosyphilis)
2008
Table 6.1. Reported Late and Late Latent Syphilis1 Cases and Rates per 100,000 Population by Age Group, Los Angeles County, 2005-2009
200720062005 2009

Sexually Transmitted Disease Morbidity Report - 2009 (Volume 1) 60
No. (%) Rate No. (%) Rate No. (%) Rate No. (%) Rate No. (%) Rate
MALE
0-14 0 0.0 0.0 0 0.0 0.0 1 0.1 0.1 1 0.1 0.1 0 0.0 0.015-19 14 1.5 3.9 19 1.8 5.3 11 1.3 3.0 18 1.8 4.7 29 3.7 7.520-24 56 5.9 16.2 75 7.1 21.7 78 9.0 21.6 74 7.6 20.4 56 7.1 15.425-29 96 10.2 27.5 118 11.1 34.0 96 11.0 27.6 124 12.7 35.5 100 12.7 28.430-34 129 13.7 33.9 101 9.5 27.0 101 11.6 27.9 127 13.0 35.8 124 15.7 35.635-44 289 30.6 37.8 349 33.0 45.6 255 29.3 33.5 264 27.0 34.9 208 26.4 27.645-54 183 19.4 29.4 218 20.6 34.2 159 18.3 24.5 193 19.7 29.0 165 20.9 24.355-64 92 9.7 23.4 114 10.8 27.8 101 11.6 24.1 95 9.7 21.8 79 10.0 17.465+ 81 8.6 20.2 64 6.0 15.7 66 7.6 15.6 74 7.6 16.9 26 3.3 5.8Unknown 5 0.5 . 1 0.1 . 2 0.2 . 8 0.8 . 2 0.3 .
Subtotal 945 62.7 19.9 1,059 64.2 22.2 870 62.4 18.1 978 67.5 20.3 789 70.2 16.3
FEMALE
0-14 0 0.0 0.0 0 0.0 0.0 1 0.2 0.1 1 0.2 0.1 0 0.0 0.015-19 28 5.0 8.1 20 3.4 5.8 14 2.7 3.9 22 4.7 6.0 10 3.0 2.720-24 63 11.2 19.3 54 9.1 16.3 47 9.0 13.8 42 8.9 12.2 28 8.4 8.025-29 61 10.8 18.4 76 12.9 23.4 66 12.6 20.5 49 10.4 15.2 28 8.4 8.730-34 54 9.6 14.7 74 12.5 20.5 67 12.8 19.2 37 7.9 10.9 37 11.0 11.135-44 159 28.2 21.4 167 28.3 22.5 121 23.0 16.4 105 22.3 14.3 93 27.8 12.745-54 84 14.9 12.9 95 16.1 14.4 89 17.0 13.3 91 19.3 13.4 56 16.7 8.155-64 47 8.3 10.7 43 7.3 9.4 62 11.8 13.2 60 12.7 12.4 41 12.2 8.265+ 63 11.2 11.2 59 10.0 10.3 57 10.9 9.7 61 13.0 10.1 41 12.2 6.7Unknown 4 0.7 . 3 0.5 . 1 0.2 . 3 0.6 . 1 0.3 .
Subtotal 563 37.3 11.6 591 35.8 12.1 525 37.6 10.7 471 32.5 9.6 335 29.8 6.8
Total2 1,510 15.8 1,655 17.2 1,397 14.4 1,451 14.9 1,125 11.5
(Source: CDC. Sexually Transmitted Disease Surveillance)
Note: Cumulative percentages may not equal 100% because of rounding. Excludes cases from Pasadena and Long Beach. Includes Transgender cases.2. Includes cases reported as "Unknown/Other" gender and known age.
Table 6.2. Reported Late and Late Latent Syphilis1 Cases and Rates per 100,000 Population Los Angeles County, 2005-2009
2005 2006 2007 2008 2009
1. Late and late latent syphilis is classified as late latent, latent unknown duration and late syphilis with clinical manifestations (including neurosyphilis).

Sexually Transmitted Disease Morbidity Report - 2009 (Volume 1) 61
Adj. Adj. Adj. Adj. Adj. Adj.No. (%) Rate No. (%) Rate No. (%) Rate No. (%) Rate No. (%) Rate No. (%) Rate
MALE
2005 171 18.1 13.1 151 16.0 42.1 485 51.3 23.2 34 3.6 6.2 10 1.1 945 62.7 19.92006 187 17.7 14.7 180 17.0 51.7 508 48.0 24.5 41 3.9 7.6 10 0.9 1,059 64.2 22.22007 139 16.0 10.7 135 15.5 37.6 460 52.9 21.7 34 3.9 6.1 12 1.4 870 62.4 18.12008 172 17.6 13.3 166 17.0 46.8 485 49.6 23.1 30 3.1 5.5 8 0.8 978 67.5 20.32009 143 18.1 10.9 127 16.1 35.3 401 50.8 18.8 27 3.4 4.8 9 1.1 789 70.2 16.3
FEMALE
2005 27 4.8 2.0 109 19.4 25.8 335 59.5 16.0 47 8.4 7.7 2 0.4 563 37.3 11.62006 27 4.6 2.0 116 19.6 27.9 349 59.1 16.6 44 7.5 7.2 4 0.7 591 35.8 12.12007 45 8.6 3.4 91 17.3 21.9 306 58.3 14.6 26 5.0 4.2 7 1.3 525 37.6 10.72008 36 7.6 2.8 83 17.6 20.9 253 53.7 12.6 29 6.2 4.9 3 0.6 471 32.5 9.62009 20 6.0 1.5 58 17.3 14.2 196 58.5 9.4 20 6.0 3.3 5 1.5 335 29.8 6.8
1. Late and late latent syphilis is classified as late latent, latent unknown duration, and late syphilis with clinical manifestations (including neurosyphilis).2. Includes data for ethnicity reported as "Other," "Native American," and "Mixed."
Note: If race/ethnicity was not specified, cases were prorated according to the distribution of cases for which race/ethnicity was specified. Rates were adjusted including the prorated cases. Therefore, these tables should be used only for race/ethnicity comparisons, not for overall totals or gender totals. Cumulative percentages may not equal 100% because of
Total3,4
rounding. Cases from Pasadena and Long Beach were not included. Transgender cases were included.
3. Excludes cases reported with "Unknown/Other" gender. 4. Includes cases reported as "Unknown" race/ethnicity.
Table 6.3. Reported Late and Late Latent Syphilis1 Cases and Rates per 100,000 Population Los Angeles County, 2005-2009
White Black Hispanic Asian-Pacific Other2
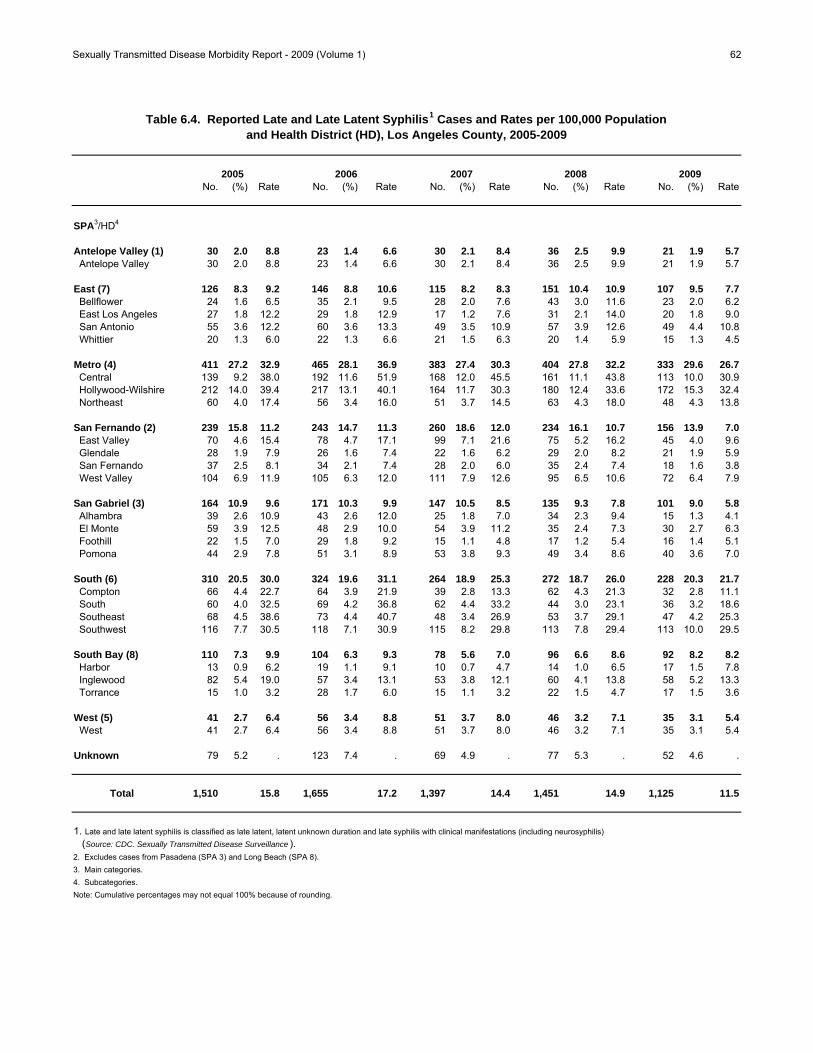
Sexually Transmitted Disease Morbidity Report - 2009 (Volume 1) 62
No. (%) Rate No. (%) Rate No. (%) Rate No. (%) Rate No. (%) Rate
SPA3/HD4
Antelope Valley (1) 30 2.0 8.8 23 1.4 6.6 30 2.1 8.4 36 2.5 9.9 21 1.9 5.7 Antelope Valley 30 2.0 8.8 23 1.4 6.6 30 2.1 8.4 36 2.5 9.9 21 1.9 5.7
East (7) 126 8.3 9.2 146 8.8 10.6 115 8.2 8.3 151 10.4 10.9 107 9.5 7.7 Bellflower 24 1.6 6.5 35 2.1 9.5 28 2.0 7.6 43 3.0 11.6 23 2.0 6.2 East Los Angeles 27 1.8 12.2 29 1.8 12.9 17 1.2 7.6 31 2.1 14.0 20 1.8 9.0 San Antonio 55 3.6 12.2 60 3.6 13.3 49 3.5 10.9 57 3.9 12.6 49 4.4 10.8 Whittier 20 1.3 6.0 22 1.3 6.6 21 1.5 6.3 20 1.4 5.9 15 1.3 4.5
Metro (4) 411 27.2 32.9 465 28.1 36.9 383 27.4 30.3 404 27.8 32.2 333 29.6 26.7 Central 139 9.2 38.0 192 11.6 51.9 168 12.0 45.5 161 11.1 43.8 113 10.0 30.9 Hollywood-Wilshire 212 14.0 39.4 217 13.1 40.1 164 11.7 30.3 180 12.4 33.6 172 15.3 32.4 Northeast 60 4.0 17.4 56 3.4 16.0 51 3.7 14.5 63 4.3 18.0 48 4.3 13.8
San Fernando (2) 239 15.8 11.2 243 14.7 11.3 260 18.6 12.0 234 16.1 10.7 156 13.9 7.0 East Valley 70 4.6 15.4 78 4.7 17.1 99 7.1 21.6 75 5.2 16.2 45 4.0 9.6 Glendale 28 1.9 7.9 26 1.6 7.4 22 1.6 6.2 29 2.0 8.2 21 1.9 5.9 San Fernando 37 2.5 8.1 34 2.1 7.4 28 2.0 6.0 35 2.4 7.4 18 1.6 3.8 West Valley 104 6.9 11.9 105 6.3 12.0 111 7.9 12.6 95 6.5 10.6 72 6.4 7.9
San Gabriel (3) 164 10.9 9.6 171 10.3 9.9 147 10.5 8.5 135 9.3 7.8 101 9.0 5.8 Alhambra 39 2.6 10.9 43 2.6 12.0 25 1.8 7.0 34 2.3 9.4 15 1.3 4.1 El Monte 59 3.9 12.5 48 2.9 10.0 54 3.9 11.2 35 2.4 7.3 30 2.7 6.3 Foothill 22 1.5 7.0 29 1.8 9.2 15 1.1 4.8 17 1.2 5.4 16 1.4 5.1 Pomona 44 2.9 7.8 51 3.1 8.9 53 3.8 9.3 49 3.4 8.6 40 3.6 7.0
South (6) 310 20.5 30.0 324 19.6 31.1 264 18.9 25.3 272 18.7 26.0 228 20.3 21.7 Compton 66 4.4 22.7 64 3.9 21.9 39 2.8 13.3 62 4.3 21.3 32 2.8 11.1 South 60 4.0 32.5 69 4.2 36.8 62 4.4 33.2 44 3.0 23.1 36 3.2 18.6 Southeast 68 4.5 38.6 73 4.4 40.7 48 3.4 26.9 53 3.7 29.1 47 4.2 25.3 Southwest 116 7.7 30.5 118 7.1 30.9 115 8.2 29.8 113 7.8 29.4 113 10.0 29.5
South Bay (8) 110 7.3 9.9 104 6.3 9.3 78 5.6 7.0 96 6.6 8.6 92 8.2 8.2 Harbor 13 0.9 6.2 19 1.1 9.1 10 0.7 4.7 14 1.0 6.5 17 1.5 7.8 Inglewood 82 5.4 19.0 57 3.4 13.1 53 3.8 12.1 60 4.1 13.8 58 5.2 13.3 Torrance 15 1.0 3.2 28 1.7 6.0 15 1.1 3.2 22 1.5 4.7 17 1.5 3.6 West (5) 41 2.7 6.4 56 3.4 8.8 51 3.7 8.0 46 3.2 7.1 35 3.1 5.4 West 41 2.7 6.4 56 3.4 8.8 51 3.7 8.0 46 3.2 7.1 35 3.1 5.4
Unknown 79 5.2 . 123 7.4 . 69 4.9 . 77 5.3 . 52 4.6 .
Total 1,510 15.8 1,655 17.2 1,397 14.4 1,451 14.9 1,125 11.5
1. Late and late latent syphilis is classified as late latent, latent unknown duration and late syphilis with clinical manifestations (including neurosyphilis) (Source: CDC. Sexually Transmitted Disease Surveillance ).2. Excludes cases from Pasadena (SPA 3) and Long Beach (SPA 8).3. Main categories.4. Subcategories.Note: Cumulative percentages may not equal 100% because of rounding.
Table 6.4. Reported Late and Late Latent Syphilis1 Cases and Rates per 100,000 Population and Health District (HD), Los Angeles County, 2005-2009
2005 2006 2007 2008 2009
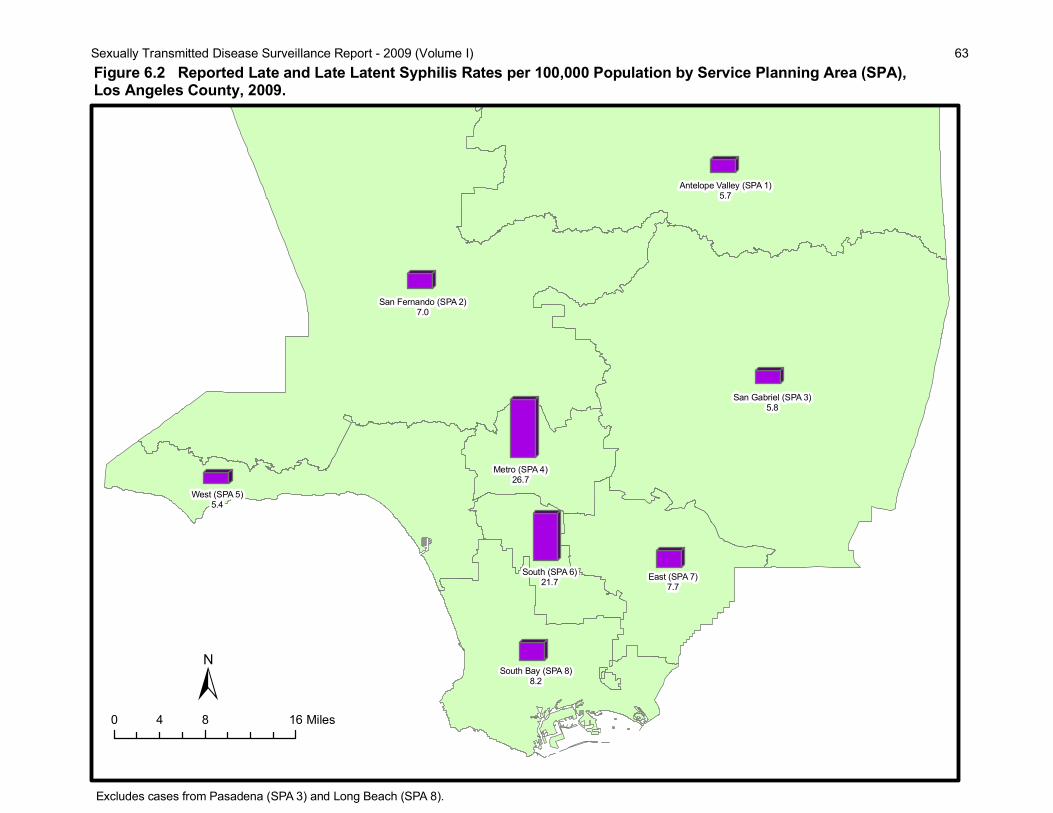
Sexually Transmitted Disease Surveillance Report - 2009 (Volume I) 63
0 8 164 Miles
Figure 6.2 Reported Late and Late Latent Syphilis Rates per 100,000 Population by Service Planning Area (SPA), Los Angeles County, 2009.
Excludes cases from Pasadena (SPA 3) and Long Beach (SPA 8).
Antelope Valley (SPA 1)5.7
East (SPA 7)7.7
Metro (SPA 4)26.7
San Fernando (SPA 2)7.0
San Gabriel (SPA 3)5.8
South (SPA 6)21.7
South Bay (SPA 8)8.2
West (SPA 5)5.4
Sexually Transmitted Disease Morbidity Report, 2009
Section VII: Congenital Syphilis
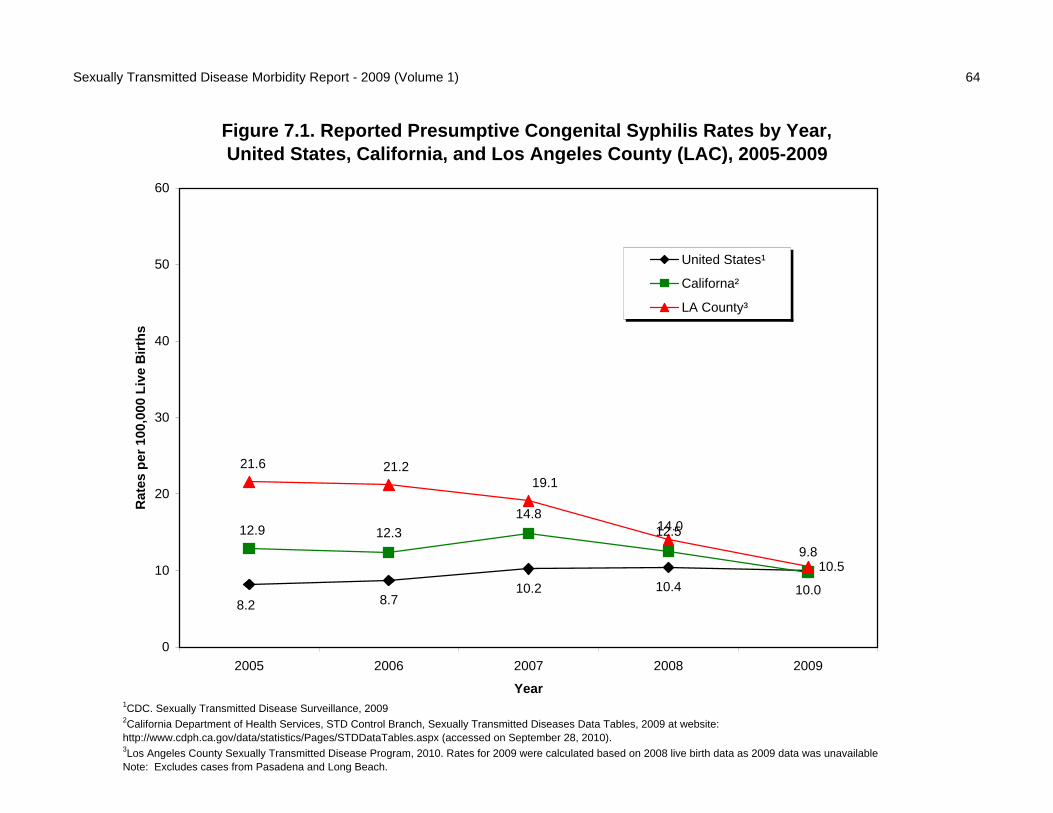
Sexually Transmitted Disease Morbidity Report - 2009 (Volume 1) 64
Figure 7.1. Reported Presumptive Congenital Syphilis Rates by Year, United States, California, and Los Angeles County (LAC), 2005-2009
10.5
8.2 8.710.2 10.4 10.0
9.812.5
14.812.312.9
21.6 21.219.1
14.0
0
10
20
30
40
50
60
2005 2006 2007 2008 2009
Year
Rat
es p
er 1
00,0
00 L
ive
Bir
ths
United States¹
Californa²
LA County³
1CDC. Sexually Transmitted Disease Surveillance, 20092California Department of Health Services, STD Control Branch, Sexually Transmitted Diseases Data Tables, 2009 at website: http://www.cdph.ca.gov/data/statistics/Pages/STDDataTables.aspx (accessed on September 28, 2010). 3Los Angeles County Sexually Transmitted Disease Program, 2010. Rates for 2009 were calculated based on 2008 live birth data as 2009 data was unavailable Note: Excludes cases from Pasadena and Long Beach.

Sexually Transmitted Disease Morbidity Report - 2009 (Volume 1) 65
Adj. Adj. Adj. Adj.No. (%) Rate No. (%) Rate No. (%) Rate No. (%) Rate No. (%) Rate
2005 1 3.2 4.6 9 29.0 96.0 15 48.4 18.7 2 6.5 15.4 31 100.0 21.6
2006 3 10.0 15.5 3 10.0 36.7 18 60.0 24.7 0 0.0 0.0 30 100.0 21.2
2007 3 11.1 15.9 13 48.1 161.7 15 55.6 20.8 4 14.8 31.3 27 100.0 19.1
2008 0 0.0 0.0 4 20.0 39.0 11 55.0 12.6 1 5.0 6.4 20 100.0 14.0
2009 3 2 13.3 8.7 2 13.3 19.5 7 46.7 8.0 0 0.0 0.0 15 100.0 10.5
1. Includes cases reported as "Unknown" race/ethnicity.2. Cases from Pasadena and Long Beach were not included.3. Rates were calculated based on 2008 live birth data as 2009 data was unavailable. Live birth data courtesy of L.A. County Office of Health Assessment and Epidemiology. Note: if race/ethnicity was not specified, cases were prorated according to the distribution of cases for which race/ethnicity was specified. Rates wereadjusted including the prorated cases. Therefore, these tables should be used only for race/ethnicity comparisons, not for overall totals or gender totals.Cumulative percentages may not equal 100% because of rounding.
Table 7.1. Reported Presumptive Congenital Syphilis Cases and Rates per 100,000 Live Births by Race/Ethnicity, Los Angeles County, 2005-2009
White Black Hispanic Asian-Pacific Total1,2
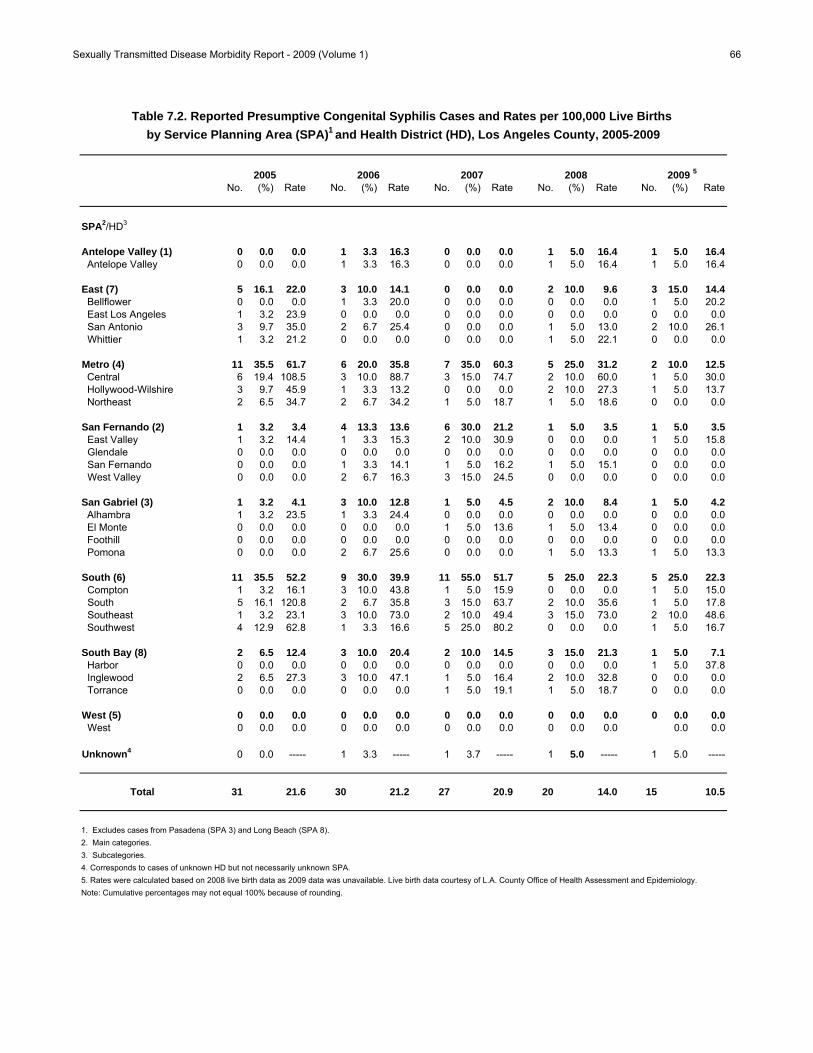
Sexually Transmitted Disease Morbidity Report - 2009 (Volume 1) 66
No. (%) Rate No. (%) Rate No. (%) Rate No. (%) Rate No. (%) Rate
SPA2/HD3
Antelope Valley (1) 0 0.0 0.0 1 3.3 16.3 0 0.0 0.0 1 5.0 16.4 1 5.0 16.4 Antelope Valley 0 0.0 0.0 1 3.3 16.3 0 0.0 0.0 1 5.0 16.4 1 5.0 16.4
East (7) 5 16.1 22.0 3 10.0 14.1 0 0.0 0.0 2 10.0 9.6 3 15.0 14.4 Bellflower 0 0.0 0.0 1 3.3 20.0 0 0.0 0.0 0 0.0 0.0 1 5.0 20.2 East Los Angeles 1 3.2 23.9 0 0.0 0.0 0 0.0 0.0 0 0.0 0.0 0 0.0 0.0 San Antonio 3 9.7 35.0 2 6.7 25.4 0 0.0 0.0 1 5.0 13.0 2 10.0 26.1 Whittier 1 3.2 21.2 0 0.0 0.0 0 0.0 0.0 1 5.0 22.1 0 0.0 0.0
Metro (4) 11 35.5 61.7 6 20.0 35.8 7 35.0 60.3 5 25.0 31.2 2 10.0 12.5 Central 6 19.4 108.5 3 10.0 88.7 3 15.0 74.7 2 10.0 60.0 1 5.0 30.0 Hollywood-Wilshire 3 9.7 45.9 1 3.3 13.2 0 0.0 0.0 2 10.0 27.3 1 5.0 13.7 Northeast 2 6.5 34.7 2 6.7 34.2 1 5.0 18.7 1 5.0 18.6 0 0.0 0.0
San Fernando (2) 1 3.2 3.4 4 13.3 13.6 6 30.0 21.2 1 5.0 3.5 1 5.0 3.5 East Valley 1 3.2 14.4 1 3.3 15.3 2 10.0 30.9 0 0.0 0.0 1 5.0 15.8 Glendale 0 0.0 0.0 0 0.0 0.0 0 0.0 0.0 0 0.0 0.0 0 0.0 0.0 San Fernando 0 0.0 0.0 1 3.3 14.1 1 5.0 16.2 1 5.0 15.1 0 0.0 0.0 West Valley 0 0.0 0.0 2 6.7 16.3 3 15.0 24.5 0 0.0 0.0 0 0.0 0.0
San Gabriel (3) 1 3.2 4.1 3 10.0 12.8 1 5.0 4.5 2 10.0 8.4 1 5.0 4.2 Alhambra 1 3.2 23.5 1 3.3 24.4 0 0.0 0.0 0 0.0 0.0 0 0.0 0.0 El Monte 0 0.0 0.0 0 0.0 0.0 1 5.0 13.6 1 5.0 13.4 0 0.0 0.0 Foothill 0 0.0 0.0 0 0.0 0.0 0 0.0 0.0 0 0.0 0.0 0 0.0 0.0 Pomona 0 0.0 0.0 2 6.7 25.6 0 0.0 0.0 1 5.0 13.3 1 5.0 13.3
South (6) 11 35.5 52.2 9 30.0 39.9 11 55.0 51.7 5 25.0 22.3 5 25.0 22.3 Compton 1 3.2 16.1 3 10.0 43.8 1 5.0 15.9 0 0.0 0.0 1 5.0 15.0 South 5 16.1 120.8 2 6.7 35.8 3 15.0 63.7 2 10.0 35.6 1 5.0 17.8 Southeast 1 3.2 23.1 3 10.0 73.0 2 10.0 49.4 3 15.0 73.0 2 10.0 48.6 Southwest 4 12.9 62.8 1 3.3 16.6 5 25.0 80.2 0 0.0 0.0 1 5.0 16.7
South Bay (8) 2 6.5 12.4 3 10.0 20.4 2 10.0 14.5 3 15.0 21.3 1 5.0 7.1 Harbor 0 0.0 0.0 0 0.0 0.0 0 0.0 0.0 0 0.0 0.0 1 5.0 37.8 Inglewood 2 6.5 27.3 3 10.0 47.1 1 5.0 16.4 2 10.0 32.8 0 0.0 0.0 Torrance 0 0.0 0.0 0 0.0 0.0 1 5.0 19.1 1 5.0 18.7 0 0.0 0.0 West (5) 0 0.0 0.0 0 0.0 0.0 0 0.0 0.0 0 0.0 0.0 0 0.0 0.0 West 0 0.0 0.0 0 0.0 0.0 0 0.0 0.0 0 0.0 0.0 0.0 0.0
Unknown4 0 0.0 ----- 1 3.3 ----- 1 3.7 ----- 1 5.0 ----- 1 5.0 -----
Total 31 21.6 30 21.2 27 20.9 20 14.0 15 10.5
1. Excludes cases from Pasadena (SPA 3) and Long Beach (SPA 8).2. Main categories.3. Subcategories.4. Corresponds to cases of unknown HD but not necessarily unknown SPA.5. Rates were calculated based on 2008 live birth data as 2009 data was unavailable. Live birth data courtesy of L.A. County Office of Health Assessment and Epidemiology. Note: Cumulative percentages may not equal 100% because of rounding.
Table 7.2. Reported Presumptive Congenital Syphilis Cases and Rates per 100,000 Live Births
by Service Planning Area (SPA)1 and Health District (HD), Los Angeles County, 2005-2009
2005 2006 2007 2008 2009 5

Sexually Transmitted Disease Morbidity Report, 2009
Section VIII: All Pelvic Inflammatory Disease

Sexually Transmitted Disease Morbidity Report - 2009 (Volume 1) 67
2005 2006 2007No. (%) Rate No. (%) Rate No. (%) Rate No. (%) Rate No. (%) Rate
FEMALE
0-14 3 0.9 0.3 2 0.7 0.2 2 0.9 0.2 7 3.5 0.7 1 0.6 0.1
15-19 95 29.5 25.8 86 28.1 24.7 80 34.6 22.2 62 31.2 16.6 45 25.9 12.0
20-24 105 32.6 31.5 97 31.7 29.3 54 23.4 15.8 44 22.1 12.6 51 29.3 14.6
25-29 54 16.8 16.6 48 15.7 14.8 34 14.7 10.5 36 18.1 11.0 28 16.1 8.7
30-34 37 11.5 10.3 28 9.2 7.7 23 10.0 6.6 18 9.0 5.2 21 12.1 6.3
35-44 17 5.3 2.4 34 11.1 4.6 25 10.8 3.4 23 11.6 3.1 23 13.2 3.1
45-54 7 2.2 1.1 8 2.6 1.2 13 5.6 1.9 7 3.5 1.0 4 2.3 0.6
55-64 1 0.3 0.2 1 0.3 0.2 0 0.0 0.0 1 0.5 0.2 1 0.6 0.2
65+ 0 0.0 0.0 0 0.0 0.0 0 0.0 0.0 1 0.5 0.2 0 0.0 0.0
Unknown 3 0.9 . 2 0.7 . 0 0.0 . 0 0.0 . 0 0.0 .
Total 322 6.7 306 6.3 231 4.7 199 4.0 174 3.5
1. Includes chlamydial PID, gonococcal PID, and non-chlamydial/non-gonococcal PID.Note: Cumulative percentages may not equal 100% because of rounding. Excludes cases from Pasadena and Long Beach.
Table 8.1. Reported All Pelvic Inflammatory Disease (PID)1
Cases and Rates per 100,000 Female Population by Age Group, Los Angeles County, 2005-2009
20092008

Sexually Transmitted Disease Morbidity Report - 2009 (Volume 1) 68
0.1
12.0
14.6
8.7
6.3
3.1
0.60.2 0.0
0
2
4
6
8
10
12
14
16
0-14 15-19 20-24 25-29 30-34 35-44 45-54 55-64 65+
Age Group
Ra
te p
er
10
0,0
00
po
pu
lati
on
Figure 8.1. Reported All PID Rates per 100,000 Female Population in Los Angeles County, by
Age Group, 2009
Note: Excludes cases in Long Beach and Pasadena

Sexually Transmitted Disease Morbidity Report - 2009 (Volume 1) 69
Adj. Adj. Adj. Adj. Adj.No. (%) Rate No. (%) Rate No. (%) Rate No. (%) Rate No. (%) Rate No. (%) Rate
FEMALE
2005 46 14.3 3.6 120 37.3 29.1 103 32.0 5.2 12 3.7 2.1 5 1.6 . 322 100.0 6.72006 28 9.2 2.1 113 36.9 27.3 130 42.5 6.2 6 2.0 1.0 1 0.3 . 306 100.0 6.32007 23 10.0 1.7 105 45.5 25.0 77 33.3 3.6 7 3.0 1.1 1 0.4 . 231 100.0 4.72008 18 9.0 1.4 77 38.7 19.1 70 35.2 3.5 8 4.0 1.3 1 0.5 . 199 100.0 4.02009 23 13.2 1.8 47 27.0 11.8 79 45.4 4.0 5 2.9 0.9 0 0.0 . 174 100.0 3.5
1. Includes chlamydial PID, gonococcal PID, and non-chlamydial/non-gonococcal PID.2. Includes data for ethnicity reported as "Other", "Native American", and "Mixed Race."3. Includes cases reported as "Unknown" race/ethnicity.Note: if race/ethnicity was not specified, cases were prorated according to the distribution of cases for which race/ethnicity was specified. Rates were adjusted including the proratedcases. Therefore, these tables should be used only for race/ethnicity comparisons, not for overall totals or gender totals. Cumulative percentages may not equal 100% because of rounding. Cases from Pasadena and Long Beach were not included.
Table 8.2. Reported All Pelvic Inflammatory Disease (PID)1
Cases and Rates per 100,000 Female Population by Race/Ethnicity, Los Angeles County, 2005-2009
White Black Hispanic Asian-Pacific Total3Other2

Sexually Transmitted Disease Morbidity Report - 2009 (Volume 1) 70
1.8
11.8
4.0
0.9
0
2
4
6
8
10
12
14
White Black Hispanic Asian-Pacific
Ra
te p
er
10
0,0
00
po
pu
lati
on
Figure 8.2. Reported All PID Rates per 100,000 Female Population in Los Angeles County, by
Race/Ethnicity, 2009
Note: Adjusted for unknown race. Excludes cases in Long Beach and Pasadena

Sexually Transmitted Disease Morbidity Report - 2009 (Volume 1) 71
2005 2006 2007No. (%) Rate No. (%) Rate No. (%) Rate No. (%) Rate No. (%) Rate
SPA3/HD4
Antelope Valley (1) 24 7.5 14.0 21 6.9 12.1 12 5.2 6.7 15 7.5 8.2 14 8.0 7.6 Antelope Valley 24 7.5 14.0 21 6.9 12.1 12 5.2 6.7 15 7.5 8.2 14 8.0 7.6
East (7) 24 7.5 3.5 22 7.2 3.2 16 6.9 2.3 15 7.5 2.1 12 6.9 6.4 Bellflower 8 2.5 4.2 3 1.0 1.6 3 1.3 1.6 8 4.0 4.2 6 3.4 5.4 East Los Angeles 1 0.3 0.9 7 2.3 6.2 3 1.3 2.7 1 0.5 0.9 1 0.6 0.4 San Antonio 7 2.2 3.1 8 2.6 3.5 7 3.0 3.1 3 1.5 1.3 5 2.9 2.9 Whittier 8 2.5 4.8 4 1.3 2.4 3 1.3 1.8 3 1.5 1.8 0 0.0 0.0
Metro (4) 28 8.7 4.6 29 9.5 4.7 24 10.4 3.9 16 8.0 2.6 18 10.3 6.9 Central 10 3.1 5.7 11 3.6 6.3 6 2.6 3.5 4 2.0 2.3 3 1.7 1.7 Hollywood-Wilshire 11 3.4 4.2 12 3.9 4.5 6 2.6 2.3 6 3.0 2.3 6 3.4 0.5 Northeast 7 2.2 4.2 6 2.0 3.4 12 5.2 6.8 6 3.0 3.4 9 5.2 3.9
San Fernando (2) 69 21.4 6.4 59 19.3 5.5 47 20.3 4.3 41 20.6 3.7 49 28.2 20.7 East Valley 14 4.3 6.3 20 6.5 8.8 7 3.0 3.1 13 6.5 5.7 19 10.9 4.1 Glendale 9 2.8 4.9 6 2.0 3.3 2 0.9 1.1 6 3.0 3.3 5 2.9 0.6 San Fernando 20 6.2 8.5 14 4.6 6.1 25 10.8 10.9 13 6.5 5.6 16 9.2 8.5 West Valley 26 8.1 6.0 19 6.2 4.3 13 5.6 2.9 0.0 9 5.2 3.7
San Gabriel (3) 24 7.5 2.8 19 6.2 2.2 16 6.9 1.8 18 9.0 2.0 16 9.2 5.5 Alhambra 1 0.3 0.5 1 0.3 0.5 5 2.2 2.7 5 2.5 2.7 2 1.1 0.4 El Monte 7 2.2 3.0 2 0.7 0.8 4 1.7 1.7 3 1.5 1.2 4 2.3 2.7 Foothill 7 2.2 4.4 5 1.6 3.1 5 2.2 3.1 4 2.0 2.5 4 2.3 4.0 Pomona 9 2.8 3.1 11 3.6 3.8 2 0.9 0.7 6 3.0 2.1 6 3.4 6.6
South (6) 93 28.9 17.5 95 31.0 17.8 71 30.7 13.3 54 27.1 10.0 38 21.8 6.6 Compton 27 8.4 18.6 16 5.2 10.8 21 9.1 14.2 10 5.0 6.8 6 3.4 5.5 South 14 4.3 15.1 17 5.6 17.7 16 6.9 16.7 12 6.0 12.6 6 3.4 2.7 Southeast 10 3.1 12.0 13 4.2 14.7 11 4.8 12.5 9 4.5 10.2 10 5.7 4.2 Southwest 42 13.0 20.1 49 16.0 24.4 23 10.0 11.4 23 11.6 11.4 16 9.2 4.8
South Bay (8) 39 12.1 6.9 49 16.0 8.6 30 13.0 5.3 23 11.6 4.0 13 7.5 11.6 Harbor 3 0.9 2.9 6 2.0 5.7 8 3.5 7.5 2 1.0 1.9 2 1.1 2.2 Inglewood 23 7.1 10.4 31 10.1 13.8 17 7.4 7.6 19 9.5 8.5 5 2.9 4.5 Torrance 13 4.0 5.5 12 3.9 5.1 5 2.2 2.1 2 1.0 0.8 6 3.4 4.9 West (5) 17 5.3 5.1 10 3.3 3.0 9 3.9 2.7 13 6.5 3.9 10 5.7 6.8 West 17 5.3 5.1 10 3.3 3.0 9 3.9 2.7 13 6.5 3.9 10 5.7 6.8
Unknown 4 1.2 . 2 0.7 . 6 2.6 . 4 2.0 . 4 2.3 .
Total 322 6.7 306 6.3 231 4.7 199 4.0 174 3.5
1. Includes chlamydial PID, gonococcal PID, and non-chlamydial/non-gonococcal PID.2. Excludes cases from Pasadena (SPA 3) and Long Beach (SPA 8).3. Main categories.4. Subcategories.Note: Cumulative percentages may not equal 100% because of rounding.
Table 8.3. Reported All Pelvic Inflammatory Disease (PID)1 Cases and Rates
per 100,000 Female Population by Service Planning Area (SPA)2 and Health District (HD),
Los Angeles County, 2005-2009
2008 2009
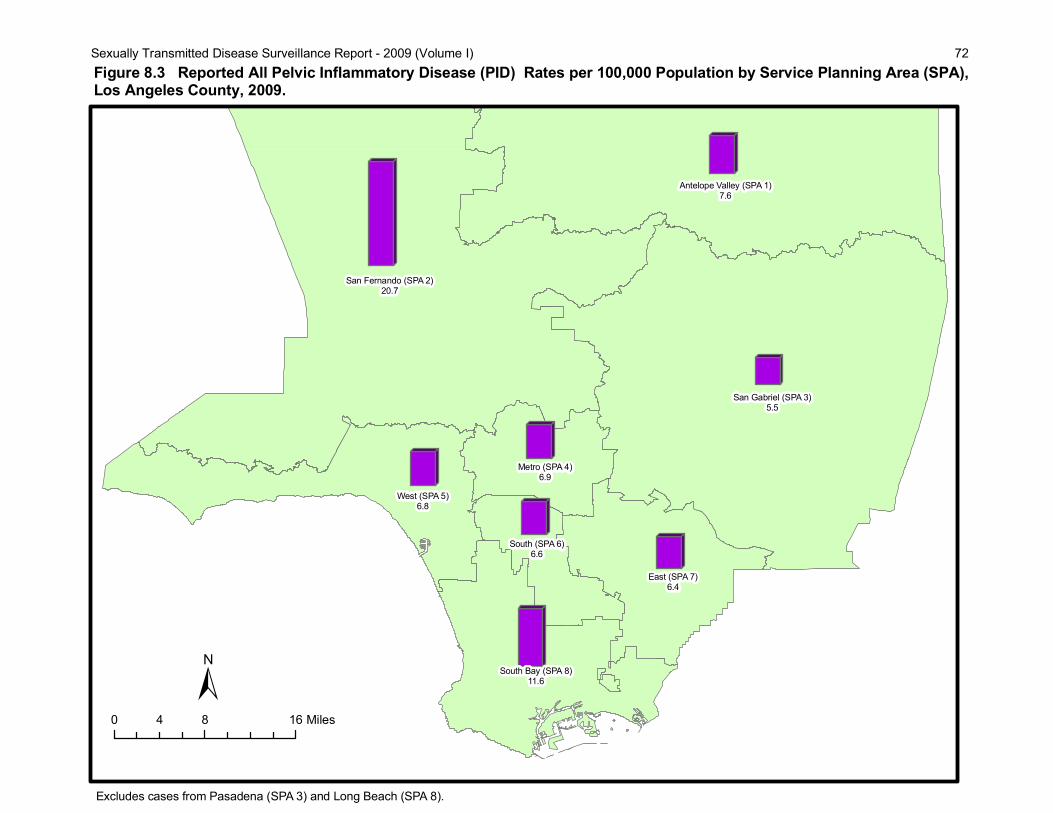
Sexually Transmitted Disease Surveillance Report - 2009 (Volume I) 72
0 8 164 Miles
Figure 8.3 Reported All Pelvic Inflammatory Disease (PID) Rates per 100,000 Population by Service Planning Area (SPA), Los Angeles County, 2009.
Excludes cases from Pasadena (SPA 3) and Long Beach (SPA 8).
Antelope Valley (SPA 1)7.6
East (SPA 7)6.4
Metro (SPA 4)6.9
San Fernando (SPA 2)20.7
San Gabriel (SPA 3)5.5
South (SPA 6)6.6
South Bay (SPA 8)11.6
West (SPA 5)6.8

Sexually Transmitted Disease Morbidity Report, 2009
Section IX: Technical Notes and Appendices

Sexually Transmitted Disease Morbidity Report – 2009 (Volume 1) IX-1
TECHNICAL NOTES Data Sources: Data on sexually transmitted disease (STD) in LAC are obtained through passive and active surveillance, and stored i n CaseWatch, a case management and surveill ance system. California law requires that positive laboratory results of S TDs and clinically ident ified suspected cases be reported to local health departments. Suspected and confirmed STD cases are reported confidentially to the California Department of He alth Services and the Centers for Disease Cont rol and Prevention (CDC) as required by California Code of Regulations (Section 2500 and Section 2505).
1. The STD case definitions are based on the CDC Sexually Transmitted Disease Surveillance 2008 at: http://www.cdc.gov/std/stats08/app-casedef.htm.
2. Passive surveillance relies on physicians, laboratories, and other healthcare providers to report STDs to the Department of Public Health (DPH) b y submitting the Confidential Morbidity Report (CMR) form by telephone, fax, or online.
3. Active surveillance ent ails STD staff regularly contacting hospitals, laboratories, physicians, and other health providers in an effort to identify all cases of a given STD. In addition, STD staff contact schools, hospitals, jails, student health centers, and sentinel physicians and clinics to collect reports of STDs.
4. CaseWatch is an open system for ongoing data collection and updating. With a b ase of live data, the results of this report are snapshots of CaseWatch System for September 2010, the time the report was prepared. Therefore, the impact of reporting updates must be considered.
5. The population data is prepared by Walter R. McDonald & Associates, Inc. (WRMA) for Urban Research, Los A ngeles County Chief Administratio n Office an d released in July 2010 by the Office of Health Assessment a nd Epidemiology, Los Angeles County Department of Public Health. The new birth pop ulation data is obtained from the Office of Health Assessment and Epidemiology, Los Angeles County Depart ment of Pu blic Health.
Data Codes: The table below lists the SAS codes for the CaseWatch data that were used to define each STD and related demographics in this report:
Subject SAS Code Interpretation Diagnosis Year (DYEAR) If DYEAR in
(2005, 2006, 2007, 2008, 2009)
Years based on CDC calendar.
Chlamydia All Sub-datasets from ‘CT2005’ to ‘CT2009’. Gonorrhea All Sub-datasets from ‘GC2005’ to ‘GC2009’. Syphilis (Primary and Secondary)
If DIAGNOS in (2, 3, 56*3, 3*56)
Sub-datasets from ‘SY2005’ to ‘SY2009’: 2=”Primary (421)”; 3=”Secondary (422)”; 56=”Neurosyphilis (770)”.
Syphilis (Early Latent)
If DIAGNOS in (4, 56*4, 4*56)
Sub-datasets from ‘SY2005’ to ‘SY2009’: 4=”Early Latent (423)”; 56=”Neurosyphilis (770)”.
Syphilis (Late and Late Latent)
If DIAGNOS in (1, 6, 14, 16, 17, 55, 56*6, 6*56, 55*56, 56*55)
Sub-datasets from ‘SY2005’ to ‘SY2009’: 1=”Type Not Specified”; 6=”Late Latent (424)”; 14=”Neurosyphilis-Late Sympotomatic (426)”; 16=”Benign Late Symptomatic (427)”; 17=”Other-Late Symptomatic (427)”;

Sexually Transmitted Disease Morbidity Report – 2009 (Volume 1) IX-2
55=”Latent Unknown Duration (488)”; 56=”Neurosyphilis (770)”.
Congenital Syphilis If DIAGNOS in (10)
Sub-datasets from ‘SY2005’ to ‘SY2009’: 10=”Congenital-Presumptive (436)”;
Pelvic Inflammator y Disease ( PID, including Chlamydial, Non-Chlamydial, Gonococcal and NonGonococcal.)
If DIAGNOS in (30, 38); Plus all fro m sub-datasets PID2004 to PID2008
Sub-datasets from ‘CT2005’ to ‘CT2009’: 30=”Chlamydial PID”; Sub-datasets from ‘GC2005’ to ‘GC2009’: 38=”Gonococcal PID”; Sub-datasets from PID2005 to PID2009.
Incident of EPI Trea ted (MORB)
If MORB='N' Then delete;
All datasets: Excluding t hose CT an d GC case s with EPI treated.
Age Group (AGENUM) If AGENUM in (missing, 0 , 1, 2, ….)
All datasets: 0<=AGENUM<=14 means ”0-14 years old”; 15<=AGENUM<=19 means ”15-19 years old”; 20<=AGENUM<=24 means ”20-24 years old”; 25<=AGENUM<=29 means ”25-29 years old”; 30<=AGENUM<=34 means ”30-34 years old”; 35<=AGENUM<=44 means ”35-44 years old”; 45<=AGENUM<=54 means ”45-54 years old”; 55<=AGENUM<=64 means ”55-64 years old”; 65<=AGENUM<=115 means ”65+ years old”; 116<=AGENUM, missing means ”Unknown”.
Gender (CWSEX) If CWSEX in (1, 2, 7, 9)
All datasets: 1, 9=”Male”; 2, 7=”Female”.
Race/Ethnicity (ETHNIC) If ETHNIC in (1, 2, 3, 4, 5, 6, 7, 8, 9)
All datasets: 1=”White”; 2=”Black” ; 7=”Hispanic”; 3, 8=”Asian/Pacific Islander”; 4, 5, 9=”Other”; 6=”Unknown”.
Service Planning A rea (SPA)
If SPA in (1, 2, 3, 4, 5, 6, 7, 8, 9)
All datasets: 1=”Antelope Valley”; 2=”San Fernando Valley”; 3=”San Gabriel”; 4=”Metro”; 5=”West”; 6=”South”; 7=”East”; 8=”South Bay”; 9=”Unknown”.
Health District (RES) If RES in (‘016’,’025’) then delete;
All datasets: Excluding Long Beach and Pasadena. '000' ='Antelope Valley'; '001'='Alhambra'; '002' ='Central'; '003' ='East LA'; '004' ='El Monte'; '005' ='Foothill'; '006' ='Northeast'; '007' ='Pomona';

Sexually Transmitted Disease Morbidity Report – 2009 (Volume 1) IX-3
'008' ='Whittier'; '009' ='East Valley'; '010' ='Glendale'; '011' ='Hollywood Wilshire'; '012' ='San Fernando'; '013' ='West Valley'; '014' ='Bellflower'; '015' ='Compton'; '017' ='San Antonio'; '018' ='South'; '019' ='Southeast'; '020' ='Harbor'; '021' ='Inglewood'; '022' ='Southwest'; '023' ='Torrance'; '024' ='West'.
L.A. County Jurisdiction (LAMORB) and/or Out of Jurisdiction (OOJYN)
If LAMORB=2 or (LAMORB=. and OOJYN='Y') or (LAMORB=0 and OOJYN='Y') or (LAMORB=9 and OOJYN='Y') Then delete;
All datasets: Excluding those cases not in L. A. county jurisdiction.
EPI treat cases prior to diagnosis
If MORB=’N’ Then delete;
All datasets: Excluding those EPI treatment cases.
Data Limitations: The data tables in the STD Annual Morbidity Report should be interpreted considering the following notable limitations: 1. Underreporting. The proportion of cases th at are not reported varies for each disease. Syphilis surveillance includes both passive and active surve illance, with detailed follow-up of cases and their se xual partners. Thus, un derreporting of early syphilis cases is minimize d. Due to the acuteness of symptoms for gonorrhea infection, individuals are more like ly to seek treatment, an d therefore cases are more likely to be reported. On the other hand, chlamydia infe ctions are often asymptomatic and there fore are mo re likely to be undiagn osed and u nderreported. In addition, some healthcare providers may not be aware of their legal requirements to report STDs. 2. Report Delay. Re port delay is defined as the time interval between the date an ST D diagnosis was made and the date t he case wa s reported t o the Healt h Departme nt. This de lay varies by STD, ranging from 1 day to 1 year or more. Therefore, the impact of report delay must be considered when evaluating trends in case numbers and rates over time. Report delay is especially important when evaluating early syphilis data, due to delays in assigning diagnosis while the case is under investigation. 3. Reliability of Rates. All vital statistic rates includ ing morbidity rates are subject to random variation. This variation is inversely related to the number of cases used to calculate rates. A small number of cases can resu lt in highly unstable rat es or proportions. To account for this instability, all rates in this Annual Morbidity Report based o n less th an 20 events are consider ed “unreliable”. This translates into a relative standard error o f the rate of 23% or more, which is the cutoff rate reliably used by the National Center for Health Statistics. Therefore, rates in this report based on less than 20 events should be evaluated with caution. 4. Morbidity date versus Report date. So me STD cases occurring in 2009 were not reported unt il after the 2 009 STD Annual Repor t was completed. Ther efore, slight differences in

Sexually Transmitted Disease Morbidity Report – 2009 (Volume 1) IX-4 numbers of cases and rates for d iseases for 2009 may be observed in the 2010 report. Any such disparities are likely to be small. Though not accounted for in censu s data, visit ors and other non-resid ents may h ave an effect on STD disease occurrence. 5. Place of acquisition of infection. So me cases of STDs reported in this Annual Morbidity Report may have been acquired outside the county. Therefore, most disease rates more accurately reflect the place of diagnosis than the location where a n infection was acquired. However, e very effort i s made in early syphilis cases to determine where the i nfection act ually occurred, in order to more effectively investigate and control the spread of disease . Early syp hilis cases determined to have been acquired outside LAC jurisdiction are not included in this report. 6. Jurisdiction. This re port does not include cases identified by Long Beach or Pasadena Health Departments. Cases from these jurisdic tions ar e reported directly to the California Department of Health Services and to the CDC. Rates:
Rate per 100,000 population = (# of cases / population) x 100,000 1. Adjusted Rate. Rates appearing in the race/ethnicity related tables were adjusted for the unknown race/ethnicity. If race/ethnicity was not specified , cases were prorated according to t he distribution of cases fo r which race/ethnicity was specified. Rates were adjusted including th e prorated cases.
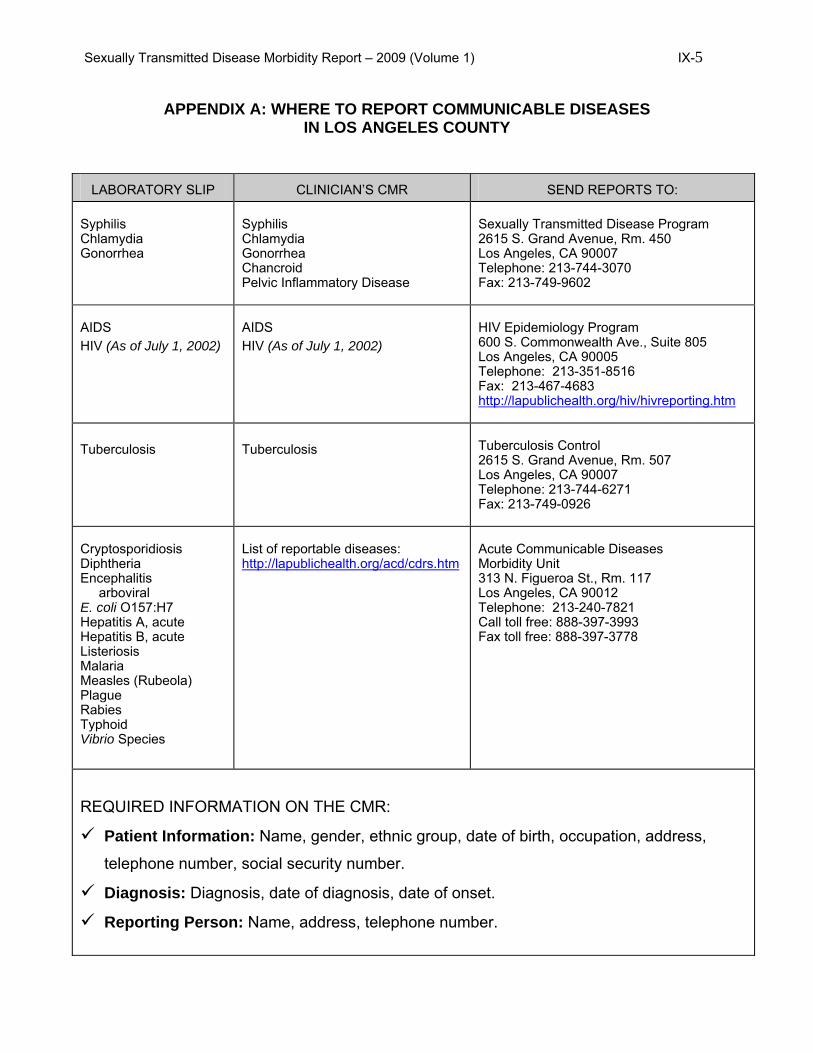
Sexually Transmitted Disease Morbidity Report – 2009 (Volume 1) IX-5
APPENDIX A: WHERE TO REPORT COMMUNICABLE DISEASES IN LOS ANGELES COUNTY
LABORATORY SLIP
CLINICIAN’S CMR
SEND REPORTS TO:
Syphilis Chlamydia Gonorrhea
Syphilis Chlamydia Gonorrhea Chancroid Pelvic Inflammatory Disease
Sexually Transmitted Disease Program 2615 S. Grand Avenue, Rm. 450 Los Angeles, CA 90007 Telephone: 213-744-3070 Fax: 213-749-9602
AIDS HIV (As of July 1, 2002)
AIDS HIV (As of July 1, 2002)
HIV Epidemiology Program 600 S. Commonwealth Ave., Suite 805 Los Angeles, CA 90005 Telephone: 213-351-8516 Fax: 213-467-4683 http://lapublichealth.org/hiv/hivreporting.htm
Tuberculosis
Tuberculosis
Tuberculosis Control 2615 S. Grand Avenue, Rm. 507 Los Angeles, CA 90007 Telephone: 213-744-6271 Fax: 213-749-0926
Cryptosporidiosis Diphtheria Encephalitis arboviral E. coli O157:H7 Hepatitis A, acute Hepatitis B, acute Listeriosis Malaria Measles (Rubeola) Plague Rabies Typhoid Vibrio Species
List of reportable diseases: http://lapublichealth.org/acd/cdrs.htm
Acute Communicable Diseases Morbidity Unit 313 N. Figueroa St., Rm. 117 Los Angeles, CA 90012 Telephone: 213-240-7821 Call toll free: 888-397-3993 Fax toll free: 888-397-3778
REQUIRED INFORMATION ON THE CMR:
Patient Information: Name, gender, ethnic group, date of birth, occupation, address,
telephone number, social security number.
Diagnosis: Diagnosis, date of diagnosis, date of onset.
Reporting Person: Name, address, telephone number.

Title 17, California Code of Regulations (CCR) §2500, §2593, §2641.5-2643.20, and §2800-2812 Reportable Diseases and Conditions*
§ 2500. REPORTING TO THE LOCAL HEALTH AUTHORITY.● § 2500(b) It shall be the duty of every health care provider, knowing of or in attendance on a case or suspected case of any of the diseases or condition listed below,
to report to the local health officer for the juridiction where the patient resides. Where no health care provider is in attendance, any individual having knowledge of aperson who is suspected to be suffering from one of the diseases or conditions listed below may make such a report to the local health officer for the jurisdiction where the patient resides.
● § 2500(c) The administrator of each health facility, clinic, or other setting where more than one health care provider may know of a case, a suspected case or an outbreak of disease within the facility shall establish and be responsible for administrative procedures to assure that reports are made to the local officer.
● § 2500(a)(14) "Health care provider" means a physician and surgeon, a veterinarian, a podiatrist, a nurse practitioner, a physician assistant, a registered nurse, a nursemidwife, a school nurse, an infection control practitioner, a medical examiner, a coroner, or a dentist.
URGENCY REPORTING REQUIREMENTS [17 CCR §2500(h)(i)]✆ ✆ =Report immediately by telephone (designated by a ♦ in regulations).
† =Report immediately by telephone when two or more cases or suspected cases of foodborne disease from separate households are suspected to have the same sourceof illness (designated by a ● in regulations.)
FAX ✆ ✉ =Report by electronic transmission (including FAX), telephone, or mail within one working day of identification (designated by a + in regulations). =All other diseases/conditions should be reported by electronic transmission (including FAX), telephone, or mail within seven calendar days of identification
REPORTABLE COMMUNICABLE DISEASES §2500(j)(1)
Acquired Immune Deficiency Syndrome (AIDS) FAX ✆ ✉ Poliovirus Infection (HIV infection only: see "Human Immunodeficiency Virus") FAX ✆ ✉ Psittacosis
FAX ✆ ✉ Amebiasis FAX ✆ ✉ Q Fever
Anaplasmosis/Ehrlichiosis ✆ ✆ Rabies, Human or Animal✆ ✆ Anthrax FAX ✆ ✉ Relapsing Fever✆ ✆ Avian Influenza (human) Rheumatic Fever, Acute
FAX ✆ ✉ Babesiosis Rocky Mountain Spotted Fever
✆ ✆ Botulism (Infant, Foodborne, Wound) Rubella (German Measles)
✆ ✆ Brucellosis Rubella Syndrome, CongenitalFAX ✆ ✉ Campylobacteriosis FAX ✆ ✉ Salmonellosis (Other than Typhoid Fever)
Chancroid ✆ ✆ Scombroid Fish PoisoningFAX ✆ ✉ Chickenpox (only hospitalizations and deaths) ✆ ✆ Severe Acute Respiratory Syndrome (SARS)
Chlamydia trachomatis infections, including Lymphogranuloma Venereum (LGV) ✆ ✆ Shiga toxin (detected in feces)
✆ ✆ Cholera FAX ✆ ✉ Shigellosis✆ ✆ Ciguatera Fish Poisoning ✆ ✆ Smallpox (Variola)
Coccidioidomycosis FAX ✆ ✉ Staphylococcus aureus infection (only a case resulting in death or admission to anFAX ✆ ✉ Colorado Tick Fever intensive care unit of a person who has not been hospitalized or had surgery, dialysis,
Creutzfeldt-Jakob Disease (CJD) and other Transmissible Spongiform or residency in a long-term care facility in the past year, and did not have an indwelling
Encephalopathies (TSE) catheter or percutaneous medical device at the time of culture)FAX ✆ ✉ Cryptosporidiosis FAX ✆ ✉ Streptococcal Infections (Outbreaks of Any Type and Individual Cases in Food
Cysticercosis or Taeniasis Handlers and Dairy Workers Only)
✆ ✆ Dengue FAX ✆ ✉ Syphilis✆ ✆ Diphtheria Tetanus
✆ ✆ Domoic Acid Poisoning (Amnesic Shellfish Poisoning) Toxic Shock SyndromeFAX ✆ ✉ Encephalitis, Specify Etiology: Viral, Bacterial, Fungal, Parasitic FAX ✆ ✉ Trichinosis
✆ ✆ Escherichia coli : shiga toxin producing (STEC) including E. coli O157 FAX ✆ ✉ Tuberculosis † FAX ✆ ✉ Foodborne Disease ✆ ✆ Tularemia
Giardiasis FAX ✆ ✉ Typhoid Fever, Cases and Carriers
Gonococcal Infections Typhus FeverFAX ✆ ✉ Haemophilus influenzae invasive disease (report an incident FAX ✆ ✉ Vibrio Infections
less than 15 years of age) ✆ ✆ Viral Hemorrhagic Fevers (e.g., Crimean-Congo, Ebola, Lassa, and Marburg viruses)
✆ ✆ Hantavirus Infections FAX ✆ ✉ Water-Associated Disease (e.g., Swimmer's Itch or Hot Tub Rash)✆ ✆ Hemolytic Uremic Syndrome FAX ✆ ✉ West Nile Virus (WNV) Infection
Hepatitis, Viral ✆ ✆ Yellow Fever FAX ✆ ✉ Hepatitis A FAX ✆ ✉ Yersiniosis
Hepatitis B (specify acute case or chronic) ✆ ✆ OCCURRENCE of ANY UNUSUAL DISEASE
Hepatitis C (specify acute case or chronic) ✆ ✆ OUTBREAKS of ANY DISEASE (Including diseases not listed in §2500). Specify if
Hepatitis D (Delta) institutional and/or open community.
Hepatitis, other, acute Influenza deaths (report an incident of less than 18 years of age) HIV REPORTING BY HEALTH CARE PROVIDERS §2641.5-2643.20
Kawasaki Syndrome (Mucocutaneous Lymph Node Syndrome) Human Immunodeficiency Virus (HIV) infection is reportable by traceable mail or person-to-person
Legionellosis transfer within seven calendar days by completion of the HIV/AIDS Case Report form (CDPH 8641A)
Leprosy (Hansen Disease) available from the local health department. For completing HIV-specific reporting requirements, see
Leptospirosis Title 17, CCR, §2641.5-2643.20 and http://www.cdph.ca.gov/programs/aids/Pages/OAHIVReporting.aspxFAX ✆ ✉ Listeriosis
Lyme Disease REPORTABLE NONCOMMUNICABLE DISEASES AND CONDITIONS §2800–2812 and §2593(b) FAX ✆ ✉ Malaria Disorders Characterized by Lapses of Consciousness (§2800-2812)FAX ✆ ✉ Measles (Rubeola) Pesticide-related illness or injury (known or suspected cases)** FAX ✆ ✉ Meningitis, Specify Etiology: Viral, Bacterial, Fungal, Parasitic Cancer, including benign and borderline brain tumors (except (1) basal and squamous skin cancer
✆ ✆ Meningococcal Infections unless occurring on genitalia, and (2) carcinoma in-situ and CIN III of the cervix) (§2593)***Mumps
✆ ✆ Paralytic Shellfish Poisoning LOCALLY REPORTABLE DISEASES (If Applicable): Pelvic Inflammatory Disease (PID)
FAX ✆ ✉ Pertussis (Whooping Cough)
✆ ✆ Plague, Human or Animal
* This form is designed for health care providers to report those diseases mandated by Title 17, California Code of Regulations (CCR). Failure to report is a misdemeanor (Heatlh and
Safety Code §120295) and is a citable offense under the Medical Board of California Citation and Fine Program (Title 16, CCR, §1364.10 and 1364.11).
** Failure to report is a citable offense and subject to civil penalty ($250) (Health and Safety Code §105200).*** The Confidential Physician Cancer Reporting Form may also be used. See Physician Reporting Requirements for Cancer Reporting in CA at: www.ccrcal.org
PM110 (revised 12/08/09)
State of Califonria - Health and Human Sevices Agency Department of Public Health