Los Alamos National Laboratory/University of California ... Alamos National Labs/TA 21/10693.pdf ·...
181
Los Alamos National Laboratory/University of California Risk Reduction & Environmental Stewardship (RRES) Remediation (R) Program, MS M992 National Nuclear Security Administration. Los Alamos Site Operations, MS A316 Environmental Restoration Program Los Alamos, New Mexico 87545 Los Alamos, New Mexico 87544 (505) 667-0808/FAX (505) 665-4747 (505) 667-7203/FAX (505) 665-4504 Date: May 7, 2003 Refer to: ER2003-0324 Mr. John Young, Corrective Action Project Leader Permits Management Program NMED- Hazardous Waste Bureau 2905 Rodeo Park Drive East Building 1 Santa Fe, NM 87505-6303 SUBJECT: RESUBMITT AL OF REVISION 3 OF THE VOLUNTARY CORRECTIVE MEASURES (VCM) PLAN FOR SOLID WASTE MANAGEMENT UNIT (SWMU) 21-011(k), AT TECHNICAL AREA (TA) 21 Dear Mr. Young: Enclosed please find two copies of the "VCM Plan for SWMU 21-011 (k) at T A 21, Revision 3". The revised VCM Plan is submitted in response to the New Mexico Environment Department Hazardous Waste Bureau (NMED-HWB) letter regarding "Comments and Conditions for Notice of Deficiency Response, SWMU 21-011 (k) VCM Plan" (HWB-Facility-02-020). The Los Alamos National Laboratory's (LANL) Risk Reduction and Environmental Stewardship Remediation Program has incorporated comments, where applicable, from the NMED-HWB Notice of Deficiency (NOD) and LANL's Response to the NOD (ER2003-0040) into the revised VCM plan. Attachments 1 through 3 are not included with the revised plan since they have not changed. If you have any questions, please contact Mark Thacker at (505) 667-5342 or Woody Woodworth at (505) 667-5820. Sim David Mcinroy, Actin Prog m Manager Remediation Program Los Alamos National Laboratory DM/ET/PB/vn Sincerely, _j/__:_f7( David Gregory, Project Manager Department of Energy Los Alamos Site Operations Enclosure: VCM Plan for SWMU 21-011 (k) at T A-21, Revision 3 ,4, "' Los Alamos An Equal Opportunity Employer/Operated by the Universi "J>I I'IJ, ',,1 11111111111111111111111111111111111 · ,:' Printed on Recycled Paper 10693
Transcript of Los Alamos National Laboratory/University of California ... Alamos National Labs/TA 21/10693.pdf ·...
Los Alamos National Laboratory/University of California Risk Reduction & Environmental Stewardship (RRES) Remediation (R) Program, MS M992
National Nuclear Security Administration. Los Alamos Site Operations, MS A316 Environmental Restoration Program
Los Alamos, New Mexico 87545 Los Alamos, New Mexico 87544 (505) 667-0808/FAX (505) 665-4747 (505) 667-7203/FAX (505) 665-4504
Date: May 7, 2003 Refer to: ER2003-0324
Mr. John Young, Corrective Action Project Leader Permits Management Program NMED- Hazardous Waste Bureau 2905 Rodeo Park Drive East Building 1 Santa Fe, NM 87505-6303
SUBJECT: RESUBMITT AL OF REVISION 3 OF THE VOLUNTARY CORRECTIVE MEASURES (VCM) PLAN FOR SOLID WASTE MANAGEMENT UNIT (SWMU) 21-011(k), AT TECHNICAL AREA (TA) 21
Dear Mr. Young:
Enclosed please find two copies of the "VCM Plan for SWMU 21-011 (k) at T A 21, Revision 3". The revised VCM Plan is submitted in response to the New Mexico Environment Department Hazardous Waste Bureau (NMED-HWB) letter regarding "Comments and Conditions for Notice of Deficiency Response, SWMU 21-011 (k) VCM Plan" (HWB-Facility-02-020). The Los Alamos National Laboratory's (LANL) Risk Reduction and Environmental Stewardship Remediation Program has incorporated comments, where applicable, from the NMED-HWB Notice of Deficiency (NOD) and LANL's Response to the NOD (ER2003-0040) into the revised VCM plan. Attachments 1 through 3 are not included with the revised plan since they have not changed.
If you have any questions, please contact Mark Thacker at (505) 667-5342 or Woody Woodworth at (505) 667-5820.
Sim David Mcinroy, Actin Prog m Manager Remediation Program Los Alamos National Laboratory
DM/ET/PB/vn
Sincerely,
_j/__:_f7( 4~ David Gregory, Project Manager Department of Energy Los Alamos Site Operations
Enclosure: VCM Plan for SWMU 21-011 (k) at T A-21, Revision 3
,4, "' Los Alamos An Equal Opportunity Employer/Operated by the Universi
"J>I I'IJ, ',,1 11111111111111111111111111111111111 · ,:' Printed on Recycled Paper 10693

Mr. John Young EA2003-0324
Cy:(w/enc) P. Bertino, ARES-A, MS M992 M. Thacker, ARES-A, MS M992 N. Quintana, ARES-A, MS M992 M. Wetovsky, ARES-A MS M992 D. Gregory, LASO, MS A316 W. Woodworth, LASO, MS A316 S. Yanicak, NMED-OB L. King, EPA Region 6 CT File #C893, MS M992 IM-5, MS A150 RPF MS M707
Cy:(w/o enclosure) D. Mcinroy, ARES-A, MS M992 B. Ramsey, ARES-DO, MS J591 J. Bearzi, NMED-HWB J. Davis, NMED-SWB J. Parker, NMED-OB ARES-A File, MS M992
JJ-,
-2-
<ilosAiamos An Equal Opportunity Employer/Operated by the University of California
' ',:'·Printed on Recycled Paper
May 7, 2003
--------------
UBRARVCOpy
LA-UR-03-3026 May 2003
ER2003-0326
Voluntary Corrective Measures Plan
for Solid Waste Management
Unit 21 -0 1 1 (k) at
- Technical Area 21 -
Revision 3 ---IIIII
~Alamos NATIONAL LABORATORY
Los Alamos NM 87545 ...

Prepared by Risk Reduction and Environmental Stewardship-Remediation
Los Alamos National Laboratory, an affirmative action/equal opportunity employer, is operated by the University of California for the United States Department of Energy under contract W-7405-ENG-36.
This report was prepared as an account of work sponsored by an agency of the United States Government. Neither the Regents of the University of California, the United States Government nor any agency thereof, nor any of their employees make any warranty, express or implied, or assume any legal liability or responsibility for the accuracy, completeness, or usefulness of any information, apparatus, product, or process disclosed, or represent that its use would not infringe privately owned rights. Reference herein to any specific commercial product, process, or service by trade name, trademark, manufacturer, or otherwise does not necessarily constitute or imply its endorsement, recommendation, or favoring by the Regents of the University of California, the United States Government, or any agency thereof.
Los Alamos National Laboratory strongly supports academic freedom and a researcher's right to publish; as an institution, however, the Laboratory does not endorse the viewpoint of a publication or guarantee its technical correctness. By acceptance of this article, the publisher recognizes that the U.S. Government retains a nonexclusive, royalty-free license to publish or reproduce the published form of this contribution, or to allow others to do so, for U.S. Government purposes. Los Alamos National Laboratory requests that the publisher identify this article as work performed under the auspices of the U.S. Department of Energy.

---
-------------· ••
--... ...
Ill'•
111111
EXECUTIVE SUMMARY
This Voluntary Corrective Measure (VCM) plan presents the approach for remediation of Solid Waste Management Unit (SWMU) 21-011 (k) located within Technical Area (TA) 21 at Los Alamos National Laboratory (LANL or the Laboratory).
SWMU 21-011 (k) consists of an inactive National Pollutant Discharge Elimination System (NPDES)permitted outfall (NPDES outfall no. EPA 050050) for treated industrial wastewater from the former wastewater treatment plants (WWTPs) (Buildings 21-35 and -157) at TA-21. Components of the SWMU include a 4-in. cast iron drainline and outfall area on the north-facing slope of DP Canyon. The initial drainline from holding tanks 21-112 and -113 consisted of a 4-in. vitrified-clay pipe (VCP) that reportedly discharged to an "outfall ditch" excavated into soil and tuff (LANL 1991, 07528.1 ). The VCP was replaced in 1976 with a 4-in. cast iron drainline that was installed within the VCP drain line excavation and outfall ditch. The discharge end of the 4-in. cast iron drainline is located approximately 80ft north of the TA-21 perimeter road where the outfall ditch previously ended. A gently sloping, rocky surface extends from the end of the outfall drainline approximately 30 ft to the south rim of DP Canyon. The effluent discharged at SWMU 21-011 (k) was comprised of process wastewater generated from the purification of plutonium and contained a variety of radioactive and chemical constituents. SWMU 21-011 (k) received industrial effluent from the WWTP in Building 21-35 from 1952 until1967 and from the WWTP in Building 21-257 (that replaced the treatment plant at Building 21-35) from 1967 to July 1986 (LANL 2002, 73115). The inactive outfall was not included in the subsequent LANL NPDES permit renewal, which took effect in 1994. The drain line was not plugged until January 2001 (LANL 2001, 72667).
SWMU 21-011 (k) was investigated in 1988 by the Department of Energy (DOE) and by the Laboratory's Environmental Restoration (ER) Project in 1992 and 1993 after use of the outfall had been discontinued. Previous investigation results indicated the presence of radionuclide contamination. An interim action (lA) was performed in 1996 to 1) divert storm water away from the outfall area, and 2) remove a portion of the radionuclide source term from the hillside by excavating and removing the most highly contaminated soil with activity exceeding the gross gamma level of approximately 100,000 counts per minute (cpm). Approximately 390 yd 3 of radioactively contaminated soil was removed from the site and disposed of at the Laboratory's low-level radioactive waste landfill, Area Gat TA-54. Post-excavation radiation survey and soil sampling showed a reduction in gross gamma count levels from greater than 500,000 cpm to 100,000 cpm. The lA Report recommended the development of a VCM to effect a final remedy at the site (LANL 1997, 55648.2).
In November 2000, an extensive in situ gamma spectrometry survey was conducted over the entire site. In March 2001, 48 surface and subsurface soil, tuff, and/or sediment samples were collected from eleven of the in situ gamma survey locations. Twenty-six of the samples were analyzed specifically for waste characterization purposes. The other 22 samples were used to characterize contaminant distribution with depth. The data from the in situ gamma survey and characterization samples was used to confirm the location of remaining areas within the boundary of SWMU 21-011(k) with concentrations above the VCM target cleanup level of 150 picocuries per gram (pCi/g) of cesium-137 (Cs-137), and establish a correlation between Cs-137 concentrations, the primary radionuclide at the site, and the concentrations of other radionuclides present at the site. Review of the data from the November 2000 and March 2001 sampling events indicate the following:
• Based on the average concentration of radionuclides present, the site meets dose criterion protective of an individual using the area for recreational trail use. However, there are areas where the target cleanup levels described in this plan of 150 pCi/g Cs-137 and 170 pCi!g americium-241 (Am-241) in the western drainage are exceeded.
ER2003-0326 iii May 2003
VCM Plan forSWMU 21-011(k), Rev. 3
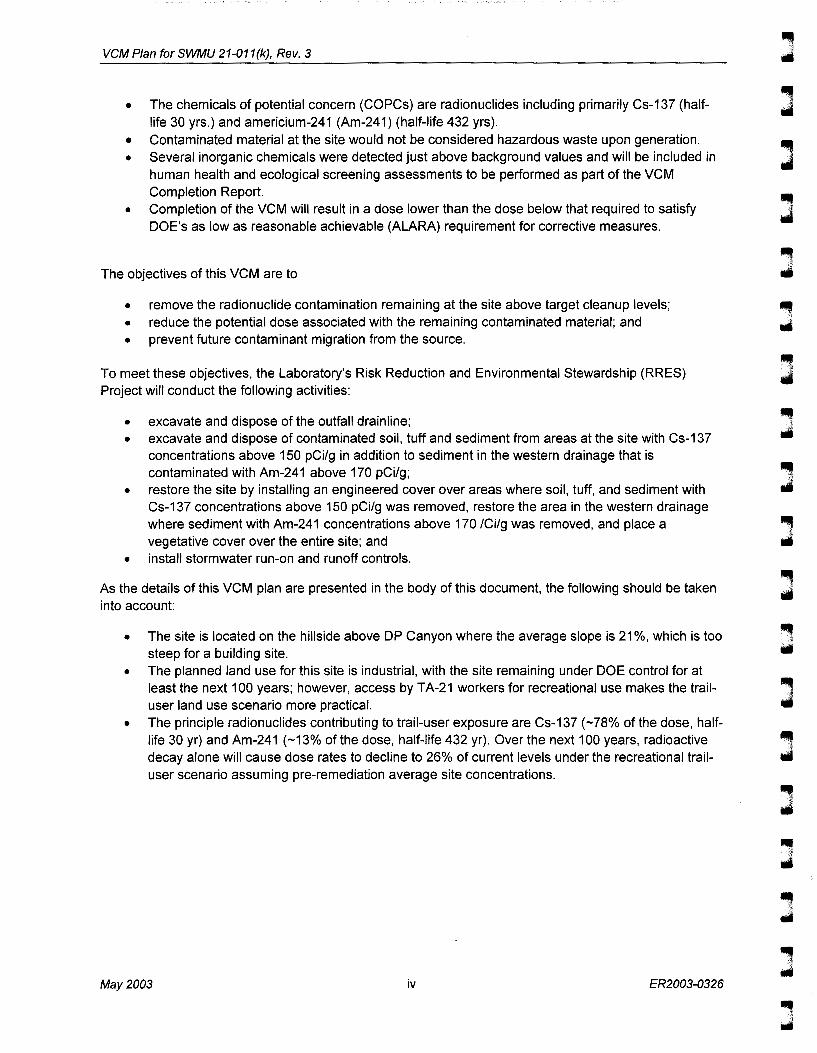
• The chemicals of potential concern (COPCs) are radionuclides including primarily Cs-137 (halflife 30 yrs.) and americium-241 (Am-241) (half-life 432 yrs).
• Contaminated material at the site would not be considered hazardous waste upon generation. • Several inorganic chemicals were detected just above background values and will be included in
human health and ecological screening assessments to be performed as part of the VCM Completion Report.
• Completion of the VCM will result in a dose lower than the dose below that required to satisfy DOE's as low as reasonable achievable (ALARA) requirement for corrective measures.
The objectives of this VCM are to
• remove the radionuclide contamination remaining at the site above target cleanup levels; • reduce the potential dose associated with the remaining contaminated material; and • prevent future contaminant migration from the source.
To meet these objectives, the Laboratory's Risk Reduction and Environmental Stewardship (RRES) Project will conduct the following activities:
• excavate and dispose of the outfall drain line; • excavate and dispose of contaminated soil, tuff and sediment from areas at the site with Cs-137
concentrations above 150 pCi/g in addition to sediment in the western drainage that is contaminated with Am-241 above 170 pCi/g;
• restore the site by installing an engineered cover over areas where soil, tuff, and sediment with Cs-137 concentrations above 150 pCi/g was removed, restore the area in the western drainage where sediment with Am-241 concentrations above 170 /Ci/g was removed, and place a vegetative cover over the entire site; and
• install stormwater run-on and runoff controls.
As the details of this VCM plan are presented in the body of this document, the following should be taken ~ into account:
• The site is located on the hillside above DP Canyon where the average slope is 21%, which is too steep for a building site.
• The planned land use for this site is industrial, with the site remaining under DOE control for at least the next 100 years; however, access by TA-21 workers for recreational use makes the trailuser land use scenario more practical.
• The principle radionuclides contributing to trail-user exposure are Cs-137 ( -78% of the dose, halflife 30 yr) and Am-241 (-13% of the dose, half-life 432 yr). Over the next 100 years, radioactive decay alone will cause dose rates to decline to 26% of current levels under the recreational trailuser scenario assuming pre-remediation average site concentrations.
May 2003 iv ER2003-0326
, •

---------
--------
TABLE OF CONTENTS
EXECUTIVE SUMMARY ............................................................................................................................. 111
1.0 INTRODUCTION ...............................................................•............................•................................. 1 1.1 Purpose and Scope ................................................................................................................ 1 1.2 Regulatory History .................................................................................................................. 4 1.3 Rationale for Proposed Corrective Measure .......................................................................... 5
2.0 PREVIOUS SITE CHARACTERIZATION AT SWMU 21-011(K) .................................................... 6 2.1 Site Description and Operational History ............................................................................... 6 2.2 Previous Field Investigations .................................................................................................. 7
3.0 BASIS FOR CLEANUP LEVELS .................................................................................................. 16
4.0 PROPOSED VOLUNTARY CORRECTIVE MEASURE ................................................................ 18 4.1 Conceptual Model. ................................................................................................................ 18 4.2 Supplemental Sampling ....................................................................................................... 20 4.3 Remedial Approach .............................................................................................................. 22
5.0 CONFIRMATION SURVEYS AND SAMPLING ............................................................................ 25 5.1 Confirmation Sampling beneath the Outfall Drainline at SWMU 21-011(k) ......................... 25 5.2 Confirmation Surveys and Sampling of Soil Removal Areas ............................................... 26 5.3 Short-Term Maintenance and Monitoring ............................................................................. 27
6.0 WASTE MANAGEMENT ............................................................................................................... 27 6.1 Estimated Types and Volumes of Waste ............................................................................. 27 6.2 Method of Management and Disposal. ................................................................................. 29
7.0 PROPOSED SCHEDULE AND UNCERTAINTIES ....................................................................... 29
8.0 REFERENCES ............................................................................................................................... 30
APPENDICES
Appendix A Acronyms and Abbreviations ................................................................................................ A-1
Appendix 8 VCM Checklist ...................................................................................................................... 8-1
Appendix C Standard Operating Procedure 2.01 ..................................................................................... C-1
Appendix D Ecological Scoping Checklist. ............................................................................................... D-1
Appendix E Estimated Costs .................................................................................................................... E-1
Appendix F Data Analysis, RESRAD Inputs, Results, Single Radionuclide Soil Guidelines ................... F-1
Appendix G Results of Previous Investigations ....................................................................................... G-1
Appendix H 2001 Pre-excavation Characterization Sampling Details ..................................................... H-1
Attachments
Attachment 1 2001 Release/Discharge Notification
Attachment 2 Design Package- Plans and Specifications
Attachment 3 Construction Quality Control Plan
ER2003-0326 v May 2003

VCM Plan for SWMU 21-011(k), Rev. 3
, List of Figures llilll
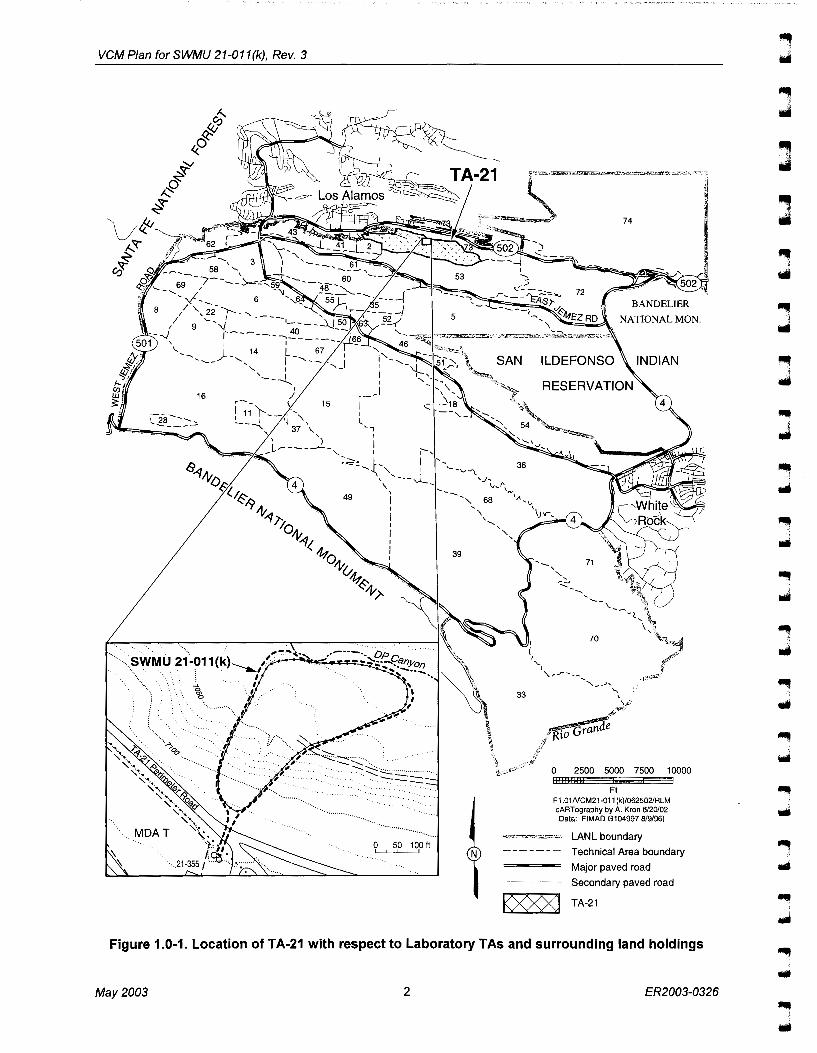
Figure 1.0-1. Location of TA-21 with respect to Laboratory TAs and surrounding land holdings .... 2 Figure 1.0-2. LocationofSWMU21-011(k)within LaboratoryTA-21 ............................................... 3 .. Figure 1.3-1. Present-day dose vs. time for trail-user scenario at SWMU 21-011 (k) ....................... 5 .I Figure 2.2-1. 1988, 1992, and 1993 sampling locations at SWMU 21-011(k) .................................. 8 Figure 2.2-2. 1996 interim action soil removal area and confirmation sample locations at SWMU Ill
21-011(k) ................................................................................................................... 10 .. Figure 2.2-3. July 2000 Chemrad gross gamma survey results at SWUM 21-011 (k) .................... 12 Figure 2.2-4. November 2000 in situ gamma survey results and March 2001 Pre-VCM IIlii
characterization sample locations at SWMU 21-011 (k) ............................................ 13 lllill Figure 3.0-1. Dose vs. time for trail-user scenario at SWMU 21-011 (k) after excavation and
removal and prior to installation of engineered cover ............................................... 17 , Figure 3.0-2. November 2000 in situ gross gamma survey results at SWMU 21-011(k) with circled ..
areas planned for removal ........................................................................................ 19 Figure 5.1-1. Outfall pipe to be removed and proposed confirmation sample locations at SWMU Ill
21-011(k) ................................................................................................................... 26 ..
List of Tables Table 1.2-1 Regulatory Activity for SWMU 21-011(k) ....................................................................... 4 Table 2.2-1 19961nterim Action Confirmation Sample Results ...................................................... 11 Table 2.2-2 2001 Pre-VCM Characterization Sample Organic Chemical Concentrations ............. 15 Table 2.2-3 2001 Pre-VCM Characterization Sample Radionuclide Concentrations above
Background/Fallout ...................................................................................................... 16 Table 3.0-1 SRSGs Derived for the Recreational Trail-User Scenario .......................................... 17 Table 4.2-1 Samples collected for validation of field screening approach ..................................... 21 Table 6.1-1 Waste Streams, Types, and Volumes at SWMU 21-011 (k) ........................................ 27 Table 7.0-1 VCM Field Work Schedule .......................................................................................... 30
May 2003 vi ER2003-0326

...
... •• ... •• ,.. .. ••
... -•• ••
-...
-.. -•
.. -.. -------
1.0 INTRODUCTION
This VCM plan presents the approach for remediating SWMU 21-011(k) located at TA-21, at Los Alamos National Laboratory (Figures 1.0-1 and 1.0-2). SWMU 21-011 (k) is an inactive drainline and outfall listed in Module VIII of the Laboratory's Hazardous Waste Facility Permit (EPA 1990, 01585.2, EPA 1994, 44146) .
1.1 Purpose and Scope
The objectives of this VCM are source reduction, dose reduction, and prevention of contaminant migration. To meet these objectives, the Laboratory's Risk Reduction and Environmental Stewardship (RRES) Project will conduct the following activities:
• supplemental sampling;
• excavate and dispose of approximately 500 yd3 of contaminated soil, tuff, and sediment, and approximately 60 yd3 of contaminated sediment in the western drainage;
• confirmation sampling;
• engineered site restoration;
• post-VCM radiation survey and/or sampling;
• removal of the inactive and plugged drain line extending from the wastewater treatment tanks to the outfall area and confirmation sampling beneath the line; and
• installation of stormwater run-on and runoff controls.
The DOE requires that corrective measures implemented at sites with radionuclide contamination strive to reduce radiation levels to "As Low As Reasonably Achievable" (ALARA). This VCM plan incorporates the principle of ALARA (DOE 1990, 58980.1 ). ALARA features include isolating radioactive materials from the environment and removal of areas with elevated radioactivity (above 150 pCilg of Cs-137 and 170 pCilg Am-241 ). The COPCs at SWMU 21-011 (k) are cesium-137 (Cs-137), strontium-90 (Sr-90), americium-241 (Am-241), and plutonium-239 (Pu-239). While the site, on average, meets the 15 mrem/yr dose limit for a recreational trail-user scenario (Appendix F), this dose limit is exceeded within some areas of the site. Soil from these areas will be removed and disposed of at Area Gat Technical Area 54 (TA-54) (see Figure 3.0-2). Implementation of the VCM will reduce exposure to a trail-user below the 15 mrem/yr dose limit over the entire site consistent with ALARA. Long-term stewardship of the site will be discussed in the VCM completion report for SWMU 21-011 (k).
ER2003-0326 May 2003
VCM Plan for SWMU 21-011 (k), Rev. 3
15
I
,_)
I I
l ~,
I
( I
33
70
' ' '\,,.r ... __ -........ _....;,
........ -
'"' ' . ""' ~··
~~~ if
f;
-._,., :~.~- .. -·
_.t,.~/ 1,;? ·. 0 2500 5000 7500 10000 1·1.11.1"1,/"'o-FI.I
Ft F1.01NCM21-011 (k)/062502/RLM cARTography by A. Kron 6/20/02 Data: FIMAD G104997 8/9/96)
LANL boundary
Technical Area boundary
Major paved road
Secondary paved road
K><><><l TA-21
Figure 1.0-1. Location of TA-21 with respect to Laboratory TAs and surrounding land holdings
May 2003 2 ER2003-0326
J
, IIIII
.. 11111111 ...

f 1
~ c ~ 2 1\) (J)
(.U
~ "<: 1\) c 2
r 1 r 1
_, -~, -.,
' ', "'\·
f J
',, :\ ' . ' . ·. ', ',, ·-. __ ,, ~
"16 '•, ---', •• , '~'o.r,. ', ·. '
I 1
'·•.,, V/}01) '-•.,, ',
' ', ~;> / >·\,
f 1
·-., . ·~ ooOO_ ',,_ ~6n ··., ',, ' ·. ' oo 0 ', uo/"). ', ·. ··-·oo oo ·o -.. v"'o ., __ ',
', 0° o0° oO ',,< '/J Ss ''-~,
f J f
----'·.. 00o~0oo0 , ___ rr" -~~ ~·-. ',, ·-. __ 0 o0° ·oO --. ',, t'', -.. \ , ·. o00 oo oO ·. __ -. , -. __ " · ·-.. ,- ,., 0 0- o oo00
-0 oo0
--._ ··-' -. "'._ · · ._ ' ' 0° 0 . 0° 0 ' '"-, i '•,,, (jO QO QO Q .• '"', · "
,
0
'·,, '·,, 0° o0° oOO 00 • 1 • If. , ' ...... ~ ---. 00oS0o~0oo - 11 2~ :. .. , ·--:Ot.-o,.. ·--. o0
oo0
oo ' _., ' ' '/~ ' . 0° 0 ',,"'"~·as , , , ··--. &0'<? ·---. - oo ', ' ',_ \_ ' 0 ... I ... I --~---__ .... ,, ',,
~,·,:~:.,, __ .. .
\~r,-1 " . . . .. \: ,.•
' I • I I
Figure 1.0-2. Location·of SWMU 21-011(k) within Laboratory TA-21
I • f f 1 f J I • f 1 r l r f ' I •
[==:1 Existing structure
~; ~;! Former structure t , • Absorbtion bed
()-;;()'Disposal shafts N
Paved road
Dirt road
---- Drainage pathway
---- SWMU boundary
----- MDA Tboundary
=====Outfall pipe
! 1
1774800
I
~ ::!1 Q) :::,
0' ..., (/)
~ c:: 1\) ..... 6 ..... ..... ~ ii? :<=:
w
,

VCM Plan for SWMU 21-011(k), Rev. 3
1.2 Regulatory History
The regulatory activities conducted at SWMU 21-011 (k) are summarized in Table 1.2-1. Table 1.2-1
Regulatory Activity for SWMU 21-011 (k)
Date Activity Document
1988 Sampling 1994 TA-21 OU RFI Phase Report 1C (LANL 1994, 31591)
1991 LANL TA-21 RFI Work Plan 1991 TA-21 Operable Unit RFI Work Plan for Environmental Restoration (LANL 1991, 07528.1)
1992-93 RFI Site Characterization 1994 Addendum to T A-21 Phase Reports 1 B and 1 C (LANL 1994, 52350.1)
1996/1997 Interim Action 1996 Interim Action Plan for PRS 21-011 (k) (LANL 1996, 54790.2); 1997 Interim Action Report for PRS 21-011 (k) (LANL 1997, 55648.2)
2001 VCM Implementation Approach for Communication Record (LANL 2002, 70217) SWMU 21-011(k)
2002 Submittal of VCM Plan for SWMU "Voluntary Corrective Measures Plan for Solid Waste 21-011(k) atTA-21 Management Unit (SWMU) 21-011 (k) at Technical Area (TA)
21 ," LA-UR-02-2218, (LANL 2002, 73085.2)
2002 NMED Issues Comments on Notice of Technical Incompleteness, VCM Plan for SWMU 21-SWMU 21-011(k) VCM Plan 011 (k), (NMED 2002, 73201)
2002 Submittal of Revision 1 of the VCM "Voluntary Corrective Measures Plan for Solid Waste Plan for SWMU 21-011 (k) at TA-21 Management Unit (SWMU) 21-011 (k) at Technical Area (TA)
21, Revision 1" LA-UR-02-3807, (LANL 2002, 73654.2)
2002 Withdrawal of Revision 1 of the Withdrawal Letter (LANL 2002, 73605) VCM Plan for SWMU 21-011 (k) at TA-21
2002 Submittal of Revision 2 of the VCM "Voluntary Corrective Measures Plan for Solid Waste Plan for SWMU 21-011 (k) at T A-21 Management Unit (SWMU) 21-011 (k) at Technical Area (TA)
21, Revision 2" LA-UR-02-6797, (LANL 2002, 73722)
2002 Submittal of Request for "No Letter Requesting No Longer Contained in Determination, Longer Contained In" determination (LANL 2002, 73721) for soil, tuff, and sediment at SWMU 21-011(k), atTA-21
2002 NMED Issues No Longer Approval letter from NMED, (NMED 2002, 73720) Contained-In Determination for material to be excavated from SWMU 21-011 (k), TA-21
2002 Submittal of VCM Confirmation Sampling Notification Letter, ER2002-0797, (LANL 2002, Sampling Notification 73723)
2002 Submittal of offsite analytical Communication Record, ER2002-0800, (LANL 2002, 73725) laboratory data to validate the proposed screening method to be used during the VCM at SWMU 21-011 (k)
2002 NMED issues Notice of Deficiency Notice of Deficiency, VCM Plan for SWMU 21-011 (k), (NMED on SWMU 21-011(k) VCM Plan 2002, 73724)
2003 Submittal of Response to NOD on Response to NOD on VCM Plan for SWMU 21-011 (k) at TA-21 SWMU 21-011(k) VCM Plan Rev. 2 (LANL 2003, 75936)
2003 NMED issues Comments and Comments and conditions for NOD response, SWMU 21-Conditions for NOD Response. 011 (k) VCM Plan (NMED 2003, 75935)
May 2003 4 ER2003-0326 IIIII ..
.... •• .... ••
•• ....
-... ••
•• -.,
.. ,
-..... ... ,
-..... .. , -
VCM Plan for SWMU 21-011 (k), Rev. 3
1.3 Rationale for Proposed Corrective Measure
SWMU 21-011 (k) is located on the north side of DP Mesa on a hillside that leads to DP Canyon. The northern SWMU boundary is within the high-water table of the DP Canyon streambed. SWMU 21-011(k) has been identified as the primary source of radionuclide contamination in sediments in the Los Alamos (LA) Canyon watershed (LANL 1999, 63915). Approximately one-third of a curie of Cs-137 has been identified in the LA Canyon watershed inventory and exists within DP Canyon and LA Canyon exclusive of SWMU 21-011(k). The existing radionuclide inventory in surface soil, tuff, and sediment at SWMU 21-011 (k) is estimated at one-fourth of a curie of Cs-137 (LANL 2002, 73392). Because of the site's high potential for erosion (erosion matrix score of 72 out of 100, Appendix C), there is the potential for radionuclides from the site to increase the radionuclide inventory in the LA Canyon watershed. Therefore, remediation of the site is considered a priority by the Laboratory, DOE, and the New Mexico Environment Department (NMED).
SWMU 21-011 (k) is located on DOE property and will remain under DOE control for at least the next 100 years. Land use for TA-21 is, and will continue to be, industrial under DOE ownership and control. However, SWMU 21-011 (k) is not a typical industrial site as it is located on a steep hillside that slopes to the bottom of DP Canyon. Although there are no plans by Los Alamos County to develop any hiking trails in the canyon, the area is accessible to LANL employees and potentially to the public. Consequently, the trail-user land use scenario is proposed for this VCM (LANL 2001, 70217) and used to screen soil and sediment areas with potentially elevated radionuclide concentration exceeding the acceptable human health dose level ( 15 mrem/yr).
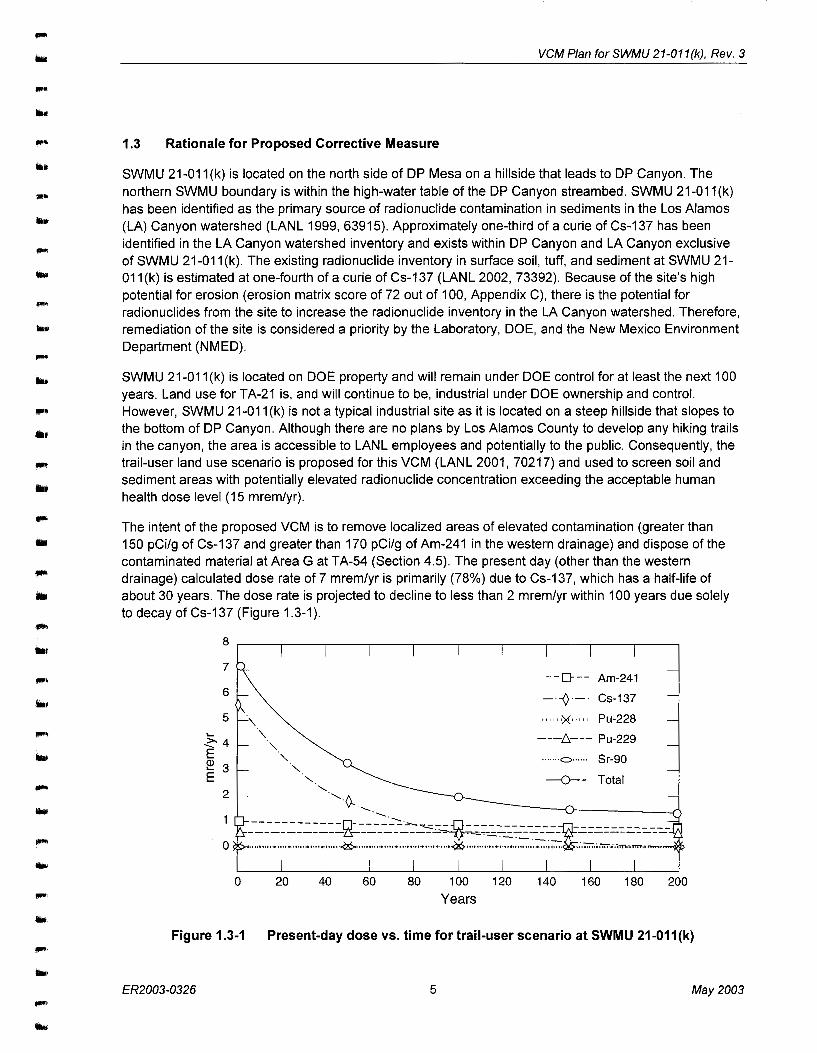
The intent of the proposed VCM is to remove localized areas of elevated contamination (greater than 150 pCi/g of Cs-137 and greater than 170 pCi/g of Am-241 in the western drainage) and dispose of the contaminated material at Area Gat TA-54 (Section 4.5). The present day (other than the western drainage) calculated dose rate of 7 mrem/yr is primarily (78%) due to Cs-137, which has a half-life of about 30 years. The dose rate is projected to decline to less than 2 mrem/yr within 100 years due solely to decay of Cs-137 (Figure 1.3-1 ) .
7
6
5
~4 E ~ 3 E
2
0
0 20 40 60 80 100 120
Years
--o--- Am-241
- ·-¢ ·-· Cs-137
,,,,,,X····· Pu-228
---!:::,.--- Pu-229
·······=······ Sr-90
-o- Total
140 160 180 200
Figure 1.3-1 Present-day dose vs. time for trail-user scenario at SWMU 21-011(k)
ER2003-0326 5 May 2003

VCM Plan for SWMU 21-011(k), Rev. 3
Site restoration will include placement of clean backfill in disturbed areas, followed by the recontouring and revegetation of the site. This remediation approach is a cost-effective and proactive remedial alternative, and is preferred over no action, fencing of the site, and/or stabilization and placement in an on-site containment cell.
2.0 PREVIOUS SITE CHARACTERIZATION AT SWMU 21-011(K)
2.1 Site Description and Operational History
SWMU 21-011(k) was the NPDES-permitted outfall (NPDES outfall no. EPA 050050) for treated industrial wastewater from the former waste water treatment plants (WWTPs) (Buildings 21-35 and -157) at TA-21. The SWMU consists of a drainline from two treated wastewater holding tanks (structures 21-112 and-113) and an outfall area on the north-facing slope of DP Canyon. The initial drainline from tanks 21-112 and -113 consisted of a 4-in. VCP that reportedly discharged to an "outfall ditch" excavated into soil and tuff (LANL 1991, 07528.1 ). The VCP was replaced in 1976 with a 4-in. cast iron drain line that was installed within the VCP drainline excavation and outfall ditch. The discharge end of the 4-in. cast iron drainline is located approximately 80ft north of the TA-21 perimeter road where the outfall ditch previously ended. A gently sloping, rocky surface extends from the end of the outfall drainline approximately 30 ft to the south rim of DP Canyon.
TA-21 is the former plutonium processing facility at the Laboratory. The first WWTP (Building 21-35) was activated in 1952 and operated until1967 when the new industrial WWTP (Building 21-257) came on line. Both facilities treated wastes from DP West and DP East consisting of liquids remaining after plutonium extraction and processing of radioactive materials for nuclear weapons and aeronautical research projects. The treatment process mixed the raw waste with lime, ferric sulfate, and coagulant aids. The waste was then pumped to a flocculator and on to a settling tank. Settled effluent was pumped through a pressure filter and sampled to verify adequate treatment. When the effluent was determined to be adequately treated, it was pumped to two final holding tanks (structures 21-112 and -113). From the tanks, the effluent was piped northeast toward DP Canyon and discharged on the north side of DP Mesa to what is now SWMU 21-011 (k). This effluent contained a variety of radioactive and chemical constituents. Discharges of treated industrial wastewater to the outfall were discontinued in July 1986 (LANL 2002, 73115). Building 21-257 has been used since 1986 for the treatment of tritiated wastewater from the Tritium Systems Test Assembly (TSTA) facility (Building 21-155). The wastewater is stored in holding tanks 21-112 and -113 and is routinely transported by tanker truck to the Radioactive Liquid Waste Treatment Facility (RLWTF) at TA-50.
Approximately 55 gal. of partially treated tritiated wastewater was released from holding tank 21-113 through the SWMU 21-011 (k) drain line in January 2001 when a faulty gauge caused the tank to over fill. The wastewater in the tank originated from the TSTA facility (LANL 2002, 73116). The released wastewater was absorbed into the ground within 50 ft of the end of the 4-in. cast iron drainline within the outfall area of SWMU 21-011 (k). The Release/Discharge Notification (Attachment 1) submitted to NMED and EPA Region 6, indicates that the wastewater did not reach a watercourse. The area impacted was approximately 2 ft x 50 ft and was covered with snow. After the discharge was stopped, a sample of wastewater from the tank was immediately collected and screened for tritium and for gross alpha and beta concentration. The results were reported as tritium = 630 nCi/L, gross alpha = 0.14 nCi/L, gross beta = 2.2 nCi!L (LANL 2001, 72667). Tritium is exclusively a beta emitting radionuclide (with a half-life of approximately 12 yr), which accounts for the elevated gross beta concentration result. These results are from the liquid wastewater that remained in the tank and are not indicative of the residual concentrations in the soil. Residual tritium concentrations in the area of the spill were initially diluted with the snow pack and then reduced through sublimation from the snow surface. Tritium concentrations were further
May 2003 6 ER2003-0326
.. ..
.. ...
IIIII I

••
... •• .....
,.. ..
.....
-.. ... ••
-... ... .....
-
-....
....
....
VCM Plan for SWMU 21-011 (k), Rev. 3
reduced by evapotranspiration during the spring and summer. Subsequent drought conditions have resulted in the evaporation of most of the available near-surface moisture along with the residual tritium. Therefore, this release will have no impact on the proposed corrective measure for this SWMU. The outfall line from holding tanks 21-112 and -113 was permanently plugged as part of the release response in January 2001 (LANL 2001, 72667).
2.2 Previous Field Investigations
SWMU 21-011 (k) was sampled during a 1988 DOE Headquarters Environmental Survey of the Laboratory (DOE 1988, 15363). In 1992, SWMU 21-011 (k) was characterized in accordance with the TA-21 Operable Unit (OU) RFI Work Plan, which involved a radiological field survey and collection of soil samples (LANL 1991, 07528.1 ). Additional site characterization consisting of a second radiological survey and collection of additional soil samples was conducted in 1993 to confirm the elevated radioactivity levels measured in 1992 and because holding times were missed for samples submitted for analysis of volatile organic compounds (VOCs) from the 1992 sampling effort (Figure 2.2-1) (LANL 1994, 52350.1 ). All of the above efforts post-date inactivation of the outfall in July 1986 (LANL 2002, 73115). Data from the previous field investigations is summarized in Appendix G .
ER2003-0326 7 May 2003

VCM Plan for SWMU 21-011 (k), Rev. 3
7050···· ··· .. . ... -········ ·· ...
········· ... _
·· .... ····-.................... .
·· .. Outfall · .. discharge
point .................................. ;>
7<o
SWMU 21-011 (k) • ...
·······
······ ... ?77o.
···········.... . ............. ..
············ .....
········ ....
···········
-··- Drainage pathway
------ MDA T boundary
Contour interval 2 ft
--- SWMU boundary
6 1988 DOE sample location
o 1992 RFI sample location
Figure 2.2-1. 1988, 1992, and 1993 sampling locations at SWMU 21-011(k)
May 2003 8 ER2003-0326
., .. J J
.... ...

••
•• ••
ill•
••
...
IIIJIIII
1111
1111
-
VCM Plan for SWMU 21-011{k), Rev. 3
2.2.1 1996 Interim Action Soil Removal
In 1996, an lA plan was prepared (LANL 1996, 54790.2). The lA was conducted in 1996 and reported in the Interim Action Report for Potential Release Site 21-011 (k) (LANL 1997, 55648.2).
The lA had two objectives:
• remove a significant portion of the source term from the areas of the outfall exhibiting the greatest levels of radioactivity.
• install storm water control measures as a best management practice (BMP) to mitigate the migration of contaminated soil and sediment into the main channel of DP Canyon by preventing stormwater run-on and runoff .
During the 1996 lA, approximately 390 yd3 of soil over an area of approximately 11,600 fe were removed from the upper drainage/outfall area of SWMU 21-011 (k} (Figure 2.2-2). Results of a post-excavation radiological survey indicated that the gross gamma concentration in soil, sediment, and tuff was reduced from greater than 500,000 cpm to less than 100,000 cpm over the entire upper drainage area.
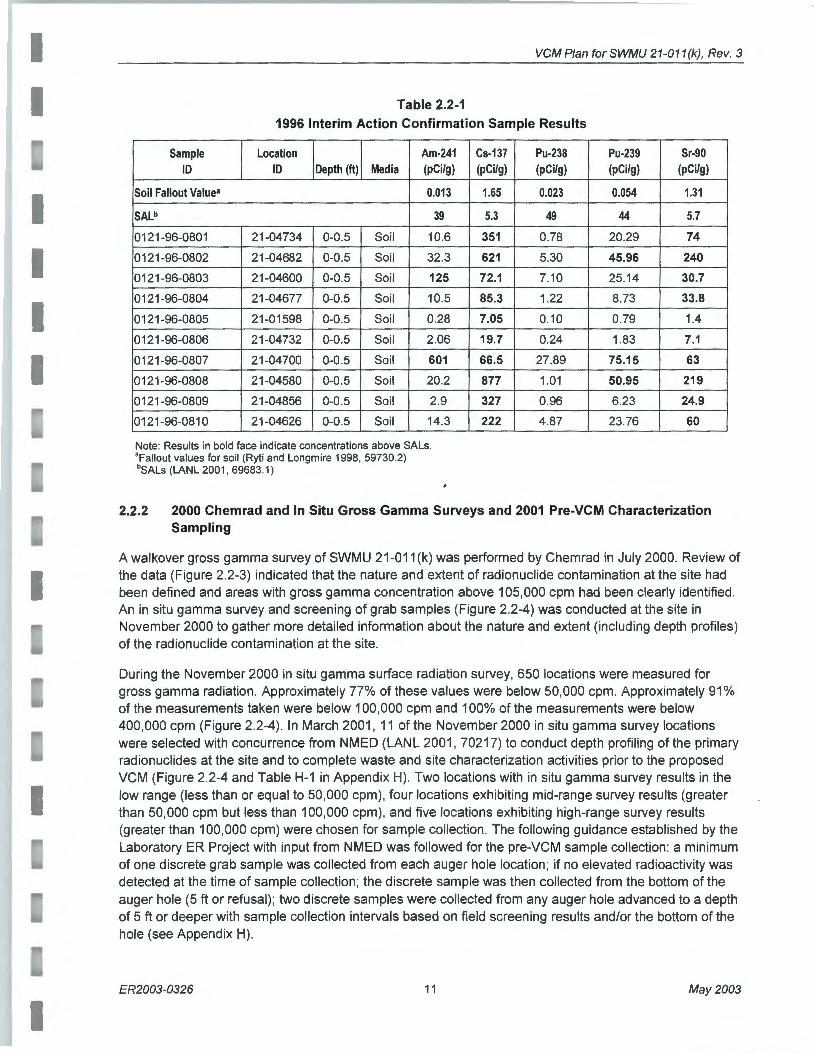
Upon completion of the soil removal in November 1996, ten surface confirmation samples (from 0 to 6 in.) were collected from throughout the SWMU, five from within the excavation area (Figure 2.2-2). The samples were analyzed for isotopic Pu, Sr-90, Cs-137 and Am-241. Analytical results for the ten surface confirmation samples are presented in Table 2.2-1 (LANL 1997, 55648.2). Analytical results in the table are compared to background or fallout values as presented in "Inorganic and Radionuclide Background Data for Soils, Canyon Sediments and Bandelier Tuff at Los Alamos National Laboratory," (Ryti et al. 1998, 59730.2). Results are also compared to risk-based screening action levels (SAL) that are protective of human health. The SALs used in these comparisons are based on a residential land use scenario presented in "Derivation and Use of Radionuclide Screening Action Levels," (LANL 2001, 69683.1 ). Americium -241, Cs-137, Pu-239, and Sr-90 exceeded their respective soil fallout values and SALs, as shown in Table 2.2-1.
ER2003-0326 9 May 2003

l J
! 1\) 0
2
..... 0
~ § 8 1\) 0)
L . .l
· __ -··· ...•.
' ··'··· ·.
'•<::::~:\' ~~· ·.. -~-::~::····; •.
'., "6~· ·', ', ..•..
' ""~;·_> _,. >~::<~" --- ·.. ; ooOO --, -16& --, ·. ', ·• .... --- · .. , oo ·o ', o,.6 •. ',·, ' ...
--··oo oo . 0 ---· ·''oiJ '-, ', •· •. 0° o0° oO ', 6>& ', ' .,
·. ·. · 0 oO oO · · •. "< · ·~ '··. 11 · - •. .. o 0 oo0 oo0 ·. '• ·. . ·
11 ·~:·· ........ > ·····0·. oO~oO&oo0~~>--,/ '~,~.,_ .. ·.·· ...•. "
' ·. · ,-, 0° 0° o0° oO ·. .., · ·. ···c, : ·· ... 0°oO oO oO '·,~,· '< 11 ... o~_ --- o 0 oo0 oo0 oo0 . ····•····:· .1. .. ' 0 0. . •.... ;-., ······-~ ~···.06o<;s0o'6ooO • f
112
' • , .... -- o&0 -- o0 oo
0oo .. . ~ . .... .... ---,~e. ',, .. oo 0 · ... • ·~ 0113.
'·<'ws '•,, · .. ,.,, ·.._, 0(', · ·.· /\....... ··)·. ·.8 .. ......... ,' <</ ·. . ·I : ··············· ·· ...... ~ ;·. .., 0 ····... 21-355 ·, . ·. -.,,,;;~, ,., 15j ··... - I . . .... -~--; .....
• 21-04626
SWMU 21-011 (k)
.. 21-04856
······ ·. ·. ···... ..{ ·.
~ ·.Eastern .. .·~--~ drainage_;k-----~ ....
······· 7030 ....
1774800
i = = = = =; Absorbtion bed
QoO Disposal shafts
--- Paved road
Dirt road
Contour interval2 ft
====== Outfall pipe
------ Drainage pathway
- SWMU boundary
• 21-04677
Area of soil removal
Sample location and location ID
Figure 2.2-2. 1996 interim action soil removal area and confirmation sample locations at SWMU 21-011(k)
l. . ..l L.~ L."".J L .. .l L ... J L.J L~J l~ .. .l L .. .l ~ """"' .. L~ . .l L .. ~J l.~.l L.~J L ..... J
2 J;! Q) :::3
0' ., (I)
~ c: 1\) ..... I
0 ..... ..... ~ ~ :-:: w
L ..... J
VCM Plan for SWMU 21-011 (k) , Rev. 3
Table 2.2-1 1996 Interim Action Confirmation Sample Results
Sample Location Am-241 ID ID Depth (ft) Media (pCi/g)
Soil Fallout Value• 0.013
SALb 39
0121-96-0801 21-04734 0-0.5 Soi l 10.6
0121-96-0802 21 -04682 0-0.5 Soi l 32.3
0121-96-0803 21-04600 0-0.5 Soil 125
0121-96-0804 21-04677 0-0.5 Soil 10.5
0121 -96-0805 21 -01598 0-0.5 Soil 0.28
0121 -96-0806 21-04732 0-0.5 Soil 2.06
0121 -96-0807 21 -04700 0-0.5 Soil 601
0121-96-0808 21 -04580 0-0.5 Soil 20.2
0121-96-0809 21 -04856 0-0.5 Soil 2.9
0121-96-0810 21 -04626 0-0.5 Soil 14.3
Note: Results in bold face indicate concentrations above SALs. •Fallout values for soil (Ryti and Longmire 1998, 59730.2) bSALs (LANL 2001 , 69683.1)
Cs-137 Pu-238 Pu-239 Sr-90 (pCi/g) (pCi/g) (pCi/g) (pCi/g)
1.65 0.023 0.054 1.31
5.3 49 44 5.7
351 0.78 20.29 74
621 5.30 45.96 240
72.1 7.10 25.14 30.7
85.3 1.22 8.73 33.8
7.05 0.10 0.79 1.4
19.7 0.24 1.83 7.1
66.5 27.89 75.15 63
877 1.01 50.95 219
327 0.96 6.23 24.9
222 4.87 23.76 60
2.2.2 2000 Chemrad and In Situ Gross Gamma Surveys and 2001 Pre-VCM Characterization Sampling
A walkover gross gamma survey of SWMU 21-011 (k) was performed by Chemrad in July 2000. Review of the data (Figure 2.2-3) indicated that the nature and extent of radionuclide contamination at the site had been defined and areas with gross gamma concentration above 105,000 cpm had been clearly identified. An in situ gamma survey and screening of grab samples (Figure 2.2-4) was conducted at the site in November 2000 to gather more detailed information about the nature and extent (including depth profiles) of the radionuclide contamination at the site.
During the November 2000 in situ gamma surface radiation survey, 650 locations were measured for gross gamma radiation . Approximately 77% of these values were below 50,000 cpm. Approximately 91% of the measurements taken were below 100,000 cpm and 100% of the measurements were below 400,000 cpm (Figure 2.2-4) . In March 2001 , 11 of the November 2000 in situ gamma survey locations were selected with concurrence from NMED (LANL 2001 , 70217) to conduct depth profiling of the primary radionuclides at the site and to complete waste and site characterization activities prior to the proposed VCM (Figure 2.2-4 and Table H-1 in Appendix H). Two locations with in situ gamma survey results in the low range (less than or equal to 50,000 cpm) , four locations exhibiting mid-range survey results (greater than 50,000 cpm but less than 100,000 cpm), and five locations exhibiting high-range survey results (greater than 100,000 cpm) were chosen for sample collection . The following guidance established by the Laboratory ER Project with input from NMED was followed for the pre-VCM sample collection : a minimum of one discrete grab sample was collected from each auger hole location; if no elevated radioactivity was detected at the time of sample collection ; the discrete sample was then collected from the bottom of the auger hole (5 ft or refusal) ; two discrete samples were collected from any auger hole advanced to a depth of 5 ft or deeper with sample collection intervals based on field screening results and/or the bottom of the hole (see Appendix H).
ER2003-0326 11 May 2003

f 1\) 0
8
N
~ 1\) 0 0 w
~ ())
Figure 2.2-3 July 2000 Chemrad gross gamma survey results at SWMU 21-011(k)
··--- Dirtroad
Temporary radiation control area fence
===== Outfall pipe
---- SWMU boundary
2 J2 Q) ::s 0' ...., (/)
~ c: 1\) ....
I
0 .... .... ~ ~ :<:: (.,)
1

~ 1\J c ~ 8 1\J ())
..... c..J
~ '<: 1\J c 8 Figure 2.2-4
control area fence
Outfall pipe
Drainage pathway
Contour interval 2 ft
---- SWMU Boundary
1:8:J 2001 pre-VCM characterization sample location
21-11206 Sample Location ID (496) (stake number)
November 2000 in situ gamma survey results and March 2001 pre-VCM characterization sample locations at SWMU 21-011(k)
(Sj ~
~ ::J
0' .., (/)
~ c: 1\J .....
I
c ..... ..... ~ ::0 CD :<:: <...>

VCM Plan for SWMU 21-011 (k), Rev. 3
Samples submitted for VOC analysis were collected from the depth intervals with the highest radioactivity screening results and/or the bottom of the auger hole and not from the top six-in . sample interval. A composite sample, made up of aliquots from each depth profile sample collected from each sample location for waste characterization purposes, was collected from the remaining material at each of the 11 sample locations. A sample from each location was screened for gross alpha, beta and gamma radiation and Cs-137. The analytical suites for discrete samples collected at each location to confirm nature and extent and for site and waste characterization purposes included the following : perchlorate, gamma I spectroscopy, isotopic Pu, Sr-90, Am-241 , Cs-137, target analyte list (TAL) metals, toxicity characteristic leaching procedures (TCLP) metals, TCLP VOCs, TCLP semivolatile organic compounds (SVOCs), pesticides, polychlorinated biphenyls (PCBs) , VOCs via Encore samplers, and screening for gross alpha beta and gamma radiation . The analytical suites for composite waste characterization samples collected at each location included all of the same analytes as the discrete samples except TAL metals.
Pre-VCM characterization sample summaries including the in situ gamma survey ID, sample location ID, sample depth, sample ID, date and time of sample collection, sample type, and the analytical suite specific to each type of sample, are shown in Table H-1 in Appendix H. The samples were collected between March 6 and 9, 2001 . Field screening data were used to develop an instrument correlation curve (correlating cpm with Cs-137 concentration levels), which was presented to NMED in May 2001 and is presented in Appendix F. The November 2000 in situ gross gamma survey map and March 2001 preVCM characterization sample locations are shown in Figure 2.2-4.
Sample results for discrete 2001 pre-VCM characterization samples are compared to SALs and to Ecological Screening Levels (ESLs) as presented in the Laboratory's ECORISK database, version 1.4 (LANL 2002, 72802).
Mercury was the single inorganic chemical detected in discrete pre-VCM characterization samples. Mercury was detected at three sample locations (21-11209, -11210, and -11211) at concentrations of 0.14, 0.16, and 1.8 mg/kg respectively (the background value for mercury is 0.1 mg/kg). Mercury was not detected above the SAL (23 mg/kg) but was detected above the minimum ESL (earthworm) at sample locations 21-11209, -11210, and -11211 . However, the concentration of mercury was less than the ESL for all other receptors; therefore, mercury does not pose a potential unacceptable risk to human or ecological receptors. The SALs used in these comparisons are derived according to the approach in the human health screening methodology document (LANL 2002, 72639), which is based on guidance in NMED (2000, 68554.1) and EPA (2001, 71466). The ESLs are derived based on the screening level ecological risk assessment approach document (LANL 1999, 64 783.1) and the ECORISK database, version 1.4 (LANL 2002, 72802).
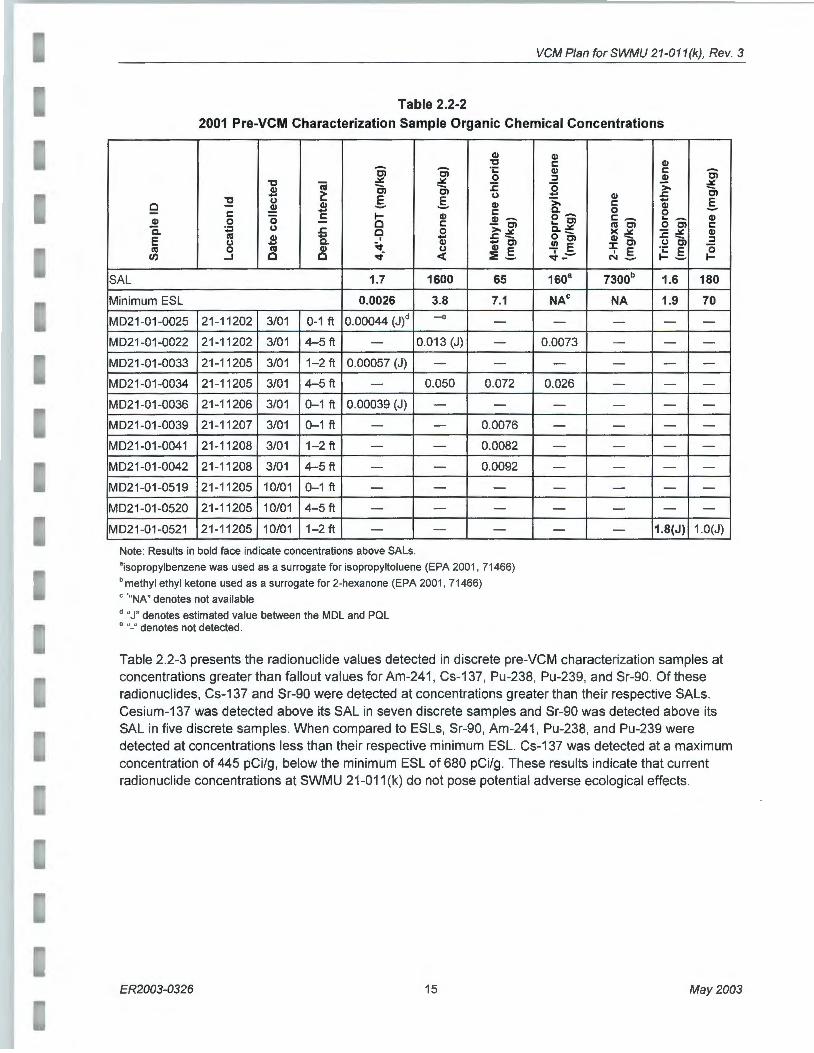
Table 2.2-2 presents sample results for organic chemicals detected in discrete pre-VCM characterization samples. The analytical results for sample location MD21-0034 were suspect because no organics were detected in the samples collected directly above and below this sample. Therefore, three additional discrete samples (MD21-01-0519, -0520, and -0521) were collected from three depths at the same location in October 2001 . The organic chemicals detected were at concentrations below their respective SALs except for trichloroethylene (TCE), which was detected at a concentration approximately equivalent to its SAL in one sample (Table 2.2-2). However, the total cancer risk and noncarcinogenic hazard is less than NMED's target level of 1 o·5 cancer and a hazard index of 1.0 (NMED 2000, 68554.1 ). The organic chemical concentrations were also less than the minimum ESLs (Table 2.2-2) . The TCE concentration of 1.8 mg/kg is just below the minimum ESL of 1.9 mg/kg and less than the ESLs for the other receptors. Therefore, the organic chemicals do not pose a potential unacceptable risk to human or ecological receptors.
May 2003 14 ER2003-0326
VCM Plan for SWMU 21-011 (k) , Rev. 3
Table 2.2-2
2001 Pre-VCM Characterization Sample Organic Chemical Concentrations
C1) C1) "C t: C1)
Ci Ci ·;:: C1) t: Ci ~ ~ ..2 ::I C1)
"C iii 0 >. ~
$ c, c, s:. c, ~ C) ~ C1) s:.
::!2 C) .§. .§. >- t: .... .§. c ~ $ C1) C1)
- t: t: c. 0 0 0 ..= 1- C1)
Cll~ o~ c:~ ... ~ C1)
C1) 0 c t: - Cl ... Cl C'll Cl 0 Cl t: a. :0::0 C) s:. c 0 >-~ c.~ ><~ -~ C1)
E C'll C1) .... I .... s:.- o- Cll- s=- ::I C) .... c. ~
C1) .... Cl U) Cl :I: Cl C) Cl 0 C'll 0 C'll C1) C) C1) E - E
I E ·;:: E c c ..:i < I ._. 1-(/) .J :!:._. ""'~ N ._. ..... __
SAL 1.7 1600 65 1603 7300b 1.6 180
Minimum ESL 0.0026 3.8 7.1 NAC NA 1.9 70
MD21-01-0025 21-11202 3/01 0-1 ft 0.00044 (J)d -e - - - - -
MD21-01-0022 21 -11202 3/01 4-5ft - 0.013 (J) - 0.0073 - - -
MD21-01-0033 21 -11205 3/01 1-2ft 0.00057 (J) - - - - - -MD21-01-0034 21-11205 3/01 4-5ft - 0.050 0.072 0.026 - - -
MD21-01-0036 21-11206 3/01 0-1 ft 0.00039 (J) - - - - - -
MD21-01-0039 21-11207 3/01 0-1 ft - - 0.0076 - - - -
MD21-01-0041 21-11208 3/01 1-2ft - - 0.0082 - - - -MD21-01-0042 21 -11208 3/01 4-5ft - - 0.0092 - - - -
MD21-01-0519 21-11205 10/01 0-1 ft - - - - - - -
MD21-01-0520 21-11205 10/01 4-5ft - - - - - - -
MD21-01-0521 21-11205 10/01 1-2ft - - - - - 1.8(J) 1.0(J)
Note: Results in bold face indicate concentrations above SALs.
"isopropylbenzene was used as a surrogate for isopropyltoluene (EPA 2001 , 71466)
b methyl ethyl ketone used as a surrogate for 2-hexanone (EPA 2001 , 71466)
c ·"NA" denotes not available
d "J" denotes estimated value between the MDL and PQL e "- " denotes not detected.
Table 2.2-3 presents the radionuclide values detected in discrete pre-VCM characterization samples at concentrations greater than fallout values for Am-241, Cs-137, Pu-238, Pu-239, and Sr-90. Of these radionuclides, Cs-137 and Sr-90 were detected at concentrations greater than their respective SALs. Cesium-137 was detected above its SAL in seven discrete samples and Sr-90 was detected above its SAL in five discrete samples. When compared to ESLs, Sr-90, Am-241 , Pu-238, and Pu-239 were detected at concentrations less than their respective minimum ESL. Cs-137 was detected at a maximum concentration of 445 pCi/g, below the minimum ESL of 680 pCi/g. These resu lts indicate that current radionuclide concentrations at SWMU 21-011 (k) do not pose potential adverse ecological effects.
ER2003-0326 15 May 2003

VCM Plan for SWMU 21-011(k), Rev. 3
Table 2.2-3 2001 Pre-VCM Characterization Sample
Radionuclide Concentrations above Background/Fallout
Location Cs-137 Sample ID ID Depth (ft) (pCi/g)
Fallout Soil Value a 1.65
SAL 5.3
Minimum ESL 680
MD21-01 -0021 21 -11201 1-2 1.43
MD21 -01-0022 21 -11202 4-5 1.67
MD21 -01-0025 21-11202 0-1 40.5
MD21-01 -0027 21 -11203 1-2 8.7
MD21-01-0029 21-11203 4-5 1.03
MD21 -01-0030 21-11204 2-3 2.6
MD21-01 -0033 21 -11205 1-2 150
MD21 -01 -0034 21-11205 4-5 3.78
MD21-01-0036 21-11206 0-1 29
MD21 -01-0037 21 -11206 4-5 1.52
MD21 -01 -0039 21 -11207 0-1 109
MD21-01 -0041 21 -11208 1-2 445
MD21-01-0042 21-11208 4-5 56.7
Note: Results in bold face indicate concentrations above SALs. • (Ryti et al. 1998, 59730.2) b "- " denotes not detected
Summary
Sr-90 Am-241 (pCi/g) Pu-239 (pCi/g) (pCi/g)
1.31 0.054 0.013
5.7 44 39
560 47 44
1.7 0.12 b -- 0.09 -
7.1 1.93 2.2
2.56 0.37 -- 0.04 -
0.9 0.11 -
26.1 13.2 13.7
1.02 1.01 6.9
3.75 1.18 -
0.51 0.12 -30.8 11 .3 7.9
132 20.5 19
15.8 4.33 21
Pu-238 (pCi/g)
0.023
49
44
0.044
-0.29
0.31
0.05
0.07
0.63
0.21
0.12
-0.74
1.64
1.2
The 1996 post-IA confirmation sample data, July 2000 Chemrad and November 2000 in situ gamma survey data, and March 2001 pre-VCM characterization data confirm that radionuclides are the primary COPCs at the site, and identified areas with elevated concentrations that will be addressed during this VCM. The July 2000 Chemrad and November 2000 in situ gamma survey results show a clear boundary between the northern edge of SWMU 21-011 (k) and the DP Canyon stream channel and indicate that radionuclides have not migrated to the channel since the completion of the 1996 lA. The proposed VCM will address source removal and dose reduction of the radionuclide contamination at SWMU 21-011 (k) . Assessment of the contamination in the canyon floor will be conducted as part of the Los Alamos/Pueblo Canyon Surface Aggregate Report to be prepared by the Canyons Focus Area.
3.0 BASIS FOR CLEANUP LEVELS
The land-use scenario considered most appropriate for derivation of cleanup levels is a recreational trail use for TA-21 employees. The recreational trail-user scenario represents an individual working at TA-21 who regularly walks on the site, as it currently exists, prior to implementation of the VCM. The recreational user is assumed to visit the site 140 times per year for 30 yrs and stay for one hour per visit. Over thirty years, this results in a total annual dose to this user of approximately 7 mrem/yr as shown in Figure 1.3-1 and is projected to decline to less than 2 mrem/yr within 100 years due to decay of Cs-137. This is compared to the acceptable annual radiation dose limit of 15 mrem/yr. (DOE 2000, 67489 and EPA 1997,
May 2003 16 ER2003-0326

VCM Plan for SWMU 21-011 (k) , Rev. 3
58693). The dose-based radiological cleanup levels for the trail-user scenario are derived using RESRAD 6.1, as shown in Appendix F, Exhibit F.2, and are presented in Table 3.0-1 as the single radionuclide soil guidelines (SRSGs). The SRSG for each radionuclide is based on a target dose limit of 15 mrem/yr.
Table 3.0-1 SRSGs Derived for the Recreational Trail-User Scenario
Radionuclide SRSG (pCi/g)
Am-241 427
Cs-137 294
Pu-238 496
Pu-239 447
Sr-90 8,288
By comparison , the calculated dose to a hypothetical recreational trail user following implementation of the proposed excavation and disposal of 500 yd 3 of contaminated material with concentrations of Cs-137 greater than 150 pCi/g and approximately 60 yd3 of contaminated sediment in the western drainage with Am-241 concentration greater than 170 pCi/g is between 3 and 4 mrem/yr or about 1/4 the criterion of 15 mrem/yr for the free-release of real property (DOE 2000, 67489). The estimated dose rate is still primarily due to Cs-137, which has a half-life of approximately 30 years. The total dose rate is projected to decline to less than 2 mrem/yr within approximately 30 years after excavation due solely to the decay of Cs-137. This is approximately 1/3 the time that would be required to reach 2 mrem/yr without the source reduction achieved through implementation of the VCM. Figure 3.0-1 is a dose versus time plot produced by RESRAD 6.1 (Appendix F, Exhibit F.C) for the recreational trail user following implementation of the proposed excavation and disposal of 500 yd3 of contaminated material with concentrations of Cs-137 greater than 150 pCi/g and approximately 60 yd3 of Am-241 contaminated sediment in the western drainage with Am-241 concentrations greater than 170 pCi/g.
3.5
3.0
2.5
'C' ~ 2.0 E Q) ... .§. Q) 1.5 Ill 0 0
1.0
0.5
0.0
1\ <~\ \ \
""' \ ~~ ~ ~
b-.
"' "' I
~
0 20 40
~ ~ ~ ~
60
~ --------.,~
r---...:,.
"'
80 ---
100 Years
120 140
-e- Am-241 + Cs-137 -8- Pu-238 -8- Pu-239 -'fit- 5•·90 + Total
160 180 200
Figure 3.0-1. Dose vs. time for trail-user scenario at SWMU 21-011 (k) after excavation and removal and prior to installation of engineered cover
ER2003-0326 17 May 2003
VCM Plan for SWMU 21-011 (k), Rev. 3
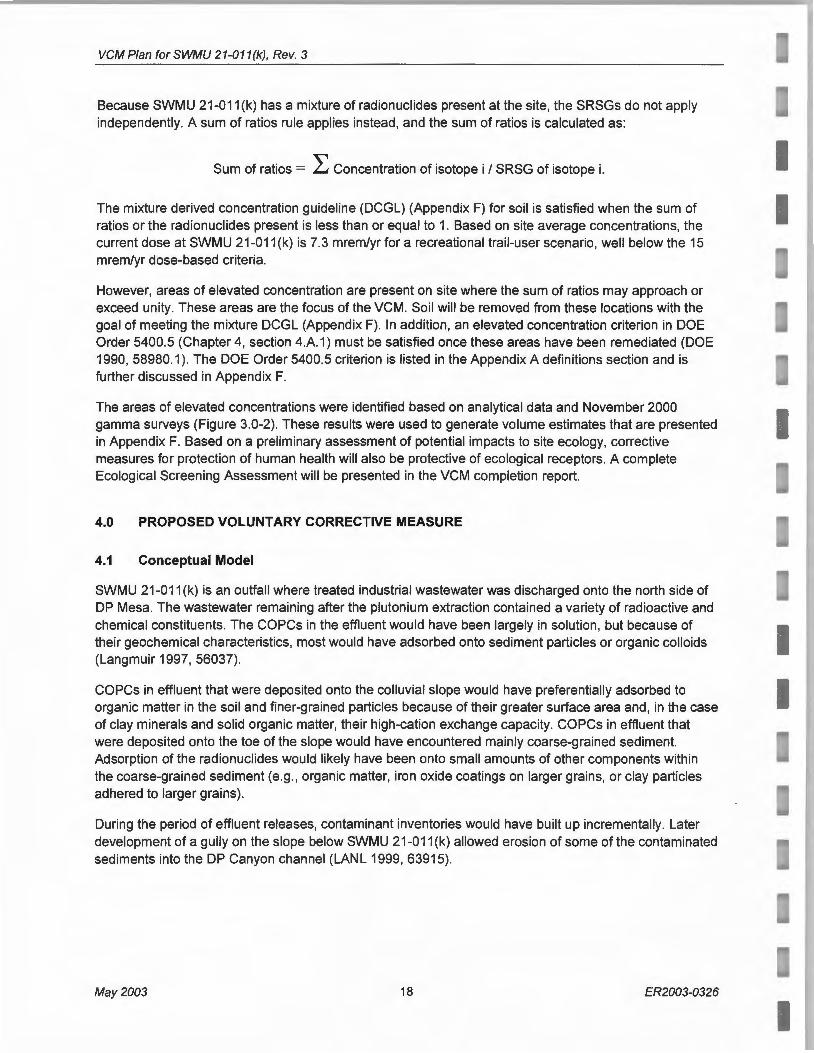
Because SWMU 21-011 (k) has a mixture of radionuclides present at the site, the SRSGs do not apply independently. A sum of ratios rule applies instead, and the sum of ratios is calculated as:
Sum of ratios = L Concentration of isotope i I SRSG of isotope i.
The mixture derived concentration guideline (DCGL) (Appendix F) for soil is satisfied when the sum of ratios or the radionuclides present is less than or equal to 1. Based on site average concentrations, the current dose at SWMU 21-011 (k) is 7.3 mrem/yr for a recreational trail-user scenario, well below the 15 mrem/yr dose-based criteria.
However, areas of elevated concentration are present on site where the sum of ratios may approach or exceed unity. These areas are the focus of the VCM. Soil will be removed from these locations with the goal of meeting the mixture DCGL (Appendix F) . In addition, an elevated concentration criterion in DOE Order 5400.5 (Chapter 4, section 4.A.1) must be satisfied once these areas have been remediated (DOE 1990, 58980.1 ). The DOE Order 5400.5 criterion is listed in the Appendix A defin itions section and is further discussed in Appendix F.
The areas of elevated concentrations were identified based on analytical data and November 2000 gamma surveys (Figure 3.0-2). These results were used to generate volume estimates that are presented in Appendix F. Based on a preliminary assessment of potential impacts to site ecology, corrective measures for protection of human health will also be protective of ecological receptors. A complete Ecological Screening Assessment will be presented in the VCM completion report.
4.0 PROPOSED VOLUNTARY CORRECTIVE MEASURE
4.1 Conceptual Model
SWMU 21-011 (k) is an outfall where treated industrial wastewater was discharged onto the north side of DP Mesa. The wastewater remain ing after the plutonium extraction contained a variety of radioactive and chemical constituents. The COPCs in the effluent would have been largely in solution, but because of their geochemical characteristics, most would have adsorbed onto sediment particles or organic colloids (Langmuir 1997, 56037).
COPCs in effluent that were deposited onto the colluvial slope would have preferentially adsorbed to organic matter in the soil and finer-grained particles because of their greater surface area and, in the case of clay minerals and solid organic matter, their high-cation exchange capacity. COPCs in effluent that were deposited onto the toe of the slope would have encountered mainly coarse-grained sediment. Adsorption of the radionuclides would likely have been onto small amounts of other components within the coarse-grained sed iment (e.g., organic matter, iron oxide coatings on larger grains, or clay particles adhered to larger grains).
During the period of effluent releases, contaminant inventories would have built up incrementally. Later development of a gully on the slope below SWMU 21-011 (k) allowed erosion of some of the contaminated sediments into the DP Canyon channel (LANL 1999, 63915).
May 2003 18 ER2003-0326

~ c c ':J 8 I\) 0)
..... co
~ '..;: I\) c 8
C=::J Existing structure - - --I '- ___ 1 Former structure
~ ~ ~ ~ ~ ~; Absorbtion bed
OoO Disposal shafts
------- Paved road
- -- Dirtroad
-··- Drainage pathway
--- Temporary radiation-control area fence
----- MDA T boundary
=====Outfall pipe
· 2-ft contour
0 50 100ft
F3.0-2NCM21 011 k/1 02902/lcf cARTography by A. Kron 4/3/02
Base map: FIMAD ACRVIEW, 4196
•· -16~-------',_,_ o'Ot,.o '-.-,
·-- :.:~:-:,~~~~ '',,, _ .. " ., ..
-~ · .. _. ,, / ·. ',,_
. ', OoO -,_ ;.q,_ --, , ---, · · ' 0 oO ', v.soo ', ·-. ' '--:-.:0oo0oo0 ---, ~'-61}.0·.,..'-<. 0 0 oo. 0 ', ·. '/L'> ' . , . 0° 0° ·. 0 '<.,"'"&0' . >-', . 0° o0° oO -- ~-- 'if -- ·-. __ o0oo0oo0 · .. _ -- / , o· o oo o-o o ·-._ --- , -, ...__, ,-__ oo oo o. o o··._ -, , ~ , , oo oo ·oo o
? ' ',, o·o oo · ooo ·. '0 ~ ', oo oo oo 0 /,,, ·->,_,_<Y?_.s-0 ---.--- __ o~()~~oC6~oO ' ', --, "0~,-o,.. -, o.
0oo
0oo
' ' ~r. - ··oo ·o '' <?, ' ' ',, "'"&0' ',,_ .. oo . ',, ~Ys ',, ----, -"-. ',- · --.0
' ....... ' I I ',~··. I . ,,
Figure 3.0-2 November 2000 in situ gross gamma survey results at SWMU 21-011(k) with circled areas planned for removal
~ ~ :::s 0' ..... (/)
~ c:: I\) ......
I c ...... ......
~ ~ ~ w
VCM Plan for SWMU 21-011 (k), Rev. 3
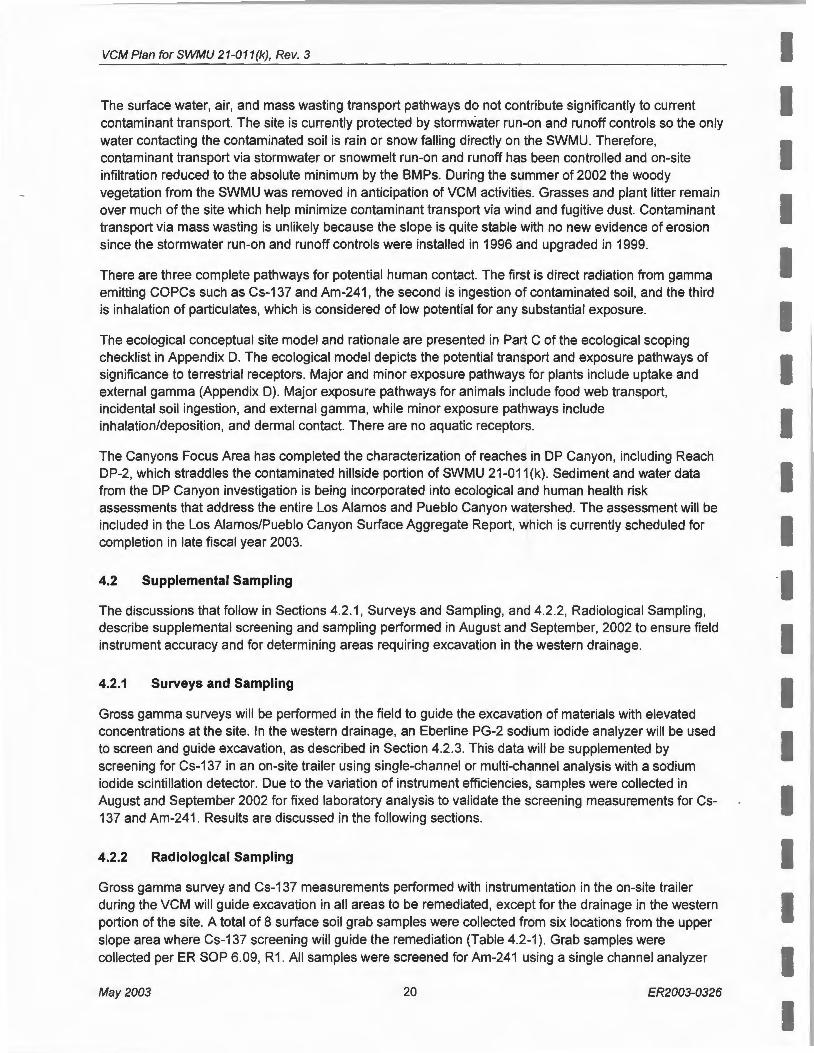
The surface water, air, and mass wasting transport pathways do not contribute significantly to current contaminant transport. The site is currently protected by stormwater run-on and runoff controls so the only water contacting the contaminated soil is rain or snow falling directly on the SWMU. Therefore, contaminant transport via stormwater or snowmelt run-on and runoff has been controlled and on-site infiltration reduced to the absolute minimum by the BMPs. During the summer of 2002 the woody vegetation from the SWMU was removed in anticipation of VCM activities. Grasses and plant litter remain over much of the site which help minimize contaminant transport via wind and fugitive dust. Contaminant transport via mass wasting is unlikely because the slope is quite stable with no new evidence of erosion since the stormwater run-on and runoff controls were installed in 1996 and upgraded in 1999.
There are three complete pathways for potential human contact. The first is direct radiation from gamma emitting COPCs such as Cs-137 and Am-241 , the second is ingestion of contaminated soil , and the third is inhalation of particulates, which is considered of low potential for any substantial exposure.
The ecological conceptual site model and rationale are presented in Part C of the ecological scoping checklist in Appendix D. The ecological model depicts the potential transport and exposure pathways of significance to terrestrial receptors. Major and minor exposure pathways for plants include uptake and external gamma (Appendix D). Major exposure pathways for animals include food web transport, incidental soil ingestion, and external gamma, while minor exposure pathways include inhalation/deposition, and dermal contact. There are no aquatic receptors.
The Canyons Focus Area has completed the characterization of reaches in DP Canyon, including Reach DP-2, which straddles the contaminated hillside portion of SWMU 21-011(k). Sediment and water data from the DP Canyon investigation is being incorporated into ecological and human health risk assessments that address the entire Los Alamos and Pueblo Canyon watershed. The assessment will be included in the Los Alamos/Pueblo Canyon Surface Aggregate Report, which is currently scheduled for completion in late fiscal year 2003.
4.2 Supplemental Sampling
The discussions that follow in Sections 4.2.1, Surveys and Sampling, and 4.2.2, Radiological Sampling, describe supplemental screening and sampling performed in August and September, 2002 to ensure field instrument accuracy and for determining areas requiring excavation in the western drainage.
4.2.1 Surveys and Sampling
Gross gamma surveys will be performed in the field to guide the excavation of materials with elevated concentrations at the site. In the western drainage, an Eberline PG-2 sodium iodide analyzer will be used to screen and guide excavation, as described in Section 4.2.3. This data will be supplemented by screening for Cs-137 in an on-site trailer using single-channel or multi-channel analysis with a sodium iodide scintillation detector. Due to the variation of instrument efficiencies, samples were collected in August and September 2002 for fixed laboratory analysis to validate the screening measurements for Cs-137 and Am-241 . Results are discussed in the following sections.
4.2.2 Radiological Sampling
Gross gamma survey and Cs-137 measurements performed with instrumentation in the on-site trailer during the VCM will guide excavation in all areas to be remediated , except for the drainage in the western portion of the site. A total of 8 surface soil grab samples were collected from six locations from the upper slope area where Cs-137 screening will guide the remediation (Table 4.2-1). Grab samples were collected per ER SOP 6.09, R1 . All samples were screened for Am-241 using a single channel analyzer
May 2003 20 ER2003-0326
-----.....
----... -· illllil
.....
••
-....
-
VCM Plan for SWMU 21-011 (k), Rev. 3
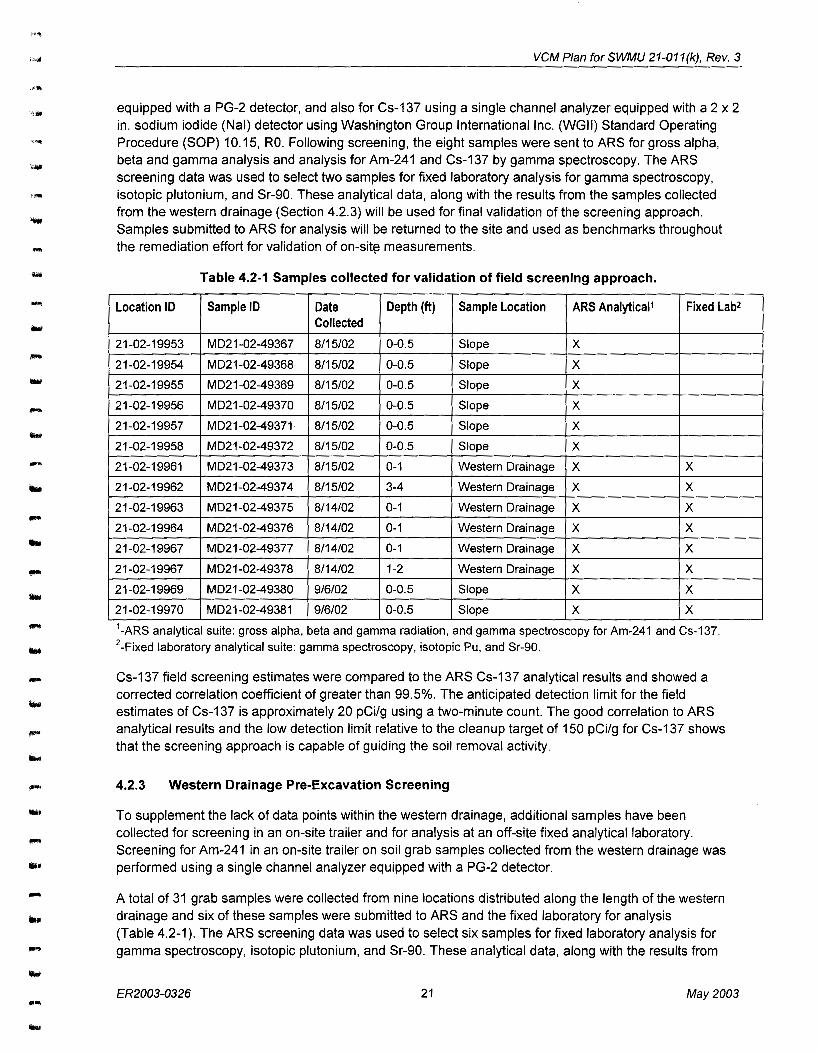
equipped with a PG-2 detector, and also for Cs-137 using a single channel analyzer equipped with a 2 x 2 in. sodium iodide (Nal) detector using Washington Group International Inc. (WGII) Standard Operating Procedure (SOP) 10.15, RO. Following screening, the eight samples were sent to ARS for gross alpha, beta and gamma analysis and analysis for Am-241 and Cs-137 by gamma spectroscopy. The ARS screening data was used to select two samples for fixed laboratory analysis for gamma spectroscopy, isotopic plutonium, and Sr-90. These analytical data, along with the results from the samples collected from the western drainage (Section 4.2.3) will be used for final validation of the screening approach. Samples submitted to ARS for analysis will be returned to the site and used as benchmarks throughout the remediation effort for validation of on-sit~ measurements.
Table 4.2-1 Samples collected for validation of field screening approach.
Location ID Sample ID Date Depth (ft) Sample Location ARS AnalyticaJ1 Fixed Lab2 Collected
21-02-19953 MD21-02-49367 8/15/02 0-0.5 Slope X
21-02-19954 MD21-02-49368 8/15/02 0-0.5 Slope X
21-02-19955 MD21-02-49369 8/15/02 0-0.5 Slope X
21-02-19956 MD21-02-49370 8/15/02 0-0.5 Slope X
21-02-19957 MD21-02-49371 8/15/02 0-0.5 Slope X
21-02-19958 M D21-02-49372 8/15/02 0-0.5 Slope X
21-02-19961 MD21-02-49373 8/15/02 0-1 Western Drainage X X
21-02-19962 MD21-02-49374 8/15/02 3-4 Western Drainage X X
21-02-19963 MD21-02-49375 8/14/02 0-1 Western Drainage X X
21-02-19964 MD21-02-49376 8/14/02 0-1 Western Drainage X X
21-02-19967 MD21-02-49377 8/14/02 0-1 Western Drainage X X
21-02-19967 MD21-02-49378 8/14/02 1-2 Western Drainage X X
21-02-19969 MD21-02-49380 9/6/02 0-0.5 Slope X X
21-02-19970 MD21-02-49381 9/6/02 0-0.5 Slope X X 1-ARS analytical suite: gross alpha, beta and gamma radiation, and gamma spectroscopy for Am-241 and Cs-137. 2-Fixed laboratory analytical suite: gamma spectroscopy, isotopic Pu, and Sr-90.
Cs-137 field screening estimates were compared to the ARS Cs-137 analytical results and showed a corrected correlation coefficient of greater than 99.5%. The anticipated detection limit for the field estimates of Cs-137 is approximately 20 pCi/g using a two-minute count. The good correlation to ARS analytical results and the low detection limit relative to the cleanup target of 150 pCi/g for Cs-137 shows that the screening approach is capable of guiding the soil removal activity .
4.2.3 Western Drainage Pre-Excavation Screening
To supplement the lack of data points within the western drainage, additional samples have been collected for screening in an on-site trailer and for analysis at an off-site fixed analytical laboratory . Screening for Am-241 in an on-site trailer on soil grab samples collected from the western drainage was performed using a single channel analyzer equipped with a PG-2 detector .
A total of 31 grab samples were collected from nine locations distributed along the length of the western drainage and six of these samples were submitted to ARS and the fixed laboratory for analysis (Table 4.2-1). The ARS screening data was used to select six samples for fixed laboratory analysis for gamma spectroscopy, isotopic plutonium, and Sr-90. These analytical data, along with the results from
ER2003-0326 21 May 2003

VCM Plan for SWMU 21-011(k), Rev. 3
the samples collected from the main body of the site will be used for final validation of the screening approach. Grab samples were collected at each location at one foot intervals from the surface to auger refusal per ER SOP 6.10, R2. Samples were collected from depths as great as 3 to 4ft below ground surface. All of the initial grab samples were screened for Am-241 using a single channel analyzer equipped with a PG-2 detector, and also for Cs-137 using a single channel analyzer equipped with a 2x2 in. Nal detector using WGII SOP 1 0.15, RO. The fixed Laboratory data will be shared with NMED as soon as it's received and prior to beginning any excavation activities and will be included in the VCM report for SWMU 21-011(k).
Review of the ARS screening data and the field screening estimates for Am-241 showed a correlation coefficient of 94%. The screening method provides a detection limit of about 10 pCi/g for a two-minute count. The good correlation to ARS analytical results, and the low detection limit relative to the cleanup target of 170 pCi/g for Am-241 in the western drainage shows that the screening approach is capable of guiding the soil removal activity.
Based on the field screening for Am-241, five areas within the western drainage were identified as having concentrations greater than or equal to 170 pCi/g (maximum contamination of 380 pCi/g). All of the samples with concentrations greater than 170 pCi/g were found from 0 to 2.0 ft bgs. Assuming an average of 150 ft2 for each anomaly and a 2-ft depth of excavation, the estimated volume of contaminated material to be removed from the western drainage is 56 yd3 (conservatively 60 yd3
). This value serves as a conservative upper limit for the total western drainage remediation and is used in the total volume estimates for the entire VCM.
4.3 Remedial Approach
Following the readiness review, mobilization and site preparation for remedial activities commenced. Mobilization activities included the delivery of site trailers, materials, and heavy equipment. Site preparation activities included clearing and grubbing of vegetation in areas to be excavated; set-up of site trailers; survey and staking of areas to be excavated; construction of site support zones; installation of sanitary facilities; tree removal and chipping; improvement and extension of the existing haul road; fence removal; installation of temporary fencing; and installation of stormwater BMPs.
Tree trunks over 8 in. in diameter were cut into nominal 15-ft lengths for subsequent use as stormwater run-on and runoff control diversion barriers. Prior to clearing and grubbing, on-site vegetation was sampled for waste characterization purposes as described in detail in Section 6.0. The material was cleared and stored in rolloff containers. After receipt and review of waste characterization results the material will be disposed of at Area Gat TA-54. The drainline from the northern fence line of the two holding tanks (structures 21-112 and -113) to the outfall at the southern end of the SWMU has been removed. This 4-in. diameter, cast iron drainline extended 80 ft from the south side of the North Perimeter Road to a discharge point just below the canyon rim. The soil above the cast iron drainline was excavated and the drainline removed. The drainline excavation trench was field screened using a gamma instrument and PG-2 detector in the same manner being followed for guiding the soil removal. Samples were collected immediately below the removed line and following collection of confirmation samples, the trench was backfilled. Based on soil screening results some soil removal and additional sampling will be required along the section of the drain line that formerly ran under the road. Once that work is accomplished the road will be repaired as described in Section 5.
During field activities, the Laboratory is monitoring worker exposure to radionuclide-contaminated soil at SWMU 21-011 (k) based on the requirements of the site-specific health and safety plan (SSHASP). The two high-volume air samplers proposed in the previous version of this VCM plan are not being
May2003 22 ER2003-0326
, ..
., lllii

..
.. .. .. .. -
-· Ill
-· ... -... ...
.....
""""
•• ... ...
.....
VCM Plan for SWMU 21-011 (k), Rev. 3
used. Upon further review of the project, Laboratory Air Quality Group personnel determined that highvolume air samples located in close proximity to the site, (i.e., across the DP Canyon drainage channel to the north) would not detect contamination present in suspended particulates from the VCM, because 1) once suspended, the particulates travel a much further distance before being deposited on the ground, and 2) the high-volume samplers will not collect an aliquot of sample sufficient for analysis in a short time period. In lieu of the high-volume samplers, the Laboratory is monitoring exposure to members of the public during remediation of 21-011 (k) by use of existing airnet stations. The Laboratory operates four airnet stations near the Los Alamos Airport and DP Road (Airnet stations: 9 - Los Alamos Airport, 68 -Airport Road, 62- Crossroads Bible Church, and 69- DP Road West Entrance). Airnet station 72 is just south of the site and is also being operated during the VCM. Airnet station 69 was shut down at the end of December 2002. These stations are downwind of SWMU 21-011 (k) and in the predominant wind direction and will be used to monitor potential exposure to the public from field activities at 21-011k. The data collected from these stations during the implementation of the VCM will be reported in the VCM Completion Report for SWMU 21-011 (k) .
The Air Quality Group personnel conducted a new source review for the SWMU 21-011(k) VCM to determine if a new air sampling station is required by National Emissions Standards for Hazardous Air Pollutants (NESHAPs) as adopted by 20.2.78 of the New Mexico Administrative Code (NMAC), and LANL Air Quality Group criteria. The soil characterization data for radionuclides was used with the appropriate release factors, as described in Appendix D of 40 CFR Part 61, to calculate an emissions estimate for excavating, transporting and treating the contaminated material onsite (1500 yd\ This calculation was conducted prior to the decision to excavate the material and transport it to Area Gat TA-54 for disposal and before the total volume estimate had been refined. Therefore, with the change in the remediation approach, the current volume estimate is lowered to 560 yd3
. The calculated emission estimate represents a conservative estimate of the potential effective dose equivalent. Dose assessments from the emissions estimates were calculated using CAP88, an EPA-approved dispersion-modeling program. Based on the previous modeling results, the potential effective dose equivalent from excavation and transport of the material to Area Gat TA-54 (560 yd3 of contaminated soil) to the nearest receptor along State Road 502 (based on predominant wind direction) would conservatively be 0.07 mrem/yr (based on the original 1500 yds\ which is below the monitoring threshold of 0.1 mrem/yr specified in Title 40 of the Code of Federal Regulations (40 CFR) Part 61, Subpart H (Radionuclide-NESHAPs).
Areas of the site with concentrations above 150 pCi/g Cs-137 and 170 pCi/g Am-241 have been surveyed and staked for excavation based on an initial walkover radiation survey conducted prior to the start of excavation. These areas showed excellent correlation to those shown in Figure 3.0-2. As these areas are excavated, real-time radiological screening combined with real-time mapping of gross gamma radiation is being used to determine whether enough media has been removed to achieve the established clean-up level. Excavated soil, sediment, and tuff are being staged on site within the bermed stockpile areas and covered with plastic sheeting. Silt fences, silt dikes, and/or straw wattles are being used to control run-on and runoff as described in the Storm Water Pollution Prevention Plan for 21-011 (k) (LANL 2002, 73189). As a BMP, soil/sediment currently located near the northern SWMU boundary and along the western and eastern edges of SWMU 21-011 (k) with Cs-137 concentrations just below the target clean-up level is being excavated first and staged on site. Confirmation sampling and a radiological survey of the entire site will be conducted prior to recontouring and placement of the vegetative cover over the site in accordance with Section 5.0, Confirmation Surveys and Sampling.
As the excavation process proceeds, the contaminated material is being placed in individual stockpiles from the various excavation areas until all of the material with Cs-137 concentrations greater than 150 pCi/g and material in the western drainage with Am-241 concentrations greater than 170 pCi/g have been excavated. All stockpile areas are in level easily-accessible portions of the site. In accordance with the No Longer Contained-In determination received from NMED on November 25, 2002, each 100 yd3 of
ER2003-0326 23 May 2003
VCM Plan forSWMU 21-011(k), Rev. 3
excavated material will be sampled for Appendix VIII volatile organic compounds (VOCs), the results reviewed with NMED prior to disposal of the soil at Area Gat TA-54, and the results included in the VCM Completion Report for SWMU 21-011(k). After receipt and review of the VOC results with NMED, rolloff containers will be brought on site and the excavated material will be placed into the containers using a front-end loader. Trucks will then be used to transport the full rolloff containers to Area G at TA-54. The trucks and rolloff containers will be surveyed by Health, Safety, and Radiation Protection (HSR-1) Radiological Control Technicians (RCTs) prior to being released from the site. To ensure efficient disposal at Area G, all waste shipping paperwork will be compiled in advance of transport.
Following excavation and transportation activities, project personnel will decontaminate all earth-moving equipment. Residual media adhering to equipment will be removed using dry decontamination methods including the use of wire brushes and scrapers (WGII SOP 1.08 Rev 1 ). If necessary, final equipment decontamination will be performed on a temporary wash pad with a high-density polyethylene (HOPE) liner. Cleaning solutions and wash water will be collected for proper disposal (Section 6.0). All parts of the equipment, including the undercarriage, wheels, tracks, chassis, and cab will be thoroughly cleaned. Air filters on equipment operating in the exclusion zone will be considered contaminated and will be removed and replaced before equipment leaves the site. A high-pressure sprayer along with long handled brushes and rods will be used to effectively remove contaminated material from equipment. Decontamination solutions will be containerized and sampled to determine final disposition (Section 6). Equipment will be surveyed by an HSR-1 RCT prior to being released from the site.
4.3.1 Site Restoration
Upon completion of excavation and removal, removal of the equipment, satisfactory completion of the site radiation survey and confirmation sample collection (described in Section 5.0), site restoration activities will be implemented. Restoration activities will involve recontouring the excavated areas, including placement of at least 560 yd3 of clean fill material in the excavated areas, and revegetation of the entire site.
At least 560 yd3 of clean borrow material will be used as restoration materials for the areas excavated during the VCM. Borrow material will be hauled to the site. Material brought in from off site will be taken from a borrow source from an undisturbed face within the vendors pit with no history of industrial activity.
Areas excavated during the VCM will be restored. Due to the fact that the ground slopes at the site vary from steep to nearly flat, three different restoration approaches have been prepared to cover the various conditions. Diagrams of the three engineered restoration approaches can be found in drawing 02-030, Restoration Cover sections and details (Attachment 2). Specifications for fill placement in the restoration areas are detailed in Attachment 2.
Restoration of the disturbed areas will be performed from the top of the slope downward (south to north). On steeply sloping excavated areas (greater than 2: 1 ), benches will be cut into the tuff bedrock and a boulder retaining wall set in place at the toe of the restoration to eliminate creep of the placed materials. Compacted lifts will be placed until a minimum 2ft of fill has been placed. Compaction will be achieved using a small remotely operated trench compactor or hand operated vibrating plate compactor as approved by the geotechnical engineer. The final slope of the restoration will be 2:1 or less. Following placement of the fill material, erosion matting will be placed over the restored area and secured per the manufacturer's instructions.
Restoration of the areas sloping approximately 2:1 will be the same as for the steeper sloped areas discussed above except that a boulder retaining wall at the toe of the restoration fill is not required. Areas with slopes flatter than 2:1 will be backfilled with a minimum 2 ft of backfill placed in compacted lifts. The
May 2003 24 ER2003-0326
., .. lllllt ..

•• ... •• •• •• •• •• ••
••
...
...
•• •• •• .. , IIIII'
....
... ....
...
... ..... ... -· ...
'"''"
.....
.....
VCM Plan for SWMU 21-011 (k), Rev. 3
up-slope edge of the backfill will be feathered into the hillside. The toe of the restoration will be sloped at a 2:1 slope. Erosion matting will be placed over the restoration materials and secured to the ground per the manufacturer's requirements to minimize stormwater runoff .
Borrow material will be placed in lifts and compacted. All grades will be finished in conformance with the lines and grade on the plans. Run-on controls will be installed at the south end of the site to limit erosion . The run-on controls will consist of a water diversion ditch located at the top of the slope of the southern boundary of SWMU 21-011 (k) to prevent stormwater from running onto the slope. The BMPs will remain at the south and north ends of the site until vegetation is well established .
Once grading is complete, revegetation activities will commence in the spring of 2003. Revegetation activities will conform to project specifications prepared by a landscape architect licensed in the State of New Mexico. Seeded areas will be maintained in accordance with the vegetation specification (Attachment 2) until a well developed vegetative cover is established. Monthly inspections of the BMPs and cover will be performed as part of the site-specific LANL Surface Water Pollution Prevention Plan (SWPPP) for the Project.
5.0 CONFIRMATION SURVEYS AND SAMPLING
5.1 Confirmation Sampling beneath the Outfall Drainline at SWMU 21-011(k)
At a minimum, five locations will be sampled below the removed outfall drainline leading to SWMU 21-011(k) (Figure 5.1-1). Samples will be collected from two depths (0 to 12 in. and 24 to 36 in. below the bottom of the removed pipe). Samples will be analyzed by gamma spectroscopy for Cs-137, by alpha spectroscopy for Am-241 and isotopic Pu, and by gas proportional counting for Sr-90 at an off-site fixed laboratory and screened for gross alpha, beta, and gamma radiation for DOT shipping purposes. A sample point will be located at the joint nearest the north and south ends of the removed drainline. The remaining three sample locations will be distributed along the length of the removed drain line. Gamma screening will be conducted along the length of the line using the same radiological detection instrumentation used for the excavation activities to identify potential release locations. Sample locations will be biased to areas of elevated gamma radiation identified during the screening as well as locations of fractures or staining. Additional sample locations will be added as appropriate. In the event that elevated radiological screening indicates a possible release, deeper samples will be collected until site background levels are reached or a clear decreasing trend is observed to ensure the determination of the nature and extent of any potential contamination. Step-out samples to define nature and extent laterally will be collected approximately 5 ft in each direction until contamination has been bounded (Figure 5.1-1 ) .
Much of the line to be removed is beneath the roadbed leading to the TSTA facility. Since this is the sole access road to this operating nuclear facility, the above samples will be collected in stages. The line will be removed and samples collected so as not to completely block access to TSTA. Road repairs will be made to one side of the road prior to removal of the line and sampling the other side. The final details of the removal and sampling will be provided in the VCM Completion Report for SWMU 21-011 (k).
ER2003-0326 25 May 2003

VCM Plan for SWMU 21-011(k), Rev. 3
:western,...
1: dramage
. . path
.. Kl· \ .
. ·. >~,:-.
\ ::
p· ·· ...... . ·~x···· ··· .. . fl. ···· .. II ··.... · ...
--11__ . ·. · ..
• ···· ... ·...... Outfall
··discharge point
... ········· ·········· ...
SWM U_~1-011 (k)
·········;-,,0 ....
. ..... : ... : .............. :··
········· ... ·· ..
···········-... .-"'-----"'-----i
0 50ft I I I I I I
~Existing structure t --- Paved road
--- Dirtroad N
=====Outfall pipe
~-- Temporary radiation control area fence
---- Drainage pathway
------ MDA T boundary
Contour interval 2 ft
--- SWMU boundary
~ Proposed confirmation sampling location
Figure 5.1-1. Outfall pipe to be removed and proposed confirmation sample locations at SWMU 21-011(k)
5.2 Confirmation Surveys and Sampling of Soil Removal Areas
Confirmation that cleanup goals have been met will be made through collection of samples from both remediated (soil removal) areas and site-wide unremediated areas. Sampling frequencies are different for each type of excavated area. In each discrete remediated area, a minimum of one surface (0 to 12 in.) confirmation sample will be collected regardless of the area's size. For remediated areas larger than 25
May 2003 26 ER2003-0326
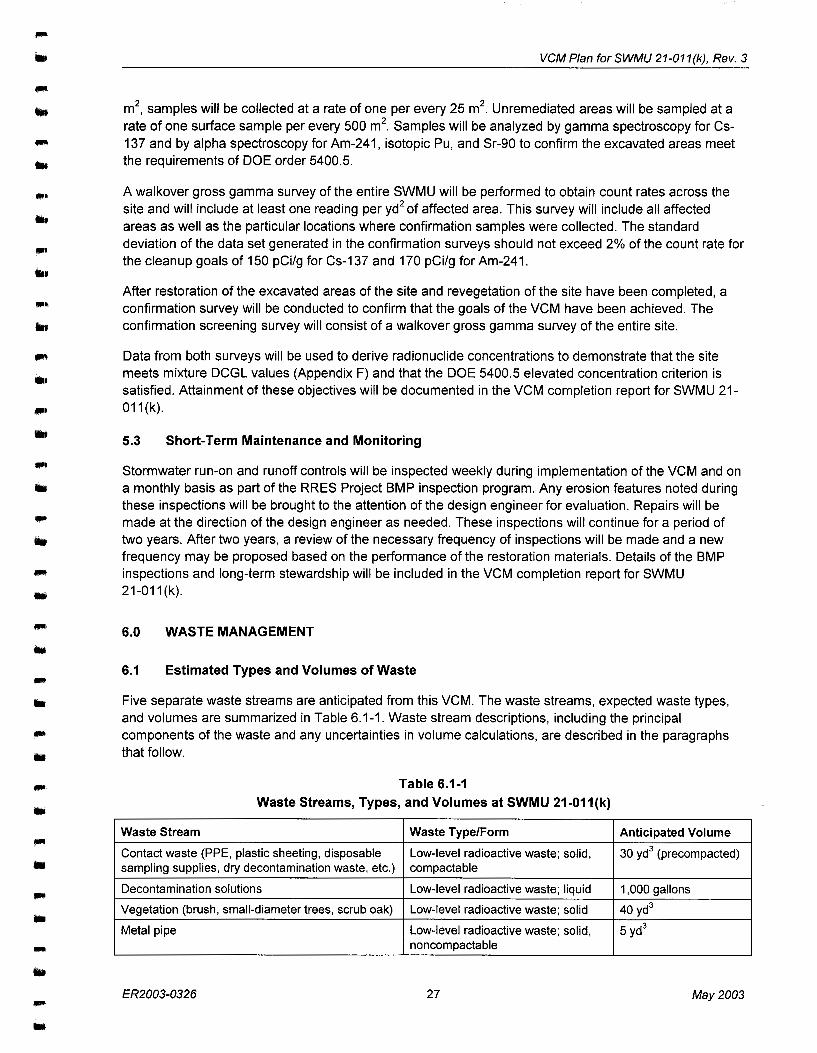
...
... (Ill
•• ... •• •• ...
••
...
.. ,
-· .. , .. , ....
....
..,,
...
!IIIII·
••
• ...
...
..
VCM Plan for SWMU 21-011 (k), Rev. 3
m2, samples will be collected at a rate of one per every 25m2
. Unremediated areas will be sampled at a rate of one surface sample per every 500 m2
. Samples will be analyzed by gamma spectroscopy for Cs-137 and by alpha spectroscopy for Am-241, isotopic Pu, and Sr-90 to confirm the excavated areas meet the requirements of DOE order 5400.5 .
A walkover gross gamma survey of the entire SWMU will be performed to obtain count rates across the site and will include at least one reading per yd2 of affected area. This survey will include all affected areas as well as the particular locations where confirmation samples were collected. The standard deviation of the data set generated in the confirmation surveys should not exceed 2% of the count rate for the cleanup goals of 150 pCi/g for Cs-137 and 170 pCi/g for Am-241 .
After restoration of the excavated areas of the site and revegetation of the site have been completed, a confirmation survey will be conducted to confirm that the goals of the VCM have been achieved. The confirmation screening survey will consist of a walkover gross gamma survey of the entire site.
Data from both surveys will be used to derive radionuclide concentrations to demonstrate that the site meets mixture DCGL values {Appendix F) and that the DOE 5400.5 elevated concentration criterion is satisfied. Attainment of these objectives will be documented in the VCM completion report for SWMU 21-011 (k) .
5.3 Short-Term Maintenance and Monitoring
Stormwater run-on and runoff controls will be inspected weekly during implementation of the VCM and on a monthly basis as part of the RRES Project BMP inspection program. Any erosion features noted during these inspections will be brought to the attention of the design engineer for evaluation. Repairs will be made at the direction of the design engineer as needed. These inspections will continue for a period of two years. After two years, a review of the necessary frequency of inspections will be made and a new frequency may be proposed based on the performance of the restoration materials. Details of the BMP inspections and long-term stewardship will be included in the VCM completion report for SWMU 21-011(k) .
6.0 WASTE MANAGEMENT
6.1 Estimated Types and Volumes of Waste
Five separate waste streams are anticipated from this VCM. The waste streams, expected waste types, and volumes are summarized in Table 6.1-1. Waste stream descriptions, including the principal components of the waste and any uncertainties in volume calculations, are described in the paragraphs that follow.
Table 6.1-1 Waste Streams, Types, and Volumes at SWMU 21-011 (k)
Waste Stream Waste Type/Form Anticipated Volume
Contact waste (PPE, plastic sheeting, disposable Low-level radioactive waste; solid, 30 yd3 (precompacted) sampling supplies, dry decontamination waste, etc.) compactable
Decontamination solutions Low-level radioactive waste; liquid 1 ,000 gallons
Vegetation (brush, small-diameter trees, scrub oak) Low-level radioactive waste; solid 40 yd3
Metal pipe Low-level radioactive waste; solid, 5 yd3
noncompactable
ER2003-0326 27 May 2003

VCM Plan for SWMU 21-011 (k), Rev. 3
Table 6.1-1 (continued)
Waste Stream Waste Type/Form Anticipated Volume
Municipal refuse, uncontaminated trash and debris Municipal solid waste (MSW); solid 25yd3
(cardboard, paper, plastic, etc.)
Soil, tuff, and sediment Low-level radioactive waste; solid, 560 yd3
noncompactable
Contact waste. This waste stream will include various types of disposable debris including personal protective equipment (gloves, booties, filter cartridges); plastic sheeting (e.g., liners, tarps and contamination control covers); sampling supplies such as plastic scoops, plastic bags, jars, and filters; and dry decontamination waste. These wastes have the potential to be become contaminated through direct contact with contaminated environmental media. Characterization of this waste will be determined through soil contaminant concentrations and from direct radiological surveys. The volume of contact waste will be kept to a minimum by decontaminating any reusable items that come into contact with the contaminated environmental media. ·
Decontamination solutions. This waste stream will consist of liquids generated from on-site decontamination of tools; excavation equipment, vehicles; sampling equipment; and personnel. The volume of decontamination solutions will be minimized using "dry" techniques.
Decontamination solutions will be containerized and characterized through direct sampling in order to demonstrate compliance with Waste Acceptance Criteria (WAC) at theTA-50 Radioactive Liquid Waste Treatment Facility (RLWTF).
Vegetation. Brush, small trees, and scrub oak were cleared from the site during site preparation activities. Large ponderosa pines were felled, their branches cut off, and the trunks cut into nominal 15ft lengths. These tree trunks are being used as BMPs. Disposition of the remaining vegetation will be determined by results from the waste characterization samples described in the following paragraph.
A total of three composite samples of the vegetation removed from the site were collected during the week of June 3, 2002; two one-gallon samples were collected for waste characterization purposes to determine if the vegetation complies with waste acceptance criteria for either disposal at Area Gat TA-54 or at the TA-16 incinerator, and a third sample was collected for screening by the ARS Laboratory to ensure compliance with the 2000 pCi/g total activity limit for transporting radioactively contaminated materials.
Each of the two characterization samples consisted of three plant species. One sample consisted of trees and bushes growing near the region with the highest levels of radioactivity within the Radiation Control Area (RCA); the second sample was collected from plants growing within the RCA. These two samples were analyzed by gamma spectroscopy, for Sr-90 by test method 905.0. and Cs-137 by test method 901.1. In addition, they were analyzed for Am-241, Pu-238, and Pu-239 by alpha spectroscopy following test method 300 in DOE's Environmental Measurements Laboratory Procedures Manual.
Metal pipe. A 4-in.-diameter, cast iron drain line from the two-wastewater treatment tanks will be removed and packaged as low-level radioactive waste. This waste stream will be characterized by survey of direct and removable contamination on the drainline. All surveys will be performed by a qualified RCT.
Municipal refuse. This waste stream will include miscellaneous uncontaminated cardboard, plastic, and paper generated during the project. Administrative controls will be established to minimize the introduction of items (e.g., packaging materials) into the exclusion zone and/or radiological control areas.
May 2003 28 ER2003-0326
IIIII ..
IIIII '

... •• ... •• ... ... ... ... ... ... ... ... ... ... ... 1111
...
..,,
---
VCM Plan for SWMU 21-011 (k), Rev. 3
As much as practicable, plastic sheeting (e.g., tarps, liners, and contamination control covers) and reusable supplies will be decontaminated, surveyed, and released by a qualified RCT. All recyclable materials will be segregated from this waste stream prior to disposal.
Soil, tuff, and sediment. This waste stream will include the 500 yd3 of excavated soil, tuff, and sediment contaminated above the cleanup goal of 150 pCi/g Cs-137 and 60 yd3 Am-241 contaminated sediment above the cleanup goal of 170 pCi/g from the western drainage .
6.2 Method of Management and Disposal
This section describes the planned methods of managing the waste from the time of generation to final disposal.
Contact waste. This waste will be collected in 55-gallon plastic bags and deposited into metal collection boxes (approx. 90 cu ft capacity) for interim storage. The metal boxes will remain in an on-site radioactive waste staging area located until filled and prepared for transport. The contact waste will then be shipped to the low-level waste (LLW) Compaction Facility at Area Gat TA-54 for disposal.
Decontamination solutions. Wastewater from the on-site decontamination pad will be pumped into plastic tuff tanks (330-gal capacity) and stored in secondary containment within a liquid radioactive waste staging area. Liquid waste samples will be collected for characterization purposes. Radioactively contaminated liquids will be transported in the tuff tanks to theTA-50 RLWTF for disposal.
Vegetation. Two vegetation samples were collected from SWMU 21-011 (k) prior to clearing activities conducted in July 2002. Samples were analyzed for gamma spectroscopy, isotopic plutonium, Sr-90 and, Am-241 by alpha spectroscopy. Of the radionuclide COPCs present at the site, only Cs-137 and Sr-90 were detected in the samples. Cs-137 ranged from 1.81 pCi/g to 2.45 pCi/g. Sr-90 ranged from 114 pCi/g to 283 pCi/g. Since the Sr- 90 values are higher than the anticipated residual levels remaining in the site soils after the VCM, all of the vegetation materials will be disposed of as LLW at Area Gat TA-54.
Metal pipe. The cast iron drain line will be placed into a lined rolloff container and staged in an on-site radioactive waste storage area. This waste stream will be disposed at Area Gat TA-54.
Municipal refuse. Uncontaminated trash will be collected daily in plastic drum liners and staged on site in a solid waste storage area. This waste will be disposed at the Los Alamos County Landfill.
Soil, tuff, and sediment. Contaminated soil, tuff, and sediment will be excavated and staged on-site in a level easily accessible area. Once all excavation activities are complete the material will be loaded into lined roll off containers and transported to Area G at T A-54.
7.0 PROPOSED SCHEDULE AND UNCERTAINTIES
The fieldwork portion for this VCM began when the vegetation was removed and pre-excavation screening and sampling was conducted in July and August 2002. The excavation, transport, and disposal for this VCM is anticipated to be completed by the end of May 2003 (Table 7.0-1). Fifteen working days have been allotted for a site readiness review, training, and mobilization. Six working days have been allotted for site preparation activities. One hundred five working days have been scheduled for excavation of contaminated material, transportation of contaminated material to Area G of TA-54 and confirmation surveys and sample collection. Ten working days have been allotted for site restoration activities. Demobilization activities are schedule to take fifteen working days. Seventy-five working days have been
ER2003-0326 29 May 2003

VCM Plan for SWMU 21-011(k), Rev. 3
allotted for waste disposal activities. The VCM Completion Report will be prepared and submitted to the NMED Hazardous Waste Bureau (HWB) by October 31, 2003.
Table 7.0-1 VCM Field Work Schedule
Activity Workday
Start Finish Duration
Submit VCM plan to NMED N/A N/A TBDa
Readiness review/mobilization/pre- 15 days November 14, November 29, excavation radiological survey 2002 2002
Site preparation 6 days November 14, November 20, 2002 2002
Excavation, confirmation sampling, and post- 105 days November 21, May 31, 2003 excavation radiological survey 2002
Review/Transmit VOC results 60 days February 17, April 15, 2003 2003
Waste management/disposal 75 days February 17, May 31,2003 2003
Site restoration and final radiological survey 30 days June 1, 2003 July 11, 2003
Demobilization 15 days July 14, 2003 July 31, 2003
Approximate VCM working days 175 days November 11, July, 2003 2002
VCM Completion Report Submittal N/A N/A October 31, 2003
aTBD -to be determined
8.0 REFERENCES
The following list includes all references cited in this document. Parenthetical information following each reference provides the author, publication date, and the ER identification (ID) number. This information also is included in the citations in the text. ER ID numbers are assigned by the Laboratory's RRES Project to track records associated with the Project. These numbers can be used to locate copies of the actual documents at the RRES Project's Records Processing Facility and, where applicable, with the RRES Project reference library titled "Reference Set for Material Disposal Areas, Technical Area 54."
Copies of the reference library are maintained at the NMED Hazardous Waste Bureau; the DOE Los Alamos Area Office; United States Environmental Protection Agency, Region 6; and the RRES Project Material Disposal Areas Focus Area. This library is a living collection of documents that was developed to ensure that the administrative authority has all the necessary material to review the decisions and actions proposed in this document. However, documents previously submitted to the administrative authority are not included.
DOE (US Department of Energy) 1988. "DOE Headquarters Environmental Survey of Los Alamos National Laboratory." (DOE 1988, 15363)
DOE (US Department of Energy) 1990. "Radiation Protection of the Public and Environment," DOE Order 5400.5. (DOE 1990, 58980.1)
May 2003 30 ER2003-0326
J
...
...
•• ... •• IJIIII! .. , 1111111
-
..
-
--
VCM Plan forSWMU 21-011(k), Rev. 3
DOE, June 13, 2000. "Procedure for the Release of Residual Radioactive Material from Real Property," Los Alamos National Laboratory memorandum to D. Glenn (DOE Area Manager) from C. Soden (ESH Division Director), Los Alamos, New Mexico. (DOE 2000, 67489.1)
EPA (US Environmental Protection Agency), April10, 1990. "Region 6 Hazardous Waste Permit (Hazardous and Solid Waste Amendments)," Permit NM0890010515. (EPA 1990, 01585.2)
EPA (US Environmental Protection Agency), August 22, 1997. "Establishment of Cleanup Levels for CERCLA Sites with Radioactive Contamination," OSWER No. 9200.4-18, Washington, DC (EPA 1992 58693)
EPA (US Environmental Protection Agency), November 1, 2001. "EPA Region 6 Human Health MediumSpecific Screening Levels, US EPA Region 6." (EPA 2000, 71466)
Langmuir, D., 1997. Aqueous Environmental Geochemistry, Prentice-Hall, Inc., ISBN 0-02-367412, Upper Saddle River, New Jersey. (Langmuir 1997, 56037)
LANL (Los Alamos National Laboratory), May 1991. "TA-21 Operable Unit RFI Work Plan for Environmental Restoration", Los Alamos National Laboratory report LA-UR-91-962, Los Alamos, New Mexico. (LANL 1991, 07528.1)
LANL (Los Alamos National Laboratory), February 28, 1994. "Phase Report 1C, TA-21 Operable Unit RCRA Facility Investigation, Outfalls Investigation," Los Alamos National Laboratory report LA-UR-94-228, Los Alamos, New Mexico. (LANL 1994, 31591.1)
LANL (Los Alamos National Laboratory), 1994. "Phase Report Addendum 18 & 1 C Operable Unit 1106 RCRA Facility Investigation Phase Report," Los Alamos National Laboratory report LA-UR-94-4360, Los Alamos, New Mexico. (LAN L 1994, 52350.1)
LANL (Los Alamos National Laboratory), September 1, 1996. "Interim Action Plan for Potential Release Site 21-011 (K) Discharge System Field Unit 1, September 1996," Los Alamos National Laboratory report LA-UR-96-1609, Los Alamos, New Mexico. (LANL 1996, 54790.2)
LANL (Los Alamos National Laboratory), 1997. "Interim Action Report for Potential Release Site 21-011 (k) Discharge System Field Unit 1, April 1997," Los Alamos National Laboratory report, Los Alamos, New Mexico. (LANL 1997, 55648.2)
LANL (Los Alamos National Laboratory), August 26, 1999. "Evaluation of Sediment and Alluvial Groundwater in DP Canyon, Reaches DP-1, DP-2, DP-3, and DP-4," Los Alamos National Laboratory document LA-UR-99-4238, Los Alamos, New Mexico. (LANL 1999, 63915)
LANL (Los Alamos National Laboratory), December 1, 1999. "Screening Level Ecological Risk Assessment Methods," Rev.1, Los Alamos National Laboratory report LA-UR-99-1405, prepared by R. Ryti, E. Kelly, M. Hooten, G. Gonzales, and L. Soholt, ER Project A3 Focus Area, Los Alamos National Laboratory, Los Alamos, New Mexico. (LANL 1999, 64783.1)
LANL (Los Alamos National Laboratory), January, 2001. "Release/Discharge Notification," Los Alamos National Laboratory document, Permit Number NM0028355, Los Alamos, New Mexico. (LANL 2001, 72667)
ER2003-0326 31 May 2003
VCM Plan for SWMU 21-011(k), Rev. 3
LANL, March 2001. "Derivation and Use of Radionuclide Screening Action Levels, LANL Environmental Restoration Project," Los Alamos National Laboratory report LA-UR-01-990, Los Alamos, New Mexico. (LANL 2001, 69683.1)
LANL (Los Alamos National Laboratory), October 2001. Environmental Restoration Project Communication Record, Los Alamos, New Mexico. (LANL 2001, 70217)
LANL (Los Alamos National Laboratory), March 2002. "ECORISK Database (Release 1.4), ER package #186," Environmental Restoration Project, Los Alamos, New Mexico. (LANL 2002, 72802)
LANL (Los Alamos National Laboratory), Apri12002. "Human Health Risk-Based Screening Methodology," Los Alamos National Laboratory report LA-UR-02-1563, Los Alamos, New Mexico. (LANL 2002, 72639)
LANL (Los Alamos National Laboratory), March 2002. "Stabilization of the Contaminated Tuff and Sediment at the Los Alamos National Laboratory," prepared by IT Corporation for the Environmental Restoration Project, Los Alamos, New Mexico. (LANL 2002, 72638)
LANL (Los Alamos National Laboratory), 2002. "Cover Thickness Calculation," prepared by WGI, Inc., for the Environmental Restoration Project, Los Alamos, New Mexico. (LANL 2002, 73217)
LANL (Los Alamos National Laboratory), 2002. "VCM Plan for SWMU 21-011(k) at TA-21," Los Alamos National Laboratory document LA-UR-02-2218, Los Alamos, New Mexico. (LANL 2002, 73085.2)
LANL (Los Alamos National Laboratory), May 2002. "Voluntary Corrective Measure at Potential Release Site 21-011(k)," Stormwater Pollution Prevention Plan prepared by WGI, Inc., for the Environmental Restoration Project, Los Alamos, New Mexico. (LANL 2002, 73189)
LANL (Los Alamos National Laboratory), 2002. "VCM Plan for SWMU 21-011(k) at TA-21, Revision 1," Los Alamos National Laboratory document LA-UR-02-3807, Los Alamos, New Mexico. (LANL 2002, 73654.2)
LANL (Los Alamos National Laboratory), 2002. "VCM Plan for SWMU 21-011(k) at TA-21, Revision 2," Los Alamos National Laboratory document LA-UR-02-6797, Los Alamos, New Mexico. (LANL 2002, 73722)
LANL (Los Alamos National Laboratory), May 2002. Personal communication between John Crocker and Harvey Decker, Los Alamos National Laboratory telephone log, Los Alamos, New Mexico. (LANL 2002, 73115)
LANL (Los Alamos National Laboratory), August 2002. "Facility Hazard Categorization for the Voluntary Corrective Measure (VCM) at Solid Waste Management Unit (SWMU) 21-011(k)," Los Alamos National Laboratory memorandum to B. Ramsey (RRES-DO) from D. Mcinroy (RRES-ER), Los Alamos, New Mexico. (LANL 2002, 73392)
LANL (Los Alamos National Laboratory), September 2002. "Withdrawal of Revision 1 of the Voluntary Corrective Measures (VCM) Plan for Solid Waste Management Unit (SWMU) 21-011(k), at Technical Area (TA) 21 ,"Los Alamos National Laboratory letter to J. Young (NMED-HWB) from D. Mcinroy (ER Project), Los Alamos, New Mexico. (LANL 2002, 73605)
May 2003 32 ER2003-0326
1111!11 ..
•• •• •• •• •• ••
... ••
""'I
.. -..
.. --.. ---·-••
VCM Plan for SWMU 21-011 (k), Rev. 3
LANL (Los Alamos National Laboratory), November 2002. "Sampling Notification," Los Alamos National Laboratory letter to J. Young (NMED-HWB) from Roy Bohn (ER Project), Los Alamos, New Mexico. (LANL 2002, 73723)
LANL (Los Alamos National Laboratory), November 2002. "Submittal of Off-site Analytical Laboratory Data to Validate the Proposed Screening Method to be Used during the VCM at SWMU 21-011(k)," Los Alamos National Laboratory record of communication to V. Maranville (NMED) from P. Bertino (LANL RRES-R), Los Alamos, New Mexico. (LANL 2002, 73725)
LANL (Los Alamos National Laboratory), November 5, 2002. "Request for 'No Longer Contained In' Determination for Soil, Tuff, and Sediment at SWMU 21-011 (k) at TA-21 ," Los Alamos National Laboratory letter to J. Young (NMED) from D. Mcinroy (LANL ER Project), Los Alamos, New Mexico. (LANL 2002, 73721)
LANL (Los Alamos National Laboratory), January 16, 2003. "Submittal of Response to Notice of Deficiency (NOD), VCM Plan for SWMU 21-011(k) at Technical Area 21, Rev. 2," Los Alamos National Laboratory letter with enclosure to J. Young (NMED) from D. Mcinroy (LANL RRES-R Program), Los Alamos, New Mexico. (LANL 2002, 75936)
NMED (New Mexico Environment Department), December 18, 2000. "Technical Background Document for Development of Soil Screening Levels (Volume I Soil Screening Guidance Technical Background Document)," New Mexico Environment Department Hazardous Waste Bureau and Ground Water Quality Bureau Voluntary Remediation Program, Santa Fe, New Mexico. (NMED 2000, 68554)
NMED (New Mexico Environment Department) November 25, 2002. "Contained in Determination for Solid Waste Management Unit (SWMU) 21-011 (k), Technical Area 21 ," New Mexico Environment Department letter to John Browne (LANL Director) from V. Maranville (NMED HWB), Santa Fe, New Mexico. (NMED 2002, 73720)
NMED (New Mexico Environment Department), May 15, 2002. "Notice of TechnicallncompletenessVCM Plan for SWMU 21-011 (k)," State of New Mexico Environment Department letter to J. Browne (LANL Director) from J. Young (NMED), Santa Fe, New Mexico. (NMED 2002, 73201)
NMED (New Mexico Environment Department), April 22, 2003. "Comments and Conditions for Notice of Deficiency Response, Solid Waste Management Unit (SWMU) 21-011 (k) VCM Plan," State of New Mexico Environment Department letter to G. P. Nanos (LANL Interim Director) from J. Bearzi (NMED/HWB), Santa Fe, New Mexico. (NMED 2003, 75935)
NMED (New Mexico Environment Department), December 2002. "Notice of Deficiency-Voluntary Corrective Measures Plan for SWMU 21-011 (k) at TA 21, Revision 2," Santa Fe, New Mexico. (NMED 2002, 73724)
Ryti, R., P. Longmire, D.E. Broxton, S.L. Reneau, and E.V. McDonald, September 22, 1998. "Inorganic and Radionuclide Background Data for Soils, Canyon Sediments, and Bandelier Tuff at Los Alamos National Laboratory," Los Alamos National Laboratory report LA-UR-98-4847, Los Alamos, New Mexico. (Ryti et al. 1998, 59730)
ER2003-0326 33 May 2003
... ••
•• •• •• ... ""' ••
Appendix A """
Acronyms, Glossary, and Metric Conversion Tables -------------

!IIIII
•• ... •• ... •• IIIII•
•• ....
,. . ... ""''
--------
----lilllll
"""'
APPENDIX A ACRONYMS, GLOSSARY, AND METRIC CONVERSION TABLES
A-1.0 ACRONYMS
ALARA as low as reasonably achievable
AOC area of concern
BGS below ground surface
BMP best management practice
COPC chemical of potential concern
CST Chemical Science and Technology (Laboratory Division)
CVAA cold vapor atomic absorption
DCGL derived concentration guideline
DOE US Department of Energy
DNA delayed neutron assay
EPA US Environmental Protection Agency
EQL estimated quantitation limit
ER environmental restoration
ESL ecological screening level
FIMAD Facility for Information Management, Analysis, and Display
HSR Health Safety and Radiation Protection
HSWA Hazardous and Solid Waste Amendments of 1984
HWB Hazardous Waste Bureau
lA interim action
Laboratory Los Alamos National Laboratory
LLW low-level waste
MDA material disposal area
MDL method detection limit
NMED New Mexico Environment Department (New Mexico Environmental Improvement Division before 1991)
PRS potential release site
QA quality assurance
ER2003-0326 A-1 May 2003

VCM Plan for SWMU 21-011(k), Rev. 3
RCA radiation control area
RCT radiological control technician
RLWTF radioactive liquid waste treatment facility
RRES Risk Reduction and Environmental Stewardship
SAL screening action level
SOP standard operating procedure
SRSG single radionuclide soil guidelines
SSHASP site-specific health and safety plan
SVOC semivolatile organic compound
SWMU solid waste management unit
SWPPP surface water pollution prevention plan
TA technical area
TAL target analyte list
TCLP toxicity characteristic leaching procedures
TST A tritium systems test assembly
VCP vitrified-clay pipe
VOC volatile organic compound
WAC waste acceptance criteria
WWTP waste water treatment plant
A-2.0 GLOSSARY
Administrative authority (AA). The Director of the New Mexico Environment Department, or his/her designee, or the U.S. Environmental Protection Agency.
Alluvium. Clay, silt, sand, and gravel transported by water and deposited on streambeds, flood plains, and alluvial fans.
Area of concern (AOC). An area at the Laboratory known or suspected to be contaminated with radionuclides but not contaminated by hazardous chemicals or hazardous waste.
Background value (BV). The upper tolerance limits (UTLs) of background sample results, calculated as the upper 95% confidence limit for the 95th percentile. When a UTL cannot be calculated, either the detection limit or the maximum reported value is used as a BV; BVs are used as simple threshold numbers to identify potentially contaminated site sample results that are greater than background levels in that geological sample medium (or group of media). All inorganic chemicals and radionuclides have BVs.
Baseline risk assessment (also known as risk assessment). A site-specific analysis of the potential adverse effects of hazardous substances that are released from a site in the absence of any control or
May 2003 A-2 ER2003-0326
IIIII!
J
IIIII! I
IIIII! ..
!IIIII
•• ... ... ... •• ''" ... ....
•• .... •
-----,...
-----
VCM Plan for SWMU 21-011 (k), Rev. 3
mitigation actions. A baseline risk assessment consists of four steps: data collection and analysis, exposure assessment, toxicity assessment, and risk characterization .
Calibration. Process used to identify the relationship between the true (reference) analyte concentration or other variable and the response of a measurement instrument, chemical analysis method, or other measurement system.
Chemical of potential concern (COPC). Chemical, detected at a site, that has the potential to adversely affect human and/or ecological receptors due to its concentration, distribution, and mechanism of toxicity. A COPC remains a concern until exposure pathways and receptors are evaluated in a sitespecific risk assessment.
Cold vapor atomic absorption (CVAA). An analytical technique used for measuring mercury; it is described in EPA Methods 7470A (Mercury in Liquid Waste) and 7471A (Mercury in Solid or Semisolid Waste). The technique is based on the absorption of radiation at 253.7-nm by mercury vapor. The mercury is reduced to the elemental state and aerated from solution in a closed system. The mercury vapor passes through a cell positioned in the light path of an atomic absorption spectrophotometer. Absorbance (peak height) is measured as a function of mercury concentration .
Data validation. Systematic process that applies a defined set of performance-based criteria to a body of data; may result in qualification of the data. The data validation process is performed independently of the analytical laboratory that generates the data set and occurs before conclusions are drawn from the data. The process may comprise a standardized data review (routine data validation) and/or a problem-specific data review (focused data validation).
Department of Energy (DOE). Federal agency that sponsors energy research and regulates nuclear materials for weapons production.
Detection limit. Minimum concentration that can be determined by a single measurement by an instrument; implies a specified statistical confidence that the analytical concentration is greater than zero.
DOE Order 5400.5, Elevated Activity Criterion. "If the average concentration in any surface or belowsurface area less than or equal to 25m2 exceeds the limit or guideline by a factor of (100/A)05 [where A is the area of the region in which concentrations are elevated]. Limits for "hot-spots" shall also be developed and applied. Procedures for calculating these hot-spot limits, which depend on the extent of the elevated local concentrations, are given in DOE/CH-8901. In addition, reasonable efforts shall be made to remove any source of radionuclide that exceeds 30 times the appropriate limit for soil, irrespective of the average concentration in the soil."
Dose. Quantity of radiation that is absorbed, per unit of mass, by the body or by any portion of the body.
Ecological screening level (ESL). An organism's exposure-response threshold for a given chemical constituent. The concentration of a substance in a particular medium corresponds to a hazard quotient (HQ) of 1.0 for a given organism below which no risk is indicated.
Environmental Protection Agency (EPA). Federal agency responsible for enforcing environmental laws. While state regulatory agencies may be authorized to administer some of this responsibility, the EPA retains oversight authority to ensure protection of human health and the environment.
Ephemeral. Said of a stream or spring that flows only during and immediately after periods of rainfall or snowmelt.
Estimated detection limit (EDL). The detection limit required by the Laboratory statement of work (SOW) for analytical services (RFP No. 9-XS1-Q4257). The Laboratory value reflect the contractrequired detection limits (CRDLs) of the Contract Laboratory Program (CLP) methods.
Estimated quantitation limit. The lowest concentration that can be reliably achieved within specified limits of precision and accuracy during routine analytical-laboratory operating conditions. Sample estimated quantitation limits are highly matrix-dependent, and the specified estimated quantitation limits might not always be achievable.
ER2003-0326 A-3 May 2003

VCM Plan for SWMU 21-011(k), Rev. 3
Evapotranspiration. The combined discharge of water from the earth's surface to the atmosphere by evaporation from lakes, streams, and soil surfaces, and by transpiration from plants.
Exposure pathway. Mode by which a receptor may be exposed to contaminants in environmental media (e.g., drinking water, ingesting food, or inhaling dust).
External standard. External standard calibration involves comparison of instrument responses from the sample to the responses from the target compounds in the calibration standards. Sample peak areas (or peak heights) are compared to peak areas (or heights) of the standards.
Fallout radionuclides. Radionuclides that are present at globally elevated levels in the environment as a result of the fallout from atomic weapons tests. The Laboratory background data sets consist of Environmental Surveillance samples taken from marginal and regional locations for the following radionuclides associated with fallout: tritium, Cs-137, americium-241, plutonium-238, plutonium-239/240, and strontium-90. Samples were collected from regional and marginal locations in the vicinity of the Laboratory that are (1) representative of geological media found within Laboratory boundaries and (2) were not impacted by Laboratory operations.
Fault. A fracture, or zone of fractures, in rock along which there has been vertical or horizontal movement; adjacent rock surfaces are displaced.
Field blank (also known as field reagent blank). A blank sample either prepared in the field or carried to the sampling site, exposed to sampling conditions (e.g., bottle caps removed, preservatives added), and returned to a laboratory for analysis in the same manner in which environmental samples are analyzed. Used to identify the presence of contamination potentially added during the sampling and analysis process.
Field duplicate. A second sample collected as near as possible to the original sample.
Gamma radiation. A form of electromagnetic, high-energy radiation emitted from a nucleus. Gamma rays are essentially the same as x-rays and require heavy shielding, such as concrete or steel, to be blocked.
Groundwater. Water in a subsurface saturated zone; water beneath the regional water table.
Hazard quotient (HQ). The ratio of a calculated exposure (E) to or dose (D) from a given contaminant (I) to a given receptor U) over a reference value (TRV) for contaminant (I) determined to be protective of receptor U), i.e., HQii = Eii [or Dii]TRVii·
Hazardous and Solid Waste Amendments (HSWA). The Hazardous and Solid Waste Amendments of 1984 (Public Law No. 98-616, 98 Stat. 3221}, which amended the Resource Conservation and Recovery Act of 1976, 42 U.S.C. § 6901 et seq.
Holding time. The maximum elapse of time that one can expect to store a sample without unacceptable changes in analyte concentrations. Holding times apply under prescribed conditions and deviations from these conditions may affect the holding time. Extraction holding time refers to the time lapse from sample collection to sample preparation; Analytical holding time refers to the time lapse between sample preparation and analysis.
HSWA module. A portion of the Laboratory's permit to operate under RCRA that contains requirements specific to Los Alamos National Laboratory. It is this portion of the permit that contains the list of solid waste management units that must be cleaned up in accordance with RCRA procedures.
Hydraulic conductivity. The rate at which water moves through a medium in a unit of time under a unit hydraulic gradient through a unit area measured perpendicular to the direction of flow.
Hydrogeology. The science that applies geologic methods to the understanding of hydrologic phenomena.
Inductively coupled plasma emission spectroscopy (ICPES). ICPES determines trace elements, including metals, in solutions. The instrument measures characteristic emission spectra by optical spectrometry. Samples are nebulized, and the resulting aerosol is transported to the plasma torch. Element-specific emission spectra are produced by a radio-frequency inductively coupled plasma. The
May 2003 A-4 ER2003-0326
... l .. ,
...
•• •• ... ... ... "'' ... ... .. , ""'' IIIII
--
-
-----
VCM Plan forSWMU 21-011(k), Rev. 3
spectra are dispersed by a grating spectrometer, and photosensitive devices are used to monitor the intensities of the emission lines .
Inductively coupled plasma mass spectroscopy (ICPMS). ICPMS is applicable to the determination of sub-mg/1 concentrations of a large number of elements in water samples and in waste extracts or digests. When dissolved constituents are required, samples must be filtered and acid preserved before analysis. No digestion is required before analysis for dissolved elements in water samples. The method measures ions produced by a radio-frequency inductively coupled plasma. Analyte species originating in a liquid are nebulized, and the resulting aerosol transported by argon gas into the plasma torch. The ions produced are entrained in the plasma gas and introduced, by means of an interface, into a mass spectrometer. The ions produced in the plasma are sorted according to their mass-tochange ratios and quantified with a channel electron multiplier.
Internal standards. Compounds added to the sample after sample preparation for qualitative and quantitative instrument analysis-the compounds serve as a standard of retention time and response, which is invariant from run to run with the instruments. (Handbook of Environmental Analysis, by Roy-Keith Smith, 3rd ed.)
Laboratory control sample (LCS). A known matrix that has been spiked with compound(s) representative of the target analytes. The LCS is used to document laboratory performance. The acceptance criteria for LCSs are method specific.
Laboratory qualifier (or laboratory flag). Codes applied to the data by the contract analytical laboratory to indicate, on a gross scale, a verifiable or potential data deficiency. These flags are applied using the Environmental protection Agency (EPA) contract laboratory program (CLP) guidelines.
Matrix spike. An aliquot of sample spiked with a known concentration of target analyte(s). Matrix spike samples are used to measure the ability to recover prescribed analytes from a native sample matrix. The spiking typically occurs before sample preparation and analysis.
Matrix spike duplicate. An intralaboratory duplicate sample spiked with a known amount of target analyte(s). Spiking occurs before sample preparation and analysis.
Method blank. An analyte-free matrix to which all reagents are added in the same volumes or proportions as those used in the environmental sample processing and which is prepared and analyzed in the same manner as the corresponding environmental samples. The method blank is used to assess the potential for contamination to the sample during preparation and analysis.
Method detection limit (MDL). The minimum concentration of a substance that can be measured and reported with a known statistical confidence that the analyte concentration is greater than zero. The MDL is determined from analysis of samples of a given matrix type that contain the analyte after subjecting the sample to the usual preparation and analyses. The MDL is used to establish detection status.
Minimum detectable activity. For the analysis of radionuclides, the minimum detectable activity is the lowest detectable radioactivity for a given analytical technique. The following equation shall be used to calculate the MDA unless otherwise noted or approved by the Laboratory:
4.65(BKG)0·5 + 2. 71
MDA = ---'--"-----2.22 x EFF x V x T5 x Y
where BKG = the total background counts, EFF = the fraction detector efficiency, V = the volume or unit weight, T = the sample count duration, and Y =the fractional chemical recovery obtained from the tracer recovery.
Depending on the type of analysis, other terms may also be required in the denominator (e.g., gamma abundance).
ER2003-0326 A-5 May 2003

VCM Plan for SWMU 21-011(k), Rev. 3
Model. A mathematical approximation of a physical, biological, or social system.
No further action (NFA). A recommendation that not further investigation or remediation is warranted based on specific criteria.
Nondetect. Sample result that is less than the MDL. The laboratory reports nondetects as undetected at the EQL.
Operable unit (OU). At the Laboratory, one of 24 areas originally established for administering the ER Project. Set up as groups of potential release sites, the OUs were aggregated based on geographic proximity for the purpose of planning and conducting RCRA facility assessments and RCRA facility investigations. As the project matured, it became apparent that 24 were too many to allow efficient communication and to ensure consistency in approach. Therefore, in 1994, the 24 OUs were reduced to six administrative "field units."
Perched groundwater. Groundwater that lies above the regional water table and is separated from it by an unsaturated zone.
Polychlorinated biphenyls (PCBs). Any chemical substance that is limited to the biphenyl molecule that has been chlorinated to varying degrees or any combination of substances which contains such substances. PCBs are colorless, odorless compounds that are chemically, electrically, and thermally stable and have proven to be toxic to both humans and animals.
Potential release site (PRS). A site suspected of releasing or having the potential to release contaminants into the environment. PRS is a generic term that includes solid waste management units, hazardous waste sites listed in Module 7 of the Laboratory's Hazardous Waste Facility Permit, and sites that have been identified as potentially contaminated by radioactivity.
Quality assurance. All those planned and systematic actions necessary to provide adequate confidence that a facility, structure, system, or component will perform satisfactorily in service.
Quality control (QC). ( 1) All those actions necessary to control and verify the features and characteristics of a material, process, product, or service to specified requirements. QC is the process through which actual quality performance is measured and compared with standards. (2) All methods and procedures used to obtain accurate and reliable results from environmental sampling and analysis. Includes rules for when, where, and how samples are taken; sample storage, preservation and transport; and the use of blanks, duplicates, and split samples during the analysis.
Radionuclide. A nuclide (species of atom) that exhibits radioactivity.
RCRA facility investigation (RFI). The investigation that determines if a release has occurred and the nature and extent of the contamination at a hazardous waste facility. The RFI is generally equivalent to the remedial investigation portion of the Comprehensive Environment Response, Compensation, and Liability Act (CERCLA) process.
Receptor. A person, plant, animal, or geographical location that is exposed to a chemical or physical agent released to the environment by human activities.
Recharge. The process by which water is added to the zone of saturation, either directly from the overlying unsaturated zone or indirectly by way of another material in the saturated zone.
Regional aquifer. Geologic material(s) or unit(s) of regional extent whose saturated portion yields significant quantities of water to wells, contains the regional zone of saturation, and is characterized by the regional water table or potentiometric surface.
Release. Any spilling, leaking, pumping, pouring, emitting, emptying, discharging, injecting, escaping, leaching, dumping, or disposing of hazardous waste or hazardous constituents into the environment (including the abandonment or discarding of barrels, containers, and other closed receptacles that contain any hazardous wastes or hazardous constituents).
Reporting limit. The numerical value that an analytical laboratory (in conjunction with its client) selects to determine if a target analyte is detected. Results below the RL are considered not detected, while results greater than the RL are considered detected. The RLs are not necessarily based on instrument
May 2003 A-6 ER2003-0326
, ..

,...
•• .... ... .... •• ... •• .... 11111
illlli
..,.,
-.. -.. -----.. ---.. ----
VCM Plan for SWMU 21-011 (k), Rev. 3
sensitivity. Rls can be established at the instrument detection limit, method detection limit, estimated quantitation limit, and contract-required detection limit.
Resource Conservation and Recovery Act (RCRA). The Solid Waste Disposal Act as amended by the Resource Conservation and Recovery Act of 1976. (40 CFR 270.2)
Runoff. The portion of the precipitation on a drainage area that is discharged from the area either by sheet flow or adjacent stream channels .
Run-on. Surface water flowing onto an area as a result of runoff occurring higher up the slope.
Sample. A portion of a material (e.g., rock, soil, water, air), which, alone or in combination with other samples, is expected to be representative of the material or area from which it is taken. Samples are typically sent to a laboratory for analysis or inspection or are analyzed in the field. When referring to samples of environmental media, the term field sample may be used.
Sample matrix. In chemical analysis, that portion of a sample which is exclusive of the analytes of interest. Together, the matrix and analytes of interest form the sample.
Screening action level (SAL). Medium-specific concentration level for a chemical derived using conservative criteria below for which it is generally assumed that there is no potential for unacceptable risk to human health. The derivation of a SAL is based on conservative exposure and land-use assumptions. However, if an applicable regulatory standard exists that is less than the value derived by risk-based computations, it will be used for the SAL.
Screening assessment. A process designed to determine whether contamination detected in a particular medium at a site may present a potentially unacceptable human-health and lor ecological risk. The assessment utilizes screening levels that are either human-health or ecologically based concentrations derived by using chemical-specific toxicity information and standardized exposure assumptions below which no additional actions are generally warranted.
Sediment. (1) A mass of fragmented inorganic solid that comes from the weathering of rock and is carried or dropped by air, water, gravity, or ice; or a mass that is accumulated by any other natural agent and that forms in layers on the earth's surface such as sand, gravel, silt, mud, fill, or loess. (2) A solid material that is not in solution and either is distributed through the liquid or has settled out of the liquid.
Site characterization. Defining the pathways and methods of migration of the hazardous waste or constituents, including the media affected, the extent, direction and speed of the contaminants, complicating factors influencing movement, concentration profiles, etc. (U.S. Environmental Protection Agency, May 1994. "RCRA Corrective Action Plan, Final," Publication EPA-520/R-94/004, Office of Solid Waste and Emergency Response, Washington, DC)
Site conceptual model. A qualitative or quantitative description of sources of contamination, environmental transport pathways for contamination, and biota that may be impacted by contamination (called receptors) and whose relationships describe qualitatively or quantitatively the release of contamination from the sources, the movement of contamination along the pathways to the exposure points, and the uptake of contaminant by the receptors.
Solid waste management unit (SWMU). Any discernible unit at which solid wastes have been placed at any time, irrespective of whether the unit was intended for the management of solid or hazardous waste. Such units include any area at a facility at which solid wastes have been routinely and systematically released. This definition includes regulated units (i.e., landfills, surface impoundments, waste piles, and land treatment units) but does not include passive leakage or one-time spills from production areas and units in which wastes have not been managed (e.g., product storage areas) .
Spring. The site where groundwater discharges to the ground surface.
Standard operating procedure (SOP). A document that details the method for an operation, analysis, or action with thoroughly prescribed techniques and steps, and is officially approved as the method for performing certain routine or repetitive tasks.
Stratigraphy. The science dealing with the succession, age, composition, and history of strata.
ER2003-0326 A-7 May 2003

VCM Plan for SWMU 21-011(k), Rev. 3
Surrogate compound or surrogate. An organic compound used in the analyses of organic target analytes that is similar in composition and behavior to target analytes but is not normally found in field samples. Surrogates are added to every blank and spike sample to evaluate the efficiency with which analytes are recovered during extraction and analysis.
Target analyte. An element, chemical, or parameter, the concentration, mass, or magnitude of which is designed to be quantified by use of a particular test method.
Technical area (TA). The Laboratory established technical areas as administrative units for all its operations. There are currently 49 active TAs spread over 43 square miles.
Tentatively identified compound (TIC). Chemical compound detected in a sample that is not a target analyte, IS, or surrogate compound. Up to 30 chromatographic peaks may be subject to mass spectral matching for identification as TICs.
Topography. The physical configuration of the land surface in an area.
Tracer. A substance, usually a radioactive isotope, added to a sample to determine the efficiency (chemical or physical losses) of the chemical extraction, reaction, or analysis. The tracer is assumed to behave in the same manner as that of the target radionuclides. Recovery guidelines for tracer results are 30% to 110% under the current contract laboratory statement of work and will be 40% to 1 05% under the new statement of work. Correction of the analytical results for the tracer recovery is performed for each sample. The concentration of the tracer added needs to be sufficient to result in a maximum of 10% uncertainty at the 95% confidence level in the measured recovery.
Tuff. A compacted deposit of volcanic ash and dust that contains rock and mineral fragments accumulated during an eruption.
Underground storage tank [as defined in Section 9001(1) ofthe Solid Waste Disposal Act]. The term "underground storage tank" means any one or combination of tanks (including underground pipes connected thereto) which is used to contain an accumulation of regulated substances, and the volume of which (including the volume of the underground pipes connected thereto) is 10% or more beneath the surface of the ground. Such term does not include any
(a) farm or residential tank of 1,100 gallons or less capacity used for storing motor fuel for noncommercial purposes;
(b) tank used for string heating oil for consumptive use on the premises where stored; (c) septic tank; (d) pipeline facility (including gathering lines) regulated under
(i) the Natural Gas Pipeline Safety Act of 1968 (49 USC App. 1671 et seq.), (ii) the Hazardous Liquid Pipeline Safety Act of 1979 (49 USC App. 2001 et seq.), or (iii) which is an intrastate pipeline facility regulated under state laws comparable to the
provisions of law referred to in Clause (i) or (ii) of this subparagraph; (e) surface impoundment, pit, pond, or lagoon; (f) storm-water or wastewater collection system; (g) flow-through process tank; (h) liquid trap or associated gathering lines directly related to oil or gas production and gathering
operations; or (i) storage tank situated in an underground area (such as a basement, cellar, mine working, drift,
shaft, or tunnel) if the storage tank is situated upon or above the surface of the floor.
US Department of Energy (DOE). Federal agency that sponsors energy research and regulates nuclear materials for weapons production.
US Environmental Protection Agency (EPA). Federal agency responsible for enforcing environmental laws. While state regulatory agencies may be authorized to administer some of this responsibility, the EPA retains oversight authority to ensure protection of human health and the environment.
Vadose zone. The unsaturated zone. Portion of the subsurface above the regional water table in which pores are not fully saturated.
May 2003 A-8 ER2003-0326
11111111
'

"'' IIIII
"'' llllr
... 111111
"'' IIIIi
""'' ...
-
---
VCM Plan forSWMU 21-011(k), Rev. 3
Welded tuff. A volcanic deposit hardened by the action of heat, pressures from overlying material, and hot gases .
A-3.0 METRIC CONVERSION TABLES
Metric to English Conversions
Multiply Sl (Metric) Unit by To Obtain US Customary Unit
kilometers (km) 0.622 miles (mi)
kilometers (km) 3281 feet (ft)
meters (m) 3.281 feet (ft)
meters (m) 39.37 inches (in.)
centimeters (em) 0.03281 feet (ft)
centimeters (em) 0.394 inches (in.)
millimeters (mm) 0.0394 inches (in.)
micrometers or microns (I.Jm) 0.0000394 inches (in.)
square kilometers (km2) 0.3861 square miles (mi2)
hectares (ha) 2.5 acres
square meters (m2) 10.764 square feet (ft2)
cubic meters (m3) 35.31 cubic feet (ft3)
kilograms (kg) 2.2046 pounds (lb)
grams (g) 0.0353 ounces (oz)
grams per cubic centimeter (g/cm3) 62.422 pounds per cubic foot (lb/ft3)
milligrams per kilogram (mg/kg) 1 parts per million (ppm)
micrograms per gram (j.Jg/g) 1 parts per million (ppm)
liters (I) 0.26 gallons (gal.)
milligrams per liter (mg/1) 1 parts per million (ppm)
degrees Celsius CC) 9/5 + 32 degrees Fahrenheit (°F)
Metric Prefixes
Term Power of 10 Symbol
mega- 106 M
kilo- 103 k
deci- 10-1 d
centi- 10-2 c
milli- 10-3 m
micro- 10-6 j.J
nano- 10-9 n
pi co- 10-12 p
ER2003-0326 A-9 May 2003

....
....
.... 'II ..
....
...
.... Appendix B
VCM Checklist and Fact Sheet ... ....
....
-· '*"'
----
-
--

..... lll!ii
.....
Accelerated Corrective Action (ACA) Checklist and Field Work Authorization Form
..... Page 1 of 2
..... PRS Number: 21-011 (k) lXI HSWA D Non-HSWA
Yes No
K Fact sheet describing planned activities is complete and attached to checklist.
K COPC(s) for human health risk <HH). ecological risk (ECO). or other requirements are known or will be determined during accelerated site characterization.
""' K N::-tture ancl extent of contamin::-ttion is defined or accelerated site characteriz::-ttion is planned as
p::-trt of this action to d&fino:. n::-tture and extent and to guide cleanuv ••
-· K Cleanup levels/preliminary remediation goals (PRGs) are appropriate.
K Remedy is obvious.
K Time for removal is less than six months.
K Remedy is final.
K L::-tnd use assumptions are stroightforward.
K Treatment. Storage. <Jnd Disposal (TSD) Facilities are available for waste type and volume. -K Cleanup cost is reasonable for the planned action and meets accelerated decision logic criterion
for decision to proceed with ACA. -K Briefing for NMED is required.
- Explain criteria not checked aoove:
....
---- Los Alamos Environmental Restoration Proiect -
-- ER2003-0326 B-1 May 2003 -
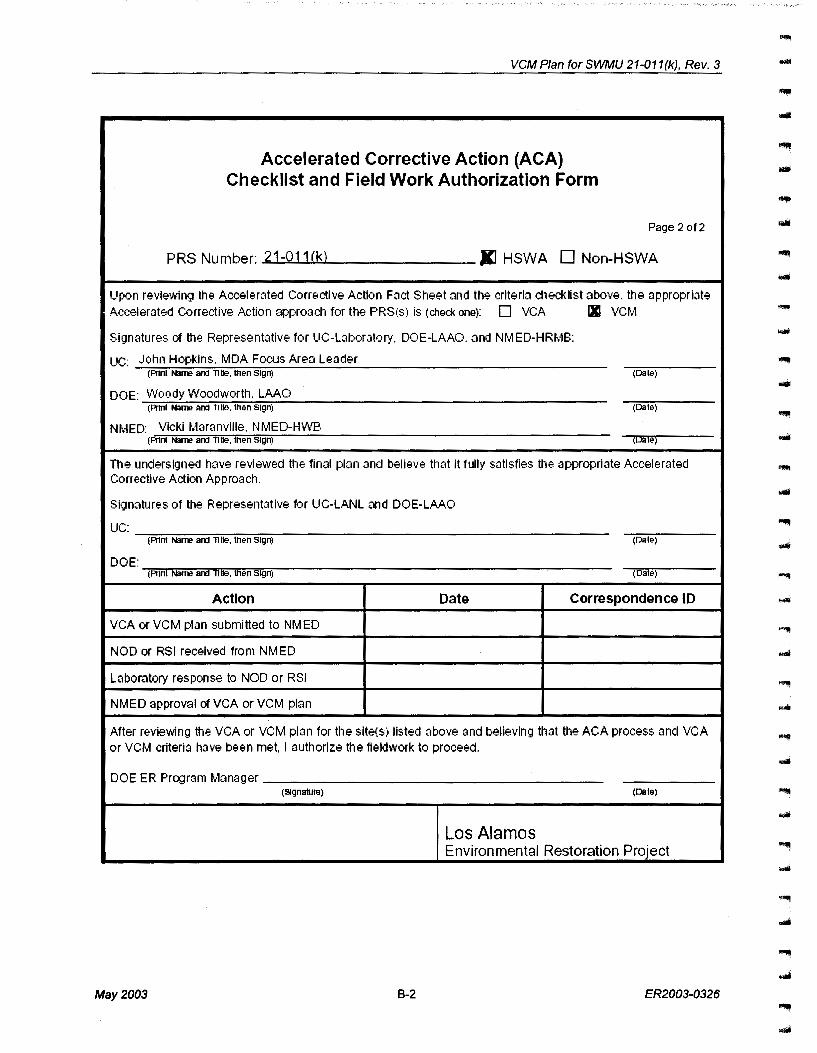
VCM Plan for SWMU 21-011(k), Rev. 3
Accelerated Corrective Action (ACA) Checklist and Field Work Authorization Form
Page 2 of2
PRS Number: 21-01Hk) XI HSWA 0 Non-HSWA
Upon reviewing the Accelemted Corrective Action Fact Sheet and the criteria checklist above. the appropriate Accelemte.d Corrective Action approach for the PRS(s) is (check one): D VCA lXI VCM -Signatures of the Representative for UC-LaborJtory. DOE-LAAO. and NI·AED-HRMB:
UC: ~lohn Hopkins. MDA Focus Arect Leader (Pilnt Narm anllllle, then stgn'j (Date)
DOE: Woody Woodworth. LAAO (Pilnt Narm anllllle, then Sign) (Date)
NMED: Vicki Maranville. tJMED-HWB (Pilnt Narm anllllle, then 5191'\1 ~l:llile)
The undersigned have reviewed the final pl8n and believe that it fully satisfies the appropriate Accelerated Corrective Action Approach.
Signatures of the RepresentJtive for UC-LANL and DOE-LAAO
UC: (Pilnt Narm anllllle, then 5191'\1 (Dale)
DOE: (Pilnt Narm anllllle, then SIQI'\I (Date)
Action Date Correspondence 10
VCA or VCM plan submitted to tJM ED
NOD or RSI received from NM ED
Laboratory response to NOD or RSI
NMED approval of VCA or VCM plan
After reviev.1ng the VCA or VCM plan for the site(s) listed above and believing that the ACA process and VCA -or VCM criteria have been met. I authorize the fieldwork to proceed.
DOE ER Program Mcmager (SignaiUre) (Date)
Los Alamos Environmental Restoration Project
May2003 B-2 ER2003-0326

·-·-.... •• .... •• .... ... .... 1111111
....
...
...
---------IIIII
VCM Plan for SWMU 21-011(k), Rev. 3
Voluntary Corrective Measure Fact Sheet for PRS 21-011(k) Confirmation Sampling and Removal of Residual Contamination SRS: 21-011(k) = 67 Erosion Matrix Score: 21-011 (k) = 72
OPERATIONAL HISTORY
Potential Release Site (PRS) 21-011(k) was the national pollutant discharge elimination system (NPDES)permitted outfall (NPDES outfall no. EPA050050) for treated industrial wastewater from Buildings TA-21-35 and -257, the former industrial wastewater treatment plants (WWTP) at TA-21, and is listed in Module VIII of the Laboratory's Hazardous Waste Facility Permit. The PRS consists of a drain line from two wastewater treatment tanks that discharged to an outfall ditch, which channeled wastewater to the canyon rim, and down the hillside toward DP Canyon. The ditch is no longer visible; however, a 4-inch cast iron drain line is located approximately 55 feet north of the TA-21 perimeter road in the area where the outfall ditch would have ended. A gently sloping, rocky surface extends from the outfall pipe approximately 30 feet to the canyon rim.
TA-21,the former plutonium processing facility at LANL, began plutonium operations in 1945 and ceased operations in 1978. The first WWTP, T A-21-35 was activated in 1952 and operated until 1967 when the new WWTP, TA-21-257, came on line. Both facilities treated wastes from DP West and DP East consisting of liquids remaining after plutonium extraction and processing of radioactive materials for nuclear weapons and space rocket research projects. The treatment process mixed the raw waste with lime, ferric sulfate, and coagulant aids. The waste was then pumped to a flocculator and onto a settling tank. Settled effluent was pumped through a pressure filter and sampled to verify treatment. If the effluent was determined to be adequately treated, it was pumped to two final effluent holding tanks (tanks TA-21-112 and TA-21-113). From tanks T A-21-112 and TA-21-113, the wastewater was piped northeast toward DP Canyon and discharged on the north side of DP Mesa (Fig. 1.0-1 ). This wastewater contained a variety of radioactive and chemical constituents. Discharges of treated wastewater to the outfall were discontinued in the early 1990's; however, Building T A-21-257 is still used for pretreatment of wastewater prior to discharge to the T A-50 waste line.
Previous Investigations and Contaminants of Potential Concern
PRS 21-011(k) was investigated in 1988 by DOE and by the ER Project in 1992 and 1993 and reported on in 1995 in the Final Draft for the OU 1106 Addendum to Phase 1 B, 1 C Report (LANL 1995, 52350). The initial radiation survey and soil sampling performed at PRS 21-011 (k) in FY92 indicated the presence of radionuclide contamination. Additional soil sampling and a radiation survey were performed during the FY93 field season to further define the extent of contamination found in FY92.
An interim action (lA) plan was prepared in 1996 (LANL 1996, 01-0042). The lA was implemented during 1996 and 1997 and described in the Interim Action Report for TA-21, Potential Release Site 21-011(k), submitted to NMED on April10, 1997 (LANL 1997, 55648). The objectives of the lA were to remove a portion of the radionuclide source term from the outfall area of the PRS and install storm water control measures as a best management practice (BMP). Soil excavated from PRS 21-011 (k) during the 1996 lA (390 cubic yards) was characterized in the field and transported to TA-54, MDA G for disposal. Storm water controls were installed in 1997 and upgraded in August 1999. The controls are routinely inspected and maintained by LAN L ESH-18 representatives.
The COPCs for this PRS include americium-241, cesium-137, plutonium-238 and -239, and strontium-90. Although analytical results from the 1988, 1992 and 1993 investigations did not identify non-radioactive, RCRA-regulated organic and inorganic chemicals as COPCs, waste characterization samples and a percentage of confirmation samples will be submitted for analysis of metals, SVOCs, and radionuclides.
ER2003-0326 B-3 May 2003
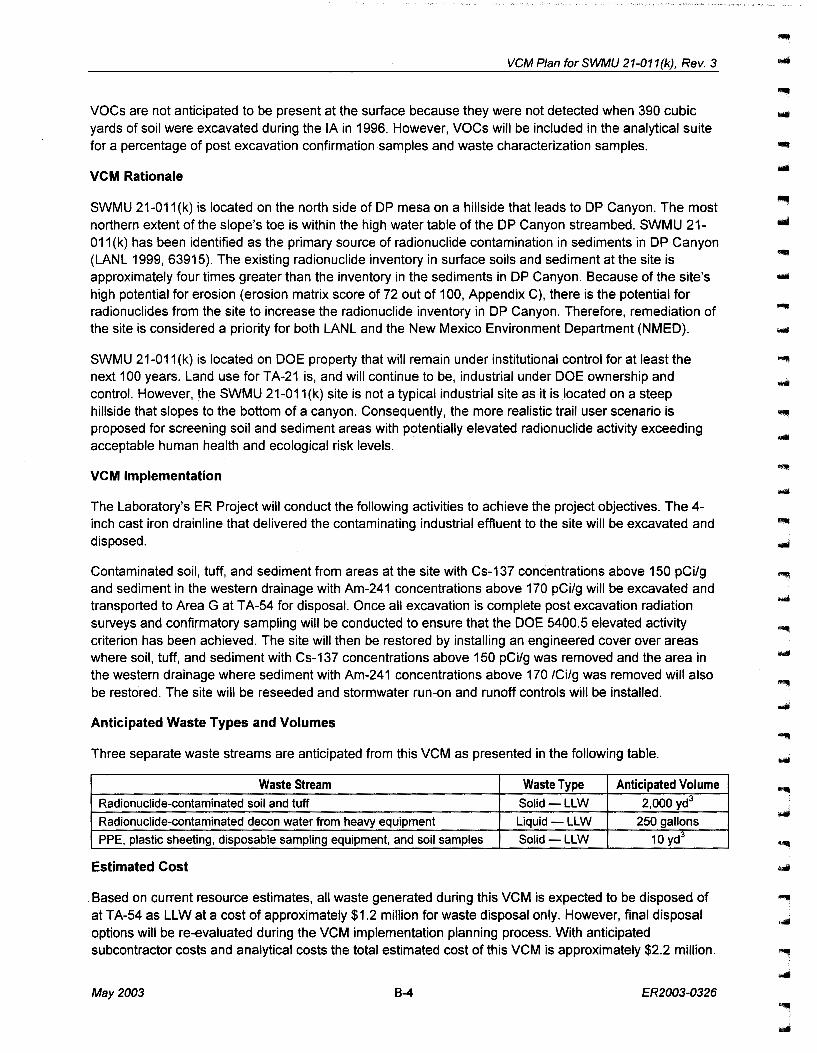
VCM Plan for SWMU 21-011(k), Rev. 3
VOCs are not anticipated to be present at the surface because they were not detected when 390 cubic yards of soil were excavated during the lA in 1996. However, VOCs will be included in the analytical suite for a percentage of post excavation confirmation samples and waste characterization samples.
VCM Rationale
SWMU 21-011(k) is located on the north side of DP mesa on a hillside that leads to DP Canyon. The most northern extent of the slope's toe is within the high water table of the DP Canyon streambed. SWMU 21-011 (k) has been identified as the primary source of radionuclide contamination in sediments in DP Canyon (LANL 1999, 63915). The existing radionuclide inventory in surface soils and sediment at the site is approximately four times greater than the inventory in the sediments in DP Canyon. Because of the site's high potential for erosion (erosion matrix score of 72 out of 100, Appendix C), there is the potential for radionuclides from the site to increase the radionuclide inventory in DP Canyon. Therefore, remediation of the site is considered a priority for both LANL and the New Mexico Environment Department (NMED).
SWMU 21-011 (k) is located on DOE property that will remain under institutional control for at least the next 100 years. Land use for TA-21 is, and will continue to be, industrial under DOE ownership and control. However, the SWMU 21-011(k) site is not a typical industrial site as it is located on a steep hillside that slopes to the bottom of a canyon. Consequently, the more realistic trail user scenario is proposed for screening soil and sediment areas with potentially elevated radionuclide activity exceeding acceptable human health and ecological risk levels.
VCM Implementation
The Laboratory's ER Project will conduct the following activities to achieve the project objectives. The 4-inch cast iron drainline that delivered the contaminating industrial effluent to the site will be excavated and disposed.
Contaminated soil, tuff, and sediment from areas at the site with Cs-137 concentrations above 150 pCi/g and sediment in the western drainage with Am-241 concentrations above 170 pCi/g will be excavated and transported to Area G at T A-54 for disposal. Once all excavation is complete post excavation radiation surveys and confirmatory sampling will be conducted to ensure that the DOE 5400.5 elevated activity criterion has been achieved. The site will then be restored by installing an engineered cover over areas where soil, tuff, and sediment with Cs-137 concentrations above 150 pCi/g was removed and the area in the western drainage where sediment with Am-241 concentrations above 170 /Ci/g was removed will also be restored. The site will be reseeded and stormwater run-on and runoff controls will be installed.
Anticipated Waste Types and Volumes
Three separate waste streams are anticipated from this VCM as presented in the following table.
Waste Stream Waste Type Anticipated Volume Radionuclide-contaminated soil and tuff Solid-LLW 2,000 yd3
Radionuclide-contaminated decon water from heavy equipment Liquid-LLW 250 gallons
PPE, plastic sheeting, disposable sampling equipment, and soil samples Solid-LLW 10 yd3
Estimated Cost
Based on current resource estimates, all waste generated during this VCM is expected to be disposed of at TA-54 as LLW at a cost of approximately $1.2 million for waste disposal only. However, final disposal options will be re-evaluated during the VCM implementation planning process. With anticipated subcontractor costs and analytical costs the total estimated cost of this VCM is approximately $2.2 million.
May 2003 B-4 ER2003-0326
....

....
....
Iiiii
..... IIIII
.... IIIII
,, ...
.....
..... IIIII
.... illt
.... illill
"""" ••
•• -· IIIIi
.....
...,,
-· -
VCM Plan for SWMU 21-011(k), Rev. 3
Schedule
The field work portion of this VCM began in November 2002 and will be completed by July 2003. The fieldwork includes soil and tuff removal, confirmatory sample collection and analysis, waste management, and site restoration.
Reference List of Past Plans, Reports, etc.:.
Environmental Restoration Project, August 1999. "Evaluation of Sediment and Alluvial Groundwater in DP Canyon," Los Alamos National Laboratory report LA-UR-99-4238, Los Alamos, New Mexico . (Environmental Restoration Project 1999, 63915)
LANL (Los Alamos National Laboratory), May 1991. "RFI Work Plan for Operable Unit 1106, Section 15.4," Los Alamos National Laboratory Report LA-UR-91-962, Los Alamos, New Mexico. (LANL 1991, 07529)
LANL (Los Alamos National Laboratory}, January 1995. "Final Draft for the OU 1106 Addendum to Phase 1 B, 1 C Report, TA-21 ," Los Alamos National Laboratory report LA-UR-94-4360, Los Alamos, New Mexico. (LANL 1995, 52350)
LANL (Los Alamos National Laboratory}, 1996. "Interim Action Plan for TA-21: PRS 21-011(k)," Los Alamos National Laboratory report LA-UR-96-1609, Los Alamos, New Mexico. (LANL 1996, 54790.2)
LANL (Los Alamos National Laboratory}, April 1997. "Interim Action Report for Potential Release Site 21-011 (k) Discharge System," Los Alamos National Laboratory report, Los Alamos, New Mexico. (LANL 1997, 55648.2)
ER2003-0326 8-5 May2003

Appendix C - Standard Operating Procedure 2.01
.....
.....
..... 1111
.....
.....
....
,.. .
....

.....
STANDARD OPERATING PROCEDURE .....
Title: Identifier: Revision: Effective Date: ....
Surface Water Site Assessments ER-SOP-2.01 0 9/21/99 .....
ER Catalog Number: ER19990087
....
.....
, ....
.... ~ J.J
•• ••
-· •• ...
,.... . ••
-· LOS ALAMOS NATIONAL LABORATORY

Surface Water Site Assessments
Table of Contents
1.0 PURPOSE ............................................................................................................................. 3
2.0 TRAINING .............................................................................................................................. 3
3.0 DEFINITIONS ....................................................................................................................... 3
4.0 BACKGROUND AND PRECAUTIONS ............................................................................. 5
5.0 EQUIPMENT ......................................................................................................................... 5
6.0 PROCEDURE ....................................................................................................................... 5
7.0 REFERENCES ..................................................................................................................... 8
8.0 RECORDS ............................................................................................................................. 8
9.0 ATTACHMENTS ................................................................................................................... 9
ER-SOP-2.01, RO (ER19990087)
Page 2 of25
---
----------
-

.....
.....
.....
-· •• -·
••
-----------
Surface Water Site Assessments
NOTE: Environmental Restoration (ER) Project personnel may produce paper copies of this procedure printed from the controlled-document electronic file located at http://erinternal.lanl.gov/documents/Procedures/sops.htm. However, it is their responsibility to ensure that they are trained to and utilizing the current version of this procedure. The Quality Program Project Leader (QPPL) may be contacted if text is unclear.
1.0 PURPOSE
This Standard Operating Procedure (SOP) describes the process for determining whether a Los Alamos National Laboratory (Laboratory) ER Project site has the potential to adversely effect surface water quality.
Note: The ER Project at the Laboratory is responsible for the investigation and remediation of solid waste management units (SWMUs) under the Resource Conservation and Recovery Act (RCRA) and areas of concern (AOCs) under the direction of the Department of Energy (DOE). During the investigation and remediation phases, information may be gathered that indicates that contaminant conditions may be present at the site that might affect surface water quality. Depending on the contaminant found, its concentration, and the erosion/sediment transport potential, it may be necessary to develop an action plan to mitigate the problem. The mitigation could include site restoration and/or stabilization.
2.0 TRAINING
2.1 All users of this SOP are trained by self-study, and the training is documented in accordance with QP-2.2. For consistency, Water Quality and Hydrology Group (ESH-18) personnel may be contacted for assistance.
2.2 The Field Team Leader (FTL) will monitor the proper implementation of this procedure and ensure that relevant team members have completed all applicable training assignments in accordance with QP-2.2.
3.0 DEFINITIONS
3.1 Area of concern (AOC)- Any suspected release of hazardous waste or hazardous waste constituent which is not directly associated with a SWMU (EPA, 1986).
3.2 Best Management Practices (BMPs) - BMPs mean schedules of activities, prohibition of practices, maintenance procedures, and other management practices to prevent or reduce the pollution of waters of the United States.
ER-SOP-2.01, RO (ER19990087)
Page 3 of25

BMPs also include treatment requirements, operating procedures, and practices to control facility site runoff, spillage or leaks, sludge or waste disposal, or drainage from raw-material storage areas.
3.3 Canopy- The ground cover formed by the leafy upper branches of surrounding trees and shrubs.
3.4 Chemical of potential concern (COPC)- A chemical detected at a specific site that has the potential to adversely affect human or animal receptors due to its concentration (e.g., above regulatory screening action levels [SALs] or upper tolerance limit [UTL] values), distribution, and mechanism of toxicity. The chemical remains a concern until exposure pathways and receptors are evaluated in a site-specific risk assessment.
3.5 Ground cover- The covering of naturally occurring soils by either natural or man-made mechanisms (e.g., grasses, pine needles, asphalt, concrete, etc.).
3.6 Gully erosion -The erosion process whereby water accumulates in narrow channels and, over short periods, removes the soil from this narrow area to considerable depths, which can range from 1 ft to as much as 50 ft.
3.7 Potential release site (PRS)- A site suspected of releasing or having the potential to release contaminants into the environment. PRS is a generic term that includes SWMUs, hazardous-waste sites listed as Module VII of the Laboratory's Hazardous Waste Facility Permit, and sites that have been identified as potentially contaminated by radioactivity. The ER Project has the responsibility for investigating and, if necessary, cleaning up such sites on and around the Laboratory.
3.8 Refuse- Includes food; swill; carrion; slops; and all substances from the preparation, cooking, and consumption of food. It also includes all substances that result from the handling, storage, and sale of food products; the carcasses of animals; junked parts of automobiles and other machinery; oil; discarded furniture; paper cartons; cans; bottles; tree branches; yard trimmings; ashes; and all unwholesome material.
3.9 Rill erosion- An erosion process in which numerous small channels only several inches deep are formed by concentrated runoff that flows during and immediately following rain storms.
3.10 Runoff- The portion of the precipitation on a drainage area that is discharged from the area either by sheet flow or adjacent stream channels.
3.11 Run-on- Surface water flowing onto an area as a result of runoff occurring higher up the slope.
3.12 Slope- A slope is a ratio of units of elevation change to units of horizontal change usually expressed in degrees.
ER-SOP-2.01, RO (ER19990087)
Page4 of25
-
-
--
---
---

....
..... llllili
....
.... •• ,, ....
...
....
-· -·
------
3.13 Solid Waste Management Unit (SWMU)- Any discernible unit where solid wastes have been or may have been placed at any time, regardless of whether the unit was intended for the management of solid or hazardous wastes. These areas include anywhere solid wastes have been routinely and systematically released. All SWMUs are listed in Module VIII of HSWA Permit.
3.14 Watercourse- Any river, creek, arroyo, canyon, draw, wash, or other channel that has definite banks and beds with visual evidence of occasional flow of water.
3.15 Water pollution- Either introducing or permitting the introduction into water, either directly or indirectly, of one or more water contaminants in such quantity and of such duration as may, with reasonable probability, injure human health, animal or plant life, or property, or to unreasonably interfere with the public welfare or the use of the property.
4.0 BACKGROUND AND PRECAUTIONS
Members of ESH-18 perform a variety of kinds of fieldwork around the Laboratory. All fieldwork conducted as part of this SOP will follow their group-specific activity hazards analysis (AHA) and additional requirements set forth by the Facility Management Unit (FMU).
5.0 EQUIPMENT
Equipment used when going into the field depends on the distance from the group office and the distance the field technician will be from the vehicle. Field personnel must have current certifications in First Aid and CPR. Additional training or specific PPE may be required; this depends on the work location. For this procedure the following equipment is needed before going into the field to perform any work:
• first aid kit in vehicle;
• radio or cellular phone communication;
• drinking water;
• camera for photodocumentation; and
• clipboard, pencils, markers, and/or white board.
6.0 PROCEDURE
Note: Deviations from SOPs are made in accordance with QP-4.2.
Streams, watercourses, and groundwater quality are regulated by the New Mexico Water Quality Control Commission (WQCC) Regulations. The water quality standards developed are enforced by the New Mexico Environment Department
ER-SOP-2.01, RO (ER19990087)
Page 5 of25
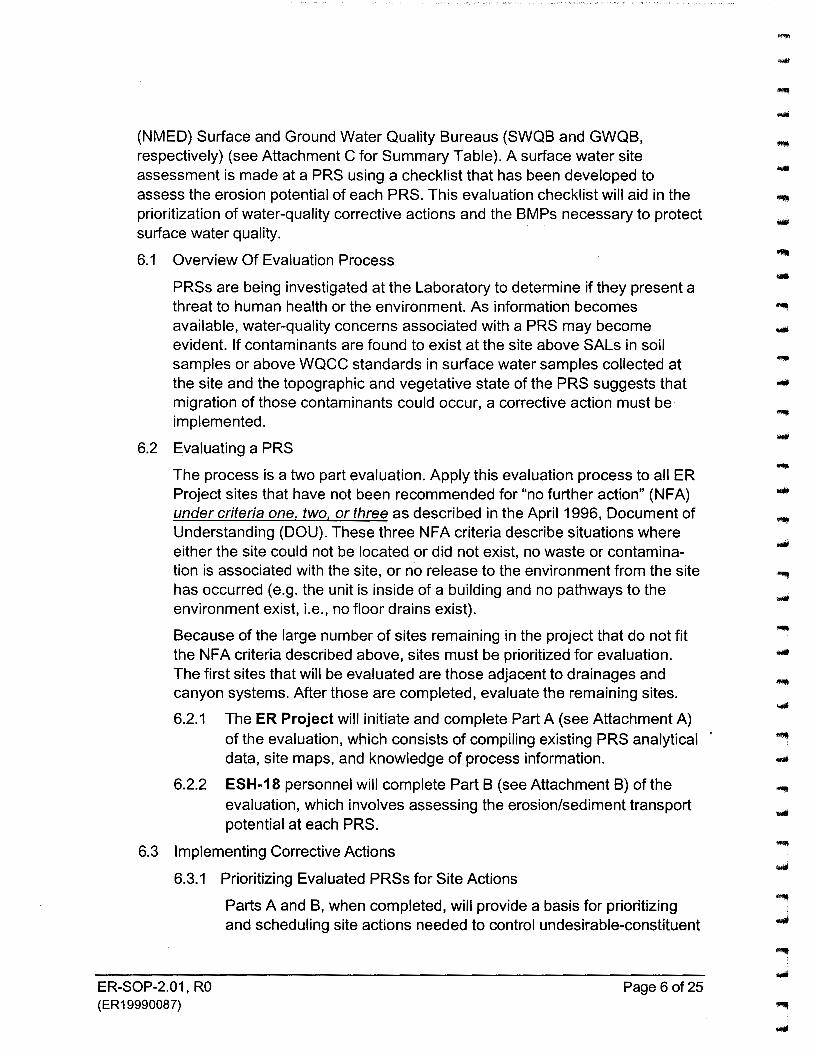
(NMED) Surface and Ground Water Quality Bureaus (SWQB and GWQB, respectively) (see Attachment C for Summary Table). A surface water site assessment is made at a PRS using a checklist that has been developed to assess the erosion potential of each PRS. This evaluation checklist will aid in the prioritization of water-quality corrective actions and the BMPs necessary to protect surface water quality.
6.1 Overview Of Evaluation Process
PRSs are being investigated at the Laboratory to determine if they present a threat to human health or the environment. As information becomes available, water-quality concerns associated with a PRS may become evident. If contaminants are found to exist at the site above SALs in soil samples or above WQCC standards in surface water samples collected at the site and the topographic and vegetative state of the PRS suggests that migration of those contaminants could occur, a corrective action must be implemented.
6.2 Evaluating a PRS
The process is a two part evaluation. Apply this evaluation process to all ER Project sites that have not been recommended for "no further action" (NFA) under criteria one, two, or three as described in the April 1996, Document of Understanding (DOU). These three NFA criteria describe situations where either the site could not be located or did not exist, no waste or contamination is associated with the site, or no release to the environment from the site has occurred (e.g. the unit is inside of a building and no pathways to the environment exist, i.e., no floor drains exist).
Because of the large number of sites remaining in the project that do not fit the NFA criteria described above, sites must be prioritized for evaluation. The first sites that will be evaluated are those adjacent to drainages and canyon systems. After those are completed, evaluate the remaining sites.
6.2.1 The ER Project will initiate and complete Part A (see Attachment A) of the evaluation, which consists of compiling existing PRS analytical data, site maps, and knowledge of process information.
6.2.2 ESH-18 personnel will complete Part B (see Attachment B) of the evaluation, which involves assessing the erosion/sediment transport potential at each PRS.
6.3 Implementing Corrective Actions
6.3.1 Prioritizing Evaluated PRSs for Site Actions
ER-SOP-2.01, RO (ER19990087)
Parts A and B, when completed, will provide a basis for prioritizing and scheduling site actions needed to control undesirable-constituent
Page 6 of25
---
----
-
...
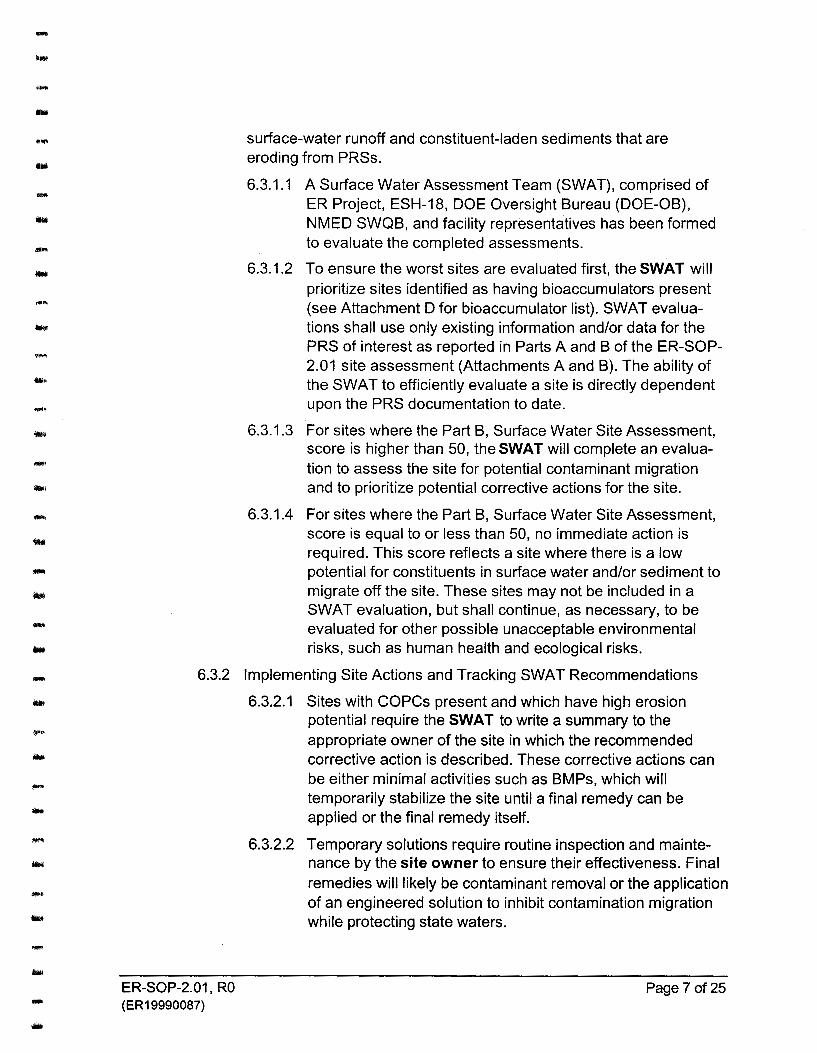
....
I IIIII
.... IIIIi
.ilil
.....
....
.... •• ......
•• ....
-· ----------
surface-water runoff and constituent-laden sediments that are eroding from PRSs.
6.3.1.1 A Surface Water Assessment Team (SWAT), comprised of ER Project, ESH-18, DOE Oversight Bureau (DOE-OB), NMED SWQB, and facility representatives has been formed to evaluate the completed assessments .
6.3.1.2 To ensure the worst sites are evaluated first, the SWAT will prioritize sites identified as having bioaccumulators present (see Attachment D for bioaccumulator list). SWAT evaluations shall use only existing information and/or data for the PRS of interest as reported in Parts A and B of the ER-SOP-2.01 site assessment (Attachments A and B). The ability of the SWAT to efficiently evaluate a site is directly dependent upon the PRS documentation to date .
6.3.1.3 For sites where the Part B, Surface Water Site Assessment, score is higher than 50, the SWAT will complete an evaluation to assess the site for potential contaminant migration and to prioritize potential corrective actions for the site.
6.3.1.4 For sites where the Part B, Surface Water Site Assessment, score is equal to or less than 50, no immediate action is required. This score reflects a site where there is a low potential for constituents in surface water and/or sediment to migrate off the site. These sites may not be included in a SWAT evaluation, but shall continue, as necessary, to be evaluated for other possible unacceptable environmental risks, such as human health and ecological risks.
6.3.2 Implementing Site Actions and Tracking SWAT Recommendations
ER-SOP-2.01, RO (ER19990087)
6.3.2.1 Sites with COPCs present and which have high erosion potential require the SWAT to write a summary to the appropriate owner of the site in which the recommended corrective action is described. These corrective actions can be either minimal activities such as BMPs, which will temporarily stabilize the site until a final remedy can be applied or the final remedy itself.
6.3.2.2 Temporary solutions require routine inspection and maintenance by the site owner to ensure their effectiveness. Final remedies will likely be contaminant removal or the application of an engineered solution to inhibit contamination migration while protecting state waters.
Page 7 of25
6.3.2.3 Upon completion of the corrective activities at a PRS, The ER Project and the FMU will generate an NFA report that describes the results of the actions.
6.3.2.4 ESH-18 will review these written summaries in order to ensure all water-protection requirements are satisfied.
6.3.2.5 ESH-18 will submit copies of these final reports to NMED and DOE-OB upon completion.
6.3.3 Financial Responsibility for Corrective Actions
6.3.3.1 The ER Project is responsible for ensuring that historic, inactive sites do not adversely effect the state's surface water quality. The ER Project will fund all corrective actions and stormwater BMPs at those sites.
6.3.3.2 For inactive sites that have been created since 1988 and active sites that might currently be affecting water quality, the landlord of those sites or Facilities, Security, and Safeguard Division (FSS) will fund those actions. ESH-18 will coordinate the implementation of corrective actions necessary at non-ER owned sites.
7.0 REFERENCES
The following documents have been cited within this procedure.
AP-02.1, Procedure for LANL ER Records Management
QP-2.2, Personnel Orientation and Training
QP-4.2, Standard Operating Procedure Development
EPA, "RCRA Facility Assessment Guidance," (OSWER, Washington, DC, 1986).
New Mexico Water Quality Control Commission, "State of New Mexico Ground and Surface Water Quality Protection Regulations," (New Mexico Water Quality Control Commission, Santa Fe, NM, 1995).
8.0 RECORDS
The ER Project Office is responsible for submitting the following records (processed in accordance with AP-02.1) to the Records Processing Facility.
8.1 Completed forms identified in Section 6.0
ER-SOP-2.01, RO (ER19990087)
Page 8 of25
------
------
...
...
...

...
...
.. , """'
-· -· illllll
-----------------
9.0 ATTACHMENTS
The document user may employ documentation formats different from those attached to/named in this procedure-as long as the substituted formats in use provide, as a minimum, the information required in the official forms developed by the procedure.
Attachment A: Constituent Assessment Form (form and completion instructions) (3 pages)
Attachment B: Surface Water Site Assessment (form, matrix, and completion instructions) (7 pages)
Attachment C: Table 1- Summary of Regulatory Water Standards Used for ER Projects (5 pages)
Attachment D: Proposed ER Project Bioaccumulator List (1 page)
ER-SOP-2.01, RO (ER19990087)
Page 9 of25

Constituent Assessment (Part A)
Site Information
1. PRS Number: ------------------- 2. Date/Time:
3. ER Point of Contact: ------------------- 4. FMU/Point of Contact: ______ I ------------------
5.0 HSWA 0 AOC (check both if AOC is on HSWA Permit) 6. Site Ranking System (SRS) #: ----------------
7. Description of the historical operations of this PRS:
8. Description of the current operations of this PRS (if any):
PRS Status
9. Action/Status to Date (check all that apply) ONone
Date Completed or Anticipated
Field Investigation 0 Phase I 0 Phase II ........................................................................ ----------------
Interim Measures 0 IM 0 BMPs ....................................................................................... ----------------
Accelerated Cleanup OVCA 0 VCM ................................................................................ ----------------
Other 0 Monitoring 0 CMs ................................................................................................ ----------------
Report Status 0 RFI Report 0 SAP ................................................................................. ----------------
0 NFA!DOU- If checked, supply criteria number(s): __________ _
Comments:
Sample Information
y N 0 0 10. Have surface/sediment (depth less than 12 in.) samples been collected that reflect current site
conditions? If yes: 1) Attach data.
2) Include analyte name. value, units. location ID, sample ID, SAL, depth, and media (soil, tuff, etc.). 3) Please attach existing map that shows where samples were taken, if available.
0 0 11. Have surface water samples been collected that reflect site conditions? If yes: 1) Attach data.
2) Include analyte name, value, units, location ID, filtered/nonfiltered, and flow data (if available).
3) Please attach existing map that shows where samples were taken, if available.
0 0 12. Is data pending? If yes: 1) List date data are anticipated: ------------
2) Provide a list of COPCs identified in RFI Work Plan as an attachment.
13.ERRepresentative: __________________________________________________________________ _
ER-SOP-2.01, RO
ER-SOP-2.01, RO (ER19990087)
(Print name and title, then sign)
Attachment A
Los Alamos Environmental Restoration Project
Page 10 of25
------..
......
-

••
....
.....
....
.....
.....
....
.....
•• ..... ... .....
....
...
.....
illl
-· ....
-· -· -· ----
Instructions for Completing a Constituent Assessment Form (Part A)
Part A of the procedure addresses both current and historic Laboratory operations that are known to have occurred at the PRS, the potential or probable constituents of concern for this PRS, and the status of work or actions taken at the PRS.
Completion of Part A shall use only existing information and/or data that are available for the PRS of interest. The form itself may be completed electronically or manually by attaching the historic and current operations description from an RFI work plan or RFI Report. Available data tables may be copied from a work plan/report or queried from Facility for Information, Management, Analysis and Display (FIMAD) but should be submitted as an attachment to the completed form. The ability to efficiently complete Part A is directly dependent upon the knowledge about the PRS of interest and the PRS documentation to date .
The FTL is responsible for the initiation and completion of the constituent-assessment process. Use an indelible dark-ink pen. Make an entry in each blank. For entry blanks for which no data are obtained, enter "UNK" for unknown, "N/A" for not applicable, or "ND" for not done, as appropriate. To change an entry, draw a single line through it, add the correct information above it, and date and initial the change. For all forms, complete the following information:
Site Information:
1. PRS Number- Use the PRS identification assigned by the ER Project for each site. If a map of the PRS and adjacent buildings within the Technical Area (TA) is available, please attach to Part A form.
2. Date/Time- The date and time when the measurement was made, in the following formats: DD-MMM-YY (e.g., 01-JAN-91) and the 24-hour clock time (0837 for 8:37a.m. and 1912 for 7:12p.m.).
3. ER Point of Contact- Provide the name of the individual who completed Part A or another individual who is very knowledgeable about the site and the information/data requested for Part A.
4. Facility Management Unit (FMU)/Responsible Party Contact- Provide the name of the individual who represents the facility where the PRS is located, and when coordination is necessary, is the point of contact for complying with Laboratory safety, security, or work-activity restrictions for the PRS.
5. Permit Information -Is this PRS listed on the Module VIII or is it an Area Of Concern (AOC) (potentially on the permit also)?
6. Site Ranking System Score - Provide the SRS score for this PRS from the most recent site ranking.
7. Description of the historic operations of this PRS - Provide information regarding past site activities that may typically be found in the SWMU report, an RFI work plan and/or RFI report. Include the identification of all constituents used at the PRS
ER-SOP-2.01, RO (ER19990087)
Attachment A Page 11 of25

as raw materials, known constituent product intermediates and product constituents for other known processes. If available, attach previous information not collected by the ER Project to Part A.
8. Description of current operations of this PRS (if any): Provide information regarding present site activities that may typically be found in the SWMU report, an RFI work plan and/or report or the current facility manager. Include the identification of all constituents used at the PRS as raw materials, known constituent-product intermediates and product constituents for other known processes. If information is available about these operations, attach the information to Part A.
PRS Status:
9. Action/Status to Date- Provide information on what type of field action has been proposed, completed, or is ongoing at a PRS. Also, provide information on the report/plan status of the site (e.g. RFI Work Plan, Sampling Analysis Plan, etc.). Check the appropriate fields on the form and provide the date that the action was completed or is anticipated to be completed. Provide additional information by circling the appropriate action (e.g., Phase I, under Field Investigation), or in the comment field.
Sample Information:
10. Soil/sediment sample descriptor information and sample data- Provide information/data that reflect only current ambient PRS field conditions which are above detection limits or background UTL values. Do not provide information/data with regard to past site conditions that no longer exist due to an action that has been taken at the PRS. Information/data are only for surface soils and sediments of less than 12 in. in depth.
Provide additional information to support PRS data, (e.g., sample date; sample number; sample location coordinates' site map with sample locations; mediasoil, sediment, tuff, etc.; data qualifiers; SALs; data detection/reporting limits; and supporting background data for the media where data is available). Editing or screening the data is not necessary at this time. All data that are available that meet the above specified identifiers should be reported.
11. Surface water sample descriptor information- If surface water sample information is available, provide information regarding sample date, location, whether sample was filtered/nonfiltered, and flow information if available. If surface water samples represent runoff from more than one PRS, the other involved PRSs and their constituents must also be identified.
12. If samples have been collected but data are not available, provide the anticipated date when the data could be available. Attach knowledge of process COPCs from RFI work plan.
13. ER Representative Identification- Print your name and position title, then sign.
ER-SOP-2.01, RO (ER 19990087)
Attachment A Page 12 of25
-...
...
----
...
-----

....
.....
....
.....
.....
.....
....
....
-!bit
.....
••
....
"""' ... ....
.....
.....
....
....
Surface Water Site Assessment (Part B)
Page 1 of 3
Site Information: 1 a. PRS Number: __________ _ 1 b. Structure Number: 1c. FMU Number: _________ _
2. Date!Time: -----------------------
Site Setting (check all that apply):
3. 0 On mesa top (a). 0 Within a bench of a canyon (b) .
0 In the canyon floor, but not in an established channel (c). 0 Within an established channel in the canyon floor (d).
Explanation:
4. Estimated ground and/or canopy cover at site( deciduous leaves, pine needles, rocks, vegetation, trees, structures, asphalt, etc.): (a)lx":l (b) X
X X X (c)
~ Estimated percentage of ground/canopy cover: 0 0% to 25%
Explanation:
5. Steepest slope at the impacted area:
(a)
c 0 Less than 10%
Explanation:
ER-SOP-2.01, RO
ER-SOP-2.01, RO (ER19990087)
(b)
0 10% to 30%
Attachment B
X Xx Xx
0 25% to 75% 0 75% to 100%
(c)
0 30% and greater
Los Alamos Environmental Restoration Pro'ect
Page 13 of25

Runoff Factors: y N
Surface Water Site Assessment (Part B)
Page 2 of3
0 0 6. Is there visible evidence of runoff discharging from the site? (If yes, answer questions 6a-6c below.)
0 0 6a. Is runoff channelized? If yes, describe: 0 Man-made channel 0 Natural channel
Explanation:
6b. Where does evidence of runoff terminate?
0 Drainage or wetland (name)
0 Within bench of canyon setting (name) ___________ _
0 Other (i.e., retention pond, meadow, mesa top)
Explanation:
0 0 6c. Has runoff caused visible erosion at the site? If yes, check type and explain below. 0 Sheet 0 Rill 0 Gully
Explanation:
Run-on Factors:
Please rate the potential for stormwater to run onto this site (check either Item 7 Q[ Item 9): y N 0 0 7. Are structures (i.e., buildings, roof drains, parking lots, storm drains) creating run-on to the site?
Explanation:
0 0 8. Are current operations (i.e., fire hydrants, NPDES outfalls) adversely impacting run-on to the site? Explanation:
0 0 9. Are natural drainage patterns directing stormwater onto the site? Explanation:
ER-SOP-2.01, RO
ER-SOP-2.01, RO (ER19990087)
Attachment B
Los Alamos Environmental Restoration Project
Page 14 of25
----
--
-"'1!11
-"'1!11
-
-----

-· •• ....
-· •• -· ""'
-IIIIi I
-· ... .....
••
-· .,,
., _,
..... .,
.. ,
-
Surface Water Site Assessment (Part B)
Assessment Finding:
y N
Page 3 of 3
0 0 10. Based on the criteria above and the assessment of this site, does a soil-erosion potential exist? (Refer to erosion-potential matrix)
11. Signature:
Water Quality/Hydrology Representative
______ Initials of the independent reviewer Check here when the information is entered in the database: 0
This section is for ESH-18 notes, recommendations, and photographs.
y N 0 0 12a. Is there visible trash/debris on the site?
0 0 12b. Is there visible trash/debris in the watercourse?
13a. Description of existing BMPs:
0 0 13b. Are BMPs being properly maintained? Provide description in "Other Internal Notes."
Other Internal Notes:
Los Alamos ER-SOP-2.01, RO Environmental Restoration Project
ER-SOP-2.01, RO (ER19990087)
Attachment B Page 15 of 25
Instructions for Completing a Surface Water Site Assessment Form (Part B)
ESH-18 or ER Project Regulatory Compliance personnel will complete Part B, the Surface Water Site Assessment. Part B addresses erosion potential and is part of a systematic approach to quantify surface-water impacts at Laboratory sites. This procedure describes the process for determining whether a site has the potential to adversely affect surface-water quality by erosion from run-off.
Field teams from ESH-18 or the ER Project will evaluate the field conditions to determine the potential for erosion or sediment migration. Based on the results of field evaluation, surface water corrective actions (BMPs) and/or NMED notifications may be required.
Photographs will be taken to help document the field characteristics at some sites. A consideration of the visual site conditions is necessary to accurately provide a frame of reference for the site. Photographs are taken to visually enhance the field-site condition descriptions.
Use an indelible dark-ink pen. Make an entry in each blank. For entry blanks for which no data are obtained, enter "UNK" for unknown, "N/A" for not applicable, or "NO" for not done, as appropriate. To change an entry, draw a single line through it, add the correct information above it, and date and initial the change. For all forms, complete the following information:
Site Information:
1 a. PRS Number- Use the PRS identification assigned by the ER Project to the site.
1 b. Structure Number- Provide the nearest technical area/structure number.
1c. FMU Number- Provide the facility management unit number.
2. Date/Time- The date and time when the measurement was made, in the following formats: DD-MMM-YY (e.g., 01-JAN-91) and the 24-hour clock time (0837 for 8:37a.m. and 1912 for 7:12p.m.).
Site Setting:
3. Check the appropriate setting(s) that best describes the location, in order of increasing concern, for the listed site.
(a) Check "On mesa top" if site is situated on a defined mesa top (e.g., Three Mile Mesa).
(b) Check "Within a bench in a canyon" if site is located over the edge of a mesa top and is either on a defined slope or bench (the original source may be located on mesa top).
ER-SOP-2.01, RO (ER19990087)
Attachment B Page 16 of25
-
------
... -

·-
....
....
.....
....
... ....
.....
....
.....
...
..... IIIII
.....
.....
....
••
illll•
(c) Check "In the canyon floor, but not in an established channel" if site is located in the bottom of the canyon exclusive of a defined drainage or bench setting. (A drainage is defined as having a bank and channel) .
(d) Check "Within established channel in the canyon floor" if site is located in the defined drainage portion of the canyon channel. (A drainage is defined as having a bank and channel) .
An explanation box is provided for a description of particular circumstances/ situations. Where more than one setting is checked, the most conservative will be used in scoring this criterion on the matrix. An example would be where a septic tank was located on a mesa top (a), but the outfall from the septic discharges over the mesa onto a defined slope or bench (b), the more conservative setting (b) would be used .
4. Check the appropriate percentage of canopy and ground cover that best compares with the provided pictorial illustration for the site location .
• Check from 0% to 25% if ground/canopy cover at site visually compares best with example (a) .
• Check 25% to 75% if ground/canopy cover at site visually compares best with example (b) .
• Check greater than 75% if ground/canopy cover at site visually compares best with example (c).
An explanation box is provided to describe the type(s) of ground cover (e.g., pine needles, grass, asphalt, rock, etc.) and canopy cover (e.g., pine/juniper, deciduous/evergreen) observed at the site. Where more than one percentage is checked, the most conservative will be used in scoring this criterion on the matrix . An example would be where a septic tank was located in a densely vegetated area (c), but the outfall from the septic discharges over the mesa top into a less vegetated area (b), the most conservative coverage (b) would be used
5. Check the appropriate slope(s) that best compare with the provided pictorial illustration for the site location.
• Check less than 10% if slope at site visually compares to example (a).
• Check 10% to 30% if slope at site visually compares to example (b).
• Check greater than 30% if slope at site visually compares to example (c) .
An explanation box is provided to describe particular circumstances/situations. Where more than one slope steepness is checked, the most conservative will be used in scoring the criteria. An example would be where a septic tank was located on a mesa top (a), but the outfall from the septic discharges over the mesa onto a very steep slope (c), the most conservative slope (c) would be used .
ER-SOP-2.01, RO (ER19990087)
Attachment B Page 17 of 25

Runoff Factors:
6. Is there visible evidence of water and/or sediment discharging from PRS? If yes, complete parts a, b, and c. If no, proceed to question number 7.
6a. Is runoff channelized? Check whether runoff discharges through man-made or natural drainage channels or from sheet flow. An explanation box is provided to describe the type of discharge.
6b. Where does evidence of runoff terminate? Check whether visual evidence of runoff terminates into a known canyon (e.g., Pajarito), into a known sub-drainage or wetland, or into other flat lying areas (e.g., bench setting, meadows, detention ponds, etc.). If runoff can be traced to an observable endpoint or drainage, provide an adequate description of that location.
6c. Has runoff caused visible erosion at the PRS? If yes, check sheet, rill, or gully erosion. An explanation box is provided to describe the visible signs of erosion and to provide an indication of the potential for the movement of surface sediments from the site.
Run-on Factors:
7. Are structures (i.e., buildings, roof drains, parking lots) creating run-on to this PRS?
If structures, from existing or new construction for facilities, collect and/or divert storm water run-on onto the PRS being evaluated, check yes. An explanation box is provided to describe the potential for buildings, roof drains, and/or construction project sites larger than five acres, to increase the volume of run-on to the site.
8. Are current operations adversely impacting storm water run-on to the PRS?
If current operations (e.g., NPDES outfalls, salvage material storage areas, septic discharges) could adversely impact run-on to the site being evaluated, check yes. Nonstormwater discharges such as fire-protection devices, potable-water-system tank overflow, and dust-suppression activities are also of interest. An explanation box is provided to describe which operations may be impacting run-on.
9. Are natural drainage patterns directing stormwater onto the PRS?
If site is located in an area in which natural drainage patterns focus stormwater run-on onto a site, check yes. An explanation box is provided to describe the natural drainage that could potentially cause erosion.
Typically, either question 7 or 9 would be selected independent of one another. If both are selected, then only one will be rated in the matrix because the weighting is identical.
ER-SOP-2.01, RO (ER19990087)
Attachment B Page 18 of25
-
-------
--
....
.....
..... IIIII
....
... ....
"""' ... -... .... ... -... ""'
'""
,..,
••
-... , -
-
Assessment Finding:
10 Based on the above criteria and the assessment of the site, does soil-erosion potential exist?
This is a subjective decision made by the field technician based on the evidence found at the site. The "potential" for soil erosion may exist without visible evidence of erosion being observed on the day of the assessment.
Signature:
11. Name of Water Quality/Hydrology or ER Project Representative- Provide name of person who completed the surface water site assessment for this site as a representative of ESH-18 or the ER Project. After completion, provide a copy to the appropriate representatives for the site .
ESH-18 Notes and Recommendations:
12a. Is there visible trash/debris located on site? If trash/debris is observed at the site, check yes and provide comments in "Other Internal Notes."
12b. Is there visible trash/debris in a watercourse? If trash/debris is observed within a watercourse as defined earlier in Section 3.15, check yes and provide comments in "Other Internal Notes" .
13a. Description of existing BMPs. Provide a brief description of BMPs that currently exist at the site .
13b. Are BMPs being properly maintained? Check either yes/no and provide a description of the effectiveness or ineffectiveness of BMPs in "Other Internal Notes."
ER-SOP-2.01, RO (ER19990087)
Attachment B Page 19 of25
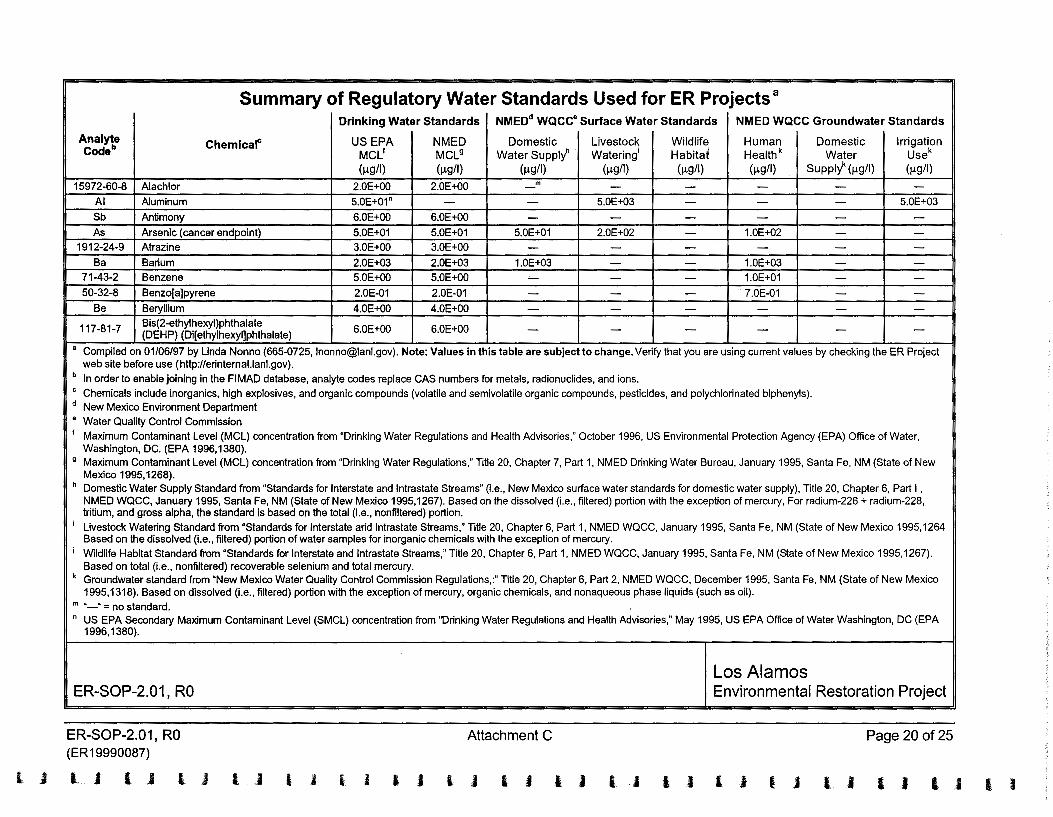
l J
Summary of Regulatory Water Standards Used for ER Projects a
Drinking Water Standards NMEDd WQcc• Surface Water Standards NMED WQCC Groundwater Standards
AnaiY1e Chemical" US EPA NMED Domestic Livestock Wildlife Human Domestic Irrigation Codeb MCL1 MCL9 Water SupplY' Watering; Habita~ Healthk Water Usek
(~-tg/1) (~-tg/1) (~-tg/1) (~-tg/1) (~-tg/1) (~-tg/1) Sup pi/ (~-tg/1) (~-tg/1)
15972-60-8 Alachlor 2.0E+OO 2.0E+OO _m - - - - -AI Aluminum 5.0E+01" - - 5.0E+03 - - - 5.0E+03
Sb Antimony 6.0E+OO 6.0E+OO - - - - - -/>$ Arsenic (cancer endpoint) 5.0E+01 5.0E+01 5.0E+01 2.0E+02 - 1.0E+02 - -
1912-24-9 Atrazine 3.0E+OO 3.0E+OO - - - - - -Ba Barium 2.0E+03 2.0E+03 1.0E+03 - - 1.0E+03 - -
71-43-2 Benzene 5.0E+OO 5.0E+OO - - - 1.0E+01 - -50-32-8 Benzo[a]pyrene 2.0E-01 2.0E-01 - - - 7.0E-01 - -
Be Beryllium 4.0E+OO 4.0E+OO - - - - - -117-81-7 Bis(2-ethylhexyl)phthalate
(DEHP) (Di[ ethylhexyl]phthalate) 6.0E+OO 6.0E+OO - - - - - -• Compiled on 01/06/97 by Linda Nonno (665-0725, [email protected]). Note: Values in this table are subject to change. Verify that you are using current values by checking the ER Project
web site before use (http://erinternal.lanl.gov).
b In order to enable joining in the FIMAD database, analyte codes replace CAS numbers for metals, radionuclides, and ions.
c Chemicals include inorganics, high explosives, and organic compounds (volatile and semivolatile organic compounds, pesticides, and polychlorinated biphenyls). d New Mexico Environment Department • Water Quality Control Commission 1 Maximum Contaminant Level (MCL) concentration from "Drinking Water Regulations and Health Advisories," October 1996, US Environmental Protection Agency (EPA) Office of Water,
Washington, DC. (EPA 1996,1380). 9 Maximum Contaminant Level (MCL) concentration from "Drinking Water Regulations," Title 20, Chapter 7, Part 1, NMED Drinking Water Bureau, January 1995, Santa Fe, NM (State of New
Mexico 1995,1268). h Domestic Water Supply Standard from "Standards for Interstate and Intrastate Streams" (i.e., New Mexico surface water standards for domestic water supply), Title 20, Chapter 6, Part I •
NMED WQCC, January 1995, Santa Fe, NM (State of New Mexico 1995,1267). Based on the dissolved (i.e., filtered) portion with the exception of mercury, For radium-226 + radium-228, tritium, and gross alpha, the standard is based on the total (i.e., nonfiltered) portion.
; Livestock Watering Standard from "Standards for Interstate arid Intrastate Streams," Title 20, Chapter 6, Part 1, NMED WQCC, January 1995, Santa Fe, NM (State of New Mexico 1995,1264 Based on the dissolved (i.e., filtered) portion of water samples for inorganic chemicals with the exception of mercury.
i Wildlife Habitat Standard from "Standards for Interstate and Intrastate Streams," Title 20, Chapter 6, Part 1, NMED WQCC, January 1995, Santa Fe, NM (State of New Mexico 1995,1267). Based on total (i.e., nonfiltered) recoverable selenium and total mercury.
k Groundwater standard from "New Mexico Water Quality Control Commission Regulations,:" Title 20, Chapter 6, Part 2, NMED WQCC, December 1995, Santa Fe, NM (State of New Mexico 1995,1318). Based on dissolved (i.e., filtered) portion with the exception of mercury, organic chemicals, and nonaqueous phase liquids (such as oil).
m "-" = no standard. " US EPA Secondary Maximum Contaminant Level (SMCL) concentration from "Drinking Water Regulations and Health Advisories," May 1995, US EPA Office of Water Washington, DC (EPA
1996,1380).
ER-SOP-2.01, RO
ER-SOP-2.01, RO (ER 19990087)
l J l j l J l j
Attachment C
l j l J I I l J l j
Los Alamos Environmental Restoration Project
Page 20 of25
l I I J i J I J l J l I l J I I l I

I i I I I 1 I J I 1 I I I t f I I t I I I I f '
r 1 I I f ) r ' ' , f
Summary of Regulatory Water Standards Used for ER Projects {continued) Drinking Water Standards NMED WQCC Surface Water Standards NMED WQCC Groundwater Standards
Analyte Chemical US EPA NMED Domestic Livestock Wildlife Human Domestic Irrigation
Code MCL MCL Water Supply Watering Habitat Health Water Supply Use (J.lg/1) (J.lg/1) (J.tg/1) (J.lg/1) (J.tg/1) (J.lg/1) (J.lg/1) (J.lg/1)
B Boron - - 5.0E+03 - - - 7.5E+02
Cd Cadmium 5.0E+OO 5.0E+OO 1.0E+01 5.0E+01 - 1.0E+01 - -
1563-66-2 Carbofuran 4.0E+01 4.0E+01 - - - - - -56-23-5 Carbon Tetrachloride 5.0E+OO 5.0E+OO - - - 1.0E+01 - -57-74-9 Chlordane 2.0E+OO 2.0E+OO - - - - - -Cl(-1) Chloride 2.5E+05" - - - - - 2.5E+05 -
108-90-7 Chlorobenzene (Monochlorobenzene) 1.0E+02 1.0E+02 - - - - - -67-66-3 Chloroform (Trichloromethane) 1.0E+02° 1.0E+O~ - - - 1.0E+02 - -
Cr Chromium (must include both trivalent
1.0E+02 1.0E+02 5.0E+01 1.0E+03 - 5.0E+01 - -and hexavalent forms)
Co Cobalt - - - 1.0E+03 - - - 5.0E+01
Cu Copper 1.3E+03P 1.3E+03P - 5.0E+02 - - 1.0E+03 -Cn(-1) Cyanide 2.0E+02 2.0E+02 2.0E+02 - - 2.0E+02 - -
75-99-0 Dalapon 2.0E+02 2.0E+02 - - - - - -96-12-8 1 ,2-Dibromo-3-chloropropane 2.0E-01 2.0E-01 - - - - - -106-93-4 1 ,2-Dibromoethane 5.0E-02 5.0E-02 - 1.0E-01
(Ethylene Dibromide) - - - -
95-50-1 1 ,2-Dichlorobenzene(o) 6.0E+02 6.0E+02 - - - - - -541-73-1 1 ,3-Dichlorobenzene(m) 6.0E+02 - - - - - - -106-46-7 1 ,4-Dichlorobenzene(p) 7.5E+01 7.5E+01 - - - - - -75-34-3 1 , 1-Dichloroethane - - - - - 2.5E+01 - -107-06-2 1,2-Dichloroethane (EDC) 5.0E+OO 5.0E+OO - - - 1.0E+01 - -75-35-4 1, 1-Dichloroethylene (1, 1-DCE) 7.0E+OO 7.0E+OO - - - 5.0E+OO - -156-59-2 1 ,2-Dichloroethylene (cis) 7.0E+01 7.0E+01 - - - - - -
156-60-5 1 ,2-Dichloroethylene (trans) 1.0E+02 1.0E+02 - - - - - -94-75-7 2,4-Dichlorophenoxyacetic Acid 7.0E+01 7.0E+01 - - - - - -
" US EPA Secondary Maximum Contaminant Level (SMCL) concentration from "Drinking Water Regulations and Health Advisories," May 1995, US EPA Office of Water Washington, DC (EPA 1996,1380).
0 The State (State of New Mexico 1995, 1268) and EPA (EPA 1996, 1380) MCL for clioroform is the MCL for total trihalomethanes. Total trihalomethanes is defined as the sum of the concentration of the following trihalomethane compounds: chloroform, dibromochloromethane, bromodichloromethane, and tribromomethane (bromoform).
P US EPA MCL is under review (EPA 1996,1380). Number presented is the EPA action level. Although the EPA MCL is under review, to NMED Drinking Water Bureau has adopted the action level.
ER-SOP-2.01, RO
ER-SOP-2.01, RO (ER 19990087)
Los Alamos Environmental Restoration Project
Attachment C Page 21 of 25
' ,
!
I
I
I I

l j
Summary of Regulatory Water Standards Used for ER Projects (continued) Drinking Water Standards NMED WQCC Surface Water Standards NMED WQCC Groundwater Standards
Analyte Chemical US EPA NMED Domestic Livestock Wildlife Human Domestic Irrigation Code MCL MCL Water Supply Watering Habitat Health Water Supply Use
(J.lg/1) (J.Lg/1) (J.lg/1) (J.lg/1) (J.lg/1) (J.lg/1) (J,!g/1) (J.lgll)
78-87-5 1 ,2-Dichloropropane 5.0E+OO 5.0E+OO - - - - - -103-23-1 Di(2-ethylhexyl)adipate 4.0E+02 4.0E+02 - - - - - -88-85-7 Dinoseb 7.0E+OO 7.0E+OO - - - - - -85-00-7 Diquat 2.0E+01 2.0E+01 - - - - - -
145-73-3 Endothall 1.0E+02 1.0E+02 - - - - - -72-20-8 Endrin 2.0E+OO 2.0E+OO - - - - - -100-41-1 Ethylbenzene 7.0E+02 7.0E+02 - - - 7.5E+02 - -
F(-1) Fluoride 4.0E+03" 4.0E+03 - - - 1.6E+03 - -1071-83-6 Glyphosate 7.0E+02 7.0E+02 - - - - - -76-44-8 Heptachlor 4.0E-01 4.0E-01 - - - - - -
1024-57-3 Heptachlor epoxide 2.0E-01 2.0E-01 - - - - - -118-74-1 Hexachlorobenzene 1.0E+OO 1.0E+OO - - - - - -
58-89-9 HCH (gamma) Lindane 2.0E-01 2.0E-01 - - - - - -77-47-4 Hexachlorocyclopentadiene 5.0E+01 5.0E+01 - - - - - -
Fe Iron 3.0E+02" - - - - 1.0E+03 - -Pb Lead 1.5E+01P 1.5E+01P 5.0E+01 1.0E+02 - 5.0E+01 - -Mn Manganese 5.0E+01" - - - - - 2.0E+02 -Hg Mercury (inorganic) 2.0E+OO 2.0E+OO 2.0E+OO 1.0E+01 1.2E+02 2.0E+OO - -
72-43-5 Methoxychlor 4.0E+01 4.0E+01 - - - - - -75-09-2 Methylene Chloride (Dichloromethane) 5.0E+OO 5.0E+OO - - - 1.0E+02 - -
Mo Molybdenum - - - - - - - 1.0E+03
n/aq Naphthalene + monomethylnaph- - - - - - 3.0E+01 - -thalenes Ni Nickel (soluble salts) - 1.0E+02 - - - - - 2.0E+02
NC>.J(-1) Nitrate (as N) 1.0E+04 1.0E+04 1.0E+04 - - 1.0E+04 - -NCh/NOJ Total Nitrate+ Nitrate (as N) 1.0E+04 1.0E+04 - - - - - -
" US EPA Secondary Maximum Contaminant Level (SMCL) concentration from "Drinking Water Regulations and Health Advisories," May 1995, US EPA Office of Water Washington, DC (EPA 1996, 1380).
P US EPA MCL is under review (EPA 1996,1380). Number presented is the EPA action level. Although the EPA MCL is under review, to NMED Drinking Water Bureau has adopted the action level.
q n/a = not applicable
ER-SOP-2.01, RO
ER-SOP-2.01, RO (ER19990087)
l,, J ' .• l.,.J L ... .J l,_ . .J 1 .. J (, j
Los Alamos Environmental Restoration Project
Attachment C Page 22 of25
l J ' J
l J l .J L ,J I. J l J l I I J I J l j

f l I I ! ! I "'
~ . I i • " lf 1 • • I I ' f J
------
If
"' If
" li J f : II\
II\ • J • I J I 1 f .. J ; " I • I
Summary of Regulatory Water Standards Used for ER Projects (continued) Drinking Water Standards NMED WQCC Surface Water Standards NMED WQCC Groundwater Standards
Analyte Chemical US EPA NMED Domestic Livestock Wildlife Human Domestic Irrigation
Code MCL MCL Water Supply Watering Habitat Health Water Supply Use (jlg/1) (jlg/1) (jlg/1) (jlg/1) (Jlg/1) (jlg/1) (jlg/1) ().!gil)
NOz(-1) Nitrite (as N) 1.0E+03 1.0E+03 - - - - - -23135-22-0 Oxamyl 2.0E+02 2.0E+02 - - - - - -
87-86-5 Pentachlorophenol 1.0E+OO 1.0E+OO - - - - - -pH pH 6.5-8.5 pH' - - - - - - -
n/aq Phenols (Total of all phenol cmpds) - - - - - - 5.0E+OO -
1918-02-1 Picloram 5.0E+02 5.0E+02 - - - - - -1336-36-3 Polychlorinated biphenyls (PCBs) 5.0E-01 5.0E-01 - - - 1.0E+OO - -
Se Selenium 5.0E+01 5.0E+01 5.0E+01 5.0E+01 2.0E+OO 5.0E+01 - -Ag Silver 1.0E+02" - 5.0E+01 - - 5.0E+01 - -
122-34-9 Simazine 4.0E+OO 4.0E+OO - - - - - -804 Sulfate 2.5E+05" - - - - - 6.0E+05 -
100-42-5 Styrene 1.0E+02 1.0E+02 - - - - - -1746-01-6 2,3,7,8-TCDD (Dioxin) 3.0E-05 3.0E-05 - - - - - -79-34-5 1,1,2,2-Tetrachloroethane - - - - - 1.0E+01 - -127-18-4 Tetrachloroethylene (PCE) 5.0E+OO 5.0E+OO - - - 2.0E+01 - -
Tl Thallium 2.0E+OO 2.0E+OO - - - - - -108-88-3 Toluene 1.0E+03 1.0E+03 - - - 7.5E+02 - -
TDS Total Dissolved Solids 5.0E+05" - - - - - 1.0E+06
8001-35-2 Toxaphene 3.0E+OO 3.0E+OO - - - - - -120-82-1 1,2,4-Trichlorobenzene 7.0E+01 7.0E+01 - - - - - -71-55-6 1,1,1-Trichloroethane 2.0E+02 2.0E+02 - - - 6.0E+01 - -79-00-5 1,1,2-Trichloroethane 5.0E+OO 5.0E+OO - - - 1.0E+01 - -79-01-6 Trichloroethylene (TCE) 5.0E+OO 5.0E+OO - - - 1.0E+02 - -93-72-1
2-(2,4,5-Trichlorophenoxy)propionic 5.0E+01 5.0E+01 - - - - - -Acid (2,4,5-TP)
Lf'UI.U~U: Uranium (soluble salts) - - 5.0E+03 - - 5.0E+03 - -v Vanadium - - - 1.0E+02 - - - -
75-01-4 Vinyl Chloride 2.0E+OO 2.0E+OO - - - 1.0E+OO - -" US EPA Secondary Maximum Contaminant Level (SMCL) concentration from "Drinking Water Regulations and Health Advisories," May 1995, US EPA Office of Water Washington, DC (EPA
1996,1380).
q n/a = not applicable
ER-SOP-2.01, RO
ER-SOP-2.01, RO (ER 19990087)
Los Alamos Environmental Restoration Proiect
Attachment C Page 23 of 25
·" t
I
I
I 11 ll

I _J
---
Summary of Regulatory Water Standards Used for ER Projects (concluded) Drinking Water Standards NMED WQCC Surface Water Standards NMED WQCC Groundwater Standards
Analyte Chemical US EPA NMED Domestic Livestock Wildlife Human Domestic Irrigation Code MCL MCL Water Supply Watering Habitat Health Water Supply Use
(J..Lg/1) (J..Lgll) (J..Lg/1) (J..Lgll) (J..Lg/1) (J..Lg/1) (J..Lgll) (J..Lg/1)
1330-20-7 Xylene (mixed) 1.0E+04 1.0E+04 - - - 6.2E+02 - -Zn Zinc 5.0E+03" - - 2.5E+04 - - 1.0E+04 -
ALPHA Gross Alpha (Does not include Radon 1.5E+01 1.5E+01 1.5E+01 or Uranium.) 1.5E+01 - - - -2261228Ra Radium-226 + Radium-228 5.0E+OO 5.0E+OO 3.0E+01 .OE+01 .OE+01 - -
""Sr Strontium-90 - 8.0E+OO - - - - - -u Uranium (radionuclide) 2.0E+01 Jlgll' sect. 207(b)1 - - - - - -"H Tritium - 2.0E+04 2.0E+04 2.0E+04 - - - -
1 Maximum Contaminant Level (MCL) concentration from "Drinking Water Regulations and Health Advisories," October 1996, US Environmental Protection Agency (EPA) Office of Water, Washington, DC. (EPA 1996,1380).
" US EPA Secondary Maximum Contaminant Level (SMCL) concentration from "Drinking Water Regulations and Health Advisories," May 1995, US EPA Office of Water Washington, DC (EPA 1996,1380).
' Proposed US EPA MCL (EPA 1996,1380). Number presented is the EPA action level.
ER-SOP-2.01, RO
ER-SOP-2.01, RO (ER19990087)
i ' I -J
' J i: .J
Attachment C
I ; l .i L j l j i J
Los Alamos Environmental Restoration Proiect
Page 24 of25
l J l I l '
I J l _, l I I -1 I J l j

illfilll
....
111111
""'
.... 111111
.... •• II"'•
,.... llllu
"""''
------
---
ER Project List of Potential Bioaccumulation Compounds
The priority list of compounds with a potential for bioaccumulation at the Laboratory is provided with the stipulation that the list is still under development. Compounds are being evaluated based on
1 ) toxicity,
2) frequency of occurrence at the Laboratory including the use of the co-occurrence of a bioaccumulator with another chemical as a marker for the bioaccumulator when supported by historical data or site sampling data,
3) potential for receptors including sensitive species and habitat at the Laboratory, and
4) bioconcentration factor (BCF) adjusted for environmental factors at the Laboratory or based on site-specific data.
Use the following list of compounds-currently in the category of "high priority" bioaccumulators-in assessing SOP 2.01 concerns at the Laboratory.
• Cadmium
• Cesium-137
• Mercury
• Strontium-90
• All arochlors (PCBs)
ER-SOP-2.01, RO (ER19990087)
Attachment D Page 25 of25

....
....
...
1111 ..
... Appendix D
....
... Ecological Scoping Checklist
•• ....
....
, ....
•• ..... ....
-· ••

-·
... APPENDIX D ECOLOGICAL SCOPING CHECKLIST
Part A-Scoping Meeting Documentation
Site ID SWMU 21-011(k) ,,.,.
Form of site releases (solid, liquid, Site was a former outfall associated with two 12,700 gal. effluent-vapor}. Describe all relevant known or holding tanks (TA-21-112 and TA-21-113) that discharged treated suspected mechanisms of release effluent from an industrial liquid waste treatment facility into DP Canyon (spills, dumping, material disposal, via 21-011 (k) outfall. Releases at the outfall were to the surface. The outfall, explosive testing, etc.} and discharge flowed down the slope and eventually into the DP Canyon
•• describe potential areas of release. drainage, which is not part of this SWMU . Reference locations on a map as
.... appropriate . List of Primary Impacted Media Surface soil- XX- impacted by discharges at the outfall.
•• (Indicate all that apply.} Surface water/sediment -X- potentially impacted from the discharge into the canyon; sediment in bottom of canyon and possibly surface water including ephemeral stream channel in bottom of canyon.
Subsurface-Groundwater- XX -alluvial groundwater impacted by discharges at
the outfall. Other, explain -
FIMAD vegetation class based on Water- XX- An ephemeral stream channel exists in the bottom of DP Arcview vegetation coverage Canyon below the SWMU and flows eastward. It is located - (Indicate all that apply.) approximately 100 to 200 yards from outfall.
Bare Ground/Unvegetated -XX -There are few areas of bare ground between vegetated areas. These areas are either exposed tuff or dirt often covered with pine needles and other plant litter. - Spruce/fir/aspen/mixed conifer-
Ponderosa pine- XX- Primary vegetation community; also ground cover of grasses and shrubs. - Pinon juniper/juniper savannah -
Grassland/shrubland -XX- in the bottom of DP Canyon, below the SWMU, with small patches of bare ground.
Developed -. - Is T&E Habitat Present? The site is on the border of the core habitat for the Mexican spotted owl If applicable, list species known or and peregrine falcon. This site is within an area that the owl may be suspected to use the site for breeding assumed to forage with a moderate to low frequency. - or foraging. Provide list of Neighboring/ Neighboring/Contiguous/Up-gradient from SWMU 21-011 (k} are: Contiguous/ Up-gradient sites, 21-001, 21-011 (a), 21-019(g), 21-011 (h), 21-011 (j), 21-011 (i), include a brief summary of COPCs 21-011 (e), 21-011 (d), 21-011 (g), 21-01 O(e), 21-011 (f), 21-016(a), - and form of releases for relevant sites 21-010(f), 21-010(a), 21-010(c), 21-011(c), 21-028(a), 21-016(b), --and reference map as appropriate. 21-010(b), 21-016(c), 21-01 O(h), and 21-01 O(g). The majority of the (Use information to evaluate need to contamination contributing to SWMU 21-011 (k) would have come aggregate sites for screening.} from SWMUs 21-011 (g) and (f), two 12,700 gal. effluent-holding
tanks (TA-21-112 and TA-21-113) that discharged treated effluent - from an industrial liquid waste treatment facility into DP Canyon. Additionally, SWMUs 21-016(a-c) (MDA T) where liquid radioactive
..... waste was disposed is upgradient from SWMU 21-011 (k) . Surface Water Erosion Potential The Erosion Matrix score for this SWMU is 72, with a score of 46 for Information runoff [visible evidence of runoff discharging (5.0), runoff terminates in a Summarize information from SOP drainage/wetland (19.0), and runoff in a gully (22.0)] and a score of 0.0 - 2.01, including the run-off subscore for run-on (natural drainages onto site) scores. The score also reflects it (maximum of 46}; terminal point of is within the canyon floodplain, but not watercourse (13.0), ground cover surface water transport; slope; and is 25-75% (6.5), and slope is >10-30%. (6.5). Potential exists for soil surface water runon sources. erosion at this site. The runoff terminates in DP Canyon. --- ER2003-0326 D-1 May2003

--VCM Plan for SWMU 21-011(k), Rev. 3 -Part 8-Site Visit Documentation
Site ID SWMU 21-011 (k)
Date of Site Visit 10/26/2000
Site Visit Conducted by Rich Mirenda, Linda Causey, Jayne Jones
Receptor Information:
Estimate cover Relative vegetative cover (high, medium, low, none)= high Relative wetland cover (high, medium, low, none)= none Relative structures/asphalt, etc. cover (high, medium, low, none)= none
Field notes on the FIMAD vegetation Site visit confirms that this SWMU is a combination of open areas and class to assist in ground-truthing the ponderosa pine. In some places the tuff is on the surface, in others it is -Arcview information several inches below the surface. Ground cover consists of grasses,
shrubs, and young trees. As one goes from DP Road to the mesa top -edge of DP Canyon, the vegetation increases and older ponderosa pine predominates. The ground is also covered with pin needles and litter from other plants.
Field notes on T&E Habitat, if Site provides good to excellent habitat for foraging. While there is applicable. Consider the need for a generally no habitat for nesting for T&E species, there are a few nearby site visit by a T&E subject matter dead trees that would make for excellent nesting of birds. The Mexican expert to support the use of the site spotted owl and the peregrine falcon may forage in DP Canyon (Koch by T &E receptors. 1999, 63599)
Are ecological receptors present at Yes. Terrestrial receptors are present in and around the SWMU. the site? Various songbirds were observed in the trees and circling raptors were
(yes/no/uncertain) observed. There was evidence of burrowing was observed in this area. Bear tracks were seen in the dry stream bed. Other large mammals
Describe the general types of such as deer, elk, coyotes and raccoons would be in the area. Plant life receptors present at the site is abundant and healthy. No aquatic receptors are present in the (terrestrial and aquatic), and make canyon reach below the SWMU. notes on the quality of habitat present
-at the site. -
Contaminant Transport Information: -Surface water transport Previously, the runoff flowed into a man-made (3 to 4ft deep) gully and
Field notes on the erosion potential, into DP Canyon. Runoff flow to this gully has been diverted during the
including a discussion of the terminal 1996 Interim Action in order to prevent contaminants from being moved
point of surface water transport (if via water. The surface water runoff has now been diverted into DP
applicable). Canyon via a drainage to the east and another to the far west of the site. Rain water that falls directly on the outfall portion of the SWMU
-would flow into DP Canyon via sheet flow. The terminal point of surface water transport is the intermittent stream channel in the bottom of DP Canyon. There is evidence of erosion into the canyon. -
·Are there any off-site transport Surface water transport is the primary off-site transport pathway. Air pathways (surface water, air, or transport via particulates or fugitive dust would be a possibility due to groundwater)? surface contamination, however, there are no barren patches of ground
(yes/no/uncertain) that would be subjected to wind, there is ground cover and plant litter covering the dirt, and the area is protected from wind by trees. Ground
Provide explanation water is a viable pathway because the alluvial aquifer is less than 5 ft from ground surface and it is suspected to be the source for DP Spring.
Interim action needed to limit off-site An Interim Action has already occurred at this SWMU. Contaminated transport? soil has been removed and runoff has been diverted from the
(yes/no/uncertain) contaminated west drainage and from the surface of the SWMU.
Provide explanation/ recommendation to project lead for lA SMDP.
May2003 D-2 ER2003-0326
-

...
.....
..... 1111"'
-....
....
...
... IIJIIIO
•• ... •• .....
.... ••
-· ... ..... ... .....
VCM Plan for SWMU 21-011 (k), Rev. 3
Ecological Effects Information:
Physical Disturbance The physical disturbances are the west drainage which shows signs of
(Provide list of major types of past remedial activities and BMPs.
disturbances, including erosion and construction activities, review historical aerial photos where appropriate.)
Are there obvious ecological effects? No. The area from the top of the mesa to the stream channel in the
(yes/no/uncertain) canyon bottom appear to be no different from the surrounding area.
Provide explanation and apparent cause (e.g., contamination, physical disturbance, other).
Interim action needed to limit No. Current data does not support the implementation of an interim apparent ecological effects? action at this SWMU. An Interim Action was implemented in 1996.
(yes/no/uncertain)
Provide explanation and recommendations to mitigate apparent exposure pathways to project lead for lA SMDP.
No Exposurenransport Pathways:
If there are no complete exposure pathways to ecological receptors onsite and no transport pathways to offsite receptors, the remainder of the checklist should not be completed. Stop here and provide additional explanation/justification for proposing an ecological No Further Action recommendation (if needed). At a minimum, the potential for future transport should include likelihood that future construction activities could make contamination more available for exposure or transport .
Not applicable .
Adequacy of Site Characterization:
Do existing or proposed data provide Nature- Yes, full suite samples from past sampling adequately defines information on the nature, rate and the nature of contamination. extent of contamination? Rate- Yes, aerial photographs show that gamma shine starts in DP (yes/no/uncertain) Canyon at SWMU 21-011 (k) and continues down canyon, and sampling
Provide explanation down stream of SWMU 21-011 (k) in the canyon has been done by the
(Consider if the maximum value was Canyons Focus Area.
captured by existing sample data.) Extent - Yes. Sampling has been conducted laterally vertically and downstream which is not part of this SWMU.
Do existing or proposed data for the Yes. The sampling proposed in the VCM will address the major site address potential transport potential transport pathway, i.e., surface water runoff down the drainage pathways of site contamination? and into DP Canyon.
(yes/no/uncertain)
Provide explanation
(Consider if other sites should aggregated to characterize potential ecological risk.)
ER2003-0326 0-3 May2003

VCM Plan for SWMU 21-011(k), Rev. 3
Part C-Ecological Pathways Conceptual Exposure Model
Question A:
Could soil contaminants reach receptors via vapors?
• Volatility of the hazardous substance (volatile chemicals generally have Henry's Law constant > 1 o·s atm-me/mol and molecular weight <200 g/mol).
Answer (likely/unlikely/uncertain): unlikely
Provide explanation: No volatile organic chemicals were detected in the samples collected before 2001. In the 2001 samples volatile organic chemicals (acetone, methylene chloride, 4-isopropyltoluene, 2-hexanone, and trichloroethane) were detected sporadically and in concentrations in the low part per billion range. One sample location (21-11205) was re-sampled and the volatile organic chemicals were not detected. Therefore, it is very possible that the volatile organic chemicals were analytical laboratory contaminants.
Question B:
Could the soil contaminants reach receptors through fugitive dust carried in air?
• Soil contamination would have to be on the actual surface of the soil to become available for dust.
• In the case of dust exposures to burrowing animals, the contamination would have to occur in the depth interval where these burrows occur.
Answer (likely/unlikely/uncertain): likely
Provide explanation: Soil contamination is on the surface of the soil and is available to become dust where there are bare areas. However, most of the ground is covered with pine needles and litter from the overstory so fugitive dust would be rare or unlikely to occur. However, there is evidence of burrowing animals and they would have to burrow through the contamination at the surface.
Question C:
Can contaminated soil be transported to aquatic ecological communities (use SOP 2.01 run-off score and terminal point of surface water runoff to help answer this question)?
• If the SOP 2.01 run-off score* for each SWMU included in the site is equal to zero, this suggests that erosion at the site is not a transport pathway.(* Note that the runoff score is not the entire erosion potential score, rather it is a subtotal of this score with a maximum value of 46 points).
• If erosion is a transport pathway, evaluate the terminal point to see if aquatic receptors could be affected by contamination from this site.
Answer (likely/unlikely/uncertain): Unlikely
Provide explanation: The major off-site transport pathway is surface water runoff into DP Canyon. However, there are no aquatic ecosystems in this reach of the canyon that would receive this runoff.
May2003 D-4 ER2003-0326
-
-------
---------
-
.... IIIII
.....
....
"'"' ...
IIIII
.....
....
....
.... •• ....
-·
-
.....
--
VCM Plan for SWMU 21-011 (k), Rev. 3
Question D:
Is contaminated groundwater potentially available to biological receptors through seeps or springs or shallow groundwater?
• Known or suspected presence of contaminants in groundwater.
• The potential for contaminants to migrate via groundwater and discharge into habitats and/or surface waters.
• Contaminants may be taken up by terrestrial and rooted aquatic plants whose roots are in contact with groundwater present within the root zone (-1 m depth).
• Terrestrial wildlife receptors generally will not contact groundwater unless it is discharged to the surface.
Answer (likely/unlikely/uncertain): Likely
Provide explanation: Alluvial water is close to the surface in the canyon, which is not part of the SWMU . Alluvia wells LAUZ-1 [located on the eastern edge of SWMU 21-011 (k) next to the stream bed] and LAUZ-2 [located approximately 250ft downgradient from LAUZ-1] encountered alluvial water at approximately 4.5 ft below the surface. The saturated zone at the time was approximately 3.5 ft thick . This alluvial water is thought to be a source for DP Spring. This spring flows from the south-facing slope of DP Canyon, approximately 3,000 ft downstream to the east from SWMU 21-011 (k). The shallow alluvial water on site can discharge into the ephemeral stream at the canyon bottom. Contaminants are available to be taken up by terrestrial plants with roots in contact with the alluvial water. Terrestrial wildlife receptors can contact this alluvial water when it surfaces into the ephemeral stream at the bottom of DP Canyon. There are no seeps or springs up canyon from the SWMU.
Question E:
Is infiltration/percolation from contaminated subsurface material a viable transport and exposure pathway?
• Suspected ability of contaminants to migrate to groundwater.
• The potential for contaminants to migrate via groundwater and discharge into habitats and/or surface waters.
• Contaminants may be taken up by terrestrial and rooted aquatic plants whose roots are in contact with groundwater present within the root zone (-1 m depth).
• Terrestrial wildlife receptors generally will not contact groundwater unless it is discharged to the surface.
Answer (likely/unlikely/uncertain): Likely
Provide explanation: Plutonium-239/240, strontium-90, tritium, uranium-234, and uranium -235 are present in SWMU 21-011 (k) soil. Plutonium-239/240, strontium-90, and uranium-234 have been observed in alluvial groundwater from LAUZ-1 and LAUZ-2 to DP Spring. Tritium and uranium-235 were detected in the alluvial groundwater from LAUZ-1 and LAUZ-2 (LANL 1999, 63915} .
Question F:
Might erosion or mass wasting events be a potential release mechanism for contaminants from subsurface materials or perched aquifers to the surface?
ER2003-0326 D-5 May2003

VCM Plan for SWMU 21-011(k), Rev. 3
• This question is only applicable to release sites located on or near the mesa edge.
• Consider the erodability of surficial material and the geologic processes of canyon/mesa edges.
Answer (likely/unlikely/uncertain): Likely
Provide explanation: While the slope is well vegetated, there is evidence of erosion. Mass wasting is not considered a potential release mechanism because the slope appears stable and vegetated.
Question G:
Could airborne contaminants interact with receptors through respiration of vapors?
• Contaminants must be present as volatiles in the air.
• Consider the importance of inhalation of vapors for burrowing animals.
• Foliar uptake of organic vapors is typically not a significant exposure pathway.
Provide quantification of exposure pathway (O=no pathway, 1=unlikely pathway, 2=minor pathway, · 3=major pathway):
Terrestrial Plants: 0
Terrestrial Animals: 0
Provide explanation: No volatile organics are expected to be present.
Question H:
Could airborne contaminants interact with plants through deposition of particulates or with animals through inhalation of fugitive dust?
• Contaminants must be present as particulates in the air or as dust for this exposure pathway to be complete.
• Exposure via inhalation of fugitive dust is particularly applicable to ground-dwelling species that would be exposed to dust disturbed by their foraging or burrowing activities or by wind movement.
Provide quantification of exposure pathway (O=no pathway, 1 =unlikely pathway, 2=minor pathway, 3=major pathway):
Terrestrial Plants: 0
Terrestrial Animals: 2
Provide explanation: Although there is contamination on the surface, the ground is well covered with pine needles and litter from the established vegetation. However, there is evidence of burrowing animals.
Question 1:
Could contaminants interact with plants through root uptake or rain splash from surficial soils?
• Contaminants in bulk soil may partition into soil solution, making them available to roots.
May2003 D-6 ER2003-0326
-
-
...

....
... VCM Plan for SWMU 21-011(k), Rev. 3
• Exposure of terrestrial plants to contaminants present in particulates deposited on leaf and stem surfaces by rain striking contaminated soils (i.e., rain splash).
"""' Provide quantification of exposure pathway (O=no pathway, 1=unlikely pathway, 2=minor pathway, 3=major pathway): ....
1111 ..
.....
111101
"""
.....
...
....
.....
.....
....
.....
....
,...
•• ..... ... .... •• .....
Terrestrial Plants: 3
Provide explanation: This is a complete pathway. The shallow nature of the contamination makes it available to roots. However, due to the ground cover rain splash is not a complete pathway.
Question J:
Could contaminants interact with receptors through food web transport from surficial soils?
• The chemicals may bioaccumulate in animals.
• Animals may ingest contaminated food items.
Provide quantification of exposure pathway (O=no pathway, 1 =unlikely pathway, 2=minor pathway, 3=major pathway):
Terrestrial Animals: 3
Provide explanation: The COPEC strontium-90, which is structurally similar to calcium, is incorporated into the body as bones and teeth. Isotopic uranium is a bioaccumulator. DDT and mercury were detected sporadically and at low concentrations .
Question K:
Could contaminants interact with receptors via incidental ingestion of surficial soils?
• Incidental ingestion of contaminated soil could occur while animals grub for food resident in the soil, feed on plant matter covered with contaminated soil or while grooming themselves clean of soil.
Provide quantification of exposure pathway (O=no pathway, 1 =unlikely pathway, 2=minor pathway, 3=major pathway):
Terrestrial Animals: 3
Provide explanation: This could be a major pathway because of the surficial nature of the contamination .
Question L:
Could contaminants interact with receptors through dermal contact with surficial soils?
• Significant exposure via dermal contact would generally be limited to organic contaminants that are lipophilic and can cross epidermal barriers .
Provide quantification of exposure pathway (O=no pathway, 1 =unlikely pathway, 2=minor pathway, 3=major pathway):
Terrestrial Animals: 1
ER2003-0326 D-7 May2003

VCM Plan for SWMU 21-011 (k), Rev. 3
Provide explanation: Most suspected COPCs are not lipophilic. No organic chemicals were detected. However, the dermal pathway is a possible complete pathway for some receptors.
Question M:
Could contaminants interact with plants or animals through external irradiation?
• External irradiation effects are most relevant for gamma emitting radionuclides.
• Burial of contamination attenuates radiological exposure.
Provide quantification of exposure pathway (O=no pathway, 1 =unlikely pathway, 2=minor pathway, 3=major pathway):
Terrestrial Plants: 3
Terrestrial Animals: 3
Provide explanation: Cesium 137, a gamma emitter, is a COPEC at this SWMU and the contamination is surficial.
Stream Channel
Question N:
Could contaminants interact with plants through direct uptake from water and sediment or sediment rain splash?
• Contaminants may be taken-up by terrestrial plants whose roots are in contact with surface waters.
• Terrestrial plants may be exposed to particulates deposited on leaf and stem surfaces by rain striking contaminated sediments (i.e., rain splash) in an area that is only periodically inundated with water.
• Contaminants in sediment may partition into soil solution, making them available to roots.
Provide quantification of exposure pathway (O=no pathway, 1 =unlikely pathway, 2=minor pathway, 3=major pathway):
Terrestrial Plants: 2
Provide explanation: The contamination is surficial in nature and the alluvial ground water is close to the surface. Therefore, roots could directly uptake contaminants from alluvial ground water or sediment. Rain splash is, however, a very minor consideration because of the ground cover and plant litter on the ground surface.
Question 0:
Could contaminants interact with receptors through food web transport from water and sediment?
• The chemicals may bioconcentrate in food items.
• Animals may ingest contaminated food items.
May2003 D-8 ER2003-0326
---
--
---------------
....
..... IIIII
.....
....
....
"'"
....
.....
VCM Plan for SWMU 21-011(k), Rev. 3
Provide quantification of exposure pathway (O=no pathway, 1 =unlikely pathway, 2=minor pathway, 3=major pathway):
Terrestrial Animals: 2
Provide explanation: PCBs are not present at the site. DDT was detected sporadically, in the low part per billion levels, and the concentrations were qualified as estimated. Mercury was detected once, slightly above background. However, terrestrial animals could ingest the strontium-90 (that is preferentially taken up by plants), and isotopic uranium (a bioaccumulator).
Question P:
Could contaminants interact with receptors via ingestion of water and suspended sediments?
• If sediments are present in an area that is only periodically inundated with water, terrestrial receptors may incidentally ingest sediments.
• Terrestrial receptors may ingest water-borne contaminants if contaminated surface waters are used as a drinking water source.
•• Provide quantification of exposure pathway (O=no pathway, 1 =unlikely pathway, 2=minor pathway, 3=major pathway): ....
1111
111111
...
....
...
-••
1111
-... ....
Terrestrial Animals: 2
Provide explanation: Although there are no aquatic systems present on the site or in the canyon below the SWMU, there is evidence that the contaminants have moved down horizontally slope and, once in the stream bed, down stream from the SWMU. This movement is due to water transporting contaminants either in a soluble form or on particulates. Terrestrial animals could have access to this water for drinking, if only for the period of rainwater or snow melt flow .
Question Q:
Could contaminants interact with receptors through dermal contact with water and sediment?
• If sediments are present in an area that is only periodically inundated with water, terrestrial species may be dermally exposed during dry periods.
• Terrestrial organisms may be dermally exposed to water-borne contaminants as a result of wading or swimming in contaminated waters.
Provide quantification of exposure pathway (O=no pathway, 1 =unlikely pathway, 2=minor pathway, 3=major pathway):
Terrestrial Animals: 1
Provide explanation: Although there are no aquatic systems present on the site or in the canyon reach below the SWMU, there is evidence that the contaminants have moved horizontally down slope and, once in the stream bed, down stream from the SWMU. This movement is due to water transporting contaminants either in a soluble form or on particulates. Terrestrial animals could have access to this water for drinking and wading, if only for the period of rainwater or snow melt flow. During times of dryness, the terrestrial species may be dermally exposed to contaminants in the dry gully and stream bed .
ER2003-0326 D-9 May2003

VCM Plan for SWMU 21-011(k), Rev. 3
Question R:
Could contaminants interact with plants or animals through external irradiation?
• External irradiation effects are most relevant for gamma emitting radionuclides.
• Burial of contamination attenuates radiological exposure.
Provide quantification of exposure pathway (O=no pathway, 1 =unlikely pathway, 2=minor pathway, 3=major pathway):
Terrestrial Plants: 2
Terrestrial Animals: 2
Provide explanation: Cesium 137 is a COPEC at this SWMU and the contamination is surficial.
QuestionS:
Could contaminants bioconcentrate in free floating aquatic, attached aquatic plants, or emergent vegetation?
• Aquatic plants are in direct contact with water.
• Contaminants in sediment may partition into pore water, making them available to submerged roots.
Provide quantification of exposure pathway (O=no pathway, 1 =unlikely pathway, 2=minor pathway, 3=major pathway):
Aquatic Plants/Emergent Vegetation: 0
Provide explanation: There are no aquatic systems present on site or in the canyon below the SWMU.
Question T:
Could contaminants bioconcentrate in sedimentary or water column organisms?
• Aquatic receptors may actively or incidentally ingest sediment while foraging.
• Aquatic receptors may be directly exposed to contaminated sediments or may be exposed to contaminants through osmotic exchange, respiration, or ventilation of sediment pore waters.
• Aquatic receptors may be exposed through osmotic exchange, respiration, or ventilation of surface waters.
Provide quantification of exposure pathway (O=no pathway, 1 =unlikely pathway, 2=minor pathway, 3=major pathway):
Aquatic Animals: 0
Provide explanation: There are no aquatic systems present on site or in the canyon below the SWMU.
Question U:
Could contaminants bioaccumulate in sedimentary or water column organisms?
May2003 D-10 ER2003-0326
-
----
--
--
----
.....
....
....
.....
..... 111111
lillf
....
.....
.....
.....
---...
-------'-••
VCM Plan for SWMU 21-011 (k), Rev. 3
• Lipophilic organic contaminants and some metals may concentrate in an organism's tissues
• Ingestion of contaminated food items may result in contaminant bioaccumulation through the food web .
Provide quantification of exposure pathway (O=no pathway, 1 =unlikely pathway, 2=minor pathway, 3=major pathway):
Aquatic Animals: 0
Provide explanation: There are no aquatic systems present on site or in the canyon below the SWMU .
Question V:
Could contaminants interact with aquatic plants or animals through external irradiation?
• External irradiation effects are most relevant for gamma emitting radionuclides .
• The water column acts to absorb radiation, thus external irradiation is typically more important for sediment dwelling organisms.
Provide quantification of exposure pathway (O=no pathway, 1 =unlikely pathway, 2=minor pathway, 3=major pathway):
Aquatic Plants: 0
Aquatic Animals: 0
Provide explanation: There are no aquatic systems present on site or in the canyon below the SWMU.
REFERENCES
Koch, S., July 15, 1999. "Memorandum to Greg McDermott: Review of Potential Release Sites for Threatened and Endangered Species Habitat for the Purpose of Ecological Screening/Risk Assessment," Los Alamos National Laboratory Memorandum ESH-20/Ecol-98-0732, Los Alamos, New Mexico. (Koch 1999, 63599)
LANL, August 26, 1999. Evaluation of Sediment and Alluvial Groundwater in DP Canyon, Reaches DP-1, DP-2, DP-3, and DP-4. LA-UR-99-4238. (LANL 1999, 63915)
ER2003-0326 D-11 May2003

VCM Plan for SWMU 21-011(k), Rev. 3
Primary Contaminant
Media
Surface Soil
Surface Water/ Sediment
Subsurface
May2003
Ecological Seeping Checklist Terrestrial Receptors
Ecological Pathways Conceptual Exposure Model
Primary Transport
Mechanism
Vaporization
Particulate Suspension
Surface runoff, erosion, mass
wasting
Springs/ Seeps
Secondary Contaminant
Media
Surface Water/
Sediment
Primary Exposure Pathway
Respiration of Vapors
Inhalation/Deposition
Plant Uptake
Food Web Transport
Incidental Ingestion
Dermal Contact
External Gamma
Plant Uptake
Food Web Transport
Drinking Water Ingestion
Dermal Contact
External Gamma
NOTE: Letters in circles refer to questions on the Seeping Checklist
Terrestrial Receptors
Plants Animals
ER2003-0326

.....
IIIII
..... ill II
,...
,...
•• .... •• ..... .... !IIIII
-·
.. -----------
Primary Contaminant
Media
Surface Soil
Groundwater
Surface Water/Sediment
Subsurface
ER2003-0326
Ecological Seeping Checklist Aquatic Receptors
VCM Plan for SWMU 21-011(k), Rev. 3
NOTE:
Ecological Pathways Conceptual Exposure Model
Letters in circles refer to questions on the Scoping Checklist
Primary Transport
Mechanism
Surface runoff, erosion, mass
wasting
Springs/Seeps
Secondary Contaminant
Media
Surface Water
Sediment
Primary Exposure Pathway
Bioconcentration
Bioaccumulation
D-13
Aquatic Receptors
Plants Animals
May2003

...
VCM Plan for SWMU 21-011 (k)
Signatures and certifications:
Checklist completed by (provide name, organization and phone number):
Name (printed): Linda Ca~~
Name (signature): ~~~c Organization: PMC Environmental
Phone number: 662-1365 --~~~---------------------------------------------------------
Date Completed: i JITJ02 ~~~==~-------------------------------------------------------
Verification by a member of ER Project Ecological Risk Task Team (provide name, organization and phone number):
Name (printed): Richard Mirenda
Name (signature): ~r~ Organization: --'R~R:.::E:..::S=----------------------------------------------------
Phone number: 665-6953 ~~~~---------------------------------------------------
Date Completed: i.JLlJ 62-~~~==~------------------------------------------------
D-14
---
-

.....
--.,..
AppendixE -- Estimated Costs
----
-----

-
----...... -....
----llllill
--"""''
""""' ••
.....
APPENDIX E: ESTIMATED COSTS
ESTIMATED COST
Estimated Cost
Based on current resource estimates, the anticipated subcontractor costs and analytical costs of this VCM are approximately $2.2 million.
Schedule
The fieldwork portion of this VCM began in November FY02 and is anticipated to be completed in July 2003. The fieldwork includes soil, sediment, and tuff removal, confirmatory sample collection and analysis, radiation surveys, waste management, and site restoration including an engineered cover.
ER2002-0745 E-1 October 2002
·-..... IIIII
......
•• ... •• .....
•• .... •• '"'"' ...
Appendix F ... ... Data Analysis ... ... ... .... Iiiii
...
... •• Ill
....
.... ,
--
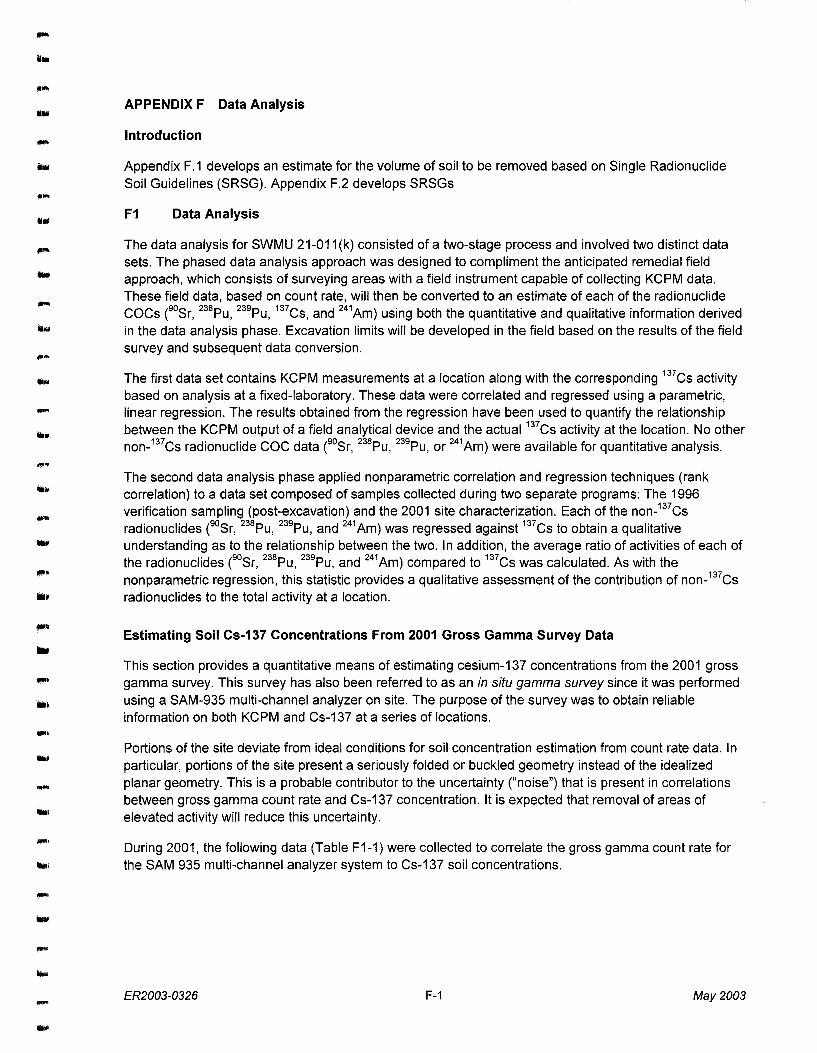
.... 111111
.... IIIII
,. ...
••
•• .... •• -Ill•
'"'"'
.....
••
.... •• 1!1111•
•• ••
•• IIIIi
.....
...
.....
... -· .. , -.....
APPENDIX F Data Analysis
Introduction
Appendix F.1 develops an estimate for the volume of soil to be removed based on Single Radionuclide Soil Guidelines (SRSG). Appendix F.2 develops SRSGs
F1 Data Analysis
The data analysis for SWMU 21-011 (k) consisted of a two-stage process and involved two distinct data sets. The phased data analysis approach was designed to compliment the anticipated remedial field approach, which consists of surveying areas with a field instrument capable of collecting KCPM data. These field data, based on count rate, will then be converted to an estimate of each of the radionuclide COGs (90Sr, 238Pu, 239Pu, 137Cs, and 241Am) using both the quantitative and qualitative information derived in the data analysis phase. Excavation limits will be developed in the field based on the results of the field survey and subsequent data conversion.
The first data set contains KCPM measurements at a location along with the corresponding 137Cs activity based on analysis at a fixed-laboratory. These data were correlated and regressed using a parametric, linear regression. The results obtained from the regression have been used to quantify the relationship between the KCPM output of a field analytical device and the actuai 137Cs activity at the location. No other non-137Cs radionuclide COG data (90Sr, 238Pu, 239Pu, or 241Am) were available for quantitative analysis.
The second data analysis phase applied nonparametric correlation and regression techniques (rank correlation) to a data set composed of samples collected during two separate programs: The 1996 verification sampling (post-excavation) and the 2001 site characterization. Each of the non-137 Cs radio nuclides (90Sr, 238Pu, 239Pu, and 241 Am) was regressed against 137 Cs to obtain a qualitative understanding as to the relationship between the two. In addition, the average ratio of activities of each of the radionuclides (90Sr, 238Pu, 239Pu, and 241Am) compared to 137Cs was calculated. As with the non parametric regression, this statistic provides a qualitative assessment of the contribution of non-137 Cs radionuclides to the total activity at a location .
Estimating Soil Cs-137 Concentrations From 2001 Gross Gamma Survey Data
This section provides a quantitative means of estimating cesium-137 concentrations from the 2001 gross gamma survey. This survey has also been referred to as an in situ gamma survey since it was performed using a SAM-935 multi-channel analyzer on site. The purpose of the survey was to obtain reliable information on both KCPM and Cs-137 at a series of locations .
Portions of the site deviate from ideal conditions for soil concentration estimation from count rate data. In particular, portions of the site present a seriously folded or buckled geometry instead of the idealized planar geometry. This is a probable contributor to the uncertainty ("noise") that is present in correlations between gross gamma count rate and Cs-137 concentration. It is expected that removal of areas of elevated activity will reduce this uncertainty.
During 2001, the following data (Table F1-1) were collected to correlate the gross gamma count rate for the SAM 935 multi-channel analyzer system to Cs-137 soil concentrations .
ER2003-0326 F-1 May 2003
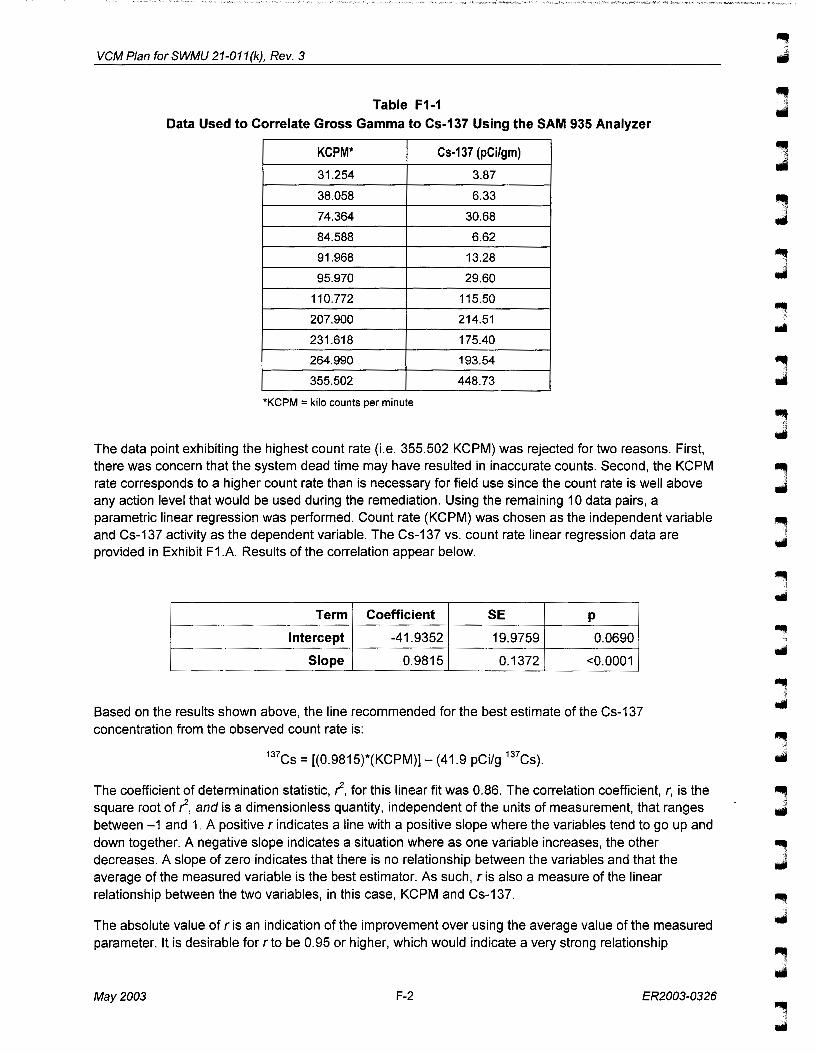
VCM Plan forSWMU 21-011(k), Rev. 3
Table F1-1
Data Used to Correlate Gross Gamma to Cs-137 Using the SAM 935 Analyzer
KCPM* Cs-137 (pCi/gm)
31.254 3.87
38.058 6.33
74.364 30.68
84.588 6.62
91.968 13.28
95.970 29.60
110.772 115.50
207.900 214.51
231.618 175.40
264.990 193.54
355.502 448.73
*KCPM = kilo counts per minute
The data point exhibiting the highest count rate (i.e. 355.502 KCPM) was rejected for two reasons. First, there was concern that the system dead time may have resulted in inaccurate counts. Second, the KCPM rate corresponds to a higher count rate than is necessary for field use since the count rate is well above any action level that would be used during the remediation. Using the remaining 10 data pairs, a parametric linear regression was performed. Count rate (KCPM) was chosen as the independent variable and Cs-137 activity as the dependent variable. The Cs-137 vs. count rate linear regression data are provided in Exhibit F1.A. Results of the correlation appear below.
Term Coefficient SE p
Intercept -41.9352 19.9759 0.0690
Slope 0.9815 0.1372 <0.0001
Based on the results shown above, the line recommended for the best estimate of the Cs-137 concentration from the observed count rate is:
137Cs = [(0.9815)*(KCPM)]- (41.9 pCi/g 137Cs).
The coefficient of determination statistic, r, for this linear fit was 0.86. The correlation coefficient, r, is the square root of r, and is a dimensionless quantity, independent of the units of measurement, that ranges between -1 and 1. A positive r indicates a line with a positive slope where the variables tend to go up and down together. A negative slope indicates a situation where as one variable increases, the other decreases. A slope of zero indicates that there is no relationship between the variables and that the average of the measured variable is the best estimator. As such, r is also a measure of the linear relationship between the two variables, in this case, KCPM and Cs-137.
The absolute value of r is an indication of the improvement over using the average value of the measured parameter. It is desirable for rto be 0.95 or higher, which would indicate a very strong relationship
May 2003 F-2 ER2003-0326
, ..

•• ••
111111
... •• """ ... ...
"""'
....
.....
•• , .... •• ... 11111111
IIIII
...
1[1!11111
'"" IIIII I
...
...
.....
•• .....
•• .... ... -· ••
VCM Plan for SWMU 21-011(k), Rev.3
between the two variables. An rvalue of 0.95 equates to ani value of approximately 0.90. Whereas an r value above 0.95 may be considered a rule-of-thumb goal, rvalues below 0.95 or i values below 0.90 are highly useful, as strong to moderately strong relationships still exist. Because of the strong correlation of 137Cs to KCPM (r = 0.93), count rate of the field instrument will be used to obtain a quantitative estimation of the 137 Cs activity in the surface soil during remedial activities.
Best Estimates of Contaminant Activity Based on 2001 Walkover Gross Gamma Measurements
Best estimates of the radionuclides co-located with Cs-137 are derived from gross gamma count rate (CR) data as follows:
Concentration A =
[{(pCilg Cs-137 I KCPM)* CR}- 41.9 pCilg] *Slope A/Cs-137
This is illustrated using Sr-90 as a specific example:
Concentration Sr-90 =
[{(0.9815 pCi!g I KCPM) * CR}- 41.9 pCilg] * 0.3027 pCi Sr901pCi Cs-137.
At a count rate of 100 KCPM the best estimate of Sr-90 is 17.03 pCilg .
Concentration americium-241 =
[{(0.9815 pCi/g I KCPM) * CR- 41.9 pCi!g] * 0.0355 pCi americium-2411pCi Cs-137.
Concentration total Pu (TPU)=
[{(0.9815 pCilg I KCPM) * CR- 41.9 pCi!g] * 0.0703 pCi TPUipCi Cs-137 .
Correlation of American Radiation Services (ARS) Cs-137 Results with 662 KeV Region of Interest Count Rate Data in Marinelli Geometry.
During 2001, data were collected to establish a correlation between count rate in the 662 KeV region of interest in Marinelli geometry and Cs-137 concentration. An excellent correlation between the two was obtained, as shown in Figure F1-1.
It is anticipated that the background and detector efficiency will be somewhat different if an alternative, but similar, system is used. In addition, the detection efficiency will be affected if a 500-ml wide mouth Nalgene jar is used as the source geometry. Use of the Marinelli geometry is not recommended because it presents a poor geometry for americium-241 screening with a single channel analyzeriPG-2 .
ER2003-0326 F-3 May 2003
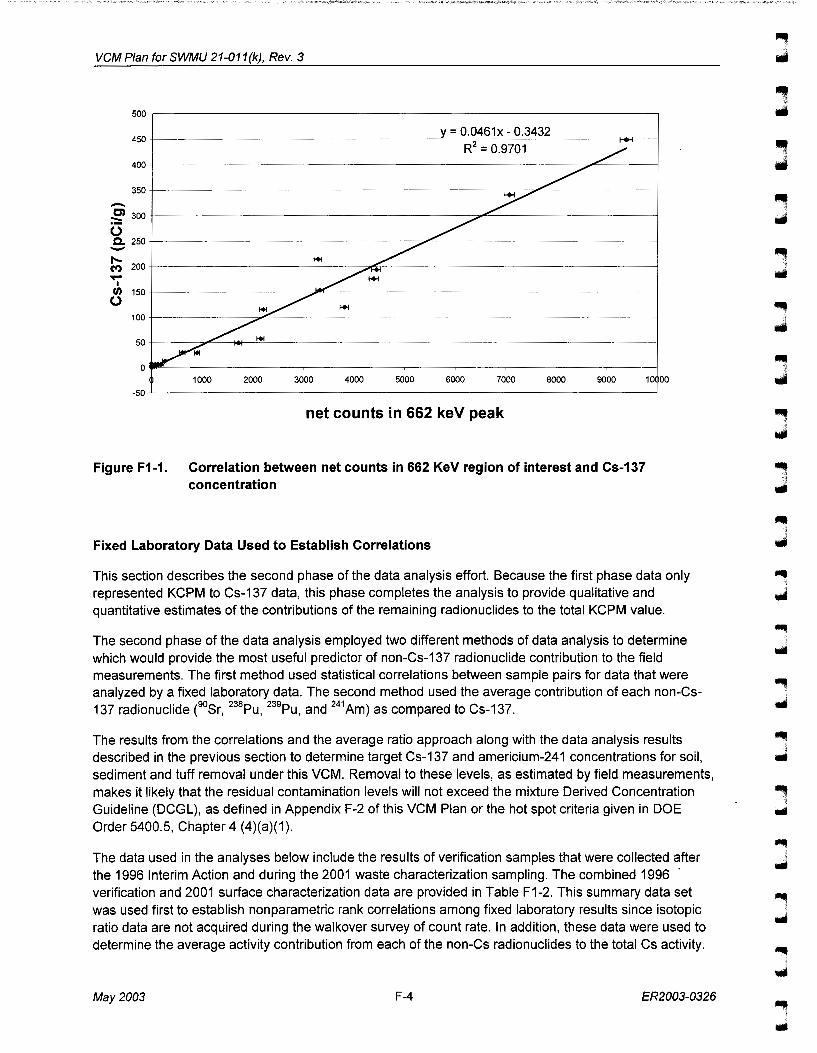
VCM Plan for SWMU 21-011(k), Rev. 3
500
450
400
350 -C) 300 :::: (.) c. 250 -......
200 (V') "t""
I tJ) 150
(.)
100
50
0
y = 0.0461x- 0.3432
R2 = 0.9701 ./ ~ --
~ ~
1+1 ~ r---·
~= ·--
~ 1+1
~~ --
~ -,-----------
1000 2000 3000 4000 5000 6000 7000 8000 9000 10
-50
net counts in 662 keV peak
Figure F1-1. Correlation between net counts in 662 KeV region of interest and Cs-137 concentration
Fixed Laboratory Data Used to Establish Correlations
00
This section describes the second phase of the data analysis effort. Because the first phase data only represented KCPM to Cs-137 data, this phase completes the analysis to provide qualitative and quantitative estimates of the contributions of the remaining radionuclides to the total KCPM value.
The second phase of the data analysis employed two different methods of data analysis to determine which would provide the most useful predictor of non-Cs-137 radionuclide contribution to the field measurements. The first method used statistical correlations between sample pairs for data that were analyzed by a fixed laboratory data. The second method used the average contribution of each non-Cs-137 radionuclide (90Sr, 238Pu, 239Pu, and 241Am) as compared to Cs-137.
The results from the correlations and the average ratio approach along with the data analysis results described in the previous section to determine target Cs-137 and americium-241 concentrations for soil, sediment and tuff removal under this VCM. Removal to these levels, as estimated by field measurements, makes it likely that the residual contamination levels will not exceed the mixture Derived Concentration Guideline (DCGL), as defined in Appendix F-2 of this VCM Plan or the hot spot criteria given in DOE Order 5400.5, Chapter 4 (4)(a)(1 ).
The data used in the analyses below include the results of verification samples that were collected after the 1996 Interim Action and during the 2001 waste characterization sampling. The combined 1996 · verification and 2001 surface characterization data are provided in Table F1-2. This summary data set was used first to establish nonparametric rank correlations among fixed laboratory results since isotopic ratio data are not acquired during the walkover survey of count rate. In addition, these data were used to determine the average activity contribution from each of the non-Cs radionuclides to the total Cs activity.
May 2003 F-4 ER2003-0326
.. ..
.. J ..
l ..
..

.... IIIII
.... •• ... ••
•• ..... IIIII
IIIII
.... •• ... •• .... •• ...
•• •• ••
•• •• .... •• ... •• , .. •• .... ••
VCM Plan for SWMU 21-011(k), Rev.3
Zero values in Table F1-2 represent non-detects. For samples where there is no entry in the table for a given analyte, the result is not available .
Table F1-2 Pooled 1996 Verification and 2001 Waste Characterization Data for 21-011 (k)
Total Pu Sample ID Sr-90 pCi/g Pu-238 pCi/g Pu-239 pCi/g Am-241 pCi/g Cs-137 pCi/g pCi/g
21-01-0021 1.7 0.034 0.122 0 1.43 0.156
21-01-0022 0 0 0.094 0 1.67 0.094
21-01-0025 7.1 0.293 1.93 2.2 40.5 2.223
21-01-0027 2.56 0.31 0.37 0 8.7 0.68
21-01-0029 0 0.048 0.036 0 1.03 0.084
21-01-0030 0.9 0.074 0.111 0 2.6 0.185
21-01-0033 26.1 0.63 13.2 13.7 150 13.83
21-01-0034 1.02 0.21 1.01 6.9 3.78 1.22
21-01-0036 3.75 0.122 1.18 0 29 1.302
21-01-0037 0.51 0 0.118 0 1.52 0.118
21-01-0039 30.8 0.74 11.3 7.9 109 12.04
21-01-0041 132 1.64 20.5 19 445 22.14
MD21-01-0025 7.1 0.293 1.93 2.2 40.5 2.223
MD21-01-0036 3.75 0.122 1.18 0 29 1.302
MD21-01-0039 30.8 0.74 11.3 7.9 109 12.04
MD21-01-0040 10.5 0.22 3.07 5.1 59.5 3.29
MD21-01-0044 103 0.8 32.6 14.9 246 33.4
MD21-01-0045 83 0.95 51.2 22.3 343 52.15
MD21-01-0069 268 1.02 59.2 32.5 690 60.22
0121-96-0301 0 0 0 0.307 0 0
0121-96-0302 0 0 0 25.3 15.7 0
0121-96-0303 0 0 0 0.93 9.39 0
0121-96-0801 74 20.088 10.6 351 20.088
0121-96-0802 240 45.959 32.3 621 45.959
0121-96-0804 33.8 8.73 10.5 85.3 8.73
0121-96-0805 1.4 0.0969 0.79054 0.281 7.05 0.88744
0121-96-0806 7.1 0.2365 1.8333 2.06 19.7 2.0698
0121-96-0808 219 50.95 20.2 877 50.95
0 121-96-0809 24.9 0.964 6.2252 2.9 327 7.1892
0121-96-0810 60 4.8694 23.7568 14.3 222 28.6262
0121-96-0807 63 75.153 601 66.5 75.153
0121-96-0803 30.7 7.0991 25.1351 125 72.1 32.2342
ER2003-0326 F-5 May 2003

VCM Plan for SWMU 21-011(k), Rev. 3
All correlations and regressions presented in this section represent nonparametric rank correlations. Parametric linear correlations were run on the data as well, but the results did not show as strong a correlation as those for the nonparametric approach. The correlations and linear regressions were performed using a commercially available Excel spreadsheet add-in, Analyse-It 1.62, which is distributed by Analyse It Software, Ltd. (http://www.analyse-it.com).
The correlations and forecast errors provided in this section provide qualitative information for the calculation of isotopic ratios based on field analytical measurements of count data. The values were calculated by nonparametric regression taken into consideration as one method to derive the proposed target Cs-137 and americium-241 concentrations, 1 as estimated by field measurements, that would be removed.
Rank correlations, also known as Spearman rank correlations, were performed between Cs-137 and Sr-90, americium-241 to Cs-137, and Pu to Cs-137. The correlation and regression results for each of the analyses indicated moderately strong to strong correlations, with the Sr-90 to Cs-137 results providing the strongest correlation (r = .94; ~ = 0.89). The next highest correlation observed was between total Pu and Cs-137 (r = 0.90; ~ = 0.81), with americium-241 to Cs-137 results exhibiting the lowest degree of rank correlation (r = 0.87, ~ = 0. 75). Regression equations for the three pairings are as follows:
pCi/g 90Sr = [(0.3027)*C 37Cs)J- (1.3330)
pCi/g 241 Am = [(0.3550)*( 137Cs)]- (1.9746)
pCi/g 238+
239Pu = [(0.0703)*( 137Cs)]- (1.4997)
Data analysis indicates that there are two distinct patterns of americium-241 to Cs-137 and total Pu to Cs-137 ratios on-site. High ratios are associated with the western drainage on the western boundary of the site, whereas a lower ratio is typical of the remainder of the site. There are not enough data to establish a reliable correlation of americium-241 to Cs-137 or Pu to Cs-137 activity in the western drainage.
The correlations above do not apply to the western drainage for americium-241 and total Pu to Cs-137. Of the 32 post lA and characterization surface samples, 29 do not appear to be associated with the western drainage. Locations 0121-96-0807, 0121-96-0803, and 0121-96-0302 were removed from the data set for correlations involving americium-241 and total Pu to Cs-137. The correlations of Sr -90 to Cs-137, americium-241 to Cs-137, and total Pu to Cs-137 appear in Exhibits F1.B to F1.D respectively.
The second method of data analysis used in the second phase used estimates of average radionuclide ratios derived from the data. Individual values for each non-Cs-137 radionuclide at a location were divided by the Cs-137 activity. For example, the Sr-90 value for sample 21-01-0021 (1. 7 pCi/g) was divided by the Cs-137 value (1.43 pCi/g) to obtain the ratio value of 1.19. These individual ratio values were summed by COC (by column) and then averaged. Results of this exercise appear in Table F1-3.
1 Cs-137 target: 150 pCi/g, Am-241 target 170 pCi/g based on field estimates.
May 2003 F-6 ER2003-0326
, IIIII
.. J
IIIII .1 ..
, ..

J!ll•
.... •• .... •• .... •• .... ••
.... •• 
VCM Plan for SWMU 21-011(k), Rev. 3
Count rate, KCPM
50
100
150
200
250
300
Count rate, KCPM
50
100
150
200
250
300
Table F1-4 Relationship Among of SAM-935 Gross Gamma Count Rate and Regression Estimates of Radionuclide Concentrations
Cs-137 Sr-90 Americium-241 Total Pu Regression Regression Regression Regression Estimate, Estimate, Estimate, Estimate,
pCi/g pCi/g pCi/g pCi/g
7.2 0.84 0.57 0.0
56.3 15.6 18.0 2.5
105.3 30.6 35.4 5.9
154.4 45.4 52.8 9.4
164.2 60.3 70.3 12.8
174.0 75.1 87.7 16.3
Table F1-5 Relationship Among of SAM-935 Gross Gamma Count Rate
and Average Ratio Estimates of Radionuclide Concentrations
Americium-241 Total Pu Cs-137 Average Sr-90 Average Average Ratio Average Ratio Ratio Estimate, Ratio Estimate, Estimate, Estimate,
pCi/g pCi/g pCi/g pCi/g
7.2 2.2 1.9 0.98
56.3 16.9 15.2 7.66
105.3 31.6 28.4 14.32
154.4 46.3 41.7 21.00
203.5 61.1 28.5 27.68
252.6 75.8 35.4 34.35
Fraction of Mixture DCGL,
Regression Estimate
0.026
0.238
0.451
0.664
0.877
1.091
Fraction of Mixture DCGL, Average Ratio
Estimate
0.029
0.229
0.428
0.628
0.827
1.027
Table F1-5 displays the results of using the average ratio approach to estimate radionuclide activity in the surface soils. Note that the column of Table F1-5 that lists americium-241 does not apply to the western drainage on the west end of SWMU 21-011 (k). The fraction of DCGL values column in Table F1-5 (sum of ratios) indicates that the average ratio approach produces nearly identical activity values as the regression (rank correlation) approach. This means that these separate and distinct methods both provide a qualitative confirmation of the other, and essentially the same answer. One should note that the regression approach takes some liberties with statistical theory, as it relies on two separate regressions that are not jointly quantifiable. This is because the Cs-137/KCPM regression used parametric technique whereas the Cs-137/radionuclide regression used a nonparametric technique. Also, the nonparametric regression uses a value that itself was derived from regression, which introduces a potentially undesirable uncertainty to the estimate. However, in the end, the regression estimates are slightly more conservative. In comparison, the average ratio approach does not carry the problems that the regression approach contains, but is not quite as conservative.
As a practical matter, the fraction of DCGL (sum of ratios) values in Tables F1-4 and F1-5 are so close that either approach may be used to select a maximum count rate for remediation. Selection of a count
May 2003 F-8 ER2003-0326
J
.. l
lllllt ' ..

VCM Plan for SWMU 21-011 (k) , Rev.3
rate cutoff for remediation by either method will most likely result in the same KCPM value. Even in the upper ranges of the risk estimates, the sum of ratios values both reach a total of 1.0 at just under 300 KCPM. Based on the values listed in Table F1 -5, excavation will be in itiated in areas that exhibit KCPM measurements in excess of 200 KCPM.
Estimated Volumes of Soil to be Removed
This section explains how the soil volumes to be removed were estimated.
It was assumed that the removal volume of contaminated soil located in the western drainage is based on the removal of americium-241 . For this analysis, the soil volume is assumed to be 100 yd3
.
The following discussion is presented in terms of gross gamma count rate with the SAM 935 multichannel analyzer with a 2x2-inch sodium iodide scintillation detector. The system to be used during removal could be more or less sensitive. A correlation will be performed between these count rates and the count rates on the system actually used during the removal. The count rates given in this section would be adjusted accordingly.
Removal of soil from other parts of the site would be based on Cs-137 concentration . The Cs-137 concentration would be based on gross gamma count rates using a SAM 935 multi-channel analyzer (or equivalent) or a ratemeter/scaler with a 2x2 inch sodium iodide scintillation detector.
The aerial extent of soil removal was based on count rate data obtained during the 2001 in situ gross gamma walkover survey. ArcView GIS software was used to estimate the aerial extent for the following count rates: 100 KCPM (nominal 56. pCi/g Cs-137), 125 KCPM (nominal81 pCi/g Cs-137), 150 KCPM (nominal105. pCi/g Cs-137) , 175 KCPM (nominal130 pCi!g Cs-137), 200 KCPM (nominal154 pCi/g Cs-137), 225 KCPM (nominal179 pCi/g Cs-137) and 250 KCPM (nominal203 pCi/g Cs-137). Aerial extent estimates are provided in Figure F1-2.
The distribution with depth was also characterized during 2001 . This data is presented in Figure F1 -3. It is assumed for estimation purposes that removal from areas of elevated contamination occurs to a depth of 24 inches. This would be sufficient to reduce concentrations by a factor of 4 on average based on the exponential constant presented in Figure F1-3.
The estimated volumes of soil that would be removed for various count rates are depicted in Figure F1-4.
ER2003-0326 F-9 May 2003

VCM Plan for SWMU 21-011 (k) , Rev. 3
1714800
111·UOO
··---.. __ _
~.f:j--..... .
Figure F1-2.
May 2003
1631900 1633200
•,
'•
. ·-.. ·. ___ r ...... > ..... }ii~ii ..................... _
··_--------···---·
\ n -"!'~ ;~.f;;:::·:: .. ~-~: 1:·:· · ·~ .. ;1:~~~- ..... n-• ~•i
· ......... -··· ·. •,
'·· -·--..... •,
n.u!':n ~:~·;ij··~ - --..
···--... __ _
n..t :~;~-~~~ ~~-J
·-.. _ n ..tA!lt
tt-tl~H
n .uue . ··-..
.... , .ri-oun
'·.
+ ·· ......... nJl~,. ·~-u ~
··-----... _
·----.
1633500
..... · -···--.
·-------·········-·········
+
n-•~~,~·--·--··· ····· ···Jiii!J·· ......
lD!Y
· ....
·--... _
Cka-. fJ'&. hrwyJ.w'b ('1•1 n~-i!~• -·-...... .
11 -•£U1 '····., +
-.. N ?J.?o···-·-··--........ A
-----------.. ...... . .
···--.. '•,
··. · .. 1632900 1633:200
SAM 935 Gross Gamma Count rates at 21-011 (k)
F-10
D D D ----D
l63lSOO
1174800
1774500
ER2003-0326
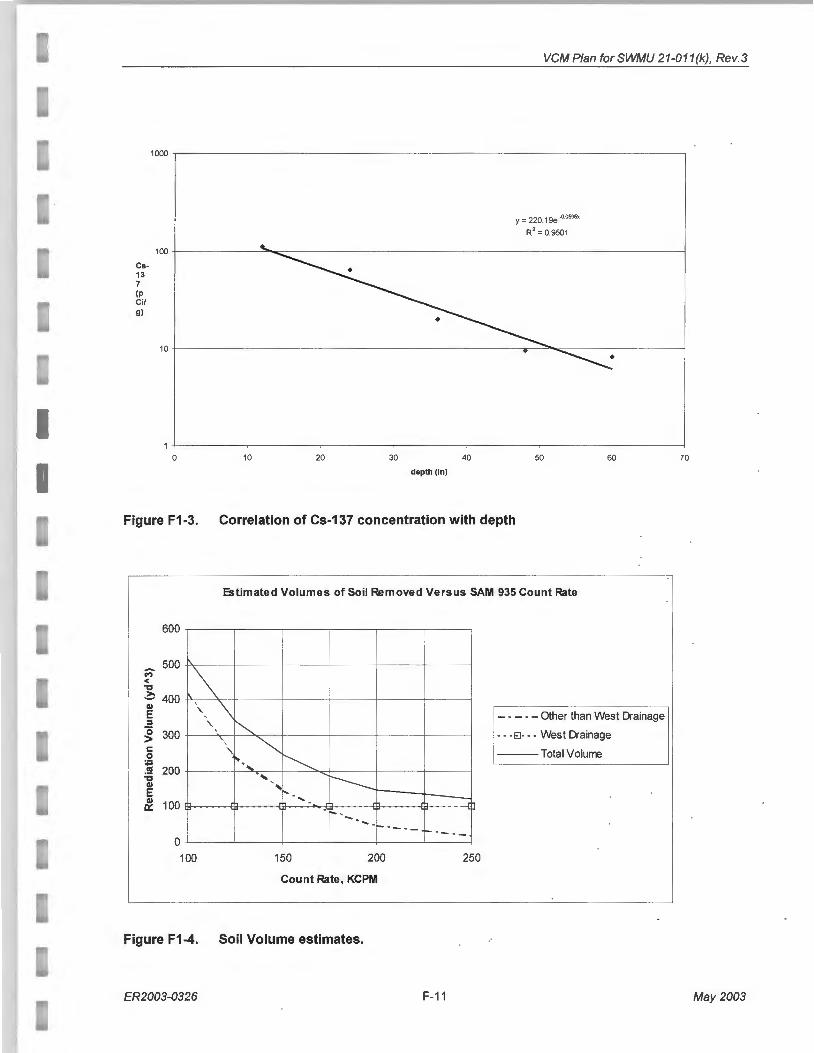
VCM Plan for SWMU 21-011(k), Rev.3
1000 .--------------------------------------------------------------------,
Cs-13 7 (p Ci/ g)
y = 220.19e .o.osos,
R2 = 0.9501
1 ~- --------~--------~--------~--------~--------~--------~--------~ 0 10 20 30 40 50 60 70
depth (In)
Figure F1-3. Correlation of Cs-137 concentration with depth
Estimated Volumes of Soil Removed Versus SAM 935 Count Rate
600
500 M' .'\ < "C ~ 400
' \ Q)
' E ' - - - - -Other than West Drainage :I ' ~ 0 300 ' · - -El· - . West Drainage > ' \ ~ c '\. ---TotaiVolurre 0
~ .. ~- ... ca 200 :0 -... ,, -----Q)
~~~ ~ E Q)
100 0:::
0 I I r'-·,+----1-----100 150 200 250
Count Rate , KCPM
Figure F1-4. Soil Volume estimates.
ER2003-0326 F-11 May 2003

VCM Plan for SWMU 21-011 (k), Rev. 3
It is proposed that surface soils be removed from areas having Cs-137 soil concentrations in excess of 154 pCi/g , as estimated from screening results, (200 KCPM per the 2001 gross gamma survey). Areas that exhibit higher concentrations have a significant chance of exceeding the mixture derived concentration guideline presented in Appendix F2. Removal of these areas is consistent with DOE's 5400.5 "As Low as Reasonably Achievable" (ALARA) policy since
• some of these elevated activity areas would already meet the DOE hot spot criteria if it was rigorously applied, even if a cover were absent, and
• placement of restoration backfill and cover materials over contaminated further reduces dose.
May 2003 F-12 ER2003-0326

n I
R'l Adjusted R' SE
Term Intercept
Slope
Source of variation Due to regression About regression
Total
350
300
2SO
200
.... 1SO ~ ,;, u 100
so
-SO
-100
VCM Plan for SWMU 21-011(k), Rev.3
.m-31!:jsE>d •m!h Gnai•Ft> 1t • Ge-ne-ral 162
Linear regression Dat-; from TabiP 10 FSR report Cs 1:-(· Vrprn
RICk Haaker 13 Februar;· :'002
10
0.86 0.85
33.7299
Coefficient SE p 95\\ Cl of Coefficient -41.9352 19.9759 0.0690 . -87 .9998 to 4.1294
r 0.9815 0.1372 <0.0001 ! 0.6652 to 1.2978
SSq OF MSq p
5:~~~ :~: ! 58264.479 51 .21 ! <0.0001 1137.709
67366.1481
y • 0.981Sx- 41 .935
50 1 00 1 so 200 250 300
Kcpm
Exhibit F1.A: Correlation of Cs-137 to SAM 935 Count Rate Data
ER2003-0326 F-13 May 2003

VCM Plan for SWMU 21-011 (k), Rev. 3
,m~ll)s.e-d w1th-: Analgse>-1t • G<>~r 311 G:: linear regression :;no1 Dat• TA21·011 ~~. : ·- 91't \1 .~ £-1 3 ..
R1ch Haaker 19 Maf(h 200:<
n I 32
R'l 0.89
Adjusted R' 0.88 SE 24.9661
Term Coefficient SE p
Intercept -1.3330 5.3886 0.8063 Slope 0.3027 0.0198 <0.0001
Source ofvariation ss DF MS Due to regression 145033.31 O! 1 145033.310 About regression
1 ~~~;~ :~i~ l 30 623.307 Total 31
350 y = 0.3027x - 1 .333
300
250
200
= "" 150 11,
100
50
0
-50+---'--~--~--~--~-~
-100 100 300 500 700 900
Cs-137
3
0
0
0
~ 0
" 1 .,
-~ "" il 0 ~ 0 0 .!:1 0 0 'E . 0 0 ., ~ -1 0
0 -2
-3 -100 100 300 500 700 900
Cs-137
Exhibit F1.B: Correlation of Sr-90 to Cs-137 Data
May 2003 F-14
90% Cl of Coefficient
-10.4788 to 7.8129 0.2691 to 0.3364
F 232.68! <0.0001
I I I
• ~· ~ I
0 10 15
ER2003-0326

VCM Plan for SWMU 21-011(k), Rev.3
ilndllJsed w•rh Analg~"' 11 • Ger.€'r<~116 ..
linear regression .:'001 Oal3 TA.:'l·Oll,f \ An, :41 \ ' - 1- ...
Rll• Haaker 20 March 2002
n I
Adjusted~~ SE
Term
Intercept Slope
Source of variation Due to regression About regression
Total
40
30
-.. 20 N e <
10
0
-10 -100
~ 1 " ... ~ i! 0 .t:! E . ... i ·1 Iii
-2
-3 -100
29
0.75
0.74 4.9626
Coe1Ticlent
1.9746 0.0355
ss 1951 .575 !
664.944 ! I
2616.519 !
SE
1.13651 0.0040
OF 1!
27 ' 28 1
y • 0.0355x + 1.9746
100 300 500
Cs-137
0
0
0 0
oo
0 0 0
00
~0 0
0
100 300 500
Cs-137
p 90% Cl of Coefficient
0.0937 0.0388 to 3.9104 <0.0001 0.0287 to 0.0423
MS F 1951 .575 79.2( <0.0001
24.628
700 900
0
0
0
700 900 0 10
Exhibit F1.C: Correlation of Americium-241 to Cs-137 Data
ER2003-0326 F-15
15
May 2003

VCM Plan for SWMU 21-011 (k), Rev. 3
analys""d 'dl'h Analys"' rt • G~nefall E.2
linear regression ~001 Da1aT•21-0II'~' Tut~l PIJ.; ( --1'17
R1ck Haa>er 20 Marcil 2002
n I 29
Adjusted~~ 0.81 0.80
SE 8.2147
Term Coefficient SE 90% a m Coefficient Intercept 1.4997 1.8813 0.4323 -1 .7046 to 4.7041
Slope 0.0703 0.0066 <0.0001 0.0591 lo 0.0816
Source ofvari3tlon ss Of MS F Due to regression 7637.817 ! 1 7637.817 113.19! <0.0001 About regression 1821 .975 / 27 67 .481
Total 9459.791 ! 28
80 y = 0 .0703x + 1 .4997
70
60
50
= 40 Q.
'" 30 '!5 ...
20
10
0
-10
-20
-100 100 300 500 700 900
Cs-137
3.5 0
2.5
0
{S 1 .5 0 0 ,;
-~ 0.5 00 0
i ~ 0
j-o.5 0 ..
c 0 £l -1 .5 0
0
-2.5
-3 .5 +----,-----~--~--~--~
-100 100 300 500 700 900 10 20
Cs-137
Exhibit F1.D: Correlation of Total Pu to Cs-137 Data
May 2003 F-16 ER2003-0326
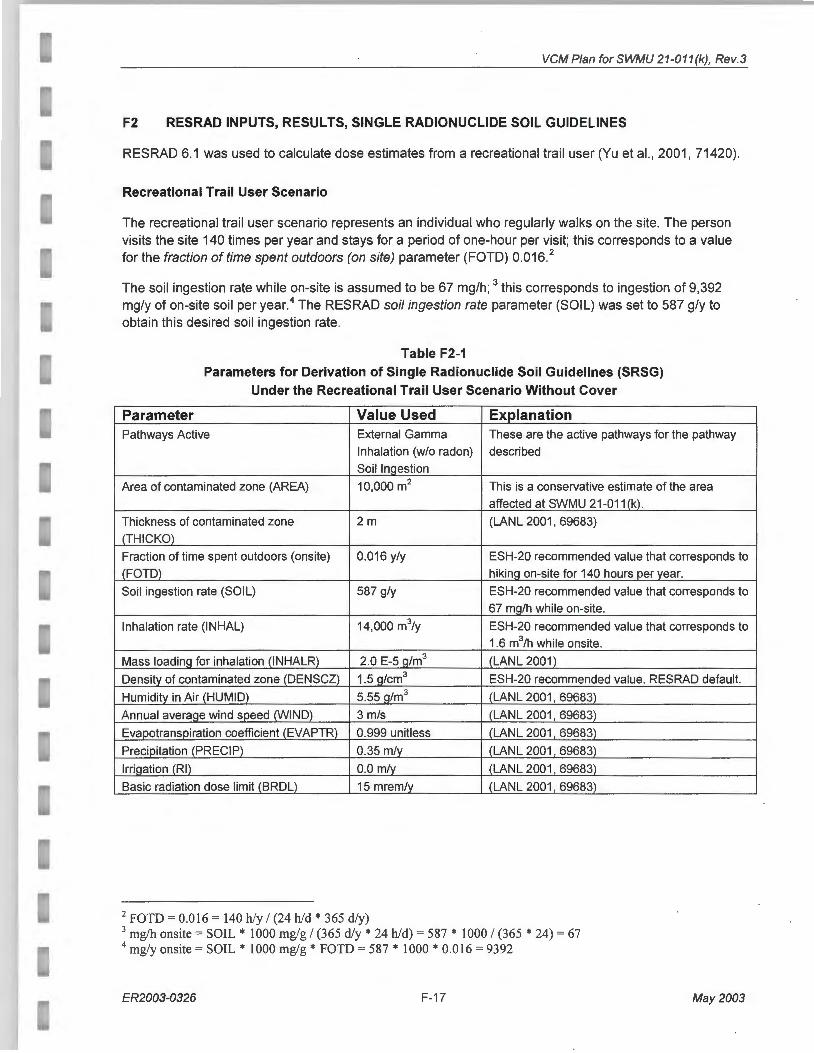
VCM Plan for SWMU 21-011(k), Rev.3
F2 RESRAD INPUTS, RESULTS, SINGLE RADIONUCLIDE SOIL GUIDELINES
RESRAD 6.1 was used to calculate dose estimates from a recreational trail user (Yu et al., 2001, 71420).
Recreational Trail User Scenario
The recreational trail user scenario represents an ind ividual who regularly walks on the site. The person visits the site 140 times per year and stays for a period of one-hour per visit; this corresponds to a value for the fraction of time spent outdoors (on site) parameter (FOTD) 0.016. 2
The soil ingestion rate while on-site is assumed to be 67 mg/h; 3 this corresponds to ingestion of 9,392 mg/y of on-site soil per year.4 The RESRAD soil ingestion rate parameter (SOIL) was set to 587 g/y to obtain this desired soil ingestion rate.
Table F2-1 Parameters for Derivation of Single Radionuclide Soil Guidelines (SRSG)
Under the Recreational Trail User Scenario Without Cover
Parameter Value Used Explanation Pathways Active External Gamma These are the active pathways for the pathway
Inhalation (w/o radon) described
Soil Ingestion
Area of contaminated zone (AREA) 10,000 m2 This is a conservative estimate of the area
affected at SWM U 21-011 (k) .
Thickness of contaminated zone 2m (LANL 2001 , 69683)
(THICKO)
Fraction of time spent outdoors (onsite) 0.016 y/y ESH-20 recommended value that corresponds to
(FOTD) hiking on-site for 140 hours per year.
Soi l ingestion rate (SOIL) 587 g/y ESH-20 recommended value that corresponds to
67 mg/h while on-site.
Inhalation rate (INHAL) 14,000 m3/y ESH-20 recommended value that corresponds to
1.6 m3/h while onsite.
Mass loading for inhalation (INHALR) 2.0 E-5 g/m3 (LANL 2001)
Density of contaminated zone (DENSCZ) 1.5 g/cm3 ESH-20 recommended value. RESRAD default.
Humidity in Air (HUMID) 5.55 g/m3 (LANL 2001 , 69683)
Annual average wind speed (WIND) 3 m/s (LANL 2001 , 69683)
Evapotranspiration coefficient (EVAPTR) 0.999 unitless (LANL 2001 , 69683)
Precipitation (PRECIP) 0.35 m/y (LANL 2001 , 69683)
Irrigation (RI) 0.0 m/y (LANL 2001 , 69683)
Basic radiation dose limit (BRDL) 15 mrem/y (LANL 2001 , 69683)
2 FOTD = 0.016 = 140 h/y I (24 h/d * 365 d/y) 3 mg!h onsite = SOIL * 1000 mg/g I (365 d/y * 24 h/d) = 587 * 1000 I (365 * 24) = 67 4 mg/y onsite =SOIL* 1000 mg/g * FOTD = 587 * 1000 * 0.016 = 9392
ER2003-0326 F-17 May 2003
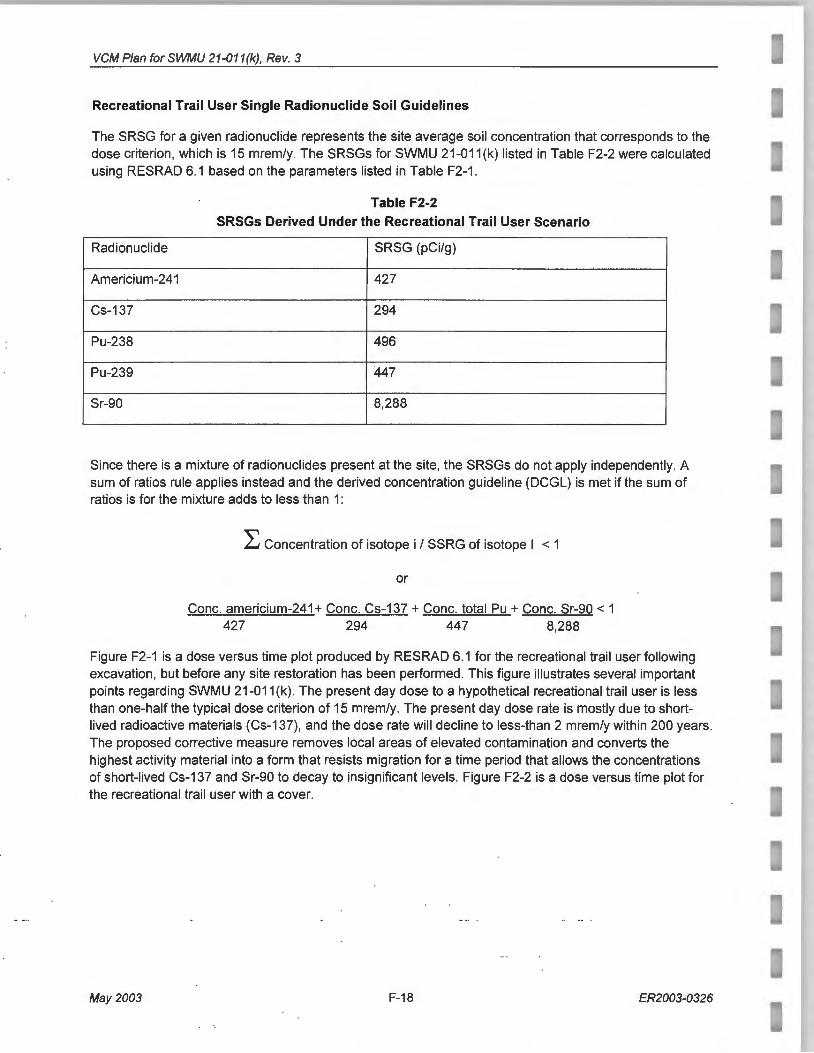
VCM Plan for SWMU 21-011(k), Rev. 3
Recreational Trail User Single Radionuclide Soil Guidelines
The SRSG for a given radionuclide represents the site average soil concentration that corresponds to the dose criterion , which is 15 mrem/y. The SRSGs for SWMU 21-011(k) listed in Table F2-2 were calculated using RESRAD 6.1 based on the parameters listed in Table F2-1 .
Table F2-2 SRSGs Derived Under the Recreational Trail User Scenario
Radionuclide SRSG (pCi/g)
Americium-241 427
Cs-137 294
Pu-238 496
Pu-239 447
Sr-90 8,288
Since there is a mixture of rad ionuclides present at the site, the SRSGs do not apply independently. A sum of ratios rule applies instead and the derived concentration guideline (DCGL) is met if the sum of ratios is for the mixture adds to less than 1:
L Concentration of isotope i I SSRG of isotope I < 1
or
Cone. americium-241+ Cone. Cs-137 +Cone. total Pu +Cone. Sr-90 < 1 427 294 447 8,288
Figure F2-1 is a dose versus time plot produced by RESRAD 6.1 for the recreational trail user following excavation , but before any site restoration has been performed. This figure illustrates several important points regarding SWMU 21-011 (k) . The present day dose to a hypothetical recreational trail user is less than one-half the typical dose criterion of 15 mrem/y. The present day dose rate is mostly due to shortlived radioactive materials (Cs-137) , and the dose rate will decline to less-than 2 mrem/y within 200 years. The proposed corrective measure removes local areas of elevated contamination and converts the highest activity material into a form that resists migration for a time period that allows the concentrations of short-lived Cs-137 and Sr-90 to decay to insignificant levels. Figure F2-2 is a dose versus time plot for the recreational trail user with a cover.
May 2003 F-18 ER2003-0326
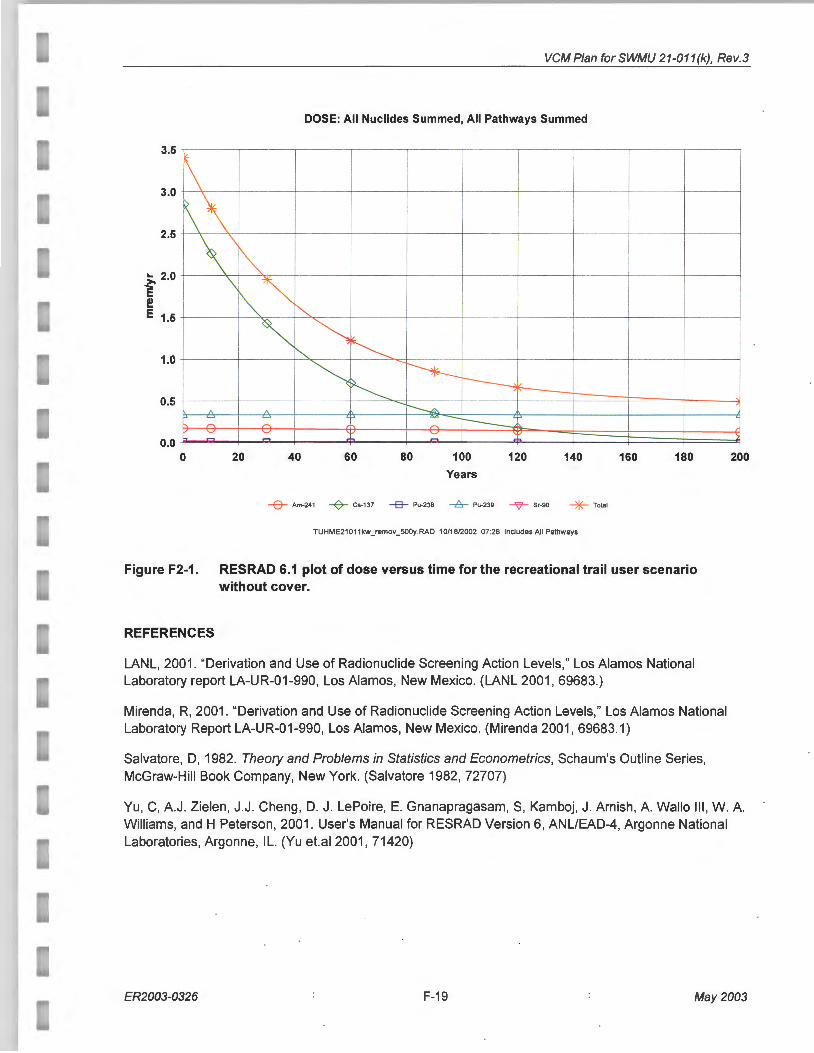
VCM Plan for SWMU 21-011(k), Rev.3
3.5
3.0
2.5
;. 2.0 ] f E 1.5
1.0
0.5
0.0
DOSE: All Nuclides Summed, All Pathways Summed
~ ~\ \ \
"" \ ~~ ~
"' ~ ~ f'-._
~ ~ I-*-~~
1\ 1\ ~ ,.... ,.... ,... c----.; ~ ::::. :::::
0 20 40 60 80 100 Years
120 140
-9- Am-241 + Cs-137 -& Pu-238 -A- Pu-239 ---"7- Sr-90 T Total
TUHME210 11kw_remov_500y.RAD 10118/2002 07:28 lndudes All Pathways
160 180
Figure F2-1 . RESRAD 6.1 plot of dose versus time for the recreational trail user scenario without cover.
REFERENCES
LANL, 2001 . "Derivation and Use of Radionuclide Screening Action Levels, " Los Alamos National Laboratory report LA-UR-01-990, Los Alamos, New Mexico. (LANL 2001 , 69683.)
Mirenda, R, 2001 . "Derivation and Use of Radionuclide Screening Action Levels," Los Alamos National Laboratory Report LA-UR-01-990, Los Alamos, New Mexico. (Mirenda 2001 , 69683.1)
Salvatore, D, 1982. Theory and Problems in Statistics and Econometrics , Schaum's Outline Series, McGraw-Hill Book Company, New York. (Salvatore 1982, 72707)
200
Yu, C, AJ . Zielen , J.J. Cheng, D. J. LePoire, E. Gnanapragasam, S, Kamboj , J. Arnish , A Wallo Ill, W. A Williams, and H Peterson , 2001 . User's Manual for RESRAD Version 6, ANL/EAD-4, Argonne National Laboratories, Argonne, IL. (Yu et.al 2001 , 71420)
ER2003-0326 F-19 May 2003

VCM Plan for SWMU 21-011(k), Rev.3
Exhibit F2.1. RESRAD Summary Report for the Recreational Trai l User Scenario Without Cover.
ER2003-0326 F-21 May 2003

VCM Plan for SWMU 21-011 (k) , Rev.3
1RESRAD, Version 6.21 T% Limit= 0.5 year 10/18/2002 07:28 Page 1 Summary : Trail User, Hiker, 140 hrs/yr, 67 mg/hr soil ingestion---21 -0011 k mean concentration w/removal of 500 yd 3
File : TUHME21011 kw_remov_500y.RAD
Table of Contents
Part 1: Mixture Sums and Single Radionuclide Guidelines
Dose Conversion Factor (and Related) Parameter Summary .. .. ... .. .... 2 Site-Specific Parameter Summary .......................... .... ........ ................ 6 Summary of Pathway Selections ......... ......................... ....... ............ . 12 Contaminated Zone and Total Dose Summary .......... .... ... ... ... .......... 13 Total Dose Components
Time= O.OOOE+OO ........................ .......... .. 14 Time = 1.000E+01 .. ......... ... .... .. ....... ......... 15 Time = 3.000E+01 .. .. ........ .. .......... ..... ... ... . 16 Time = 6.000E+01 ....... ................ ... ........ .. 17 Time = 9.000E+01 ............... ..................... 18 Time= 1.200E+02 .................................... 19 Time = 2.000E+02 ........ .... ... ..... ... .. ........... 20
Dose/Source Ratios Summed Over All Pathways ...... .. ..... ... ... .......... 21 Single Radionuclide Soil Guidelines .......................... ... ........ ............. 21 Dose Per Nuclide Summed Over All Pathways ................................. 23 Soil Concentration Per Nuclide ........ ....... ...... ............ ...... .................. 24
ER2003-0326 F-23 May 2003

VCM Plan for SWMU 21-011 (k), Rev. 3
1 RESRAD, Version 6.21 TY. Limit= 0.5 year 10/18/2002 07:28 Page 2 Summary : Trail User, Hiker, 140 hrs/yr, 67 mg/hr soil ingestion---21-0011 k mean cone w/r File : TUHME21 011 kw_remov_500y.RAD
Dose Conversion Factor (and Related) Parameter Summary File: FGR 13 Morbidity Current Parameter Menu Parameter Value Default Name -------+----------------------------------------------------------------------------B-1 B-1 B-1 B-1 B-1 B-1 B-1 B-1 B-1 B-1 B-1 B-1 B-1 B-1 B-1 B-1 B-1 B-1
D-1 D-1 D-1 D-1 D-1 D-1 D-1 D-1 D-1 D-1 D-1 D-1 D-1 D-1 D-1 D-1 D-1 D-1
D-34 D-34 D-34 D-34 D-34 D-34 D-34 D-34 D-34 D-34 D-34 D-34
Dose conversion factors for inhalation, mrem/pCi Ac-227+D Am-241 Cs-137+D HNp-237+ Pa-231 Pb-210+D Pu-238 Pu-239 Ra-226+D Sr-90+D Th-229+D Th-230 U-233 U-234 U-235+D U-238+D
6.720E+OO 4.440E-01 3.190E-05 6.400E-08 5.400E-01 1.280E+OO 2.320E-02 3.920E-01 4.290E-01 8.600E-03 1.31 OE-03
2.160E+OO 3.260E-01 1.350E-01 1.320E-01 1.230E-01 1.180E-01
Dose conversion factors for ingestion, mrem/pCi Ac-227+D Am-241 Cs-137+D H-3 Np-237+D Pa-231 Pb-210+D Pu-238 Pu-239 Ra-226+D Sr-90+D Th-229+D Th-230 U-233 U-234 U-235+D U-238+D
Food transfer factors
1.480E-02 3.640E-03 5.000E-05 6.400E-08 4.440E-03 1.060E-02 7.270E-03 3.200E-03 3.540E-03 1.330E-03 1.530E-04 4.030E-03 5.480E-04 2.890E-04 2.830E-04 2.670E-04 2.690E-04
6.720E+OO 4.440E-01 3.190E-05 6.400E-08 5.400E-01 1.280E+OO 2.320E-02 3.920E-01 4.290E-01 8.600E-03 1.31 OE-03
2.160E+OO 3.260E-01 1.350E-01 1.320E-01 1.230E-01 1.180E-01
1.480E-02 3.640E-03 5.000E-05 6.400E-08 4.440E-03 1.060E-02 7.270E-03 3.200E-03 3.540E-03 1.330E-03 1.530E-04 4.030E-03 5.480E-04 2.890E-04 2.830E-04 2.670E-04 2.690E-04
DCF2( 1) DCF2( 2) DCF2( 3) DCF2( 4) DCF2( 5) DCF2( 6) DCF2( 7) DCF2( 8) DCF2( 9)
DCF2(10) DCF2(11) DCF2(12) DCF2(13) DCF2(14) DCF2(15) DCF2(16) DCF2(17)
DCF3( 1) DCF3( 2) DCF3( 3) DCF3( 4) DCF3( 5) DCF3( 6) DCF3( 7) DCF3( 8) DCF3( 9)
DCF3(10) DCF3(11) DCF3(12) DCF3(13) DCF3(14) DCF3(15) DCF3(16) DCF3(17)
Ac-227+Dplant/soil concentration ratio, dimensionless2.500E-03 2.500E-03 RTF( 1,1) Ac-227+Dbeef/livestock-intake ratio, (pCi/kg)/(pCi/d)2.000E-05 2.000E-05 RTF( 1 ,2) Ac-227+Dmilkllivestock-intake ratio, (pCi/L)/(pCi/d) 2.000E-05 2.000E-05 RTF( 1 ,3)
Am-241 Am-241 Am-241
Cs-137+D Cs-137+D Cs-137+D
plant/soil concentration ratio, dimensionless beef/livestock-intake ratio, (pCi/kg)/(pCi/d) milk/livestock-intake ratio, (pCi/L)/(pCi/d)
plant/soil concentration ratio , dimensionless beef/livestock-intake ratio , {pCi/kg)/(pCi/d) milk/livestock-intake ratio, {pCi/L)/(pCi/d)
1.000E-03 5.000E-05 2.000E-06
4.000E-02 3.000E-02 8.000E-03
1.000E-03 5.000E-05 2.000E-06
4.000E-02 3.000E-02 8.000E-03
May 2003 F-24
RTF( 2,1) RTF( 2,2) RTF( 2,3)
RTF( 3,1) RTF( 3,2) RTF( 3,3)
ER2003-0326

VCM Plan for SWMU 21-011 (k) , Rev.3
1RESRAD, Version 6.21 TY:z Limit= 0.5 year 10/18/2002 07:28 Page 3 Summary: Trail User, Hiker, 140 hrs/yr, 67 mg/hr soil ingestion---21-0011 k mean cone w/r File : TUHME21011 kw_remov_500y.RAD
Dose Conversion Factor (and Related) Parameter Summary (continued) File: FGR 13 Morbidity
Current Parameter
-------+-------------------------------------------------------------------------------Menu D-34 D-34 D-34 D-34 D-34 D-34 D-34 D-34 D-34 D-34 D-34 D-34 D-34 D-34 D-34 D-34 D-34 D-34 D-34 D-34 D-34 D-34 D-34 D-34 D-34 D-34 D-34 D-34 D-34 D-34 D-34 D-34 D-34 D-34 D-34 D-34 D-34 D-34 D-34 D-34 D-34 D-34 D-34 D-34 D-34 D-34 D-34
Parameter H-3 plant/soil concentration ratio, dimensionless H-3 beef/livestock-intake ratio, (pCilkg)/(pCi/d} H-3 milk/livestock-intake ratio, (pCi/L)/(pCi/d)
Np-237+Dplant/soil concentration ratio, dimensionless Np-237+Dbeef/livestock-intake ratio, (pCi/kg)/(pCi/d) Np-237+Dmilk!livestock-intake ratio, (pCi/L)/(pCi/d)
Pa-231 plant/soil concentration ratio, dimensionless Pa-231 beef/livestock-intake ratio, (pCi/kg)/(pCi/d) Pa-231 milk/livestock-intake ratio, (pCi/L)/(pCi/d)
Pb-21 O+Dplant/soil concentration ratio, dimensionless Pb-21 O+Dbeef/livestock-intake ratio, (pCi/kg)/(pCi/d) Pb-21 O+Dmilkllivestock-intake ratio, (pCi/L)/(pCi/d)
Pu-238plant/soil concentration ratio, dimensionless Pu-238beef/livestock-intake ratio, (pCi/kg)/(pCi/d) Pu-238milk!livestock-intake ratio, (pCi/L)/(pCi/d)
Pu-239plant/soil concentration ratio, dimensionless Pu-239beef/livestock-intake ratio, (pCi/kg)/(pCi/d) Pu-239milkllivestock-intake ratio, (pCi/L)/(pCi/d)
Ra-226+Dplant/soil concentration ratio, dimensionless Ra-226+Dbeef/livestock-intake ratio, (pCi/kg)/(pCi/d) Ra-226+Dmilkllivestock-intake ratio, (pCi!L)/(pCi/d)
Sr-90+D plant/soil concentration ratio, dimensionless Sr-90+D beef/livestock-intake ratio, (pCilkg)/(pCi/d) Sr-90+D milk/livestock-intake ratio, (pCi/L)/(pCi/d) Th-229+Dplant/soil concentration ratio , dimensionless Th-229+Dbeef/livestock-intake ratio, (pCi/kg)/(pCi/d) Th-229+Dmilk/livestock-intake ratio, (pCi/L)/(pCi/d)
Th-230plant/soil concentration ratio, dimensionless Th-230beef/livestock-intake ratio, (pCi/kg)/(pCi/d} Th-230milkllivestock-intake ratio, (pCi/L)/(pCi/d)
U-233 plant/soil concentration ratio , dimensionless U-233 beef/livestock-intake ratio, (pCi/kg)/(pCi/d) U-233 milk/livestock-intake ratio, (pCi/L)/(pCi/d)
U-234 plant/soil concentration ratio, dimensionless U-234 beef/livestock-intake ratio, (pCi/kg)/(pCi/d) U-234 milk/livestock-intake ratio, (pCi/L)/(pCi/d)
ER2003-0326 F-25
Value 4.800E+OO 1.200E-02 1.000E-02
2.000E-02 1.000E-03 5.000E-06
1.000E-02 5.000E-03 5.000E-06
1.000E-02 8.000E-04 3.000E-04
1.000E-03 1.000E-04 1.000E-06
1.000E-03 1.000E-04 1.000E-06
4.000E-02 1.000E-03 1.000E-03
3.000E-01 8.000E-03 2.000E-03 1.000E-03 1.000E-04 5.000E-06
1.000E-03 1.000E-04 5.000E-06
2.500E-03 3.400E-04 6.000E-04
2.500E-03 3.400E-04 6.000E-04
Default 4.800E+OO 1.200E-02 1.000E-02
2.000E-02 1.000E-03 5.000E-06
1.000E-02 5.000E-03 5.000E-06
1.000E-02 8.000E-04 3.000E-04
1.000E-03 1.000E-04 1.000E-06
1.000E-03 1.000E-04 1.000E-06
4.000E-02 1.000E-03 1.000E-03
3.000E-01 8.000E-03 2.000E-03 1.000E-03 1.000E-04 5.000E-06
1.000E-03 1.000E-04 5.000E-06
2.500E-03 3.400E-04 6.000E-04
2.500E-03 3.400E-04 6.000E-04
Name RTF( 4,1} RTF( 4,2) RTF( 4,3)
RTF(5 ,1) RTF( 5,2) RTF( 5,3}
RTF( 6,1) RTF( 6,2) RTF( 6,3)
RTF( 7,1} RTF( 7,2) RTF( 7,3}
RTF( 8,1) RTF( 8,2) RTF( 8,3)
RTF( 9,1} RTF( 9,2) RTF( 9,3)
RTF(10,1) RTF(10,2) RTF(10,3)
RTF(11 ,1) RTF(11 ,2) RTF(11 ,3) RTF(12 ,1) RTF(12 ,2) RTF(12 ,3)
RTF(13 ,1) RTF(13,2) RTF(13,3)
RTF(14,1) RTF(14,2) RTF(14,3)
RTF(15,1) RTF(15 ,2) RTF(15 ,3)
May 2003

VCM Plan for SWMU 21-011 (k), Rev. 3
1 RESRAD, Version 6.21 TY. Limit= 0.5 year 10/18/2002 07:28 Page 4 Summary : Trail User, Hiker, 140 hrs/yr, 67 mg/hr soil ingestion---21 -0011k mean cone w/r File : TUHME21 011 kw_remov_500y.RAD
Dose Conversion Factor (and Related) Parameter Summary (continued) File: FGR 13 Morbidity
Current Parameter Menu Parameter Value Default Name
+ 0-34 U-235+0 planUsoil concentration ratio , dimensionless 2.500E-03 2.500E-03 RTF(16,1) 0 -34 U-235+0 beef/livestock-intake ratio, (pCi/kg)/(pCi/d) 3.400E-04 3.400E-04 RTF(16,2) 0 -34 U-235+0 milk/livestock-intake ratio, (pCi/L)/(pCi/d) 6.000E-04 6.000E-04 RTF(16,3) 0-34 0 -34 U-238+0 plant/soil concentration ratio , dimensionless 2.500E-03 2.500E-03 RTF(17,1) 0-34 U-238+0 beef/livestock-intake ratio, (pCi/kg)/(pCi/d) 3.400E-04 3.400E-04 RTF(17,2) 0-34 U-238+0 milk/livestock-intake ratio, (pCi/L)/(pCi/d) 6.000E-04 6.000E-04 RTF(17,3)
0 -5 Bioaccumulation factors, fresh water, Ukg: 0-5 Ac-227+0 fish 1.500E+01 1.500E+01 BIOFAC( 1,1) 0-5 Ac-227+0 crustacea and mollusks 1.000E+03 1.000E+03 BIOFAC( 1 ,2) D-5 D-5 Am-241 fish 3.000E+01 3.000E+01 BIOFAC( 2,1) 0 -5 Am-241 crustacea and mollusks 1.000E+03 1.000E+03 BIOFAC( 2,2) 0-5 D-5 Cs-137+0 fish 2.000E+03 2.000E+03 BIOFAC( 3,1) 0-5 Cs-137+0 crustacea and mollusks 1.000E+02 1.000E+02 BIOFAC( 3,2) 0-5 0-5 H-3 fish 1.000E+OO 1.000E+OO BIOFAC( 4,1) 0-5 H-3 crustacea and mollusks 1.000E+OO 1.000E+OO BIOFAC( 4,2) D-5 0 -5 Np-237+0 fish 3.000E+01 3.000E+01 BIOFAC( 5,1) 0-5 Np-237+0 crustacea and mollusks 4.000E+02 4.000E+02 BIOFAC( 5,2) 0-5 D-5 Pa-231 fish 1.000E+01 1.000E+01 BIOFAC( 6,1) 0-5 Pa-231 crustacea and mollusks 1.100E+02 1.100E+02 BIOFAC( 6,2) 0-5 D-5 Pb-210+0 fish 3.000E+02 3.000E+02 BIOFAC( 7,1) 0-5 Pb-210+0 crustacea and mollusks 1.000E+02 1.000E+02 BIOFAC( 7,2) 0 -5 0-5 Pu-238 fish 3.000E+01 3.000E+01 BIOFAC( 8,1) 0 -5 Pu-238 crustacea and mollusks 1.000E+02 1.000E+02 BIOFAC( 8,2) 0-5 0 -5 Pu-239 fish 3.000E+01 3.000E+01 BIOFAC( 9,1) 0-5 Pu-239 crustacea and mollusks 1.000E+02 1.000E+02 BIOFAC( 9,2) 0-5 0-5 Ra-226+0 fish 5.000E+01 5.000E+01 BIOFAC(1 0,1) 0-5 Ra-226+0 crustacea and mollusks 2.500E+02 2.500E+02 BIOFAC(1 0,2) 0-5 0-5 Sr-90+0 fish 6.000E+01 6.000E+01 BIOFAC(11 ,1) 0-5 Sr-90+0 crustacea and mollusks 1.000E+02 1.000E+02 BIOFAC(11 ,2) 0 -5 0-5 Th-229+0 fish 1.000E+02 1.000E+02 BIOFAC(12, 1) 0-5 Th-229+0 crustacea and mollusks 5.000E+02 5.000E+02 BIOFAC(12,2) 0-5 0-5 Th-230 fish 1.000E+02 1.000E+02 BIOFAC(13, 1) 0-5 Th-230 crustacea and mollusks 5.000E+02 5.000E+02 BIOFAC(13,2) 0-5 0-5 U-233 fish 1.000E+01 1.000E+01 BIOFAC(14,1) 0-5 U-233 crustacea and mollusks 6.000E+01 6.000E+01 BIOFAC(14,2)
May 2003 F-26 ER2003-0326

VCM Plan for SWMU 21-011(k), Rev.3
1 RESRAD, Version 6.21 T% Limit= 0.5 year 10/18/2002 07:28 Page 5 Summary : Trail User, Hiker, 140 hrs/yr, 67 mg/hr soil ingestion---21-0011 k mean cone w/r File : TUHME21 011 kw_remov_500y.RAD
Dose Conversion Factor (and Related) Parameter Summary (continued) File: FGR 13 Morbidity
Current Parameter Menu Pa r ame t er Value Defau l t
+ 0-5 U-234 fish 1.000E+01 1.000E+01 D-5 U-234 crustacea and mollusks 6.000E+01 6.000E+01 0-5 0-5 U-235+0 fish 1.000E+01 1.000E+01 0-5 U-235+0 crustacea and mollusks 6.000E+01 6.000E+01 0-5 0-5 U-238+0 fish 1.000E+01 1.000E+01 0-5 U-238+0 crustacea and mollusks 6.000E+01 6.000E+01
Name
BIOFAC(15,1) BIOFAC(15,2)
BIOFAC(16, 1) BIOFAC(16,2)
BIOFAC(17,1) BIOFAC(17,2)
====================================================================================================
ER2003-0326 F-27 May 2003

VCM Plan for SWMU 21-011 (k), Rev. 3
1 RESRAD, Version 6.21 T% Limit= 0.5 year 10/18/2002 07:28 Page 6 Summary : Trail User, Hiker, 140 hrs/yr, 67 mg/hr soil ingestion---21-0011 k mean cone w/r File : TUHME21 011 kw_remov_500y.RAD
Site-Specific Parameter Summary User Used by RESRAD Parameter
Menu Parameter Input Default Name (If different from user input)
-------+----------------------------------------------------------------------------+---R011 Area of contaminated zone (m**2) R011 Thickness of contaminated zone (m) R011 Length parallel to aquifer flow (m) R011 Basic radiation dose limit (mrem/yr) R011 Time since placement of material (yr) R011 Times for calculations (yr) R011 Times for calculations (yr) R011 Times for calculations (yr) R011 Times for calculations (yr) R011 Times for calculations (yr) R011 Times for calculations (yr) R011 Times for calculations (yr) R011 Times for calculations (yr) R011 Times for calculations (yr)
R012 Initial principal radionuclide (pCi/g): Am-241 R012 Initial principal radionuclide (pCi/g): Cs-137 R012 Initial principal radionuclide (pCi/g): Pu-238 R012 Initial principal radionuclide (pCi/g): Pu-239 R012 Initial principal radionuclide (pCi/g): Sr-90 R012 Concentration in groundwater (pCi/L) : Am-241 R012 Concentration in groundwater (pCi/L): Cs-137 R012 Concentration in groundwater (pCi/L) : Pu-238 R012 Concentration in groundwater (pCi/L): Pu-239 R012 Concentration in groundwater (pCi/L): Sr-90
R013 Cover depth (m) R013 Density of cover material (g/cm**3) R013 Cover depth erosion rate (m/yr) R013 Density of contaminated zone (g/cm**3) R013 Contaminated zone erosion rate (m/yr) R013 Contaminated zone total porosity R013 Contaminated zone field capacity R013 Contaminated zone hydraulic conductivity (m/yr) R013 Contaminated zone b parameter R013 Average annual wind speed (m/sec) R013 Humidity in air (g/m**3) R013 Evapotranspiration coefficient R013 Precipitation (m/yr) R013 Irrigation (m/yr) R013 Irrigation mode R013 Runoff coefficient R013 Watershed area for nearby stream or pond (m**2) R013 Accuracy for water/soil computations
R014 Density of saturated zone (g/cm**3) R014 Saturated zone total porosity R014 Saturated zone effective porosity R014 Saturated zone field capacity R014 Saturated zone hydraulic conductivity (m/yr)
May 2003
1.000E+04 2.000E+OO not used 1.500E+01 O.OOOE+OO 1.000E+01 3.000E+01 6.000E+01 9.000E+01 1.200E+02 2.000E+02 not used not used not used
5.000E+OO 5.600E+01 5.000E-01 1.000E+01 1.300E+01 not used not used not used not used not used
O.OOOE+OO not used not used 1.500E+OO 1.000E-03 4.000E-01 2.000E-01 1.000E+01 5.300E+OO 3.000E+OO 5.500E+OO 9.990E-01 3.500E-01 O.OOOE+OO overhead 2.000E-01 not used not used
not used not used not used not used not used
F-28
1.000E+04 2.000E+OO 1.000E+02 2.500E+01 O.OOOE+OO 1.000E+OO 3.000E+OO 1.000E+01 3.000E+01 1.000E+02 3.000E+02 1.000E+03 O.OOOE+OO O.OOOE+OO
O.OOOE+OO O.OOOE+OO O.OOOE+OO O.OOOE+OO O.OOOE+OO O.OOOE+OO O.OOOE+OO O.OOOE+OO O.OOOE+OO O.OOOE+OO
O.OOOE+OO 1.500E+OO 1.000E-03 1.500E+OO 1.000E-03 4.000E-01 2.000E-01 1.000E+01 5.300E+OO 2.000E+OO 8.000E+OO 5.000E-01 1.000E+OO 2.000E-01 overhead 2.000E-01 1.000E+06 1.000E-03
1.500E+OO 4.000E-01 2.000E-01 2.000E-01 1.000E+02
AREA THICKO LCZPAQ BRDL Tl T(2) T( 3) T(4) T( 5) T( 6) T(7) T(8) T( 9) T(10)
S1( 2) S1( 3) S1( 8) S1( 9) S1 (11) W1(2) W1(3) W1(8) W1(9) W1(11)
COVERO DENSCV vcv DENSCZ vcz TPCZ FCCZ HCCZ BCZ WIND HUMID EVAPTR PRECIP Rl I DITCH RUNOFF WAREA EPS
DENSAQ TPSZ EPSZ FCSZ HCSZ
ER2003-0326

VCM Plan forSWMU 21-011(k), Rev.3
1RESRAD, Version 6.21 T% Limit= 0.5 year 10/18/2002 07:28 Page 7 Summary : Trail User, Hiker, 140 hrs/yr, 67 mg/hr soil ingestion---21-0011 k mean cone w/r File : TUHME21 011 kw_remov_500y.RAD
Site-Specific Parameter Summary (continued) User Used by RESRAD Parameter
Menu Parameter Input Default Name (If different f r om user input)
-------+----------------------------------------------------------------------------+---R014 Saturated zone hydraulic gradient R014 Saturated zone b parameter R014 Water table drop rate (m/yr) R014 Well pump intake depth (m below water table) R014 Model: Nondispersion (ND) or Mass-Balance (MB) R014 Well pumping rate (m**3/yr)
R015 R015 R015 R015 R015 R015 R015 R015
R016 R016 R016 R016 R016
R016
R016 R016 R016 R016 R016
R016
R016 R016 R016 R016 R016
R016
R016 R016 R016 R016 R016
R016
R016 R016 R016 R016 R016
R016
Number of unsaturated zone strata Unsat. zone 1, thickness (m) Unsat. zone 1, soil density (g/cm**3) Unsat. zone 1, total porosity Unsat. zone 1, effective porosity Unsat. zone 1, field capacity Unsat. zone 1, soil-specific b parameter Unsat. zone 1, hydraulic conductivity (m/yr)
Distribution coefficients for Am-241 Contaminated zone (cm**3/g) Unsaturated zone 1 (cm**3/g) Saturated zone (cm**3/g) Leach rate (/yr)
ALEACH( 2) Solubility constant
SOLUBK( 2)
Distribution coefficients for Cs-137 Contaminated zone (cm**3/g) Unsaturated zone 1 (cm**3/g) Saturated zone (cm**3/g) Leach rate (/yr)
ALEACH( 3) Solubility constant
SOLUBK( 3)
Distribution coefficients for Pu-238 Contaminated zone (cm**3/g) Unsaturated zone 1 (cm**3/g) Saturated zone (cm**3/g) Leach rate (/yr)
ALEACH( 8) Solubility constant
SOLUBK( 8) Distribution coefficients for Pu-239
Contaminated zone (cm**3/g) Unsaturated zone 1 (cm**3/g) Saturated zone (cm**3/g) Leach rate (/yr)
ALEACH( 9) Solubility constant
SOLUBK( 9)
Distribution coefficients for Sr-90 Contaminated zone (cm**3/g) Unsaturated zone 1 (cm**3/g) Saturated zone (cm**3/g) Leach rate (/yr)
ALEACH(11) Solubility constant
SOLUBK(11)
ER2003-0326
not used not used not used not used not used not used
not used not used not used not used not used not used not used not used
2.000E+01 not used not used O.OOOE+OO
O.OOOE+OO
1.000E+03 not used not used O.OOOE+OO
O.OOOE+OO
2.000E+03 not used not used O.OOOE+OO
O.OOOE+OO
2.000E+03 not used not used O.OOOE+OO
O.OOOE+OO
3.000E+01 not used not used O.OOOE+OO
O.OOOE+OO
F-29
2.000E-02 5.300E+OO 1.000E-03 1.000E+01 ND 2.500E+02
1 4.000E+OO 1.500E+OO 4.000E-01 2.000E-01 2.000E-01 5.300E+OO 1.000E+01
2.000E+01 2.000E+01 2.000E+01 O.OOOE+OO
O.OOOE+OO
1.000E+03 1.000E+03 1.000E+03 O.OOOE+OO
O.OOOE+OO
2.000E+03 2.000E+03 2.000E+03 O.OOOE+OO
O.OOOE+OO
2.000E+03 2.000E+03 2.000E+03 O.OOOE+OO
O.OOOE+OO
3.000E+01 3.000E+01 3.000E+01 O.OOOE+OO
O.OOOE+OO
HGWT BSZ VWT DWIBWT MODEL uw
NS H(1) DENSUZ(1) TPUZ(1) EPUZ(1) FCUZ(1) BUZ(1) HCUZ(1)
DCNUCC( 2) DCNUCU( 2,1) DCNUCS( 2)
4.636E-06
not used
DCNUCC( 3) DCNUCU( 3,1) DCNUCS( 3)
9.332E-08
not used
DCNUCC( 8) DCNUCU( 8,1) DCNUCS( 8)
4.666E-08
not used
DCNUCC( 9) DCNUCU( 9,1) DCNUCS( 9)
4.666E-08
not used
DCNUCC(11) DCNUCU(11 , 1) DCNUCS(11)
3.097E-06
not used
May 2003
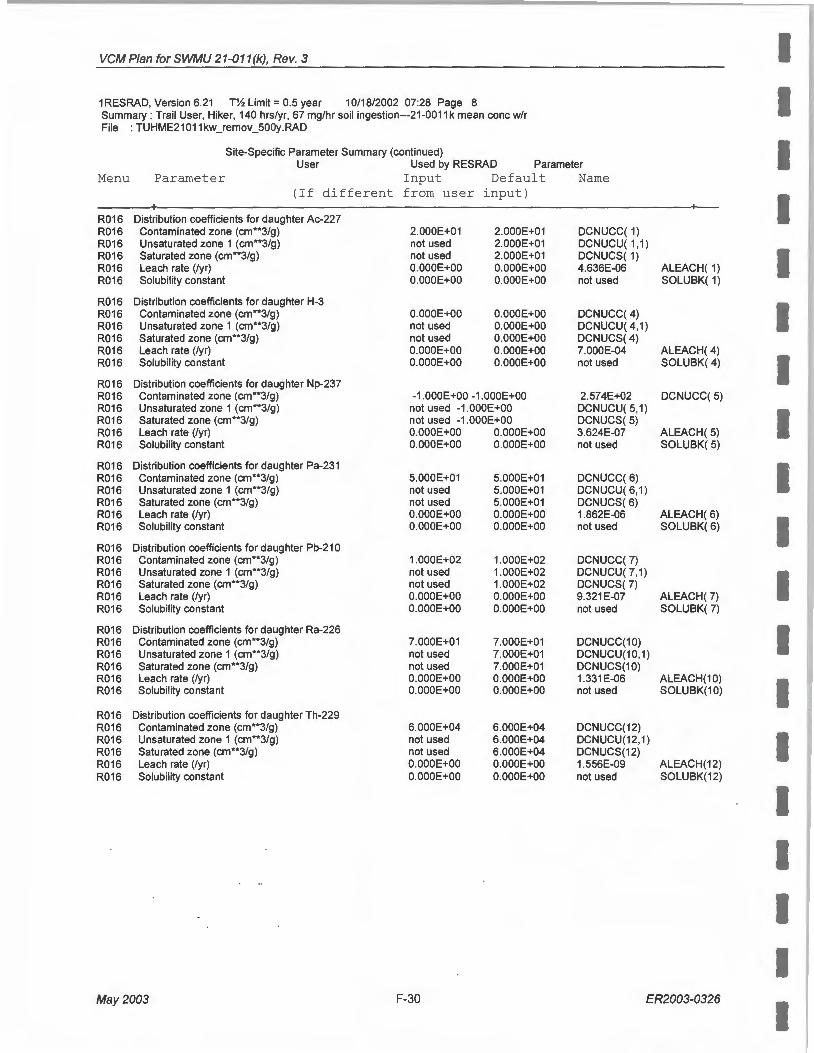
VCM Plan for SWMU 21-011 (k) , Rev. 3
1RESRAD, Version 6.21 TY. Limit= 0.5 year 10/18/2002 07:28 Page 8 Summary : Trail User, Hiker, 140 hrs/yr, 67 mg/hr soil ingestion---21-0011 k mean cone w/r File : TUHME21 011 kw_remov_500y.RAD
Site-Specific Parameter Summary (continued) User Used by RESRAD Parameter
Menu Parameter Input Default Name (If different from user input)
+ +-R016 Distribution coefficients for daughter Ac-227 R016 Contaminated zone (cm**3/g) 2.000E+01 2.000E+01 DCNUCC( 1) R016 Unsaturated zone 1 (cm**3/g) not used 2.000E+01 DCNUCU( 1,1) R016 Saturated zone (cm**3/g) not used 2.000E+01 DCNUCS( 1) R016 Leach rate (/yr) O.OOOE+OO O.OOOE+OO 4.636E-06 ALEACH( 1) R016 Solubility constant O.OOOE+OO O.OOOE+OO not used SOLUBK( 1)
R016 Distribution coefficients for daughter H-3 R016 Contaminated zone (cm**3/g) O.OOOE+OO O.OOOE+OO DCNUCC( 4) R016 Unsaturated zone 1 (cm**3/g) not used O.OOOE+OO DCNUCU( 4,1) R016 Saturated zone (cm**3/g) not used O.OOOE+OO DCNUCS( 4) R016 Leach rate (/yr) O.OOOE+OO O.OOOE+OO 7.000E-04 ALEACH( 4) R016 Solubility constant O.OOOE+OO O.OOOE+OO not used SOLUBK( 4)
R016 Distribution coefficients for daughter Np-237 R016 Contaminated zone (cm**3/g) -1 .000E+OO -1.000E+OO 2.574E+02 DCNUCC( 5) R016 Unsaturated zone 1 (cm**3/g) not used -1 .000E+OO DCNUCU( 5,1) R016 Saturated zone (cm**3/g) not used -1 .000E+OO DCNUCS( 5) R016 Leach rate (/yr) O.OOOE+OO O.OOOE+OO 3.624E-07 ALEACH( 5) R016 Solubility constant O.OOOE+OO O.OOOE+OO not used SOLUBK( 5)
R016 Distribution coefficients for daughter Pa-231 R016 Contaminated zone (cm**3/g) 5.000E+01 5.000E+01 DCNUCC( 6) R016 Unsaturated zone 1 (cm**3/g) not used 5.000E+01 DCNUCU( 6,1) R016 Saturated zone (cm**3/g) not used 5.000E+01 DCNUCS(6) R016 Leach rate (/yr) O.OOOE+OO O.OOOE+OO 1.862E-06 ALEACH(6) R016 Solubility constant O.OOOE+OO O.OOOE+OO not used SOLUBK( 6)
R016 Distribution coefficients for daughter Pb-21 0 R016 Contaminated zone (cm**3/g) 1.000E+02 1.000E+02 DCNUCC( 7) R016 Unsaturated zone 1 (cm**3/g) not used 1.000E+02 DCNUCU( 7,1) R016 Saturated zone (cm**3/g) not used 1.000E+02 DCNUCS( 7) R016 Leach rate (/yr) O.OOOE+OO O.OOOE+OO 9.321 E-07 ALEACH( 7) R016 Solubility constant O.OOOE+OO O.OOOE+OO not used SOLUBK( 7)
R016 Distribution coefficients for daughter Ra-226 R016 Contaminated zone (cm**3/g) 7.000E+01 7.000E+01 DCNUCC(10) R016 Unsaturated zone 1 (cm**3/g) not used 7.000E+01 DCNUCU(10,1) R016 Saturated zone (cm**3/g) not used 7.000E+01 DCNUCS(10) R016 Leach rate (/yr) O.OOOE+OO O.OOOE+OO 1.331 E-06 ALEACH(10) R016 Solubil ity constant O.OOOE+OO O.OOOE+OO not used SOLUBK(10)
R016 Distribution coefficients for daughter Th-229 R016 Contaminated zone (cm**3/g) 6.000E+04 6.000E+04 DCNUCC(12) R016 Unsaturated zone 1 (cm**3/g) not used 6.000E+04 DCNUCU(12, 1) R016 Saturated zone (cm**3/g) not used 6.000E+04 DCNUCS(12) R016 Leach rate (/yr) O.OOOE+OO O.OOOE+OO 1.556E-09 ALEACH(12) R016 Solubility constant O.OOOE+OO O.OOOE+OO not used SOLUBK(12)
May 2003 F-30 ER2003-0326
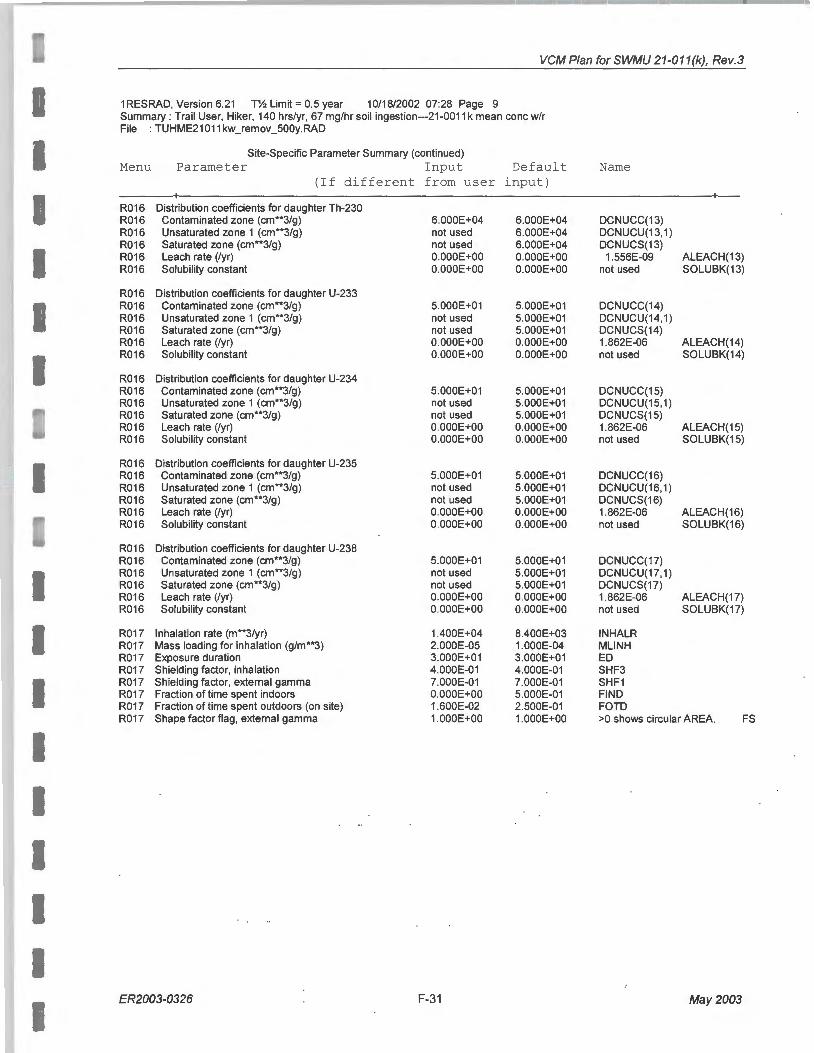
VCM Plan for SWMU 21-011(k), Rev.3
1 RESRAD, Version 6.21 T% Limit= 0.5 year 10/18/2002 07:28 Page 9 Summary : Trail User, Hiker, 140 hrs/yr, 67 mg/hr soil ingestion---21-0011 k mean cone w/r File : TUHME21 011 kw_remov_500y.RAD
Site-Specific Parameter Summary (continued) Menu Parameter Input Default Name
(If different from user input) + +--
R016 Distribution coefficients for daughter Th-230 R016 Contaminated zone (cm**3/g) 6.000E+04 6.000E+04 DCNUCC(13) R016 Unsaturated zone 1 (cm**3/g) not used 6.000E+04 DCNUCU(13, 1) R016 Saturated zone (cm**3/g) not used 6.000E+04 DCNUCS(13) R016 Leach rate (/yr) O.OOOE+OO O.OOOE+OO 1.556E-09 ALEACH(13) R016 Solubility constant O.OOOE+OO O.OOOE+OO not used SOLUBK(13)
R016 Distribution coefficients for daughter U-233 R016 Contaminated zone (cm**3/g) 5.000E+01 5.000E+01 DCNUCC(14) R016 Unsaturated zone 1 (cm**3/g) not used 5.000E+01 DCNUCU(14,1) R016 Saturated zone (cm**3/g) not used 5.000E+01 DCNUCS(14) R016 Leach rate (/yr) O.OOOE+OO O.OOOE+OO 1.862E-06 ALEACH(14) R016 Solubility constant O.OOOE+OO O.OOOE+OO not used SOLUBK(14)
R016 Distribution coefficients for daughter U-234 R016 Contaminated zone (cm**3/g) 5.000E+01 5.000E+01 DCNUCC(15) R016 Unsaturated zone 1 ( cm**3/g) not used 5.000E+01 DCNUCU(15,1) R016 Saturated zone (cm**3/g) not used 5.000E+01 DCNUCS(15) R016 Leach rate (/yr) O.OOOE+OO O.OOOE+OO 1.862E-06 ALEACH(15) R016 Solubility constant O.OOOE+OO O.OOOE+OO not used SOLUBK(15)
R016 Distribution coefficients for daughter U-235 R016 Contaminated zone (cm**3/g) 5.000E+01 5.000E+01 DCNUCC(16) R016 Unsaturated zone 1 (cm**3/g) not used 5.000E+01 DCNUCU(16, 1) R016 Saturated zone (cm**3/g) not used 5.000E+01 DCNUCS(16) R016 Leach rate (/yr) O.OOOE+OO O.OOOE+OO 1.862E-06 ALEACH(16) R016 Solubility constant O.OOOE+OO O.OOOE+OO not used SOLUBK(16)
R016 Distribution coefficients for daughter U-238 R016 Contaminated zone (cm**3/g) 5.000E+01 5.000E+01 DCNUCC(17) R016 Unsaturated zone 1 (cm**3/g) not used 5.000E+01 DCNUCU(17, 1) R016 Saturated zone (cm**3/g) not used 5.000E+01 DCNUCS(17) R016 Leach rate (/yr) O.OOOE+OO O.OOOE+OO 1.862E-06 ALEACH(17) R016 Solubility constant O.OOOE+OO O.OOOE+OO not used SOLUBK(17)
R017 Inhalation rate (m**3/yr) 1.400E+04 8.400E+03 INHALR R017 Mass loading for inhalation (g/m**3) 2.000E-05 1.000E-04 MLINH R017 Exposure duration 3.000E+01 3.000E+01 ED R017 Shielding factor, inhalation 4.000E-01 4.000E-01 SHF3 R017 Shielding factor, external gamma ?.OOOE-01 ?.OOOE-01 SHF1 R017 Fraction of time spent indoors O.OOOE+OO 5.000E-01 FIND R017 Fraction oftime spent outdoors (on site) 1.600E-02 2.500E-01 FOTD R017 Shape factor flag , external gamma 1.000E+OO 1.000E+OO >0 shows circular AREA. FS
ER2003-0326 F-31 May 2003

VCM Plan for SWMU 21-011 (k) , Rev. 3
1RESRAD, Version 6.21 T% Limit= 0.5 year 10/18/2002 07:28 Page 1 0 Summary : Trail User, Hiker, 140 hrs/yr, 67 mg/hr soil ingestion---21-0011 k mean cone w/r File : TUHME21011kw_remov_500y.RAD
Site-Specific Parameter Summary (continued) Menu Parameter I nput Default Name
(If different from user input) + +--
R017 Radii of shape factor array (used if FS = -1): R017 Outer annular radius (m), ring 1: not used 5.000E+01 RAD_SHAPE( 1) R017 Outer annular radius (m) , ring 2: not used 7.071 E+01 RAD_SHAPE( 2) R017 Outer annular radius (m) , ring 3: not used O.OOOE+OO RAD_SHAPE( 3) R017 Outer annular radius (m) , ring 4: not used O.OOOE+OO RAD_SHAPE( 4) R017 Outer annular radius (m), ring 5: not used O.OOOE+OO RAD_SHAPE( 5) R017 Outer annular radius (m), ring 6: not used O.OOOE+OO RAD_SHAPE( 6) R017 Outer annular radius (m), ring 7: not used O.OOOE+OO RAD_SHAPE( 7) R017 Outer annular radius (m}, ring 8: not used O.OOOE+OO RAD_SHAPE( 8) R017 Outer annular radius (m) , ring 9: not used O.OOOE+OO RAD_SHAPE( 9) R017 Outer annular radius (m) , ring 10: not used O.OOOE+OO RAD_SHAPE(1 0) R017 Outer annular radius (m), ring 11 : not used O.OOOE+OO RAD_SHAPE(11) R017 Outer annular radius (m) , ring 12: not used O.OOOE+OO RAD_SHAPE(12)
R017 Fractions of annular areas within AREA: R017 Ring 1 not used 1.000E+OO FRAGA( 1) R017 Ring 2 not used 2.732E-01 FRAGA( 2) R017 Ring 3 not used O.OOOE+OO FRAGA( 3) R017 Ring 4 not used O.OOOE+OO FRACA(4) R017 Ring 5 not used O.OOOE+OO FRAGA( 5) R017 Ring 6 not used O.OOOE+OO FRAGA( 6) R017 Ring 7 not used O.OOOE+OO FRAGA( 7) R017 Ring 8 not used O.OOOE+OO FRAGA( 8) R017 Ring 9 not used O.OOOE+OO FRAGA( 9) R017 Ring 10 not used O.OOOE+OO FRACA(10) R017 Ring 11 not used O.OOOE+OO FRACA(11) R017 Ring 12 not used O.OOOE+OO FRACA(12)
R018 Fruits, vegetables and grain consumption (kg/yr) not used 1.600E+02 DIET(1) R018 Leafy vegetable consumption (kg/yr) not used 1.400E+01 DIET(2) R018 Milk consumption (Uyr) not used 9.200E+01 DIET(3) R018 Meat and poultry consumption (kg/yr) not used 6.300E+01 DIET(4) R018 Fish consumption (kg/yr) not used 5.400E+OO DIET(5) R018 Other seafood consumption (kg/yr) not used 9.000E-01 DIET(6) R018 Soil ingestion rate (g/yr) 5.870E+02 3.650E+01 SOIL R018 Drinking water intake (Uyr) not used 5.100E+02 OWl R018 Contamination fraction of drinking water not used 1.000E+OO FDW R018 Contamination fraction of household water not used 1.000E+OO FHHW R018 Contamination fraction of livestock water not used 1.000E+OO FLW R018 Contamination fraction of irrigation water not used 1.000E+OO FIRW R018 Contamination fraction of aquatic food not used 5.000E-01 FR9 R018 Contamination fraction of plant food not used -1 FPLANT R018 Contamination fraction of meat not used -1 FMEAT R018 Contamination fraction of milk not used -1 FMILK
R019 Livestock fodder intake for meat (kg/day) not used 6.800E+01 LFI5 R019 Livestock fodder intake for milk (kg/day) not used 5.500E+01 LFI6 R019 Livestock water intake for meat (Uday) not used 5.000E+01 LWI5 R019 Livestock water intake for milk (Uday) not used 1.600E+02 LWI6 R019 Livestock soil intake (kg/day) not used 5.000E-01 LSI
May 2003 F-32 ER2003-0326
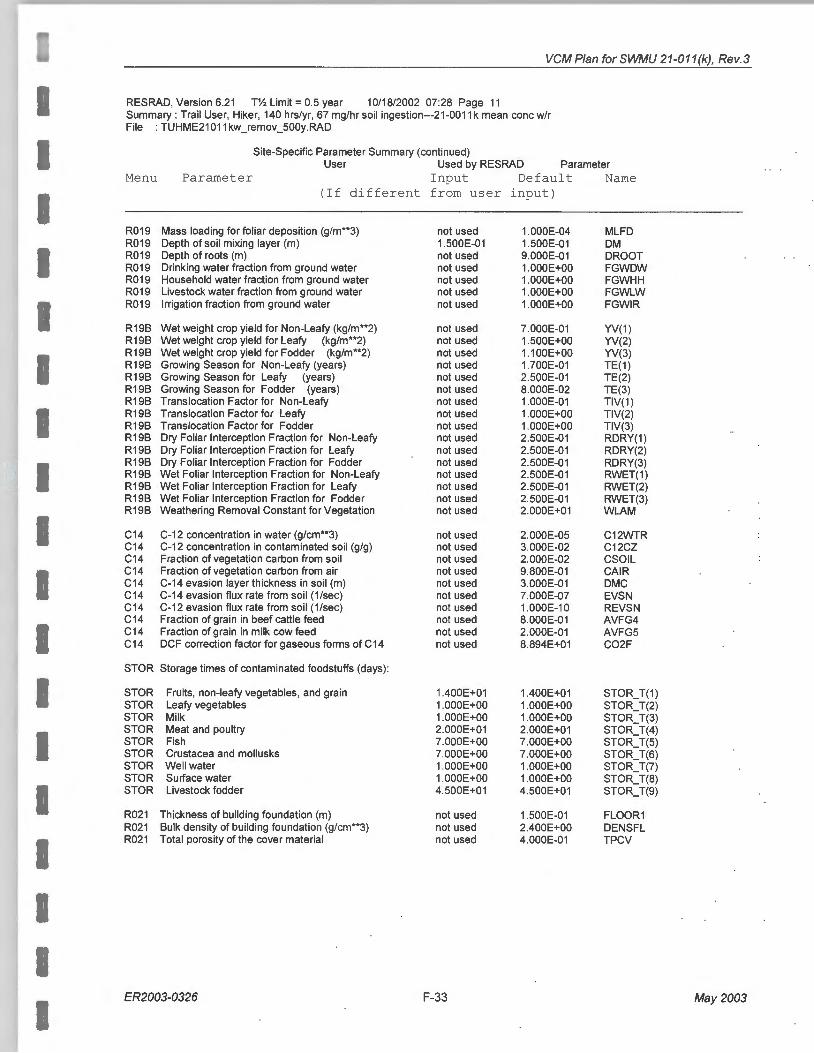
I I
VCM Plan for SWMU 21-011 (k), Rev.3
RESRAD, Version 6.21 T% Limit= 0.5 year 10/18/2002 07:28 Page 11 Summary : Trail User, Hiker, 140 hrs/yr, 67 mg/hr soil ingestion---21 -0011 k mean cone w/r File : TUHME21 011 kw_remov_500y.RAD
Site-Specific Parameter Summary (continued) User Used by RESRAD Parameter
Menu Parameter Input Default Name (If different from user input)
R019 Mass loading for foliar deposition (g/m**3) R019 Depth of soil mixing layer (m) R019 Depth of roots (m) R019 Drinking water fraction from ground water R019 Household water fraction from ground water R019 Livestock water fraction from ground water R019 Irrigation fraction from ground water
R 198 Wet weight crop yield for Non-Leafy (kg/m**2) R 198 Wet weight crop yield for Leafy (kg/m**2) R19B Wet weight crop yield for Fodder (kg/m**2) R19B Growing Season for Non-Leafy (years) R19B Growing Season for Leafy (years) R19B Growing Season for Fodder (years) R19B Translocation Factor for Non-Leafy R19B Translocation Factor for Leafy R19B Translocation Factor for Fodder R19B Dry Foliar Interception Fraction for Non-Leafy R19B Dry Foliar Interception Fraction for Leafy R19B Dry Foliar Interception Fraction for Fodder R19B Wet Foliar Interception Fraction for Non-Leafy R19B Wet Foliar Interception Fraction for Leafy R19B Wet Foliar Interception Fraction for Fodder R 198 Weathering Removal Constant for Vegetation
C14 C-12 concentration in water (g/cm**3) C14 C-12 concentration in contaminated soil (g/g) C14 Fraction of vegetation carbon from soil C14 Fraction of vegetation carbon from air C14 C-14 evasion layer thickness in soil (m) C14 C-14 evasion flux rate from soil (1/sec) C14 C-12 evasion flux rate from soil (1/sec) C14 Fraction of grain in beef cattle feed C14 Fraction of grain in milk cow feed C 14 DCF correction factor for gaseous forms of C 14
STOR Storage times of contaminated foodstuffs (days):
STOR Fruits, non-leafy vegetables , and grain STOR Leafy vegetables STOR Milk STOR Meat and poultry STOR Fish STOR Crustacea and mollusks STOR Well water STOR Surface water STOR Livestock fodder
R021 Thickness of building foundation (m) R021 Bulk density of building foundation (g/cm**3) R021 Total porosity of the cover material
ER2003-0326
not used 1.500E-01 not used not used not used not used not used
not used not used not used not used not used not used not used not used not used not used not used not used not used not used not used not used
not used not used not used not used not used not used not used not used not used not used
1.400E+01 1.000E+OO 1.000E+OO 2.000E+01 7.000E+OO 7.000E+OO 1.000E+OO 1.000E+OO 4.500E+01
not used not used not used
F-33
1.000E-04 1.500E-01 9.000E-01 1.000E+OO 1.000E+OO 1.000E+OO 1.000E+OO
7.000E-01 1.500E+OO 1.100E+OO 1.700E-01 2.500E-01 8.000E-02 1.000E-01 1.000E+OO 1.000E+OO 2.500E-01 2.500E-01 2.500E-01 2.500E-01 2.500E-01 2.500E-01 2.000E+01
2.000E-05 3.000E-02 2.000E-02 9.800E-01 3.000E-01 7.000E-07 1.000E-1 0 8.000E-01 2.000E-01 8.894E+01
1.400E+01 1.000E+OO 1.000E+OO 2.000E+01 7.000E+OO 7.000E+OO 1.000E+OO 1.000E+OO 4.500E+01
1.500E-01 2.400E+OO 4.000E-01
MLFD DM DROOT FGWDW FGWHH FGWLW FGWIR
YV(1) YV(2) YV(3) TE(1) TE(2) TE(3) TIV(1) TIV(2) TIV(3) RDRY(1) RDRY(2) RDRY(3) RWET(1) RWET(2) RWET(3) WlAM
C12WTR C12CZ CSOIL CAIR DMC EVSN REVSN AVFG4 AVFG5 C02F
STOR_T(1) STOR_T(2) STOR_T(3) STOR_T(4) STOR_T(5) STOR_T(6) STOR_T(7) STOR_T(8) STOR_T(9)
FLOOR1 DENSFL TPCV
May 2003

VCM Plan for SWMU 21-011 (k) , Rev. 3
1 RESRAD, Version 6.21 T% Limit= 0.5 year 10/18/2002 07:28 Page 12 Summary : Trail User, Hiker, 140 hrs/yr, 67 mg/hr soil ingestion---21-0011 k mean cone w/r File : TUHME21011kw_remov_500y.RAD
Site-Specific Parameter Summary (continued) 0 User Used by RESRAD Menu Parameter Input Default
(If different from user +
R021 Total porosity of the building foundation not used 1.000E-01 R021 Volumetric water content of the cover material not used 5.000E-02 R021 Volumetric water content of the foundation not used 3.000E-02 R021 Diffusion coefficient for radon gas (m/sec): R021 in cover material not used 2.000E-06 R021 in foundation material not used 3.000E-07 R021 in contaminated zone soil not used 2.000E-06 R021 Radon vertical dimension of mixing (m) not used 2.000E+OO R021 Average building air exchange rate (1/hr) not used 5.000E-01 R021 Height of the building (room) (m) not used 2.500E+OO R021 Building interior area factor not used O.OOOE+OO FAI R021 Building depth below ground surface (m) not used -1 .000E+OO R021 Emanating power of Rn-222 gas not used 2.500E-01 R021 Emanating power of Rn-220 gas not used 1.500E-01
TITL Number of graphical time points 32 NPTS TITL Maximum number of integration points for dose 17 LYMAX TITL Maximum number of integration points for risk 257 KYMAX
Parameter Name input)
+--
TPFL PH20CV PH20FL
DIFCV DIFFL DIFCZ HMIX REXG HRM
DMFL EMANA(1 ) EMANA(2)
====================================================================================================
Summary of Pathway Selections
Pathway User Selection ---------------------------------------+-----------------------
1 -- external gamma 2 -- inhalation (w/o radon) 3 -- plant ingestion 4 -- meat ingestion 5 -- milk ingestion 6 -- aquatic foods 7 -- drinking water 8 -- soil ingestion 9 --radon Find peak pathway doses
active active suppressed suppressed suppressed suppressed
suppressed active
suppressed suppressed
===================================================
May 2003 F-34 ER2003-0326
I

VCM Plan for SWMU 21-011 (k}, Rev.3
1 RESRAD, Version 6.21 TY. Limit= 0.5 year 10/18/2002 07:28 Page 13 Summary : Trail User, Hiker, 140 hrs/yr, 67 mg/hr soil ingestion---21-0011 k mean cone w/r File : TUHME21011kw_remov_500y.RAD
Contaminated Zone Dimensions Initial Soil Concentrations, pCi/g
Area: 10000.00 square meters Thickness: 2.00 meters
Cover Depth: 0.00 meters
Am-241 Cs-137 Pu-238 Pu-239 Sr-90
5.000E+OO 5.600E+01 5.000E-01 1.000E+01 1.300E+01
0 Total Dose TDOSE(t), mrem/yr
Basic Radiation Dose Limit= 1.500E+01 mrem/yr Total Mixture Sum M(t) =Fraction of Basic Dose Limit Received at Time (t)
t (years): O.OOOE+OO 1.000E+01 3.000E+01 6.000E+01 TDOSE(t): 3.402E+OO 2.805E+OO 1.952E+OO 1.222E+OO M(t): 2.268E-01 1.870E-01 1.301 E-01 8.150E-02 5.688E-02 Maximum TDOSE(t) : 3.402E+OO mrem/yr at t = O.OOOE+OO years
ER2003-0326 F-35
9.000E+01 8.532E-01 4.430E-02
1.200E+02 6.645E-01 3.281 E-02
2.000E+02 4.922E-01
May 2003

~ "> 0
8 1 RESRAD, Version 6.21 T% Limit= 0.5 year 10/18/2002 07:28 Page 14 6 Summary : Trail User, Hiker, 140 hrs/yr, 67 mg/hr soil ingestion--21-0011 k mean cone w/r ~ File : TUHME21011kw remov 500y.RAD ~ - -
Total Dose Contributions TDOSE(i ,p,t) for Individual Radionuclides (i) and Pathways (p) As mrem/yr and Fraction of Total Dose At t = O.OOOE+OO years
Water Independent Pathways (Inhalation excludes radon) Ground Inhalation Radon Plant Meat Milk Soil
Radio-Nuclide mrem/yr fract. mrem/yr fract. mrem/yr fract. mrem/yr fract.
Am-241 3.390E-03 0 .0010 1.463E-03 0.0004 O.OOOE+OO 0.0000 O.OOOE+OO 0.0000 Cs-137 2.827E+OO 0.8309 1.165E-06 0.0000 O.OOOE+OO 0.0000 O.OOOE+OO 0.0000 Pu-238 1.192E-06 0 .0000 1.288E-04 0.0000 O.OOOE+OO 0.0000 O.OOOE+OO 0.0000 Pu-239 4.532E-05 0.0000 2.830E-03 0.0008 O.OOOE+OO 0.0000 O.OOOE+OO 0.0000 Sr-90 4.750E-03 0 .0014 1.11 OE-05 0.0000 O.OOOE+OO 0.0000 O.OOOE+OO 0.0000
mrem/yr fract. mrem/yr fract.
O.OOOE+OO 0.0000 O.OOOE+OO 0.0000 O.OOOE+OO 0.0000 O.OOOE+OO 0.0000 O.OOOE+OO 0.0000 O.OOOE+OO 0.0000 O.OOOE+OO 0.0000 O.OOOE+OO 0.0000 O.OOOE+OO 0.0000 O.OOOE+OO 0.0000
======= ========= ====== ========= ====== ========= ====== ========= ====== ========= ====== ========= ====== ========= ======
"Tl I w ......
~ "> 0 0 w
Total 2.835E+OO 0.8333 4.434E-03 0.0013 O.OOOE+OO 0.0000 O.OOOE+OO 0.0000 O.OOOE+OO 0.0000 O.OOOE+OO 0.0000
Total Dose Contributions TDOSE(i,p,t) for Individual Radionuclides (i) and Pathways (p) As mrem/yr and Fraction of Total Dose At t = O.OOOE+OO years
Water Dependent Pathways Water Fish Radon Plant Meat Milk All Pathways*
Radio-Nuclide mrem/yr fract. mrem/yr fract. mrem/yr fract. mrem/yr fract. mrem/yr fract. mrem/yr fract.
Am-241 O.OOOE+OO 0.0000 O.OOOE+OO 0.0000 O.OOOE+OO 0.0000 O.OOOE+OO 0.0000 O.OOOE+OO 0.0000 O.OOOE+OO 0 .0000 Cs-137 O.OOOE+OO 0.0000 O.OOOE+OO 0.0000 O.OOOE+OO 0.0000 O.OOOE+OO 0.0000 O.OOOE+OO 0.0000 O.OOOE+OO 0.0000 Pu-238 O.OOOE+OO 0.0000 O.OOOE+OO 0.0000 O.OOOE+OO 0.0000 O.OOOE+OO 0.0000 O.OOOE+OO 0.0000 O.OOOE+OO 0.0000 Pu-239 O.OOOE+OO 0.0000 O.OOOE+OO 0.0000 O.OOOE+OO 0.0000 O.OOOE+OO 0.0000 O.OOOE+OO 0.0000 O.OOOE+OO 0.0000 Sr-90 O.OOOE+OO 0.0000 O.OOOE+OO 0.0000 O.OOOE+OO 0.0000 O.OOOE+OO 0.0000 O.OOOE+OO 0.0000 O.OOOE+OO 0.0000 ======= ========= ====== ========= ====== ========= ====== ========= ====== ========= ====== ========= ====== ========= ====== Total O.OOOE+OO 0.0000 O.OOOE+OO 0.0000 O.OOOE+OO 0.0000 O.OOOE+OO 0.0000 O.OOOE+OO 0.0000 O.OOOE+OO 0.0000 *Sum of all water independent and dependent pathways.
mrem/yr fract.
1.708E-01 0.0502 2.600E-02 0.0076 1.497E-O 0.0044 3.325E-01 0.0977 1.846E-02 0.0054
5.627E-01 0.1654
mrem/yr fract. ---1.757E-01 0.0516 2.853E+OO 0.8385 1.510E-02 0.0044 3.353E-01 0.0986 2.322E-02 0.0068
3.402E+OO 1.0000
2 ~ ::J
0' .., (/)
~ c:: "> ~ I
0 ~
~
~ ~ ~ w

~ '<:: 1 RESRAD, Version 6.21 T'h Limit= 0.5 year 10/18/2002 07:28 Page 15 ~ Summary : Trail User, Hiker, 140 hrs/yr, 67 mg/hr soil ingestion---21-0011k mean cone w/r 8 File : TUHME21 011 kw_remov_500y.RAD
Total Dose Contributions TDOSE(i,p,t) for Individual Radionuclides (i) and Pathways (p) As mrem/yr and Fraction of Total Dose At t = 1.000E+01 years
Water Independent Pathways (Inhalation excludes radon) Ground Inhalation Radon Plant Meat Milk Soil
Radio-Nuclide mrem/yr fract. mrem/yr tract. mrem/yr fract. mrem/yr fract. mrem/yr tract. mrem/yr fract.
-Am-241 3.336E-03 0.0012 1.440E-03 0.0005 O.OOOE+OO 0.0000 O.OOOE+OO 0.0000 O.OOOE+OO 0.0000 O.OOOE+OO 0.0000 Cs-137 2.244E+OO 0.8000 9.246E-07 0.0000 O.OOOE+OO 0.0000 O.OOOE+OO 0.0000 O.OOOE+OO 0.0000 O.OOOE+OO 0.0000 Pu-238 1.101E-06 0.0000 1.190E-04 0.0000 O.OOOE+OO 0.0000 O.OOOE+OO 0.0000 O.OOOE+OO 0.0000 O.OOOE+OO 0.0000 Pu-239 4.531E-05 0.0000 2.829E-03 0.0010 O.OOOE+OO 0.0000 O.OOOE+OO 0.0000 O.OOOE+OO 0.0000 O.OOOE+OO 0.0000 Sr-90 3.744E-03 0.0013 8.750E-06 0.0000 O.OOOE+OO 0.0000 O.OOOE+OO 0.0000 O.OOOE+OO 0.0000 O.OOOE+OO 0.0000 ======= ========= ====== ========= ====== ========= ====== ========= ====== ========= ====== ========= ====== ========= ======
, w CXl
~ ~ 8 1\.) 0>
Total 2.251 E+OO 0.8025 4.398E-03 0.0016 O.OOOE+OO 0.0000 O.OOOE+OO 0.0000 O.OOOE+OO 0.0000 O.OOOE+OO 0.0000
Total Dose Contributions TDOSE(i,p,t) for Individual Radionuclides (i) and Pathways (p) As mrem/yr and Fraction of Total Dose At t = 1.000E+01 years
Water Dependent Pathways Water Fish Radon Plant Meat Milk All Pathways*
Radio-Nuclide mrem/yr tract. mrem/yr tract. mrem/yr tract. mrem/yr fract. mrem/yr tract. mrem/yr tract.
Am-241 O.OOOE+OO 0.0000 O.OOOE+OO 0.0000 O.OOOE+OO 0.0000 O.OOOE+OO 0.0000 O.OOOE+OO 0.0000 O.OOOE+OO 0.0000 Cs-137 O.OOOE+OO 0.0000 O.OOOE+OO 0.0000 O.OOOE+OO 0.0000 O.OOOE+OO 0.0000 O.OOOE+OO 0.0000 O.OOOE+OO 0.0000 Pu-238 O.OOOE+OO 0.0000 O.OOOE+OO 0.0000 O.OOOE+OO 0.0000 O.OOOE+OO 0.0000 O.OOOE+OO 0.0000 O.OOOE+OO 0.0000 Pu-239 O.OOOE+OO 0.0000 O.OOOE+OO 0.0000 O.OOOE+OO 0.0000 O.OOOE+OO 0.0000 O.OOOE+OO 0.0000 O.OOOE+OO 0.0000 Sr-90 O.OOOE+OO 0.0000 O.OOOE+OO 0.0000 O.OOOE+OO 0.0000 O.OOOE+OO 0.0000 O.OOOE+OO 0.0000 O.OOOE+OO 0.0000 ================================================================================================================ Total O.OOOE+OO 0.0000 O.OOOE+OO 0.0000 O.OOOE+OO 0.0000 O.OOOE+OO 0.0000 O.OOOE+OO 0.0000 O.OOOE+OO 0.0000 *Sum of all water independent and dependent pathways.
mrem/yr fract.
1.681 E-01 0.0599 2.063E-02 0.0074 1.383E-02 0.0049 3.324E-01 0.1 185 1.455E-02 0.0052
5.495E-01 0.1959
mrem/yr fract.
1.728E-01 0.0616 2.264E+OO 0.8073 1.395E-02 0.0050 3.353E-01 0.1195 1.830E-02 0.0065
2.805E+OO 1.0000
-
<:.::: ()
s: ::\;! Q) ::J
0' ...., (/)
~ c: 1\.) ..... I c ..... ..... ~ :::0 <1)
:<:: <.>
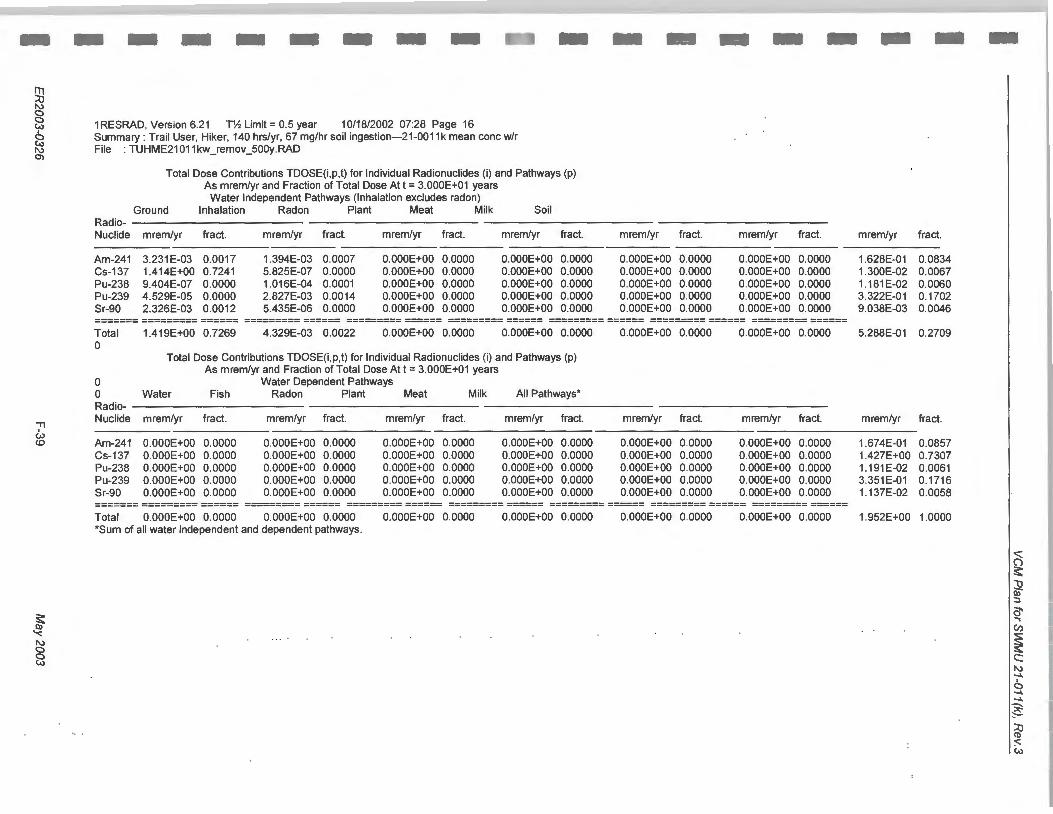
~ 1'\.) 0 8 1 RESRAD, Version 6.21 TY. Limit= 0.5 year 10/18/2002 07:28 Page 16 8 Summary : Trail User, Hiker, 140 hrs/yr, 67 mg/hr soil ingestion---21-0011k mean cone w/r ~ File : TUHME21 011 kw_remov_500y.RAD
Total Dose Contributions TDOSE(i,p,t) for Individual Radionuclides (i) and Pathways (p) As mrem/yr and Fraction of Total Dose At t = 3.000E+01 years
Water Independent Pathways (Inhalation excludes radon) Ground Inhalation Radon Plant Meat Milk Soil
Radio-Nuclide mrem/yr fract. mrem/yr fract. mrem/yr fract. mrem/yr fract. mrem/yr fract. mrem/yr fract.
--Am-241 3.231 E-03 0.0017 1.394E-03 0.0007 O.OOOE+OO 0.0000 O.OOOE+OO 0.0000 O.OOOE+OO 0.0000 O.OOOE+OO 0.0000 Cs-137 1.414E+OO 0.7241 5.825E-07 0.0000 O.OOOE+OO 0.0000 O.OOOE+OO 0.0000 O.OOOE+OO 0.0000 O.OOOE+OO 0.0000 Pu-238 9.404E-07 0.0000 1.016E-04 0.0001 O.OOOE+OO 0.0000 O.OOOE+OO 0.0000 O.OOOE+OO 0.0000 O.OOOE+OO 0.0000 Pu-239 4.529E-05 0.0000 2.827E-03 0.0014 O.OOOE+OO 0.0000 O.OOOE+OO 0.0000 O.OOOE+OO 0.0000 O.OOOE+OO 0.0000 Sr-90 2.326E-03 0.0012 5.435E-06 0.0000 O.OOOE+OO 0.0000 O.OOOE+OO 0.0000 O.OOOE+OO 0.0000 O.OOOE+OO 0.0000 ======= ========= ====== ========= ====== ========= ====== ========= ====== ========= ====== ========= ====== ========= ======
11 I w <0
~ '<: 1'\.) 0 0 w
Total 1.419E+OO 0.7269 4.329E-03 0.0022 O.OOOE+OO 0.0000 O.OOOE+OO 0.0000 O.OOOE+OO 0.0000 O.OOOE+OO 0.0000 0
Total Dose Contributions TDOSE(i,p,t) for Individual Radionuclides (i) and Pathways (p) As mrem/yr and Fraction of Total Dose At t = 3.000E+01 years
0 Water Dependent Pathways 0 Water Fish Radon Plant Meat Milk All Pathways* Radio-Nuclide mrem/yr fract. mrem/yr fract. mrem/yr fract. mrem/yr fract. mrem/yr fract. mrem/yr fract.
Am-241 O.OOOE+OO 0.0000 O.OOOE+OO 0.0000 O.OOOE+OO 0.0000 O.OOOE+OO 0.0000 O.OOOE+OO 0.0000 O.OOOE+OO 0.0000 Cs-137 O.OOOE+OO 0.0000 O.OOOE+OO 0.0000 O.OOOE+OO 0.0000 O.OOOE+OO 0.0000 O.OOOE+OO 0.0000 O.OOOE+OO 0.0000 Pu-238 O.OOOE+OO 0.0000 O.OOOE+OO 0.0000 O.OOOE+OO 0.0000 O.OOOE+OO 0.0000 O.OOOE+OO 0.0000 O.OOOE+OO 0.0000 Pu-239 O.OOOE+OO 0.0000 O.OOOE+OO 0.0000 O.OOOE+OO 0.0000 O.OOOE+OO 0.0000 O.OOOE+OO 0.0000 O.OOOE+OO 0.0000 Sr-90 O.OOOE+OO 0.0000 O.OOOE+OO 0.0000 O.OOOE+OO 0.0000 O.OOOE+OO 0.0000 O.OOOE+OO 0.0000 O.OOOE+OO 0.0000 ======= ========= ====== ========= ====== ========= ====== ========= ====== ========= ====== ========= ====== ========= ====== Total O.OOOE+OO 0.0000 O.OOOE+OO 0.0000 O.OOOE+OO 0.0000 O.OOOE+OO 0.0000 O.OOOE+OO 0.0000 O.OOOE+OO 0.0000 *Sum of all water independent and dependent pathways.
mrem/yr fract.
1.628E-01 0.0834 1.300E-02 0.0067 1.181 E-02 0.0060 3.322E-01 0.1702 9.038E-03 0.0046
5.288E-01 0.2709
mrem/yr fract. ---1.674E-01 0.0857 1.427E+OO 0.7307 1.191 E-02 0.0061 3.351 E-01 0.1716 1.137E-02 0.0058
1.952E+OO 1.0000
2 32 Q) ::J
0' .., (/)
~ c: 1'\.) ~ I
0 ~
~
?: ~ ~ w

~ '<: 1\)
§
II I
.j>. 0
~ g <f 8 1\) OJ
1 RESRAD, Version 6.21 T% Limit= 0.5 year 10/18/2002 07:28 Page 17 Summary : Trail User, Hiker, 140 hrs/yr, 67 mg/hr soil ingestion---21-0011k mean cone w/r File : TUHME21011kw_remov_500y.RAD
Total Dose Contributions TDOSE(i ,p,t) for Individual Radionuclides (i) and Pathways (p) As mrem/yr and Fraction of Total Dose At t = 6.000E+01 years
Water Independent Pathways (Inhalation excludes radon) Ground Inhalation Radon Plant Meat Milk Soil
Radio-Nuclide mrem/yr tract. mrem/yr tract. mrem/yr tract. mrem/yr tract.
Am-241 3.080E-03 0.0025 1.329E-03 0.0011 O.OOOE+OO 0.0000 O.OOOE+OO 0.0000 Cs-137 7.068E-01 0.5781 2.912E-07 0.0000 O.OOOE+OO 0.0000 O.OOOE+OO 0.0000 Pu-238 7.422E-07 0.0000 8.017E-05 0.0001 O.OOOE+OO 0.0000 O.OOOE+OO 0.0000 Pu-239 4.525E-05 0.0000 2.825E-03 0.0023 O.OOOE+OO 0.0000 O.OOOE+OO 0.0000 Sr-90 1.139E-03 0.0009 2.661 E-06 0.0000 O.OOOE+OO 0.0000 O.OOOE+OO 0.0000
mrem/yr tract. mrem/yr tract.
O.OOOE+OO 0.0000 O.OOOE+OO 0.0000 O.OOOE+OO 0.0000 O.OOOE+OO 0.0000 O.OOOE+OO 0.0000 O.OOOE+OO 0.0000 O.OOOE+OO 0.0000 O.OOOE+OO 0.0000 O.OOOE+OO 0.0000 O.OOOE+OO 0.0000
======= ========= ====== ========= ====== ========= ====== ========= ====== ========= ====== ========= ====== ========= ====== Total 7.11 OE-01 0.5816 4.237E-03 0.0035 O.OOOE+OO 0.0000 O.OOOE+OO 0.0000 O.OOOE+OO 0.0000 O.OOOE+OO 0.0000 5.072E-01 0.4149 0
Total Dose Contributions TDOSE(i,p,t) for Individual Radionuclides (i) and Pathways (p) As mrem/yr and Fraction of Total Dose At t = 6.000E+01 years
Water Dependent Pathways Water Fish Radon Plant Meat Milk All Pathways*
Radio-Nuclide mrem/yr tract. mrem/yr tract. mrem/yr tract. mrem/yr tract. mrem/yr tract. mrem/yr tract.
-Am-241 O.OOOE+OO 0.0000 O.OOOE+OO 0.0000 O.OOOE+OO 0.0000 O.OOOE+OO 0.0000 O.OOOE+OO 0.0000 O.OOOE+OO 0.0000 Cs-137 O.OOOE+OO 0.0000 O.OOOE+OO 0.0000 O.OOOE+OO 0.0000 O.OOOE+OO 0.0000 O.OOOE+OO 0.0000 O.OOOE+OO 0.0000 Pu-238 O.OOOE+OO 0.0000 O.OOOE+OO 0.0000 O.OOOE+OO 0.0000 O.OOOE+OO 0.0000 O.OOOE+OO 0.0000 O.OOOE+OO 0.0000 Pu-239 O.OOOE+OO 0.0000 O.OOOE+OO 0.0000 O.OOOE+OO 0.0000 O.OOOE+OO 0.0000 O.OOOE+OO 0.0000 O.OOOE+OO 0.0000 Sr-90 O.OOOE+OO 0.0000 O.OOOE+OO 0.0000 O.OOOE+OO 0.0000 O.OOOE+OO 0.0000 O.OOOE+OO 0.0000 O.OOOE+OO 0.0000 ======= ========= ====== ========= ====== ========= ====== ========= ====== ========= ====== ========= ====== ========= ====== Total O.OOOE+OO 0.0000 O.OOOE+OO 0.0000 O.OOOE+OO 0.0000 O.OOOE+OO 0.0000 O.OOOE+OO 0.0000 O.OOOE+OO 0.0000 *Sum of all water independent and dependent pathways.
mrem/yr tract.
1.551 E-01 0.1269 6.499E-03 0.0053 9.318E-03 0.0076 3.319E-01 0.2715 4.425E-03 0.0036
mrem/yr tract.
1.595E-01 0.1305 7.133E-01 0.5834 9.399E-03 0.0077 3.348E-01 0.2738 5.566E-03 0.0046
1.222E+OO 1.0000
2 3;1 Q) :J
0' ...., (/)
~ c:: 1\) ...... I c ......
......
~ ~ :::; (.,)

~ 1\.) c 8 1 RESRAD, Version 6.21 TY. Limit= 0.5 year 10/18/2002 07:28 Page 18 g Summary : Trail User, Hiker, 140 hrs/yr, 67 mg/hr soil ingestion---21-0011k mean cone w/r ~ File : TUHME21 011 kw_remov_500y.RAD
Total Dose Contributions TDOSE(i,p,t) for Individual Radionuclides (i) and Pathways (p) As mrem/yr and Fraction of Total Dose At t = 9.000E+01 years
Water Independent Pathways (Inhalation excludes radon) Ground Inhalation Radon Plant Meat Milk Soil
Radio-Nuclide mrem/yr fract. mrem/yr fract. mrem/yr fract. mrem/yr fract. mrem/yr fract. mrem/yr fract.
Am-241 2.935E-03 0.0034 1.266E-03 0.0015 O.OOOE+OO 0.0000 O.OOOE+OO 0.0000 O.OOOE+OO 0.0000 O.OOOE+OO 0.0000 Cs-137 3.534E-01 0.4142 1.456E-07 0.0000 O.OOOE+OO 0.0000 O.OOOE+OO 0.0000 O.OOOE+OO 0.0000 O.OOOE+OO 0.0000 Pu-238 5.859E-07 0.0000 6.326E-05 0.0001 O.OOOE+OO 0.0000 O.OOOE+OO 0.0000 O.OOOE+OO 0.0000 O.OOOE+OO 0.0000 Pu-239 4.522E-05 0.0001 2.823E-03 0.0033 O.OOOE+OO 0.0000 O.OOOE+OO 0.0000 O.OOOE+OO 0.0000 O.OOOE+OO 0.0000 Sr-90 5.574E-04 0.0007 1.303E-06 0.0000 O.OOOE+OO 0.0000 O.OOOE+OO 0.0000 O.OOOE+OO 0.0000 O.OOOE+OO 0.0000 ======= ========= ====== ========= ====== ========= ====== ========= ====== ========= ====== ========= ====== ========= ======
., ~ ......
~ 1\.) c 8
Total 3.569E-01 0.4183 4.153E-03 0.0049 O.OOOE+OO 0.0000 O.OOOE+OO 0.0000 O.OOOE+OO 0.0000 O.OOOE+OO 0.0000
Total Dose Contributions TDOSE(i,p,t) for Individual Radionuclides (i) and Pathways (p) As mrem/yr and Fraction of Total Dose At t = 9.000E+01 years
Water Dependent Pathways Water Fish Radon Plant Meat Milk All Pathways*
Radio-Nuclide mrem/yr fract. mrem/yr fract. mrem/yr fract. mrem/yr fract. mrem/yr fract. mrem/yr fract.
241 O.OOOE+OO 0.0000 O.OOOE+OO 0.0000 O.OOOE+OO 0.0000 O.OOOE+OO 0.0000 O.OOOE+OO 0.0000 O.OOOE+OO 0.0000 Cs-137 O.OOOE+OO 0.0000 O.OOOE+OO 0.0000 O.OOOE+OO 0.0000 O.OOOE+OO 0.0000 O.OOOE+OO 0.0000 O.OOOE+OO 0.0000 Pu-238 O.OOOE+OO 0.0000 O.OOOE+OO 0.0000 O.OOOE+OO 0.0000 O.OOOE+OO 0.0000 O.OOOE+OO 0.0000 O.OOOE+OO 0.0000 Pu-239 O.OOOE+OO 0.0000 O.OOOE+OO 0.0000 O.OOOE+OO 0.0000 O.OOOE+OO 0.0000 O.OOOE+OO 0.0000 O.OOOE+OO 0.0000 Sr-90 O.OOOE+OO 0.0000 O.OOOE+OO 0.0000 O.OOOE+OO 0.0000 O.OOOE+OO 0.0000 O.OOOE+OO 0.0000 O.OOOE+OO 0.0000 ======= ========= ====== ========= ====== ========= ====== ========= ====== ========= ====== ========= ====== ========= ====== Total O.OOOE+OO 0.0000 O.OOOE+OO 0.0000 O.OOOE+OO 0.0000 O.OOOE+OO 0.0000 O.OOOE+OO 0.0000 O.OOOE+OO 0.0000 *Sum of all water independent and dependent pathways.
mrem/yr
1.478E-01 3.249E-03 7.352E-03 3.316E-01 2.166E-03
4.922E-01
mrem/yr
1.520E-01 3.566E-01 7.416E-03 3.345E-01 2.725E-03
8.532E-01
fract.
0.1732 0.0038 0.0086 0.3887 0.0025
0.5768
fract. Am-
0.1781 0.4180 0.0087 0.3920 0.0032
1.0000
2 :3:! Q) :::J
0' ..... (f.)
~ c: 1\.) ..... I c ..... ..... ~ ~ :<::. w

~ '<: "">
§
11 I
-""' N
~ ""> 0 0 <f 8 ""> 0)
1 RESRAD, Version 6.21 T% Limit= 0.5 year 10/18/2002 07:28 Page 19 Summary : Trail User, Hiker, 140 hrs/yr, 67 mg/hr soil ingestion---21-0011 k mean cone w/r File : TUHME21011kw_remov_500y.RAD
Total Dose Contributions TDOSE(i,p,t) for Individual Radionuclides (i) and Pathways (p) As mrem/yr and Fraction of Total Dose At t = 1.200E+02 years
Water Independent Pathways (Inhalation excludes radon) Ground Inhalation Radon Plant Meat Milk Soil
Radio-Nuclide mrem/yr tract. mrem/yr tract. mrem/yr tract. mrem/yr tract.
Am-241 2.798E-03 0.0042 1.206E-03 0.0018 O.OOOE+OO 0.0000 O.OOOE+OO 0.0000 Cs-137 1.767E-01 0.2659 7.281 E-08 0.0000 O.OOOE+OO 0.0000 O.OOOE+OO 0.0000 Pu-238 4.627E-07 0.0000 4.991E-05 0.0001 O.OOOE+OO 0.0000 O.OOOE+OO 0.0000 Pu-239 4.518E-05 0.0001 2.820E-03 0.0042 O.OOOE+OO 0.0000 O.OOOE+OO 0.0000 Sr-90 2.729E-04 0.0004 6.378E-07 0.0000 O.OOOE+OO 0.0000 O.OOOE+OO 0.0000
mrem/yr tract. mrem/yr tract.
O.OOOE+OO 0.0000 O.OOOE+OO 0.0000 O.OOOE+OO 0.0000 O.OOOE+OO 0.0000 O.OOOE+OO 0.0000 O.OOOE+OO 0.0000 O.OOOE+OO 0.0000 O.OOOE+OO 0.0000 O.OOOE+OO 0.0000 O.OOOE+OO 0.0000
======= ========= ====== ========= ====== ========= ====== ========= ====== ========= ====== ========= ====== ========= ====== Total 1.798E-01 0.2706 4.077E-03 0.0061 O.OOOE+OO 0.0000 O.OOOE+OO 0.0000 O.OOOE+OO 0.0000 O.OOOE+OO 0.0000
Total Dose Contributions TDOSE(i,p,t) for Individual Radionuclides (i) and Pathways (p) As mrem/yr and Fraction of Total Dose At t = 1.200E+02 years
Water Dependent Pathways Water Fish Radon Plant Meat Milk All Pathways*
Radio-Nuclide mrem/yr tract. mrem/yr tract. mrem/yr tract. mrem/yr tract. mrem/yr tract. mrem/yr tract.
-Am-241 O.OOOE+OO 0.0000 O.OOOE+OO 0.0000 O.OOOE+OO 0.0000 O.OOOE+OO 0.0000 O.OOOE+OO 0.0000 O.OOOE+OO 0.0000 Cs-137 O.OOOE+OO 0.0000 O.OOOE+OO 0.0000 O.OOOE+OO 0.0000 O.OOOE+OO 0.0000 O.OOOE+OO 0.0000 O.OOOE+OO 0.0000 Pu-238 O.OOOE+OO 0.0000 O.OOOE+OO 0.0000 O.OOOE+OO 0.0000 O.OOOE+OO 0.0000 O.OOOE+OO 0.0000 O.OOOE+OO 0.0000 Pu-239 O.OOOE+OO 0.0000 O.OOOE+OO 0.0000 O.OOOE+OO 0.0000 O.OOOE+OO 0.0000 O.OOOE+OO 0.0000 O.OOOE+OO 0.0000 Sr-90 O.OOOE+OO 0.0000 O.OOOE+OO 0.0000 O.OOOE+OO 0.0000 O.OOOE+OO 0.0000 O.OOOE+OO 0.0000 O.OOOE+OO 0.0000 ======= ========= ====== ========= ====== ========= ====== ========= ====== ========= ====== ========= ====== ========= ====== Total O.OOOE+OO 0.0000 O.OOOE+OO 0.0000 O.OOOE+OO 0.0000 O.OOOE+OO 0.0000 O.OOOE+OO 0.0000 O.OOOE+OO 0.0000 *Sum of all water independent and dependent pathways.
c:5 s:: ~ ::J
i3' ..... Cl)
~ c: ""> _.. I
mrem/yr tract. 0 _.. _.. 1.408E-01 0.2119 ~ 1.625E-03 0.0024 ::0 5.801 E-03 0.0087 (!)
:<:: 3.313E-01 0.4986 w 1.061 E-03 0.0016
4.806E-01 0.7233
mrem/yr tract. ---1.448E-01 0.2179 1.783E-01 0.2683 5.851 E-03 0.0088 3.342E-01 0.5029 1.334E-03 0.0020
6.645E-01 1.0000
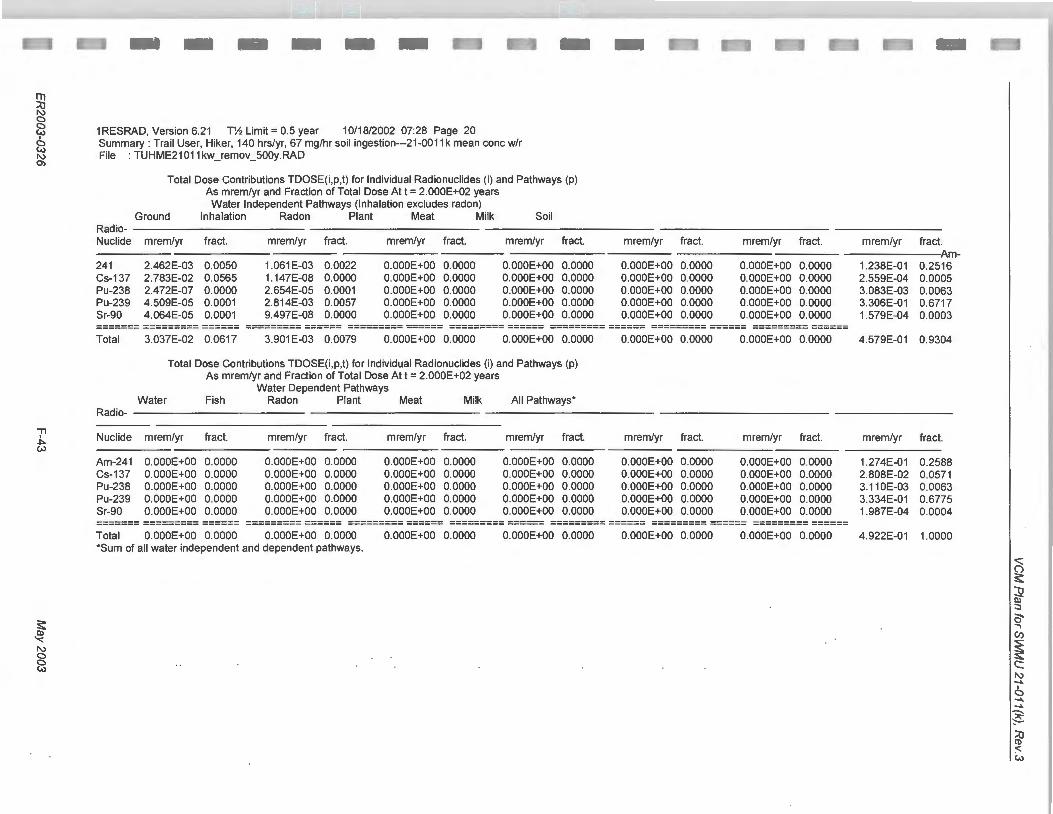
~ 1\.) 0 8 1 RESRAD, Version 6.21 T'h Limit= 0.5 year 10/18/2002 07:28 Page 20 8 Summary : Trail User, Hiker, 140 hrs/yr, 67 mg/hr soil ingestion---21-0011 k mean cone w/r ~ File : TUHME21 011 kw_remov_500y.RAD
Total Dose Contributions TDOSE(i ,p,t) for Individual Radionuclides (i) and Pathways (p) As mrem/yr and Fraction of Total Dose At t = 2.000E+02 years
Water Independent Pathways (Inhalation excludes radon) Ground Inhalation Radon Plant Meat Milk Soil
Radio-Nuclide mrem/yr tract. mrem/yr tract. mrem/yr tract. mrem/yr tract.
-241 2.462E-03 0.0050 1.061 E-03 0.0022 O.OOOE+OO 0.0000 O.OOOE+OO 0.0000 Cs-137 2 .783E-02 0.0565 1.147E-08 0.0000 O.OOOE+OO 0.0000 O.OOOE+OO 0.0000 Pu-238 2.472E-07 0.0000 2 .654E-05 0.0001 O.OOOE+OO 0.0000 O.OOOE+OO 0.0000 Pu-239 4.509E-05 0.0001 2 .814E-03 0.0057 O.OOOE+OO 0.0000 O.OOOE+OO 0.0000 Sr-90 4.064E-05 0.0001 9.497E-08 0.0000 O.OOOE+OO 0.0000 O.OOOE+OO 0.0000
mrem/yr tract. mrem/yr tract. -
O.OOOE+OO 0.0000 O.OOOE+OO 0.0000 O.OOOE+OO 0.0000 O.OOOE+OO 0.0000 O.OOOE+OO 0.0000 O.OOOE+OO 0.0000 O.OOOE+OO 0.0000 O.OOOE+OO 0.0000 O.OOOE+OO 0.0000 O.OOOE+OO 0.0000
======= ========= ====== ========= ====== ========= ====== ========= ====== ========= ====== ========= ====== ========= ======
., ~ (..)
~ "<: 1\.) 0
8
Total 3.037E-02 0.0617 3.901E-03 0.0079 O.OOOE+OO 0.0000 O.OOOE+OO 0.0000 O.OOOE+OO 0.0000 O.OOOE+OO 0.0000
Total Dose Contributions TDOSE(i ,p,t) for Individual Radionuclides (i) and Pathways (p) As mrem/yr and Fraction of Total Dose At t = 2.000E+02 years
Water Dependent Pathways Water Fish Radon Plant Meat Milk All Pathways*
Radio---Nuclide mrem/yr tract. mrem/yr tract. mrem/yr tract. mrem/yr tract. mrem/yr tract. mrem/yr tract.
Am-241 O.OOOE+OO 0.0000 O.OOOE+OO 0.0000 O.OOOE+OO 0.0000 O.OOOE+OO 0.0000 O.OOOE+OO 0.0000 O.OOOE+OO 0.0000 Cs-137 O.OOOE+OO 0.0000 O.OOOE+OO 0.0000 O.OOOE+OO 0.0000 O.OOOE+OO 0.0000 O.OOOE+OO 0.0000 O.OOOE+OO 0.0000 Pu-238 O.OOOE+OO 0.0000 O.OOOE+OO 0.0000 O.OOOE+OO 0.0000 O.OOOE+OO 0.0000 O.OOOE+OO 0.0000 O.OOOE+OO 0.0000 Pu-239 O.OOOE+OO 0.0000 O.OOOE+OO 0.0000 O.OOOE+OO 0.0000 O.OOOE+OO 0.0000 O.OOOE+OO 0.0000 O.OOOE+OO 0.0000 Sr-90 O.OOOE+OO 0.0000 O.OOOE+OO 0.0000 O.OOOE+OO 0.0000 O.OOOE+OO 0.0000 O.OOOE+OO 0.0000 O.OOOE+OO 0.0000 ======= ========= ====== ========= ====== ========= ====== ========= ====== ========= ====== ========= ====== ========= ====== Total O.OOOE+OO 0.0000 O.OOOE+OO 0.0000 O.OOOE+OO 0.0000 O.OOOE+OO 0.0000 O.OOOE+OO 0.0000 O.OOOE+OO 0.0000 *Sum of all water independent and dependent pathways.
mrem/yr
1.238E-01 2.559E-04 3.083E-03 3.306E-01 1.579E-04
4.579E-01
mrem/yr ---1.274E-01 2 .808E-02 3.110E-03 3.334E-01 1.987E-04
4.922E-01
tract. Am-
0.2516 0.0005 0.0063 0.6717 0.0003
0.9304
tract.
0.2588 0.0571 0.0063 0.6775 0.0004
1.0000
~ :!;! Q)
::J
0' ..., (/)
~ c: 1\.) ...... 6 ...... ......
~ ::0 (!)
:" w
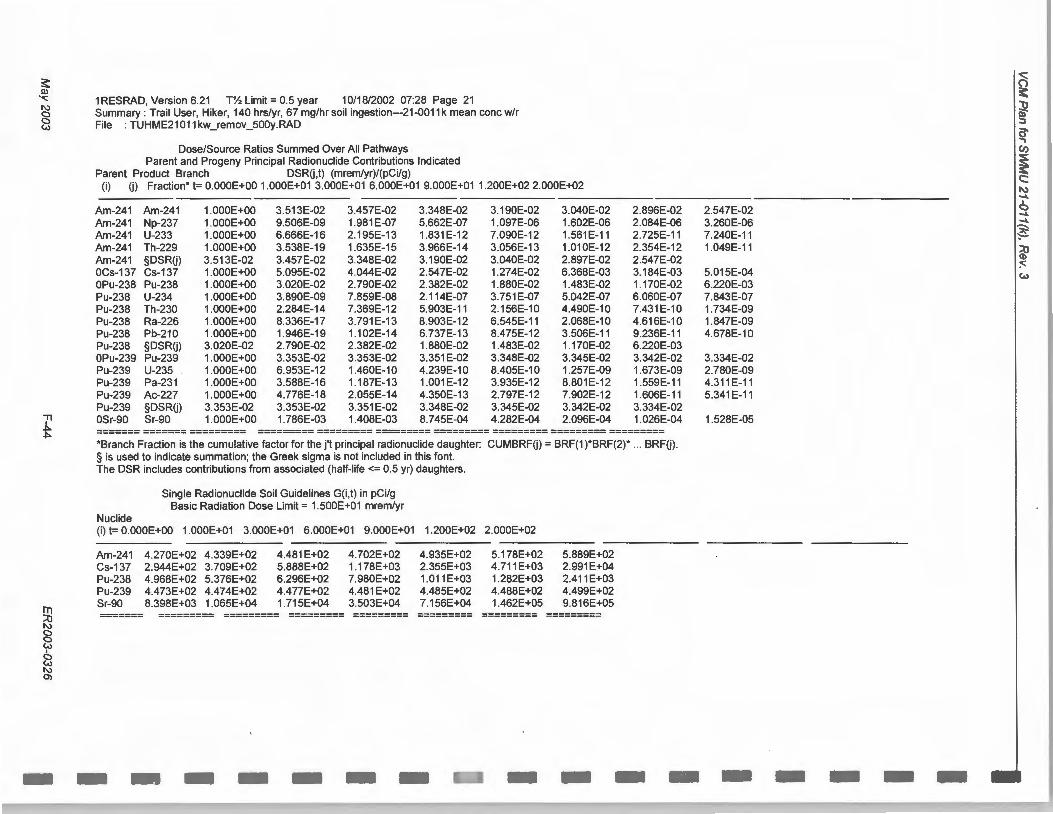
~ 1\) c 8
11 I
-""' -""'
rn ::0 1\) c c w
I c w 1\) Ol
1 RESRAD, Version 6.21 TY:z Limit= 0.5 year 10/18/2002 07:28 Page 21 Summary : Trail User, Hiker, 140 hrs/yr, 67 mg/hr soil ingestion---21-0011 k mean cone w/r File : TUHME21011kw_remov_500y.RAD
Dose/Source Ratios Summed Over All Pathways Parent and Progeny Principal Radionuclide Contributions Indicated
Parent Product Branch DSRO.t) (mrem/yr)/(pCi/g) (i) 0) Fraction* t= O.OOOE+OO 1.000E+01 3.000E+01 6.000E+01 9.000E+01 1.200E+02 2.000E+02
Am-241 Am-241 1.000E+OO 3.513E-02 3.457E-02 3.348E-02 3.190E-02 3.040E-02 Am-241 Np-237 1.000E+OO 9.506E-09 1.981 E-07 5.662E-07 1.097E-06 1.602E-06 Am-241 U-233 1.000E+OO 6.666E-16 2.195E-13 1.831E-12 7.090E-12 1.561 E-11 Am-241 Th-229 1.000E+OO 3.538E-19 1.635E-15 3.966E-14 3.056E-13 1.010E-12 Am-241 §DSRO) 3.513E-02 3.457E-02 3.348E-02 3.190E-02 3.040E-02 2.897E-02 OCs-137 Cs-137 1.000E+OO 5.095E-02 4.044E-02 2.547E-02 1.274E-02 6.368E-03 OPu-238 Pu-238 1.000E+OO 3.020E-02 2.790E-02 2.382E-02 1.880E-02 1.483E-02 Pu-238 U-234 1.000E+OO 3.890E-09 7.859E-08 2.114E-07 3.751E-07 5.042E-07 Pu-238 Th-230 1.000E+OO 2.284E-14 7.369E-12 5.903E-11 2.156E-10 4.490E-10 Pu-238 Ra-226 1.000E+OO 8.336E-17 3.791E-13 8.903E-12 6.545E-11 2.068E-10 Pu-238 Pb-210 1.000E+OO 1.946E-19 1.1 02E-14 6.737E-13 8.475E-12 3.506E-11 Pu-238 §DSRO) 3.020E-02 2.790E-02 2.382E-02 1.880E-02 1.483E-02 1.170E-02 OPu-239 Pu-239 1.000E+OO 3.353E-02 3.353E-02 3.351E-02 3.348E-02 3.345E-02 Pu-239 U-235 . 1.000E+OO 6.953E-12 1.460E-10 4.239E-10 8.405E-10 1.257E-09 Pu-239 Pa-231 1.000E+OO 3.588E-16 1.187E-13 1.001E-12 3.935E-12 8.801 E-12 Pu-239 Ac-227 1.000E+OO 4.776E-18 2.055E-14 4.350E-13 2.797E-12 7.902E-12 Pu-239 §DSRO) 3.353E-02 3.353E-02 3.351E-02 3.348E-02 3.345E-02 3.342E-02 OSr-90 Sr-90 1.000E+OO 1.786E-03 1.408E-03 8.745E-04 4.282E-04 2.096E-04
2.896E-02 2.084E-06 2.725E-11 2.354E-12 2.547E-02 3.184E-03 1.170E-02 6.060E-07 7.431 E-10 4.616E-10 9.236E-11 6.220E-03 3.342E-02 1.673E-09 1.559E-11 1.606E-11 3.334E-02 1.026E-04
======= ======= ========= ========= ========= ========= ========= ========= ========= ========= *Branch Fraction is the cumulative factor for the j't principal radionuclide daughter: CUMBRFO) = BRF(1 )*BRF(2)* ... BRFO). § is used to indicate summation; the Greek sigma is not included in this font. The DSR includes contributions from associated (half-life <= 0.5 yr) daughters.
Single Radionuclide Soil Guidelines G(i ,t) in pCi/g Basic Radiation Dose Limit= 1.500E+01 mrem/yr
Nuclide (i) t= O.OOOE+OO 1.000E+01 3.000E+01 6.000E+01 9.000E+01 1.200E+02 2.000E+02
-Am-241 4.270E+02 4.339E+02 4.481E+02 4.702E+02 4.935E+02 5.178E+02 5.889E+02 Cs-137 2.944E+02 3.709E+02 5.888E+02 1.178E+03 2.355E+03 4.711E+03 2.991E+04 Pu-238 4.968E+02 5.376E+02 6.296E+02 7.980E+02 1.011 E+03 1.282E+03 2.411E+03 Pu-239 4.473E+02 4.474E+02 4.477E+02 4.481E+02 4.485E+02 4.488E+02 4.499E+02 Sr-90 8.398E+03 1.065E+04 1.715E+04 3.503E+04 7.156E+04 1.462E+05 9.816E+05 ======= ========= ========= ========= ========= ========= ========= =========
2.547E-02 3.260E-06 7.240E-11 1.049E-11
5.015E-04 6.220E-03 7.843E-07 1.734E-09 1.847E-09 4.678E-10
3.334E-02 2.780E-09 4.311E-11 5.341E-11
1.528E-05
~ :g Ill ::3
0' ..., (/)
~ c: 1\) ...... I c ......
......
~ ~ :<=:
w

~ 1\,) 0 8 1 RESRAD, Version 6.21 T% Limit= 0.5 year 10/18/2002 07:28 Page 22 8 Summary : Trail User, Hiker, 140 hrs/yr, 67 mg/hr soil ingestion---21-0011k mean cone w/r ~ File : TUHME21011kw_remov_500y.RAD
Tl I
""" 01
~ Q)
'<: 1\,) 0 0 w
Summed Dose/Source Ratios DSR(i ,t) in (mrem/yr)/(pCi/g) and Single Radionuclide Soil Guidelines G(i,t) in pCi/g
at tmin =time of minimum single radionuclide soil guideline and at tmax =time of maximum total dose = O.OOOE+OO years
Nuclide Initial tmin DSR(i,tmin) G(i ,tmin) DSR(i ,tmax) G(i ,tmax)
Am-241 Cs-137 Pu-238 Pu-239 Sr-90
(i) (pCi/g) (years) (pCi/g) (pCi/g)
5.000E+OO 5.600E+01 5.000E-01 1.000E+01 1.300E+01
O.OOOE+OO O.OOOE+OO O.OOOE+OO O.OOOE+OO O.OOOE+OO
3.513E-02 5.095E-02 3.020E-02 3.353E-02 1.786E-03
4.270E+02 2.944E+02 4.968E+02 4.473E+02 8.398E+03
3.513E-02 5.095E-02 3.020E-02 3.353E-02 1.786E-03
4.270E+02 2.944E+02 4.968E+02 4.473E+02 8.398E+03
~ :Q Q) :::s 0' .... (/)
~ c: 1\,) ...... I
0 ...... ...... ~ ~ :" w

s: Ill
'<:: 1\.) c c (,.)
-n .J,.. 0>
~ 1\.) c ~ 2 1\.) 0)
1RESRAD, Version 6.21 TY:z Limit= 0.5 year 10/18/2002 07:28 Page 23 Summary : Trail User, Hiker, 140 hrs/yr, 67 mg/hr soil ingestion---21-0011k mean cone w/r File : TUHME21 011 kw_remov_500y.RAD
Individual Nuclide Dose Summed Over All Pathways Parent Nuclide and Branch Fraction Indicated
ONuclide Parent BRF(i) DOSEQ,t), mrem/yr G) (i) t= O.OOOE+OO 1.000E+01 3.000E+01 6.000E+01 9.000E+01 1.200E+02 2.000E+02
Am-241 Am-241 1.000E+OO 1.757E-01 1.728E-01 1.674E-01 1.595E-01 1.520E-01 1.448E-01 Np-237 Am-241 1.000E+OO 4.753E-08 9.903E-07 2.831E-06 5.483E-06 8.010E-06 1.042E-05 U-233 Am-241 1.000E+OO 3.333E-15 1.097E-12 9.155E-12 3.545E-11 7.807E-11 1.363E-10 Th-229 Am-241 1.000E+OO 1.769E-18 8.176E-15 1.983E-13 1.528E-12 5.050E-12 1.177E-11 Cs-137 Cs-137 1.000E+OO 2.853E+OO 2.264E+OO 1.427E+OO 7.133E-01 3.566E-01 1.783E-01 Pu-238 Pu-238 1.000E+OO 1.510E-02 1.395E-02 1.191 E-02 9.399E-03 7.415E-03 5.851E-03 U-234 Pu-238 1.000E+OO 1.945E-09 3.929E-08 1.057E-07 1.875E-07 2.521E-07 3.030E-07 Th-230 Pu-238 1.000E+OO 1.142E-14 3.685E-12 2.951 E-11 1.078E-10 2.245E-10 3.715E-10 Ra-226 Pu-238 1.000E+OO 4.168E-17 1.896E-13 4.451E-12 3.273E-11 1.034E-10 2.308E-10 Pb-210 Pu-238 1.000E+OO 9.730E-20 5.509E-15 3.368E-13 4.238E-12 1.753E-11 4.618E-11 Pu-239 Pu-239 1.000E+OO 3.353E-01 3.353E-01 3.351 E-01 3.348E-01 3.345E-01 3.342E-01 U-235 Pu-239 1.000E+OO 6.953E-1 1 1.460E-09 4.239E-09 8.405E-09 1.257E-08 1.673E-08 Pa-231 Pu-239 1.000E+OO 3.588E-15 1.187E-12 1.001 E-11 3.935E-11 8.801 E-11 1.559E-1 0 Ac-227 Pu-239 1.000E+OO 4.776E-17 2.055E-13 4.350E-12 2.797E-11 7.902E-11 1.606E-10 Sr-90 Sr-90 1.000E+OO 2.322E-02 1.830E-02 1.137E-02 5.566E-03 2.725E-03 1.334E-03 ======= ======= ========= ========= ========= ========= ========= ========= ========= ========= BRF(i) is the branch fraction of the parent nuclide. § is used to indicate summation; the Greek sigma is not included in this font.
t3 s: ::Q Ill ::::!
0' .., (/)
~ c: 1\.) ...... I
1.273E-01 c ...... 1.630E-05 ......
3.620E-1 0 ~ 5.246E-11 ::0 2.808E-02 (!)
:" 3.110E-03 (,.)
3.921E-07 8.672E-10 9.233E-10 2.339E-1 0 3.334E-01 2.780E-08 4.311E-10 5.341E-10 1.987E-04
-
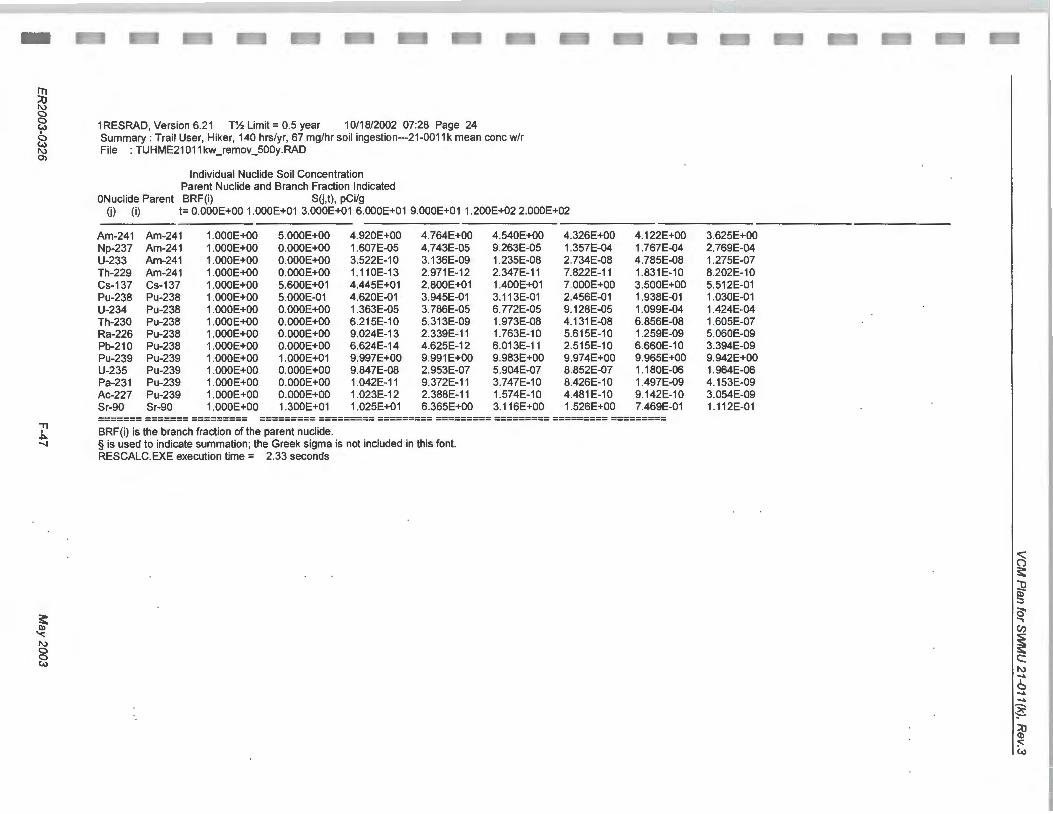
~ c 8 1 RESRAD, Version 6.21 TY. Limit= 0.5 year 10/18/2002 07:28 Page 24 6 Summary : Trail User, Hiker, 140 hrs/yr, 67 mg/hr soil ingestion---21-0011k mean cone w/r ~ File : TUHME21 011 kw remov 500y.RAD ~ - -
Individual Nuclide Soil Concentration Parent Nuclide and Branch Fraction Indicated
ONuclide Parent BRF(i) SU.t), pCi/g U) (i) t= O.OOOE+OO 1.000E+01 3.000E+01 6.000E+01 9.000E+01 1.200E+02 2.000E+02
Am-241 Am-241 1.000E+OO 5.000E+OO 4.920E+OO 4.764E+OO 4.540E+OO 4.326E+OO 4.122E+OO 3.625E+OO Np-237 Am-241 1.000E+OO O.OOOE+OO 1.607E-05 4.743E-05 9.263E-05 1.357E-04 1.767E-04 2.769E-04 U-233 Am-241 1.000E+OO O.OOOE+OO 3.522E-10 3.136E-09 1.235E-08 2.734E-08 4.785E-08 1.275E-07 Th-229 Am-241 1.000E+OO O.OOOE+OO 1.110E-13 2.971E-12 2.347E-11 7.822E-11 1.831E-10 8.202E-10 Cs-137 Cs-137 1.000E+OO 5.600E+01 4.445E+01 2.800E+01 1.400E+01 7.000E+OO 3.500E+OO 5.512E-01 Pu-238 Pu-238 1.000E+OO 5.000E-01 4.620E-01 3.945E-01 3.113E-01 2.456E-01 1.938E-01 1.030E-01 U-234 Pu-238 1.000E+OO O.OOOE+OO 1.363E-05 3.786E-05 6.772E-05 9.128E-05 1.099E-04 1.424E-04 Th-230 Pu-238 1.000E+OO O.OOOE+OO 6.215E-10 5.313E-09 1.973E-08 4.131 E-08 6.856E-08 1.605E-07 Ra-226 Pu-238 1.000E+OO O.OOOE+OO 9.024E-13 2.339E-11 1.763E-10 5.615E-10 1.259E-09 5.060E-09 Pb-210 Pu-238 1.000E+OO O.OOOE+OO 6.624E-14 4.625E-12 6.013E-11 2.515E-10 6.660E-10 3.394E-09 Pu-239 Pu-239 1.000E+OO 1.000E+01 9.997E+OO 9.991E+OO 9.983E+OO 9.974E+OO 9.965E+OO 9.942E+OO U-235 Pu-239 1.000E+OO O.OOOE+OO 9.847E-08 2.953E-07 5.904E-07 8.852E-07 1.180E-06 1.964E-06 Pa-231 Pu-239 1.000E+OO O.OOOE+OO 1.042E-11 9.372E-11 3.747E-10 8.426E-1 0 1.497E-09 4.153E-09 Ac-227 Pu-239 1.000E+OO O.OOOE+OO 1.023E-12 2.388E-11 1.574E-1 0 4.481 E-1 0 9.142E-10 3.054E-09 Sr-90 Sr-90 1.000E+OO 1.300E+01 1.025E+01 6.365E+OO 3.116E+OO 1.526E+OO 7.469E-01 1.112E-01 ======= ======= ========= ========= ========= ========= ========= ========= ========= =========
11 BRF(i) is the branch fraction of the parent nuclide. ' ~
-...! § is used to indicate summation; the Greek sigma is not included in this font. RESCALC.EXE execution time= 2.33 seconds
c:5 ~ :Q Q) ::J
~ 0' ....,
'"'::: (/)
1\.) ~ c c w c: 1\.) ...... ' c ......
......
~ ::0 (1) :;;; w

~ Q)
"' 1\) 0 0 <..>
"'Tl I ~ co
~ 0
~ 2 1\) 0>
3.5
3.0
2.5
~ 2.0 ~ 2! E 1.5
1.0
0.5
0.0
DOSE: All Nuclides Summed, All Pathways Summed
\ \\ \ \
""' \ ~~ "'-
' ~ ~ "' ~ ~ ~ ~
A A ~ ,...,_ ,.... -~ ,.... .....,
~ .....,
0 20 40 60 80 100
Years
120 140
-e- Am-241 ~ Cs-137 -8- Pu-238 -8- Pu-239 -.sv- Sr-90 + Total
TUHM E21011kw_remov_500y.RAD 10/1812002 07:28 Includes All Pathways
160 180 200
· c:5 ~ ::Q Q)
:::J
0' ..... (/)
~ c: 1\) ....... 6 ....... ....... ~ ~
~ :<: <..>
Appendix G
Results of Previous Field Investigations
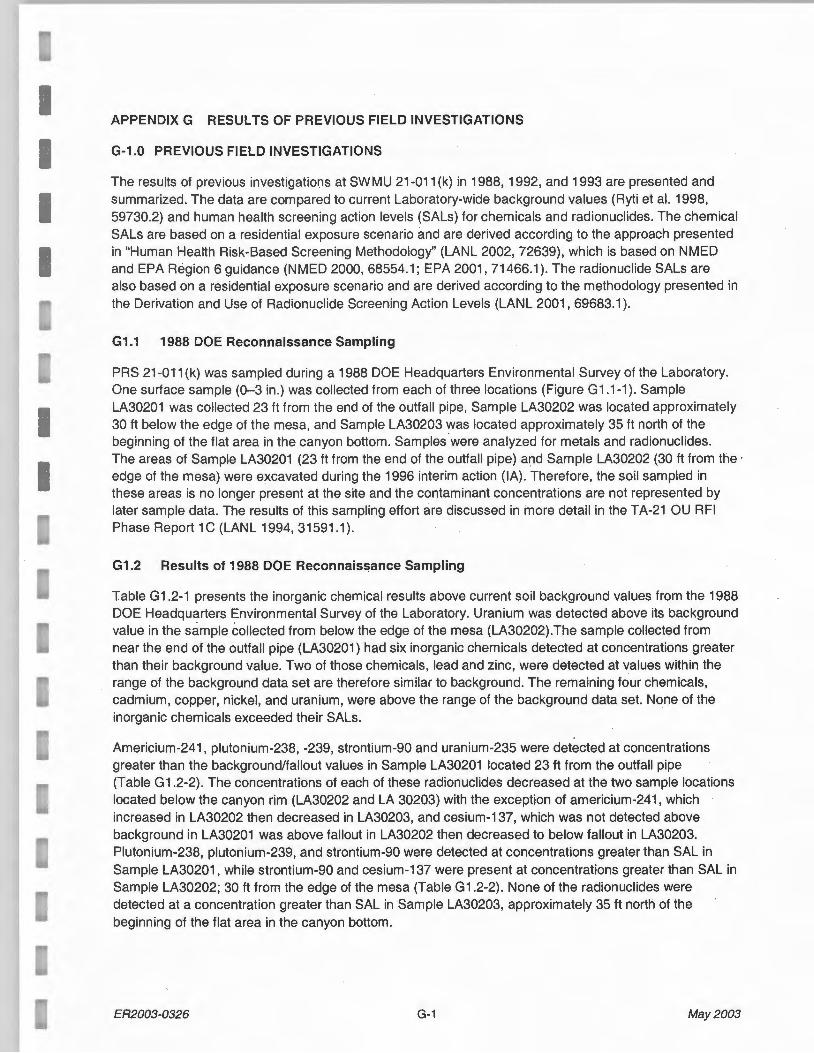
I I
APPENDIX G RESULTS OF PREVIOUS FIELD INVESTIGATIONS
G-1.0 PREVIOUS FIELD INVESTIGATIONS
The results of previous investigations at SWMU 21-011 (k) in 1988, 1992, and 1993 are presented and summarized. The data are compared to current Laboratory-wide background values (Ryti et al. 1998, 59730.2) and human health screening action levels (SALs) for chemicals and radionuclides. The chemical SALs are based on a residential exposure scenario and are derived according to the approach presented in "Human Health Risk-Based Screening Methodology" (LANL 2002, 72639), which is based on NMED and EPA Region 6 guidance (NMED 2000, 68554.1; EPA 2001, 71466.1 ). The radionuclide SALs are also based on a residential exposure scenario and are derived according to the methodology presented in the Derivation and Use of Radionuclide Screening Action Levels (LANL 2001, 69683.1 ).
G1.1 1988 DOE Reconnaissance Sampling
PRS 21-011 (k) was sampled during a 1988 DOE Headquarters Environmental Survey of the Laboratory. One surface sample (0-3 in.) was collected from each of three locations (Figure G1 .1-1 ). Sample LA30201 was collected 23ft from the end of the outfall pipe, Sample LA30202 was located approximately 30 ft below the edge of the mesa, and Sample LA30203 was located approximately 35ft north of the beginning of the flat area in the canyon bottom. Samples were analyzed for metals and radionuclides . The areas of Sample LA30201 (23ft from the end of the outfall pipe) and Sample LA30202 (30ft from the · edge of the mesa) were excavated during the 1996 interim action (lA). Therefore, the soil sampled in these areas is no longer present at the site and the contaminant concentrations are not represented by later sample data. The results of this sampling effort are discussed in more detail in the T A-21 OU RFI Phase Report 1 C (LANL 1994, 31591.1 ).
G1.2 Results of 1988 DOE Reconnaissance Sampling
Table G1.2-1 presents the inorganic chemical results above current soil background values from the 1988 DOE Headquarters Environmental Survey of the Laboratory. Uranium was detected above its background value in the sample collected from below the edge of the mesa (LA30202).The sample collected from near the end of the outfall pipe (LA30201) had six inorganic chemicals detected at concentrations greater than their background value. Two of those chemicals, lead and zinc, were detected at values within the range of the background data set are therefore similar to background. The remaining four chemicals, cadmium, copper, nickel, and uranium, were above the range of the background data set. None of the inorganic chemicals exceeded their SALs.
Americium-241, plutonium-238, -239, strontium-90 and uranium-235 were detected at concentrations greater than the background/fallout values in Sample LA30201 located 23 ft from the outfall pipe (Table G1.2-2). The concentrations of each of these radionuclides decreased at the two sample locations located below the canyon rim (LA30202 and LA 30203) with the exception of americium-241, which increased in LA30202 then decreased in LA30203, and cesium-137, which was not detected above background in LA30201 was above fallout in LA30202 then decreased to below fallout in LA30203. Plutonium-238, plutonium-239, and strontium-90 were detected at concentrations greater than SAL in Sample LA30201, while strontium-90 and cesium-137 were present at concentrations greater than SAL in Sample LA30202; 30ft from the edge of the mesa (Table G1.2-2). None of the radionuclides were detected at a concentration greater than SAL in Sample LA30203, approximately 35 ft north of the beginning of the flat area in the canyon bottom.
ER2003-0326 G-1 May2003

VCM Plan for SWMU 21-011 (k), Rev. 3
Table G1.2-1 Inorganic Chemicals Detected Above Background in 1988 DOE Reconnaissance Samples
Sample Soil Background Sample/Location Interval Sample Value Values Soil SAL
ID Analyte (inches) (mg/kg) (mg/kg) (mg/kg)
LA30201 Cadmium 0-3 24.7 0.4 70
LA30201 Copper 0-3 45.8 14.7 2800
LA30201 Lead Q-3 26.1 22.3 400
LA30201 Nickel Q-3 64.3 15.4 1500
LA30201 Uranium Q-3 8.0 1.82 2301
LA30202 Uranium 0-3 9.0 1.82 230
LA30201 Zinc 0-3 60.5 48.8 23000 1USEPA 4/212002 Region 111 Risk Based Concentration Table (Website: www.EPA.gov/reg3hwmd/risk/index.htm)
Table G1.2-2 Radionuclides Detected Above Background in 1988 DOE Reconnaissance Samples
Sample Interval , Soil Background Sample/Location Depth Sample Value Values Soil SALs
ID Radionuclide (in.) (pCVg) (pCVg) (pCVg)
LA30201 Uranium-235 0-3 1.7 0.2 17
LA30201 Plutonium-238 0-3 105 0.023 49
LA30201 Plutonium-239 0-3 377 0.054 44
LA30201 Americium-241 0-3 1.4 0.013 39
LA30201 Strontium-90 0-3 414 1.31 5.7
LA30202 Uranium-235 0-3 0.21 0.2 17
LA30202 Plutonium-238 Q-3 0.34 0.023 49
LA30202 Plutonium-239 Q-3 1.9 0.054 44
LA30202 Americium-241 Q-3 2.6 O.Q13 39
LA30202 Strontium-90 Q-3 17 1.31 5.7
LA30202 Cesium-137 Q-3 51 .8 1.65 5.3
LA30203 Plutonium-238 Q-3 0.046 0.023 49
LA30203 Plutonium-239 Q-3 0.25 0.054 44
LA30203 Americium-241 Q-3 0.52 0.013 39
May2003 G-2 ER2003-0326
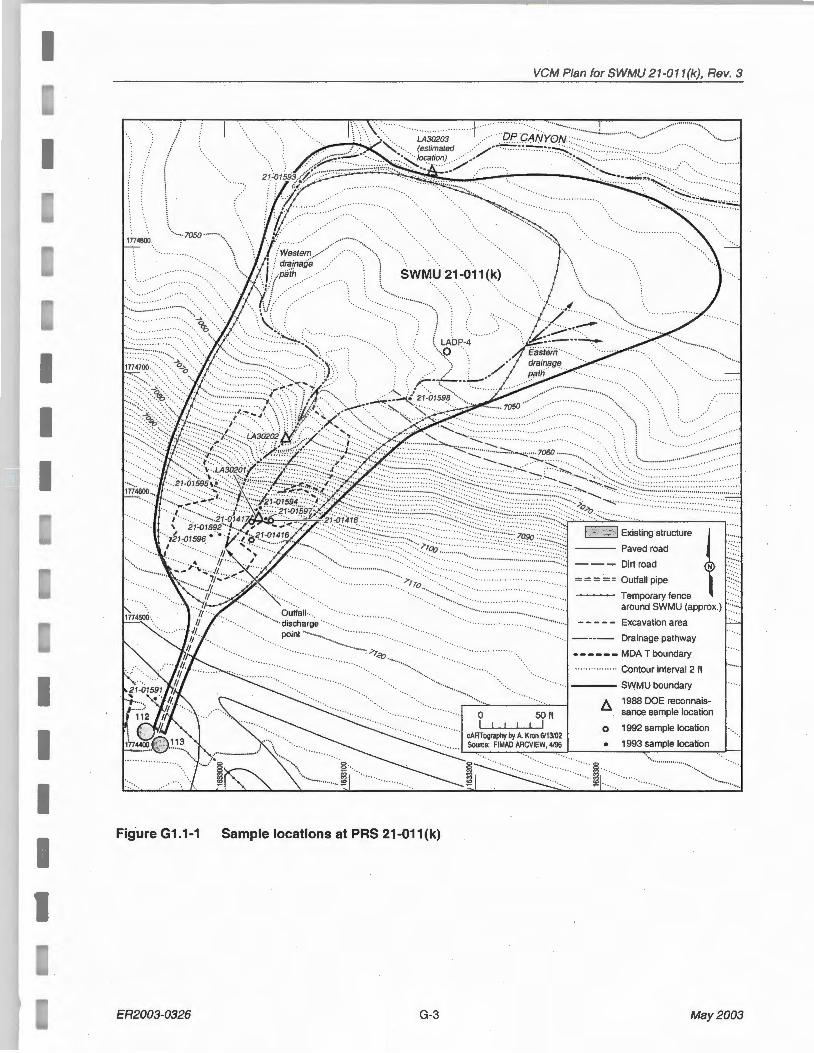
7050·· ···· ··· .. ·· ...
-.:·-.
VCM Plan for SWMU 21 -011(k), Rev. 3
SWMU 21-011(k) ·· ....
· .. ·· ... . ···· ················· '····· ... _·· ·· •..
········ ....
-- -....., ... ········ ... .. ··:::: ·· """::":-: .-:.. __ ,.,.~ • . ····· ...
···:·- : :::·:~:-::-.·.··.· •. ·.•.•.·· --- .. ··. ·· ... ·······:::·.················:.··· ···.· :---.. ,.,_::--~--.. _.:._.::_.·:::::·:············· ·· ···················· ··· ······ . . . . .: . .::. .~ : ····························· ----..... .
. :.:.::.:.: ............... ·:.... ····· .. : ::.... . _:~::_::·::~~-~0 ... ·.· .. ·.· .. ············ .. :~:·: - -::.:::.:::.:::.:::.::.:: . . ... ... ... : ::::::.: ···>::-_:r"-""--'-'--'""---"'"'---------,
••: "•••·•·•·•·•·•• ••••• •••••••:·· ... ?JOo "•••• •••• •••• •~•ou: .. :::·:::~·u~~ -~Do=•·•·•:o.::~~-:::::::~ -=-~-=-=--· ~;~~L~: t ........••.. . .....
.. ...... ···········- ....... . . . •,. •, ..... •· ... ······················
around SWMU {approx.)
Excavation area
---- Drainage pathway
····. ------ MDA T boundary
· · · · · · · ·· · · · · · ·· Contour interval 2 It
·········- .... ---- S.....,MU boundary
I:!. 1988 DOE reconnaissance sample location
0 1992 sample location
• 1993 sample location
·· .................. .
·············•··············· ...
Fig.ure G1.1-1 Sample locations at PRS 21-011 (k)
ER2003-0326 G-3 May2003

VCM Plan for SWMU 21-011(k), Rev. 3
G1.3 1992 RFI Sampling
Characterization of SWMU 21-011 (k) was performed in 1992 as prescribed in the T A-21 Operable Unit RFI Work Plan (LANL 1991, 07528.1 ). The 1992 investigation consisted of a radiological field survey and the collection of soil samples at three locations: 21-01416, 21-01417, and 21-01418 (Figure G 1.1-1 ). One surface sample (0-6 in.) and two near surface samples (6-12 in. and 12-18 in.) were collected at each location except location 21-1416 where refusal was encountered at 5 in. Samples were analyzed for semivolatile organic compounds (SVOCs), metals, and radionuclides. The areas of Sample Locations 21-01416, 21-01417 and 21-01418 were excavated during the 1996 lA. Therefore, the soil sampled in these areas is no longer present at the site and the contaminant concentrations are not represented by later sample data. These data are presented in the Phase Report Addendum 1 B and 1 C Operable Unit 1106, . RCRA Facility Investigation (LANL 1994, 52350.1 ).
G1.4 Results of 1992 RFI Sampling
Tables G1.4-1 (SVOCs), G1.4-2 (inorganic chemicals}, and G1.4-3 (radionuclides) present the results of the 1992 RFI sampling. Two organic chemicals, bis(2-ethylhexyl}phthalate and di-n-butylphthalate, were detected slightly above the estimated quantitation limits (EQLs} and well below their respective SALs at Sample Location 21-01418 (Table G1.4-1). Cadmium, calcium, copper, lead, nickel, silver, thallium, uranium, and zinc were detected above their soil background values or had detected limits above their background values. In addition, lithium .and strontium, which do not have background values, were detected in the soil. None of the inorganic chemicals were detected above their SALs, however, thallium had detection limits slightly above its SAL at all three sample locations The radionuclides americium-241, plutonium-238, plutonium-239, strontium-90, and tritium were detected above their soil background/fallout values. The concentrations for americium-241 (locations 21-01416 and 21-01417), plutonium-239/240 (locations 21-01417 and 21-01418), and strontium-90 (locations 21-01416,-01417, -01418) were detected greater than their respective SALs.
Table G1.4-1 SVOCs Detected in the 1992 RFI Samples
Sample Location Depth Value SAL
ID Sample ID Media (in) Analyte (mg/kg) (mg/kg)
21-01418 AAA0908 Soil 6-12 Bis{2-ethylhexyl)phthalate 0.34 35
21-01418 AAA0909 Soil 0-6 Di-n-butylphthalate 0.6 6100
May2003 G-4 ER2003-0326

I I I I
VCM Plan for SWMU 21-011(k), Rev. 3
Table G1.4-2 Inorganic Analytes Detected Above Background Values in 1992 RFI Samples 1
Sample Location Depth ID ID (tt) Media Cadmium Calcium Copper Lead Lithium Nickel Silver Strontium Thallium Uranium Zinc
Soil Background Value 0.4 6120 14.7 22.3 N/a2 15.4 1 N/a 0.73 1.82 48.8
Soil SAL 70 N/A3 2800 400 1600 1500 380 37000 6.1 2304 23000
AAA0833 21-01416 0-0.42 Soil 52 46000 132.2 50.4 6.92 224.4 20.6 157 7.3 (U) 54.2 196.6
AAA0906 21-01417 0-0.5 Soil 9.6 - 5 34.8 - 6.2 44.4 2.5 (U) 39.2 5.2 (U)
AAA0907 21-01417 0.50-1 .0 Soil 9.8 (U) - - - 5.1 21.4 3.2 (U) 14.2 -
AAA0908 21 -01418 0.00-0.5 Soil 9.8 (U) - - - 6.1 25.1 3.1 .(U) 41 .4 6.4 (U)
AAA0909 21 -01418 0.50-1 .0 Soil 10 (U) - - - 4.9 18.7 3.2 (U) 25.5 6.5 (U)
1AII soil values are in units of mg/kg 2 "N/a" denotes "not available" because these chemicals were not included in the background study
· 3. "N/A" denotes "not applicable" because calcium is an essential nutrient 4USEPA 4/2/2002 Region Ill Risk Based Concentration Table (Website: www.EPA.gov/req3hwmd/risk/index.htm) 5 "- "denotes _a value not exceeding the background value
Table G1.4-3 Radionuclides Detected ~bove Fallout Values in 1992 RFI Sampling
6.9 -
4.5 -
5.3 -
4.3 -
Depth Americium-241 Plutonium-238 Plutonium-239 Strontium-90 Tritium1 Sample ID Location ID (ft) Media (pCi/g) (pCi/g) (pCi/g) (pCi/g) (pCi/g)
Soil FalloutValue 0.013 0.023 0.054 1.31 0.075
Soil SAL 39 49 44 5.7 880
AAA0833 21-01416 0.00-0.42 Soil 2600 2 1800 0.023 -
AAA0906 21-01417 0.00-0.50 Soil 289 - - 600 0.02
AAA0907 21-01417 0.50-1.00 Soil 38 2.2 53 220 0.001
AAA0908 -21-01418 0.00-0.50 Soil 29.8 2 .8 49 170 0.0005
AAA0909 21-01418 0 .50-1 .00 Soil 29.8 0.77 14 180 0.0009 1Tritium soil background value and sample results were converted to pCi/g using an average percent moisture of 9% from the Phase
Report Addendum 1 B and 1 C (LANL 1994, 52350.1) 2
"-" denotes that the radionuclide was not detected.
G1.5 1993 RFI Sampling
Additional characterization of SWMU 21 -011 (k) was conducted in 1993 due to the elevated radionuclide concentrations encountered in the 1992 RFI sampling. The additional sampling included a radiological survey with direct reading instruments to further delineate the extent of contamination and to guide the placement of sampling locations. Eight additional sampling locations (Location IDs 21·01591 through • 1598) (Figure G 1.1-1) were selected based on the radiological survey. The survey extended to the bottom of DP Canyon including small drainage channels leading from the discharge point. Surface samples (0-6 in.) were collected at all eight locations and near-surface samples (6-12 and 12-18 in.) were collected at three locations and analyzed for radionuclides. The results of this sampling effort are also discussed in more detail in the T A-21 Addendum to OU RFI Phase Reports 1 8 and 1 C (LANL 1994, 52350.1)
ER2003-0326 G-5 May2003

VCM Plan for SWMU 21-011 (k), Rev. 3
G1.6 Results of 1993 RFI Sampling
Americium-241, cesium-137, plutonium-238, -239, strontium-90, thorium-228, tritium, uranium-234 and -235 were all detected at levels above background (Table G1 .6-1 ). Of these radionuclides, americium-241, cesium-137, plutonium-239, strontium-90, and thorium-228 exceeded their respective SALs. Americium-241 was only detected above SAL at Sample Location 21-01593, plutonium-239 was detected above SAL at two locations (Location IDs 21-01594 and 21-01597), and thorium-228 was detected once above SAL at Location ID 21-01597. Cesium-137 and strontium-90 were detected above SAL at all1993 sample locations (Location IDs 21-01591 through 21-01598). The soils at Location IDs 21-01592 and 21-01594 through -1597 were excavated during the 1996 lA. Therefore, the soil sampled in these areas is no longer present at the site and the contaminant concentrations are not represented by later sample data.
May2003 G-6 ER2003-0326

i ~ O'l
G)
.!.J
~ §
Table G1.6-1 Radionuclides Detected Above Background/Fanout In The 1993 Rfl Samples1
Sample Location Depth ID 10 {ft) Media Americium-241 Cesium-137 Plutonium-23a Plutonium-239 Strontium-90 Thorium-228 TritiumJ Uranium-234 Uranium-235
Soil Background/Fallout Value 0.013 1.65 0.023 0.054 1.31 2.28 0.075 2.59 0.2
SAL 39 5.3 49 44 5.7 2.0 880 63 17
AAA4009 21-01591 0.00-0.50 Soil 9 42.6 0.86 12.8 8.6 2 0.011 - -
AAA4010 21-01592 0.00-0.50 Soil 12.8 753 0.88 27.6 238 - 0.017 - -AAA4011 21-01593 0.00-0.50 Soil 125.2 81 .3 7.9 21.5 47.5 - 0.019 6.3 0.27
AAA4012 21-01594 0.00-0.50 Soil 28 510 1.8 53.9 174 - 0.059 - -AAA4013 21-01595 0.00-0.50 Soil 0.83 259 0.078 3.2 202 - 0.023 - -
AAA4015 21-01596 0.00-0.50 Soil 5.7 268 0.28 13.8 85.6 - 0.016 - -AAA4016 21-01596 0.50-1.00 Soil 3.8 418 0.23 10.1 245 - 0.08 - -
AAA4017 21-01596 1.00-1.50 Soil 0.84 414 0.065 3.3 178 - 0.041 - -AAA4018 21-01597 0.00-0.50 Soil - 2675 47.8 773 1234 2.4 0.21 4 -AAA4019 21-01597 0.50-1.00 Soil - 3226 19.8 283 1155 - 0.25 2.8 -
AAA4021 21-01597 1.00-1.50 Soil - 1648 32.6 196 431 - 0.55 7.9 0..26
AAA4022 21-01598 0.00-0.50 Soil 3.7 190 1.5 7.8 31 .2 - 0.017 - -
AAA4023 21-01598 0.50-1.00 Soil 1.0 234 0.39 2.9 32.3 - 0.037 - -
AAA4024 21-01598 1.00-1.50 Soil 0.4 32.1 0.098 2.3 21 .7 - 0.021 - -1 All soil values are in units of pCi/g 2"-" denotes a value not exceeding the background/fallout value
3Tritium soil background value and sample results were converted to pCi/g using an average percent moisture of 9% from the Phase Report Addendum 1 Band 1 C (LANL 1994, 52350.1)
~ ~
~ :J
0' ..... (/)
~ c: 1\) ...... 6 ...... ...... ~ :;-;..
~ ~ t.l

VCM Plan for SWMU 21-011(k), Rev. 3
REFERENCES
The following list includes all references cited in this appendix. Parenthetical information following each reference provides the author, publication date, and the ER record identification (ER ID) number. This information also is included in the citations in the text. ER ID numbers are assigned by the Laboratory's ER Project to track records associated with the Project. These numbers can be used to locate copies of the actual documents at the ER Project's Records Processing Facility and, where applicable, with the ER Project reference library titled "Reference Set for Material Disposal Areas, Technical Area 21."
Copies of the reference library are maintained at the New Mexico Environment Department Hazardous Waste Bureau; the Department of Energy Los Alamos Area Office; United States Environmental Protection Agency, Region 6; and the ER Project MDAs Focus Area. This library is a living collection of documents that was developed to ensure that the administrative authority has all the necessary material to review the decisions and actions proposed in this document. However, documents previously submitted to the administrative authority are not included.
EPA (US Environmental Protection Agency), 2001 . "EPA Region 6 Human Health Medium-Specific Screening Levels, US EPA, November 2001. (EPA 2001, 71466.1)
LANL (Los Alamos National Laboratory) 1991, "TA-21 Operable Unit RFI Work Plan for Environmental Restoration," May 1991 . Volume 1 A. Department of Energy Environmental Clean-up Program, Los Alamos National Laboratory report LA-UR-91-962, Los Alamos, New Mexico. (LANL 1991, 07528.1)
LANL (Los Alamos National Laboratory), February 28, 1994. "Phase Report 1 C, T A-21 Operable Unit RCRA Facility Investigation, Outfalls Investigation," Los Alamos National Laboratory report LA-UR-94-228, Los Alamos, New Mexico. (LANL 1994, 31591.1)
LANL (Los Alamos National Laboratory), 1994. "Phase Report Addendum 1 B & 1 C Operable Unit 1106 RCRA Facility Investigation Phase Report," Los Alamos National Laboratory report LA-UR-94-4360, Los Alamos, New Mexico. (LANL 1994, 52350.1)
LANL (Los Alamos National Laboratory), March 2001. "Derivation and Use of Radionuclide Screening Action Levels, LANL Environmental Restoration Project," Los Alamos National Laboratory report LA-UR-01-990, Los Alamos, New Mexico. (LANL 2001, 69683.1)
LANL (Los Alamos National Laboratory), April2002. "Human Health Risk-Based Screening Methodology," Los Alamos National Laboratory report LA-UR-02-1563, Los Alamos, New Mexico. (LANL 2002, 72639)
NMED (New Mexico Environment Department), December 18, 2000. "Technical Background Document for Development of Soil Screening Levels (Volume I Soil Screening Guidance Technical Background Document)," New Mexico Environment Department Hazardous Waste Bureau and Ground Water Quality Bureau Voluntary Remediation Program, Santa Fe, New Mexico. (NMED 2000, 68554.1)
Ryti, R., P. Longmire, D. Broxton, S. Reneau, and E.V. McDonald, September 22, 1998. "Inorganic and Radionuclide Background Data for Soils, Canyon Sediments, and Bandelier Tuff at Los Alamos National Laboratory," Los Alamos National Laboratory report LA-UR-98-4847, Los Alamos, New Mexico. (Ryti et al. 1998, 59730)
ER2003-0326 G-8 May2003
I
I
I

Appendix H
2001 Pre-Excavation Characterization Sampling

APPENDIX H 2001 PRE-EXCAVATION CHARACTERIZATION SAMPLING
Table H-1 presents the summary of the samples collected during the pre-VCM characterization effort performed at SWMU 21-011 (k) in March of 2001 . Eleven sample locations were selected with input from NMED and were based on preliminary results from the in situ gamma spectrometry survey conducted in November 2000.
Table H-1 2001 Waste Characterization Sample Summaries
In Situ Gamma Survey Location Depth Sample ID Date/Time Analytical Suites Sample Type ID ID (ft)
256 (Low) 21- 0-1 256-0 Gross alpha/beta, Gross gamma, Field 11201 Cesium-137, Americium-241 Screening
1-2 MD21-01 - 3/6/01 Perchlorate, Gamma Spec, Discrete 0021 10:05 Isotopic Pluton ium, Sr-90, TAL
Metals, TCLP Metals, TCLP VOCs, TCLP SVOCs, Pesticides,
PCBs, VOCs (Encore), Gross alpha/beta, Gross gamma,
Cesium-137, Americium-241
2-3 256-2 Gross alpha/beta, Gross gamma, Field Cesium-137, Americium-241 Screening
3-4 256-3 Gross alpha/beta, Gross gamma, Field Cesium-137, Americium-241 Screening
4-5 MD21-01 - 3/6/01 Perchlorate, Gamma Spec, Discrete 0023 10:30 Isotopic Plutonium, Sr-90, TAL
Metals, TCLP Metals, TCLP VOCs, TCLP SVOCs, Pesticides,
PCBs, VOCs (Encore) , Gross alpha/beta, Gross gamma,
Cesium-137, Americium-241
0-5 MD21-01 - 3/6/01 9:55 Perchlorate, Gamma Spec, Waste 0024 Isotopic Plutonium, Sr-90, TCLP Composite
Metals, TCLP VOCs, TCLP SVOCs, Pesticides, PCBs, Gross
alpha/beta, Gross gamma, Cesium-137, Americium-241
352 (Mid) 21 - 0-1 MD21-01- 3/6/01 Perchlorate, Gamma Spec, Discrete 11202 0025 11:11 Isotopic Plutonium, Sr-90, TAL
Metals, TCLP Metals, TCLP VOCs, TCLP SVOCs, Pesticides,
PCBs, VOCs(Encore) , Gross alpha/beta, Gross gamma,
Cesium-137, Americium-241
ER2003-0326 H-1 May 2003

VCM Plan for SWMU 21-011(k), Rev. 3
Table H-1 (continued)
In Situ Gamma Location Depth Sample ID Date/Time Analytical Suites Sample ID (ft) Type
Survey ID
1-2 352-1 Gross alpha/beta, Gross gamma, Field Cesium-137, Americium-241 Screening
2-3 352-2 Gross alpha/beta, Gross gamma, Field Cesium-137, Americium-241 Screening
3-4 352-3 Gross alpha/beta, Gross gamma, Field Cesium-137, Americium-241 Screening
4-5 MD21-01 - 3/6/01 12:33 Perchlorate, Gamma Spec, Isotopic Discrete 0022 Plutonium, Sr-90, TAL Metals, TCLP
Metals, TCLP VOCs, TCLP SVOCs, Pesticides, PCBs, VOCs (Encore}, Gross alpha/beta, Gross gamma,
Cesium-137, Americium-241
0-5 MD21-01 - 3/6/01 12:20 Perchlorate, Gamma Spec, Isotopic Waste 0026 Plutonium, Sr-90, TCLP Metals, Composite
TCLP VOCs, TCLP SVOCs, Pesticides, PCBs, Gross alpha/beta,
Gross gamma, Cesium-137, Americium-241
67 (Low) 21-11203 0-1 67-0 Gross alpha/beta, Gross gamma, Field Cesium-137, Americium-241 Screening
1-2 MD21-01- 317/01 9:31 Perchlorate, Gamma Spec, Isotopic Discrete 0027 Plutonium, Sr-90, TAL Metals, TCLP
Metals, TCLP VOCs, TCLP SVOCs, Pesticides, PCBs, VOCs (Encore}, Gross alpha/beta, Gross gamma,
Cesium-137, Americium-241
2-3 67-2 Gross alpha/beta, Gross gamma, Field Cesium-137, Americium-241 Screening
3-4 67-3 Gross alpha/beta, Gross gamma, Field Cesium-137, Americium-241 Screening
4-5 MD21 -01- 3/7/01 9:44 Perchlorate, Gamma Spec, Isotopic Discrete 0029 Plutonium, Sr-90, TAL Metals, TCLP
Metals, TCLP VOCs, TCLP SVOCs, Pesticides, PCBs, VOCs (Encore), Gross alpha/beta, Gross gamma,
Cesium-137, Americium-241
0-5 MD21-01 - 3/7/01 9:36 Perchlorate, Gamma Spec, Isotopic Waste 0028 Plutonium, Sr-90, TCLP Metals, Composite
TCLP VOCs, TCLP SVOCs, Pesticides, PCBs, Gross alpha/beta,
Gross gamma, Cesium-137, Americium-241
331 (Mid) 21-11204 0-1 331-0 Gross alpha/beta, Gross gamma, Field Cesium-137, Americium-241 Screening
May 2003 H-2 ER2003-0326

VCM Plan for SWMU 21-011 (k) , Rev. 3
Table H-1 (continued)
In Situ Gamma Location Depth Sample ID Date/Time Analytical Suites Sample ID (ft) Type
Survey ID
1-2 331-1 Gross alpha/beta, Gross gamma, Field Cesium-137, Americium-241 Screening
2-3 MD21 -01 - 3/7/0110:18 Perchlorate, Gamma Spec, Isotopic Discrete 0030 Plutonium, Sr-90, TAL Metals, TCLP
Metals, TCLP VOCs, TCLP SVOCs, Pesticides, PCBs, VOCs (Encore), Gross alpha/beta, Gross gamma,
Cesium-137, Americium-241
3-4 331-3 Gross alpha/beta, Gross gamma, Field Cesium-137, Americium-241 Screening
4-5 MD21 -01 - 3/7/01 10:27 Perchlorate, Gamma Spec, Isotopic Discrete 0031 Plutonium, Sr-90, TAL Metals, TCLP
Metals, TCLP VOCs, TCLP SVOCs, Pesticides, PCBs, VOCs (Encore), Gross alpha/beta, Gross gamma,
Cesium-137, Americium-241
0-5 MD21-01- 3/7/01 10:23 Perchlorate, Gamma Spec, Isotopic Waste 0032 Plutonium, Sr-90, TCLP Metals, Composite
TCLP VOCs, TCLP SVOCs, Pesticides, PCBs, Gross alpha/beta,
Gross gamma, Cesium-137, Americium-241
122 (Mid) 21 -11205 0-1 122-1 Gross alpha/beta, Gross gamma, Field Cesium-137, Americium-241 Screening
1-2 MD21 -01 - 3/7/01 12:29 Perchlorate, Gamma Spec, Isotopic Discrete 0033 Plutonium, Sr-90, TAL Metals, TCLP
Metals, TCLP VOCs, TCLP SVOCs, Pesticides, PCBs, VOCs (Encore) , Gross alpha/beta, Gross gamma,
Cesium-137, Americium-241
2-3 122-2 Gross alpha/beta, Gross gamma, Field Cesium-137, Americium-241 Screening
3-4 122-3 Gross alpha/beta, Gross gamma, Field Cesium-137, Americium-241 Screening
4-5 MD21-01- 3/7/01 12:57 Perchlorate, Gamma Spec, Isotopic Discrete 0034 Plutonium, Sr-90, TAL Metals, TCLP
Metals, TCLP VOCs, TCLP SVOCs, Pesticides, PCBs, VOCs (Encore), Gross alpha/beta, Gross gamma,
Cesium-137, Americium-241
0-5 MD21 -01- 3/7/0112:38 Perchlorate, Gamma Spec, Isotopic Waste 0035 Plutonium, Sr-90, TCLP Metals, Composite
TCLP VOCs, TCLP SVOCs, Pesticides, PCBs, Gross alpha/beta,
Gross gamma, Cesium-137, Americium-241
ER2003-0326 H-3
May 2003

VCM Plan for SWMU 21-011(k), Rev. 3
Table H-1 (continued)
In Situ Gamma Location Depth Sample ID Date/Time Analytical Suites Sample ID (ft) Type
Survey ID
496 (Mid) 21 -11206 0-1 MD21-01 - 3/8/01 10:30 Perchlorate, Gamma Spec, Isotopic Discrete 0036 Plutonium, Sr-90, TAL Metals, TCLP
Metals, TCLP VOCs, TCLP SVOCs, Pesticides, PCBs, VOCs (Encore), Gross alpha/beta, Gross gamma,
Cesium-137, Americium-241
1-2 496-1 Gross alpha/beta, Gross gamma, Field Cesium-137, Americium-241 Screening
2-3 496-2 Gross alpha/beta, Gross gamma, Field Cesium-137, Americium-241 Screening
3-4 496-3 Gross alpha/beta, Gross gamma, Field Cesium-137, Americium-241 Screening
4-5 MD21-01- 3/8/01 10:52 Perchlorate, Gamma Spec, Isotopic Discrete 0037 Plutonium, Sr-90, TAL Metals, TCLP
Metals, TCLP VOCs, TCLP SVOCs, Pesticides, PCBs, VOCs (Encore), Gross alpha/beta, Gross gamma,
Cesium-137, Americium-241
0-5 MD21-01 - 3/8/01 22:44 Perchlorate, Gamma Spec, Isotopic Waste 0038 Plutonium, Sr-90, TCLP Metals, Composite
TCLP VOCs, TCLP SVOCs, Pesticides, PCBs, Gross alpha/beta,
Gross gamma, Cesium-137, Americium-241
547 (High) 21-11207 0-1 MD21-01 - 3/8/01 11 :41 Perchlorate, Gamma Spec, Isotopic Discrete 0039 Plutonium, Sr-90, TAL Metals, TCLP
Metals, TCLP VOCs, TCLP SVOCs, Pesticides, PCBs, VOCs (Encore) , Gross alpha/beta, Gross gamma,
Cesium-137, Americium-241
1-1 .5 547-1 Gross alpha/beta, Gross gamma, Field Cesium-137, Americium-241 Screening
0-1 .5 MD21 -01 - 3/8/01 11 :41 Perchlorate, Gamma Spec, Isotopic Waste 0040 Plutonium, Sr-90, TCLP Metals, Composite
TCLP VOCs, TCLP SVOCs, Pesticides, PCBs, Gross alpha/beta,
Gross gamma, Cesium-137, Americium-241
554 (High) 21-11208 0-1 554-0 Gross alpha/beta, Gross gamma, Field Cesium-137, Americium-241 Screening
1-2 MD21-01 - 3/8/01 13:09 Perchlorate, Gamma Spec, Isotopic Discrete 0041 Plutonium, Sr-90, TAL Metals, TCLP
Metals, TCLP VOCs, TCLP SVOCs, Pesticides, PCBs, VOCs (Encore), Gross alpha/beta, Gross gamma,
Cesium-137, Americium-241
2-3 554-2 Gross alpha/beta, Gross gamma, Field
May 2003 H-4 ER2003-0326
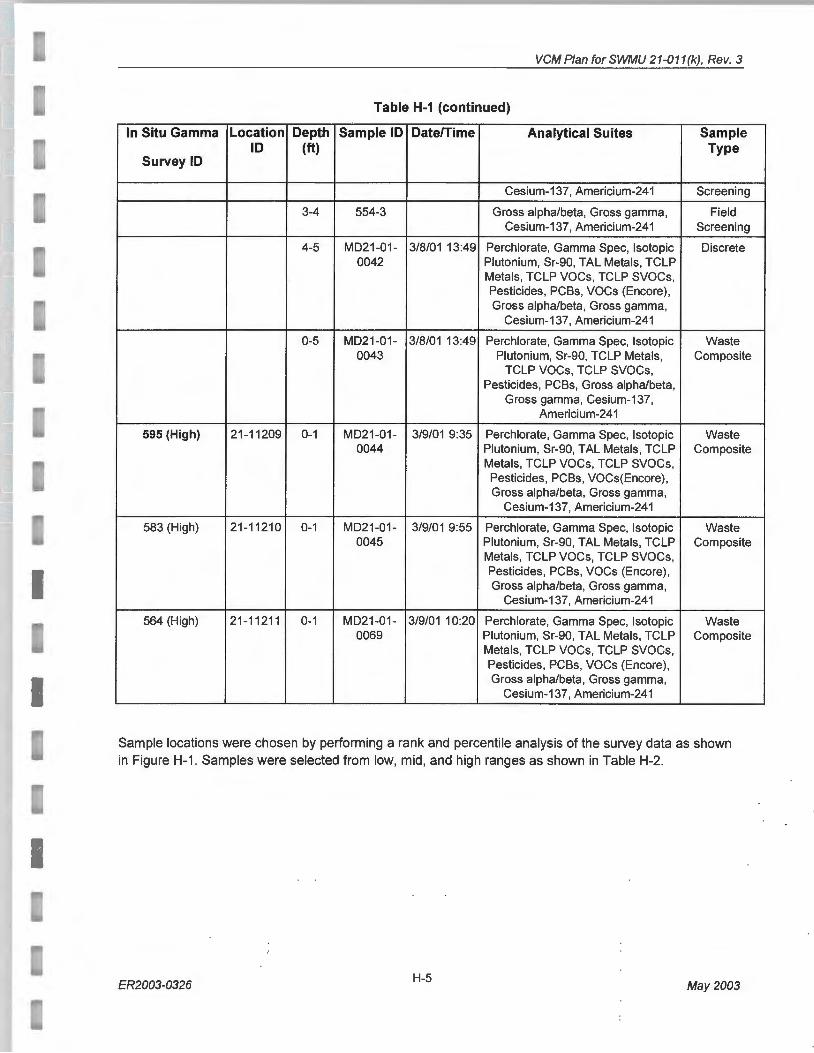
VCM Plan for SWMU 21-011 (k) , Rev. 3
Table H-1 (continued)
In Situ Gamma Location Depth Sample ID Date/Time Analytical Suites Sample ID (ft) Type
Survey ID
Cesium-137, Americium-241 Screening
3-4 554-3 Gross alpha/beta, Gross gamma, Field Cesium-137, Americium-241 Screening
4-5 MD21-01 - 3/8/01 13:49 Perchlorate, Gamma Spec, Isotopic Discrete 0042 Plutonium, Sr-90, TAL Metals, TCLP
Metals, TCLP VOCs, TCLP SVOCs, Pesticides, PCBs, VOCs (Encore}, Gross alpha/beta, Gross gamma,
Cesium-137, Americium-241
0-5 MD21-01 - 3/8/01 13:49 Perchlorate, Gamma Spec, Isotopic Waste 0043 Plutonium, Sr-90, TCLP Metals, Composite
TCLP VOCs, TCLP SVOCs, Pesticides, PCBs, Gross alpha/beta,
Gross gamma, Cesium-137, Americium-241
595 (High) 21 -11209 0-1 MD21-01 - 3/9/01 9:35 Perchlorate, Gamma Spec, Isotopic Waste 0044 Plutonium, Sr-90, TAL Metals, TCLP Composite
Metals, TCLP VOCs, TCLP SVOCs, Pesticides, PCBs, VOCs(Encore) , Gross alpha/beta, Gross gamma,
Cesium-137, Americium-241
583 (High) 21-11210 0-1 MD21-01- 3/9/01 9:55 Perchlorate, Gamma Spec, Isotopic Waste 0045 Plutonium, Sr-90, TAL Metals, TCLP Composite
Metals, TCLP VOCs, TCLP SVOCs, Pesticides, PCBs, VOCs (Encore), Gross alpha/beta, Gross gamma,
Cesium-137, Americium-241
564 (High) 21 -11211 0-1 MD21-01- 3/9/01 10:20 Perchlorate, Gamma Spec, Isotopic Waste 0069 Plutonium, Sr-90, TAL Metals, TCLP Composite
Metals, TCLP VOCs, TCLP SVOCs, Pesticides, PCBs, VOCs (Encore) , Gross alpha/beta, Gross gamma,
Cesium-137, Americium-241
Sample locations were chosen by performing a rank and percentile analysis of the survey data as shown in Figure H-1 . Samples were selected from low, mid, and high ranges as shown in Table H-2.
ER2003-0326 H-5
May 2003
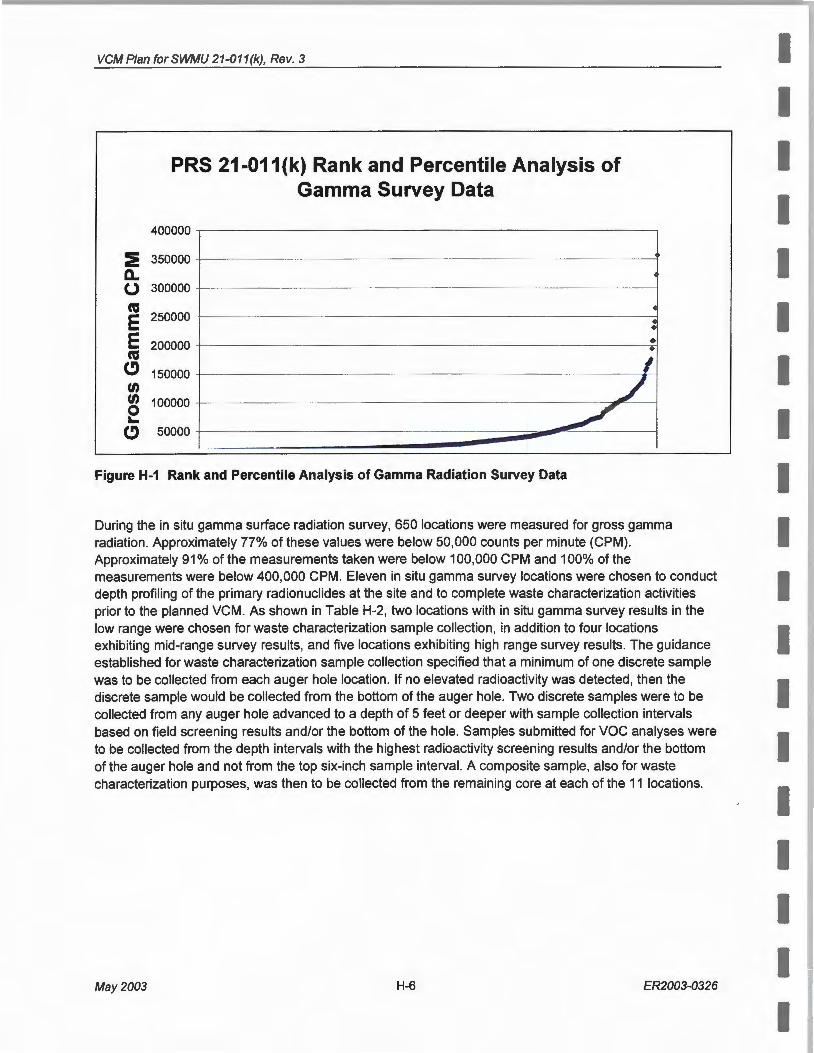
VCM Plan for SWMU 21-011(k), Rev. 3
PRS 21-011 (k) Rank and Percentile Analysis of Gamma Survey Data
400000
:E 350000 Q. 0 300000
ns 250000
~
E : E 200000 • cu •
I C) 150000
"' J "' 100000 0 _....,/' .... C) 50000
Figure H-1 Rank and Percentile Analysis of Gamma Radiation Survey Data
During the in situ gamma surface radiation survey, 650 locations were measured for gross gamma radiation. Approximately 77% of these values were below 50,000 counts per minute (CPM). Approximately 91% of the measurements taken were below 100,000 CPM and 100% of the measurements were below 400,000 CPM. Eleven in situ gamma survey locations were chosen to conduct depth profiling of the primary radionuclides at the site and to complete waste characterization activities prior to the planned VCM. As shown in Table H-2, two locations with in situ gamma survey results in the low range were chosen for waste characterization sample collection, in addition to four locations exhibiting mid-range survey results, and five locations exhibiting high range survey results. The guidance established for waste characterization sample collection specified that a minimum of one discrete sample was to be collected from each auger hole location. If no elevated radioactivity was detected, then the discrete sample would be collected from the bottom of the auger hole. Two discrete samples were to be collected from any auger hole advanced to a depth of 5 feet or deeper with sample collection intervals based on field screening results and/or the bottom of the hole. Samples submitted for VOC analyses were to be collected from the depth intervals with the highest radioactivity screening results and/or the bottom of the auger hole and not from the top six-inch sample interval. A composite sample, also for waste characterization purposes, was then to be collected from the remaining core at each of the 11 locations.
May 2003 H-6 ER2003-0326

VCM Plan forSWMU 21-011(k), Rev. 3
Table H-2 Sample Location Selection Criteria
Survey 10 X_ Coordinate Y _Coordinate Elevation Gross Range CPM
256 1633386.108 1774761 .007 7046.355 31254 Low
67 1633193.959 1774839.47 7049.203 38058 Low
352 1633307.191 1774782.117 7049.189 74364 Mid
331 1633164.585 1774795.306 7050.476 84588 Mid
496 1633172.271 1774695.58 7052.654 91968 Mid
122 1633036.628 1774737.631 7058.224 95970 Mid
547 1633076.448 1774654.923 7067.518 110772 High
554 1633059.719 1774646.382 7072.723 231618 High
583 1633005.769 1774577.311 7114.731 207900 High
595 1632998.255 177 4557.402 7113.792 264990 High
564 1633015.987 1774612.395 7099.214 356502 High
2001 Waste Characterization Discrete Sample Results
The analytical results of the waste characterization sampling for discrete intervals are listed in Tables H-3 through H-6.
Sampleld Soil
Sediment M021.01 -0021
021-01-0023 021.01 -0025
1-o· 021.01
1021-01 M021.01 M021 ·01 M021.01 -0033 M021 -01-0034 M021.01-0036
)21.01-0037 )21.01 -0039
1·01-0041 )21-01 -0042 )21 -01-0044
M021.01 -0045 M021 -01 -0069
Table H-3
Target Analyte List (TAL) for lnorganics Screening against Sediment and Soil Background (Discrete Sample Intervals Only)*
Location ld Depth Interval I Antimony Arsenic Barium Beryllium jCadmlum ·Calcium I Chromium jCobalt ;copper NA NA 29200 0.83 8.17 295 1.83 0.4 6120 19.3 8.64 14. NA NA 15400 0.83 3.98 127 1.31 0.4 4420 10.5 4. 73 11 .2
21·" 12( 0.34 B 2.3 66 0. B 970 4.1 3. 21-11 201 1.28 B 1.3 3C B 520 2 1.5 21-11 202 2.8 86 0. B 1600 i.4 4.3 4. 21-1 1202 1.34 B 2. 1 09: B 180 '.1 ,.5.9• 5 21-11203 0.28 B 2.3 89 1000 4.2 5 '1·' 1203 4400 2.3 1.49 B 8 87( 2.1 3.
21-11204 830 1.62 B 3.8 ).88 130
~ 4 21·' 1204 8100 1.4 B 3.5 h 3 ..... 0.89 190 21-11205 530 1.4 B 2.4 ).69 180 21-1 1205 500 2.1 1.98 76( .4 3 21-11206 0-1 ft 4800 2.4 89 1.55 B 11 B 1700 4.5 3.8 3.9 21-11206 4-S ft 710 0.35 B 2.6 64 1.3 08 8 1500 1 .-~·-· 1. 5.9 21-11207 0-1 ft 7100 0.48 B 1.5 74 •••• 7.9 3.5 6.3 21·1 1208 1-2 ft 350 '.5 32 1.73 1500 4 1. 5.5 21-11208 4-5ft 31 0 1 ~ 1.99 670 3.5 0.8 3.8 ~ 1 -' 1209 0-1 ft 450C 0.38 8 !.8 82 1.56 B 5.9 1 ~ 4.1•· 8.7
21-1 1210 ()..1ft 490 0.39 8 !.6 54 1.55 B 3600 8.8 2. 10 21-1 12 ' 0-1 ft 600 2.1 58 1.53 B 6 2.
Iron 21500 13800
00 5900 8300
00 8600
JO
00 8400 10000 5900 4600 7600 8300 8500
ER2003-0326 H-7
May 2003
Lead 22.3 19." 8. .6.·
8.<
9.8
10 ·.a
4.4 1 ~ 15 16

VCM Plan for SWMU 21-011 (k), Rev. 3
Table H-3 - Continued II
Samp/e/d ~ocation ld Depth Interval I Nickel I Silver ;Sodium 'Vanadium I Zinc Mercury I. Soil NA NA 1.52 1 . 8 0 .
Sediment Background NA NA 0.3 1 0. M021-01-0021 21 -11201 1-2ft 012 8 [I ~i021-01-0023 21-11201 4-5ft .
021-01-0025 21-11202 0-1ft 1.091 8 0.019 8 11202 4-5ft 1400 38Q 6.4 1200 370 18 25 .
13 1-2ft 890 310 5.1 1700 1300 14 22 0.0078 8 13 4-5ft 810 190 3.3 920 . . 610 11 24 0.0064 8
tl 1600 310 7.6 2000 . 1300 28 0.0081 8 )2 0 • • . . .
M021-01-0033 . . 1.18 M021-01-0034 21 · i21 . . M 21-11206 0-1
~ . . 0.0099 8
a 21-11206 4-5ft . . I 0.0079 8 21-11207 0-1ft 2• . .05i 8
1-0 i-0041 21 -11208 1-2ft 560 1200 . 0.16 8 330 '.8 24 1.061 8 21 -11208 4-5ft 410 1_4Q_
• 850 . . 270 5.2
E·~ 21 -11209 0-1 It 1000 330 1500 . . 130 8 13 !1-' 1210 0-1ft 930 240 _1:3()0 . 0.15 8 78 8 11 21 -11211 0-1ft 1500 260 2100 . 0.21 8 190 9.9
Table H-3 - Key
= greater than sediment background value
······=greater than soil background value
= greater than sediment and soil background value
Table H-4 TCLP Metals Analysis Results (Discrete Sample Intervals Only)*
Sampleld Location ld Depth Interval Arsenic Barium Cadmium Chromium Lead MD21..01..0021 21-11201 1-2ft 0.021 B 0.6 B . 0.005 B .
MD21..01..0022 21 -11202 4-5ft 0.019 B 0.6 B - - . MD21..01..0023 21 -11201 4-5ft - 0.49 B - - .
MD21..01..0025 21-11202 0-1 ft . 0.81 B - 0.0099 B -MD21..01-0027 21-11203 1-2ft . 1.5 - 0.034 B 0.026 B MD21..01..0029 21 -11203 4-5ft . 0.72 B - 0.0056 B -MD21..01..0030 21-11204 2-3ft . 0.66 B - - -MD21..01..0031 21 -11204 4-5ft . 0.63 B - 0.0075 B -MD21..()1..()033 21 -11205 1-2ft . 0.52 B - - -MD21..01..0034 21-11205 4-5ft . 0.53 B - - -MD21..01..0036 21 -11206 0-1 ft . 0.64 B . . .
MD21..01..0037 21-11206 4-5ft . 0.57 B - - -MD21..01-0039 21-11207 0-1 ft . 0.48 B . 0.013 B -MD21..01-0041 21-11208 1-2ft . 0.45 B 0.0043 B 0.014 B 0.011 B MD21..01-0042 21-11208 4-5ft - - 0.0031 B - -MD21..01..0044 21 -11209 0-1 ft - 0.87 B 0.0079 B 0.013 B -MD21..01..0045 21 -11210 0-1 ft - 0.82 B 0.012 B - 0.27 MD21..01..0069 21-11211 0-1 ft 0.56 B 0.0052 B - .
*All Units in mg/L
May 2003 H-8 ER2003-0326

VCM Plan for SWMU 21-011 (k), Rev. 3
Table H-5
Organic Detects (Analyte Suites include Pesticides, PCBs, VOCS (Encore), TCLP SVOCs, TCLP VOCs) (Discrete Sample Intervals Only)*
Sampleld Location ld Depth Interval 4,4'-DD~ ug/Kg) Acetone ug/Kg) Methylene chloride ug/Kg) 4-lsopropyltoluene ug/Kg) 2-Hexanone ug/Kg) Trichloroethene mg/L MD21-01-0021 21-11201 1-2ft MD21-01-0023 21-11201 4-5ft MD21-01-0025 21-11202 0-1 ft 0.44 J MD21-01-0022 21-11202 4-5ft 13 J 7.3 0.007 J MD21-01-0027 21-11203 1-2ft -MD21-01-0029 21 -11203 4-5 ft MD21-01-0030 21-11204 2-3ft MD21-01-0031 21-11204 4-5ft MD21-01-0033 21-11205 1-2ft 0.57 J MD21-01-0034 21-1 1205 4-5ft 50 72 26 MD21-01-0036 21-11206 0-1 ft 0.39 J MD21-01-0037 21-11206 4-5ft MD21 -01-0039 21-11207 0-1 ft 7.6 MD21 -01 -0041 21-11208 1-2ft 8.2 MD21-01-0042 21-11208 4-5ft 9.2 MD21-01-0044 21-11209 0-1 ft 0.69 J MD21-01 -0045 21-11210 0-1 ft 0.51 J 26 J MD21-01 -0069 21-1 1211 0-1 ft 0.88J 21 J
Table H-5 - Continued
SamtJ/e ld Location ld Depth Interval 2-Butanone (mg/L) MD21-01-0021 21-11201 1-2ft -MD21-01-0023 21 -11201 4-5ft -MD21-01-0025 21-11202 0-1 ft -MD21-01-0022 21 -11202 4-5ft -MD21-01-0027 21 -11203 1-2ft -MD21-01-0029 21-11203 4-5ft -MD21-01-0030 21-11204 2-3ft 0.031 J MD21-01-0031 21 -11204 4-5ft -MD21-01-0033 21-11205 1-2 ft -MD21-01-0034 21-11205 4-5ft -MD21-01-0036 21 -11206 0-1 ft -MD21-01-0037 21 -11206 4-5ft -MD21-01-0039 21 -11207 0-1 ft -MD21-01-0041 21 -11208 1-2ft -MD21-01-0042 21-11208 4-5ft -MD21-01-0044 21 -11209 0-1 ft -MD21-01-0045 21 -11210 0-1 ft -MD21-01-0069 21-11211 0-1 ft -
ER2003-0326 H-9
May 2003

VCM Plan for SWMU 21-011(k), Rev. 3
Table H-6
2001 Discrete Sample Radionuclide Concentrations Screened against Sediment Background Values
= greater than sediment background value
2001 Waste Characterization Composite Sample Results
The composite waste characterization samples were analyzed for perchlorates, TCLP metals, TCLP VOCs, TCLP SVOCs, pesticides, PCBs, gamma spec (Cs-137 and Am-241), isotopic plutonium, and strontium-90 (Table H-7 and H-8). Only detects are reported. No TCLP VOCS or SVOCs were detected above reporting limits in the composite waste characterization samples.
Table H-7 Composite Waste Samples - TCLP Metals Results
Arsenic Barium Cadmium Chromium Lead Selenium SampleiD Location ld Depth Interval mg!L mg!L mg!L mg!L mg!L mg!L
MD21-01-0024 21-11201 0-5 ft - 0.79 8 - - - -MD21-01-0026 21-11202 0-5 ft - 0.74 8 - 0.0069 8 - -MD21-01-0028 21-11203 0-5 ft 0.019 8 1.2 - 0.036 8 0.033 -MD21-01-0032 21-11204 0-5 ft - 0.65 8 - - - -MD21-01-0035 21-11205 0-5 ft 0.022 8 0.5 8 0.0063 8 - - 0.031 8 MD21-01-0038 21-11206 0-5 ft - 0.68 8 - - - -MD21-01-0040 21-11207 0-1.5ft - 0.61 8 0.009 8 - -MD21-01-0043 21-11208 0-5 ft - 0.27 8 0.006 8 0.0048 8 - -
May 2003 H-10 ER2003-0326

VCM Plan forSWMU 21-011(k), Rev. 3
Table H-8 Composite Waste Samples - Radionuclide Concentrations
Cs-137 Sr-90 Pu-239 Am-241 Pu-238 Sample/D Location ld Depth Interval pCi/g pCi/g pCi/g pCi/g pCilg
MD21-01-0024 21-11201 0-5 ft 1.48 1.1 0.225 - 0.035 MD21-01-0026 21 -11202 0-5 ft 9.3 1.42 0.46 - -
MD21-01-0028 21-11203 0-5ft 3.3 1.46 0.245 - 0.165 MD21-01-0032 21-11204 0-5ft 3.49 2.28 0.374 0.61 0.115 MD21-01-0035 21 -11205 0-5ft 22.5 10.4 13.4 67.8 3.08 MD21-01-0038 21-11206 0-5 ft 6 1.93 0.226 - -MD21-01-0040 21-11207 0-1.5ft 59.5 10.5 3.07 5.1 0.22 MD21-01-0043 21-11208 0-5ft 150 52.8 8.6 28.3 2.18
ER2003-0326 H-11
May 2003

• Sample Location
0 Potential Release Site
-- Structure
-- Contour 100 It
~Paved road
- TABoundry
40-05008
90
Cartography: Miriam Oudejans RRES-OEIM
Map No. R03047-drafl 06-MAY-2003
45 90 Feet
- -

AppendixH
2001 Pre-Excavation Characterization Sampling

APPENDIX H 2001 PRE-EXCAVATION CHARACTERIZATION SAMPLING
Table H-1 presents the summary of the samples collected during the pre-VCM characterization effort performed at SWMU 21-011 (k) in March of 2001 . Eleven sample locations were selected with input from NMED and were based on preliminary results from the in situ gamma spectrometry survey conducted in November 2000.
Table H-1 2001 Waste Characterization Sample Summaries
In Situ Gamma Survey Location Depth Sample ID Date/Time Analytical Suites Sample Type ID ID (ft)
256 (Low) 21- 0-1 256-0 Gross alpha/beta, Gross gamma, Field 11201 Cesium-137, Americium-241 Screening
1-2 MD21-01- 3/6/01 Perchlorate, Gamma Spec, Discrete 0021 10:05 Isotopic Plutonium, Sr-90, TAL
Metals, TCLP Metals, TCLP VOCs, TCLP SVOCs, Pesticides,
PCBs, VOCs (Encore), Gross alpha/beta, Gross gamma,
Cesium-137, Americium-241
2-3 256-2 Gross alpha/beta, Gross gamma, Field Cesium-137, Americium-241 Screening
3-4 256-3 Gross alpha/beta, Gross gamma, Field Cesium-137, Americium-241 Screening
4-5 MD21-01- 3/6/01 Perchlorate, Gamma Spec, Discrete 0023 10:30 Isotopic Plutonium, Sr-90, TAL
Metals, TCLP Metals, TCLP VOCs, TCLP SVOCs, Pesticides,
PCBs, VOCs (Encore), Gross alpha/beta, Gross gamma,
Cesium-137, Americium-241
0-5 MD21-01- 3/6/01 9:55 Perchlorate, Gamma Spec, Waste 0024 Isotopic Plutonium, Sr-90, TCLP Composite
Metals, TCLP VOCs, TCLP SVOCs, Pesticides, PCBs, Gross
alpha/beta, Gross gamma, Cesium-137, Americium-241
352 (Mid) 21- 0-1 MD21-01 - 3/6/01 Perchlorate, Gamma Spec, Discrete 11202 0025 11 :11 Isotopic Plutonium, Sr-90, TAL
Metals, TCLP Metals, TCLP VOCs, TCLP SVOCs, Pesticides,
PCBs, VOCs(Encore) , Gross alpha/beta, Gross gamma,
Cesium-137, Americium-241
ER2003-0326 H-1 May 2003

VCM Plan for SWMU 21-011 (k), Rev. 3
Table H-1 (continued)
In Situ Gamma Location Depth Sample ID Date/Time Analytical Suites Sample ID (ft) Type
Survey ID
1-2 352-1 Gross alpha/beta, Gross gamma, Field Cesium-137, Americium-241 Screening
2-3 352-2 Gross alpha/beta, Gross gamma, Field Cesium-137, Americium-241 Screening
3-4 352-3 Gross alpha/beta, Gross gamma, Field Cesium-137, Americium-241 Screening
4-5 MD21 -01- 3/6/0112:33 Perchlorate, Gamma Spec, Isotopic Discrete 0022 Plutonium, Sr-90, TAL Metals, TCLP
Metals, TCLP VOCs, TCLP SVOCs, Pesticides, PCBs, VOCs (Encore), Gross alpha/beta, Gross gamma,
Cesium-137, Americium-241
0-5 MD21-01 - 3/6/01 12:20 Perchlorate, Gamma Spec, Isotopic Waste 0026 Plutonium, Sr-90, TCLP Metals, Composite
TCLP VOCs, TCLP SVOCs, Pesticides, PCBs, Gross alpha/beta,
Gross gamma, Cesium-137, Americium-241
67 {Low) 21-11203 0-1 67-0 Gross alpha/beta, Gross gamma, Field Cesium-137, Americium-241 Screening
1-2 MD21-01- 3/7/01 9:31 Perchlorate, Gamma Spec, Isotopic Discrete 0027 Plutonium, Sr-90, TAL Metals, TCLP
Metals, TCLP VOCs, TCLP SVOCs, Pesticides, PCBs, VOCs (Encore), Gross alpha/beta, Gross gamma,
Cesium-137, Americium-241
2-3 67-2 Gross alpha/beta, Gross gamma, Field Cesium-137, Americium-241 Screening
3-4 67-3 Gross alpha/beta, Gross gamma, Field Cesium-137, Americium-241 Screening
4-5 MD21-01- 3/7/01 9:44 Perchlorate, Gamma Spec, Isotopic Discrete 0029 Plutonium, Sr-90, TAL Metals, TCLP
Metals, TCLP VOCs, TCLP SVOCs, Pesticides, PCBs, VOCs (Encore), Gross alpha/beta, Gross gamma,
Cesium-137, Americium-241
0-5 MD21-01- 3/7/01 9:36 Perchlorate, Gamma Spec, Isotopic Waste 0028 Plutonium, Sr-90, TCLP Metals, Composite
TCLP VOCs, TCLP SVOCs, Pesticides, PCBs, Gross alpha/beta,
Gross gamma, Cesium-137, Americium-241
331 {Mid) 21-11204 0-1 331-0 Gross alpha/beta, Gross gamma, Field Cesium-137, Americium-241 Screening
May 2003 H-2 ER2003-0326
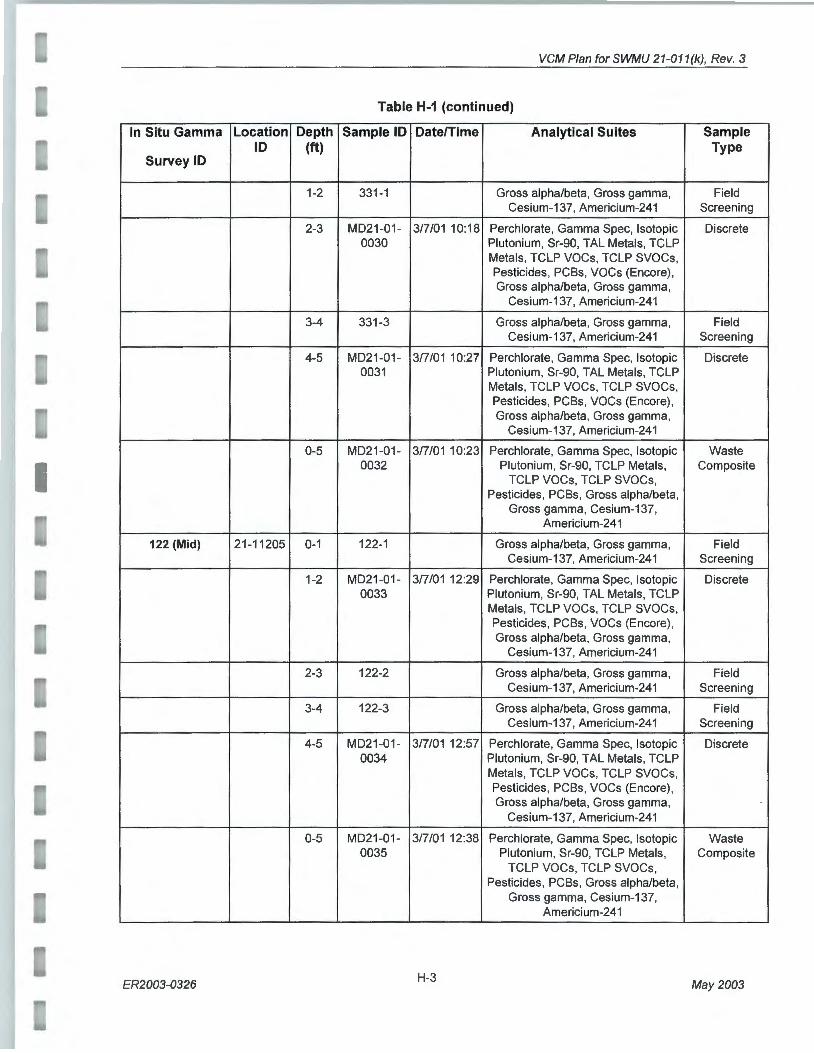
VCM Plan for SWMU 21-011 (k), Rev. 3
Table H-1 (continued)
In Situ Gamma Location Depth Sample ID Date/Time Analytical Suites Sample ID (ft) Type
Survey ID
1-2 331-1 Gross alpha/beta, Gross gamma, Field Cesium-137, Americium-241 Screening
2-3 MD21-01- 3/7/01 10:18 Perchlorate, Gamma Spec, Isotopic Discrete 0030 Plutonium, Sr-90, TAL Metals, TCLP
Metals, TCLP VOCs, TCLP SVOCs, Pesticides, PCBs, VOCs (Encore) , Gross alpha/beta, Gross gamma,
Cesium-137, Americium-241
3-4 331-3 Gross alpha/beta, Gross gamma, Field Cesium-137, Americium-241 Screening
4-5 MD21-01- 3/7/01 10:27 Perchlorate, Gamma Spec, Isotopic Discrete 0031 Plutonium, Sr-90, TAL Metals, TCLP
Metals, TCLP VOCs, TCLP SVOCs, Pesticides, PCBs, VOCs (Encore), Gross alpha/beta, Gross gamma,
Cesium-137, Americium-241
0-5 MD21-01 - 3/7/01 10:23 Perchlorate, Gamma Spec, Isotopic Waste 0032 Plutonium, Sr-90, TCLP Metals, Composite
TCLP VOCs, TCLP SVOCs, Pesticides, PCBs, Gross alpha/beta,
Gross gamma, Cesium-137, Americium-241
122 (Mid) 21-11205 0-1 122-1 Gross alpha/beta, Gross gamma, Field Cesium-137, Americium-241 Screening
1-2 MD21-01- 3/7/0112:29 Perchlorate, Gamma Spec, Isotopic Discrete 0033 Plutonium, Sr-90, TAL Metals, TCLP
Metals, TCLP VOCs, TCLP SVOCs, Pesticides, PCBs, VOCs (Encore) , Gross alpha/beta, Gross gamma,
Cesium-137, Americium-241
2-3 122-2 Gross alpha/beta, Gross gamma, Field Cesium-137, Americium-241 Screening
3-4 122-3 Gross alpha/beta, Gross gamma, Field Cesium-137, Americium-241 Screening
4-5 MD21 -01 - 3/7/01 12:57 Perchlorate, Gamma Spec, Isotopic Discrete 0034 Plutonium, Sr-90, TAL Metals, TCLP
Metals, TCLP VOCs, TCLP SVOCs, Pesticides, PCBs, VOCs (Encore) , Gross alpha/beta, Gross gamma,
Cesium-137, Americium-241
0-5 MD21-01 - 3/7/0112:38 Perchlorate, Gamma Spec, Isotopic Waste 0035 Plutonium, Sr-90, TCLP Metals, Composite
TCLP VOCs, TCLP SVOCs, Pesticides, PCBs, Gross alpha/beta,
Gross gamma, Cesium-137, Americium-241
ER2003-0326 H-3
May 2003

VCM Plan for SWMU 21-011(k), Rev. 3
Table H-1 (continued)
In Situ Gamma Location Depth Sample ID Date/Time Analytical Suites Sample ID (ft) Type
Survey ID
496 (Mid) 21-11206 0-1 MD21 -01- 3/8/01 10:30 Perchlorate, Gamma Spec, Isotopic Discrete 0036 Plutonium, Sr-90, TAL Metals, TCLP
Metals, TCLP VOCs, TCLP SVOCs, Pesticides, PCBs, VOCs (Encore), Gross alpha/beta, Gross gamma,
Cesium-137, Americium-241
1-2 496-1 Gross alpha/beta, Gross gamma, Field Cesium-137, Americium-241 Screening
2-3 496-2 Gross alpha/beta, Gross gamma, Field Cesium-137, Americium-241 Screening
3-4 496-3 Gross alpha/beta, Gross gamma, Field Cesium-137, Americium-241 Screening
4-5 MD21-01- 3/8/01 1 0:52 Perchlorate, Gamma Spec, Isotopic Discrete 0037 Plutonium, Sr-90, TAL Metals, TCLP
Metals, TCLP VOCs, TCLP SVOCs, Pesticides, PCBs, VOCs (Encore) , Gross alpha/beta, Gross gamma,
Cesium-137, Americium-241
0-5 MD21-01- 3/8/01 22:44 Perchlorate, Gamma Spec, Isotopic Waste 0038 Plutonium, Sr-90, TCLP Metals, Composite
TCLP VOCs, TCLP SVOCs, Pesticides, PCBs, Gross alpha/beta,
Gross gamma, Cesium-137, Americium-241
547 (High) 21-11207 0-1 MD21-01 - 3/8/01 11:41 Perchlorate, Gamma Spec, Isotopic Discrete 0039 Plutonium, Sr-90, TAL Metals, TCLP
Metals, TCLP VOCs, TCLP SVOCs, Pesticides, PCBs, VOCs (Encore), Gross alpha/beta, Gross gamma,
Cesium-137, Americium-241
1-1 .5 547-1 Gross alpha/beta, Gross gamma, Field Cesium-137, Americium-241 Screening
0-1 .5 MD21 -01- 3/8/01 11 :41 Perchlorate, Gamma Spec, Isotopic Waste 0040 Plutonium, Sr-90, TCLP Metals, Composite
TCLP VOCs, TCLP SVOCs, Pesticides, PCBs, Gross alpha/beta,
Gross gamma, Cesium-137, Americium-241
554 (High) 21 -11208 0-1 554-0 Gross alpha/beta, Gross gamma, Field Cesium-137, Americium-241 Screening
1-2 MD21-01- 3/8/01 13:09 Perchlorate, Gamma Spec, Isotopic Discrete 0041 Plutonium, Sr-90, TAL Metals, TCLP
Metals, TCLP VOCs, TCLP SVOCs, Pesticides, PCBs, VOCs (Encore), Gross alpha/beta, Gross gamma,
Cesium-137, Americium-241
2-3 554-2 Gross alpha/beta, Gross gamma, Field
May 2003 H-4 ER2003-0326

VCM Plan for SWMU 21-011 (k) , Rev. 3
Table H-1 (continued)
In Situ Gamma Location Depth Sample ID Date/Time Analytical Suites Sample ID (ft) Type
Survey ID
Cesium-137, Americium-241 Screening
3-4 554-3 Gross alpha/beta, Gross gamma, Field Cesium-137, Americium-241 Screening
4-5 MD21-01 - 3/8/01 13:49 Perchlorate, Gamma Spec, Isotopic Discrete 0042 Plutonium, Sr-90, TAL Metals, TCLP
Metals, TCLP VOCs, TCLP SVOCs, Pesticides, PCBs, VOCs (Encore) , Gross alpha/beta, Gross gamma,
Cesium-137, Americium-241
0-5 MD21-01- 3/8/0113:49 Perchlorate, Gamma Spec, Isotopic Waste 0043 Plutonium, Sr-90, TCLP Metals, Composite
TCLP VOCs, TCLP SVOCs, Pesticides, PCBs, Gross alpha/beta,
Gross gamma, Cesium-137, Americium-241
595 (High) 21 -11209 0-1 MD21-01 - 3/9/01 9:35 Perchlorate, Gamma Spec, Isotopic Waste 0044 Plutonium, Sr-90, TAL Metals, TCLP Composite
Metals, TCLP VOCs, TCLP SVOCs, Pesticides, PCBs, VOCs(Encore), Gross alpha/beta, Gross gamma,
Cesium-137, Americium-241
583 (High) 21-11210 0-1 MD21-01 - 3/9/01 9:55 Perchlorate, Gamma Spec, Isotopic Waste 0045 Plutonium, Sr-90, TAL Metals, TCLP Composite
Metals, TCLP VOCs, TCLP SVOCs, Pesticides, PCBs, VOCs (Encore), Gross alpha/beta, Gross gamma,
Cesium-137, Americium-241
564 (High) 21 -11211 0-1 MD21-01- 3/9/01 10:20 Perchlorate, Gamma Spec, Isotopic Waste 0069 Plutonium, Sr-90, TAL Metals, TCLP Composite
Metals, TCLP VOCs, TCLP SVOCs, Pesticides, PCBs, VOCs (Encore), Gross alpha/beta, Gross gamma,
Cesium-137, Americium-241
Sample locations were chosen by performing a rank and percentile analysis of the survey data as shown in Figure H-1 . Samples were selected from low, mid, and high ranges as shown in Table H-2.
ER2003-0326 H-5
May 2003

VCM Plan for SWMU 21-011 (k), Rev. 3
PRS 21-011 (k) Rank and Percentile Analysis of Gamma Survey Data
400000
:E 350000 a. 0 300000
ns 250000
4
E : E 200000 • • ns
I C) 150000 en / en 100000 0 __.,.,/ ~
C) 50000 ...
Figure H-1 Rank and Percentile Analysis of Gamma Radiation Survey Data
During the in situ gamma surface radiation survey, 650 locations were measured for gross gamma radiation. Approximately 77% of these values were below 50,000 counts per minute (CPM). Approximately 91% of the measurements taken were below 100,000 CPM and 100% of the measurements were below 400,000 CPM. Eleven in situ gamma survey locations were chosen to conduct depth profiling of the primary radionuclides at the site and to complete waste characterization activities prior to the planned VCM. As shown in Table H-2, two locations with in situ gamma survey results in the low range were chosen for waste characterization sample collection , in addition to four locations exhibiting mid-range survey results, and five locations exhibiting high range survey results. The guidance established for waste characterization sample collection specified that a minimum of one discrete sample was to be collected from each auger hole location. If no elevated radioactivity was detected, then the discrete sample would be collected from the bottom of the auger hole. Two discrete samples were to be collected from any auger hole advanced to a depth of 5 feet or deeper with sample collection intervals based on field screening results and/or the bottom of the hole. Samples submitted for VOC analyses were to be collected from the depth intervals with the highest radioactivity screening results and/or the bottom of the auger hole and not from the top six-inch sample interval. A composite sample, also for waste characterization purposes, was then to be col lected from the remaining core at each of the 11 locations.
May 2003 H-6 ER2003-0326
I I I I I
I

VCM Plan for SWMU 21-011 (k), Rev. 3
Table H-2 Sample Location Selection Criteria
Survey ID X_ Coordinate Y _Coordinate Elevation Gross Range CPM
256 1633386.1 08 1774761 .007 7046.355 31254 Low
67 1633193.959 1774839.47 7049.203 38058 Low
352 1633307.191 1774782.117 7049.189 74364 Mid
331 1633164.585 1774795.306 7050.476 84588 Mid
496 1633172.271 1774695.58 7052.654 91968 Mid
122 1633036.628 1774737.631 7058.224 95970 Mid
547 1633076.448 1774654.923 7067.518 110772 High
554 1633059.719 177 4646.382 7072.723 231618 High
583 1633005.769 1774577.311 7114.731 207900 High
595 1632998.255 1774557.402 7113.792 264990 High
564 1633015.987 1774612.395 7099.214 356502 High
2001 Waste Characterization Discrete Sample Results
The analytical results of the waste characterization sampling for discrete intervals are listed in Tables H-3 through H-6.
Sample let Soil
Sediment
MD21-01 -0023
Ml Ml
MD21-01 -0031 MD21-01-0033 MD21-01 -0034 MD21-01 -0036
-0037 -0039 -0041 -0042 -0044
MD21-01-0045 MD21-01 -0069
Table H-3
Target Analyte List (TAL) for lnorganics Screening against Sediment and Soil Background (Discrete Sample Intervals Only)*
Location let Depth Interval IAntimonv Arsenic Barium Bervt/lum ;actmium !Calcium ; hromium I Cobalt !Copper lA NA 29200 0.83 8.17 295 1.83 0.4 6120 19.3 8.64 14. lA NA 15400 0.83 3.98 127 1.31 0.4 4420 10.5 4. 73 11.2
!1-' 1-211 380C 0.34 8 2.3 66 1.4i 8 0.11 8 970 6 4.1 3. 21-' 4-5 11 200 0.288 1.3 30 1.29 8 06 8 520 2. 2 1.5 !1 -' 0-1 It 480C 2.8 86 1.56 8 0.13 8 161)0 5.4 4.3 4.7
21-1 4-511 620 0.34 8 2. 1.78 092 8 181 '.1 . 5.$ ! 5 21-1 1-2 It 530 0.28 8 2.3 89 ).62 0. 101)0 5. 4.2 5 !1-' 4-511 440( 1.49 8 0.081 8 8; 4.5 2.1 3.2 21-11204 2-311 830 0.62 8 1.88 14 8 t: lO 8.5
- '89 21-11204 4-5 11 81 0 1.4 8 IJ.'' 1.89 16 8 191)0 8~6 21-1 1205 1-2ft 530 1.4 8 ).69 ).33 1800 5.2 T 4.8 21-11205 4-5ft 500 1.98 1.118 760 6.5 1.4 3.5 21-11206 0-1 It 4800 2.4 89 1.55 8 0.11 B . 1700 4.5 ~8 - 3~ 21-' 1206 4-5ft 71 0 0.35 8 2.6 64 .3 08 8 1500 1. 5.9 21-" 1207 0-1 It 710 0.48 8_ 35 _74
'·' ·'~ '.9 3.5 6.3
!1-" 1208 1-2 - 2.5 32 1500 4 1.6 5.5 21-" 1208 4-5 1; l70 3.5 0.8 8 3.8 21-: 1209 0-1 iOC 0.38 8 2.8 82 - 5.9 l. ll:4ll, B. 21-1121 1 0-1 0.39 8 2.6 54 l600 8.8 2.5 10 21-112" ...<1:1 2.1 58 - _§ 2.3
Iron 21500 13800 7100 590 8300 1 ooc 860 8100 1300C @)_()(:
650 JJ_(JQ_ 840 1000C 5900 460 760 8300 8500
ER2003-0326 H-7 May 2003
Leact 22.3 19. 8.6 .6.4
11 12 8.8 8 12 1:2_ 9.1 7.1
_9,8 7.7
.8 4.4 1L 15 16

VCM Plan for SWMU 21-011(k), Rev. 3
I , Sampleld Location ld Depth Interval Nickel !Selenium !Silver !Sodium !Vanadium IZinc !Mercury
Soil NA NA 461~ 671 15.4 346~ 1.52 1 915 39.6 48.8 0.1 ~
Table H-3- Continued
Sediment NA NA 23< 543 9.38 2690 0.3 1 1470 19.7 60.2 0.1 MD21-01-0021 21-11201 1-2ft 711 300 5. 710 - - 470 12 17 0.012 8 II 1-0'1-0023 21-11201 4-5ft 360 210 2.2 360 - - -
1025 21-11202 0-1 ft 1000 320 5.2 1200 - I 0.091 8 019 8 .1-11202 4-5ft 1400 380 6.4 1200 - -
!O: 19< 10 5.1 D - - 0078 8 3.3 - 0064 8
II '.6 00818 - 18 -MD21-01-0033 5.6 610 10 24 ' 8 MD21-01-0034 6.2 550 7.4 3C MD21-01-0036
* 65 8 13 2Q_ Q.0099 8
~I MD21-01-0037 21-11206 4-5ft 1200 600 9.7 36 0.0079 8 MD21-01 -0039 21 -1120j 0-1ft 2400 000 14 26 0.057 8 MD21 -01-0041 21 -11208 1-2ft 1200 - 0.16 8 330 7.8 24 0.061 8 MD21-01-0042 21-11208 4-5ft _410 140
• 850 - - 270 5.2
~·JI M021-01-0044 21 -11209 0-1 ft 1000 330 1500 - - 130 8 13 MD21-01-0045 21-11210 0-1 ft 930 _24Q_ 1300 - 0.15 8 78 8 11 MD21-01-0069 21 -11211 0-1 ft 1500 260 2100 - 0.21 8 190 9.9
Table H-3 - Key
= greater than sediment background value
······=greater than soil background value
= greater than sediment and soil background value
Table H-4
TCLP Metals Analysis Results (Discrete Sample Intervals Only)* Sampleld Location ld Depth Interval Arsenic Barium Cadmium Chromium Lead MD21-01-0021 21-11201 1-2ft 0.021 B 0.6 B - 0.005 B -MD21-01-0022 21-11202 4-5ft 0.019 B 0.6 B - - -MD21-01-0023 21-11201 4-5ft - 0.49 B - - -MD21-01-0025 21-11202 0-1 ft - 0.81 B - 0.0099 B -MD21-01-0027 21-11203 1-2ft - 1.5 - 0.034 B 0.026 B MD21-01-0029 21-11203 4-5ft - 0.72 B - 0.0056 B -MD21-01-0030 21-11204 2-3ft - 0.66 B - - -MD21-01-0031 21-11204 4-5ft - 0.63 B - 0.0075 B -MD21-01-0033 21 -11205 1-2 ft - 0.52 B - - -MD21-01-0034 21-11205 4-5ft - 0.53 B - - -MD21-01-0036 21-11206 0-1 ft - 0.64 B - - -MD21-01-0037 21-11206 4-5ft - 0.57 B - - -MD21-01-0039 21-11207 0-1 ft - 0.48 B - 0.013 B -MD21-01-0041 21-1 1208 1-2ft - 0.45 B 0.0043 B 0.014 B 0.011 B MD21-01-0042 21-11208 4-5ft - - 0.0031 B - -MD21-01-0044 21-11209 0-1 ft - 0.87 B 0.0079 B 0.013 B -MD21-01-0045 21-11210 0-1 ft - 0.82 B 0.012 B - 0.27 MD21-01-0069 21-11211 0-1 ft 0.56 B 0.0052 B - -
*All Units in mg/L
May 2003 H-8 ER2003-0326

VCM Plan for SWMU 21-011 (k), Rev. 3
Table H-5 Organic Detects (Analyte Suites include Pesticides, PCBs, VOCS (Encore), TCLP SVOCs,
TCLP VOCs) (Discrete Sample Intervals Only)*
Sampleld Location ld Depth Interval 4,4'-DDT, ug/Kg) Acetone ug!Kg) Methylene chloride (ug!Kg) 4-lsopropy/toluene uQ/K.Q) 2-Hexanone ug/Kg) Trichloroethene (mg!L) MD21-01-0021 21-1 1201 1-2ft -MD21-01 -0023 21-1 1201 4-5ft MD21-01 -0025 21-11202 0-1 ft 0.44 J MD21-01 -0022 21-11202 4-5ft 13 J 7.3 0.007 J MD21-01-0027 21-11203 1-2ft MD21-01-0029 21-11203 4-5ft MD21·01-0030 21-11204 2-3ft MD21-01-0031 21-11204 4-5ft MD21-01-0033 21-11205 1-2ft 0.57 J MD21-01 -0034 21-11205 4-5ft - 50 72 26 MD21-01-0036 21-11206 0-1 ft 0.39 J MD21-01 -0037 21-11206 4-5ft MD21-01-0039 21-11207 0-1 ft - 7.6 MD21-01 -0041 21-11208 1-2ft 8.2 MD21-01-0042 21-11208 4-5ft 9.2 MD21-01 -0044 21-11209 0-1 ft 0.69 J MD21-01-0045 21 -11210 0-1 ft 0.51 J 26 J -MD21-01-0069 21-11211 0-1 ft 0.88 J 21 J
Table H-5 - Continued
Sample ld Location ld Depth Interval 2-Butanone (mg!L) MD21-01-0021 21 -11201 1-2 ft -MD21 -01-0023 21-11201 4-5ft -MD21-01-0025 21-11202 0-1 ft -MD21-01-0022 21-11202 4-5ft -MD21-01-0027 21 -11203 1-2ft -MD21-01-0029 21 -11203 4-5ft -MD21-01-0030 21-11204 2-3ft 0.031 J MD21-01-0031 21 -11204 4-5ft -MD21-01-0033 21-11205 1-2ft -MD21-01-0034 21-11205 4-5 ft -MD21-01-0036 21-11206 0-1 ft -MD21 -01-0037 21-11206 4-5ft -MD21-01-0039 21-11207 0-1 ft -MD21-01-0041 21-11208 1-2ft -MD21-01-0042 21-11208 4-5ft -MD21-01-0044 21-11209 0-1 ft -MD21-01-0045 21 -11210 0-1 ft -MD21-01-0069 21-11211 0-1 ft -
ER2003-0326 H-9
May 2003
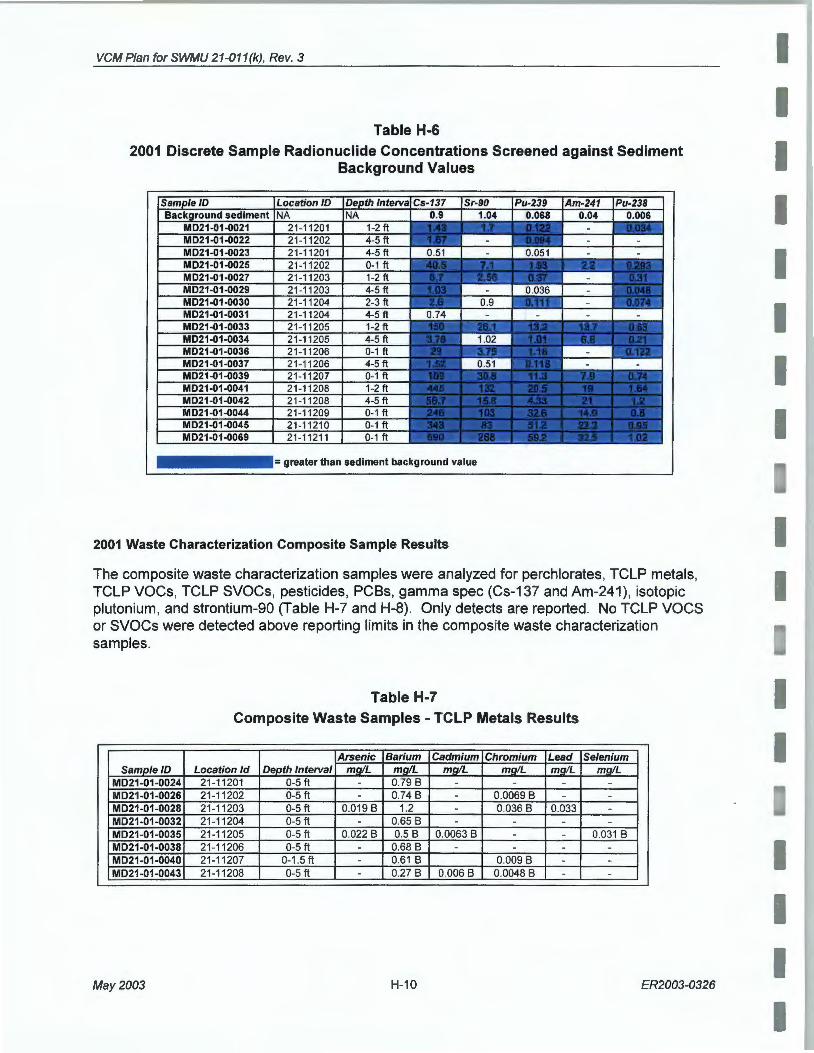
VCM Plan for SWMU 21-011 (k), Rev. 3
Table H-6 2001 Discrete Sample Radionuclide Concentrations Screened against Sediment
Background Values
= greater than sediment background value
2001 Waste Characterization Composite Sample Results
The composite waste characterization samples were analyzed for perchlorates, TCLP metals, TCLP VOCs, TCLP SVOCs, pesticides, PCBs, gamma spec (Cs-137 and Am-241), isotopic plutonium, and strontium-90 (Table H-7 and H-8). Only detects are reported. No TCLP VOCS or SVOCs were detected above reporting limits in the composite waste characterization samples.
Table H-7
Composite Waste Samples - TCLP Metals Results
Arsenic Barium Cadmium Chromium Lead Selenium SampleiD Location ld Depth Interval mg/L mg!L mg/L mg/L mg/L mg!L
MD21-01-0024 21 -11201 0-5 ft - 0.79 B - - - -MD21-01-0026 21 -11202 0-5 ft - 0.74 B - 0.0069 B - -MD21-01-0028 21-11203 0-5 ft 0.019 B 1.2 - 0.036 B 0.033 -MD21-01-0032 21-11204 0-5 ft - 0.65 B - - - -MD21-01-0035 21 -11205 0-5 ft 0.022 B 0.5 B 0.0063 B - - 0.031 B MD21-01-0038 21-11206 0-5 ft - 0.68 B - - - -MD21-01-0040 21-11207 0-1 .5ft - 0.61 B 0.009 B - -MD21-01-0043 21-11208 0-5 ft - 0.27 B 0.006 B 0.0048 B - -
May 2003 H-10 ER2003-0326
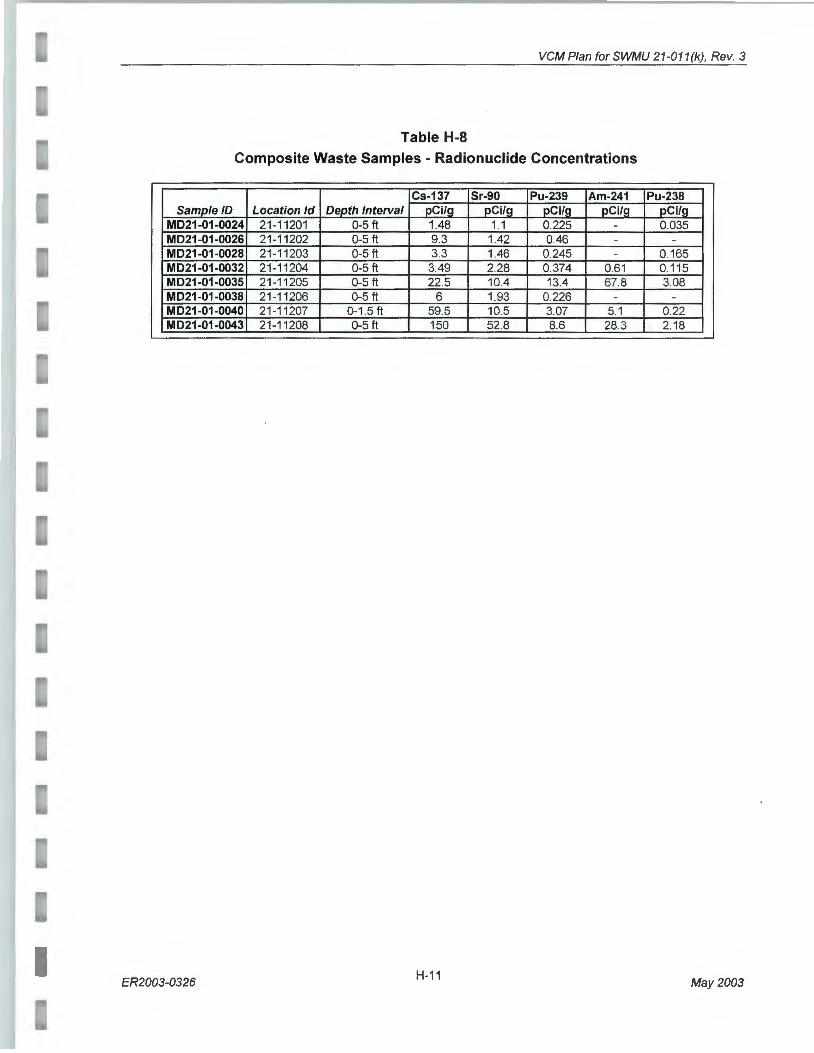
VCM Plan for SWMU 21-011(k), Rev. 3
Table H-8
Composite Waste Samples - Radionuclide Concentrations
Cs-137 Sr-90 Pu-239 Am-241 Pu-238 Sample ID Location ld Depth Interval pCilg pCilg pCilg pCilg pCilg
MD21-01-0024 21-11201 0-5ft 1.48 1.1 0.225 - 0.035 MD21-01-0026 21-11202 0-5ft 9.3 1.42 0.46 - -MD21-01-0028 21-11203 0-5 ft 3.3 1.46 0.245 - 0.165 MD21-01-0032 21-11204 0-5ft 3.49 2.28 0.374 0.61 0.115 MD21-01-0035 21-11205 0-5ft 22.5 10.4 13.4 67.8 3.08 MD21-01-0038 21 -11206 0-5ft 6 1.93 0.226 - -MD21-01-0040 21-11207 0-1 .5ft 59.5 10.5 3.07 5.1 0.22 MD21-01-0043 21-11208 0-5 ft 150 52.8 8.6 28.3 2.18
ER2003-0326 H-11
May 2003
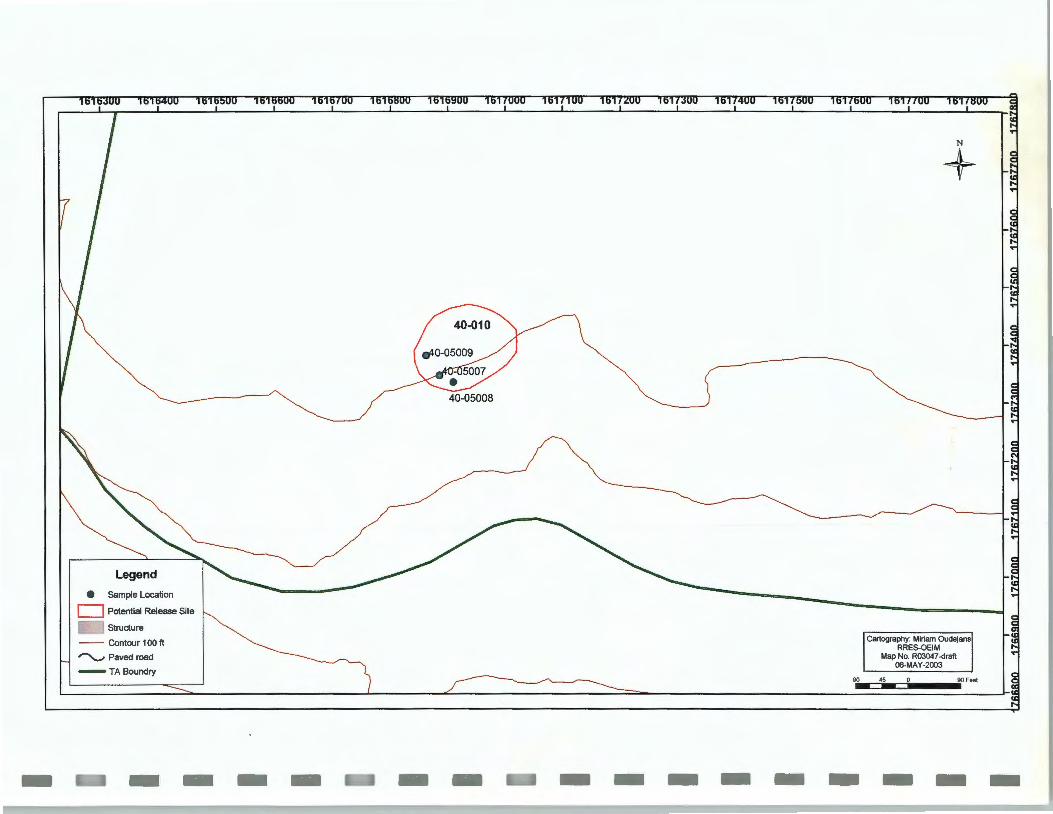
0 Sample Location
D Potential Release Site
-- Structure
-- Contour 100ft
~Paved road
-TABoundry
40-05008
90
cartography: Miriam Oudejans RRES-OEIM
Map No. R03047-draft 06-MAY -2003
•s 90 Feet