Lorne M. Schussel
103
The Best Self Visualization Method: Clinical Implications and Physiological Correlates Lorne M. Schussel Submitted in partial fulfillment of the requirements for the degree of Doctor of Philosophy under the Executive Committee of the Graduate School of Arts and Sciences COLUMBIA UNIVERSITY 2018
Transcript of Lorne M. Schussel

The Best Self Visualization Method: Clinical Implications and Physiological Correlates
Lorne M. Schussel
Submitted in partial fulfillment of the requirements for the degree of
Doctor of Philosophy under the Executive Committee
of the Graduate School of Arts and Sciences
COLUMBIA UNIVERSITY 2018

© 2018 Lorne M. Schussel All rights reserved

ABSTRACT
The Best Self Visualization Method: Clinical Implications and Physiological Correlates
Lorne M. Schussel
The focus of this study was to evaluate the psychological and psychosocial factors of a novel and
composite meditation–visualization practice known as the best self visualization method (BSM).
The researcher adapted and modified the BSM to work within a brief 2-week, two-session
intervention period. The aim of the study was to evaluate the effects on psychopathology (GAD,
PHQ), resilience (PHQ, GAD, Gratitude, Compassion, DSES, Trust, Personal Growth,
Mindfulness, and Social Connection), and bio-physiological changes related to EEG spectral
power, coherence, and heart rate variability (BPM-Coherence). A total of 66 participants were
randomized into active meditation control (n = 35) and BSM (n = 31) intervention groups. Data
analysis revealed significant effects for GAD in favor of BSM psychopathology attenuation (U =
316.5, z = -1.62, p ≤ .05) as well as for the PHQ (U = 321.5, z = -1.54, p = .06). Individual t tests
revealed a much more robust effect. There were no significant differences for the other scales
measured except for interpersonal trust, which had a stronger effect for the BSM group, t(23) = -
1.90, p = .04. For EEG and HRV data, results showed the BSM elicited significant changes in
parietal gamma spectral power (F[2, 15] = 6.34, p = .010), parietal alpha blocking (F[1, 15] =
5.14, p = .039), and heart rate coherence achievement (t[28] = 1.97, p = .03), as well as
demonstrated a heart rate increase trend. Paradoxically, the BSM’s bio-physiological profile was
more “activating” when compared to the control, indicating psychopathology attenuation was not
related necessarily to a relaxation response.

i
Table of Contents
List of Tables ................................................................................................................................. iii
List of Figures ................................................................................................................................. iv
Acknowledgements ........................................................................................................................ vi
Introduction ..................................................................................................................................... 1
Literature Review ............................................................................................................................ 7
Sound Entrainment .................................................................................................................. 10
Best Self in Practice ................................................................................................................. 11
Hypotheses and Research Questions ....................................................................................... 13
Method ........................................................................................................................................... 17
Participants .............................................................................................................................. 17
Instruments .............................................................................................................................. 17
Procedure ................................................................................................................................. 22
Data Analysis and Significance ............................................................................................... 24
Results ........................................................................................................................................... 30
Preliminary Data Analysis ....................................................................................................... 30
Quantitative and Biological Data ............................................................................................ 30
Hypothesis 1: Psychopathology Attenuation ........................................................................... 33
Hypothesis 2: Resilience Scale Increases ................................................................................ 37
Hypothesis 3: Alpha Power Increases ..................................................................................... 38
Hypothesis 4: Alpha Power Group Differences ...................................................................... 41
Hypothesis 5: Theta Power Increase for BSM ........................................................................ 45
Hypothesis 6: Gamma Power Increase for the BSM ............................................................... 49

ii
Hypothesis 7: Inter-Hemispheric Coherence Increases ........................................................... 54
Hypothesis 8: Heart Rate Coherence Increase ........................................................................ 56
Discussion ...................................................................................................................................... 60
Resilience Scales ..................................................................................................................... 60
GAD and PHQ ......................................................................................................................... 62
Alpha Power ............................................................................................................................ 63
Theta Power ............................................................................................................................. 65
Gamma Power ......................................................................................................................... 66
EEG Coherence ....................................................................................................................... 66
Heart Rate Coherence .............................................................................................................. 67
Limitations ............................................................................................................................... 69
Closing Comments .................................................................................................................. 72
References ..................................................................................................................................... 74
Appendix A: Psychological Instruments ....................................................................................... 82
Appendix B: Recruitment Flyer .................................................................................................... 88
Appendix C: Consent Forms ......................................................................................................... 89

iii
List of Tables
1. Independent t Test of Pre-Existing Group Differences ........................................................... 31
2. Comparison of Group Mean Delta and ANCOVA differences for the BSM & Control groups
(GAD, PHQ) ............................................................................................................................ 34
3. Series of Dependent t Tests Evaluating Pretest and Posttest Differences of Scale Data ......... 36
4. Comparison of Group Mean Delta, Pretest and Posttest (Resilience Scales) .......................... 38
5. Normalized Power Dependent t Test for Parietal and Occipital Regions ............................... 39
6. Analysis of Covariance Evaluating Occipital & Parietal Power Group Differences .............. 42
7. Dependent t Tests Evaluating Inter-Hemispheric Connectivity for Occipital & Parietal
Regions .................................................................................................................................... 55
8. Independent t Tests Evaluating Group Difference Pretest–Posttest Delta .............................. 55
9. Dependent t Test Evaluating Pretest During & Pretest–Posttest Changes for Heart Rate
Coherence ................................................................................................................................ 58
10. Independent t Test of Group Differences for Heart Rate Coherence Gain Scores .................. 59

iv
List of Figures
Figure 1. Comparison of pretest–posttest delta for the PHQ and GAD. ...................................... 35
Figure 2. Pretest–posttest power changes for all values (occipital-parietal regions). .................. 40
Figure 3. Gain score for normalized power (occipital and parietal region). ................................ 40
Figure 4. Full spectrum pre–post EEG power values for control and BSM. ................................ 41
Figure 5. Gain score comparison: Occipital and parietal alpha. ................................................... 43
Figure 6. Full spectrum interpolated 2d brain representation for alpha power. ........................... 43
Figure 7. Pretest–posttest changes parietal alpha power (control). .............................................. 44
Figure 8. Pretest–posttest changes parietal alpha power (BSM). ................................................. 44
Figure 9. Pretest–posttest changes occipital alpha power (control). ............................................ 45
Figure 10. Pretest–posttest changes occipital alpha power (BSM). ............................................. 45
Figure 11. Gain score occipital and parietal theta (BSM and control). ........................................ 47
Figure 12. Full spectrum interpolated 2d brain representation for theta power. .......................... 47
Figure 13. Pretest–posttest change occipital theta power (control). ............................................. 48
Figure 14. Pretest–posttest change occipital theta power (BSM). ................................................ 48
Figure 15. Pretest–posttest change parietal theta power (control). ............................................... 49
Figure 16. Pretest–posttest change parietal theta power (BSM). ................................................. 49
Figure 17. Gain score occipital and parietal gamma (BSM and control). .................................... 51
Figure 18. Full spectrum interpolated 2d brain representation for gamma. ................................. 51
Figure 19. Pretest–posttest changes parietal gamma power (BSM). ............................................ 52
Figure 20. Pretest–posttest changes parietal gamma power (control). ......................................... 52
Figure 21. Pretest–posttest changes occipital gamma power (control). ....................................... 53
Figure 22. Pretest–posttest changes occipital gamma power (BSM). ......................................... 53

v
Figure 23. Pretest–posttest coherence changes for parietal region (P7, P8). ................................ 56
Figure 24. Pretest–posttest coherence changes for occipital region (O1, O2). ............................ 56
Figure 25. Pretest–posttest changes for heart rate (BPM). ........................................................... 68

vi
Acknowledgements
I would like to thank all of the people who believed in my study and contributed with
their unique expertise. I offer a special thanks to my mentor, Dr. Lisa Miller, who has inspired
me with her innovative work and believed in both the project and myself.
Another important thanks to my clinical mentor, Dr. Gary Weaver, who took me into the
wilderness of Utah with at-risk youth and helped me explore my own healing gifts. Gary
encouraged me to create a visualization technique that was based on the deepest of my own
experiences.
I offer much appreciation and thanks to the late Dr. Craig Tenke, who also believed in the
project and supported me with his clinical expertise in EEG methods. More gratitude to Dr.
Charles Kinzer for supporting the neurofeedback aspect of the study by lending an additional
neurofeedback device to the lab. Additional thanks to the experts who helped with some of the
additional statistical analysis questions: Dr. Alessandri & Enrico Perinelli from the University of
Rome.
I would also like to thank dearly my committee chair, Dr. Lena Verdeli, Dr. Lisa Miller as
sponsor, and Dr. Ueli Rutishauser who so generously offered his expertise within EEG
quantitative methods to further support the study. Also, the RAs who helped with the project:
Shafi Aktar, Jorge Alvarez, and Michael Lau. I would also like to thank my wife for her loving
support, and my two small doggies, Leika and Swatchy, for their canine therapy contribution.

1
Introduction
Mindfulness, meditation, and visualization practice have garnered increasing public
support and have been widely studied as adjunct clinical modalities over the last 50 years. Such
practices have become increasingly pervasive in both clinical and nonclinical settings and, to
date, at least 1,000 scientific publications have been produced in these areas. These studies have
illustrated varied physiological and psychological effects across many different domains,
including decreases in blood pressure, pain, anxiety, depression, insomnia, and symptoms of
psychopathology (Chiesa & Serretti, 2010; Coelho, Canter, & Ernst, 2013; Grossman, Niemann,
Schmidt, & Walach, 2004; Jain et al., 2007; Lutz, Greischar, Rawlings, Ricard, & Davidson,
2004; Montgomery, DuHamel, & Redd, 2000; Ospina et al., 2007). Mindfulness-based practices
involve many different modalities and include techniques such as mindfulness based stress
reduction (MBSR), mindfulness based cognitive therapy (MBCT), dialectical behavior therapy
(DBT), mindfulness based release prevention (MBRP), Zen Buddhist meditation, transcendental
meditation, progressive muscle relaxation, relaxation response (RR), loving-kindness meditation
(metta), Saja Yoga, Kriya Yoga, qigong, positive visualization, and clinical hypnosis, among
others (Delmonte, 1985; Ospina et al., 2007; Walsh & Shapiro, 2006).
Many of these practices vary widely in their style and implementation and have distinctly
different features. Mindfulness is perhaps the most widely studied of the above techniques and
was defined by Bishop et al. (2004) as “observing and attending to the changing field of
thoughts, feelings, and sensations from moment to moment—by regulating the focus of
attention” (p. 232). Mindfulness has been studied as both a clinical modality and an adjunct
therapeutic technique. Its benefits have been summarized across several meta-analyses, with
results indicating a reduction in anxiety and improvement in mood (Coelho et al., 2013;

2
Grossman et al., 2004). However, despite the public trend to equate mindfulness and meditation
techniques, the components of mindfulness practice are distinctly different from those used in
other meditation, yoga, and mind–body practices. Mindfulness is a state of momentary
awareness of breath, whereas yogic breathing practices employ a breath focus that relies on the
qualitative aspects of breathing itself, such as timing, retention, and exaltation coupled with
unique yogic postures or mudras that rely on distinctly different physiological mechanisms.
Furthermore, practices such as Transcendental Mediation employ a different cognitive focus
altogether, requiring the internal recitation of a specific Vedic phrase or mantra.
To rectify the distinct operational differences among the different practices despite
nominal confusion, Walsh and Shapiro (2006) classified meditation practices as a “family of
self-regulation practices that aim to bring mental processes under voluntary control through
focusing attention and awareness” (p. 64). However, because of the divergent features of many
of these different modalities, it is still difficult to classify them under an organized taxonomy.
Ospina et al. (2007) suggested these self regulation practices could be broadly organized based
on their phenomenological qualities related to the goals of practice:
(Therapeutic or spiritual), the direction of the attention (mindfulness, concentrative, and
practices that shift between the field or background perception and experience and an
object within the field), the kind of anchor employed (a word, breath, sound, object or
sensation, and posture). (p. 10)
However, even this definition has limitations in that it does not address the use of
imagery/visualization, depth of breathing, and many other factors that can influence self-
regulation. Furthermore, there has been limited delineation between the different
meditation/mindfulness components and each of their respective clinical benefits, especially

3
when certain components can be used to potentiate effects for specific populations. For example,
adding a positive visualization component to a deep meditation or deeply relaxed state could
enhance the effects of the visualization as a result of the ability to alter declarative memories
during theta brain waves. Furthermore:
Hypnagogic imagery has been shown to be more effective at stimulating the part of the
brain related to pain compared with normal imagined activity, suggesting imagery in a
hypnogogic or meditatively relaxed state may be more powerful than imagined activity
alone. (Schussel & Miller, 2013, p. 838)
Combining a positive visualization practice with deep breathing could enhance the
clinical effects of a number of different mediation practices, such as those that employ some
form of positive visualization, like loving-kindness meditation. Loving-kindness (metta in
Sanskrit) is traditionally a Buddhist practice that consists of “employing the imagining or actual
experience of the emotional state as an object of attention and mindful awareness” (p. 1128). It
can involve imagining and contemplating the spreading of loving-kindness to successively
broader groups of individuals. The technique has yielded positive clinical results, though there is
a lack of evidence on combining loving-kindness as a composite practice or experimentally
checking the manipulation as related to the degree of relaxation (Fredrickson & Cohn, 2008;
Hoffmann, Grossman, & Hinton, 2011; Hutcherson, Seppala, & Gross, 2008).
Furthermore, there are methodological issues related to creating a consistent operational
definition of mindfulness and meditation across the compendium of research (Davidson &
Kaszniak, 2015; Shapiro, de Sousa, & Hauck, 2016). These limitations, as well as the rapidly
growing interest in mindfulness by the public, warrant further study, especially as related to
comparative studies evaluating multiple practices and individual composite practices. The

4
primary aim of the current study was to investigate the clinical implications of the best self
visualization method (BSM), a novel and composite mediation and visualization practice that
uses several techniques from the multiple modalities mentioned above. The BSM was created in
2011 and was first used with homeless youth in a transitional living program in the Midtown area
of New York City; it was used successfully as an adjunct to a 16-week interpersonal therapy
(IPT) model centered around resolving interpersonal conflicts, overcoming severe trauma, and
navigating difficult life transitions. The results of the initial clinical study, which was a
feasibility pilot study used to examine IPT and the BSM with homeless youth, yielded very
strong qualitative results as evidenced by clinical interviews as well as psychological instruments
indicating significant attenuation of psychopathology (Schussel & Miller, 2013). The technique
was adapted to global conflict resolution and used with large audiences at several events
associated with the United Nations (Schussel, 2015). It was also included as part of a curriculum
for mental health and resilience at North Shore-LIJ Hospital. The curriculum was part of a larger
clinical trial for trauma in the Long Beach School district related to Hurricane Sandy. The
current study was designed to investigate whether any meaningful psychological and
physiological changes resulted from the intervention.
The BSM consists of multiple components: sound entrainment (with Tibetan singing
Bowl), Pranayama or deep breathing, visualization of a “best self,” reception of loving-kindness
from one’s best self to the present self, and sending and receiving loving-kindness to other group
members. The BSM is part of a group meditation and visualization technique that consists of
strategies thought to induce a deeper state of relaxation. The techniques within the BSM are
outlined below:

5
• Tibetan singing bowl–Listening practice for relaxation and focusing (“Listen to the
bowl’s tones three times. Raise your hand when the sound ceases.”).
• Pranayama technique–Rhythmic breathing, counting up and down and then empty
retention (i.e., a state where the individual holds still for a few seconds with no breath
at all). This randomized sequence of timed rhythmic breathing has origins in prana-
yoga. The practice itself consists of taking in a deep breath with the abdomen and
through the nose. The breath is timed randomly with sequences no less than 5
seconds. After several cycles, group members are asked to “become the breath.”
• Visualization of a best self–Participants are asked to imagine all the positive qualities
of their best possible self, and then receive loving-kindness from that best self. As
loving-kindness flows into them from the best self, participants are asked to merge
with their “best possible self“ (“Let the loving-kindness fill up your heart and extend
out through your hands, feel that you are that self.”).
• Projection of loving-kindness–Sending loving-kindness to other group members
through the best self (As their present self merges with the highest and best possible
self, members are asked to send loving-kindness to other group members, then
receive it, alternating back and forth from giving to receiving.). This is followed by
the projection of loving-kindness to the earth (“all the people”) and then the reception
of loving-kindness from the earth (“all the people”).
The BSM has also been used in conjunction with traditional psychoanalysis, interpersonal
therapy (IPT; Schussel & Miller, 2013), and as a stand-alone practice for well-being and coping.
The method has roots in positive psychology, schema therapy, mindfulness, and ego state
therapy in that it draws upon the awareness and modification of one’s self-state. Drawing further

6
parallels with the cognitive behavioral therapeutic technique of cognitive restructuring, the BSM
targets the re-structuring of the core beliefs of the self. Initially, when working with homeless
youth, the technique targeted trauma-based dissociation, and was thought to create a “safe”
proxy self that would allow an individual to give and receive loving-kindness (Schussel &
Miller, 2013). This proxy self was thought to buffer any effect of “self-fragmentation” and other
analogues of disassociation from trauma. The visualization of a best self was postulated to be
integral for creating a simulated “coherent self” during the course of therapy.

7
Literature Review
As mentioned earlier, the efficacy of positive visualization in clinical practice is
supported by developments in cognitive neuroscience. This research shows mentally simulated
activity, such as playing a musical instrument, can evoke similar neural activation to the actual
playing (Decety & Grèzes, 2006; Meister et al., 2004). Neurally simulated states tend to produce
a similar response to their “real world” correlates (Jeannerod, 2001). Furthermore, deep
meditation or a mechanism that produces a hypnogogic state (e.g., rem1, theta) may make the
mind more receptive to the effect of visualization and play a part in integrating visual images
into memory, which is important when simulating an ideal self state (Baijal & Srinivasan, 2010).
Apart from priming the best self to assimilate into one’s self-schema and produce unconscious
behavioral effects, positive visualization has numerous other benefits perhaps related to the latter
mechanism. Some of these benefits of include adaptive coping in adverse circumstances, and
attenuating symptoms related to depression, anxiety, and physical pain (Montgomery et al.,
2000; Rivkin & Taylor, 1999). These techniques have been effectively used to enhance intrinsic
motivation, sports performance, confidence, and goal attainment (Beauchamp, Halliwell,
Fournier, & Koestner, 1996; Callow, Hardy, & Hall, 2001; Feltz & Landers, 1983; Schussel &
Miller, 2013).
Pertinent to the current study, Sheldon and Lyubomirsky (2006) asked their participants
to imagine their best possible selves over 4 weeks and actively write about this process. The
self-guided visualization of the best possible self (BPS) was shown to significantly enhance
positive mood and general well-being. In a follow-up study, M. L. Peters, Flink, Boersma, and
Linton (2010) also found positive outcomes by combining writing tasks and 5 minutes of
imagining a BPS. Outcome data were collected with undergraduate psychology students over a

8
4-week period in Sweden. The researchers examined two groups of participants. The
experimental group (n = 44) was asked to write and imagine about their best possible future
selves and the control group (n = 38) was asked to write about their typical day. During the
exercise, the experimental group was asked to write for 15 minutes about thoughts related to
accomplishing their dreams and goals around their BPS. Subsequent to the writing exercise,
participants were asked to imagine/reflect for 5 minutes about what they had written. M. L.
Peters et al. found positive affect increased and expectancies for negative outcomes decreased
significantly after the BPS intervention. In these studies, the visualization scripts were mostly
based on a writing process and they did not include guided meditation–visualization, sound
entrainment, deep breathing, or the principle of metta, the Buddhist concept of universal love
thought to be an important mechanism to integrate the self-schema (King, 2001; Schussel &
Miller, 2013).
Previous studies supported that visualizing loving-kindness and sending it to others can
enhance positive emotional states as well as increase personal resources (e.g., social support,
purpose in life, mindfulness) and social connectedness (Fredrickson, 2004; Fredrickson & Cohn,
2008; Hutcherson et al., 2008). Results of other loving-kindness meditation studies showed that
when combined with therapeutic interventions, loving-kindness can increase positive affect,
decrease negative affect, and help target psychological problems such as “depression, social
anxiety, marital conflict, anger, and coping with the strains of long-term caregiving” (D. Peters
& Calvo, 2017, p. 242; see also Hoffman et al., 2011). On a short-term basis of 2 weeks, results
of one study showed loving-kindness compassion training could affect individual altruism and
even influenced changes in brain regions related to emotional regulation and social cognition
(Weng et al., 2013). However, these metta practices did not include a receiving component,

9
which is thought to be integral in assimilating the self-schema and the psychological re-enforcing
of the experience.
In addition to imagery and loving-kindness, the BSM contains a deep meditation practice
component. During the initial development of the BSM, it was thought that the BSM would
benefit from including meditation, which has been shown to reduce symptoms of depression,
blood pressure, and anxiety; cortisol; and have many other positive effects (Baer, 2003; Chiesa &
Serretti, 2010; Lutz et al., 2004). Specific to working with homeless youth, mindfulness can help
with goal achievement, human connectedness, and prosocial behavior (Sibinga et al., 2011).
Also, meditation has been shown to work within prison environments. Bleick and Abrams
(1987) found in a study of 259 male prisoners who had practiced meditation that recidivism was
significantly reduced versus the matched control group.
Recent studies of prison behavior also have revealed positive results when looking at
social and behavioral outcomes longitudinally. Perelman et al. (2012) evaluated the effects of
Vipassana meditation over a 1-year period and at 1-year follow-up, and found emotional
intelligence and decreased mood disturbance had occurred when evaluated against a comparison
group. Especially important is the impact on self-regulation and other underlying factors of
psychopathology and aberrant forms of behavior (Dafoe & Stermac, 2013). Self-regulation is
also a significant contributor to the ability to achieve positive and optimal states of functioning,
providing validity for using the BSM with a nonclinical population.
Though visualization and deep meditation both have proven value as stand-alone
practices, combining them with each other augments the therapeutic benefits even further. In a
deeply relaxed state induced by meditation, “hypnagogic imagery has been shown to be more
effective at stimulating the part of the brain related to pain when compared to normal imagined

10
activity, suggesting imagery in a hypnagogic state is more powerful than imagined activity
alone” (Schussel & Miller, 2013, p. 838; see also Derbyshire, Whalley, Stenger, & Oakley,
2004). Mental states associated with deep relaxation are related to the formation of declarative
memories, as these memories are formed during a theta state (4 to 7hz). Memory load, retrieval,
and encoding have also been shown to be associated with theta brain waves (Jacobs, Hwang,
Curran, & Kahana, 2006; Jensen & Tesche, 2002). Furthermore, the hippocampus has been
shown to demonstrate memory deficits when theta rhythms were blocked (Winson, 1978).
How are theta rhythms associated with meditation? Results of multiple studies have
demonstrated that advanced meditators or deeply relaxed participants exhibit amplitude changes
in the theta range (Aftanas & Golocheikine, 2001). Furthermore, when the experiences were
correlated to “bliss” or positive emotions such as with a loving-kindness practice, they were
likely to be related to theta power (Aftanas & Golocheikine, 2001). The formation of a best self
state may be more effective in a deep meditative state because of evidence of memory plasticity
and consolidation during deep relaxation, or REM cycle 1 (i.e., theta; Rauchs, Desgranges, Foret,
& Eustache, 2005; Stickgold, 2005). Positive emotional experiences may potentiate the effect by
making access to theta memory plasticity more pronounced.
Sound Entrainment
Entrainment is a principle in physics and is based on the ability of different frequencies to
resonate in synchrony. Related to the above principle, a Tibetan singing bowl has been
hypothesized to help induce the meditation process through entrainment:
In Tibetan Buddhism, it is said that the sound of the singing bowl invokes perception of
the universal unceasing sound, prananva (om). In many mystical traditions sound is used

11
to facilitate meditation, relaxation, and influence changes in mental and emotional states.
(Schussel & Miller, 2013, p. 838)
It was thought that a Tibetan singing bowl would:
Prime the BSM practice and help induce a meditative state in individual through
“entrainment.” The term refers to two oscillations falling into a state of synchronization,
similar to the notion of two tuning forks vibrating at the same frequency after touching or
two pendulums swinging at the same tempo over time. (Schussel & Miller, 2013, p. 838)
Furthermore, “behavioral entrainment involves the process of unconscious behavioral mimicry
where there is an automatic coordination of facial features, vocal rhythms, and movement
between individuals” (Schussel & Miller, 2013, p. 838; see also Hatfield, Cacioppo, & Rapson,
1994; Hogg & Tindale, 2001). Research has shown the syncing of external stimuli to neural
impulses, especially photic and auditory signals (Thut, Schyns, & Gross, 2011). Auditory beat
can elicit a periodic neural response at the frequency of the beat (Nozaradan, Zerouali, Peretz, &
Mouraux, 2013). This may be related to the power of the singing bowl when used as a potential
tool for neural entrainment. For example, “The singing bowl when played with one revolution
per second, may cause neural entrainment influencing a deep meditative state due to the resonant
effect of the bowl causing 4-6 beats per revolution similar to theta power band” (Schussel &
Miller, 2013, p. 838; see also Cahn & Polich, 2006; Henrique, Antunes, & Inácio, 2004; Jansen,
1990).
Best Self in Practice
The BSM was first implemented in a group psychotherapy setting in a homeless shelter
with young adults ages 18 to 24. The group explored interpersonal and individual problems,
setting long-term and short-term and goals, and offering support during a life transition.

12
Meditation sessions lasted approximately 20 to 30 minutes and were conducted adjunct to
psychotherapy sessions themed around “fostering awareness of negative emotions, maladaptive
patterns, facilitating the formation of the ‘best self’, and strengthening relationships and
emotional receptivity through loving-kindness” (Schussel & Miller, 2013, p. 830). Data analysis
focused on general measures of psychopathology, including the General Health Questionnaire-12
(GHQ-12), the Patient Health Questionnaire-9 (PHQ-9), and the Generalized Anxiety Disorder-7
(GAD-7). Results indicated there was a significant attenuation of symptoms related to
psychopathology when comparing pre and post measures (Schussel & Miller, 2013). In addition
to significant improvements in outcomes related to the GHQ-12, PHQ-9, and GAD-7, group
members reported feeling mild euphoria, serenity, and mental focus (Schussel & Miller, 2013):
One member indicated: “It [BSM] helped me to calm down. It helped me to keep my
mind open. It gave me . . . a sense of euphoria especially when I was upset, or felt, or felt
anxious. It definitely put me in the right state of mind, and putting me in the right state of
mind helped me stay focused and refocus on what it is that I need to do.” (p. 839)
Another group member felt the BSM helped him focus on his self-efficacy:
The breathing exercises, the whole become your breath, look at yourself, see your best
self. I think that sometimes the visual is great to see. And for me when I close my eyes
and when I really think about my best self, I can really see, it’s not that I’m glowing or I
look better, but it’s just this confidence that I exhibit, it’s not that my outside appearance
changes but it’s more of a connection and I feel I’m connected to my best self. (p. 839)
The same member also described the effects of the BSM on self-regulation, especially related to
anger:
13
It helped me notice, like, the way my anger works. It helped me notice that some of the
things I used to get angry about weren’t even worth being angry over. You know, it
taught me a lot, it taught me a lot about myself that I didn’t even know actually . . . it had
an effect on other people in the group as well. It helped me find a way to just come to
terms with yourself and everybody has their own things and their own ways to help them
relax, you understand, and I’ve never really had something like that . . . My anger went
from like here to here. It went from the ceiling to the floor. It pummeled downwards
which is a good thing because before the group I found myself being really angry with
everybody for no reason at all . . . At age 20 I’m glad I was able to experience something
like this because it helped me learn a lot about myself. It helped me become a better
person. (Schussel & Miller, 2013, p. 842)
In summary, there are indications that, for some individuals, BSM can help with
identifying a coherent sense of self, self-regulating negative emotions, inducing mild euphoria,
attenuating clinical symptoms, and integrating the feeling of a positive sense of self into
conscious awareness. The BSM also has support based on meditation and visualization
literature.
Hypotheses and Research Questions
The main hypothesis in this study was that the active strategies of visualization,
meditation, and loving-kindness could together potentiate an enduring positive emotional state,
increase social connectedness, and reduce anxiety within a student population. The study was
designed to measure the impact of the BSM on anxiety, depression, anger, self-compassion, and
social connectedness using reliable and valid psychological instruments, as well as study neuro-

14
cardiological changes using brain computer interface technology and heart rate monitoring
technology. The research involved testing the following pertinent hypotheses:
Hypothesis 1: A group BSM practice will have greater attenuation for anxiety and mood-
based scales over a 2-week period (two sessions) than an active mindful control.
The intervention was designed to work with trauma-based populations and could have
better outcomes for clinical measures especially, as the literature supports the BSM components
and their effect on the clinical attenuation of symptoms (Schussel & Miller, 2013). In light of
evidence of an increase in positive affect and enhanced mood as the result of both loving-
kindness and the BPS as stand-alone practices (Fredrickson & Cohn, 2008; M. L. Peters et al.,
2010; Weng et al., 2013), it was hypothesized that the BSM would have a more robust result for
the mood-related measures than the active mindful breathing comparison group.
Hypothesis 2: The BSM will have better outcomes for the Social Connectedness,
Personal Growth-PGI, General Trust, Social Connectedness Scale, Daily Spiritual Experiences
Scale, and Self-Compassion Scale.
The mindfulness control did not have a theme related to a focus on the relationships
between people, personal growth, or compassion-based constructs. Thus, it was hypothesized
that the BSM would have a more robust effect on these scales as the cognitive focus of the BSM
is centered around compassion of the self in relation to others, as well as personal growth and
achievement. It was predicted that these measures would be more likely to show positive
changes.
Hypothesis 3: There will be a measured increase in alpha power pretest–posttest for both
the BSM and control group.

15
Results of a number of studies have indicated meditation-related tasks increase alpha
power. However, the alpha increases seemed to be more prevalent for mindfulness-based
modalities versus other meditation types, and, as such, could result in a larger increase for the
mindful breathing control group versus the BSM (Cahn & Polich, 2006; Chiesa & Serretti,
2010).
Hypothesis 4: The BSM will exhibit less alpha power than the active control.
The task specific requirement in the BSM employs a focus on an internal visual stimulus.
The focusing of imagery on internal mental state could result in alpha blocking. This notion was
supported by Lo, Huang, and Chang (2003), who found that EEG alpha blocking correlated with
perception of inner light during Zen meditation. In the same study, subjects received a blessing,
or unconditional loving-kindness. “During the blessing period, significant alpha blocking was
observed in experimental subjects” (Lo et al., 2003, p. 629). Some of these themes bear
similarities to the BSM implementation as the sending and receiving of loving-kindness is a
central component and the focus on internal imagery is also prominent.
Hypothesis 5: There will be a measured increase in theta power pretest–posttest for the
BSM group.
Those who experience the BSM subjectively describe that the process produces a deeper
state of relaxation when compared to other mediation modalities they have experienced. The
deeply relaxed state is likely to produce a measured increase in theta power as supported by
studies on meditation and theta (Aftanas & Golocheikine, 2001).
Hypothesis 6: There will be a measured increase of gamma power for BSM versus the
control.

16
Gamma power has been associated with deeper states of meditation and even perceptual
experiences in advanced meditators. Based on the BSM characteristics of enhanced inner
perceptual activation and even positive emotions, it was deemed possible that gamma power
would increase versus the control, which contained no perceptual task or positive emotional
component (Cahn & Polich, 2006).
Hypothesis 7: There will be an increase in inter-hemispheric brain connectivity as
measured by coherence pretest–posttest within groups.
Increased hemispheric coherence has been supported in past mediation literature
(Dillbeck & Bronson, 1981; Faber et al., 2004; Lagopoulos et al., 2009). It was possible both
groups would exhibit an increase in inter-hemispheric brain coherence for both alpha and theta
bands (Cahn & Polich, 2006).
Hypothesis 8: There will an increase in heart rate coherence for the BSM versus control.
The literature indicates increasing levels of heart rate coherence are indicative of
psychological and physiological resilience and associated with positive emotions (Beckham,
Greene, & Meltzer-Brody, 2013; Lemaire, Wallace, Lewin, de Grood, & Schaefer, 2011;
McCraty, Atkinson, Tiller, Rein, & Watkins, 1995; McCraty & Tomasino, 2006; Ratanasiripong,
Ratanasiripong, & Kathalae, 2012). It was thought the BSM would elicit an increase in
coherence versus the control based on the relationship of heart rate coherence to positive
emotional states.

17
Method
Participants
Participants were 66 men and women recruited from departments throughout Teachers
College (TC), Columbia University. Gender was split between male (29%) and female (81%).
The age range was initially expected to be from 25 to 70 years; the actual age of participants
ranged from 18 to 46 years, with a mean of 28.44 years (SD = 5.90). Participants were recruited
from the graduate school population primarily due to issues related to feasibility and to expedite
the study’s implementation. Seven subjects were not included in the analysis as a result of
systematic error within the data collection process, as their Qualtrics electronic data were not
fully imported by the research assistants. In light of the effects of psychological disorders on
self-reported psychopathology and the tendency for extreme scores to regress to the mean,
subjects were excluded if they had any psychological or neurological disorders. Three
participants were excluded on the basis of self-reported psychopathology.
The study was designed as a simple two group randomized control design using mixed
methods. The participants were divided into the BSM (n = 24, 40.68%) and control (C; n = 35,
59.32%) groups. A total of 16 random blocks were established, and group size was determined
to be approximately four; however, sizes varied based on uncontrollable factors related to
recruitment. In practice, after group determination, group size differed on average between the
two different interventions: BSM (M = 3.9, SD = 1) and C (M = 4.4, SD = 1.5).
Instruments
Apparatus. The technology used for the study is outlined below.
EEG device. Emotiv EPOC Research edition is a consumer-brain-computer interface
device that is widely used for neural feedback assessment and collecting raw EEG from 14
18
channels. It is a wireless device that is placed on the participant’s head like a headset, and it
includes dry electrode technology that does not require gel. Emotiv uses technology that is now
prevalent in children’s toys (e.g., Star Wars Force Trainer, Neural Impulse Activator, XWave
headset, etc.), and this device does not require extensive training to be used in a safe and
educational manner (http://emotiv.com/epoc/). Emotiv EPOC Research edition has been widely
used as a viable and portable EEG device for conducting research. The EPOC system passed all
regulatory compliance regulations for use in the U.S. consumer market, has world-wide safety
accreditation, and is certified to IEC60950-1:2005 (Certificate number JPTUV-029914 issued by
TUV Rheinland), which is recognized in the United States under the CB Scheme (Mutual Test
Recognition). EPOC is also certified to FCC Title 47 Part 15 Sub-parts A, B (Class B) and C.
The USB transceiver holds the FCC identifier XUE-USBD01 and the headset holds FCC
identifier XUE-EPOC01 from TCB. These details are listed on the FCC website.
Data were collected using a 14 channel low density EEG, Emotiv EPOC. Below are the
channels used within the system: AF3, F7, F3, FC5, T7, P7, O1, O2, P8, T8, FC6, F4, F8, and
AF4. Reference data use CMS/DRL or common sense mode active electrode, and Driven Right
LEG (DRL) electrode. CMS is located in P3 or TP9 for Emotiv, and acts as an absolute voltage
reference in which all voltages are compared. DRL is located at contralateral right mastoid TP10
or P4 (Emotiv Zendesk, n.d.). The data were collected using sequential sampling 128SPS
(2048HZ internal). Data filtration in the initial collection was done with a .2-45HZ digital filter
and notch filter at 50Hz and 60Hz. Data were wireless using 2.4Gz band. Acquisition software
known as Test Bench records data and displays them with FFT window methods (Hanning,
Hamming, Hann, Blackman, Rectangle). Impedances are measured using test bench software.
Collected raw data are exported to EDF format.

19
Several comparison studies have evaluated the data collected by Emotiv against other
known systems. Badcock et al. (2013) and De Lissa, Sörensen, Badcock, Thie, and McArthur
(2015) found strong comparative validity to other known EEG systems, such as Neuroscan,
when looking at different ERP components. Grummett et al. (2015) also compared multiple
systems to Emotiv EPOC and found similar power spectral distributions for the Berger effect;
however, he mentioned that the system was limited to certain channel dependent paradigms. For
example, P300, which is localized in the parietal-central channels (F3, F4, Fz), precludes Emotiv
use, as Emotiv montage does not contain an Fz channel. Ramirez-Cortes, Alarcon-Aquino,
Rosas-Cholula, Gomez-Gil, and Escamilla-Ambrosio (2011) claimed to successfully overcome
this limitation to examine P300 by adjusting orientation of AF3, AF4, and F4 and reported
reliable P300 data. To date, at least 50 papers have been published using Emotiv EPOC over a
wide range of EEG research applications.
Heart rate monitor. The study included the use of a widely commercially available heart
monitor that measures HRV, cardiac-sympthavagal regulation, and coherence. This is a simple
hand held heart rate monitoring device that is currently available on the market for personal and
education purposes (http://store.heartmath.org/emWave2/emWave2-handheld). The device was
used to examine cardiac-sympthavagal regulation and summate state effects of regulation as a
coherence ratio. The literature indicates increasing levels of coherence are indicative of
psychological and physiological resilience; the researcher in this study wanted to examine that
claim (Beckham et al., 2013; Lemaire et al., 2011; McCraty et al., 1995; McCraty & Tomasino,
2006; Ratanasiripong et al., 2012).
Psychological instruments. The instrumentation used for the study is outlined below.

20
Daily Spiritual Experience Scale. The Daily Spiritual Experience Scale (DSES) is a 16-
item scale assessing multiple dimensions of spirituality, including:
Awe, gratitude, mercy, and awareness of discernment, inspiration and a sense of deep
inner peace. The DSES evidenced good reliability across several studies with internal
consistency estimates in the .90s. Preliminary evidence showed that daily spiritual
experience is related to decreased total alcohol intake, improved quality of life, and
positive psychosocial status. (Underwood & Teresi, 2002, p. 22)
Self-Compassion Scale. The Self-Compassion Scale is a 12-item Likert scale with a 5-
point metric ranging from almost never to always (Neff, 2003). Items contain the following
dimensions: self-kindness, self-judgment, isolation, mindfulness, over-identified, self-judgment,
and common humanity. “The SCS-SF demonstrated adequate internal consistency (Cronbach’s
alpha ≥ .86 in all samples) and a near-perfect correlation with the long form SCS (r ≥ .97 all
samples)” (Raes, Pommier, Neff, & Van Gucht, 2011, p. 254).
Santa Clara Brief Compassion Scale. The Santa Clara Brief Compassion Scale is a
short 5-item Likert scale used to assess self-compassion with a 7-point metric ranging from Not
at all true to Very True. The correlation between the original and brief version is 0.96, and the
internal reliability of the brief version’s Cronbach’s alpha is 0.90 (Hwang, Plante, & Lackey,
2008).
Social Connectedness. The Social Connectedness Scale is a 6-item scale used to assess
how individuals feel connected to others or community. Responses use a Likert scale from
strongly disagree to strongly agree. Reliability and validity are well tested, with Cronbach’s
alpha of .91 (Lee & Robins, 1995).

21
Patient Health Questionnaire. The Patient Health Questionnaire (PHQ-9) is a widely
validated and commonly used scale to measure depression in both clinical and nonclinical
settings. The PHQ contains nine questions answered on a Likert scale to assess the DSM-IV
criteria for depression. Internal consistency of the PHQ-9 has been shown to be high. A study
involving two different patient populations produced Cronbach alphas of .86 and .89 (Spitzer,
Kroenke, & Williams, 1999).
General Anxiety Disorder-7. The General Anxiety Disorder (GAD) is a widely used
psychological instrument consisting of seven questions used to assess for levels of clinical
anxiety on a Likert scale. “Findings suggest that the GAD-7 has good internal consistency and
good convergent validity with worry, anxiety, depression and stress” (Kertz, 2013, p. 1).
Furthermore, “confirmatory factor analyses substantiated the 1-dimensional structure of the
GAD-7 and its factorial invariance for gender and age. Internal consistency was identical across
all subgroups (α = 0.89)” (Herzberg, 2008; Kertz, Bigda‐Peyton, & Bjorgvinsson, 2013; Löwe et
al., 2008; p.1).
General Trust. General Trust is a 6-item scale meant to rate subjective experience of
trust. Items range from strongly disagree to a strongly agree, and reflect levels of general and
interpersonal trust. The scale was validated over 200 studies (Yamagishi & Yamagishi, 1994).
Personal Growth Initiative Scale. The Personal Growth Initiative Scale (PGIS) is a
psychological test used to evaluate an individual’s personal growth initiative, or subjective
evaluation of developmental growth. The scale includes nine items that are rated on a Likert
scale from 1 (Strongly Disagree) to 6 (Strongly Agree). Scores are tallied to obtain a total PGI
score. PGIS is positively correlated to psychological well-being. The scale is negatively
correlated to distress of a psychological nature. Reliability and validity indicate values above
22
.85. The PGIS takes only several minutes to complete and there are no time constraints
(Robitschek, 1998).
Procedure
The analysis was designed to look at two factors and examine both within- and between-
group effects pretest–posttest using the 10 scales mentioned below. Survey data were collected
during at the beginning of treatment in session 1 and at the end of session 2. The scales
examined were the PHQ, GAD, Gratitude, Self-Compassion, Brief Compassion, DSES, General
Trust, Personal Growth Initiative, Mindfulness, and Social Connectedness (see Appendix A).
Biological data were collected at the beginning and end of treatment to examine bio-
physiological state changes.
The study involved a true experimental design that was randomized and contained an
active control group. Participants were recruited from the TC general population using message
boards on the MY TC website and posters around TC facilities (see Appendix B). Participants
were assigned to either the BSM group or a control group that used mindful breathing based on a
random block sequence determined by the RA. Participants were given notice of the exclusion
criteria (i.e., no psychological or neurological disorders). All participants received two reminder
e-mails informing them of their scheduled time and asked not to wear excessive products in their
hair because of the sensitivity of the EEG. Upon arrival at the testing room, participants were
asked to fill out an informed consent form for participation in the study (see Appendix C). Any
questions or concerns were addressed, and participants were reminded they had the right to drop
out at any time and still receive compensation. When asked about the nature of the study, both
groups were told they were part of a “relaxation study” that would take place over two sessions.
Next, participants were given the surveys to complete on several lab computers. Data entry

23
lasted approximately 25 to 30 minutes. At any given time, two or three RAs were present to
monitor the data collection process and ensure the smooth implementation of the study’s
protocol. Subjects were de-identified and given coded numbers. After the electrodes were
soaked in salt solution for several minutes, two EPOC EEG headsets were applied to the
participants and a heart rate sensor was held in the hand or applied to the ear. Participants were
repeatedly asked if they felt any discomfort, and all efforts were made to mitigate irritation.
Sensors were analyzed for level of connectivity using EPOC software, making sure there were
adequate impedance values based on the equipment’s pre-determined thresholds used to
represent connectivity within the equipment. The research team made adjustments until optimal
connectivity was achieved, and a signal stable ensuring net connectivity across all 14 channels.
Team members kept a log of EEG activity, noting the time of any major artifact producing event
or issues with the data connection. The head lab technician from the Electrophysiology lab of
Columbia Psychiatry was present to help manage any issues with connectivity and the data
collection process. Before the collection, participants were read a script asking them to remain
as still and relaxed as possible. The collection process consisted of four 2-minute intervals. The
sequence was as follows: eyes closed, eyes open, eyes closed, eyes open. During the eyes open
task, the participants were asked to look at a fixed point (cross on paper attached to the wall) and
to blink as little as possible. During the eyes closed task, the participants were asked to keep
their eyes closed for a 2-minute interval and to minimize movement as well as lateral ocular
drift. The same exact sequence was implemented directly after the intervention. During each
session, participants in the treatment group received a 12-minute guided BSM practice led by a
facilitator. In the control group, the same person also administered a 12-minute exercise
focusing on awareness of breath. EEG and heart data were collected at the beginning and end of

24
each session. When the session was finished, the participants were debriefed and asked to fill
out the surveys, but only at the end of the second treatment session.
When the EEG collection was finished, the sensors were removed and cleaned in
solution. An intervention of one session per week for 2 weeks was delivered, for a total of two
sessions. Each session was held in a group setting with a target number of four individuals per
group, with a minimum of two and maximum of seven participants. Sessions were held mostly
in the evening to avoid any systematic error caused by time of day and to ensure less overall
activity that would create more experimental “noise.” Participants were remunerated with
compensation of $50 at the end of the study. Compensation was given with hard currency and
contained in secure white envelopes.
Data Analysis and Significance
The data analysis involved examining two factors for both within- and between-group
effects pretest–posttest using the 10 scales mentioned. Data were imported from Qualtrics,
where the psychological instruments were administered, and stored on a password-protected
computer. Data were further organized using an Excel spreadsheet implemented by the lab RAs.
After organizing the data based on treatment time and group type, they were imported into SPSS
and any other program used for analysis. After being stored as EDF files, EEG data were
directly imported into Matlab (EEGLAB). Heart data were extracted from the HeartMath
program and imported into a database, and then also organized by treatment time and
intervention time. Different sample sizes were collected based on the feasibility of equipment
and variability within the data collection process. The EEG data sample collected was
approximately 32. However, 14 subject files were excluded as a result of any one problem with
one of the four posterior EEG channels (O1, O2, P7, P8; see EEG analysis below).

25
The researcher conducted multiple dependent t tests to examine within-group differences
related to the effect of the intervention pretest–posttest. For the dependent t test, Shapiro-Wilk
was used to determine normality (Razali & Wah, 2011) and Levene’s test for homogeneity of
variance was used to test equality of variances (Levene, 1961). Dependent t test was used for
heart rate pretest–posttest data, EEG pre- and pretest–posttest data for both intervention groups,
and with all 10 psychological instruments pretest–posttest for both treatment groups.
When examining between-group differences, the researcher used individual independent t
tests to determine whether the effect of randomization occluded any pre-existing group
differences for between-subjects factors. Gain scores or difference scores between posttest and
pretest were used to look at differences in the between-subjects factors, and determine whether
there were significant differences between the two intervention modalities on the basis of the 10
rating scales. Because the 16 groups were randomly created and not variable-based clusters, it
was not necessary to use ICC(1) coefficient to account for the clusters.
The gain score approach allowed for uni-directional hypotheses to be tested. Similarly, if
there were issues with normality, non-parametric statistics could be applied using the same set of
difference scores (Gliner, Morgan, & Harmon, 2003). In the case of the present study, the
researcher used a Mann-Whitney to test any non-parametric distributions and an independent t
test to test for gain score differences between the two interventions.
In light of the possibility of data variability within the EEG pretest data, the researcher
used an analysis of co-variance (ANCOVA) to examine group differences while controlling for
pretest values for the different EEG power spectra. Prior to analysis, assumptions of univariate
normality of residuals, homoscedasticity of residuals, and homogeneity of regression slopes were

26
examined. Data output was initially analyzed as normalized, and then as log-transformed
normalized data.
A short manipulation check asking questions about the level of relaxation related to the
intervention, along with qualitative aspects about its effectiveness, was used to determine
whether experimental manipulation did produce the hypothesized outcome. Data analysis was
conducted using the EEGLAB toolbox within Matlab. After locating and converting data to an
EDF file through EPOC software, the data were retrieved from EEG files and imported using
BioSig toolbox, and further imported into EEGLAB. After import, 10 to 20 channel locations
were identified using a .CED file, which specifies 10 to 20 locations using polar angle(theta),
polar radius, cartesian X, Y, Z coordinates, spherical horizontal angle, spherical azimuth angle,
spherical radius, and channel type (Delorme & Makeig, 2004). A read locations file was loaded,
and channel data were applied to the working file. After the channel data were loaded, they were
re-filtered using both a high pass filter of 1hz (typically filters out slow artifacts, such as
electrogalvanic signals and movement artifact) and a low pass filter, which filters out high-
frequency artifacts, such as electromyographic signals (Vidaurre, Sander, & Schlögl, 2011).
After the filter was applied, baseline was removed and channel distribution was checked
once again to ensure channel locations for the data were successfully attributed. Next, data were
examined visually looking for abnormal voltages and artifacts. After visual inspection and
rejection of artifact-laden segments, an automated channel rejection and continuous rejection
function were applied to data. Automated channel rejection includes parameters that focus on
abnormally high power and distribution of channel that exhibits significant kurtosis as specified
by EEGLAB. The process was automated within EEGLAB, which highlights channels that meet
rejection criteria in red. Both processes use FFT and a hanning window as part of their

27
decomposition. Based on the limitation of low montage density, if more than three channels are
rejected, or a single parietal-occipital channel is highlighted, rather than interpolate channels, the
entire data file would be flagged for exclusion.
Next, an event file was imported to the data. As no experimental ERP paradigm was
used, there were no events inherently collected within the Emotiv hardware/software. A file with
1-second events was constructed and imported into the EEG file structure to extract epoch or
segment the data for power spectral analysis and coherence. After the events were placed in the
file structure, the channel properties were checked in the GUI and within the channel scroll
window to ensure successful implementation. After the events were imported, the independent
analysis function was then implemented.
ICA, or independent component analysis, is a linear decomposition method such as PCA
that involves linear changes of basis from data collected at single scalp channels. The
core goal to minimize the mutual information among the data projections and maximize
their joint entropy. (Delorme & Makeig, 2004, p. 12)
ICA decomposes the EEG with Runica () function and visualizes the primary components of the
EEG, making it possible to separate non-neural sources from the data. The function organizes
components on the basis of contribution or percent of variance accounted for. To further
evaluate rejection of the non-neural EEG components, EEGLAB’s ADJUST plugin was used to
standardize component rejection process, as opposed to stand-alone visual inspection. ADJUST
identifies eye blinks, vertical eye movements, horizontal eye movements, and generic
discontinuities. In summary, the plugin examines the above non-neural sources using spatial
average difference (SAD), maximum epoch variance (MEV), spatial eye difference (SED),
generic discontinuities spatial feature (GDSF), and maximum epoch variance (MEV; Mognon,
28
Jovicich, Bruzzone, & Buiatti, 2010). Also, common features of non-neural components are flat
lined EEG and localized power distribution in the ocular region. The toolbox highlights flagged
components with red marks. Resulting flagged components are removed. Before further
analysis, data were epoched using the default criteria where epochs were defined as being from 1
second before to 2 seconds after the event.
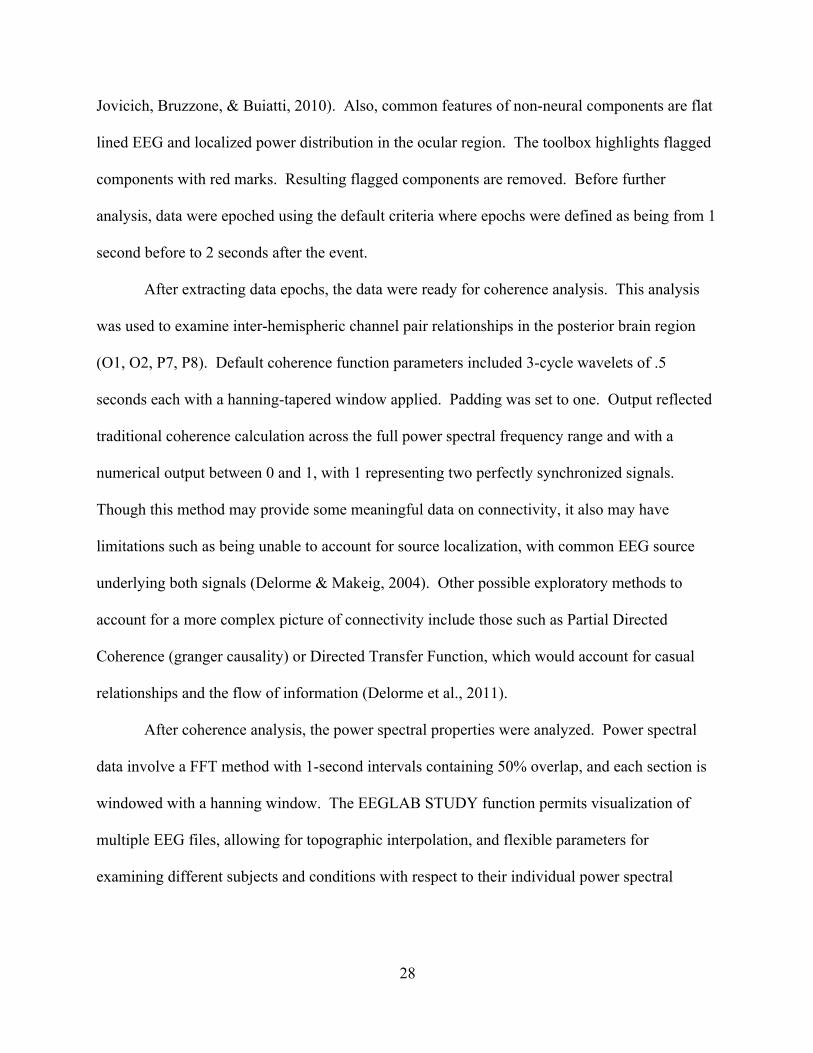
After extracting data epochs, the data were ready for coherence analysis. This analysis
was used to examine inter-hemispheric channel pair relationships in the posterior brain region
(O1, O2, P7, P8). Default coherence function parameters included 3-cycle wavelets of .5
seconds each with a hanning-tapered window applied. Padding was set to one. Output reflected
traditional coherence calculation across the full power spectral frequency range and with a
numerical output between 0 and 1, with 1 representing two perfectly synchronized signals.
Though this method may provide some meaningful data on connectivity, it also may have
limitations such as being unable to account for source localization, with common EEG source
underlying both signals (Delorme & Makeig, 2004). Other possible exploratory methods to
account for a more complex picture of connectivity include those such as Partial Directed
Coherence (granger causality) or Directed Transfer Function, which would account for casual
relationships and the flow of information (Delorme et al., 2011).
After coherence analysis, the power spectral properties were analyzed. Power spectral
data involve a FFT method with 1-second intervals containing 50% overlap, and each section is
windowed with a hanning window. The EEGLAB STUDY function permits visualization of
multiple EEG files, allowing for topographic interpolation, and flexible parameters for
examining different subjects and conditions with respect to their individual power spectral

29
properties. It was here that the data were visualized and graphically represented based on
conditions, and power spectral properties displayed.
Heart data examined cardiac-sympthavagal regulation, and summated state effects of
regulation as a coherence ratio. Heart rate variability was collected looking for changes in the
coherence ratio during HRV between the control and experimental group as well as between
baseline and intervention for both groups. The HeartMath software program provided
information on the heart rate measure in BPS (beats per second) and recorded. Average
coherence rate was calculated and a number between 0 to 1 was given to represent coherence
variable. After each session, data (average coherence & BPS) were exported to a data
spreadsheet in SPSS. Independent t tests of gain scores and dependent t tests were used to
evaluate any differences as mentioned above.

30
Results
Preliminary Data Analysis
The researcher in the present study employed a series of 10 psychological instruments
commonly used within clinical research. Scale data were collected at Time 1 (pretest) and Time
2 (posttest) before and after two intervention sessions. A total of eight psychological instruments
were used to examine resilience factors (Gratitude, Self-Compassion, Brief Compassion, DSES,
Trust, Personal Growth Initiative, Mindfulness, and Social Connection). The other outcome data
focused on psychopathology to examine the underlying constructs of depression and anxiety
(PHQ, GAD). The hypotheses were that the BSM group would have better outcomes for
psychopathology and assumed a reduction from Time 1 (pretest) to Time 2 (posttest) and
increases for the resilience-based measures.
Quantitative and Biological Data
The chosen psychological instruments were empirically validated and appropriately
normed (see Appendix A) and the results were further supported with bio-physiological data.
The EEG system included in the study was the Emotiv EPOC Research edition, a consumer-
brain-computer interface device that is widely used for neural feedback assessment. Raw EEG
data were collected from 14 channels, and the system used sequential sampling 128 SPS (2048
Hz internal). Data filtration in the initial collection was done with a 0.2 to 45Hz digital filter and
notch filter at 50Hz and 60Hz. Heart rate coherence data were collected using HeartMath EM
Wave 2, a widely commercially available heart monitor that measures heart rate variability
(HRV) cardiac-sympthavagal regulation, and heart rate coherence.
The researcher evaluated the pre-existing group differences using a series of independent
t tests to compare the differences in pretest scores among the various psychological instruments.

31
Additional t tests were employed to compare EEG power values across all power bands and for
EEG coherence data. Other data included in the pretest analysis of group differences included
heart rate coherence data and an additional t test for difference in EEG epochs/events. No
significant differences were found for any of the pretest values, which suggests for all
instruments there were no pre-existing group differences (see Table 1).
Table 1
Independent t Test of Pre-Existing Group Differences
M SD M SD t p
Psychological Instruments (n=59)
Pre PGIS 40.542 6.534 41.257 5.943 0.436 0.664
Pre Self Kindness 8.083 1.501 8.171 1.599 0.213 0.832
Pre Self Compassion 48.083 6.107 47.857 7.183 0.126 0.9
Pre DSES 51.917 18.448 50.771 18.399 0.235 0.815
Pre Brief Compassion 27.75 5.135 26.457 6.363 0.827 0.412
Pre Trust 19.833 3.031 20.714 3.569 0.989 0.327
Pre Mindfulness 36.083 6.164 35.147 6.907 0.531 0.597
Pre Social Connect 74.292 6.231 72.286 6.21 1.217 0.229
Pre GAD 9.4 2.586 8.75 5.654 1.372 0.176
Pre PHQ 10.25 3.417 9.24 4.351 0.532 0.597
Pre Gratitude 28.913 3.642 30.257 3.906 1.316 0.193
EEG Measures (n=18)
PreCohOcciptaltheta 0.532 0.14 0.506 0.108 0.478 0.638
PreCohOcciptalalpha 0.515 0.144 0.505 0.152 0.143 0.888
PreCohOcciptalgamma 0.475 0.108 0.4 0.1 1.614 0.124
PreCohParietaltheta 0.395 0.216 0.399 0.164 0.047 0.963
(continued)

32
Table 1 (continued)
Independent t Test of Pre-Existing Group Differences
M SD M SD t p
PreCohParietalgamma 0.412 0.187 0.365 0.147 0.603 0.555
PreCohParietalalpha 0.346 0.181 0.36 0.149 0.182 0.858
PreparietalThetaPower 46.446 4.213 48.652 3.54 1.268 0.221
PreparietalAlphaPower 47.431 4.973 50.177 3.651 1.408 0.176
PreparietalGammaPower 35.351 2.068 36.38 1.906 1.157 0.262
PreOcciptalThetaPower 50.499 4.048 48.934 3.714 0.901 0.379
PreOcciptalAlphaPower 52.549 4.471 52.112 3.967 0.231 0.82
PreocciptalgammaPower 37.615 2.109 36.729 1.829 1.004 0.329
Heart Measures (n=
PreHR 69.762 5.898 69.875 7.136 0.053 0.958
PreHeartCoherence 0.638 0.12 0.725 0.259 1.242 0.229
PreAchievment 64.762 23.637 83.938 37.319 1.909 0.064
Event/Epoch Differences 51.1 34.339 54.7 27.352 0.388 0.702
* Significance ≤ .05
After analyzing the pretest mean difference scores and being unable to reject the null
hypothesis to assume group differences for any one measure, a preliminary data analysis was
employed to examine the effects of the treatment. Group analysis was used to evaluate the data
on the basis of the differential gain scores between the two groups. The difference in gain scores
was determined by the delta between Time 1 and Time 2 and then by conducting a one-tailed
independent t test to compare the groups. The independent t test is appropriate only if statistical
assumptions were met (i.e., normality, homogeneity of variance). To provide more details on the
difference in changes within each group, the researcher used a series of dependent t tests to look
at differences between Time 1 (pretest) and Time 2 (posttest). Non-parametric tests such as

33
Mann-Whitney were used when assumptions of normality were not met as determined by
Shapiro-Wilk. For EEG data, an ANCOVA was used to determine group differences. Prior to
conducting the analysis, the assumptions of univariate normality of residuals, homoscedasticity
of residuals, homogeneity of slopes, and independence between the covariates and independent
variables were analyzed.
Coherence data were analyzed on the basis of within-group differences and a series of
dependent t tests were used to evaluate post-hoc pretest–posttest power and coherence changes
across alpha, theta, and gamma power bands. EEG data were plotted as a series of pretest–
posttest lines plots for each power band. The posterior brain regions of analytic focus included
both parietal (P7, P8) and occipital lobes (O1, O2). These areas were determined as necessary to
reduce any problematic non-neural artifacts (e.g., horizontal and lateral eye motion, electro
galvanic signals and movement artifacts that manifest in anterior brain regions). Histograms
depicting mean changes were used to depict the deltas for group differences and the pretest–
posttest values across all measured data.
Hypothesis 1: Psychopathology Attenuation
A group BSM practice will have greater attenuation for anxiety and mood-based scales
over a 2-week period (two sessions) than an active mindful control.
The BSM intervention was designed to work with trauma-based populations and could
also have better outcomes for measures of clinical pathology, as the literature supports the BSM
components and their effects on the clinical attenuation of symptoms (Schussel & Miller, 2013).
In light of evidence of an increase in positive affect and enhanced mood as the result of both
loving-kindness and the BPS as stand-alone practices (Fredrickson & Cohn, 2008; M. L. Peters
et al., 2010; Weng et al., 2013), it was hypothesized in this study that the BSM would have a
34
stronger effect for both clinical measures and resilience-based measures (Hypothesis 2) than the
active mindful breathing comparison group.
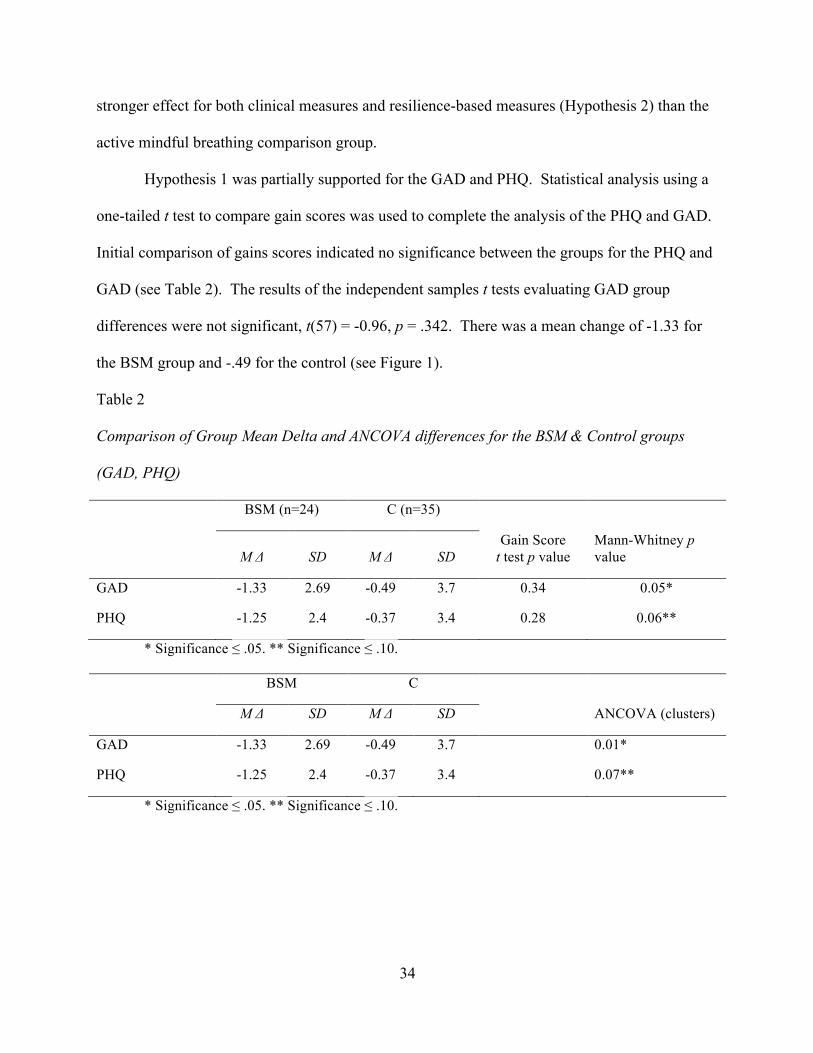
Hypothesis 1 was partially supported for the GAD and PHQ. Statistical analysis using a
one-tailed t test to compare gain scores was used to complete the analysis of the PHQ and GAD.
Initial comparison of gains scores indicated no significance between the groups for the PHQ and
GAD (see Table 2). The results of the independent samples t tests evaluating GAD group
differences were not significant, t(57) = -0.96, p = .342. There was a mean change of -1.33 for
the BSM group and -.49 for the control (see Figure 1).
Table 2
Comparison of Group Mean Delta and ANCOVA differences for the BSM & Control groups
(GAD, PHQ)
BSM (n=24) C (n=35)
M Δ SD M Δ SD Gain Score
t test p value Mann-Whitney p value
GAD -1.33 2.69 -0.49 3.7 0.34 0.05*
PHQ -1.25 2.4 -0.37 3.4 0.28 0.06**
* Significance ≤ .05. ** Significance ≤ .10.
BSM C
M Δ SD M Δ SD ANCOVA (clusters)
GAD -1.33 2.69 -0.49 3.7 0.01*
PHQ -1.25 2.4 -0.37 3.4 0.07**
* Significance ≤ .05. ** Significance ≤ .10.

35
Figure 1. Comparison of pretest–posttest delta for the PHQ and GAD.
The Shapiro-Wilk test was conducted to determine whether gains in GAD could have
been produced by a normal distribution (Razali & Wah, 2011). The results of the Shapiro-Wilk
test were significant (W = 0.86, p < .001), indicating the distribution was non-normal. A follow-
up Mann-Whitney test was used to evaluate the data as a non-parametric distribution. The result
of the Mann-Whitney U test was significant at a 95% confidence interval (U = 316.5, z = -1.62, p
≤ .05; the p-value was rounded down from .0525). Additional ANCOVA tests were performed
with group as fixed factor and cluster as random factor. Results were similar to Mann-Whitney
test attributing a significant effect (F [2, 56] = 36.52, p < .01) for the GAD, and a significant
effect at a 90 percent confidence interval for the PHQ (F[2, 56] = 37.64, p < .07).
Additional independent t tests were used to examine changes between pretest and posttest
to examine the clinical effects of each treatment on the basis of differences between Time 1 and
Time 2. Several independent t tests were conducted. Individual t tests for the PHQ
demonstrated some differences that did not appear within the gain score analysis. The BSM
PHQ t test was significant at a 95% confidence interval (t[23] = 2.55, p = .002) and the control

36
was not (t[934] = 0.65, p = .261; see Table 3). As far as the GAD, individual t tests showed
there was a sharper contrast between individual changes. The BSM group indicated significant
changes (t[23] = 2.42, p = .01) and the control did not reach significance (t[34] = 0.77, p = .22).
Table 3
Series of Dependent t Tests Evaluating Pretest and Posttest Differences of Scale Data
Variable Pre Post
BSM(n=24)C (n=35) M SD M t SD p
PGIS Cntrl 41.26 5.94 42.94 -2.14 7.03 0.02*
PGIS BSM 40.54 6.53 42.08 -2.36 5.40 0.01***
Self Kindness Cntrl 8.17 1.60 8.43 -0.96 1.91 0.17
Self Kindness BSM 8.08 1.50 8.13 -0.13 1.60 0.45
Social Connect Cntrl 47.86 7.18 46.94 1.33 5.94 0.2
Social Connect BSM 48.08 6.11 47.04 1.00 5.18 0.16
DSES CNTRL 50.77 18.40 49.14 1.89 20.49 0.97
DSES BSM 51.92 18.45 50.00 1.84 19.00 0.96
Brief Compassion Cntrl 26.46 6.36 26.74 -0.48 7.52 0.32
Brief Compassion BSM 27.75 5.14 27.63 0.18 4.59 0.43
General Trust Cntrl 20.71 3.57 20.97 -0.57 4.36 0.14
General Trust BSM 19.83 3.03 20.54 -1.90 3.16 0.04*
Mindfulness Cntrl 35.15 6.91 31.12 6.27 7.54 0.50
Mindfulness BSM 36.08 6.16 31.42 8.69 5.88 0.50
GAD Cntrl 9.4 5.54 8.91 0.77 5.65 0.22
GAD BSM 8.75 3.52 7.41 2.42 2.59 0.012*
PHQ Cntrl 9.24 4.35 8.72 0.65 5.46 0.26
PHQ BSM 10.25 3.42 9.0 2.55 3.01 0.009*
Gratitude Cntrl 30.26 3.91 30.29 -0.07 4.59 0.47

37
Gratitude BSM 28.91 3.64 28.96 -0.08 3.74 0.47
* Significance ≤ .05. ** Significance ≤ .10. *** Significance ≤ .01.
Hypothesis 2: Resilience Scale Increases
The BSM will have better outcomes for the Social Connectedness, Personal Growth-PGI,
General Trust, DSES, Brief-Compassion, Gratitude, Self-Compassion Scales, and Brief
Compassion.
Statistical analysis using a one-tailed t test comparing gain scores was used to complete
the analysis of the eight other psychological instruments being evaluated: PGI, General Trust,
Social Connectedness Scale, Gratitude, Self-Compassion, Brief Compassion, Mindfulness, and
the Daily Spiritual Experiences Scale. The hypothesis was partially met for several of the scales
on the basis of individual t tests. For the General Trust Scale, the gain score analysis evaluating
group differences did not indicate a significant change between the two groups, t(57) = 0.72, p =
.475. However, individual t tests for the two groups illustrated other differences. The BSM
group showed significant changes for the General Trust Scale, t(23) = -1.90, p = .04. The control
group did not indicate any significant differences, t(34) = -0.57, p = .14.
The Social Connectedness Scale did not show any group differences (t[57] = -0.11, p =
.458), nor did the individual t tests. There were no differences for DSES, Gratitude,
Mindfulness, Self-Compassion, or Brief Compassion (see Tables 3 and 4). Thus, the null
hypothesis could not be rejected for these constructs. As for Personal Growth, the results
indicated no group differences, t(57) = -0.13, p = .45. However, there were significant changes
for Personal Growth initiative for both the Control and BSM on the basis of individual t tests:
t(34) = -2.14, p = .02 for the control and t(23) = -2.36, p = .01 for the BSM. In this case, the
BSM showed a stronger trend on the basis of pretest–posttest changes for Personal Growth. The

38
hypothesis of positive changes for the BSM on the basis of the eight resilience-based constructs
was partially met for the Personal Growth Scale and General Trust Scale.
Table 4
Comparison of Group Mean Delta, Pretest and Posttest (Resilience Scales)
BSM ∆ C ∆
N=59 M SD M SD Gain Score
t test p value Mann-Whitney p
value
Gain Score PGIS 1.54 3.20 1.69 4.66 0.90 0.54
Gain Self Kindness 0.04 1.57 0.26 1.58 0.61 -
Gain Social Connect -1.04 5.10 -0.91 4.08 0.92 0.96
Gain Brief Compassion -0.13 3.44 0.29 3.52 0.66 -
Gain Trust 0.71 1.83 0.26 2.67 0.48 -
Gain Mindfulness -4.67 2.63 -4.03 3.75 0.48 -
Gain DSES -1.92 5.11 -1.63 5.09 0.83 -
Gain Gratitude 0.04 2.53 0.03 2.33 0.98 0.88
Gain Self Compassion -1.04 5.10 -0.91 4.08 0.92 -
* Significance ≤ .05. ** Significance ≤ .10.
Hypothesis 3: Alpha Power Increases
Hypothesis 3: There will be a measured increase in alpha power pretest–posttest for both
the BSM and control group.
Based on the results of previous studies on alpha power and meditation, the researcher
hypothesized that there would be an increase in alpha power for both groups as measured during
a single session. However, the data for alpha power changes did not indicate any significant
changes from pretest to posttest for either the parietal or occipital regions (see Table 5). The
result of the paired samples t test for occipital alpha control was not significant (t[9] = -0.77, p =
.231), suggesting the true difference in the means of pre occipital alpha control and post occipital

39
control was not significantly different from zero. An additional series of paired samples t tests
was conducted to examine whether the difference between pre occipital alpha BSM and post
occipital alpha BSM was significantly different. The result of the paired samples t test was not
significant, t(7) = 0.29, p = .389. Apart from occipital power, tests were conducted in the
parietal region for both the control and BSM. The results of the paired samples t test were not
significant for the control group (t[9] = -1.19, p = .132) or the BSM group (t[7] = 0.77, p = .233).
The results did not indicate a significant increase in alpha power for either group. Thus, the null
hypothesis of alpha power increases pretest–posttest failed to be rejected.
Table 5
Normalized Power Dependent t Test for Parietal and Occipital Regions
Pre Post
M M p d
Control (n=9)
Occipital Theta 0.0070524 0.0069983 0.22 0.24
Parietal Theta 0.007151 0.007089 0.19 0.23
Occipital Alpha 0.007864 0.008018 0.23 0.27
Parietal Alpha 0.007529 0.007651 0.13 0.35
Occipital Gamma 0.005584 0.005613 0.41 0.09
Parietal Gamma 0.005725 0.005705 0.46 0.03
BSM (n=9)
Occipital Theta 0.00697125 0.007154 0.14 0.56
Parietal Theta 0.00723 0.00711875 .093 0.34
Occipital Alpha 0.007596125 0.0075325 0.39 0.13
Parietal Alpha 0.00745625 0.00729875 0.23 0.43
Occipital Gamma 0.00566875 0.00589125 0.047* 1.00
Parietal Gamma 0.00591625 0.0060225 0.19 0.35

40
* Significance ≤ .05.
Figure 2. Pretest–posttest power changes for all values (occipital-parietal regions).
Figure 3. Gain score for normalized power (occipital and parietal region).

41
Figure 4. Full spectrum pre–post EEG power values for control and BSM.
Hypothesis 4: Alpha Power Group Differences
The BSM will exhibit less alpha power than the active control.
To evaluate differences across different power spectral bands between the control group
and BSM, the researcher used an ANCOVA. The ANCOVA was conducted to determine
whether there were significant differences in post parietal and occipital alpha by group while
controlling for pretest power values. Prior to conducting the analysis, the assumptions of
univariate normality of residuals, homoscedasticity of residuals, homogeneity of regression
slopes, and independence between the covariates and independent variables were assessed.
The results of the post parietal alpha ANCOVA were significant (F[2, 15] = 3.68, p ≤
.05), indicating the differences among the values of group were not equivalent. The main effect,
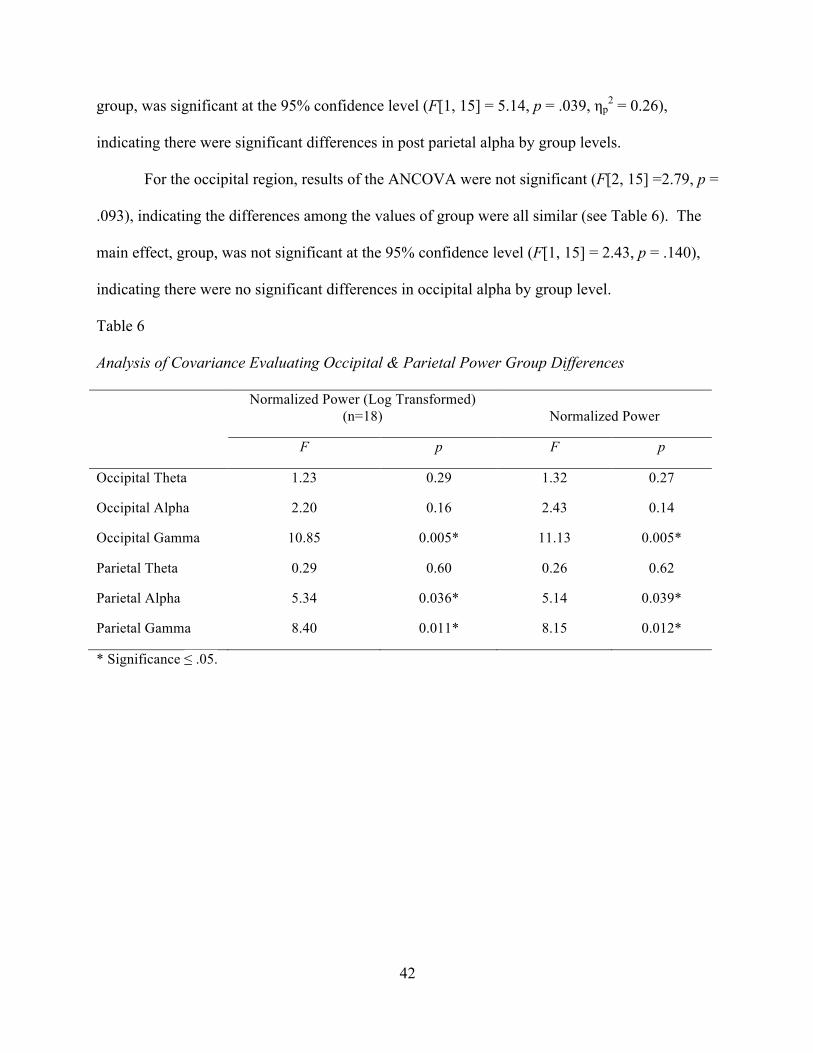
42
group, was significant at the 95% confidence level (F[1, 15] = 5.14, p = .039, ηp2 = 0.26),
indicating there were significant differences in post parietal alpha by group levels.
For the occipital region, results of the ANCOVA were not significant (F[2, 15] =2.79, p =
.093), indicating the differences among the values of group were all similar (see Table 6). The
main effect, group, was not significant at the 95% confidence level (F[1, 15] = 2.43, p = .140),
indicating there were no significant differences in occipital alpha by group level.
Table 6
Analysis of Covariance Evaluating Occipital & Parietal Power Group Differences
Normalized Power (Log Transformed)
(n=18) Normalized Power
F p F p
Occipital Theta 1.23 0.29 1.32 0.27
Occipital Alpha 2.20 0.16 2.43 0.14
Occipital Gamma 10.85 0.005* 11.13 0.005*
Parietal Theta 0.29 0.60 0.26 0.62
Parietal Alpha 5.34 0.036* 5.14 0.039*
Parietal Gamma 8.40 0.011* 8.15 0.012*
* Significance ≤ .05.

43
Figure 5. Gain score comparison: Occipital and parietal alpha.
Figure 6. Full spectrum interpolated 2d brain representation for alpha power.
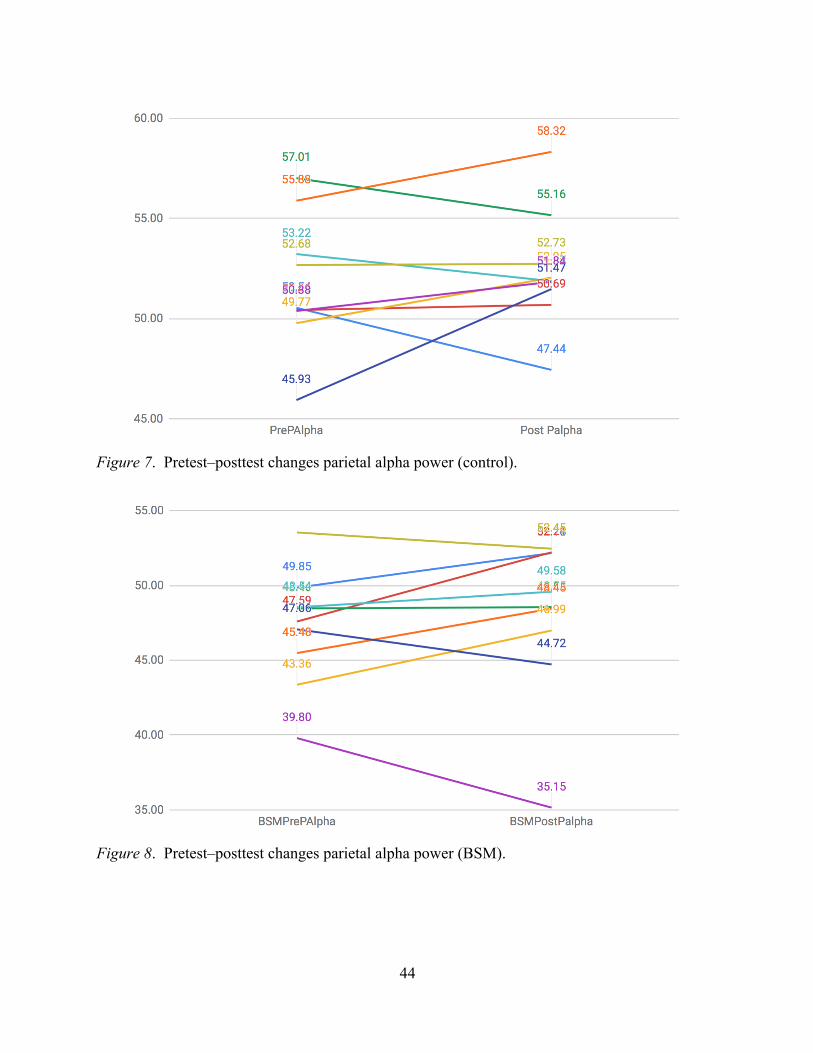
44
Figure 7. Pretest–posttest changes parietal alpha power (control).
Figure 8. Pretest–posttest changes parietal alpha power (BSM).

45
Figure 9. Pretest–posttest changes occipital alpha power (control).
Figure 10. Pretest–posttest changes occipital alpha power (BSM).
Hypothesis 5: Theta Power Increase for BSM
There will be a measured increase in theta power pretest–posttest for the BSM group.
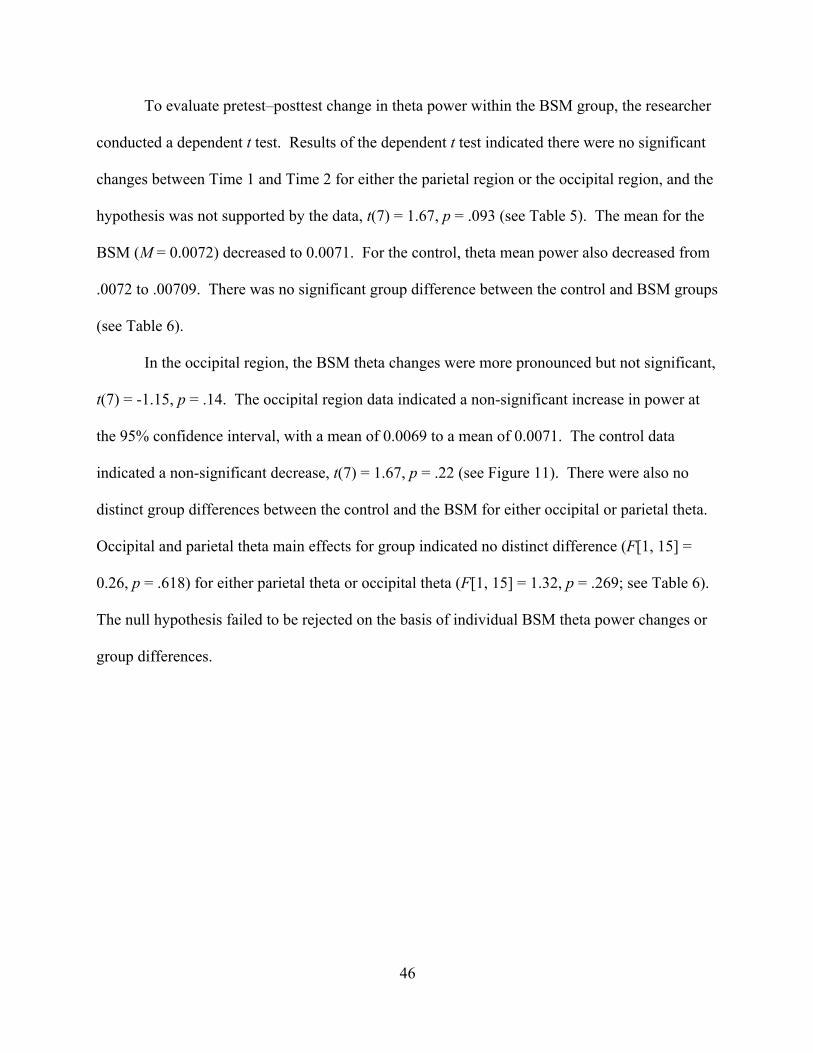
46
To evaluate pretest–posttest change in theta power within the BSM group, the researcher
conducted a dependent t test. Results of the dependent t test indicated there were no significant
changes between Time 1 and Time 2 for either the parietal region or the occipital region, and the
hypothesis was not supported by the data, t(7) = 1.67, p = .093 (see Table 5). The mean for the
BSM (M = 0.0072) decreased to 0.0071. For the control, theta mean power also decreased from
.0072 to .00709. There was no significant group difference between the control and BSM groups
(see Table 6).
In the occipital region, the BSM theta changes were more pronounced but not significant,
t(7) = -1.15, p = .14. The occipital region data indicated a non-significant increase in power at
the 95% confidence interval, with a mean of 0.0069 to a mean of 0.0071. The control data
indicated a non-significant decrease, t(7) = 1.67, p = .22 (see Figure 11). There were also no
distinct group differences between the control and the BSM for either occipital or parietal theta.
Occipital and parietal theta main effects for group indicated no distinct difference (F[1, 15] =
0.26, p = .618) for either parietal theta or occipital theta (F[1, 15] = 1.32, p = .269; see Table 6).
The null hypothesis failed to be rejected on the basis of individual BSM theta power changes or
group differences.

47
Figure 11. Gain score occipital and parietal theta (BSM and control).
Figure 12. Full spectrum interpolated 2d brain representation for theta power.
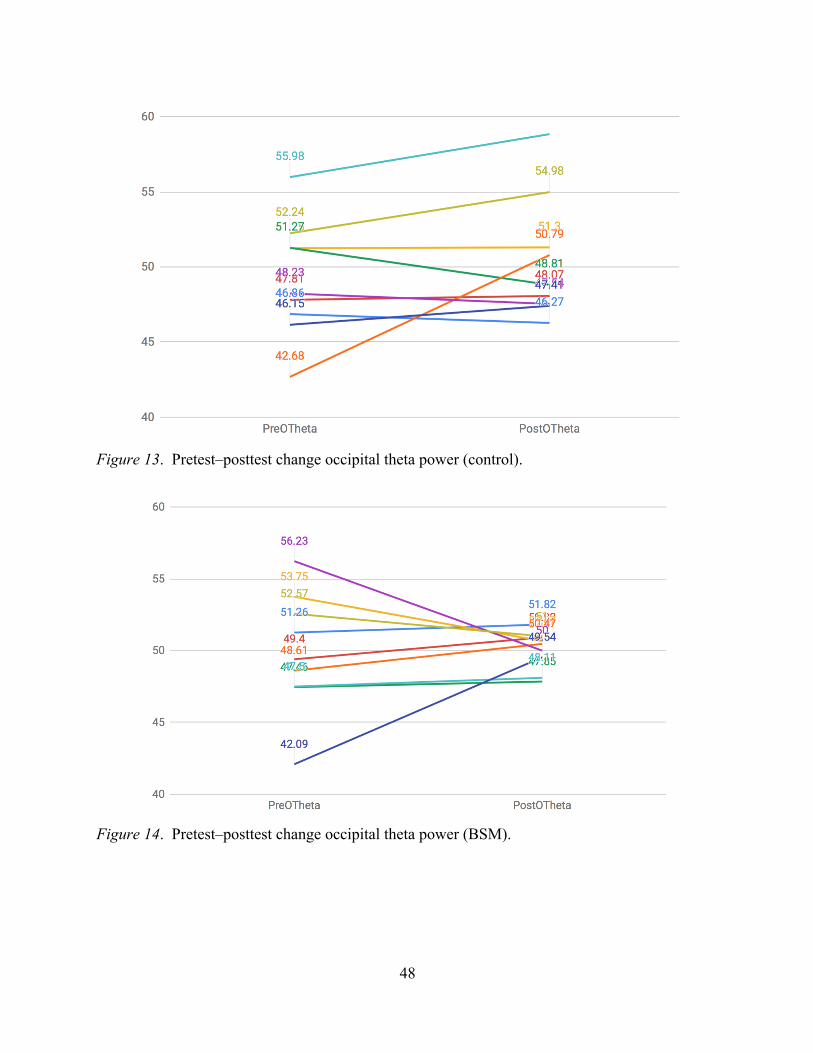
48
Figure 13. Pretest–posttest change occipital theta power (control).
Figure 14. Pretest–posttest change occipital theta power (BSM).

49
Figure 15. Pretest–posttest change parietal theta power (control).
Figure 16. Pretest–posttest change parietal theta power (BSM).
Hypothesis 6: Gamma Power Increase for the BSM
There will be a measured increase of gamma power for BSM versus the control.

50
To evaluate whether an increase in gamma power existed across different power spectral
bands, the researcher implemented ANCOVA. The ANCOVA was conducted to determine
whether there were significant differences in posttest parietal gamma by group while controlling
for pretest parietal gamma. The results of the ANCOVA were significant (F[2, 15] = 6.34, p =
.010), indicating there were significant differences among the values of group (see Table 5). The
main effect, group, was significant at the 95% confidence level, F(1, 15) = 10.85, p = .005, ηp2 =
0.42.
Further analysis of the parietal region also indicated group differences; the results of the
ANCOVA were significant (F[2, 15] = 9.75, p = .002), indicating there were significant
differences between parietal gamma means. The main effect, group, was significant at the 95%
confidence level (F[1, 15] = 8.15, p = .012, ηp2 = 0.35), indicating there were significant
differences in parietal gamma by group levels.
Results of other post-hoc individual dependent t tests demonstrated a significant effect
across Time 1 and Time 2 for occipital gamma for the BSM (t[7] = -1.94, p = .047), whereas the
control showed no difference in the occipital region (t[9] = -0.23, p = .410). For the parietal
region, neither group showed significant changes across Time 1 and Time 2. The BSM group
had a stronger non-significant trend for the parietal region power increase between Time 1 and
Time 2, t(7) = -0.95, p = .187. The control group showed less of a difference for the parietal
region power increase between Time 1 and Time 2, t(9) = -0.10, p = .462.

51
Figure 17. Gain score occipital and parietal gamma (BSM and control).
Figure 18. Full spectrum interpolated 2d brain representation for gamma.

52
Figure 19. Pretest–posttest changes parietal gamma power (BSM).
Figure 20. Pretest–posttest changes parietal gamma power (control).

53
Figure 21. Pretest–posttest changes occipital gamma power (control).
Figure 22. Pretest–posttest changes occipital gamma power (BSM).
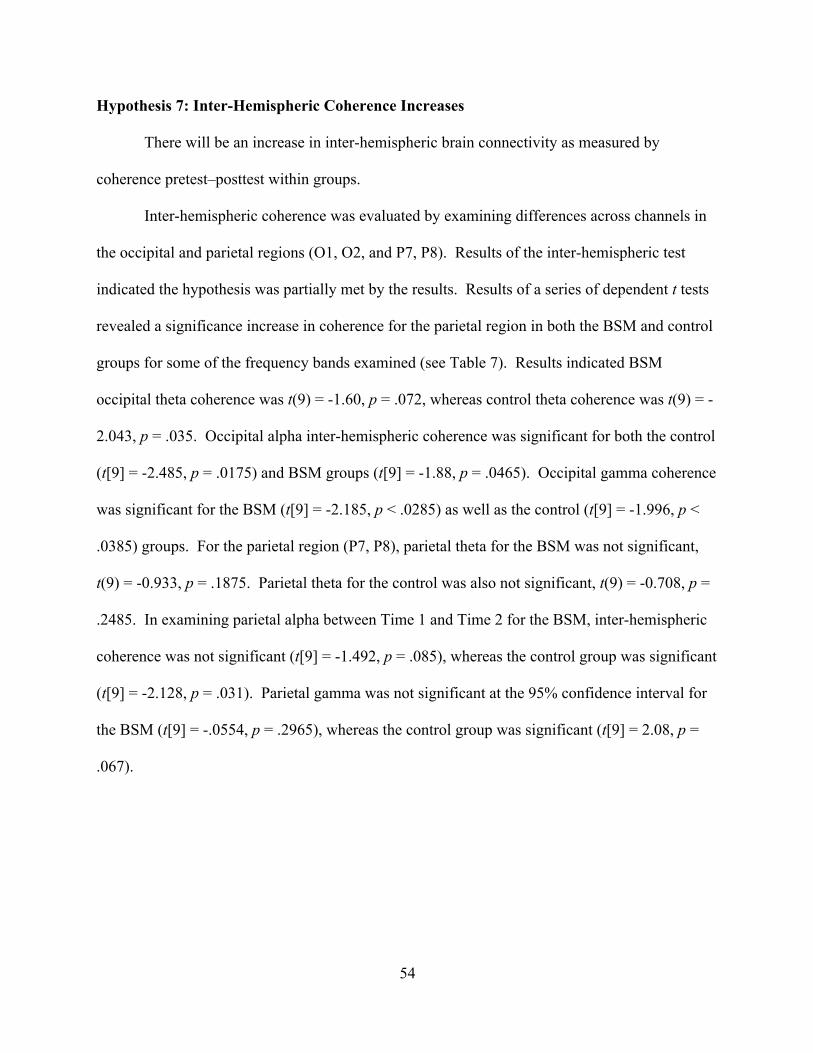
54
Hypothesis 7: Inter-Hemispheric Coherence Increases
There will be an increase in inter-hemispheric brain connectivity as measured by
coherence pretest–posttest within groups.
Inter-hemispheric coherence was evaluated by examining differences across channels in
the occipital and parietal regions (O1, O2, and P7, P8). Results of the inter-hemispheric test
indicated the hypothesis was partially met by the results. Results of a series of dependent t tests
revealed a significance increase in coherence for the parietal region in both the BSM and control
groups for some of the frequency bands examined (see Table 7). Results indicated BSM
occipital theta coherence was t(9) = -1.60, p = .072, whereas control theta coherence was t(9) = -
2.043, p = .035. Occipital alpha inter-hemispheric coherence was significant for both the control
(t[9] = -2.485, p = .0175) and BSM groups (t[9] = -1.88, p = .0465). Occipital gamma coherence
was significant for the BSM (t[9] = -2.185, p < .0285) as well as the control (t[9] = -1.996, p <
.0385) groups. For the parietal region (P7, P8), parietal theta for the BSM was not significant,
t(9) = -0.933, p = .1875. Parietal theta for the control was also not significant, t(9) = -0.708, p =
.2485. In examining parietal alpha between Time 1 and Time 2 for the BSM, inter-hemispheric
coherence was not significant (t[9] = -1.492, p = .085), whereas the control group was significant
(t[9] = -2.128, p = .031). Parietal gamma was not significant at the 95% confidence interval for
the BSM (t[9] = -.0554, p = .2965), whereas the control group was significant (t[9] = 2.08, p =
.067).
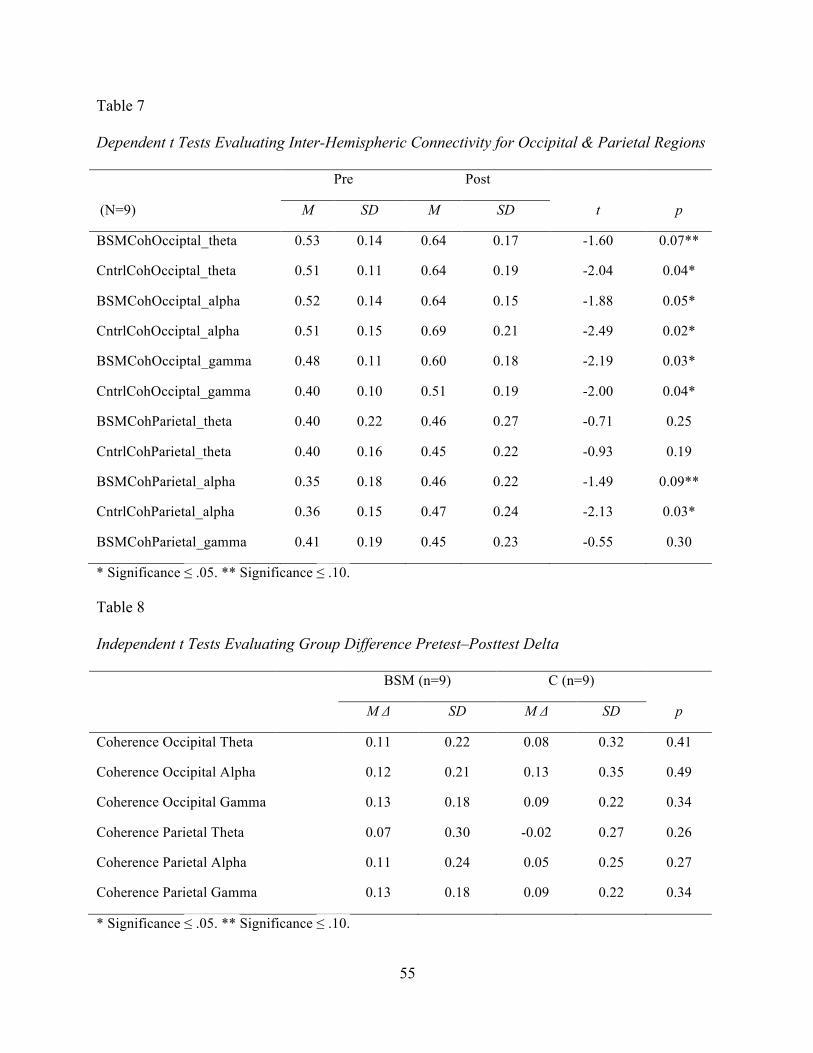
55
Table 7
Dependent t Tests Evaluating Inter-Hemispheric Connectivity for Occipital & Parietal Regions
Pre Post
(N=9) M SD M SD t p
BSMCohOcciptal_theta 0.53 0.14 0.64 0.17 -1.60 0.07**
CntrlCohOcciptal_theta 0.51 0.11 0.64 0.19 -2.04 0.04*
BSMCohOcciptal_alpha 0.52 0.14 0.64 0.15 -1.88 0.05*
CntrlCohOcciptal_alpha 0.51 0.15 0.69 0.21 -2.49 0.02*
BSMCohOcciptal_gamma 0.48 0.11 0.60 0.18 -2.19 0.03*
CntrlCohOcciptal_gamma 0.40 0.10 0.51 0.19 -2.00 0.04*
BSMCohParietal_theta 0.40 0.22 0.46 0.27 -0.71 0.25
CntrlCohParietal_theta 0.40 0.16 0.45 0.22 -0.93 0.19
BSMCohParietal_alpha 0.35 0.18 0.46 0.22 -1.49 0.09**
CntrlCohParietal_alpha 0.36 0.15 0.47 0.24 -2.13 0.03*
BSMCohParietal_gamma 0.41 0.19 0.45 0.23 -0.55 0.30
* Significance ≤ .05. ** Significance ≤ .10.
Table 8
Independent t Tests Evaluating Group Difference Pretest–Posttest Delta
BSM (n=9) C (n=9)
M Δ SD M Δ SD p
Coherence Occipital Theta 0.11 0.22 0.08 0.32 0.41
Coherence Occipital Alpha 0.12 0.21 0.13 0.35 0.49
Coherence Occipital Gamma 0.13 0.18 0.09 0.22 0.34
Coherence Parietal Theta 0.07 0.30 -0.02 0.27 0.26
Coherence Parietal Alpha 0.11 0.24 0.05 0.25 0.27
Coherence Parietal Gamma 0.13 0.18 0.09 0.22 0.34
* Significance ≤ .05. ** Significance ≤ .10.

56
Figure 23. Pretest–posttest coherence changes for parietal region (P7, P8).
Figure 24. Pretest–posttest coherence changes for occipital region (O1, O2).
Hypothesis 8: Heart Rate Coherence Increase
There will be an increase in heart rate coherence for the BSM as compared to the control
group.

57
Heart rate coherence data were examined for changes during each session between pretest
and posttest measurements as well as for pretest and during intervention. After examining the
differences in gain scores across pretest during HR, pretest–posttest HR, pretest–posttest
coherence, pretest during coherence, pretest–posttest achievement coherence, and pretest during
achievement coherence, there were significant group effects for two different periods: pretest
during coherence achievement and pretest–posttest coherence achievement. Pretest during
coherence achievement was significant (t[28] = 1.974, p = .029; coherence achievement score is
the metric of the positive change of coherence over time). The difference in pretest–posttest
coherence achievement between group gain scores was also significant (t[36] = 1.684, p ≤ .05;
initial value of 0.0505 was rounded to .05). This trend indicates the BSM group’s heart rate
coherence achievement was significantly greater than the control group (see Table 10).
Individual dependent t tests elaborated on the difference in heart rate coherence for the BSM and
control groups. BSM coherence between pretest and during measurements was significant (t[29]
= 1.914, p = .039), and pretest–posttest was also significant (t[29] = -1.915, p = .037). For the
control, the pretest–posttest change was not significant, t(29) = -.613, p = .27. Pretest during for
the control group (t[29] = -.613, p = .72) was also not significant at a 95% confidence interval.
The results support the presence of differences in heart rate coherence between the BSM and
control groups.

58
Table 9
Dependent t Test Evaluating Pretest During & Pretest–Posttest Changes for Heart Rate
Coherence
Control (n=17)
BSM (n=14) Pre HR C During HR
M SD M SD p
Control 69.529 6.974 68.471 5.864 0.1675
BSM 67.786 7.287 69.786 5.381 0.147
Pre HR Post HR
M SD M SD p
Control 70.286 6.581 69.524 7.033 0.2285
BSM 68.529 6.947 68.647 6.519 0.464
Pre Coherence During Coherence
M SD M SD p
Control 0.706 0.241 0.876 0.459 0.072**
BSM 0.864 0.424 0.721 0.278 0.039*
Pre Coherence Post Coherence
M SD M SD p
Control 0.71 0.221 0.752 0.347 0.2735
BSM 0.641 0.142 0.729 0.252 0.037*
Pre Achievement Post Achievement
M SD M SD p
Control 83.824 36.137 69.529 32.135 0.049*
BSM 64.762 23.637 69.571 32.411 0.169
Pre Achievement During Achievement
M SD M SD p
Control 83.188 37.224 117.938 64.035 0.0135*

59
BSM 60.467 12.316 138.267 62.389 < .001*
* Significance ≤ .05. ** Significance ≤ .10.
Table 10
Independent t Test of Group Differences for Heart Rate Coherence Gain Scores
BSM (n=14) C (n=17)
df M Δ SD M Δ SD p
Pretest During HR 29 2.00 6.85 -1.06 4.39 0.07**
Pretest–Posttest HR 32 0.12 5.26 -0.71 3.58 0.30
Pretest During Coherence 28 0.22 0.36 0.17 0.46 0.39
Pretest–Posttest Coherence 36 0.09 0.19 0.04 0.32 0.31
Pretest During Coherence A 28 68.29 53.29 33.00 44.64 0.03*
Pretest–Posttest Coherence A 36 4.47 22.85 -11.14 32.18 0.05*
* Significance ≤ .05. ** Significance ≤ .10.
60
Discussion
The outcome data in the previous section addressing the study’s eight hypotheses
revealed a number of salient conclusions. The following section contains the implications of
these results.
Resilience Scales
Results in this section explain the BSM and its effectiveness as related to the resilience
scales used in the study and can be used to interpret how positive visualization could have been
responsible for inducing the attenuation of the measures related to psychopathology. The eight
resilience scales examined did not fully produce the hypothesized effects. Clinical observations
of the BSM underlie changes in motivation and personal growth, and it was thought that there
would be an increase in the PGI scale. The data did partially confirm this hypothesis, as
individual within-group differences for the PGI increased for both the BSM and control groups.
However, there were no differences between the groups themselves. Some thoughts are that the
change in 2-week internal motivation related to Personal Growth cannot be explained on the
basis of positive visualization alone, as the control group, which did not receive the best self
imagery, also had a increase in personal growth, t(34) = -2.14, p = .02. Although the trend of the
BSM’s change was stronger than the control (t[23] = -2.36, p = .01), this difference, as
previously mentioned, was not significant and perhaps could be explained by group-related
effects on motivation. The difference may also be related to issues of construct validity and
dosage when examining a broader trait change over a very limited intervention time with a
seemingly smaller dosage.
In the case of the present study, only two BSM sessions were offered, and the treatment
perhaps may have been unable to influence certain trait effects over such a short time window.

61
Other constructs that also demonstrated limited change between Time 1 and Time 2 were the
DSES, Brief-Compassion, Gratitude, Self-Compassion Scales, Brief Compassion, and
Mindfulness. There were no significant pretest–posttest changes for these scales. The reason for
this limited difference could also underlie the same thoughts on dosage and psychological trait
change.
The only other positive trait scale that had a significant effect was the General Trust
Scale. The General Trust Scale for the BSM group elicited significant changes (t[23] = -1.90, p
= .04), and the control group did not have the same effect (t[34] = -0.57, p = .14). The contrast
between these two measures is perhaps grounded in the positive effects of interpersonal trust on
a number of different social-behavioral and even monetary outcomes, including income (Knack,
2001). Interpersonal trust is the basis for object relations, and Erickson posited the development
of trust to be critical for development of the self and for the first stage of psychosocial
development (Erikson & Erikson, 1998). Problems of early childhood trust can result in
attachment disorders. The BSM was developed in theory around object relations where the best
self acts as a simulated self to address psychological fragmentation as a result of trauma. For the
BSM practice, the newly formed self is then reinforced by individual self-directed and group
initiated loving-kindness. Group members temporally fill the void for any paternal and maternal
love and re-enforce the “proxy self” meant to supplant any psychological fragmentation.
Because theorists in objects relations posit maladaptive relations are projected into external ones,
both maternal and paternal relations devoid of trust are then externalized to other relations that
also have a deficit of trust. To this end, the best self may act as a trust buffer, and this could
partially explain why the BSM had a significant increase versus the control intervention on trust.

62
GAD and PHQ
The researcher hypothesized that both the GAD and PHQ scales would have significantly
lower post-treatment values for the BSM group than for the control group. The hypothesis was
confirmed by the study’s results, as the PHQ and GAD ratings decreased significantly for the
BSM group when compared to the control group data. The mean change of -1.33 for the BSM
group and -.49 for the control group brought the initial anxiety cutoffs from nearly moderate
anxiety levels to clinically “mild” levels. Moderate GAD cutoffs of 9+ attenuated to milder
levels of anxiety in the 5 to 9 range. The between-group gain score differences were significant
and there were significant pretest-posttest changes for the within-group BSM data.
This finding supports previous clinical observations on the effectiveness of the BSM
when compared to a clinical population (Mastropieri, Schussel, Forbes, & Miller, 2015). In the
homeless youth study, when using the BSM paired with a 16-week IPT group therapy
intervention, anxiety levels fell from a mean of 7.10 to a mean of 4.7. In that study there was a
greater reduction of anxiety (M = 2.4) when compared to the present study (M = 1.33), and this is
perhaps related to dosage effects (Mastropieri et al., 2015). BSM dosage is a salient issue when
considering the effectiveness of the BSM or any intervention.
In the previous BSM homeless study, the 16 week intervention most likely had an
additive effect when coupled with group therapy (Mastropieri et al., 2015). However, the
difference in GAD delta between the original homeless study and the present study was 1.07,
indicating the original study, despite its longer duration intervention of 16 weeks, had only a 1.07
larger decrease in GAD anxiety ratings. This observation could give support to the BSM as an
effective brief adjunctive treatment technique when compared to a longer duration treatment. A

63
future study on dosage effects could be an important vehicle to further investigate these salient
clinical observations.
Apart from GAD rating scale changes, the PHQ results yielded a similar net change when
comparisons were made between the two groups. The PHQ delta change of -1.25 for the BSM
group and -.37 for the control was significantly different at a 90% confidence interval and mean
reductions of the PHQ were highly significant for the BSM (t[23] = 2.55, p = .09), whereas the
control was not (t[34] = 0.65, p = .261). The former supports that the BSM was more effective
clinically than the meditation control for changes in PHQ and offers evidence of its clinical
effectiveness as related to both depression and anxiety.
Clinical reductions of the PHQ and GAD values for the BSM versus the active control
groups lend support to the hypothesis that the BSM technique could have value over other self-
regulation techniques and offer some emerging evidence of its clinical efficacy as a modality that
specifically targets psychopathology. The bio-physiological measures provide even more of an
understanding of the basis for the GAD and PHQ reductions on the basis of self-regulation where
the evidence supports a paradoxical outcome based on activation and would partially explain the
BSM’s effectiveness and its basis as a resilience-based technique, as further discussed in the
heart coherence and bio-physiological data section.
Alpha Power
One of the EEG findings in the results section addressed the change in alpha spectral
power. Several meditation studies, especially those related to mindfulness, provided evidence of
increases in alpha power in a number of different brain regions (Chiesa & Serretti, 2010). It was
thought that both the BSM and control would elicit an increase in alpha power in light of the
empirically supported effects for this change. However, this hypothesis was not supported by the

64
study’s data. In the study, occipital alpha power for the control increased non-significantly (t[9]
= -0.77, p = .231), and for the BSM it decreased (t[7] = 0.29, p = .389). The same was also true
for the parietal region where the control increased with a stronger trend non-significantly (t[9] =
-1.19, p = .132), and the BSM decreased non-significantly (t[7] = 0.77, p = .233). The non-
significant alpha changes could be related to the lack of convergent validity between a traditional
“mindfulness” practice and a deep breathing meditation practice or multi-modal method. The
construct measuring mindfulness in the study yielded no significant increase in trait mindfulness
for either the BSM or the control, and this non-significant change for either practice could
provide evidence that excludes both the BSM and control from being defined as traditional
mindfulness. These practices namely include a definition where awareness of the “present
moment” is the primary point of focus. The taxonomy of meditation and mindfulness practices
has been a point of contention in the literature, and this could explain the apparent difference
between the present study and the empirical mindfulness literature where alpha power increases
are common.
The researcher in the current study had partially taken this fact into account and
postulated that the BSM group would have suppressed or blocked alpha when compared to the
control, and this hypothesis appeared to be true. The result of the study demonstrated alpha
power decreased for the BSM group in both the occipital (F[2, 15] = 3.72, p = .049) and parietal
regions (F[2, 15] = 4.21, p = .035). BSM alpha blocking is most likely the result of a state of
internal focus on a visual stimuli. The EEG literature supports alpha blocking during states of
focus and with the locking on to a visual cue (Etevenon, 1986; Kaiser, 2005; Sauseng et al.,
2005). Furthermore, in a comparative study on a form of Zen meditation where meditators
focused on an “inner light,” there was evidence of alpha blocking, and this could partially

65
support why the BSM group’s alpha power spectral values decreased despite self-report of deep
relaxation (Lo et al., 2003). The alpha blocking results could also be confirmation that the BSM
imagery was actively occurring cognitively in the neural profiles of the study’s participants.
Theta Power
This thought leads to the next hypothesis that targeted a different band of spectral EEG
power and posited that the BSM group would have a marked increase in theta power in the
posterior region. An increase in theta would suggest a state of deeper relaxation as theta is
associated with early sleep stages. Theta increases have been cited as evidence of advanced
meditators (Cahn & Polich, 2006). It was also thought that the theta increases would be a basis
for the BSM visualization being integrated into the conscious mind, especially as declarative
memories are thought to be consolidated during theta neural activation (the hippocampus
vibrates at theta). The channels in the posterior brain region did not show a theta increase and
frontal EEG was avoided in light of the chance of conclusions being drawn as a result of artifacts
as opposed to neural sources. The 2d brain interpolation offers an interesting perspective
perhaps suggesting (see Figure 12) the underlying hypothesis has some validity, and theta
changes should not be narrowly localized (i.e., P7, P8, O1, O2).
In the case of the present study, despite the visually compelling evidence that there was a
theta increase for the BSM versus all other conditions, posterior EEG statistics indicated the
result was not significant for the BSM or control groups. Perhaps further analysis can investigate
theta localized in regions other than the parietal and occipital lobes, and further address this
claim.

66
Gamma Power
In previous studies, evidence of gamma increases was found for advanced meditators
(Cahn & Polich, 2006; Lutz et al., 2004) and gamma power was found to be related to positive
emotions, such as laughter (Berk et al., 2016). The BSM has been qualitatively associated with a
sense of euphoria and subjectively positive experiences. Schussel and Miller (2013) reported on
one of their participant’s thoughts regarding the BSM:
It helped me to calm down. It helped me to keep my mind open. It gave me . . . a sense
of euphoria especially when I was upset . . . or felt anxious. It definitely put me in the
right state of mind, and putting me in the right state of mind helped me stay focused and
refocus on what it is that I need to do. (p. 839)
These experiential narratives, along with other self-reported positive experiences during the last
6 years of BSM implementation, could provide an explanation for the present study’s gamma
power data. The BSM group had increases for gamma spectral power and the results were
significantly different than the control group for both the parietal (F[2, 15] = 9.75, p = .002) and
occipital regions (t[7] = -1.94, p = .047). Gamma changes (see Figure 18) could support the
phenomenological differences between a practice that fosters a positive emotional state versus
self-regulation through breathing alone.
EEG Coherence
Cahn and Polich (2006) reported that a number of empirical meditation studies revealed
experimental changes in inter-hemispheric coherence could be linked to states of meditation. It
was hypothesized in present study would produce similar results for both the control and BSM
groups. As self-regulation through rhythmic breathing produces a “zeitgeber” for brain waves to
be globally synchronized to other biological rhythms, coherence could be the result of controlled

67
self-regulation of the heart. In past studies on meditation, certain practices have elicited
synchronization between the heart and brain (McCraty, Atkinson, Tomasino, & Bradley, 2009;
Russek & Schwartz, 1994). In the case of the present study, both meditation practices produced
highly correlated inter-hemispheric changes between the baseline values and posttest. The
changes are interesting in that they support the literature on coherence changes for meditation
practices. However, the data provided no additional information on the differences between the
two modalities, and the lack of a non-active control affected the ability to draw larger
conclusions about the change.
Heart Rate Coherence
Another hypothesis examined in the study was the change of heart rate coherence
between baseline and post-treatment. It was expected that there would be an increase between
the two time points, and differences between the groups would produce evidence of the BSM
eliciting higher values than the control.
In the literature, heart rate coherence has been associated with a number of positive
psychological effects. Increasing levels of heart rate coherence are indicative of both
psychological and physiological resilience (Beckham et al., 2013; Lemaire et al., 2011; McCraty
et al., 1995; McCraty & Tomasino, 2006; Ratanasiripong et al., 2012). In the case of the present
study, it was hypothesized that these changes would appear in the BSM group as opposed to the
control. McCraty and Tomasino (2006) found heart rate coherence changed through the active
practice of loving-kindness and positive emotions, and it was expected that because this quality
was present in the BSM versus the control group there would be clinical effects detected in the
experiment. The results partially supported this statement as the BSM group had increases in
both pretest during coherence achievement (t[28] = 1.97, p = .03) and pretest–posttest coherence
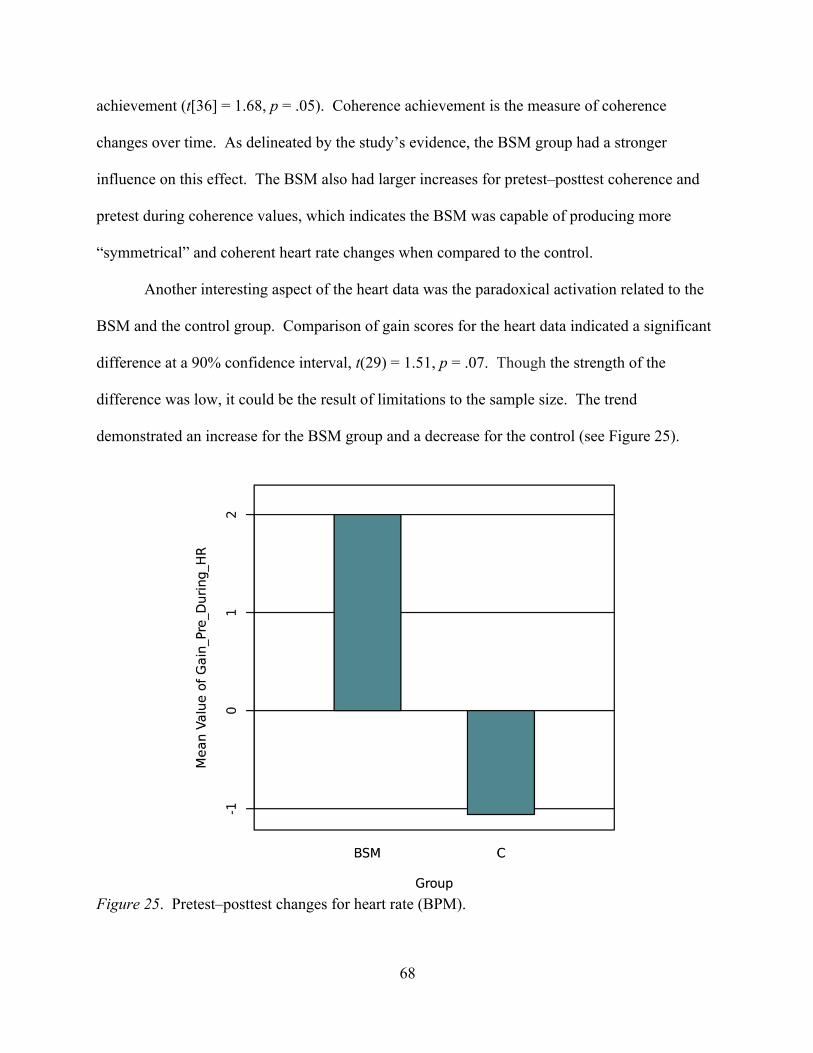
68
achievement (t[36] = 1.68, p = .05). Coherence achievement is the measure of coherence
changes over time. As delineated by the study’s evidence, the BSM group had a stronger
influence on this effect. The BSM also had larger increases for pretest–posttest coherence and
pretest during coherence values, which indicates the BSM was capable of producing more
“symmetrical” and coherent heart rate changes when compared to the control.
Another interesting aspect of the heart data was the paradoxical activation related to the
BSM and the control group. Comparison of gain scores for the heart data indicated a significant
difference at a 90% confidence interval, t(29) = 1.51, p = .07. Though the strength of the
difference was low, it could be the result of limitations to the sample size. The trend
demonstrated an increase for the BSM group and a decrease for the control (see Figure 25).
Figure 25. Pretest–posttest changes for heart rate (BPM).

69
In a number of empirical studies on relaxation and meditation, decreases in heart rate and
other attenuating forms of cardio symthaphagal regulation/activation were associated with
reduced anxiety based on a relaxation response (Bahrke & Morgan, 1978; Patra & Telles, 2010).
To this end, in many cases it is assumed that differential forms of self-regulation are part of the
relaxation response that is associated with reduced bodily tension, and anxiousness, and
increases in the para-sympathetic nervous system. In the case the of the present study, the BSM
increased activation, leading to the possible implication that the component responsible for
reduced anxiety and negative mood states is, in fact, related to the “positive” component of the
BSM. This is further supported by the EEG evidence related to larger gamma spectral power
increases for the BSM group versus the control, and the relationship to positive emotions.
Limitations
The study was fairly complicated in the number of nuanced hypotheses proposed, and
this may have led to some methodological limitations and errors during its implementation. One
possible issue with the study was the monitoring of systematic error during the data collection
process, which could have affected any missing items that occurred during the data entry. This
same thought carries over to the EEG data, which had a fairly strict rejection criterion in which
having one bad channel in posterior region would require the rejection of an entire file. Perhaps
the researcher could have done a better job at ensuring the posterior channels were always
perfectly connected by more acutely monitoring connectivity. Problems with connectivity
resulted in a large number of files being rejected as a result of bad channels and effectively
reduced the net study power of the EEG aspect of the study data, making it harder to detect
experimental effects; this may have resulted in a Type II error. Low power could also partially
be the result of any issues related to the feasibility of remunerating a larger number of subjects
70
with limited funds. Also, a less stringent rejection of file criteria would have ensured a larger
sample at the expense of some additional noise in the data, which may have been adequate for
interpretation. This alternative method could be considered in future permutations of the EEG
data collection.
Another possible limitation of the study is that suggestive experimental demands were
perhaps influenced by the nature of the study’s recruitment flyer. For example, the flier suggests
participation in a relaxation study and this could change the valence of the expectancies within
different participants, and be related to the Hawthorne effect as participants may seek to meet the
demands of the experimenters. A neutral toned flyer will perhaps be better in future permutations
of the research.
Other limitations include understanding better the patients who do not respond well to the
treatment. For example, a highly narcissistic individual may find the BSM enhances grandiose
thoughts, and this could affect them negatively by exacerbating their grandiose and delusional
cognitions. An individual with bi-polar disorder could have their mania fueled by the BSM
intervention in the same way. Other clinical caveats include caution when using the technique
with psychotic patients who could suffer from further splitting, and psychosis during a deep
meditation process that can potentially alter one’s state of consciousness.
For the psychological instruments, there may have been methodology issues related to
Type I error whereby using too many positive resilience scales increased the chances of falsely
detecting an effect. This holds true for all the scales examining positive and resilience-based
constructs as they greatly outnumbered the only two scales measuring psychopathology (i.e.,
GAD, PHQ). More conservative statistical methods, and bonferonni correction could help

71
account for this. Future permutations of the study should perhaps avoid the use of redundant
scales.
Other limitations perhaps relate to the EEG coherence data as the pretest–posttest spectral
coherence values could not confirm a net change in coherence without a comparison group that
had no treatment. Adding an additional comparison group would also address the underlying
power issue, and would require a much large number of subjects, which was not feasible at the
time the study was initiated. Finally, EEG connectivity could be further validated by additional
connectivity models via partial directed coherence (granger causality) or directed transfer
function, which would account for casual relationships and the flow of information (Delorme et
al., 2011).
Future Directions
In future permutations of the study it may make sense to employ additional resilience
scales that underlie state based constructs as opposed to the trait-based scales that were employed
by the study. This would be practical for a short-term intervention and account better for state
based mood changes, especially, as some of participants reported mild euphoria when practicing
the BSM. Possible scales for future rounds of data collection could examine constructs related to
joy, and contentment. Such scales would perhaps provide additional information on differential
emotional state changes, and access data outcomes not included in the study’s data.
A future study could also examine gender and multicultural differences and divide
subjects on the basis of these underlying changes. Also, since part of theory behind the BSM is
focused on object relations and trust as affected by different developmental outcomes it will be
salient to examine the psychopathology and treatment outcome data within different
developmental states. Perhaps, different individuals within differential developmental states

72
respond to the treatment in different ways. Future use of the intervention may require thoughtful
modification, and adjustment of its treatment methodology based on the data examining
differential developmental outcomes.
Other future rounds of data collection could examine stress-induced states, and see how
the BSM could help modify emotional and stress based reactivity. This idea could also be
applied to differential developmental phases as related to trust, and malformed object relations.
Another permutation of the BSM is sending loving-kindness from the best self into a
traumatic memory, which could be clinically effective at reducing the emotional, and
physiological reactivity to trauma based memories. This technique could be linked to certain
methods within TF-CBT that seek to heal trauma by re-telling the trauma narrative and using
resilience-based tools to control stress reactivity.
Closing Comments
Mindfulness and meditation have become ever-important methods of self-regulation and
clinical tools to attenuate psychopathology in the past 50 years. The present study was designed
to investigate a multi-modal meditation practice and delineate both psychological and
physiological distinction from other contemplative treatment methods. The BSM combines
multiple modalities from several different disciplines along with its own novel script.
In summary, the evidence within the present study supports that the BSM is
phenomenologically different from a meditation practice grounded in self-regulation through
breathing and other mindful awareness-based methods. The BSM and its ability to induce
relaxation through positive visualization appear to be paradoxically different than other forms of
meditation and self-regulation practices used to lower heart rate and reduce anxiety through a

73
relaxation response. These techniques are often associated with the attenuation of heart rate and
reduced physiological activity.
In the case of the BSM, activation appeared to be increased as evidenced by heart rate
changes, gamma power increases, and alpha power decreases. These unique differences support
the BSM as a practice that increases activation while simultaneously reducing anxiety and
enhancing mood. Hopefully, this novel psychological practice and adjunctive treatment method
can be used to supplement other clinical treatment techniques in the future, as well as target
psychopathology through different pathways.
As discussed, the BSM actively fosters positive visualization in a deeply relaxed state,
and this positive thinking seemingly directly influences both psychological and physiological
states. Just as imagined piano playing has similar activation to actual playing, and imagined pain
in a hypnogogic and relaxed state produces similar activation to real pain, a best self may
perhaps manifest in the process of imaginal activation (Decety & Grèzes, 2006; Derbyshire et al.,
2004; Meister et al., 2004). The idea of “you become what you think” is rooted in traditional
Buddhist texts such as the sutra called the Dvedhavkitakka, or “Two Modes of Thinking.”
“Whatever a monk keeps pursuing with his thinking and pondering, that becomes the inclination
of his awareness” (Ñāṇamoli & Bodhi, 2009, p. 204). As Desecrates so elegantly put it, “Cogito,
ergo sum [I think, therefore I am].” Perhaps in the future, society can actively pursue its own
best self and a state of inclined positive awareness, and in aggregate change collectively to
become a better society and planet one best self at a time.

74
References
Aftanas, L. I., & Golocheikine, S. A. (2001). Human anterior and frontal midline theta and lower alpha reflect emotionally positive state and internalized attention: High-resolution EEG investigation of meditation. Neuroscience Letters, 310(1), 57–60.
Badcock, N. A., Mousikou, P., Mahajan, Y., De Lissa, P., Thie, J., & McArthur, G. (2013). Validation of the Emotiv EPOC® EEG gaming system for measuring research quality auditory ERPs. PeerJ, 1, e38.
Baer, R. A. (2003). Mindfulness training as a clinical intervention: A conceptual and empirical review. Clinical Psychology: Science and Practice, 10(2), 125–143.
Bahrke, M. S., & Morgan, W. P. (1978). Anxiety reduction following exercise and meditation. Cognitive Therapy and Research, 2(4), 323–333.
Baijal, S., & Srinivasan, N. (2010). Theta activity and meditative states: Spectral changes during concentrative meditation. Cognitive Processing, 11(1), 31–38.
Beauchamp, P. H., Halliwell, W. R., Fournier, J. F., & Koestner, R. (1996). Effects of cognitive-behavioral psychological skills training on the motivation, preparation, and putting performance of novice golfers. The Sport Psychologist, 10(2), 157–170.
Beckham, A. J., Greene, T. B., & Meltzer-Brody, S. (2013). A pilot study of heart rate variability biofeedback therapy in the treatment of perinatal depression on a specialized perinatal psychiatry inpatient unit. Archives of Women’s Mental Health, 16(1), 59–65.
Berk, L., Lee, J., Mali, D., Lohman, E., Bains, G., Daher, N., . . . Shah, S. (2016). Humor associated mirthful laughter increases the intensity of power spectral density (µV2) EEG gamma wave band frequency (31–40Hz) which is associated with neuronal synchronization, memory, recall, enhanced cognitive processing and other brain health benefits when compared to distress. The FASEB Journal, 30(1_supplement), 1284–1289.
Bishop, S. R., Lau, M., Shapiro, S., Carlson, L., Anderson, N. D., Carmody, J., . . . Devins, G. (2004). Mindfulness: A proposed operational definition. Clinical Psychology: Science and Practice, 11(3), 230–241.
Bleick, C. R., & Abrams, A. I. (1987). The Transcendental Meditation program and criminal recidivism in California. Journal of Criminal Justice, 15(3), 211–230.
Cahn, B. R., & Polich, J. (2006). Meditation states and traits: EEG, ERP, and neuroimaging studies. Psychological Bulletin, 132(2), 180.
Callow, N., Hardy, L., & Hall, C. (2001). The effects of a motivational general-mastery imagery intervention on the sport confidence of high-level badminton players. Research Quarterly for Exercise and Sport, 72(4), 389–400.

75
Chiesa, A., & Serretti, A. (2010). A systematic review of neurobiological and clinical features of mindfulness meditations. Psychological Medicine, 40(8), 1239–1252.
Coelho, H. F., Canter, P. H., & Ernst, E. (2013). Mindfulness-based cognitive therapy: Evaluating current evidence and informing future research. Journal of Consulting and Clinical Psychology, 75(6), 1000–1005.
Dafoe, T., & Stermac, L. (2013). Mindfulness meditation as an adjunct approach to treatment within the correctional system. Journal of Offender Rehabilitation, 52(3), 198–216.
Davidson, R. J., & Kaszniak, A. W. (2015). Conceptual and methodological issues in research on mindfulness and meditation. American Psychologist, 70(7), 581.
Decety, J., & Grèzes, J. (2006). The power of simulation: Imagining one’s own and other’s behavior. Brain Research, 1079(1), 4–14.
De Lissa, P., Sörensen, S., Badcock, N., Thie, J., & McArthur, G. (2015). Measuring the face-sensitive N170 with a gaming EEG system: A validation study. Journal of Neuroscience Methods, 253, 47–54.
Delmonte, M. M. (1985). Meditation and anxiety reduction: A literature review. Clinical Psychology Review, 5(2), 91–102.
Delorme, A., & Makeig, S. (2004). EEGLAB: An open source toolbox for analysis of single-trial EEG dynamics including independent component analysis. Journal of Neuroscience Methods, 134(1), 9–21.
Delorme, A., Mullen, T., Kothe, C., Acar, Z. A., Bigdely-Shamlo, N., Vankov, A., & Makeig, S. (2011). EEGLAB, SIFT, NFT, BCILAB, and ERICA: New tools for advanced EEG processing. Computational Intelligence and Neuroscience, 2011, 10.
Derbyshire, S. W., Whalley, M. G., Stenger, V. A., & Oakley, D. A. (2004). Cerebral activation during hypnotically induced and imagined pain. NeuroImage, 23(1), 392–401.
Dillbeck, M. C., & Bronson, E. C. (1981). Short-term longitudinal effects of the Transcendental Meditation technique on EEG power and coherence. International Journal of Neuroscience, 14(3-4), 147–151.
Emotiv Zendesk. (n.d.). Are CMS/DRL references positioned as usually around the mastoid? Are P3 and P4 signals estimated from data of existing (closest) derivations? Retrieved from us/articles/208272813-Are-CMS-DRL-references-positioned-as-usually-around-the-mastoid-Are-P3-and-P4-signals-estimated-from-data-of-existing-closest-derivations
Erikson, E. H., & Erikson, J. M. (1998). The life cycle complete. New York, NY: Norton & Company.
76
Etevenon, P. (1986). Applications and perspectives of EEG cartography. In F. H. Duffy (Ed.), Topographic mapping of brain electrical activity (pp. 113–141). Stoneham, MA: Butterworth Publishers.
Faber, P. L., Lehmann, D., Gianotti, L. R. R., Kaelin, M., & Pascual-Marqui, R. D. (2004, April). Scalp and intracerebral (LORETA) theta and gamma EEG coherence in meditation. In Meeting of the International Society for Neuronal Regulation, Winterthur, Switzerland.
Feltz, D. L., & Landers, D. M. (1983). The effects of mental practice on motor skill learning and performance: A meta-analysis. Journal of Sport Psychology, 5(1), 25–57.
Fredrickson, B. L. (2004). The broaden-and-build theory of positive emotions. Philosophical Transactions-Royal Society of London Series B Biological Sciences, 359(1449), 1367–1378.
Fredrickson, B. L., & Cohn, M. A. (2008). Positive emotions. In M. Lewis, J. M. Haviland-Jones, & L. F. Barrett (Eds.), Handbook of emotions (Vol. 3, pp. 777–796). New York, NY: Guilford Press.
Gliner, J. A., Morgan, G. A., & Harmon, R. J. (2003). Pretest-posttest comparison group designs: Analysis and interpretation. Journal of the American Academy of Child & Adolescent Psychiatry, 42(4), 500–503.
Grossman, P., Niemann, L., Schmidt, S., & Walach, H. (2004). Mindfulness-based stress reduction and health benefits: A meta-analysis. Journal of Psychosomatic Research, 57(1), 35–43.
Grummett, T. S., Leibbrandt, R. E., Lewis, T. W., DeLosAngeles, D., Powers, D. M. W., Willoughby, J. O., . . . Fitzgibbon, S. P. (2015). Measurement of neural signals from inexpensive, wireless and dry EEG systems. Physiological Measurement, 36(7), 1469.
Hatfield, E., Cacioppo, J. T., & Rapson, R. L. (1994). Emotional contagion. New York, NY: Cambridge University Press.
Henrique, L., Antunes, J., & Inácio, O. (2004). The physics of Tibetan singing bowls. Revista de Acústica, 35(1), 33–39.
Herzberg, P. Y. (2008). Validation and standardization of the Generalized Anxiety Disorder Screener (GAD-7) in the general population. Medical Care, 46(3), 266.
Hofmann, S. G., Grossman, P., & Hinton, D. E. (2011). Loving-kindness and compassion meditation: Potential for psychological interventions. Clinical Psychology Review, 31(7), 1126–1132.
Hogg, M. A., & Tindale, S. (Eds.). (2001). Blackwell handbook of social psychology: Group processes. Malden, MA: Blackwell.

77
Hutcherson, C. A., Seppala, E. M., & Gross, J. J. (2008). Loving-kindness meditation increases social connectedness. Emotion, 8(5), 720.
Hwang, J. Y., Plante, T., & Lackey, K. (2008). The development of the Santa Clara Brief Compassion Scale: An abbreviation of Sprecher and Fehr’s Compassionate Love Scale. Pastoral Psychology, 56(4), 421–428.
Jacobs, J., Hwang, G., Curran, T., & Kahana, M. J. (2006). EEG oscillations and recognition memory: Theta correlates of memory retrieval and decision making. NeuroImage, 32(2), 978–987.
Jain, S., Shapiro, S. L., Swanick, S., Roesch, S. C., Mills, P. J., Bell, I., & Schwartz, G. E. (2007). A randomized controlled trial of mindfulness meditation versus relaxation training: Effects on distress, positive states of mind, rumination, and distraction. Annals of Behavioral Medicine, 33(1), 11–21.
Jansen, E. R. (1990). Singing bowls: A practical handbook of instruction and use. Havelte, Holland: Binkeykok Publishing.
Jeannerod, M. (2001). Neural simulation of action: A unifying mechanism for motor cognition. NeuroImage, 14(1), S103–S109.
Jensen, O., & Tesche, C. D. (2002). Frontal theta activity in humans increases with memory load in a working memory task. European Journal of Neuroscience, 15(8), 1395–1399.
Kaiser, D. A. (2005). Basic principles of quantitative EEG. Journal of Adult Development, 12(2-3), 99–104.
Kertz, S., Bigda-peyton, J., & Bjorgvinsson, T. (2013). Validity of the Generalized Anxiety Disorder 7 Scale in an acute psychiatric sample. Clinical Psychology & Psychotherapy, 20(5), 456–464.
King, L. (2001). The health benefits of writing about life goals. Personality and Social Psychology Bulletin, 27, 798–807.
Knack, S. (2001). Trust, associational life, and economic performance. Washington, DC: World Bank Research Department.
Lagopoulos, J., Xu, J., Rasmussen, I., Vik, A., Malhi, G. S., Eliassen, C. F., . . . Davanger, S. (2009). Increased theta and alpha EEG activity during nondirective meditation. The Journal of Alternative and Complementary Medicine, 15(11), 1187–1192.
Lee, R. M., & Robbins, S. B. (1995). Measuring belongingness: The Social Connectedness and the Social Assurance scales. Journal of Counseling Psychology, 42(2), 232.
Lemaire, J. B., Wallace, J. E., Lewin, A. M., de Grood, J. A., & Schaefer, J. P. (2011). The effect of a biofeedback-based stress management tool on physician stress: A randomized controlled clinical trial. Open Medicine, 5(4), 154–165.
78
Levene, H. (1961). Robust tests for equality of variances. In I. Olkin (Ed.), Contributions to probability and statistics. Essays in honor of Harold Hotelling (pp. 279–292). Palo Alto, CA: Stanford University Press.
Lo, P. C., Huang, M. L., & Chang, K. M. (2003). EEG alpha blocking correlated with perception of inner light during Zen meditation. The American Journal of Chinese Medicine, 31(4), 629–642.
Löwe, B., Decker, O., Müller, S., Brähler, E., Schellberg, S., Herzog, W., & Herzberg, P. Y. (2008). Validation and standardization of the Generalized Anxiety Disorder Screener (GAD-7) in the general population. Medical Care, 46(3), 266–274.
Lutz, A., Greischar, L. L., Rawlings, N. B., Ricard, M., & Davidson, R. J. (2004). Long-term meditators self-induce high-amplitude gamma synchrony during mental practice. Proceedings of the National Academy of Sciences, 101(46), 16369–16373.
Mastropieri, B., Schussel, L., Forbes, D., & Miller, L. (2015). Inner resources for survival: Integrating interpersonal psychotherapy with spiritual visualization with homeless youth. Journal of Religion and Health, 54(3), 903–921.
McCraty, R., Atkinson, M., Tiller, W. A., Rein, G., & Watkins, A. D. (1995). The effects of emotions on short-term power spectrum analysis of heart rate variability. The American Journal of Cardiology, 76(14), 1089–1093.
McCraty, R., Atkinson, M., Tomasino, D., & Bradley, R. T. (2009). The coherent heart: Heart-brain interactions, psychophysiological coherence, and the emergence of system-wide order. Integral Review: A Transdisciplinary & Transcultural Journal for New Thought, Research, & Praxis, 5(2).
McCraty, R., & Tomasino, D. (2006). Emotional stress, positive emotions, and psychophysiological coherence. In B. B. Arnetz, & R. Ekman (Eds.), Stress in health and disease (pp. 342–365). Weinheim, Germany: Wiley-VCH Veriag GmbH & Co KGaA.
Meister, I. G., Krings, T., Foltys, H., Boroojerdi, B., Müller, M., Töpper, R., & Thron, A. (2004). Playing piano in the mind—An fMRI study on music imagery and performance in pianists. Cognitive Brain Research, 19(3), 219–228.
Mognon, A., Jovicich, J., Bruzzone, L., & Buiatti, M. (2011). ADJUST: An automatic EEG artifact detector based on the joint use of spatial and temporal features. Psychophysiology, 48(2), 229–240.
Montgomery, G. H., DuHamel, K. N., & Redd, W. H. (2000). A meta-analysis of hypnotically induced analgesia: How effective is hypnosis? International Journal of Clinical and Experimental Hypnosis, 48(2), 138–153.
Ñāṇamoli, B., & Bodhi, B. (2009). The middle length discourses of the Buddha. Somerville, MA: Wisdom Publishing.

79
Neff, K. D. (2003). Development and validation of a scale to measure self-compassion. Self and Identity, 2, 223–250.
Nozaradan, S., Zerouali, Y., Peretz, I., & Mouraux, A. (2013). Capturing with EEG the neural entrainment and coupling underlying sensorimotor synchronization to the beat. Cerebral Cortex, 25(3), 736–747.
Ospina, M. B., Bond, K., Karkhaneh, M., Tjosvold, L., Vandermeer, B., Liang, Y., . . . Klassen, T. P. (2007). Meditation practices for health: State of the research. Evidence Report/Technology Assessment, 155, 1–263.
Patra, S., & Telles, S. (2010). Heart rate variability during sleep following the practice of cyclic meditation and supine rest. Applied Psychophysiology and Biofeedback, 35(2), 135–140.
Perelman, A. M., Miller, S. L., Clements, C. B., Rodriguez, A., Allen, K., & Cavanaugh, R. (2012). Meditation in a Deep South prison: A longitudinal study of the effects of Vipassana. Journal of Offender Rehabilitation, 51(3), 176–198.
Peters, D., & Calvo, R. (2017). Positive computing - Technology for wellbeing and human potential. Cambridge, MA: MIT Press.
Peters, M. L., Flink, I. K., Boersma, K., & Linton, S. J. (2010). Manipulating optimism: Can imagining a best possible self be used to increase positive future expectancies? The Journal of Positive Psychology, 5(3), 204–211.
Raes, F., Pommier, E., Neff, K., & Van Gucht, D. (2011). Construction and factorial validation of a short form of the Self-Compassion Scale. Clinical Psychology & Psychotherapy, 18(3), 250–255.
Ramirez-Cortes, J. M., Alarcon-Aquino, V., Rosas-Cholula, G., Gomez-Gil, P., & Escamilla-Ambrosio, J. (2011). ANFIS-based P300 rhythm detection using wavelet feature extraction on blind source separated EEG signals. In S. Ao, M. Amouzegar, & B. B. Rieger (Eds.), Intelligent automation and systems engineering (pp. 353–365). New York, NY: Springer.
Ratanasiripong, P., Ratanasiripong, N., & Kathalae, D. (2012). Biofeedback intervention for stress and anxiety among nursing students: A randomized controlled trial. ISRN Nursing, 2012, 1–5.
Rauchs, G., Desgranges, B., Foret, J., & Eustache, F. (2005). The relationships between memory systems and sleep stages. Journal of Sleep Research, 14(2), 123–140.
Razali, N. M., & Wah, Y. B. (2011). Power comparisons of Shapiro-Wilk, Kolmogorov-Smirnov, Lilliefors and Anderson-Darling tests. Journal of Statistical Modeling and Analytics, 2(1), 21–33.

80
Rivkin, I. D., & Taylor, S. E. (1999). The effects of mental simulation on coping with controllable stressful events. Personality and Social Psychology Bulletin, 25(12), 1451–1462.
Robitschek, C. (1998). Personal growth initiative: The construct and its measure. Measurement and Evaluation in Counseling and Development, 30, 183–198.
Russek, L. G., & Schwartz, G. E. (1994). Interpersonal heart-brain registration and the perception of parental love: A 42 year follow-up of the Harvard Mastery of Stress Study. Subtle Energies & Energy Medicine Journal Archives, 5(3).
Sauseng, P., Klimesch, W., Stadler, W., Schabus, M., Doppelmayr, M., Hanslmayr, S., . . . Birbaumer, N. (2005). A shift of visual spatial attention is selectively associated with human EEG alpha activity. European Journal of Neuroscience, 22(11), 2917–2926.
Schussel, L. M. (2015, March 19). The best self visualization method. Lecture presented at Transforming Trauma of Political Violence: Lessons from Africa, Middle East & Caribbean at United Nations Church Center, New York City.
Schussel, L., & Miller, L. (2013). Best self visualization method with high‐risk youth. Journal of Clinical Psychology, 69(8), 836–845.
Shapiro, S., de Sousa, S., & Hauck, C. (2016). Mindfulness in positive clinical psychology. In A. M. Wood, & J. Johnson (Eds.), The Wiley handbook of positive clinical psychology (pp. 381–393). Malden, MA: John Wiley & Sons.
Sheldon, K. M., & Lyubomirsky, S. (2006). How to increase and sustain positive emotion: The effects of expressing gratitude and visualizing best possible selves. The Journal of Positive Psychology, 1, 73−82.
Sibinga, E. M., Kerrigan, D., Stewart, M., Johnson, K., Magyari, T., & Ellen, J. M. (2011). Mindfulness-based stress reduction for urban youth. The Journal of Alternative and Complementary Medicine, 17(3), 213–218.
Spitzer, R., Kroenke, K., & Williams, J. (1999). Validation and utility of a self-report version of PRIME-MD: The PHQ Primary Care Study. Journal of the American Medical Association, 282, 1737–1744.
Stickgold, R. (2005). Sleep-dependent memory consolidation. Nature, 437(7063), 1272–1278.
Thut, G., Schyns, P. G., & Gross, J. (2011). Entrainment of perceptually relevant brain oscillations by non-invasive rhythmic stimulation of the human brain. Frontiers in Psychology, 2(170), 170.
Underwood, L. G., & Teresi, J. A. (2002). The Daily Spiritual Experience Scale: Development, theoretical description, reliability, exploratory factor analysis, and preliminary construct validity using health-related data. Annals of Behavioral Medicine, 24(1), 22–33.

81
Vidaurre, C., Sander, T. H., & Schlögl, A. (2011). BioSig: The free and open source software library for biomedical signal processing. Computational Intelligence and Neuroscience, 2011.
Walsh, R., & Shapiro, S. L. (2006). The meeting of meditating disciplines and Western psychology: A mutually enriching dialogue. American Psychologist, 61(3), 227–239.
Weng, H. Y., Fox, A. S., Shackman, A. J., Stodola, D. E., Caldwell, J. Z., Olson, M. C., . . . Davidson, R. J. (2013). Compassion training alters altruism and neural responses to suffering. Psychological Science, 24(7), 1171–1180.
Winson, J. (1978). Loss of hippocampal theta rhythm results in spatial memory deficit in the rat. Science, 201(4351), 160–163.
Yamagishi, T., & Yamagishi, M. (1994). Trust and commitment in the United States and Japan. Motivation and Emotion, 18, 129–166.

82
Appendix A: Psychological Instruments
Personal Growth Initiative Scale Please answer the following questions using the scale below:
1 2 3 4 5 6
Definitely Disagree
Mostly Disagree
Somewhat Disagree
Somewhat Agree
Mostly Agree
Definitely Agree
____________ 1. I know how to change specific things that I want to change in my life. ____________ 2. I have a good sense of where I am headed in my life. ____________ 3. If I want to change something in my life, I initiate the transition process. ____________ 4. I can choose the role that I want to have in a group. ____________ 5. I know what I need to do to get started toward reaching my goals. ____________ 6. I have a specific action plan to help me reach my goals. ____________ 7. I take charge of my life. ____________ 8. I know what my unique contribution to the world might be. ____________ 9. I have a plan for making my life more balanced. Self Compassion Please read each statement carefully before answering and answer each question using the scale below.
1 2 3 4 5 6
Definitely Disagree
Mostly Disagree
Somewhat Disagree
Somewhat Agree
Mostly Agree
Definitely Agree
________ 1. When I fail at something important to me, I become consumed by feelings of inadequacy. ________ 2. I try to be understanding and patient towards those aspects of my personality I don’t like. ________ 3. When something painful happens I try to take a balanced view of the situation. ________ 4. When I’m feeling down, I tend to feel like most other people are probably happier
than I am. ________ 5. I try to see my failings as part of the human condition. ________ 6. When I’m going through a very hard time, I give myself the caring and tenderness I need. ________ 7. When something upsets me I try to keep my emotions in balance. ________ 8. When I fail at something that’s important to me, I tend to feel alone in my failure. ________ 9. When I’m feeling down I tend to obsess and fixate on everything that’s wrong.

83
_______ 10. When I feel inadequate in some way, I try to remind myself that feelings of inadequacy are shared by most people. _______ 11. I’m disapproving and judgmental about my own flaws and inadequacies. _______ 12. I’m intolerant and impatient towards those aspects of my personality I don’t like. Daily Spiritual Experience Scale The list that follows includes items which you may or may not experience, please consider how often you directly have this experience, and try to disregard whether you feel you should or should not have these experiences. A number of items use the word God. If this word is not a comfortable one for you, please substitute another idea which calls to mind the divine or holy for you.
1 2 3 4 5 6
Many Times a Day
Every day Most Days Some Days Once in a While
Never or Almost Never
________ 1. I feel God’s presence. ________ 2. I experience a connection in life. ________ 3. During worship, or at other times when connecting with God, I feel joy, which lifts me out of my daily concerns. ________ 4. I find strength in my religion or spirituality. ________ 5. I find comfort in my religion or spirituality. ________ 6. I feel deep inner peace or harmony. ________ 7. I ask for God’s help in the midst of daily activities. ________ 8. I feel God’s love for me directly. ________ 9. I feel God’s love for me through others. ________ 10. I am spiritually touched by the beauty of creation. ________ 11. I feel thankful for my blessing. ________ 12. I feel a selfless caring for others. ________ 13. I accept others even when they do things that I think are wrong. ________ 14. I desire to be closer to God or in union with Him. ________ 15. In general, how close do you feel to God? Santa Clara Brief Compassion Scale Please read each statement carefully before answering and use the scale below to rate each question.
1 2 3 4 5 6 7
Not at all true of me
Very true of me

84
________ 1. When I hear about someone (a stranger) going through a difficult time, I feel a great deal of compassion for him or her. ________ 2. I tend to feel compassion for people, even though I do not know them. ________ 3. One of the activities that provide me with the most meaning to my life is helping others in the world when they need help. ________ 4. I would rather engage in action that help others, even though they are strangers, than engage in actions that would help me. ________ 5. I often have tender feelings toward people (strangers) when they seem to be in need. General Trust Scale Using the following scale, please indicate how much you agree or disagree with the following statements.
1 2 3 4 5
Strongly Disagree
Disagree Neutral Agree Strongly Agree
________ 1. Most people are basically honest. ________ 2. Most people are trustworthy. ________ 3. Most people are basically good and kind. ________ 4. Most people are trustful of others. ________ 5. I am trustful. ________ 6. Most people will respond in kind when they are trusted by others. Freiburg Mindfulness Inventory Provide an answer for every statement as best as you can. Please answer as honestly and spontaneously as possible. There are neither "right" nor "wrong" answers, nor "good" or "bad" responses. What is important to us is your own personal experience.
1 2 3 4
Rarely Occasionally Fairly often Almost Always ________ 1. I am open to the experience of the present moment. ________ 2. I sense my body, whether eating, cooking, cleaning or talking. ________ 3. When I notice an absence of mind, I gently return to the experience of the here and
now. ________ 4. I am able to appreciate myself. ________ 5. I pay attention to what’s behind my actions. ________ 6. I see my mistakes and difficulties without judging them.

85
________ 7. I feel connected to my experience in the here-and-now. ________ 8. I accept unpleasant experiences. ________ 9. I am friendly to myself when things go wrong. ________ 10. I watch my feelings without getting lost in them. ________ 11. In difficult situations, I can pause without immediately reacting. ________ 12. I experience moments of inner peace and ease, even when things get hectic and
stressful. ________ 13. I am impatient with myself and with others. ________ 14. I am able to smile when I notice how I sometimes make life difficult. Social Connectedness Following are a number of statements that reflect various ways in which we view ourselves. Rate the degree to which you agree or disagree with each statement using the following scale. There is no right or wrong answer. Please do not spend too much time with any one statement and do not leave any unanswered.
1 2 3 4 5 6
Strongly Disagree
Disagree Mildly Disagree
Mildly Agree Agree Strongly Agree
________ 1. I feel comfortable in the presence of strangers. ________ 2. I am in tune with the world. ________ 3. Even among my friends, there is no sense of brother/sisterhood. ________ 4. I fit in well in new situations. ________ 5. I feel close to people. ________ 6. I feel disconnected from the world around me. ________ 7. Even around people I know, I don’t feel that I really belong. ________ 8. I see people as friendly and approachable. ________ 9. I feel like an outsider. ________ 10. I feel understood by the people I know. ________ 11. I feel distant from people. ________ 12. I am able to relate to my peers. ________ 13. I have little sense of togetherness with my peers. ________ 14. I find myself actively involved in people’s lives. ________ 15. I catch myself losing a sense of connectedness with society. ________ 16. I am able to connect with other people. ________ 17. I see myself as a loner. ________ 18. I don’t feel related to most people. ________ 19. My friends feel like family. ________ 20. I don’t feel I participate with anyone or any group

86
Generalized Anxiety Disorder Questionnaire-7 Over the last 2 weeks, how often have you been bothered by any of the following problems? Not at all Several More than Nearly days half the days every day 1. Feeling nervous, anxious or on edge. 0 1 2 3 2. Not being able to stop or control 0 1 2 3 worrying. 3. Worrying too much about different 0 1 2 3 things. 4. Trouble relaxing. 0 1 2 3 5. Being so restless that it’s hard to 0 1 2 3 sit still. 6. Becoming easily annoyed or irritable. 0 1 2 3 7. Feeling afraid as if something awful 0 1 2 3 might happen. 8. If you checked off any problems, how difficult have these problems made it for you to do your work, take care of things at home, or get along with other people? Not difficult at all _____ Somewhat difficult _____ Very difficult _____ Extremely difficult _____ Patient Health Questionnaire-9 Over the last 2 weeks, how often have you been bothered by any of the following problems? Not at all Several More than Nearly days half the days every day 1. Little interest or pleasure in doing 0 1 2 3 things. 2. Feeling down, depressed or hopeless. 0 1 2 3 3. Trouble falling or staying asleep, 0 1 2 3 or sleeping too much. 4. Feeling tired or having little energy. 0 1 2 3 5. Poor appetite or overeating. 0 1 2 3 6. Feeling bad about yourself – or that you are a failure or have let yourself 0 1 2 3 or your family down. 7. Trouble concentrating on things, such as 0 1 2 3 reading the newspaper or watching television. 8. Moving or speaking so slowly that other people could have noticed. Or the opposite – 0 1 2 3 being so fidgety or restless that you have been moving around a lot, more than usual.

87
9. Thoughts that you would be better off dead, 0 1 2 3 or of hurting yourself in some way 10. If you checked off any problems, how difficult have these problems made it for you to do your work, take care of things at home, or get along with other people? Not difficult at all _____ Somewhat difficult _____ Very difficult _____ Extremely difficult _____ The Gratitude Questionnaire (GQ-6) –a six-item scale measuring the disposition to experience gratitude. McCullough, M. E., Emmons, R. A., & Tsang, J. (2002). The Grateful Disposition: A conceptual and Empirical Topography. Journal of Personality and Social Psychology, 82, 112- 127. The Gratitude Questionnaire-Six Item Form (GQ-6) Using the scale below as a guide, write a number beside each statement to indicate how much you agree with it 1= strongly disagree 2=disagree 3=slightly disagree 4=neutral 5=slightly agree 6=agree 7=strongly agree 1. I have so much in life to be thankful for. 2. If I had to list everything that I felt grateful for, it would be a very long list. 3. When I look at the world, I don’t see much to be grateful for. * 4. I am grateful to a wide variety of people. 5. As I get older I find myself more able to appreciate the people, events, and situations that have been part of my life story. 6. Long amounts of time can go by before I feel grateful to something or someone. * *Item 3 and 6 are reverse-scored.

88
Appendix B: Recruitment Flyer

89
Appendix C: Consent Forms
Consent forms for the experimental group and control group are listed sequentially Init:______ Date:________ Time: _______ Group:_________ Sub ID:__________
INFORMED CONSENT Principal Investigators: Dr. Lisa Miller & Lorne Schussel Research Title: Efficacy of Best Self Visualization Method on Well-being and Connectedness DESCRIPTION OF THE RESEARCH: You are invited to participate in a research study on a relaxation technique known as the Best Self Visualization Method (BSM). The purpose of the study is to clarify the psychological and social aspects of this technique. You will be asked to participate in four sessions in a group, once a week for 3 weeks (totaling a four hour time commitment). The first and last sessions will be 1 hour and 30 minutes each. Two of the middle sessions will be 30 minutes long. The study will take place in a classroom at Columbia University (Teachers College). The BSM comprises 4 parts, listed sequentially:
Utilizing a Tibetan singing bowl listening practice for relaxation and focus. Employing a meditation technique that involves controlled rhythmic breathing, and relaxation. Using visualization of a best self, where participants are asked to imagine all the positive qualities of their best possible self. Next, imagined projection and reception of loving-kindness to other group members through an image of their best self. After the session, surveys and physiological measures (brain waves and heart rate sensor) will be administered pre-post the 1st and 4th intervention sessions. RISKS AND BENEFITS: Potential risks are minimal but may include boredom during the questionnaire and possible discomfort during the visualization. Also, discomfort from the EEG, and hand held heart monitoring device. The EEG and heart rate variability measurement devices used in the study are available commercially, and designed for safety and comfort. Electrical discharge from the device is a very small but still there exists some possible risk of shock. The device complies with the Low Voltage Directive 2096/95/EC and is certified with the FCC, XUE-USBD01. To ensure safety, both devices are highly regulated pertaining to any hazardous and safety issues, but if a participant experiences any discomfort, they will be given the option to leave at any time. There are no direct benefits for participating in this study. An indirect benefit is the experience of positive mood, and relaxation. In the event that you would like to terminate your participation at any point of the study, you are free to leave after speaking with the research coordinator (Lorne Schussel, 917-301-4034).

90
All recordings, and survey answers will be saved on a password protected hard drive. All other data will be kept in a locked and secure file cabinet in a secure office space at Teachers College. All identifying information will be coded and encrypted using a sequence of 8 numbers. PAYMENTS: For participation in the study, payment to subjects will be paid whether or not the subject decides to complete the experiment or to withdraw. In other words, you will be paid $50 for participation even if you withdraw from the study. DATA STORAGE TO PROTECT CONFIDENTIALITY: Your questionnaire data contributed to this study will be stored securely in a locked cabinet, and date entered for analysis will be coded to make all data anonymous. All recordings, and survey answers will be saved on a password protected hard drive. TIME INVOLVEMENT: A 3 week commitment including 4 sessions. A 4 hour time commitment in total. The first and last sessions will be 1.5 hours long, and the 2 middle sessions will be 30 minutes long. HOW WILL RESULTS BE USED: The results of the study will be used for research, and may be presented at conferences and published in journals, however, you will be by no means linked to the study as your personal information is kept strictly confidential. PARTICIPANT'S RIGHTS
• I have read and discussed the Research Description with the researcher. I have had the opportunity to ask questions about the purposes and procedures regarding this study.
• My participation in research is voluntary. I may refuse to participate or withdraw from
participation at any time without jeopardy to future medical care, employment, student status or other entitlements.
• The researcher may withdraw me from the research at his/her professional discretion.
• If, during the course of the study, significant new information that has been developed
becomes available which may relate to my willingness to continue to participate, the investigator will provide this information to me.
• Any information derived from the research project that personally identifies me will not
be voluntarily released or disclosed without my separate consent, except as specifically required by law.
• If at any time I have any questions regarding the research or my participation, I can
contact the investigator, who will answer my questions. The principal investigator and research coordinator is Lorne Schussel. His phone number is (917)301-4034.

91
• If at any time I have comments, or concerns regarding the conduct of the research or questions about my rights as a research subject, I should contact the Teachers College, Columbia University Institutional
• I should receive a copy of the Research Description and this Participant's Rights
document. • Review Board /IRB. The phone number for the IRB is (212) 678-4105. Or, I can write to
the IRB at Teachers College, Columbia University, 525 W. 120th Street, New York, NY, 10027, Box 151.
Signature for Consent If you have read this form and have decided to participate in this project, please understand that your participation is voluntary and you have the right to withdraw your consent or discontinue participation at any time without penalty. You have the right to refuse to answer particular questions. Your individual privacy will be maintained at all times. I have read the above description and give my consent to participate in the study. My signature means that I agree to participate in the study. Participant's signature:____________________________________ Date:___/___/___ Printed name:_____________________________

92
Init:______ Date:________ Time: _______ Group:_________ Sub ID:__________
INFORMED CONSENT
Principal Investigators: Dr. Lisa Miller &Lorne Schussel DESCRIPTION OF THE RESEARCH: You are invited to participate in a psychological research study where you will be answering surveys to learn more about psychosocial health and physiological well-being in graduate students. You will be asked to participate in four sessions in a group, once a week for 3 weeks (totaling a four hour time commitment). The first and last sessions will be 1 hour and 30 minutes each, and consist of filling out measures, and being monitored by devices that measure brain waves, and heart rate. The study will take place in a classroom at Columbia University (Teachers College). RISKS AND BENEFITS: Potential risks are minimal but may include boredom during the questionnaire and possible discomfort during the visualization. Also, discomfort from the EEG, and hand held heart monitoring device. The EEG and heart rate variability measurement devices used in the study are available commercially, and designed for safety and comfort. Electrical discharge from the device is a very small but still there exists some possible risk of shock. The device complies with the Low Voltage Directive 2096/95/EC and is certified with the FCC, XUE-USBD01. To ensure safety, both devices are highly regulated pertaining to any hazardous and safety issues, but if a participant experiences any discomfort, they will be given the option to leave at any time. There are no direct benefits for participating in this study. An indirect benefit is the experience of positive mood, and relaxation. In the event that you would like to terminate your participation at any point of the study, you are free to leave after speaking with the research coordinator (Lorne Schussel, 917-301-4034). All recordings, and survey answers will be saved on a password protected hard drive. All other data will be kept in a locked and secure file cabinet in a secure office space at Teachers College. All identifying information will be coded and encrypted using a sequence of 8 numbers. PAYMENTS: For participation in the study, payment to subjects will be paid whether or not the subject decides to complete the experiment or to withdraw. In other words, you will be paid $50 for participation even if you withdraw from the study. DATA STORAGE TO PROTECT CONFIDENTIALITY: Your questionnaire data contributed to this study will be stored securely in a locked cabinet, and date entered for analysis will be coded to make all data anonymous. All other data will be kept in a locked and secure file cabinet in a secure office space at Teachers College. All identifying information will be coded and encrypted using a sequence of 8 numbers. TIME INVOLVEMENT: A 3 week commitment including 4 sessions. A 4 hour time commitment in total. The first and last sessions will be 1.5 hours long, and the 2 middle sessions will be 30 minutes long.

93
HOW WILL RESULTS BE USED: The results of the study will be used for research, and may be presented at conferences and published in journals, however, you will be by no means linked to the study as your personal information is kept strictly confidential. PARTICIPANT'S RIGHTS • I have read and discussed the Research Description with the researcher. I have had the opportunity to ask questions about the purposes and procedures regarding this study. • My participation in research is voluntary. I may refuse to participate or withdraw from participation at any time without jeopardy to future medical care, employment, student status or other entitlements. • The researcher may withdraw me from the research at his/her professional discretion. • If, during the course of the study, significant new information that has been developed becomes available which may relate to my willingness to continue to participate, the investigator will provide this information to me. • Any information derived from the research project that personally identifies me will not be voluntarily released or disclosed without my separate consent, except as specifically required by law. • If at any time I have any questions regarding the research or my participation, I can contact the investigator, who will answer my questions. The principal investigator and research coordinator is Lorne Schussel. His phone number is (917)301-4034. • If at any time I have comments, or concerns regarding the conduct of the research or questions about my rights as a research subject, I should contact the Teachers College, Columbia University Institutional • I should receive a copy of the Research Description and this Participant's Rights document.
• Review Board /IRB. The phone number for the IRB is (212) 678-4105. Or, I can write to the IRB at Teachers College, Columbia University, 525 W. 120th Street, New York, NY, 10027, Box 151.
Signature for Consent If you have read this form and have decided to participate in this project, please understand that your participation is voluntary and you have the right to withdraw your consent or discontinue participation at any time without penalty.

94
You have the right to refuse to answer particular questions. Your individual privacy will be maintained at all times. I have read the above description and give my consent to participate in the study. My signature means that I agree to participate in the study. Participant's signature:____________________________________ Date:___/___/___ Printed name:_____________________________