Looking beyond the cycle - Home | Fresnillo plc · Annual attributable silver production ... Market...
244
Looking beyond the cycle Annual report 2013
-
Upload
vuongtuyen -
Category
Documents
-
view
215 -
download
0
Transcript of Looking beyond the cycle - Home | Fresnillo plc · Annual attributable silver production ... Market...
Looking beyond the cycleAnnual report 2013

Fresnillo plc | Annual report 2013 www.fresnilloplc.com
Operational highlights Financial highlightsAnnual attributable silver production (including Silverstream) up 4.3% to 42.7 moz
Annual attributable gold production down 10.0% to 425,831 oz due to the Ejido El Bajío legal proceedings1 that resulted in disruptions at Minera Penmont
Achieved US$27.4 million in operating efficiencies; productivity indicators improved at Ciénega and Saucito
Dynamic leaching plant at Herradura completed on schedule; rapid progress at Saucito II with early commissioning planned; San Julián progressed but commissioning deferred for 12 months
Total silver and gold resources increased; encouraging exploration results at San Julián, Centauro Deep, Noche Buena and in the Ciénega district; reserves declined due to lower prices used for calculation and conservative mine designs
Advanced the maturity of our HSECR system; positive trends for several indicators, including a range of safety metrics; however, two fatalities in the year indicate more work is required
Financial performance under pressure from lower metal prices
Market confidence in Group’s long-term strategy supported successful share issuance and bond placement
Adjusted revenue2 of US$1,761.9 million, 23.0% lower
Gross profit and EBITDA down 43.8% and 44.5% respectively, to US$767.4 million and US$729.8 million
Profit from continuing operations of US$488.1 million, 54.0% lower
Basic and diluted earnings per Ordinary Share from continuing operations of US$0.329, 68.2% lower
Adjusted EPS of US$0.381, 58.4% lower
Final dividend of 6.8 US cents per Ordinary Share
Our Performance
20132012201120102009
41.3
Attributable silver production*Millions of ounces
42.1
42.741.9 41.0 42.7
20132012201120102009
1,289.0
Total attributable silver resourcesMillions of ounces
1,472.7
2,134.51,811.1 2,033.1 2,134.5
20132012201120102009
13.9
Total attributable gold resourcesMillions of ounces
20.1
28.423.5 27.0 28.4
20132012201120102009
276.6
Attributable gold productionThousands of ounces
369.0
425.8448.9 473.0 425.8
20132012201120102009
944.0
Adjusted revenueUS$ million
1,473.9
1,761.92,307.4 2,287.2 1,761.9
20132012201120102009
0.430
Adjusted EPSUS$
0.740
0.3811.098 0.916 0.381
20132012201120102009
428.8
Profit from continuing operationsUS$ million
833.5
488.11,360.9 1,060.7 488.1
20132012201120102009
21.40
Total dividends paidUS cents
44.80
34.09102.85 57.90 34.09
20132012201120102009
532.3
Gross profitUS$ million
979.4
767.41,563.5 1,364.6 767.4
20132012201120102009
496.6
EBITDAUS$ million
945.0
729.81,538.5 1,315.3 729.8
1 A summary overview of the legal proceedings can be found on page 11.
2 Adjusted revenue is the revenue shown in the income statement adjusted to add back treatment and refining costs and lead and zinc hedging. The Company considers this is a useful additional measure to help understand underlying factors driving revenue in terms of volumes sold and realised prices.
* Graph illustrates silver production from our own mines, with shaded portion representing ounces relating to the Silverstream Contract.

1www.fresnilloplc.com Fresnillo plc | Annual report 2013
Fresnillo Today
Strategic Report
Corporate Governance
Financial Statements
We are the world’s leading silver miner and one of Mexico’s largest gold producers. We see the enduring value of precious metals beyond the current cycle. We’re profitable and we’re investing in the future.Fresnillo plc has always taken the long-term view on precious metals, with a value creation strategy that allows for changing marketplace dynamics. We seek to balance shareholder returns with sustainable growth by focusing on operational excellence and the disciplined development of new projects, investing across price cycles in high potential exploration projects that position us to be a profitable, low-cost producer.
Our aim is to produce 65 million ounces of silver and 500,000 ounces of gold by 2018. Today, we affirm our commitment to delivering on that goal, profitably and sustainably.
Our Investment Case
For a more indepth look at our performance go to pages
54-103

2 Fresnillo plc | Annual report 2013 www.fresnilloplc.com
Operational excellenceWe deploy experienced personnel and advanced technology to optimise returns, with a focus on continuous improvement. Productivity and efficiency efforts in 2013 included improved drill patterns and blasting techniques, more effective maintenance schedules, and lower unit consumption of operating materials and energy.
Our Investment Case What Differentiates Us
Financial strength and flexibilityA conservative and efficient balance sheet and careful management of assets and cash provides us with sufficient capital resources and operational flexibility. We raised over US$345 million in a secondary share issue and US$800 million in senior notes to fund long-term growth. 20132012
415.3
251.2
313.7241.3
Balancing growth and returnsUS$ millions
Dividends Growth capex
656.6 564.9
1.818
Ciénega Saucito
Consumption of explosives Kgs/tonne
1.574 1.211 0.952
2012 2013
2012 2013
1.987
Ciénega Saucito
Consumption of steel balls for milling Kgs/tonne
1.854 1.461 1.419
Competitive cash cost performanceAlong with stringent investment criteria applied at the earliest phases of exploration, we seek to further contain costs during project development and mine operation. Our cash costs in 2013, using both traditional and all-in calculation methodologies, were amongst the lowest in the industry for most of our mines.
0
5
10
15
20
25
30
Silver cash cost curve US$/oz
0 600100 200 300 400 500
Saucito Fresnillo
Silver price
Note: Data are based on 2012 costs,but adjusted to reflect 2013s prices,smelter charges and exchange rates.
Cumulative production (Moz)Source: CRU
Gold cash cost curve US$/oz (as of September 2013)
0
500
1000
1500
2000
2500
3000
3500
1000 25 50 75
Ciénega Penmont
% of cumulative recovered gold (oz)Source: Thomson Reuters GFMS
Gold price

3www.fresnilloplc.com Fresnillo plc | Annual report 2013
Fresnillo Today
Strategic Report
Corporate Governance
Financial Statements
World-class assets and strong organic growth pipelineWe operate the world’s largest primary silver mine and a portfolio of low-cost silver and gold mines, high potential development projects and advanced exploration prospects. We are amongst the largest concession holders in mineral-rich Mexico, and invest in exploration across price
cycles. The Company’s rich resource base, and a proven ability to convert resources into reserves, supports our goal of producing 65 million ounces of silver and 500,000 attributable ounces of gold by 2018, and to sustain that level of production for the next ten years.
201820172016201520142013
2013-2018 Silver production profile* Millions of ounces
38,798 40,242 44,165 55,237 68,235 75,678
38,798 75,678
San Julián Pyrites plant Ciénega Juanicipio – 56% Saucito II Fresnillo expansion Ciénega expansion Saucito I Fresnillo
*Excluding Silverstream
Resources as of 2013
Reservesas of 2013
Ounces mined(2004-2013)
Reserves created from
resourcesand exploration
(2004-2013)
Reserves2003
Conversion of resources into reserves – Fresnillo mine – Silver Millions of ounces
219.3
219.3
622.6
403.3
622.6
345.0
277.6
277.6
800.2
522.6
800.2
Resources as of 2013
Reserves as of 2013
Ounces mined(2004-2013)
Reservescreated from
resources and exploration
(2004-2013)
Reserves2003
Conversion of resources into reserves – Cíenega mine – Gold Millions of ounces
1.3
1.3
2.2
0.9
2.2
1.3
0.8
0.8
1.6
0.8
1.6
201820172016201520142013
2013-2018 Gold production profile Millions of ounces
426 459 438 523 598 628
426 628
Centauro Deep – 56% Pyrites plant Noche Buena – 56% Juanicipio 56% Dynamic leaching – 56% Herradura – 56% Ciénega expansion Saucito II Ciénega San Julián Saucito Fresnillo

4 Fresnillo plc | Annual report 2013 www.fresnilloplc.com
PerformanceAdvancing towards our ambitious production goals, profitably and sustainably.
Maximise the potential of existing operationsWe strive to operate at full capacity, replenish reserves each year, generate continuous improvements in productivity and cost controls, and leverage expansion opportunities.
Deliver growth through development projectsOnce projects meet stringent criteria for mineral content and embedded cost, they are advanced towards development, construction, start-up and production.
Extend the growth pipelineWith continuous investment in exploration across price cycles, we deploy expert personnel and technology to ensure a pipeline of growth projects, striving to maintain reserves sufficient for at least ten years of operation.
Advance and enhance the sustainability of our businessWe focus on the safety and health of our employees, responsible environmental stewardship, the wellbeing of the communities where we operate, and adherence to best governance practices.
Expected production
Risk Investment Gold Silver2014 2015 2016 2017 2018 (US$ million) koz moz
Saucito II Medium Low 235 35 8.4
San Julián Medium 515 44 10.3
Ciénega 5,000 TPD (optimisation project) Low 55 20 1.3
Fresnillo 10,000 TPD (optimisation project) Low 171 n/a 10
Pyrites plant (optimisation project) Medium 105 18 4
Mega Centauro Pit Medium 200 200 N/A
Centauro Deep Medium High 250 200 N/A
Juanicipio Medium Low 300 30 10
Orisyvo High 350 136 N/A
Exploration Exploration and detailed engineering Basic and detailed engineering Detailed engineering Construction Development Production
1
3 4
2
Fresnillo todayFresnillo plc is the world’s leading silver mining company and one of Mexico’s largest gold producers. Headquartered in Mexico City, we are a FTSE 100 company with shares trading on the London and Mexican Stock Exchanges.
Strategy We seek to create value for stakeholders across precious metal cycles, focusing on high potential silver and gold projects that can be developed into low cost, world-class mines.
Fresnillo Today Who We Are
Attributable silver production by mineThousands of ounces
42,743Fresnillo 53.3%Saucito 27.1%Ciénega 9.9%Herradura 0.4%Noche Buena 0.1%Soledad-Dipolos 0.0%Silverstream 9.2%
Attributable gold production by mineOunces
425,831Herradura 34.8%Ciénega 26.3%Noche Buena 14.3%Saucito 10.6%Fresnillo 7.8%Soledad-Dipolos 6.2%
Pages 4-11
Pages 12-53
Pages 54-103

5www.fresnilloplc.com Fresnillo plc | Annual report 2013
Fresnillo Today
Strategic Report
Corporate Governance
Financial Statements
Our business model
“ We will continue to emphasise the importance of achieving excellence on HSECR matters”
Rafael Mac Gregor Chairman, Health, Safety, Environment and Community Relations Committee
Performance Highlights ifc Our Investment Case 1
Performance 54Review of Operations 55Our Mines in Operation 58Our Projects in Development 70Our Exploration Programme 72Social and Sustainability Performance 76Financial Review 92
Corporate Governance
Chairman’s Letter of Governance 105Corporate Governance Overview 106
Board of Directors and Executive Committee 108Corporate Governance Report 112Director’s Remuneration Report 132Directors’ Report 144Statement of Directors’ Responsibilities 147
Financial Statements
Independent Auditor’s Report 149Consolidated Financial Statements 152Notes to the Consolidated Accounts 158Parent Company Financial Statements 207Notes to the Parent Company Accounts 211
Additional Information 232Reserves and Resources Tables 232Operating Statistics 236Glossary 238Shareholder Information 240
1234
Fresnillo Today
Who We Are 4Where We Do It 6A Strong Growth Pipeline 7Chairman’s Statement 8
Summary of the Ejido El Bajío legal proceedings 11
Mr Alvídrez Chief Executive Officer
Alberto Baillères Non-executive Chairman
Strategic Report
Strategy 13A Conversation with our Chief Executive 14Market Overview 18Our Business Model 22Strategy and KPIs 27Managing our Risks 42
Page 22
Page 14
Page 76
Page 8

6 Fresnillo plc | Annual report 2013 www.fresnilloplc.com
1
2
7
312
9
13
54611
10
11 Centauro Deep (at Herradura**)
Indicated and inferred resources:
Gold 2.2 moz
Status: Intensive exploration prior to pre-feasibility study
12 Las Casas (at Ciénega)
Resources are included in Ciénega figures
Status: Intensive exploration, preparation for stoping
13 Saucito II (at Saucito)
Resources are included in Saucito figures
Status: Under construction, start-up 2H 2014
Development and advanced exploration projects7 San Julián
Measured, indicated and inferred resources:
Silver 200.8 moz
Gold 892,800 oz
Status: Under construction, start-up 2H 2015
8 Mega Centauro (at Herradura)
Resources are included in Herradura figures
Status: Intensive infill exploration prior to pre-feasibility study
9 Juanicipio**
Indicated and inferred resources:
Silver 115.0 moz
Gold 452,600 oz
Status: In-mine exploration
10 Orisyvo
Measured, indicated and inferred resources
Gold 9.9 moz
Status: Metallurgical testing of the ore body and evaluation of development options
Our core operations are in Mexico, a country with significant geological resources, strong potential for continued growth, a skilled workforce and solid infrastructure. We will continue to seek and evaluate growth opportunities in Mexico and elsewhere in Latin America.
58-69 Read more: Our mines
Where We Do It
* The Group suspended operations at Soledad-Dipolos in 2H 2013 following the Ejido El Bajío proceedings. Workforce figures reflect 1H 2013 only. See pages 11 and 66 for more information.
** Reserves and resources reflect attributable 56% ownership.
Mines in operation1 Fresnillo
Silver reserves 277.6 moz
Gold reserves 667,000 oz
Mine life (years) 11.8
2013 revenue US$502.7m
Employees 907
Contractors 767
2 Saucito
Silver reserves 128.5 moz
Gold reserves 600,000 oz
Mine life (years) 8.8
2013 revenue US$284.7m
Contractors 999
3 Ciénega & San Ramón
Silver reserves 67.4 moz
Gold reserves 809,000 oz
Mine life (years) 11.9
2013 revenue US$233.4m
Employees 462
Contractors 446
4 Herradura
Silver reserves 1.9 moz
Gold reserves 1.5 moz
Mine life (years) 4.1
2013 revenue US$378.2m
Employees 1,027
Contractors 337
5 Soledad-Dipolos*
Silver reserves 679,000 oz
Gold reserves 436,000 oz
Mine life (years) N/A
2013 revenue US$68.4m
Employees 405
Contractors 388
6 Noche Buena**
Silver reserves 1.1 moz
Gold reserves 625,000 oz
Mine life (years) 2.9
2013 revenue US$147.5m
Employees 417
Contractors 375
Core operations

7www.fresnilloplc.com Fresnillo plc | Annual report 2013
Fresnillo Today
Strategic Report
Corporate Governance
Financial Statements
A Strong Growth Pipeline
Our goal is to profitably and sustainably maintain the Group’s position as the world’s largest primary silver company and a leading gold producer in Mexico. We have an extensive portfolio of projects and prospects.
1 OperateMaximise the potential of existing operations
2 DevelopDeliver growth through development projects
3 ExploreExtend the growth pipeline
4 Sustainability Advance and enhance the sustainability of our business
2 DevelopDeliver growth throdevelopment projec
3 ExploreExtend the growth pipeline
4 Sustainability Advance and enhance the sustainability of our business
ns
ough cts
Mines in operation1 Fresnillo, 2 Saucito,
3 Ciénega & San Ramón, 4 Herradura,
5 Soledad-Dipolos, 6 Noche Buena
New mine construction7 San Julián
Advanced exploration8 Centauro Deep, 9 Juanicipio, 10 Orisyvo,
11 Mega Centauro (at Herradura), 12 Las Casas (at Ciénega)
Prospect in drillingMexico: Fresnillo area of influence, Guachichil, Guanajuato, Manzanillas, Leones, El Cairo, Lucerito, Tocayos, San Juan, Cebadillas, San Nicolás del
Oro, Candameña, Tajitos, La Yesca Peru: Amata, Cautivas, Pilarica
Early stage explorationMexico: San Javier, El Carmen, Urite, Atotonilco, Rosario, Otzumatlán,
Pereñita, La Huerta, Rodeo, Peru: Huacravilca
New early stage explorationLas Norias, El Nudo, Carina, La Choya, Cerritos, El Dorado, S. Brígida,
Rosetillas, SJPinal, Bellavista, C. Blanco, Lucero, Concha-Nieves Corridor, Argentum, Coyotes, Villa García (all in Mexico)
Projects at current mines4 Dynamic leaching (at Herradura),
13 Saucito II (at Saucito)
22 Read more: Our Business Model
8 Fresnillo plc | Annual report 2013 www.fresnilloplc.com
“ We remain well positioned to weather cyclical challenges.”
Alberto Bailléres Non-executive Chairman
Chairman’s Statement

9www.fresnilloplc.com Fresnillo plc | Annual report 2013
Fresnillo Today
Strategic Report
Corporate Governance
Financial Statements
The changing dynamics of the precious metals industry in 2013 proved to be challenging for most mining companies. Falling metal prices, rising operating costs, lower ore grades, increased governmental and community actions, and greater demand from investors for short-term returns had important implications for the strategy, performance and long-term viability of many in our industry.
Fresnillo plc was not immune to these pressures, yet we remain well positioned to weather cyclical challenges thanks to a value creation strategy that accounts for such shifts in market dynamics. Furthermore, while some in our industry were burdened with expensive acquisitions made during the commodity boom, we continued to generate solid profit margins in 2013, albeit below those of the previous year.
The Group’s portfolio of profitable mines and development projects is expected to yield returns even in a low metal price environment. This reflects our long-term strategy of conservative organic growth based on a strong commitment to exploration and the development of efficient, low-cost, world-class operations located in mining districts we know well. Notwithstanding our commitment to this strategy, external circumstances and our own aspirations demand that we adapt to our environment in a process of continuous improvement and work to enhance our role as a corporate citizen.
Responding to a changed market environmentThe most significant impact on performance in 2013 was the decline in precious metal prices. This was neither unforeseen nor remarkable, for us or to those who follow the industry closely. The Group’s long experience in mining – more than a century, in fact, under the Peñoles umbrella – has taught us to expect, plan for and manage through such cycles.
Gold started the year at a high of over US$1,600 per ounce and closed below US$1,300. Our average realised gold price was approximately US$1,400 per ounce, 16.3% less than in 2012. Silver declined from its starting price of US$30.33 per ounce to US$19.47 at year end, with our average realised silver price at $22.83 per ounce, 27.3% lower than in 2012.
This fall in precious metal prices over the course of the year necessitated a review of exploration and capital expenditures, as part of our regular assessment of the Group’s financial resources and requirements.
On management’s recommendation, total investment in exploration for 2013 was reduced by 16.6% from the original budget, to US$233.3 million. Priority was given to projects within our current mining districts and to those with the best mineral potential. Those same strict parameters will continue in 2014, for which US$225.0 million has been allocated to exploration and early project development, in line with our growth strategy and commitment to maintaining the strongest exploration team in Mexico.
Development projects, designed to be low-cost from inception, saw no material change in total budget allocation, but as I outline below, management has modified the timing of certain projects in response to operational and market developments.
At our operating mines, further efficiencies were sought in order to offset higher unit costs for labour, refining charges, electricity and fuel, an effort that must certainly remain in place going forward.
New challengesBeyond the impact of metal prices, the mining industry in Mexico faced its own unique set of challenges in 2013, most notably the marked escalation in land access issues. In response, we elevated the ranking of this risk from fourth place in terms of severity and likelihood, to second place, behind the precious metal price risk.
Under Mexican law, mineral rights belong to the State and only the federal government may issue concessions to explore and mine. Concession holders are required to negotiate with landowners, often agrarian cooperatives known as ejidos, to access the land on which the concessions are located. In 2013, the mining industry in Mexico saw a trend in ejidos disavowing their previously signed agreements and blocking access to mine sites.
The legal issue that arose for our subsidiary Minera Penmont, in which ownership of the surface land of the Dipolos pit and the beneficiation plant of the Soledad-Dipolos mine was contested and ultimately returned to the Ejido El Bajío, must be seen in this broader context. More details can be found on page 11.
The operational implications for us were material, having suspended all mining and beneficiation activity at Soledad-Dipolos as well as mining activity at the larger Herradura mine nearby, due to the temporary suspension of the explosives permit it shared with Soledad-Dipolos. The permitting matter was resolved in early 2014 and we expect gold production to gradually pick up at Herradura as the leaching process stabilises over two to three months and the new dynamic leaching plant commences production. In the meanwhile, Noche Buena will help bolster the Group’s gold production as it continues to ramp up to full capacity.
From a strategic perspective, the elevated risk of access to land brings with it new oversight and control requirements. While we are not immune to opportunistic demands, we continue to believe that fair and transparent land negotiations and productive relationships with local communities and landowners are the basis for lasting agreements. It is my hope that the Mexican authorities will also take action to enforce land agreements and guarantee access to concession holders who take significant operating and financial risk.
Exploration priority: projects within current mining districts and those with the best mineral potential
Fair and transparent land negotiations are the basis for lasting agreements
10 Fresnillo plc | Annual report 2013 www.fresnilloplc.com
The country’s current administration must be recognised for the comprehensive structural reforms presented to Congress in 2013 and subsequently approved. This is arguably Mexico’s most important legislation in recent memory, with numerous new laws governing education, social security, energy, telecoms and banking, among others. The country stands to benefit from job growth, increased foreign investment and more cost-effective energy generation. However, with fiscal reforms that include new charges for mining companies on the basis of 7.5% of a base similar to EBITDA and 0.5% of gold and silver sales, it seems our industry bears a disproportionate share of the burden, which may slow the industry’s growth and the ability of some companies to operate their mines at a profit.
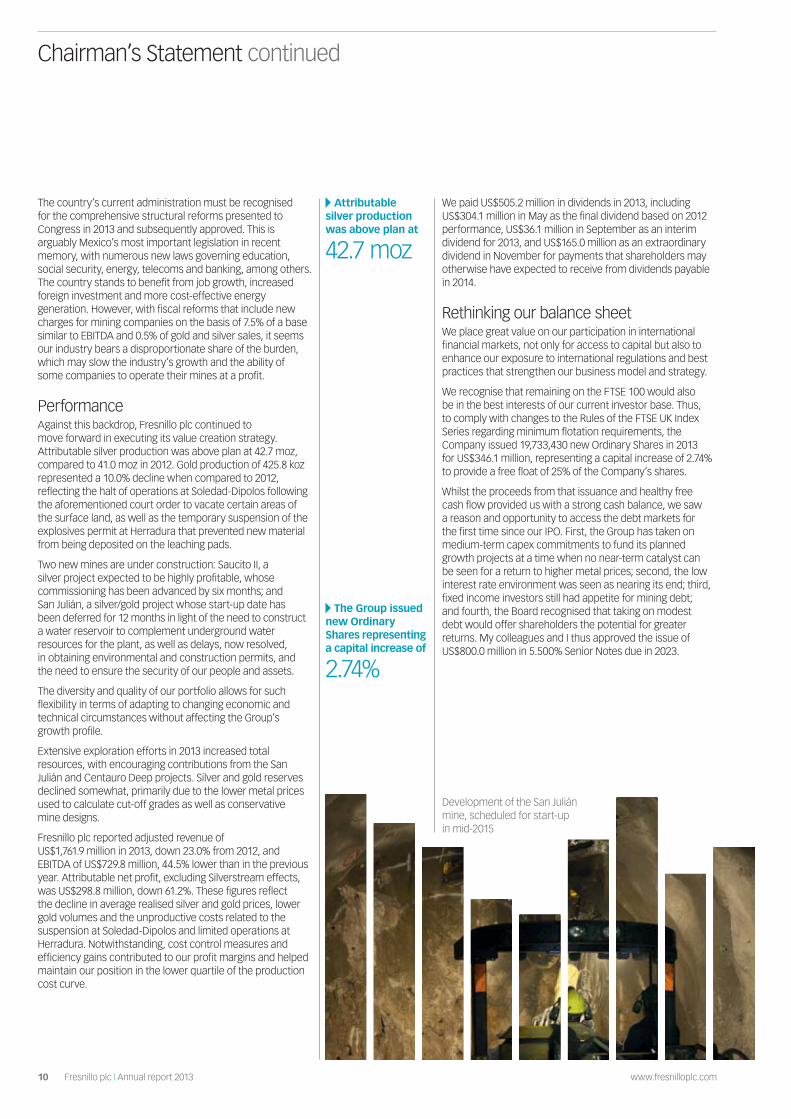
PerformanceAgainst this backdrop, Fresnillo plc continued to move forward in executing its value creation strategy. Attributable silver production was above plan at 42.7 moz, compared to 41.0 moz in 2012. Gold production of 425.8 koz represented a 10.0% decline when compared to 2012, reflecting the halt of operations at Soledad-Dipolos following the aforementioned court order to vacate certain areas of the surface land, as well as the temporary suspension of the explosives permit at Herradura that prevented new material from being deposited on the leaching pads.
Two new mines are under construction: Saucito II, a silver project expected to be highly profitable, whose commissioning has been advanced by six months; and San Julián, a silver/gold project whose start-up date has been deferred for 12 months in light of the need to construct a water reservoir to complement underground water resources for the plant, as well as delays, now resolved, in obtaining environmental and construction permits, and the need to ensure the security of our people and assets.
The diversity and quality of our portfolio allows for such flexibility in terms of adapting to changing economic and technical circumstances without affecting the Group’s growth profile.
Extensive exploration efforts in 2013 increased total resources, with encouraging contributions from the San Julián and Centauro Deep projects. Silver and gold reserves declined somewhat, primarily due to the lower metal prices used to calculate cut-off grades as well as conservative mine designs.
Fresnillo plc reported adjusted revenue of US$1,761.9 million in 2013, down 23.0% from 2012, and EBITDA of US$729.8 million, 44.5% lower than in the previous year. Attributable net profit, excluding Silverstream effects, was US$298.8 million, down 61.2%. These figures reflect the decline in average realised silver and gold prices, lower gold volumes and the unproductive costs related to the suspension at Soledad-Dipolos and limited operations at Herradura. Notwithstanding, cost control measures and efficiency gains contributed to our profit margins and helped maintain our position in the lower quartile of the production cost curve.
We paid US$505.2 million in dividends in 2013, including US$304.1 million in May as the final dividend based on 2012 performance, US$36.1 million in September as an interim dividend for 2013, and US$165.0 million as an extraordinary dividend in November for payments that shareholders may otherwise have expected to receive from dividends payable in 2014.
Rethinking our balance sheetWe place great value on our participation in international financial markets, not only for access to capital but also to enhance our exposure to international regulations and best practices that strengthen our business model and strategy.
We recognise that remaining on the FTSE 100 would also be in the best interests of our current investor base. Thus, to comply with changes to the Rules of the FTSE UK Index Series regarding minimum flotation requirements, the Company issued 19,733,430 new Ordinary Shares in 2013 for US$346.1 million, representing a capital increase of 2.74% to provide a free float of 25% of the Company’s shares.
Whilst the proceeds from that issuance and healthy free cash flow provided us with a strong cash balance, we saw a reason and opportunity to access the debt markets for the first time since our IPO. First, the Group has taken on medium-term capex commitments to fund its planned growth projects at a time when no near-term catalyst can be seen for a return to higher metal prices; second, the low interest rate environment was seen as nearing its end; third, fixed income investors still had appetite for mining debt; and fourth, the Board recognised that taking on modest debt would offer shareholders the potential for greater returns. My colleagues and I thus approved the issue of US$800.0 million in 5.500% Senior Notes due in 2023.
Attributable silver production was above plan at
42.7 moz
The Group issued new Ordinary Shares representing a capital increase of
2.74%
Development of the San Julián mine, scheduled for start-up in mid-2015
Chairman’s Statement continued
11www.fresnilloplc.com Fresnillo plc | Annual report 2013
Fresnillo Today
Strategic Report
Corporate Governance
Financial Statements
11www.fresnilloplc.com Fresnillo plc | Annual report 2013
Summary of the Ejido El Bajío legal proceedings As disclosed in the Company’s 2012 annual report as well as in its various market updates since then, the Company faced a dispute originally presented by five members (the ‘Claimants’) of the Ejido El Bajío (the ‘Ejido’) agrarian community located in Sonora, northern Mexico, against Minera Penmont (‘Penmont’).
As a result of this dispute, Penmont’s occupation agreements over 1,824 hectares of agrarian land located within the Ejido were declared null and void by an Agrarian Magistrate, who ordered Penmont to vacate the land in mid-2013. Penmont complied with this ruling and placed the entirety of the disputed lands at the disposition of the Magistrate, who in turn placed them in deposit before a joint commission comprised of both the Claimants and the Ejido assembly, pending regulatory remediation activities by Penmont over approximately 300 hectares of the land. Penmont’s Dipolos pit is located within these lands, and operations at Dipolos were suspended.
These proceedings also resulted in a temporary suspension by the Mexican Ministry of Defence (MOD) of two explosives permits held by Penmont: (i) the single permit covering the Noche Buena mine; and (ii) the single permit covering the Herradura and Soledad-Dipolos mines. Given that Noche Buena is more than 20 kms away from the Ejido, its permit was reactivated by the MOD.
Various proceedings have since occurred. On 11 February 2014, a district court issued a ruling denying the Ejido the relief it was seeking, namely cease and desist proceedings in an attempt to judicially impede an uplifting of the suspended explosives permit at Herradura and Soledad. On 24 February 2014, the MOD granted a new explosives permit for the Herradura mining unit, thereby allowing Penmont to resume the use of explosives at this mine. Normal mining operations at Herradura resumed in March 2014 as preparations had been made in 2H 2013 for the lifting of the suspension of explosives, with holes for blasting having been pre-drilled at the mine.
As part of the on-going dispute with the Ejido, various claims and counterclaims have been made between the relevant parties. Penmont will continue to evaluate these issues and the Company will make such updates as is necessary to the market in relation to this ongoing dispute in the same way it has during the course of 2013. The Company has no intention of reactivating explosives within the Ejido land affected by the ruling. Furthermore, given that Soledad is not currently economically viable as a stand-alone mine independent of Dipolos, the Company has also suspended operations at that site whilst legal proceedings continue.
Following a comprehensive review of the Company’s current and future financial requirements, we believe our current balance sheet is well placed to meet the Company’s capital expenditure plans and positions us favourably to take advantage of potential accretive acquisition opportunities. We remain committed to prudent financial policies that ensure sufficient cash on hand to invest in existing operations, pursue growth, and maintain a healthy dividend stream.
Sustainable business strategyWe will continue to pursue operational excellence and the disciplined development of new projects by investing across price cycles, and I remain personally focused on ensuring the Group adheres to responsible and sustainable business practices.
It is therefore with deep regret that I report the two fatalities that occurred during the year. We have reviewed each of these incidents as well as the actions taken by management to bolster safety policies, training procedures and supervision. Furthermore, management’s remuneration is tied to safety performance.
An area in which we continue to evolve and advance is the diversity and development of our workforce, as well as the range of measures on which we report in our Social and Sustainability Performance. I encourage you to review our new reporting practices as set out on pages 76-91.
I am grateful to my Board colleagues for their continued insight and engagement, and extend my deepest appreciation to the people of Fresnillo plc for their dedication and focus. As we set our sights beyond the current horizon, I am confident in the capacity of this team and our Group to create continued value for all stakeholders.
Alberto Bailléres Non-executive Chairman
Committed to prudent financial policies: US$225.0 million allocated to exploration and early project development in 2014

12 Fresnillo plc | Annual report 2013 www.fresnilloplc.com
Strategy 13
A Conversation with our Chief Executive 14
Market Overview 18
Our Business Model 22
Strategy and KPIs 27
Managing our Risks 42
Performance 54
Review of Operations 55
Our Mines in Operation 58
Our Projects in Development 70
Our Exploration Programme 72
Social and Sustainability Performance 76
Financial Review 92
Strategic Report
Mining methods, equipment and skilled personnel help maximise the potential of our mines

13www.fresnilloplc.com Fresnillo plc | Annual report 2013
Fresnillo Today
Strategic Report
Corporate Governance
Financial Statements
Strategy
Performance
The strategic report includes information on our strategy and performance
12-103
We seek to create value for our stakeholders across precious metal cycles, focusing on high potential silver and gold projects that can be developed into low-cost, world-class mines.
Strategy

14 Fresnillo plc | Annual report 2013 www.fresnilloplc.com
“ Our focus on cost cutting and operational efficiency remains more relevant than ever.”
“ Investing in long-term growth across metal price cycles will always be a hallmark of our strategy, but prudent capital allocation is critical to maintaining the right balance.”Octavio Alvídrez Chief Executive Officer
A Conversation with our Chief Executive

15www.fresnilloplc.com Fresnillo plc | Annual report 2013
Fresnillo Today
Strategic Report
Corporate Governance
Financial Statements
Strategy
Performance
Q: Much has happened in your first full year as Chief Executive of Fresnillo plc. How would you characterise 2013?
A: By all indications this was indeed a challenging year. The decline in precious metal prices, a
complex legal case resulting in vacating some of our assets and lowering our gold production, unproductive costs related to that issue, the elevation of certain risks facing our operation, I could go on.
But given those factors, and in fact despite those factors, there were a number of bright spots. We exceeded our silver production targets; the new dynamic leaching plant was completed on plan and on budget; construction continues at the new San Julián and Saucito II mines; exploration efforts yielded a number of interesting prospects; and despite new and tougher industry criteria and lower prices used for estimation, our total resources went up in the year.
In fact, it is a testament to the quality of our assets that lower metal prices had such a limited impact on our reserves and resources estimate, and thus mine life.
We also made good progress on most of our social and sustainability goals, with important improvements in safety indices. That said, it saddens and frustrates me that we had two fatalities in the year, so clearly there is still work to do, especially with contractors.
From a financial perspective, our embedded cash costs are still amongst the lowest in the industry, allowing us to maintain healthy margins. We declared and paid US$505.2 million in dividends while investing US$779.9 million in exploration and capex, underscoring our commitment to balancing shareholder returns and long-term growth.
Lastly, on a more personal note, I am delighted that our management team and Executive Committee have expanded to include Roberto Díaz as Chief Operating Officer. His vast experience in mining operations and project development will serve our growth plans well, as does his commitment to safety and sustainability.
Q: Looking at the flagship Fresnillo mine, silver ore grades continued to decline year over year, even more so than anticipated. What can we expect going forward?
A: First, let me clarify that what we saw in 2013 was a combination of the natural decline of the ore
grade in the deeper areas of the San Carlos vein, which we expected, combined with certain structural difficulties in developing new rich areas of the Santa Cruz and San Mateo veins. Thus, production was largely limited to lower ore grade stopes. We expect average ore grades in 2014 to remain at 281 gpt and then gradually decline over the next few years to the ore grade currently in reserves, 271 gpt.
Q: Does this relate to the delay in expanding processing capacity at the Fresnillo mine?
A: It does. We always want to maximise current capacity before adding any additional overhead,
and more development work inside the mine is required to ensure sufficient material to feed a larger plant. Also, the original expansion rationale took into consideration an expected rise in lead and zinc ore grades that would slow recovery rates and affect production volumes. However, with the delay in accessing higher ore grades, this has not been a factor. That said, we have already completed some work on the expansion in terms of site evaluation and basic engineering.
Q: With continued volatility and downward pressure on metal prices, has your operational strategy shifted?
A: Fortunately, thanks to our low cash costs and conservative balance sheet, Fresnillo
can withstand a fair amount of volatility and still remain profitable whilst continuing to fund its growth projects and exploration programme.
Notwithstanding, our focus on cost cutting and operational efficiency remains more relevant than ever: that means extracting the most economically viable material, enhancing the use of technology, and putting greater focus on current mining districts where we can leverage our own infrastructure. Keep in mind that costs for exploration and drilling have actually come down substantially, so we will advance at similar rates going forward but with a lower investment. In terms of capex, we will continue to monitor any changes to our operating assumptions and act accordingly, always favouring actions that accelerate cash flow and deferring expenditures that do not sacrifice the optimal timing of our projects.
2013 investment in exploration and capex
US$779.9 million
Our embedded cash costs are still amongst the lowest in the industry
Our flagship Fresnillo mine – more than 500 years old – remains a profitable base on which to grow

16 Fresnillo plc | Annual report 2013 www.fresnilloplc.com
Q: Do the legal issues the Company faced in 2013 have broader implications for the business?
A: What made those legal proceedings take on greater significance for us was that vacating the
surface land at Dipolos and dismantling the plant meant we would have to suspend operations at its adjacent sister mine Soledad, as the two sites had always been conceived as a single unit with shared infrastructure, and not expected to be economically viable on their own. Furthermore, we faced a temporary halt on blasting at the Herradura mine about 8 km away because of their shared explosives permit. This issue has since been resolved and operations are back to normal at Herradura.
While the incident at Dipolos only related to the claims of one ejido community, unfortunately these kinds of cases are now on the rise in Mexico. We gained important lessons from this, and now having elevated the risk of land access, we apply a very rigorous set of controls to mitigate it.
Q: The security risk has also moved up. Have you seen more impact on operations and projects?
A: There has been an increase in the number – not necessarily severity – of incidents, and whilst
production hasn’t been impacted at this point, we must dedicate more time and resources to secure our people and assets. In fact, this was one of the factors that influenced our decision to defer San Julián. We are working together with federal and local authorities to take preventive measures.
Q: How do Mexico’s new mining duties enacted as part of the fiscal reforms impact your competitiveness?
A: There’s no doubt that these new charges make Mexico somewhat less competitive for the mining
industry than the country had been previously, particularly to junior miners. I imagine the competitive landscape will change as the financial burden on operators increases.
Q: Looking ahead, what opportunities are you most excited about?
A: We haven’t talked much about it yet, but I am very enthusiastic about our prospects in the
Guanajuato district where we obtained very good results at a number of vein systems and increased total gold and silver resources in the district by 5.7% and 36.9%, respectively. Notably, we have much of the infrastructure in place to potentially operate a mine, having resumed control of the Torres mining concessions, mill and surface land, which we had previously leased to a junior company, and the Guanajuato district as a whole has the roads, power, water and experienced labour pool to support such an operation.
Q: What are your priorities for 2014?
A: You’ll find our strategy, objectives and targets covered in great detail throughout this report,
all of which are aimed at advancing us towards our 2018 goal of producing 65 million ounces of silver per year and 500,000 ounces of gold profitably and sustainably. Therefore let me elaborate on the key areas I am personally focused on: people, reserves and resources, and capital allocation.
Without safety, security, health and wellbeing, our workforce is compromised. Fresnillo’s people, therefore, remain my number one priority. We still have work to do on our Safety Action Plan, and I’m looking at our talent development programmes and diversity initiatives as well.
Second, our reserves and resources are the foundation and future of the Company. We must maximise our assets and continue to look for new sources of growth. I am particularly focused on converting resources into reserves, as this is one of the strongest indicators of future production.
Lastly, I am cognisant of the demand for shareholder returns in the current economic environment. Investing in long-term growth across metal price cycles will always be a hallmark of our strategy, but prudent capital allocation is critical to maintaining the right balance. I’ll be keeping a close eye on development and exploration projects to ensure that capital expenditures remain tightly aligned with our ROI criteria.
I am encouraged by our progress already in these first months of the year, and remain committed to excellence in execution as we look ahead.
Silver resources in the Guanajuato district rose
36.9%
A Conversation with our Chief Executive continued
17www.fresnilloplc.com Fresnillo plc | Annual report 2013
Fresnillo Today
Strategic Report
Corporate Governance
Financial Statements
Strategy
Performance
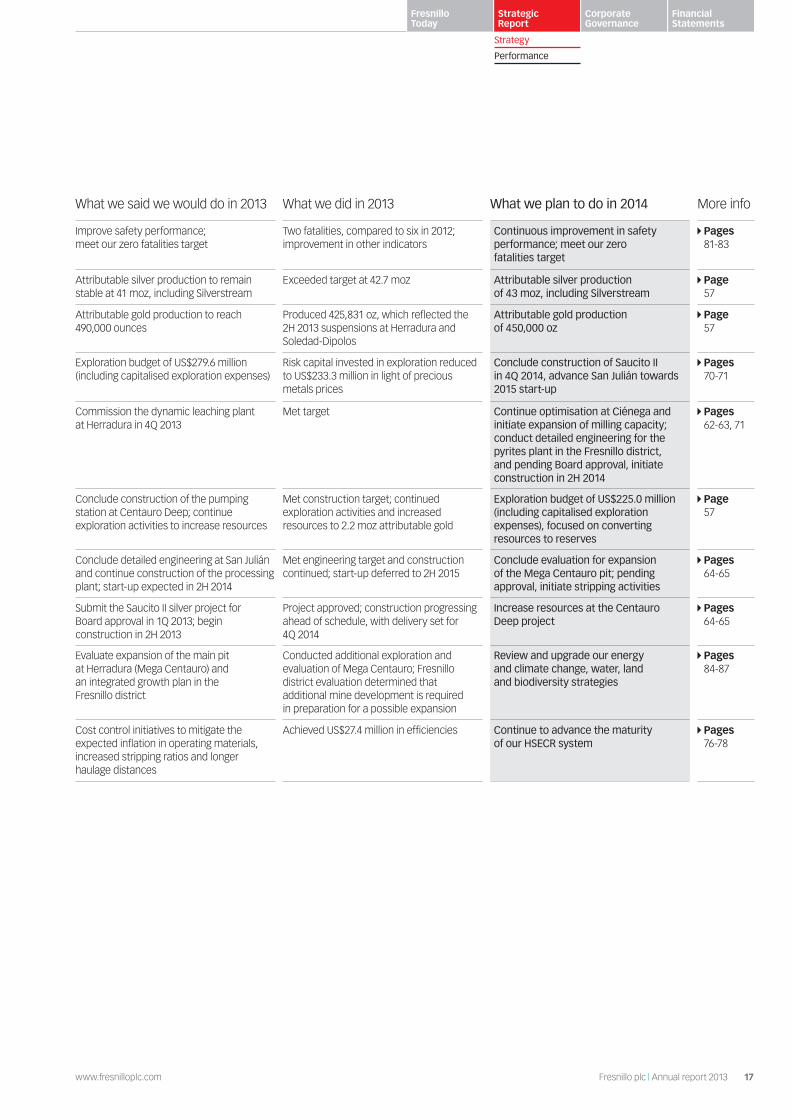
What we said we would do in 2013 What we did in 2013 What we plan to do in 2014 More info
Improve safety performance; meet our zero fatalities target
Two fatalities, compared to six in 2012; improvement in other indicators
Continuous improvement in safety performance; meet our zero fatalities target
Pages 81-83
Attributable silver production to remain stable at 41 moz, including Silverstream
Exceeded target at 42.7 moz Attributable silver production of 43 moz, including Silverstream
Page 57
Attributable gold production to reach 490,000 ounces
Produced 425,831 oz, which reflected the 2H 2013 suspensions at Herradura and Soledad-Dipolos
Attributable gold production of 450,000 oz
Page 57
Exploration budget of US$279.6 million (including capitalised exploration expenses)
Risk capital invested in exploration reduced to US$233.3 million in light of precious metals prices
Conclude construction of Saucito II in 4Q 2014, advance San Julián towards 2015 start-up
Pages 70-71
Commission the dynamic leaching plant at Herradura in 4Q 2013
Met target Continue optimisation at Ciénega and initiate expansion of milling capacity; conduct detailed engineering for the pyrites plant in the Fresnillo district, and pending Board approval, initiate construction in 2H 2014
Pages 62-63, 71
Conclude construction of the pumping station at Centauro Deep; continue exploration activities to increase resources
Met construction target; continued exploration activities and increased resources to 2.2 moz attributable gold
Exploration budget of US$225.0 million (including capitalised exploration expenses), focused on converting resources to reserves
Page 57
Conclude detailed engineering at San Julián and continue construction of the processing plant; start-up expected in 2H 2014
Met engineering target and construction continued; start-up deferred to 2H 2015
Conclude evaluation for expansion of the Mega Centauro pit; pending approval, initiate stripping activities
Pages 64-65
Submit the Saucito II silver project for Board approval in 1Q 2013; begin construction in 2H 2013
Project approved; construction progressing ahead of schedule, with delivery set for 4Q 2014
Increase resources at the Centauro Deep project
Pages 64-65
Evaluate expansion of the main pit at Herradura (Mega Centauro) and an integrated growth plan in the Fresnillo district
Conducted additional exploration and evaluation of Mega Centauro; Fresnillo district evaluation determined that additional mine development is required in preparation for a possible expansion
Review and upgrade our energy and climate change, water, land and biodiversity strategies
Pages 84-87
Cost control initiatives to mitigate the expected inflation in operating materials, increased stripping ratios and longer haulage distances
Achieved US$27.4 million in efficiencies Continue to advance the maturity of our HSECR system
Pages 76-78

18 Fresnillo plc | Annual report 2013 www.fresnilloplc.com
Market Overview
We are exposed to the market dynamics common to the global precious metals industry, as well as to those specific to companies operating in Mexico, which can impact our competitiveness in the precious metals industry.
Competitive environment Silver and gold minersAmongst major precious metal mining companies, Fresnillo plc is unique in that silver and gold contribute in nearly equal parts to its revenues.
In silver, our peer group are other primary silver miners, although much of global production is derived as a by-product of gold, lead, zinc and copper mines. Irrespective, Fresnillo plc has long been amongst the top three global producers of silver, both by-product and primary, and we aim to maintain our leadership position amongst global producers.
In gold we benchmark our performance against medium-sized global gold miners with similar annual production.
The precious metals marketOur performance and that of our peers is driven by the price of precious metals and ultimately the supply and demand dynamics that drive those prices. The extent to which we monitor metal price movements and market dynamics, using primarily third party analyses and forecasts, is to support our financial projections and cash management strategies rather than operational decision-making.
Our production goals are based on what we can profitably extract and sell rather than on external market dynamics. Because embedded costs in most of our mines are significantly lower than current and projected market prices for gold and silver, we continue to operate in line with those goals.
Our strategy of operational continuity is borne of experience in the cyclical nature of the precious metals industry. The Group’s mining experience gives us confidence that the core drivers for demand will prevail, notwithstanding the significant impact of metal price declines on our financial performance in 2013.
Fresnillo plc is a major silver and gold mining company, with the majority of our people and operations located in Mexico.
0
10
20
30
40
20131999198619731960
Gold and silver prices 1963-2013Silver price US$/oz in nominal prices
US$23.79/oz
0200
600
1,000
1,400
1,800
20131999
Source: LBMA
198619731960
Gold and silver prices 1963-2013Gold price US$/oz in nominal prices
US$1,411.23/oz

19www.fresnilloplc.com Fresnillo plc | Annual report 2013
Fresnillo Today
Strategic Report
Corporate Governance
Financial Statements
Strategy
Performance
19www.fresnilloplc.com Fresnillo plc | Annual report 2013
Peer group comparison
2013 2012 2011 2010
Primary silver producers Production in moz
Fresnillo plc 43 41 42 42
Coeur d’Alene Mines Corp. 17 18 19 17Hochschild Mining 14 14 15 18Hecla 9 6 9 11Silver Standard Resources 8 9 7 6Silver Corp Metals 5 5 6 5Global silver producers, by-product and primary Production in moz
Fresnillo plc 43 41 42 42
KGHM Polska Miedz 38* 41 41 37
BHP Billiton 37 39 39 47
Goldcorp Inc. 30 30 28 20
Pan American Silver Corp. 26 25 22 24
Medium-size gold producers Attributable production in koz
Agnico Eagle 1,100 1,044 985 988
Randgold 910 795 696 440
Petropavlovsk 741 710 630 507
Polymetal 805 589 443 444
Fresnillo plc1 426 473 449 369
Oceana 326 233 252 269
Coeur d’Alene Mines Corp. 262 226 221 157
Hochschild Mining 116 112 127 144
Kazakhmys plc 103 129 151 127
* Estimated
1 Total gold production 2013: 611 koz; 2012:687 koz; 2011: 663 koz; 2010: 545 koz
Demand for silver and goldFor silver, demand is driven by fabrication (industrial applications, jewellery and medals, photography and other applications) and investment (coins, bullion and Exchange Traded Funds, or ETFs). A recovering global economy should sustain fabrication demand, while investment demand has proven less volatile than in gold.
For gold, demand is largely driven by its status as a safe haven, with consumers and investors buying the metal to protect their savings and purchasing power in an environment of high inflation and low interest rates, and as a means to diversify away from the US dollar. In some markets gold has strong cultural allure, with China and India leading the demand for gold jewellery, although the Indian government set temporary curbs on gold imports in 2013 to control their current account deficits.
Silver and gold supplyMine output provides the majority of silver supply, and recycling and scrap provide much of the remainder, with government sales a minor and unpredictable source. More than 800 million ounces of silver were produced globally in 2013, compared to 787.0 million in 2012, driven by projects coming online following greater investment in the sector during recent years.
While prices remain above mining costs for the main primary silver producers, weak gold prices will result in the loss of silver production through the closure of some gold/silver mines, and a number of projects that had been anticipated to supply the market have already been delayed or mothballed, which will serve to stabilise short- and medium-term supply in the market.
In gold, mine output accounts for approximately two-thirds of the global gold supply, with the remainder coming from recycling and central bank sales. In a weak price environment, recycling flows are depressed and many miners cannot produce profitably; analysts expect some closures and decreases in output. Furthermore, the tightening of capital expenditures may limit future production; such supply constraints may once again drive positive investor sentiment.
See the Silver Institute and World Gold Council websites for current industry and market information.
20 Fresnillo plc | Annual report 2013 www.fresnilloplc.com
Market Overview continued
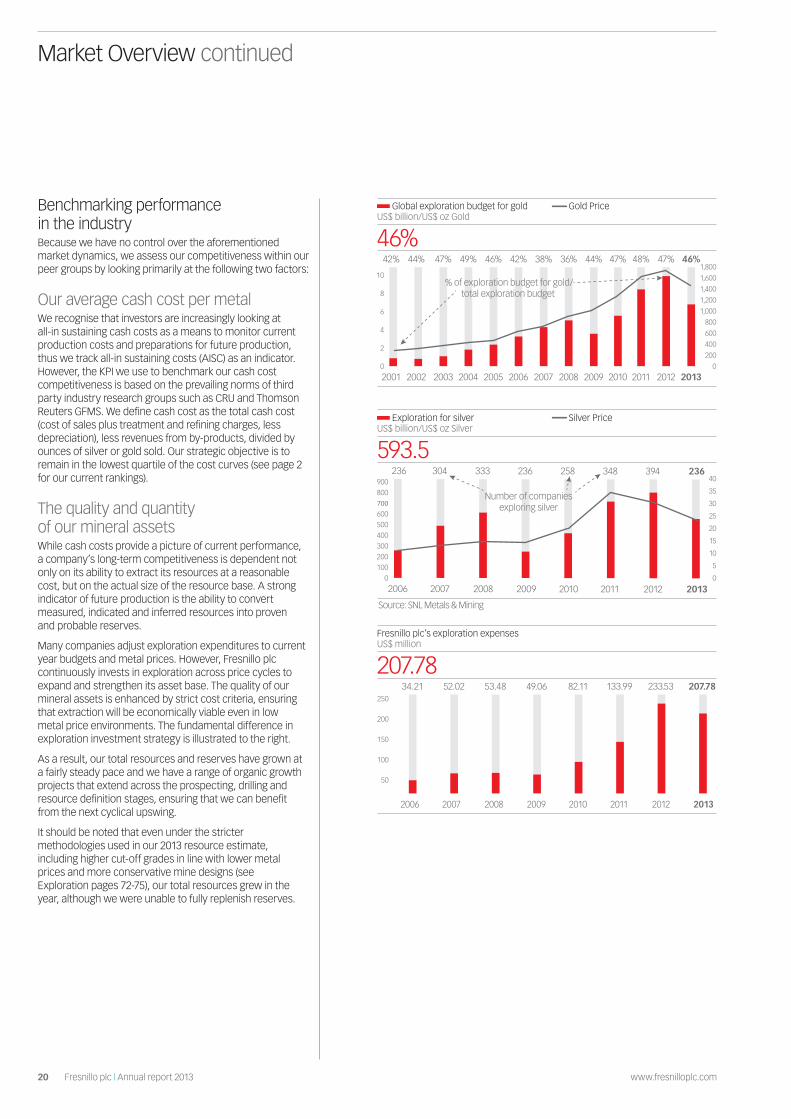
Benchmarking performance in the industryBecause we have no control over the aforementioned market dynamics, we assess our competitiveness within our peer groups by looking primarily at the following two factors:
Our average cash cost per metal We recognise that investors are increasingly looking at all-in sustaining cash costs as a means to monitor current production costs and preparations for future production, thus we track all-in sustaining costs (AISC) as an indicator. However, the KPI we use to benchmark our cash cost competitiveness is based on the prevailing norms of third party industry research groups such as CRU and Thomson Reuters GFMS. We define cash cost as the total cash cost (cost of sales plus treatment and refining charges, less depreciation), less revenues from by-products, divided by ounces of silver or gold sold. Our strategic objective is to remain in the lowest quartile of the cost curves (see page 2 for our current rankings).
The quality and quantity of our mineral assetsWhile cash costs provide a picture of current performance, a company’s long-term competitiveness is dependent not only on its ability to extract its resources at a reasonable cost, but on the actual size of the resource base. A strong indicator of future production is the ability to convert measured, indicated and inferred resources into proven and probable reserves.
Many companies adjust exploration expenditures to current year budgets and metal prices. However, Fresnillo plc continuously invests in exploration across price cycles to expand and strengthen its asset base. The quality of our mineral assets is enhanced by strict cost criteria, ensuring that extraction will be economically viable even in low metal price environments. The fundamental difference in exploration investment strategy is illustrated to the right.
As a result, our total resources and reserves have grown at a fairly steady pace and we have a range of organic growth projects that extend across the prospecting, drilling and resource definition stages, ensuring that we can benefit from the next cyclical upswing.
It should be noted that even under the stricter methodologies used in our 2013 resource estimate, including higher cut-off grades in line with lower metal prices and more conservative mine designs (see Exploration pages 72-75), our total resources grew in the year, although we were unable to fully replenish reserves.
2013201220112010200920082007200620052004200320022001
46%47%48%47%44%36%38%42%46%49%47%44%42%
Global exploration budget for goldUS$ billion/US$ oz Gold
46%10
8
6
4
2
0
1,800
800
1,000
1,200
1,400
1,600
600
400
200
0
Gold Price
% of exploration budget for gold/total exploration budget
20132012201120102009200820072006
304236 236394348258236333
Exploration for silverUS$ billion/US$ oz Silver
593.5900800700
600500400300200100
0
40
35
30
25
20
15
10
5
0
Silver Price
Number of companies exploring silver
Source: SNL Metals & Mining
20132012201120102009200820072006
52.0234.21 207.78233.53133.9982.1149.0653.48250
200
150
100
50
Fresnillo plc’s exploration expensesUS$ million
207.78
21www.fresnilloplc.com Fresnillo plc | Annual report 2013
Fresnillo Today
Strategic Report
Corporate Governance
Financial Statements
Strategy
Performance
We are confident the core drivers for demand will prevail
Fresnillo plc has long been amongst the top three global producers of silver
Industry trendsThe global mining industry faces a number of underlying trends that impact competitiveness and viability. The key trends below are discussed in greater detail in Managing our Risks on pages 42-53:
– Pressures on performance, productivity and operational effectiveness resulting from commodity price volatility and uncertainty, rising costs and maturing mines with declining ore grades
– Limited capital allocation for growth and revised funding scenarios for capital projects resulting from changes to rates of return, rising impairment charges, over-leveraged balance sheets and shareholder demands for returns
– Rising resource nationalism often driven by greater governmental interest in deriving additional revenue from the sector, as well as increasing local demands and activism regarding ownership, profit sharing and sustainability
– Increased regulatory and reporting requirements
– Difficulty in recruiting and retaining a skilled workforce, irrespective of cyclical contraction, particularly those with extensive mining and exploration experience.
Country environmentMexico is the largest producer of silver in the world and a top global producer of gold, copper and zinc, amongst other minerals. It ranks only behind the United States, Canada and Australia in terms of investment attractiveness, in part due to its vast reserves of unexploited minerals. Mining contributes approximately 5% of the country’s GDP, accounting for over 300,000 jobs and remains the fourth largest source of revenue after oil exports and the automotive and electronic industries.
With its long mining tradition – over 500 years – Mexico has a largely favourable environment for the industry in terms of environmental legislation, political climate, skilled workforce and infrastructure. However, recent developments have somewhat altered the attractiveness of mining in the country, and our industry faces other challenges specific to Mexico. The most notable factors impacting the competitiveness and viability of mining in Mexico are outlined below, and discussed in greater detail in Managing our Risks on pages 42-53:
– Fiscal reforms passed in 2013: As part of comprehensive structural reforms passed by the Mexican government in 2013, new duties set to take effect in 2014 were approved for mining companies: 7.5% of a figure similar to EBITDA and 0.5% of gold and silver sales. There is little debate as to the necessity of the overall reforms, but we see a contradiction between the Government’s aims of promoting investment and job creation and the new financial burden placed on the precious metals industry in particular, given declining metal prices and investments in exploration.
– Land access and ownership: Mining concessions confer no rights to the surface land above the mineral resources in the subsoil. Concession holders must negotiate private agreements with landowners, including communally held land as recorded in the National Agrarian Registry. Inconsistent registration and enforcement of inherited ownership rights for communal land has led some opportunistic parties to disavow previously signed agreements – some dating back several decades – in order to seek greater compensation.
– Security: Crime and violence, much of it fuelled by drug cartels, affect many parts of the country. Federal police and armed forces have increased their enforcement activities, as have private citizen groups. While organised criminal networks are now on the defensive, the security situation in Mexico remains an issue.
– Labour and skills shortage: While overall university enrolment has increased recently and the government has passed new education reforms, there is a deficit of geosciences professionals in Mexico.

22 Fresnillo plc | Annual report 2013 www.fresnilloplc.com
A comprehensive risk management framework ensures that we assess and mitigate the risks that could impact our ability to execute our strategy.
Risk Management Framework
Our Business Model
Through our business model we seek to create value for stakeholders across precious metal cycles, focusing on high potential silver and gold projects that can be developed into low-cost, world-class mines.
Fresnillo value chain
2 DevelopDeliver growth through development projects
4 Sustainability Advance and enhance the sustainability of our business
3 ExploreExtend the growth pipeline
1 OperateMaximise the potential of existing operations
1OperateAssets
2DevelopProjects
3Explore
Prospects
4Sustainability
Licence to operate
Financial strength and control
Strategicrelationships
Risk Management Framework
Experienced management and skilled personnel
Technology
Our operations are centred on the exploration, development and operation of gold and silver mines. Sustainable development practices shape our operations and underpin our social licence to operate.

23www.fresnilloplc.com Fresnillo plc | Annual report 2013
Fresnillo Today
Strategic Report
Corporate Governance
Financial Statements
Strategy
Performance
Stakeholder support
Strategic relationships
Strategic enablers
Employees GovernmentSuppliersCommunities Customers Shareholders and Partners
Job creation
Wages and benefits
Profit sharing
Professional development
Productivity
Commitment
Payment for goods and services
Support for local economy
Quality
Fair prices
Technical support
Infrastructure
Education/healthcare
Arts/athletics
Conservation
Quality of life
Access
Trust
Respect
Treatment and refining charges
Timely intake and payment
Flexibility
Dividends
Capital gains
Capital Concessions
Permits
Access to capital markets
Tax revenue
GDP contribution
Value
Fresnillo plc
Exploration for mineral resources
Development and construction of
new mines
Mineral extraction and beneficiation
Smelting and refining Brokers Buyers
Precious metal value chain
Strategic resources and relationships support the effective execution of our business.

24 Fresnillo plc | Annual report 2013 www.fresnilloplc.com
1 OperateThe extraction and beneficiation of ore from our operating mines.
2 DevelopThe development and construction of new operating mines and facilities.
Key assetsAsset Annual production
Completed in 2013: Dynamic leaching plant
Facility at Herradura to process high-grade ore from the district
Average attributable annual production of 28,000 oz gold
Project completion 4Q 2013
In process: San Julián
An underground mine in the San Julián district
Average annual production estimated at 10.3 moz silver and 44,000 oz gold
Start-up 2H 2015
Saucito II
Expansion project at Saucito for a secondary underground mine, Fresnillo district
Average annual production estimated at 8.4 moz silver
Start-up 4Q 2014
Pending: Pyrites treatment plant
Facility at Fresnillo to process tailings from the Fresnillo and Saucito mines to increase gold and silver recovery rates
Average annual production estimated at 4 moz silver and 18,000 oz gold
Start-up 2H 2016
All projects must meet stringent viability criteria including but not limited to resource definition, metallurgy, mine design, environmental impact, investment requirements, sustaining capital expenditures and rates of return. For greenfield projects in new mining districts such as San Julián, we also consider eventual expansion and synergy potential with our other prospects in the district.
We deploy specialised contract engineering and construction teams, whose services we contract from Peñoles (see Suppliers, page 26), for the disciplined advancement of all projects towards development, construction, start-up and production.
Cross reference to risk section Pages 46-49, 52
Strategic focus:
Deliver growth through development projects.
Key assetsAsset Type Commodity Year
Fresnillo district
Fresnillo Underground Silver primary 1554
Saucito Underground Silver primary 2011
Ciénega district
Ciénega Underground Gold 1992
San Ramón (Ciénega satellite) Underground Gold 2012
Herradura district
Herradura Open pit Gold 1997
Soledad-Dipolos4 Open pit Gold 2010
Noche Buena Open pit Gold 2012
Our operating mines share a number of key characteristics: a) geographic proximity within prime gold and silver mining districts in Mexico where we seek to consolidate our position and derive synergies from shared infrastructure; b) with the exception of Fresnillo, which has been in near continuous operation for almost 500 years, our mines were subject to rigorous viability criteria prior to development, including embedded cash costs well below consensus forecast metal prices; and c) adaptive extraction methods that reflect changing mine characteristics. Combined, these factors position our cost performance competitively amongst industry peers.
We primarily rely on our own expert personnel for key functions such as engineering, mine planning, explosives handling and safety oversight, while skilled mining labour is generally contracted for excavation, stripping, hauling and processing work. The workforce is largely drawn from the communities around our mines.
Cross reference to risk section Pages 46-48, 52
Strategic focus:
Maximise the potential of existing operations.
4 The Group suspended operations at Soledad-Dipolos in 2H 2013 following the Ejido El Bajío proceedings. See page 11.
Our Business Model continued Business Model Components

25www.fresnilloplc.com Fresnillo plc | Annual report 2013
Fresnillo Today
Strategic Report
Corporate Governance
Financial Statements
Strategy
Performance
3 ExploreThe search for ore deposits that expand our resource base.
4 SustainabilityThe responsible operation of our business to create value for and ensure the wellbeing of stakeholders, without compromising future generations, through policies and practices implemented from the earliest stages of exploration until mine closure.
Key pillars
Health Safety
Environment Community Relations
Socially responsible development has long been a strategic driver for Fresnillo plc with established programmes in place prior to our IPO. Notwithstanding, the listing in the UK in 2008 brought new requirements and opportunities to enhance our strategy, implementation and controls. Today, we benefit from Board-level oversight, executives and managers dedicated to sustainability efforts, and a comprehensive approach that informs our value-creation metrics. Our licence to operate relies on the effectiveness of our HSECR (health, safety, environment, community relations) policies, procedures, programmes, equipment, training, monitoring, execution and controls.
We rely on our own executives and staff for oversight, training and implementation of HSECR policies and programmes, and work closely with employees, contractors, unions, communities, governmental agencies, industry organisations, NGOs and other third parties to ensure that our performance adheres to the standards, needs and aspirations of our stakeholders.
Cross reference to risk section Pages 47-48, 50, 52-53
Strategic focus:
Advance and enhance the sustainability of our business.
Key assetsAsset Type
Fresnillo district
Juanicipio Silver
Ciénega district
Las Casas Silver and gold
Herradura district
Centauro Deep Gold
Chihuahua (greenfield)
Orisyvo Gold
Other early stage projects and prospects, Mexico and Peru
Our pipeline of organic growth projects extends across the prospecting, geological studies, drilling and resource definition stages. Prospects must have a minimum potential of 100 moz of silver or 2 moz of gold equivalent and meet strict criteria on ore grades, metallurgical recoveries and environmental impact. We acquire concessions that advance our district consolidation strategy; the Group currently holds one of the largest land positions in Mexico. We also pursue early stage partnerships and make selective acquisitions in Mexico and potentially elsewhere in Latin America.
Our experienced team of geologists, working from five regional exploration offices, utilise advanced technology and tools to identify new areas of mineralisation and analyse core samples, while relying on skilled contractors, our own and those of Peñoles, to conduct drilling campaigns.
Cross reference to risk section Pages 46-48, 51-52
Strategic focus:
Extend the growth pipeline.

26 Fresnillo plc | Annual report 2013 www.fresnilloplc.com
Strategic enablersThe key inputs required to sustain our value creation model.
Strategic resourcesFinancial strength and controlStrict control of cash, assets, costs and expenses to retain our competitive position as a low-cost producer, which allows us to ensure operational continuity and deliver shareholder returns.
Experienced management and skilled personnelPersonnel with the requisite knowledge, skills and experience to execute our strategy; selection, recruitment, training, development, compensation and retention programmes help secure this resource.
TechnologyAdvanced tools and systems that support exploration, increase productivity, reinforce sustainability, enhance accountability, and support decision-making and financial planning processes.
Strategic relationships Key suppliers of equipment and services; contractors; customers; equity partners in our mines and projects; authorities and regulators; employees; community members and organisations where we operate.
Strategic relationshipsContract and unionised labourWe rely on skilled and reliable labour for our operations. Contractors are strategic partners for key development functions and some operational activities at certain mines, and are integrated into our employee management systems and training programmes in order to align practices and performance with our strategic objectives. Our workforce plays a key role in our efforts to improve our safety record, notably through the ‘leadership and commitment’ element of the No More Accidents programme.
We strive to maintain mutually respectful relations with local labour unions through continuous dialogue and collaboration, including yearly contract negotiations with the unionised workforce. We are committed to providing a safe, equitable and fair work environment. To date, Fresnillo plc has not experienced a work stoppage or industrial action as a consequence of labour disputes with the Group, or with Group companies with whom labour unions have collective agreements.
CommunitiesHealthy community relations require a deep respect for and knowledge of the customs, cultures, needs and expectations of each community where we operate. Engagement efforts begin at the earliest phases of exploration and continue throughout the lifecycle of a project, including beyond mine closure. We invest directly and through partnerships in a range of initiatives that aim to enhance the quality of life and long-term wellbeing of our communities, with a focus on environment, education, health and social integration, entrepreneurship, and social infrastructure.
SuppliersWe negotiate long-term purchase agreements with key suppliers to secure better pricing and ensure timely availability of key equipment, materials and services. The Group contracts Servicios Administrativos Peñoles, S.A. de C.V. (SAPSA), a Peñoles subsidiary, to supply administrative services. The relationship is regulated by a Services Agreement (NSA, or New Services Agreement), ensuring that all services are delivered at arm’s length and on normal commercial terms as per the Relationship Agreement with the Peñoles Group.
CustomersSubstantially all of the primary products originating from our mines in 2013 were sold to the Met-Mex Peñoles, S.A. de C.V. refining and smelting facility in Torreón, Coahuila (Mexico) under a series of supply
agreements that enable us to benefit from relatively low transport costs associated with the proximity of their operations. The terms of the supply agreements with Met-Mex are set on an arm’s length basis based on international benchmarks. The Group has sold to other refiners and smelters in the past and may do so in the future if conditions warrant.
Shareholders and note holdersThe major shareholder in Fresnillo plc is Industrias Peñoles S.A.B. de C.V., which holds 75% of the issued share capital of the Company. Peñoles has been the principal investor in Group assets for over 50 years and is committed to our long-term growth and development. Peñoles is also a significant supplier of services to the Group, as described in the Suppliers section herein.
25% of Fresnillo plc shares trade on the London and Mexican Stock Exchanges, and bondholders own US$800 million of Senior Secured Notes due 2023. The Group maintains a regular dialogue with its independent investors and note holders as described in the Corporate Governance Report.
PartnersThe Group owns 56% of Minera Penmont S. de R.L. de C.V., with Newmont USA Limited holding 44%. Minera Penmont owns the Herradura, Soledad-Dipolos and Noche Buena mines. The Group has a 56% interest in the Juanicipio project, while MAG Silver Corporation has a 44% interest, the agreement with MAG Silver was entered into for the development of the Juanicipio concession. We also partner with a number of junior exploration companies to conduct early stage prospecting.
Membership organisationsWe belong to a number of key industry and trade groups in Mexico that help advance our strategic objectives. These include: CAMIMEX, the Mexican Mining Chamber, which promotes sector agreements, advocates industry positions, and sets benchmarks for the mining sector; CESPEDES (Sustainable Development Studies Commission for the Mexican Private Sector, part of the Mexican Business Coordinating Council, or CCE), which coordinates the private sector stance on key issues such as the transition towards a green economy and greenhouse gas mitigation efforts in the country; and the Mining Cluster for the State of Zacatecas, through which mining industry participants in Zacatecas state promote the development of economic, social and environmental best practices across the supply chain.
Authorities and regulatorsIn Mexico and Peru, we must secure mining concessions from the federal government in order to explore for and exploit mineral deposits. We are subject to the laws and regulations governing all companies, and those for natural resources and mining companies in particular, that are promulgated by various branches of the government. These include environmental and construction permits and the use and handling of explosives, among others. We are also subject to state and municipal laws and ordinances in the specific localities where we operate.
As a publicly-traded company on the London and Mexican stock exchanges, the Company is subject to issuer requirements from these exchanges as well as financial and regulatory oversight from the securities regulators in the UK and Mexico.
Risk management frameworkThe identification, evaluation and mitigation of the principal risks that could affect the Company’s ability to execute its strategy and deliver on its commitments.
Risk identification, assessment and mitigation are performed at all levels of the organisation, from the Board and Executive Management to the operational level at each site. Risk management processes and internal controls operate across our mine sites, exploration and development projects, and corporate offices, as well as across functional areas including finance, HSECR, human resources, procurement, IT, legal, security and insurance management.
Our Business Model continued Business Model Components
27www.fresnilloplc.com Fresnillo plc | Annual report 2013
Fresnillo Today
Strategic Report
Corporate Governance
Financial Statements
Strategy
PerformanceStrategy and KPIs
Our value creation strategy is founded on four pillars intrinsically linked to the business model.
Strategic objective Strategic priorities KPIs
1 Operate: Maximise the potential of existing operationsMaintain our position as a leading low-cost precious metals producer
– Optimise capacity and recovery rates by refining mining methods and beneficiation processes
– Replenish reserves
– Generate continuous improvements in productivity and cost controls
– Leverage expansion opportunities
– Attributable production by metal
– Cost per tonne by mine
– Productivity by mine (ore milled or moved per person)
– Proven and probable reserves (attributable) by metal
2 Develop: Deliver growth through development projectsAdvance new projects towards commissioning, optimising cash flow and returns
– Adhere to strict delivery timelines and capex budgets
– Project delivery against budget/timeline
3 Explore: Extend the growth pipelineEnsure business continuity by expanding total resources and maintaining reserves sufficient for at least ten years of operation
– Allocate continuous funding across metal price cycles
– Advance prospects and projects along the exploration pipeline (from early stage to drilling to advanced)
– Convert resources to reserves
– Total attributable resources by metal
4 Sustainability: Advance and enhance the sustainability of our businessUphold our licence to operate – Fully integrate the HSECR System across
the organisation
– Improve and maintain the health of our people
– Eliminate unsafe workplace conditions and behaviours
– Enforce and enhance environmental management practices
– Engage the communities where we operate
– Attract, retain and develop our people
– Fatal injuries
– Fatal injury frequency rate
– Lost time injury frequency rate
– GHG emissions and intensity
– Water withdrawal
– Community investment
Financial value creationEnsure profitable growth and shareholder returns
– Maintain our competitive low cash cost position
– Maintain flexible capital funding options
– Maximise free cash flow available for growth and returns
– Cash cost per ounce by mine
– EBITDA and EBITDA margin
– Cash flow from operating activities before changes in working capital
– Earnings per share
Page 28
Page 32
Page 34
Page 36
Page 40

28 Fresnillo plc | Annual report 2013 www.fresnilloplc.com
What we said we would do in 2013
Optimise capacity and recovery rates by refining mining methods and beneficiation processes – Maintain attributable silver production at a stable 41 moz, including
Silverstream; produce 490,000 ounces of attributable gold
– Conclude construction of the Jarillas shaft
– Commission the dynamic leaching plant at Herradura in 4Q 2013
– Optimise the milling process at Ciénega by reducing bottlenecks, increasing the volume of ore processed and maintaining production levels at expected lower gold ore grades
– Accelerate the leaching process in the pads at Soledad-Dipolos
Replenish reserves
Generate continuous improvements in productivity and cost controls – Implement cost cutting and efficiency initiatives to mitigate the
expected inflation in operating materials, increased stripping ratios and longer haulage distance
Leverage expansion opportunities – Evaluate new and/or expanded processing capacity in the Fresnillo
district, including a 2,000 tpd extension to the current Fresnillo beneficiation plant, and a pyrites plant at Saucito to increase gold recoveries from Fresnillo and Saucito tailings
In 2013, we ramped up production at our newest mines, Saucito and Noche Buena, optimised milling processes and increased ore throughput at Ciénega, which has been in operation for more than 20 years, and achieved a number of operating efficiencies that allowed us to mitigate cost pressures. However, as a result of the events related to the El Bajío litigation (see pages 11 and 64-69), we were unable to pursue our strategic objectives at the Penmont mines.
1 OperateMaximise the potential of existing operations
The milling process at Ciénega has been optimised and increased above its nominal capacity with the use of technology, the knowledge and experience of our personnel, and continuous investment in improvements at our facilities. As a result, the size of the mineral fed to the mills is smaller, which improves the use of reagents and thus lowers cost per tonne.
Strategy in action
Strategy and KPIs continued

29www.fresnilloplc.com Fresnillo plc | Annual report 2013
Fresnillo Today
Strategic Report
Corporate Governance
Financial Statements
Strategy
Performance
What we did in 2013 What we plan to do in 2014
– Silver production rose 4.3% to 42.7 moz; gold production of 425.8 koz reflected the decrease in production in the Herradura district
– Jarillas shaft commissioned and contributed to accessing the rich Jarillas vein
– Dynamic leaching plant commissioned on plan
– Ore processed at Ciénega increased 11.6% over the year mitigating lower gold ore grades
– Acceleration of leaching process at Soledad-Dipolos cancelled following the dismantling of the beneficiation plant
– Increase the rate of stope development at Fresnillo to supply 10,000 tpd throughput
– Deepen the San Carlos shaft to reduce haulage costs from the deeper levels of the mine
– Increase mine development on the Jarillas vein at Saucito in preparation for the Saucito II expansion
– Continue to ramp-up capacity to 75,000 attributable gold ounces at Noche Buena
– Silver reserves decreased by 4.3% mainly as a result of lower prices and delayed development at Fresnillo, mitigated by an increase in reserves at Saucito; gold reserves decreased by 14.5% due to the sensitivity of open pit mines to lower gold prices and more conservative cost figures
– On-going in-mine and area of influence exploration to increase reserves by converting resources
– Achieved US$27.4 million in efficiencies, helping mitigate costs pressures; productivity indicators improved at Ciénega and Saucito
– In underground mines, optimise blasting, reduce ore dilution, increase usage of plants and equipment; at open pit mines, increase haulage efficiency
– Determined that expansion of Fresnillo district processing capacity will not take place in 2014 due to additional mine development required to warrant it; continued to evaluate development of a pyrites plant, resulting in a favourable determination to proceed with engineering
– Conduct detailed engineering for the pyrites plant, and pending approval, initiate construction in 2H 2014
– Conclude detailed engineering for expansion of milling capacity at Ciénega to 5,000 tpd and initiate construction in 2H 2014
– Evaluate Centauro pit expansion at Herradura; pending approval, initiate stripping activities

30 Fresnillo plc | Annual report 2013 www.fresnilloplc.com
Attributable productionSum of ounces produced multiplied by ownership interest in each mine, plus ounces accrued through the Silverstream Contract. This indicator monitors total production levels at our mines and contributions from advance development projects.
2013 resultsSilver production increased by 4.3% due to the ramp-up of production to full capacity at Saucito and the increased production at Ciénega arising from higher silver ore grade at the San Ramón satellite mine.
Attributable gold production decreased by 10.0% due to the stoppage of operations at Soledad-Dipolos in 2H 2013 and the temporary suspension at Herradura (see pages 11, 64-69). These adverse effects were mitigated by the ramp-up of production at Noche Buena.
* Graph illustrates silver production from our own mines, with shaded portion representing ounces relating to the Silverstream Contract.
Cost per tonneAdjusted production costs (total production costs less depreciation, profit sharing and exchange rate hedging effects) divided by total volume of tonnes processed. This monitors variations of costs directly related to the production process; the analysis of such variations improves management’s decision-making.
2013 resultsAdjusted production costs at our underground mines were affected by the Group’s 7.3% estimated cost inflation and the 3.0% revaluation of the Mexican peso/US dollar exchange rate. These effects were mitigated, and in the case of Ciénega more than offset, by efficiencies achieved through economies of scale and cost reduction initiatives such as the use of wire mesh to optimise shotcreting, better operating controls that reduced consumption of materials such as steel balls for milling, and the optimised use of reagents. Suspended operations in 2H 2013 resulting from the Ejido El Bajío proceedings distorted this indicator, however, 1H 2013 was impacted by the following increases: contractors hired to haul ore and waste; consumption of diesel due to longer haulage distances, and consumption of sodium cyanide to improve recovery rates. In the case of Noche Buena, cost per tonne was impacted by ramp-up of production in its first full year of operations, albeit disrupted by the suspension of the explosives permits for almost two months; whereas in 2012 it operated for ten months and ore from development during the construction of the mine was deposited.
1 Operate KPIs
20132012201120102009
41.3
Silver production*Millions of ounces
42.1
42.741.9 41.0 42.7
37.9 38.6 37.9 36.9 38.8
20132012201120102009
36.5
FresnilloUS$/tonne milled
40.9
45.643.0 44.5 45.6
20132012201120102009
59.2
Ciénega & San RamónUS$/tonne milled
63.2
70.873.4 77.1 70.8
20132012
Noche BuenaUS$/tonne deposited
7.86.6 7.8
201320122011
SaucitoUS$/tonne milled
61.051.8 60.9 61.0
20132012201120102009
5.4
HerraduraUS$/tonne deposited
5.6
8.46.0 6.2 8.4
2013201220112010
Soledad-DipolosUS$/tonne deposited
5.7
9.95.8 6.3 9.9
20132012201120102009
276.6
Gold productionThousands of ounces
369.0
425.8448.9 473.0 425.8
Strategy and KPIs continued

31www.fresnilloplc.com Fresnillo plc | Annual report 2013
Fresnillo Today
Strategic Report
Corporate Governance
Financial Statements
Strategy
Performance
20132012201120102009
1,614
FresnilloOre milled per person (tonnes)
1,668
1,6151,620 1,703 1,615
20132012201120102009
1,054
Ciénega & San RamónOre milled per person (tonnes)
1,120
1,3691,230 1,230 1,369
20132012
Noche BuenaOre/waste moved per person (tonnes)
101,125152,977 101,125
20132012201120102009
374.0
Silver reserves Millions of ounces
441.6
477.2403.4 498.5 477.2
20132012201120102009
101,755
HerraduraOre/waste moved per person (tonnes)
91,919
70,37092,231 85,931 70,370
2013201220112010
Soledad-DipolosOre/waste moved per person (tonnes)
111,746
52,633103,455 88,336 52,633
20132012201120102009
4.3
Gold reservesMillions of ounces
4.5
4.74.6 5.5 4.7
201320122011
SaucitoOre milled per person (tonnes)
1,1121,007 975 1,112
ProductivityTonnes of ore milled per person, including contractors, at underground mines; and tonnes of ore deposited and waste material moved per person, including contractors, at open pit mines.
2013 resultsFresnillo: The decrease reflects the additional number of contractors hired for development and backfilling activities.
Saucito: The increase is due to the ramp-up of production and access to the Jarillas vein, which allowed for additional ore to be processed from development activities.
Cienéga and San Ramón: The increase is due to the optimisation of the milling process.
Herradura: This indicator was distorted, as unionised employees and contractors from the suspended Soledad-Dipolos mine were transferred to Herradura for training and to carry out development.
Noche Buena: 2013 was the first full year of operations at Noche Buena, but it was disrupted by the suspension of explosives permits and affected by the transfer of unionised employees and contractors from Soledad-Dipolos. In 2012, ore from development activities and from upper parts of the pit was deposited at the leaching pads.
Soledad-Dipolos: This indicator was distorted, as the mine was only in operation in 1H 2013 and tonnage of ore and waste moved corresponded to that period.
Proven and probable reserves (attributable)A measure of the quality of the Group’s operating assets and our ability to extend the life of operating mines at profitable levels. Our goal is to have 650 million ounces of silver and 5.0 million ounces of gold in reserves by 2018.
2013 resultsSilver reserves decreased by 4.3% primarily as a result of lower ore grade, reflecting the change in price and development delays at Fresnillo; this was partially mitigated by increased reserves at Saucito. Gold reserves decreased by 14.5% due mainly to the reduced tonnage at Herradura and Soledad-Dipolos as a result of the new calculation methodology.

32 Fresnillo plc | Annual report 2013 www.fresnilloplc.com
Variation from timeline: Timeline revised in 2012 for relocating the plant, with no variation since; commercial operations require sufficient material from resumed mining activity at Herradura (see page 64-65 and 70)
Original capex budgetUS$ million
US$106.0 m
Revised budgetUS$ million
US$116.0 m
Total capex to date US$ million, project completed
US$115.6 m
Original timeline
2011-2013
What we said we would do in 2013
Adhere to strict delivery timelines and capex budgets – Conclude construction and commence operation of the dynamic
leaching plant at Herradura
– Conclude detailed engineering and continue the construction of the San Julián processing plant, with start-up expected in 2H 2014
– Initiate construction of Saucito II
KPIs
Project deliveryAbility to adhere to forecasted schedules and budgets. This measures management’s forecast strength and execution capabilities.
Dynamic leaching plant
Strategy and KPIs continued
The dynamic leaching plant was completed on time and on budget in 2013 and we advanced the development of two new mines, Saucito II and San Julián, both vital to our 2018 goals. We modified the delivery of these projects in response to certain operational and market developments.
2 DevelopDeliver growth through development projects
The new dynamic leaching plant at Herradura

33www.fresnilloplc.com Fresnillo plc | Annual report 2013
Fresnillo Today
Strategic Report
Corporate Governance
Financial Statements
Strategy
Performance
Variation from timeline: One year, in order to build a reservoir that will ensure sufficient water supply for both the leaching and flotation plants, to optimise capex allocation, and to reinforce security measures
* Excludes transactions with contractors
Original capex budget*US$ million
US$500.0 m
Revised budget*US$ million
US$515.0 m
Total capex to date* US$ million, committed US$124.1 m
US$90.2 m
Original timeline
2012-2014
What we did in 2013 What we plan to do in 2014
– Commissioned the dynamic leaching plant and conducted initial tests; full-scale operations require sufficient material from resumed mining activities at Herradura
– San Julián construction continued; mine commissioning deferred for one year due to delays in obtaining certain permits, now resolved, and in order to ensure sufficient water supplies and reinforce security measures
– Saucito II construction advanced rapidly, expected start date brought forward to 4Q 2014
– Conclude Saucito II construction and commence operations in 4Q
– Continue construction of the leaching plant and development of the veins at San Julián
– Initiate expansion of milling capacity at Ciénega
– Conclude evaluation for expansion of the Mega Centauro pit; pending approval, initiate stripping activities
San Julián

34 Fresnillo plc | Annual report 2013 www.fresnilloplc.com
What we said we would do in 2013
Allocate continuous funding across metal price cycles – US$279.6 million budgeted for exploration
Advance prospects and projects along the exploration pipeline (from early stage to drilling to advanced) – At Las Casas, prepare a pilot stope to verify the geological model
and geotechnical characteristics; conduct a scoping study
– At Centauro Deep, conclude construction of the pumping station, continue exploration activities to increase the resource base
– Evaluate the Mega Centauro expansion project
– At Juanicipio, continue the exploration programme in accordance with the recommendations of the pre-feasibility study
– At Saucito II, submit the feasibility study for Board approval in 1Q 2013; begin construction in 2H 2013 for the expansion of the Saucito mine
Convert resources to reserves
KPIs
Total resources (attributable)Quantifies measured, indicated and inferred resources at all our assets; an indicator of the Group’s growth potential and ability to discover and develop new ore bodies.
Strategy and KPIs continued
We conducted a highly targeted yet extensive exploration programme in 2013 on 25 properties, prioritising the most promising prospects and projects within our current concession areas. Notwithstanding the stricter resource estimation criteria and lower metal prices, our total silver and gold resources increased in the year. Of particular note is the increase at San Julián, which underscores the profile of that project and its potential to become a new mining district for us, while good mineralisation at a number of other sites in Sonora, Durango and Guanajuato warrant continued drilling in 2014.
3 ExploreExtend the growth pipeline
We continuously invest in exploration across price cycles, with US$225.0 million budgeted for 2014. As part of our district consolidation strategy, over 65% of these funds will be allocated to areas of influence around our operating mines, near development projects, and within advanced exploration sites.
Strategy in action

35www.fresnilloplc.com Fresnillo plc | Annual report 2013
Fresnillo Today
Strategic Report
Corporate Governance
Financial Statements
Strategy
Performance
2013 resultsSilver resources increased by 5.0% as a result of the additional mineralisation encountered at San Julián and Lucerito (Durango) and Candameña (Chihuahua).
Gold resources rose by 5.2% due mainly to increased resources at Centauro Deep following a more conservative open pit mine design, thus transferring resources to this underground project; and higher resources at Lucerito, Noche Buena and Cebadillas, which mitigated the aforementioned decrease in Herradura and Soledad-Dipolos.
What we did in 2013 What we plan to do in 2014
– Exploration budget totalled US$233.3 million, a 26.8% decrease from 2012 but in line with strategy
– US$225.0 million budgeted for exploration, including capitalised expenses
– Las Casas: An exploration tunnel was constructed; 445.0 koz gold and 40.6 moz silver in resources have been added
– Advance exploration activities at Cebollitas cluster in the Ciénega district
– Centauro Deep: pumping station completed, resources increased – Continue exploration at Centauro Deep and Noche Buena;
conclude evaluation for expansion of the Mega Centauro pit in the Herradura district – Mega Centauro expansion: Intensive infill exploration to evaluate
the potential expansion project
– Juanicipio: on-going exploration, initiated construction of the exploration/production ramp
– Saucito II: advanced to development project phase
– Resources converted into reserves at Saucito – Continue to upgrade resources at Saucito to proven and probable reserves in preparation for expansion
20132012201120102009
1,289.0
Attributable silver resources Millions of ounces
1,472.7
2,134.51,811.1 2,033.1 2,134.5
20132012201120102009
13.9
Attributable gold resources Millions of ounces
20.1
28.423.5 27.0 28.4

36 Fresnillo plc | Annual report 2013 www.fresnilloplc.com
What we said we would do in 2013
Fully integrate the HSECR System across the organisation – Enhance the strategic alignment of the HSECR System, incorporating
assets such as Centauro Deep and San Julián
– Continue to advance the maturity level of the HSECR System; monitor compliance by contractor companies and formalise a reporting, assurance and internal control process for the HSECR System
Improve and maintain the health of our people
Eliminate unsafe workplace conditions and behaviours
Enforce and enhance environmental management practices – Complete International Cyanide Management Code certification
for Ciénega and Soledad-Dipolos
Engage the communities where we operateIncorporate consultation processes for other key stakeholders
Attract, retain and develop our people
Strategy and KPIs continued
We continued to advance the maturity of our HSECR system this year, including a review of our materiality assessment and reporting practices, resulting in the addition of several KPIs. We identify material issues by conducting internal assessments of risks and incorporating feedback from our stakeholder engagement activities (communities, employees, unions, investors and host governments). We also benchmark information from industry peers and the insights gained from our participation in international and Mexican initiatives. Although these processes are not new, historically we have not systematically linked them to our sustainability reporting process.
We also extended the implementation of our safety programmes to advanced exploration and development projects, and actively supported our contractors with the adoption of and adherence to our policies and programmes. We mourned two fatalities in the year, and hold ourselves accountable to a zero tolerance policy.
4 SustainabilityAdvance and enhance the sustainability of our business
See pages 76-91 to learn more about our Social and Sustainability Performance
Strategy in action
Recruiting and training new mining technicians

37www.fresnilloplc.com Fresnillo plc | Annual report 2013
Fresnillo Today
Strategic Report
Corporate Governance
Financial Statements
Strategy
Performance
What we did in 2013 What we plan to do in 2014
– Incorporated San Julián, Centauro Deep and Orisyvo in the HSECR system
– Advanced the maturity level of the HSECR System to 75.5%, as validated by PricewaterhouseCoopers
– Further advance the maturity of the HSECR system and position IT to support HSECR processes and performance
– Zero new case of occupational diseases – Pursue certification of all operating units in the Occupational Health and Safety Management (OHSAS) 18001 System
– Two fatalities
– The No More Accidents action plan became a permanent programme to engage stakeholders6 and reinforce the safety culture
– Introduced more comprehensive set of performance indicators
– Zero fatalities; Certification of all operating units in the Occupational Health and Safety Management (OHSAS) 18001 System
– Evaluate IT systems to support our safety business processes
– Advanced Ciénega’s application for International Cyanide Management Code certification
– Zero environmental incidents
– Introduced a more comprehensive set of performance indicators
– Obtain Clean Industry certification at Saucito and Cyanide Code at Ciénega
– Review and upgrade energy and climate change, water, land and biodiversity strategies
– Introduced guidelines to track social investments more effectively – Conduct a perception/reputation survey and reassessment of community capabilities and opportunities; include focus groups for the first time in the formal consultation process
– Review and upgrade our community investment strategy and policies
– Intensified recruitment and training efforts
– Conducted performance evaluations across the organisation to align individual objectives and business strategy
– Conduct workplace satisfaction survey and prepare actions plans based on outcomes
– Review and enhance gender diversity initiatives
6 Our main stakeholder groups are communities, employees, unions, investors and host governments; see pages 23 and 26 for engagement activities.
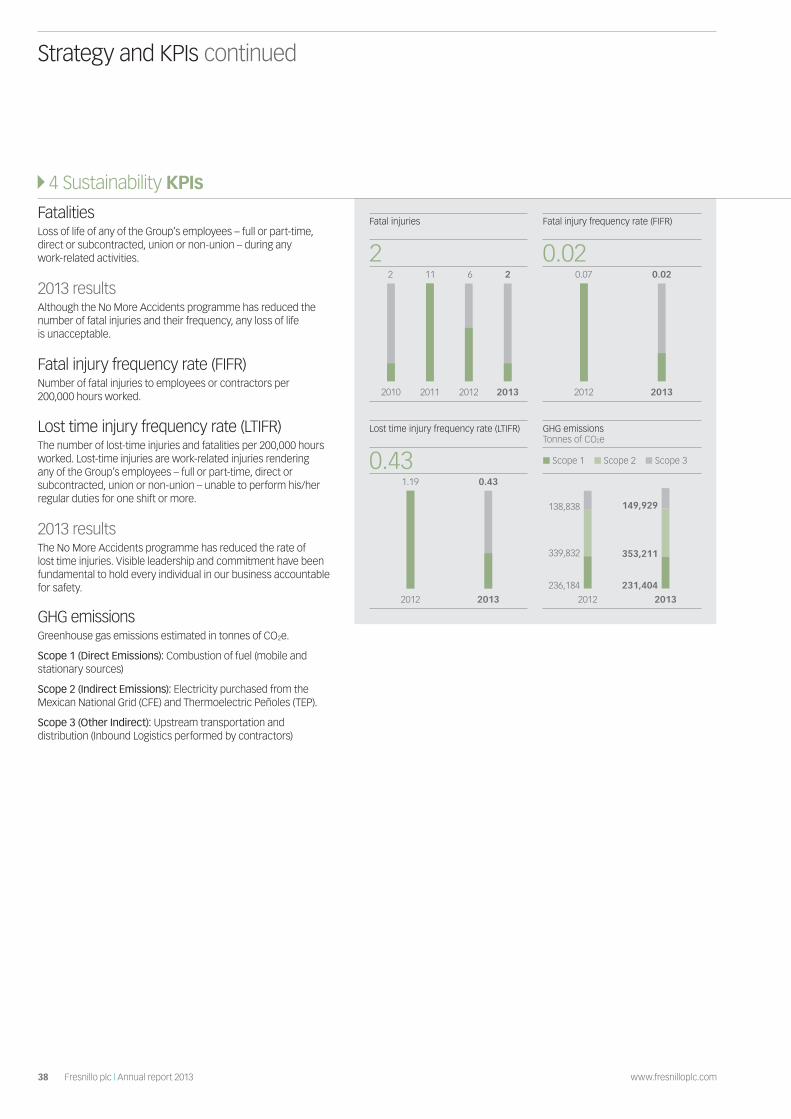
38 Fresnillo plc | Annual report 2013 www.fresnilloplc.com
2013201220112010
Fatal injuries
2
211 6 2
20132012
Lost time injury frequency rate (LTIFR)
0.431.19 0.43
20132012
138,838 149,929
353,211
231,404
339,832
236,184
GHG emissionsTonnes of CO2e
Scope 1 Scope 2 Scope 3
20132012
Fatal injury frequency rate (FIFR)
0.020.07 0.02
FatalitiesLoss of life of any of the Group’s employees – full or part-time, direct or subcontracted, union or non-union – during any work-related activities.
2013 resultsAlthough the No More Accidents programme has reduced the number of fatal injuries and their frequency, any loss of life is unacceptable.
Fatal injury frequency rate (FIFR)Number of fatal injuries to employees or contractors per 200,000 hours worked.
Lost time injury frequency rate (LTIFR)The number of lost-time injuries and fatalities per 200,000 hours worked. Lost-time injuries are work-related injuries rendering any of the Group’s employees – full or part-time, direct or subcontracted, union or non-union – unable to perform his/her regular duties for one shift or more.
2013 resultsThe No More Accidents programme has reduced the rate of lost time injuries. Visible leadership and commitment have been fundamental to hold every individual in our business accountable for safety.
GHG emissionsGreenhouse gas emissions estimated in tonnes of CO2e.
Scope 1 (Direct Emissions): Combustion of fuel (mobile and stationary sources)
Scope 2 (Indirect Emissions): Electricity purchased from the Mexican National Grid (CFE) and Thermoelectric Peñoles (TEP).
Scope 3 (Other Indirect): Upstream transportation and distribution (Inbound Logistics performed by contractors)
4 Sustainability KPIs
Strategy and KPIs continued

39www.fresnilloplc.com Fresnillo plc | Annual report 2013
Fresnillo Today
Strategic Report
Corporate Governance
Financial Statements
Strategy
Performance
20132012
GHG IntensityCO2e per tonne processed
0.0150.011 0.015
20132012
Community InvestmentUS$ million
2.143.14 2.14
20132012
1,990 2,236
6,1616,359
Water withdrawalML new water
Third party Groundwater
GHG IntensityEmissions in tonnes of CO2e per tonne of mineral processed.
2013 resultsEmissions under our operational control (Scope 1) decreased while the emissions from our contractors for inbound logistics (Scope 3) were higher as a result of our business model. The demand for electricity increased 3%, raising Scope 2 (indirect) emissions by 4% due to our reliance on Thermoelectric Peñoles (TEP). The reduced tonnage of material processed at Penmont explains the increase in our overall GHG intensity measures. This performance requires decisive action and a comprehensive review of our GHG reduction strategy.
Water withdrawalThe total amount of new water, measured in mega litres, introduced into the mine system.
2013 resultsThe withdrawal of groundwater (freshwater) decreased through operational efficiency gains in our mineral processing plants. The increase in the supply of municipal wastewater has allowed us to maintain our commitment to neutralising the use of fresh water for mineral processing in our Fresnillo and Saucito operations, setting a best practice in the Mexican mining sector. The reduced tonnage of material processed at Penmont explains the increase in our overall water intensity measures.
Community InvestmentContributions made to support the communities where we operate, develop projects or explore. Our contributions comprise cash, in-kind support and administration costs. Our efforts target five strategic levers: education, social welfare (public health, social interaction and sports), environmental awareness, community capacity building and infrastructure.
2013 resultsRevenue reductions required our operations to be more selective in their community investment decisions. However, despite the overall budget decrease, we intensified the number of community engagement activities.

40 Fresnillo plc | Annual report 2013 www.fresnilloplc.com
Financial value creationEnsure profitable growth and shareholder returns
Strategy and KPIs continued
KPIs
Cash cost per ounceTotal cash cost (cost of sales plus treatment and refining charges, less depreciation) less revenues from by-products divided by ounces of silver or gold sold. Used to compare profit margins and economic competitiveness amongst peers.
Cash costs overall were affected by higher mining costs as explained in the cost per tonne KPI. Other mine-specific factors are indicated herein. Despite the decline in silver price during the year, both silver and gold prices remained at levels that allowed us to continue operating profitably across our mines.
2013 resultsFresnillo: Lower ore grade, higher silver refining charges and a slight increase in mining costs were mitigated by higher by-product credits per silver ounce and lower profit sharing.
Saucito: Lower by-product credits per ounce of silver due to lower prices of gold and zinc and higher treatment and refining charges, partially offset by higher silver ore grade and lower mining costs.
Ciénega & San Ramón: Lower gold ore grade, higher treatment and refining charges and a decrease in by-product credits per ounce of gold, mitigated by a decrease in mining costs resulting from the efficiencies achieved and lower profit sharing.
Herradura: Increase in cost per tonne, including the effects from changes in inventories and unproductive costs due to stoppage; partially compensated by higher ore grades and lower profit sharing.
Noche Buena: The increase is explained by: i) increase in cost per tonne, including the effects from changes in inventories; and ii) unproductive costs generated by stopping and initiating operations twice when the explosives permits were suspended. These negative effects were partially mitigated by higher ore grade and lower profit sharing.
Soledad-Dipolos: Increase in cost per tonne including effects from changes in inventories and unproductive costs due to stoppage; mitigated by higher ore grade and lower profit sharing.
20132012201120102009
15.27
3.32
78.3%
Fresnillo cash cost: silver US$/ounce
21.39
84.7%
3.27
5.8734.75
84.9%
5.24
31.43
82.2%
5.59
22.83
74.3%
5.87
20132012201120102009
988.94
172.60
80.7%
Ciénega & San Ramón cash cost: goldUS$/ounce
1,252.05
86.3%
172.10
37.681,585.33
92.4%
121.06
1,674.14
105.1%
-84.84
1,401.32
97.3%
37.68
20132012
Noche Buena cash cost: gold US$/ounce
928.031,674.14
65.7%
574.16
1,401.32
33.8%
928.03
2013201220112010
Soledad-Dipolos cash cost: gold US$/ounce
1,252.05
69.5%
382.18
820.281,585.33
69.8%
478.17
1,674.14
63.0%
618.76
1,401.32
41.5%
820.28
20132012201120102009
988.94
341.84
65.4%
Herradura cash cost: gold US$/ounce
1,252.05
74.3%
322.32
651.231,585.33
77.2%
362.19
1,674.14
71.9%
470.56
1,401.32
53.5%
651.23
201320122011
Saucito cash cost: silver US$/ounce
3.6134.75
97.7%
0.81
31.43
98.4%
0.49
22.83
84.2%
3.61
Gold and silver pricesCash cost

41www.fresnilloplc.com Fresnillo plc | Annual report 2013
Fresnillo Today
Strategic Report
Corporate Governance
Financial Statements
Strategy
Performance
EBITDA, EBITDA margin and Cash flow from operating activities before changes in working capitalEBITDA is gross profit plus depreciation included within cost of sales less administrative, selling and exploration expenses. EBITDA margin is EBITDA divided by total revenue. Both EBITDA and cash flow from operating activities before changes in working capital measure the Group’s ability to generate cash from its core business.
2013 resultsEBITDA and EBITDA margin Lower gross profit resulting from the decrease in precious metals prices and lower gold volumes sold, combined with higher administrative expenses; mitigated by lower exploration expenses. EBITDA margin decreased to 45.2% from 61.0% in 2012.
Cash flow from operating activities before changes in working capitalThe decline reflects lower profits.
Earnings per share excluding post-tax Silverstream revaluation effectsAttributable profit available to equity shareholders, excluding the revaluation effects of the Silverstream Contract divided by the weighted average number of shares in issue during the period. Monitors net profit levels generated for equity shareholders. See Financial Review page 92.
2013 resultsLower net profits divided across an increased number of issued shares following the placement of new shares in May 2013.
20132012201120102009
496.6
58.4%
EBITDA and EBITDA margin US$ million
945.0
67.0%
729.81,538.5
70.2%
1,315.3
61.0%
729.8
45.2%
20132012201120102009
0.430
Earnings per share US$
0.740
0.3811.098 0.916 0.381
20132012201120102009
548.8
Cash flow US$ million
983.6
750.21,612.1 1,356.7 750.2

42 Fresnillo plc | Annual report 2013 www.fresnilloplc.com
Managing our Risks
The dynamic management of risk is critical to Fresnillo plc’s business model and value creation capabilities. GovernanceThe Board of Directors is responsible for maintaining the Company’s risk management and internal control systems. The Board’s mandate includes defining risk appetite and monitoring risk exposures to ensure that the nature and extent of significant risks taken by the Company are aligned with our overall goals and strategic objectives.
The Audit Committee supports the Board of Directors in monitoring our risk exposures and is responsible for reviewing the effectiveness of our risk management and internal control systems. Internal Audit supports the Audit Committee in evaluating the design and operating effectiveness of our risk mitigation strategies and the internal controls implemented by management.
During the annual risk identification and assessment process, Executive Management reviews strategic objectives and risk appetite, assesses the level of risk attendant to achieving these objectives, and incorporates controls into the strategic and operating plans to mitigate them. This top down risk identification and assessment process helps to ensure that the bottom up process is aligned with and focused on current strategy and objectives.
Maturity of the risk management systemThe annual and on-going elements of the enterprise risk management programme have been formalised, including the definition of risk appetite and risk identification and assessment processes. We are working towards embedding a risk management culture amongst all employees, who are demonstrating increasingly greater awareness.
Key developments in 2013 included: extending the scope of our anti-bribery and corruption programme to include prevention of money laundering and fraud, utilising the Company’s established compliance infrastructure; defining risk management activities and responsibilities for staff performance assessments; and beginning to formally gather and report on key risk indicators (KRIs) for our principal risks in order to detect and analyse trends and take mitigating actions on a timely basis. The KRIs monitored, included in the table on pages 46-53, are now presented quarterly to the Executive Committee and Audit Committee.
We will continue to evolve and build on our existing risk management framework, enhancing risk governance and management across the business in line with best practices. Our priorities through 2018 include:
– Periodically reporting on KRI metrics and the status of action plans for each principal risk
– Incorporating appraisal of risk management performance in annual employee performance reviews
– Developing a formalised and documented methodology to evaluate and address project risks
– Utilising software to automate the identification, assessment and response to risk in order to enhance timeliness and efficiency
Top downOversight, identification, assessment and mitigation of risk at corporate level
Bottom upIdentification, assessment and mitigation of risk at business unit level and across functional areas
Operational level
Audit Committee – Supports the Board in monitoring
risk exposure against risk appetite – Reviews the effectiveness of our
risk management and internal controls systems
Executive Committee – Assesses and mitigates our risks
Company-wide – Monitors our risk management
process and internal controls
Internal Audit – Supports the Audit Committee
in reviewing the effectiveness of our risk management and internal controls systems
The Board – Has overall responsibility
for the Group’s risk management and internal controls system
– Sets strategic objectives and defines risk appetite
– Monitors the nature and extent of risk exposure against risk appetite for our principal risks
– Provides direction on the importance of risk management and risk management culture
– Risk management process and internal controls embedded across functional areas, mining operations, projects and exploration sites
– Risk identification, assessment and mitigation performed across the business
– Risk awareness and safety culture embedded across the business
Risk management framework diagram

43www.fresnilloplc.com Fresnillo plc | Annual report 2013
Fresnillo Today
Strategic Report
Corporate Governance
Financial Statements
Strategy
Performance
2013 risk assessmentThe annual risk assessment exercise across all our operations, advanced projects, exploration offices, support and corporate areas identified and evaluated 104 risks. This universe was narrowed down into major risks monitored by Executive Management and the Audit Committee, and then further refined into the principal risks monitored by Executive Management and the Board of Directors.
A formal risk analysis was also conducted of our advanced projects, detailing the specific risks faced by each project according to the characteristics and conditions of each site.
The most notable movement among our risk register was access to land, which increased substantially in 2013, both in Mexico and globally. Large mining projects have suffered major delays and even closure due to this risk. In Mexico specifically, demands from members of agrarian communities (ejidos) increased from the previous year; discontent with previous land negotiations has been exacerbated by influencers who may even disavow such agreements. The Board and the Executive Committee continue to follow this risk closely.
Risk heat map
The following risk heat map illustrates the relative positioning of our principal risks in terms of impact and likelihood:
Risk
1. Impact of global macroeconomic developments
2. Access to land
3. Security
4. Potential actions by the government (e.g. taxes, more stringent regulations)
5. Public perception against mining
6. Projects (performance risk)
7. Safety
8. Exploration
9. Human resources
10. Environmental incidents
2013 2012
Impa
ct
Very
low
Se
vere
Unlikely Almost certain
Likelihood
X X
12
3
4567
8
9
10 10
7
2 6 1
3
4
5
9

44 Fresnillo plc | Annual report 2013 www.fresnilloplc.com
Managing our Risks continued
Our approach to managing risk is underpinned by our understanding of our current risk exposures, risk appetite and how our risks are changing over time.
Current Order (change from 2012) Risk
Risk rating
Change Description of risk changeRisk appetite 2012 2013
1. (was 2)
Impact of global macro-economic developments
High High Very high
Most industry and financial analysts who follow metal prices predict lower average silver and gold prices, with continued high volatility. The sharp fall in precious metal prices in 2013 has put the industry under more pressure than it has known for almost a decade.
2. (was 4)
Access to land Medium High Very high
Negotiations for land, in Mexico and globally, combined with an increase in land requirements, remain a challenge. Foreign mining companies in general, and Canadian ones in particular, have set certain precedents for future negotiations in their agreements with members of agrarian communities (ejidos). A number of ejidos have disavowed previous agreements, seeking to renegotiate agreed, upon terms and conditions; such actions are often driven by special interests. Their demands have increased significantly compared to previous years and this trend is expected to continue.
3. (was 1)
Security Low Very high
Very high
Although we have not experienced a material negative impact on our operations this year, the number of security incidents in areas near our operations and exploration projects increased in 2013.
4. (was 5)
Potential actions by the government, e.g. implementation of a tax on mining companies in Mexico, more stringent regulations for obtaining permits, etc.
Low High Very high
As part of the Tax Reform approved by the Mexican Congress in 2013, the tax burden that mining companies will face includes reduced deductions of exploration costs and social benefits, and new mining duties (7.5% of a base similar to EBITDA and 0.5% of gold and silver sales). Detailed rules on the implementation of these new mining duties are yet to be defined. Additionally, it is expected that a new more restrictive mining law with higher burdens will be discussed and approved in 2014.
Another potential government action that may impact on us is the increase in regulations on the use and handling of explosives, driven by the new administration and the increased concern about misuse of explosives by drug cartels; the length of time to obtain permits is longer and the requirements more stringent.

45www.fresnilloplc.com Fresnillo plc | Annual report 2013
Fresnillo Today
Strategic Report
Corporate Governance
Financial Statements
Strategy
Performance
Current Order (change from 2012) Risk
Risk rating
Change Description of risk changeRisk appetite 2012 2013
5. (was 6)
Public perception against mining
Low High High Social activism continues to be a growing global phenomenon within the mining sector with the potential to impact all strategic areas; there have been several examples impacting other mining companies in Mexico. In particular, the growth of social activism could negatively impact our ability to obtain and maintain the social licence to operate by the communities near our operations and projects.
6. (was 3)
Projects Medium High Medium high
As we continue to develop our advanced projects, we obtain greater certainty about the mineral resources and face lower performance and delivery risks because of lower construction risk and greater certainty about the availability of key equipment. In addition, our strict investment governance process and system of capital project controls supports our ability to deliver development projects on time and on budget.
7. (was 7)
Safety Low High Medium high
Accident indicators continue to decline due to our strict application of procedures and greater supervision of safety for personnel and contractors; however, the risk remains at a medium high level and we have still not met our safety goals.
8. (was 9)
Exploration Medium Medium Medium
Continued investment in the exploration programme has stabilised this risk and we foresee no change in risk status based on available information.
9. (was 10)
Human resources Medium Medium Medium low
Competition for skilled personnel remains a challenge; however, we continue to see results from our proactive recruitment actions with universities and our diverse retention strategies.
10. (was 8)
Environmental incidents
Low Low Low Our mature environmental management programme continues to reduce the likelihood of a significant environmental incident.
For those risks with a risk rating that is above our risk appetite, management takes action to reduce the level of risk. See Risk response/mitigation in the table that follows.

46 Fresnillo plc | Annual report 2013 www.fresnilloplc.com
Our principal risks
Risk description and context Risk response/mitigation Risk and strategy
1. Impact of global macroeconomic developmentsThere could be an adverse impact on our sales and profit, and potentially the economic viability of projects, from macroeconomic developments such as:
– A decrease in gold and silver prices (primary driver of the risk); this was the case for silver and gold in 2013, with a decline of 27.3% and 16.3% correspondingly, in the annual average price over the previous year.
– Continued volatility in gold and silver prices.
– Adverse fluctuations in MXN/USD exchange rates or other foreign currencies.
– General inflation in Mexico, which was 3.97% in Mexican pesos in 2013; the specific inflation affecting the Company was 7.34% in US dollar terms.
We continue to have full exposure to fluctuations in the prices of gold and silver and currently have no hedging in place in line with our investors’ mandate. For new major projects, the Company may consider undertaking some degree of hedging. The extent of risk appetite in this area will continue to be evaluated frequently to ensure on-going alignment with shareholders’ expectations.
We have hedging policies in place for foreign exchange movements, including currencies impacting equipment purchase commitments; in 2013, we entered into new hedging contracts for US$328.6 million and the closing position is US$232.7 million. See Note 30 in the Financial Statements page 198-199.
Inflationary pressures: we engage suppliers in long-term contracts to maintain our position as a low-cost producer and control the impact of the rising cost of our main inputs. See Suppliers page 26.
Link to strategy
1 Operate2 Develop3 Explore
Key risk indicators
– Gross profit sensitivity to % change in metals price
– EBITDA sensitivity to % change in metals price
2. Access to landGiven our growth strategy and aggressive exploration plan, failure or significant delays in accessing the surface over our mineral concessions and other land of interest is a persistent risk with a potentially high impact on our objectives. Potential barriers to land access include:
– Rising expectations of land owners
– Refusal to acknowledge prior land acquisitions terms and conditions by members of an agrarian community
– Influence of multiple special interests in land negotiations
– Conflicts in land boundaries with an often arduous resolution process
– Succession issues among land owners resulting in a lack of clarity about the legal entitlement to possess and sell land
– Furthermore, insecurity and conflicts in our exploration/operation areas increase the complexity of land access.
Fresnillo plc acquired 2,831.3 hectares of surface land for the San Julián project and 676.5 hectares of surface land for other exploration projects/prospects in 2013. To maximise our opportunities for successful land access we:
– Invest in hiring and training negotiators and provide Executive Management support for our negotiation teams; our negotiation team is comprised of six negotiators hired directly by Fresnillo and seven negotiators provided as part of the service agreement with Peñoles.
– Plan well in advance for land requirements and acquisitions (e.g. anticipating potential land purchase before intensive exploration).
– Foster strong community relations through investment in community programmes and infrastructure. Such investments totalled US$2.14 million.
– Always seek tri-party cooperation between the government, community and ourselves in securing access to land.
– As a consequence of the ‘Ejido’ El Bajío legal proceedings at Dipolos, we are conducting a comprehensive review of the status of our land rights in order to mitigate or eliminate a risk of similar litigation.
Link to strategy
1 Operate2 Develop3 Explore
Key risk indicators
– Percentage of land required for advanced exploration projects that has been purchased (overall and by project)
– Total US$ and percentage of project budget spend on HSECR activities, including community relations (at projects and exploration)
Managing our Risks continued

47www.fresnilloplc.com Fresnillo plc | Annual report 2013
Fresnillo Today
Strategic Report
Corporate Governance
Financial Statements
Strategy
Performance
Risk description and context Risk response/mitigation Risk and strategy
3. SecurityOur people face the risk of kidnapping, extortion or harm due to security conditions in the regions where we operate. We face the risk of restricted access to operations/projects and theft of assets.
The growing influence of drug cartels, other criminal elements and general lawlessness in the regions where we operate, combined with our aggressive exploration and project activity in areas of transfer or cultivation of drugs, makes working in these areas of particular risk for us.
We closely monitor the security situation, maintain clear internal communications and coordinate work in areas of higher insecurity, along with the following practices to manage our security risks and prevent possible incidents:
– Travel management: e.g. travel in convoy, use aircraft versus land travel and avoid known insecure areas; in 2013, we invested US$2.5 million in helicopter travel. At San Julián, construction of a landing strip was concluded with an investment of US$2.7 million.
– Enhanced on-site security measures (cameras, barriers, delayed access); we invested US$1.3 million in security equipment.
– Theft prevention: we continued to utilise logistics controls in 2013 to further reduce the probability of theft of mineral concentrate, including the use of real-time tracking technology, the use of guard services and control checkpoints in a ‘safe corridor’ and reduced authorised stops in order to optimise delivery times and reduce convoys to exposure.
– We invest in community programmes, infrastructure improvements, and government initiatives to support development of lawful local communities and discourage criminal acts.
– We maintain close relations with the governmental authorities, including the army encampments installed nearby our operations.
– In order to ensure the security of our personnel we suspended access to the San Nicolás del Oro prospect because of the state of insecurity in Guerrero state, and also decided to postpone certain prospecting activities in certain regions of Chihuahua, Durango, Michoacán and Sinaloa.
Link to strategy
1 Operate2 Develop3 Explore4 Sustainability
Key risk indicators
– Total number of security incidents (thefts, kidnapping, extortion, etc.)
– Number of sites affected and work days lost, by region and type of site
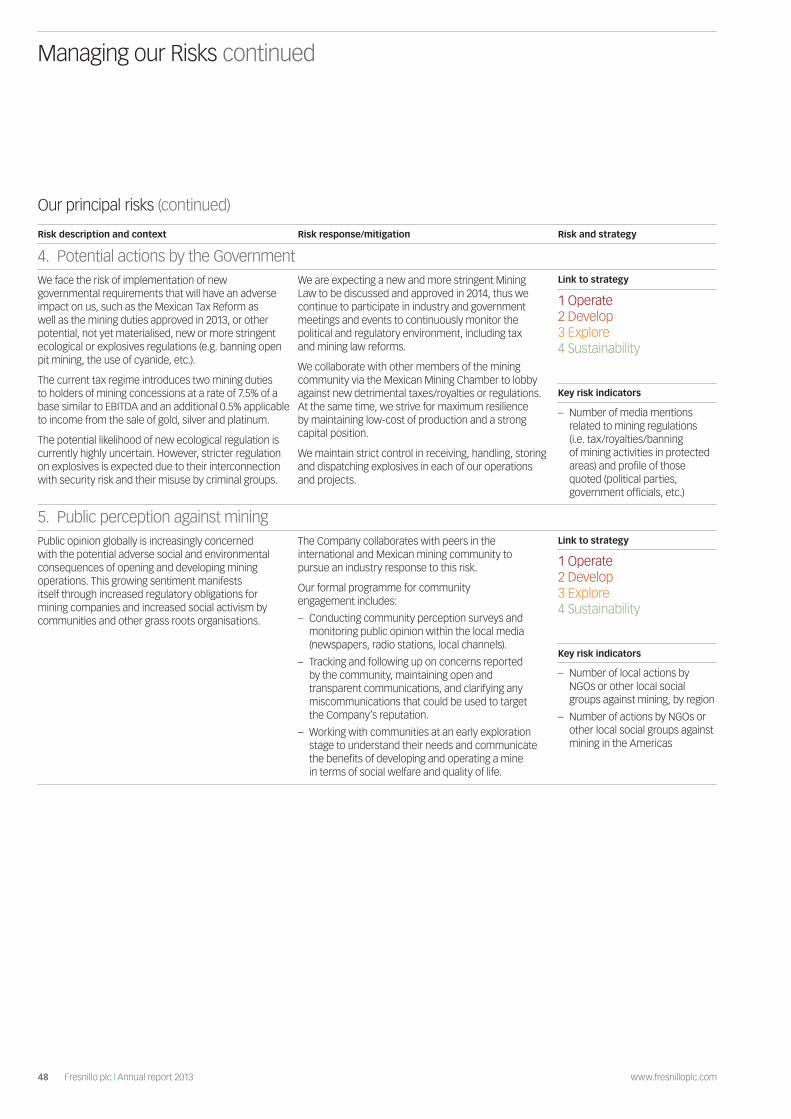
48 Fresnillo plc | Annual report 2013 www.fresnilloplc.com
Our principal risks (continued)
Risk description and context Risk response/mitigation Risk and strategy
4. Potential actions by the GovernmentWe face the risk of implementation of new governmental requirements that will have an adverse impact on us, such as the Mexican Tax Reform as well as the mining duties approved in 2013, or other potential, not yet materialised, new or more stringent ecological or explosives regulations (e.g. banning open pit mining, the use of cyanide, etc.).
The current tax regime introduces two mining duties to holders of mining concessions at a rate of 7.5% of a base similar to EBITDA and an additional 0.5% applicable to income from the sale of gold, silver and platinum.
The potential likelihood of new ecological regulation is currently highly uncertain. However, stricter regulation on explosives is expected due to their interconnection with security risk and their misuse by criminal groups.
We are expecting a new and more stringent Mining Law to be discussed and approved in 2014, thus we continue to participate in industry and government meetings and events to continuously monitor the political and regulatory environment, including tax and mining law reforms.
We collaborate with other members of the mining community via the Mexican Mining Chamber to lobby against new detrimental taxes/royalties or regulations. At the same time, we strive for maximum resilience by maintaining low-cost of production and a strong capital position.
We maintain strict control in receiving, handling, storing and dispatching explosives in each of our operations and projects.
Link to strategy
1 Operate2 Develop3 Explore4 Sustainability
Key risk indicators
– Number of media mentions related to mining regulations (i.e. tax/royalties/banning of mining activities in protected areas) and profile of those quoted (political parties, government officials, etc.)
5. Public perception against miningPublic opinion globally is increasingly concerned with the potential adverse social and environmental consequences of opening and developing mining operations. This growing sentiment manifests itself through increased regulatory obligations for mining companies and increased social activism by communities and other grass roots organisations.
The Company collaborates with peers in the international and Mexican mining community to pursue an industry response to this risk.
Our formal programme for community engagement includes:
– Conducting community perception surveys and monitoring public opinion within the local media (newspapers, radio stations, local channels).
– Tracking and following up on concerns reported by the community, maintaining open and transparent communications, and clarifying any miscommunications that could be used to target the Company’s reputation.
– Working with communities at an early exploration stage to understand their needs and communicate the benefits of developing and operating a mine in terms of social welfare and quality of life.
Link to strategy
1 Operate2 Develop3 Explore4 Sustainability
Key risk indicators
– Number of local actions by NGOs or other local social groups against mining, by region
– Number of actions by NGOs or other local social groups against mining in the Americas
Managing our Risks continued
49www.fresnilloplc.com Fresnillo plc | Annual report 2013
Fresnillo Today
Strategic Report
Corporate Governance
Financial Statements
Strategy
Performance
Risk description and context Risk response/mitigation Risk and strategy
6. ProjectsPursuing advanced exploration and development opportunities, which are core to meeting our strategic goals, carry certain project-related risks:
– Economic viability: impact of capital cost to develop and maintain the mine, future metals prices and operating costs through the mine’s life cycle.
– Uncertainties associated with developing and operating new mines: fluctuations in ore grade and recovery, unforeseen complexities in the mining process, poor rock quality, unexpected presence of water, lack of community support, and inability to obtain and maintain required operating permits.
– Delivery risk: projects may go over budget in terms of cost and time, or may not be constructed in accordance with the required specifications, or major mining equipment may not be delivered in time.
Our investment evaluation process determines how to best direct available capital using technical, financial and other qualitative criteria.
Technical: we assess the resource estimate and confirmed resources, metallurgy of the mineral bodies, investment required in general infrastructure (e.g. roads, power, general services, housing) and infrastructure required for the mine and plant.
Financial: we look at risk relative to return for proposed investments of capital. We set expected internal rates of return (IRR) per project as thresholds for approving the allocation of capital based on the present value of expected cash flows from the invested capital.
Other qualitative factors: e.g. alignment of the investment with our strategic plan and business model; synergies with other investments and operating assets; implications for safety, security, people, resourcing and community relations.
We closely monitor our project controls to ensure we deliver approved projects on time, on budget and as per defined specifications. The Executive Management team and Board of Directors are regularly updated on progress.
Each advanced exploration project and major capital development project has a risk register containing the identified and assessed risks specific to the project.
In 2012, the Board approved the San Julián project with an investment of US$500 million; at the end of 2013, the progress was 16.1% vs. 16.7% planned. The expenses incurred and committed are on budget. The major risk factor specific to this project is to determine a sufficient water supply for when the mine becomes operational. The Company continues to invest in geo-hydrological and geo-physical studies for water supply.
In 2013, the Board approved the Saucito II project with an investment of US$235 million; at the end of December 2013, the progress was 40.6% in line with plan. The major risk factor specific to this project is to face an unexpected presence of water that could delay the development of the mining works.
At the Centauro Deep project, our efforts continue to focus on identifying an adequate and profitable mining system, thus we plan to continue exploration to confirm the nature of the mineral and mechanical and hydrological characteristics. During 2013, we faced a particular setback with regards to the explosives permit, since resolved, thus the advance in the development works was severely impacted in the second half of the year. A new explosives permit was granted by the Ministry of Defence in early 2014, allowing for a resumption of exploration activity.
The major risk driver at the Orisyvo project is metallurgical recovery. We continue researching and performing tests on mineral processing options.
Link to strategy
2 Develop
Key risk indicators
– Earned value (rate of financial advancement rate vs. physical advancement)
– Percentage of major equipment ordered and received according to plan
– Percentage of completion of mine development

50 Fresnillo plc | Annual report 2013 www.fresnilloplc.com
Risk description and context Risk response/mitigation Risk and strategy
7. SafetyInherent to our industry is the risk of incidents due to unsafe acts or conditions causing injuries or fatalities to our people.
Our people face risks of fire, explosion, electrocution and carbon monoxide poisoning, as well as risks specific to each mine site and development project, for example, rock falls caused by geological conditions, collisions of equipment in large operations, cyanide contamination, collisions between equipment and people and smaller vehicles.
We are committed to offering a safe workplace to our workers and contractors. We aspire to a safety culture where our personnel have the knowledge, competence and desire to work safely.
Our strategy is based on:
– Managing our knowledge of safety through identifying and analysing risks, evaluating controls, performing situational assessments, and monitoring performance.
– Engaging our stakeholders through the No more accidents process, which has become a permanent programme to reinforce the safety culture. This programme includes Leaders for Safety, Behavioural Change, Operational Discipline, Rules that Save Lives, and comprehensive accident investigation.
– Launching initiatives to embed safety in our culture. Safety culture is routinely monitored to assess the attitudes, behaviours and disciplined elimination of unsafe conditions.
Other mitigating activities include:
– Support staff were hired in 2013 to reinforce the safety teams in our operating business units.
– Development of our internal capabilities to reduce our reliance on external experts.
– Training, including reinforcing employee and contractor instruction. We conducted 257,767 hours of safety training in 2013.
See pages 81-83 for more on our safety strategy.
Link to strategy
4 Sustainability
Key risk indicators
– Safe behaviour index = percentage of work observed that is executed safely (in accordance with the Company’s safety procedures)
– Unsafe conditions eliminated index = percentage of unsafe conditions observed and recorded that have been eliminated
– Operational procedures availability index = percentage of required safety procedures that are available
Our principal risks (continued)
Managing our Risks continued
51www.fresnilloplc.com Fresnillo plc | Annual report 2013
Fresnillo Today
Strategic Report
Corporate Governance
Financial Statements
Strategy
Performance
Risk description and context Risk response/mitigation Risk and strategy
8. ExplorationWe are highly dependent on the success of the exploration programme to meet our targets in terms of strategic value-creation and our long-term production and reserves goals.
Risk factors that may impact prospecting and converting inferred resources (apart from the growing level of insecurity and access to land) include not having a robust portfolio of prospects in our pipeline with sufficient potential in terms of indicated and inferred resources, and insufficient concession and surface right coverage in target areas.
As our production escalates and more mines approach the end of their lives, it becomes increasingly challenging to replenish their reserves.
We invest heavily in our exploration programme, aiming to maintain a consistent exploration budget across metals cycles. The budgeted risk capital invested in exploration for 2014 is US$225.0 million, with 37% of the budget allocated to exploration around major projects and the remainder to a combination of mine site exploration, prospects and regional prospecting.
We also ensure we have:
– A focus on increasing the regional exploration programme to locate new districts with high potential
– For local exploration, aggressive in-field exploration programme to convert inferred resources into reserves.
– A team of highly trained and motivated geologists, both employees and long-term contractors.
– During 2013, we revised our portfolio of concessions and determined that some did not have the expected potential; thus, we voluntarily relinquished 134,538 hectares in order to focus our efforts on areas of greater potential.
– Advisory technical reviews by international third party experts – up-to-date and integrated GIS databases and software for identifying favourable metallurgical belts and districts
– Drill-ready projects
– To remain in line with industry standards with regard to the estimation of reserves and resources, we applied the Joint Ore Reserves Committee (JORC) Code 2012 that came into effect on 1 December 2013.
– See pages 72-75 for more on our exploration programmes and investment.
Link to strategy
3 Explore
Key risk indicators
– Drill programmes completed (overall and by project)

52 Fresnillo plc | Annual report 2013 www.fresnilloplc.com
Risk description and context Risk response/mitigation Risk and strategy
9. Human resourcesOur people are critical to delivering our objectives. We face risks in selecting, recruiting, training and retaining the people we need.
Although we have a risk of union action or degradation of union relations at some sites, our overall relationship continues to strengthen and this risk has decreased.
The lack of reliable contractors with adequate infrastructure, machinery, performance and skilled people is also a risk that might affect our ability to develop and construct mining works.
Recruitment: We assessed our hiring requirements for key positions in the 2013-2018 period, and aim to meet openings through internal training and promotion, and by recruitment through:
– Our close relationships with universities offering earth sciences programmes (we have dedicated programmes to identify potential candidates based on performance who may be hired as interns and/or residents on graduation).
– CETEF (Centre for Technical Studies Fresnillo) which teaches specific mining operational skills; 14 of the 2013 graduates joined the Company as full-time employees. We welcomed the new cohort of mining technicians with 12 students who will graduate in 2014.
– CETLAR (the Peñoles Centre for Technical Studies) which trains mechanics and electrical technicians; eight of the 2013 graduates joined the Company as full-time employees.
Retention: We provide a stable labour environment, strong corporate culture committed to our people, good working conditions, competitive benefits and career development opportunities.
Contractors: We have long-term drilling and mining contracts. We invest significantly in training contractors, particularly on safety and environmental requirements. We support ten of our major contractor companies in their integration into the first level Self-Management Programme on Safety and Health at Work (PASST), promoted by the Mexican Secretariat of Labour and Social Welfare (STPS).
Unions: We have clearly assigned responsibilities and programmes for maintaining close relationships with unions at mine site and at the national level. We engage experienced legal counsel, both internal and external, to support us. We are proactive and timely in our responses to the needs of the unions, and experienced no labour-related work stoppages in 2013.
Link to strategy
1 Operate2 Develop3 Explore4 Sustainability
Key risk indicators
– Number of positions filled by area of specialty, for vacancies and new positions
– Employee turnover rate
– Average hours of training and professional development per employee
Our principal risks (continued)
Managing our Risks continued

53www.fresnilloplc.com Fresnillo plc | Annual report 2013
Fresnillo Today
Strategic Report
Corporate Governance
Financial Statements
Strategy
Performance
Risk description and context Risk response/mitigation Risk and strategy
10. Environmental incidentsInherent to our industry is the risk of environmental incidents such as overflow/collapse of tailings dams, cyanide spills and dust emissions, among others, any of which could have a high potential impact on our people, communities and business.
We have an environmental management system to ensure effective compliance with regulations and support initiatives that reduce our environmental footprint.
During 2013, we met our zero environmental incidents target.
All our operations are certified under ISO 14001 and have Clean Industry certification except for Saucito, which is in the process of obtaining both. The Herradura mine is certified in the International Cyanide Management Code and Ciénega is in the process of obtaining it.
We rigorously adhere to the requirements established by each project’s environmental permit (Environmental Impact Manifest). We also support contractors in their efforts to integrate environmental management systems.
See pages 84-87 for more on our environment strategy.
Link to strategy
4 Sustainability
Key risk indicators
– Number of business units (BUs) with ISO 14001:2004 certification
– Number of BUs with Clean Industry certification
– Number of BUs with International Cyanide Code certification
– Number of BUs with OSHAS 18001: 2007 certification
– Number of BUs integrated into the Self-Management programme of the Mexican Secretariat of Labour (STPS)
– Number of environmental permits for all advanced exploration projects (according to schedule)
54 Fresnillo plc | Annual report 2013 www.fresnilloplc.com
Performance
In the context of cyclical challenges, natural changes in ore grades, and unexpected legal developments, the Company continued to move forward on executing its long-term growth strategy.
The performance section runs over pages
56-103

55www.fresnilloplc.com Fresnillo plc | Annual report 2013
Fresnillo Today
Strategic Report
Corporate Governance
Financial Statements
Strategy
PerformanceReview of Operations
We focused on operational excellence, disciplined growth and improved safety performance in 2013 in order to meet our long-term production, resource and sustainability targets.
Our operating trajectory changed in mid-year 2013 when the Ejido El Bajío legal proceedings ultimately led to a suspension of mining and beneficiation activities at Soledad-Dipolos and temporarily halted mining activity at Herradura, thereby impacting annual gold production at our Penmont mines. Notwithstanding, silver production rose in the year; we advanced our strategic objectives of maximising capacity and increasing efficiency; maintained our position in the silver cost curve; completed construction of a new facility on plan; advanced the development and construction of two new mines; and increased our total resources through on-going exploration.
A full review of our projects confirmed their economic viability even under stressed metal prices; however, we adjusted our investment budget downward slightly and deferred some minor capex allocations in order to decrease expenditures across this capital-intensive phase of development in current market conditions. We remain confident that the size and profile of our growth pipeline will enable us to meet 2018 production targets and deliver continued value to stakeholders beyond the current cycle.
As our social and sustainability system matures, we have gained greater visibility into the effectiveness of our programmes, policies and practices, and where we must continue to adapt and advance. Performance this year improved across a range of indicators, and we have enhanced the transparency and assurance of our results.
Annual attributable silver production
42.7 moz+4.3%
Annual attributable gold production
425,831 oz −10.0%

56 Fresnillo plc | Annual report 2013 www.fresnilloplc.com
Review of Operations continued
ProductionAnnual attributable silver production increased 4.3% from 2012 to 42.7 moz, including 3.9 moz from the Silverstream Contract. This primarily reflected the successful ramp-up of production at Saucito, now operating at full capacity, as well as increased production at Ciénega resulting from higher silver ore grade at the San Ramón satellite mine; fully offsetting lower silver ore grade at the Fresnillo mine.
Annual attributable gold production decreased by 10.0% to 425,831 oz due to the suspension of operations at Soledad-Dipolos in the second half of the year and the temporary suspension of the explosives permit at Herradura. These factors were mitigated by the continued ramp-up of production at Noche Buena.
DevelopmentThe Company completed construction of the dynamic leaching plant on time and on budget (December 2013, with total capex of US$115.6 million). The facility will process high-grade ore from Herradura once the resumption of blasting activity yields sufficient mineral for processing, and is expected to increase attributable gold production in the district by an average of 28,000 oz per year.
Two additional development projects are underway. Saucito II, a new expansion mine in the Fresnillo district, advanced rapidly as a result of efficient execution and infrastructure synergies; this, combined with its high profit margin projections, has warranted a prioritisation of its development. The beneficiation plant is expected to be completed by year end 2014, rather than the original schedule of 2015.
Development of the new San Julián mine, a greenfield project in a new mining district, also advanced but we have deferred its commissioning to 2H 2015 (from 4Q 2014) and slightly revised capex to US$515 million from US$500 million. Expected production volumes of 10.3 moz silver and 44,000 oz gold at full capacity remained unchanged.
These projects play a critical role in achieving our long-term production goals.
ExplorationExploration remains core to our organic growth strategy and a key element in extending mine life. Risk capital invested in exploration totalled US$233.3 million in 2013, a 26.8% decrease from 2012 but in line with our strategic aim of consistent investment; of the total, US$25.6 million was capitalised, mainly at the Juanicipio, Centauro Deep and Orisyvo projects.
Resources increased through an aggressive exploration programme that included almost 530,458 metres of drilling at 25 projects and prospects. Resources and reserves were estimated using the new JORC 2012 standards, at lower gold and silver prices.
Even under this more conservative calculation, gold resources increased by 5.2% to 28.4 moz gold and silver resources by 5.0% to 2,134.5 moz. Gold reserves, however, declined by 14.5% to 4.7 moz gold, due mainly to the revised criteria, while silver reserves declined 4.3% to 477.2 moz, related both to the change in price as well as to development delays at Fresnillo that were only partially compensated by increased reserves at Saucito.
Safety and sustainabilityOur continued focus on safety training and behavioural changes resulted in strong improvements across a range of indicators. Regrettably, however, we did not achieve our zero fatalities target and reported two fatal accidents during the year. The work continues to strengthen our safety culture.
Other sustainability metrics showed improvement in the year: a decline in the withdrawal of fresh groundwater, increase in gender diversity, and higher average number of hours of HSECR training, for example. Increase in
gold and silver resources, respectively
5.2% 5.0%
Risk capital invested in exploration US$
233.3 m
Development work at the Fresnillo mine to prepare for a possible expansion of milling capacity

57www.fresnilloplc.com Fresnillo plc | Annual report 2013
Fresnillo Today
Strategic Report
Corporate Governance
Financial Statements
Strategy
Performance
CostsCosts per tonne for those mines in operation during the full year were affected by several factors:
– The 3.0% revaluation of the MXP/USD exchange rate, which increased costs denominated in Mexican pesos when converted to US dollars
– A 19.5% and 7.2% increase in the unit prices of diesel and electricity respectively
– The 6.0% rise in wages in Mexican pesos for unionised workers
– Higher contractor costs due to the average 5.4% rise in unit fees in Mexican pesos
Many of these factors were mitigated by operational efficiencies achieved.
2014 OutlookWe expect attributable silver production to remain stable at 43 moz, including Silverstream. Attributable gold production is expected to rise to 450,000 oz as a result of resumed operations at Herradura, the continued ramp-up of production at Noche Buena, and the start-up of operations at the dynamic leaching plant.
Our development projects will advance in the year with the completion of Saucito II and further progress at San Julián. Once approved, we expect to begin construction on the expansion of the Ciénega mill and the pyrites treatment plant at Fresnillo, whilst additional exploration will determine whether Mega Centauro and Centauro Deep will be submitted as new projects for Board approval.
The Group’s exploration budget for 2014 has been set at US$225.0 million (including capitalised exploration expenses), 3.6% below 2013. Capex, including capitalised exploration expenses of US$30.0m, is budgeted to rise to US$642.0 million.
We expect continued cost pressures, mainly in energy, operating materials and labour, although less than in recent years. In addition, costs will be impacted by new mining duties that will be levied in 2014 and payable in early 2015.
We will continue to invest in cost control initiatives aimed at preserving healthy margins. At underground mines, this includes optimising blasting techniques in the development phase, monitoring and reducing dilution, more effective usage of mining equipment, and accelerating maintenance programmes to increase uptime and mechanical availability in the beneficiation plants. In our open pit mines, we aim to optimise haulage and increase the efficiency of load-haul-dump cycles.
2014E investment in exploration US$
225.0 m−3.6%
2014E attributable silver production
43 moz
Optimised shotcreting work (here conducted by an experienced contractor) contributed to cost reductions at San Ramón-Ciénega
Exploration ramp at Centauro Deep; this project and the expanded Centauro pit design will be revised in 2014

58 Fresnillo plc | Annual report 2013 www.fresnilloplc.com
Our Mines in Operation 1 Operate: Maximise the Potential of Existing Operations
Fresnillo is the largest primary silver mine in the world and one of the world’s oldest continuously operating mines; it produced 53.3% of the Group’s total attributable silver and generated 33.4% of adjusted revenue.
Average silver ore grades have continued their natural and expected declines. This puts pressure on cash costs as we seek to optimise production of the remaining resource and operate at full capacity, which requires more extensive mine development. We also conduct intensive and on-going local and regional exploration to replace and expand the resource base, and plan to increase recovery rates by processing tailings.
Fresnillo 1234
Ownership: 100% Fresnillo plc
In operation since: 1554
Facilities: Underground mine and flotation plant
Workforce: 907 employees/767 contractors
Location: Zacatecas
Mine life (years): 11.8 (2012: 12.5)
2013 milling capacity: 8,000 tpd/2,640,000 tpy
2013 2012 % change
Financial highlights
Adjusted revenue (US$m) 588.3 865.7 (32.0)
Segment profit (US$m) 379.5 656.1 (42.2)
Capital expenditure (US$m) 61.3 85.5 (28.3)
Exploration (US$) 10.7 9.4 13.8
2013 2012 % change
Mine production
Ore milled (kt) 2,703 2,738 (1.3)
Silver (koz) 22,764 26,383 (13.7)
Gold (oz) 33,079 29,573 11.9
Lead (tonnes) 15,552 16,190 (3.9)
Zinc (tonnes) 14,914 14,966 (0.3)
Reserves
Total reserves
Silver (moz) 277.6 308.5 (10.0)
Gold (oz) 667,000 733,000 (9.0)
Avg ore grade in reserves
Silver (g/t) 271 281 (3.6)
Gold (g/t) 0.65 0.67 (3.0)
Cut-off grade (gpt Ag Eq) 125 92 35.9
Resources
Total resources
Silver (moz) 800.2 798.7 0.2
Gold (moz) 1.69 1.68 0.6
Average ore grade in resources
Silver (gpt) 358 353 1.4
Gold (gpt) 0.76 0.75 1.3
Cut-off grade (gpt Ag Eq) 83 64 29.7
What we said we would do in 2013Evaluate new and/or expanded processing capacity in the Fresnillo district, including a 2,000 tpd extension to the current Fresnillo beneficiation plant, and a pyrites plant at Saucito to increase gold recoveries from Fresnillo and Saucito tailings
Continue exploration at current investment levels to replace/grow the resource base
Continue to develop and prepare new mine stopes
Cost cutting/efficiency initiatives
What we did in 2013Deferred expansion for processing capacity until we reach deeper zones with higher base metal contents and mine stopes are sufficiently developed to maintain production levels at 10,000 tpd; conducted engineering work for the pyrites plant.
Maintained the resource base despite lower prices used in estimates
On-going mine stope preparation, albeit at a slower pace than expected
Cost per tonne increased a slight 2.4%, lower than the estimated inflation rate at this mine of 6.4%, reflecting cost reduction initiatives and operating efficiencies
What we plan to do in 2014Increase development rate to 3,300 metres per month
Conduct detailed engineering for the pyrites plant; pending approval, initiate construction in 2H 2014
Start engineering to deepen the San Carlos shaft in order to reduce haulage costs and gain access to deeper ore reserves
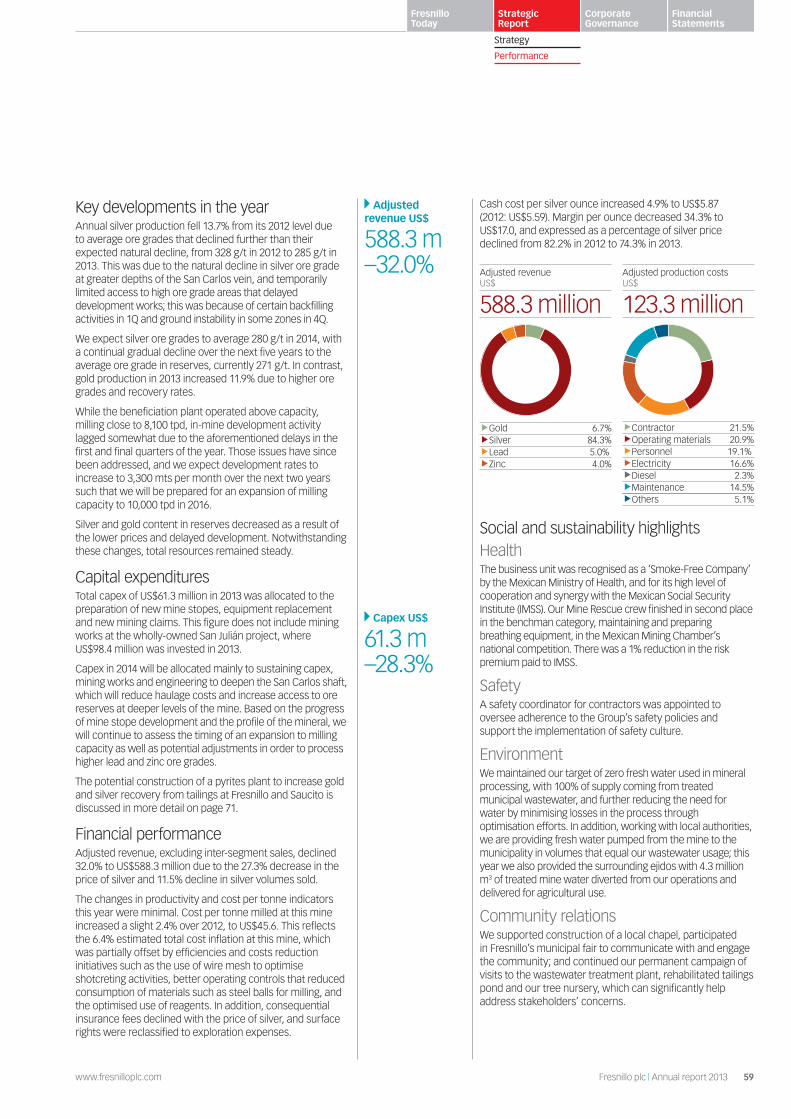
59www.fresnilloplc.com Fresnillo plc | Annual report 2013
Fresnillo Today
Strategic Report
Corporate Governance
Financial Statements
Strategy
Performance
Key developments in the yearAnnual silver production fell 13.7% from its 2012 level due to average ore grades that declined further than their expected natural decline, from 328 g/t in 2012 to 285 g/t in 2013. This was due to the natural decline in silver ore grade at greater depths of the San Carlos vein, and temporarily limited access to high ore grade areas that delayed development works; this was because of certain backfilling activities in 1Q and ground instability in some zones in 4Q.
We expect silver ore grades to average 280 g/t in 2014, with a continual gradual decline over the next five years to the average ore grade in reserves, currently 271 g/t. In contrast, gold production in 2013 increased 11.9% due to higher ore grades and recovery rates.
While the beneficiation plant operated above capacity, milling close to 8,100 tpd, in-mine development activity lagged somewhat due to the aforementioned delays in the first and final quarters of the year. Those issues have since been addressed, and we expect development rates to increase to 3,300 mts per month over the next two years such that we will be prepared for an expansion of milling capacity to 10,000 tpd in 2016.
Silver and gold content in reserves decreased as a result of the lower prices and delayed development. Notwithstanding these changes, total resources remained steady.
Capital expendituresTotal capex of US$61.3 million in 2013 was allocated to the preparation of new mine stopes, equipment replacement and new mining claims. This figure does not include mining works at the wholly-owned San Julián project, where US$98.4 million was invested in 2013.
Capex in 2014 will be allocated mainly to sustaining capex, mining works and engineering to deepen the San Carlos shaft, which will reduce haulage costs and increase access to ore reserves at deeper levels of the mine. Based on the progress of mine stope development and the profile of the mineral, we will continue to assess the timing of an expansion to milling capacity as well as potential adjustments in order to process higher lead and zinc ore grades.
The potential construction of a pyrites plant to increase gold and silver recovery from tailings at Fresnillo and Saucito is discussed in more detail on page 71.
Financial performanceAdjusted revenue, excluding inter-segment sales, declined 32.0% to US$588.3 million due to the 27.3% decrease in the price of silver and 11.5% decline in silver volumes sold.
The changes in productivity and cost per tonne indicators this year were minimal. Cost per tonne milled at this mine increased a slight 2.4% over 2012, to US$45.6. This reflects the 6.4% estimated total cost inflation at this mine, which was partially offset by efficiencies and costs reduction initiatives such as the use of wire mesh to optimise shotcreting activities, better operating controls that reduced consumption of materials such as steel balls for milling, and the optimised use of reagents. In addition, consequential insurance fees declined with the price of silver, and surface rights were reclassified to exploration expenses.
Cash cost per silver ounce increased 4.9% to US$5.87 (2012: US$5.59). Margin per ounce decreased 34.3% to US$17.0, and expressed as a percentage of silver price declined from 82.2% in 2012 to 74.3% in 2013.
Social and sustainability highlightsHealthThe business unit was recognised as a ‘Smoke-Free Company’ by the Mexican Ministry of Health, and for its high level of cooperation and synergy with the Mexican Social Security Institute (IMSS). Our Mine Rescue crew finished in second place in the benchman category, maintaining and preparing breathing equipment, in the Mexican Mining Chamber’s national competition. There was a 1% reduction in the risk premium paid to IMSS.
SafetyA safety coordinator for contractors was appointed to oversee adherence to the Group’s safety policies and support the implementation of safety culture.
EnvironmentWe maintained our target of zero fresh water used in mineral processing, with 100% of supply coming from treated municipal wastewater, and further reducing the need for water by minimising losses in the process through optimisation efforts. In addition, working with local authorities, we are providing fresh water pumped from the mine to the municipality in volumes that equal our wastewater usage; this year we also provided the surrounding ejidos with 4.3 million m3 of treated mine water diverted from our operations and delivered for agricultural use.
Community relationsWe supported construction of a local chapel, participated in Fresnillo’s municipal fair to communicate with and engage the community; and continued our permanent campaign of visits to the wastewater treatment plant, rehabilitated tailings pond and our tree nursery, which can significantly help address stakeholders’ concerns.
Capex US$
61.3 m–28.3%
Adjusted revenue US$
588.3 m–32.0% Adjusted revenue
US$
588.3 million
Gold 6.7%Silver 84.3%Lead 5.0% Zinc 4.0%
Adjusted production costsUS$
123.3 million
Contractor 21.5%Operating materials 20.9%Personnel 19.1% Electricity 16.6%Diesel 2.3%Maintenance 14.5%Others 5.1%
60 Fresnillo plc | Annual report 2013 www.fresnilloplc.com
Our Mines in Operation 1 Operate: Maximise the Potential of Existing Operations
Saucito, along with its planned Saucito II expansion (see page 70) is one of the Group’s key growth drivers and critical to achieving our 2018 production target of 65 million ounces of silver.
Our efforts are currently focused on converting resources to reserves in order to maintain a mine life of at least ten years, while advancing the Saucito II expansion towards completion in 2H14.
Saucito
What we said we would do in 2013Submit Saucito II expansion project for Board approval; begin construction in 2H 2013
Obtain Clean Industry certification and conduct initial audit for ISO 14001 certification
Exploration on the Natalias veins to expand resources
Cost cutting/efficiency initiatives
Evaluate construction of a pyrites plant in conjunction with the integrated Fresnillo district growth optimisation plan
What we did in 2013Secured Board approval for Saucito II; construction initiated in 1H 2013 and advanced ahead of schedule
Considerable progress made in Clean Industry and ISO 14001 certification processes
Despite on-going exploration, resources decreased 1.8% due to lower prices
Cost per tonne remained stable due to efficiencies in the milling process, which mitigated the 5.9% estimated inflation
Conducted engineering work for the pyrites plant; evaluated iron flotation circuit for Saucito II plant
What we plan to do in 2014Conclude construction of Saucito II in 4Q 2014
Increase development mainly in the west area of the Jarillas vein
Convert resources to reserves
Obtain Clean Industry and ISO 14001 certifications
1234
2013 2012 % change
Mine production
Ore milled (kt) 1,182 905 30.6
Silver (koz) 11,581 7,054 64.2
Gold (oz) 45,177 45,246 (0.2)
Lead (tonnes) 5,605 2,773 102.1
Zinc (tonnes) 4,509 1,791 151.8
Reserves
Total reserves
Silver (moz) 128.5 118.9 8.1
Gold (oz) 600,000 568,000 5.6
Avg ore grade in reserves
Silver (g/t) 384 357 7.6
Gold (g/t) 1.80 1.71 5.3
Cut-off grade (gpt Ag Eq) 145 114 27.2
Resources
Total resources
Silver (moz) 518.0 527.5 (1.8)
Gold (moz) 2.05 2.04 0.5
Average ore grade in resources
Silver (gpt) 363 362 0.3
Gold (gpt) 1.44 1.40 2.9
Cut-off grade (gpt Ag Eq) 98 83 18.1
Ownership: 100% Fresnillo plc
In operation since: 2011
Facilities: Underground mine and flotation plant
Workforce: 999 contractors
Location: Zacatecas, 8 km SW of the Fresnillo mine
Mine life (years): 8.8 (2012: 11.4)
2013 milling capacity: 3,000 tpd/990,000 tpy
2013 2012 % change
Financial highlights
Adjusted revenue (US$m) 326.3 285.9 14.1
Segment profit (US$m) 211.9 206.3 2.7
Capital expenditure (US$m) 71.2 54.4 30.9
Exploration (US$) 4.2 3.7 13.5
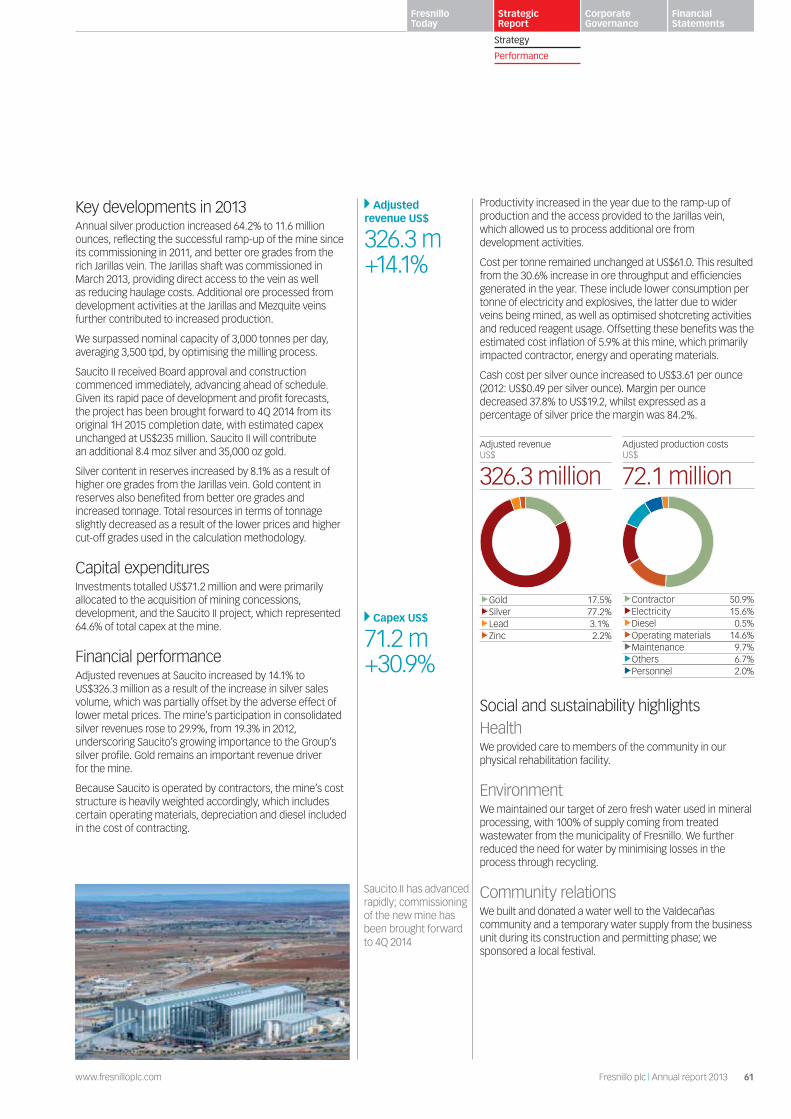
61www.fresnilloplc.com Fresnillo plc | Annual report 2013
Fresnillo Today
Strategic Report
Corporate Governance
Financial Statements
Strategy
Performance
Key developments in 2013Annual silver production increased 64.2% to 11.6 million ounces, reflecting the successful ramp-up of the mine since its commissioning in 2011, and better ore grades from the rich Jarillas vein. The Jarillas shaft was commissioned in March 2013, providing direct access to the vein as well as reducing haulage costs. Additional ore processed from development activities at the Jarillas and Mezquite veins further contributed to increased production.
We surpassed nominal capacity of 3,000 tonnes per day, averaging 3,500 tpd, by optimising the milling process.
Saucito II received Board approval and construction commenced immediately, advancing ahead of schedule. Given its rapid pace of development and profit forecasts, the project has been brought forward to 4Q 2014 from its original 1H 2015 completion date, with estimated capex unchanged at US$235 million. Saucito II will contribute an additional 8.4 moz silver and 35,000 oz gold.
Silver content in reserves increased by 8.1% as a result of higher ore grades from the Jarillas vein. Gold content in reserves also benefited from better ore grades and increased tonnage. Total resources in terms of tonnage slightly decreased as a result of the lower prices and higher cut-off grades used in the calculation methodology.
Capital expendituresInvestments totalled US$71.2 million and were primarily allocated to the acquisition of mining concessions, development, and the Saucito II project, which represented 64.6% of total capex at the mine.
Financial performanceAdjusted revenues at Saucito increased by 14.1% to US$326.3 million as a result of the increase in silver sales volume, which was partially offset by the adverse effect of lower metal prices. The mine’s participation in consolidated silver revenues rose to 29.9%, from 19.3% in 2012, underscoring Saucito’s growing importance to the Group’s silver profile. Gold remains an important revenue driver for the mine.
Because Saucito is operated by contractors, the mine’s cost structure is heavily weighted accordingly, which includes certain operating materials, depreciation and diesel included in the cost of contracting.
Productivity increased in the year due to the ramp-up of production and the access provided to the Jarillas vein, which allowed us to process additional ore from development activities.
Cost per tonne remained unchanged at US$61.0. This resulted from the 30.6% increase in ore throughput and efficiencies generated in the year. These include lower consumption per tonne of electricity and explosives, the latter due to wider veins being mined, as well as optimised shotcreting activities and reduced reagent usage. Offsetting these benefits was the estimated cost inflation of 5.9% at this mine, which primarily impacted contractor, energy and operating materials.
Cash cost per silver ounce increased to US$3.61 per ounce (2012: US$0.49 per silver ounce). Margin per ounce decreased 37.8% to US$19.2, whilst expressed as a percentage of silver price the margin was 84.2%.
Social and sustainability highlightsHealthWe provided care to members of the community in our physical rehabilitation facility.
EnvironmentWe maintained our target of zero fresh water used in mineral processing, with 100% of supply coming from treated wastewater from the municipality of Fresnillo. We further reduced the need for water by minimising losses in the process through recycling.
Community relationsWe built and donated a water well to the Valdecañas community and a temporary water supply from the business unit during its construction and permitting phase; we sponsored a local festival.
Capex US$
71.2 m+30.9%
Adjusted revenue US$
326.3 m+14.1%
Saucito II has advanced rapidly; commissioning of the new mine has been brought forward to 4Q 2014
Adjusted revenueUS$
326.3 million
Gold 17.5%Silver 77.2%Lead 3.1% Zinc 2.2%
Adjusted production costsUS$
72.1 million
Contractor 50.9%Electricity 15.6%Diesel 0.5%Operating materials 14.6%Maintenance 9.7%Others 6.7%Personnel 2.0%
62 Fresnillo plc | Annual report 2013 www.fresnilloplc.com
Our Mines in Operation 1 Operate: Maximise the Potential of Existing Operations
Whilst Ciénega has long been classified as a gold mine, silver revenues have risen markedly in recent years reflecting the mine’s rich silver resources.
Notwithstanding, in order to maintain equivalent gold production and compensate for lower average gold ore grade, we have increased milling capacity in the flotation plant and are intensifying exploration and extraction from the San Ramón satellite mine and other areas of influence. We will build a new tailings dam, the third, in 2014 to support increased operating levels.
Ciénega
What we said we would do in 2013Prepare a scoping study for the Las Casas project
Intensify exploration programme at Cebollitas
Evaluate alternatives to increase tailings dam capacity
Cost cutting/efficiency initiatives
What we did in 2013Began detailed exploration work at Rosario-Las Casas ore bodies to conduct direct sampling activities and carry out geotechnical and metallurgical tests to prepare a scoping study
Almost 10% of exploration investment in the district was allocated to Cebollitas
Initiated detailed engineering for the third tailings dam
Optimised milling capacity and increased ore processed by 11.6%; cost per tonne decreased by 8.1%
What we plan to do in 2014Continue optimising milling capacity to reach 4,000 tpd by year end
Evaluate and initiate construction on milling capacity expansion to 5,000 tpd
Conclude engineering and initiate construction of the third tailings dam at Ciénega
Continue exploration of the Cebollitas cluster with direct mine development work
Initiate mine development at Rosario-Las Casas
1234
Ownership: 100% Fresnillo plc
In operation since: 1992
Facilities: Underground mine, flotation and leaching plant
Workforce: 462 employees, 446 contractors
Location: Durango
Mine life (years): 11.9 (2012: 16.7)
2013 milling capacity: 3,600 tpd/1,200,000 tpy
2013 2012 % change
Financial highlights
Adjusted revenue (US$ m) 250.7 320.1 (21.7)
Segment profit (US$m) 146.1 217.7 (32.9)
Capital expenditure (US$m) 59.3 81.9 (27.6)
Exploration (US$) 11.5 15.4 (25.3)
2013 2012 % change
Mine production
Ore milled (kt) 1,242 1,113 11.6
Silver (koz) 4,240 3,329 27.4
Gold (oz) 112,053 125,275 (10.6)
Lead (tonnes) 4,811 5,676 (15.2)
Zinc (tonnes) 5,459 8,171 (33.2)
Reserves
Total reserves
Silver (moz) 67.4 66.1 2.0
Gold (oz) 809,000 828,000 (2.3)
Avg ore grade in reserves
Silver (g/t) 142 111 27.9
Gold (g/t) 1.71 1.38 23.9
Cut-off grade (gpt Au Eq) 2.12-2.94 1.90 N/A
Resources
Total resources
Silver (moz) 144.0 136.8 5.3
Gold (moz) 1.61 1.67 (3.6)
Average ore grade in resources
Silver (gpt) 141 113 24.8
Gold (gpt) 1.58 1.38 14.5
Cut-off grade (gpt Au Eq) 1.48–2.05 1.18–2.10 N/A

63www.fresnilloplc.com Fresnillo plc | Annual report 2013
Fresnillo Today
Strategic Report
Corporate Governance
Financial Statements
Strategy
Performance
Key developments in 2013Annual gold production decreased 10.6% from 2012 due to the expected depletion of high ore grade bodies. This was partially mitigated by increased volumes of ore throughput resulting from the optimisation of the milling process, which increased capacity from 2,800 to 3,600 tpd, and slightly improved recovery rates.
Silver production increased by a strong 27.4% due to increased ore throughput from San Ramón, which has higher silver mineralisation and lower gold grades. San Ramón represented 34% of Ciénega’s total throughput.
Lead and zinc production fell as a result of lower grades.
As expected, average gold ore grade decreased in the year, from 3.6 g/t in 2012 to 2.9 g/t (-19.4%). Conversely, silver ore grade rose 15.6% to 121.6 g/t reflecting the increased contribution from the San Ramón satellite. Gold grades are expected to continue decreasing towards the level contained in resources with an expected ore grade between 2.0 g/t and 2.5 g/t for 2014, whilst silver grade is anticipated to remain above 100 g/t in the coming years, further strengthening the silver profile of this mine.
Silver reserves were replenished, whilst gold reserves decreased by 2.3% with the depletion of gold ore bodies at Ciénega. Resources reflected higher silver mineralisation, in the San Ramón and Las Casas-Rosario satellite mines. Total gold and silver content remains stable at San Ramón; exploration on the new San Gregorio and El Campo 2 veins showed good gold and silver grades over mineable widths, and new exploration targets were developed south of Ciénega’s mine through mapping and sampling.
Capital expendituresInvestments declined 27.6% from the previous year, to US$59.3 million, with resources allocated to development and mine work, optimisation of the milling process, construction of a 2.2 km water drainage tunnel to reduce pumping costs, acquisition of mining concessions and surface land, and replacement of equipment. Capex in 2014 will be allocated to expanding milling capacity to 5,000 tpd and construction of the third tailings dam.
Financial performanceAdjusted revenue decreased 21.7% to US$250.7 million in 2013, reflecting lower sales volume in gold and the lower prices of gold and silver. Ciénega is the Group’s most polymetallic mine, as evidenced by the 41.3% contribution from silver, lead and zinc (2012: 36.9%).
Productivity increased in the year due to optimisation of the milling process. Cost per tonne milled at Ciénega decreased 8.1% to US$70.8 reflecting the positive impact of the 11.6% increase in ore milled and other efficiencies achieved, such as optimised shotcreting, lower consumption of anchors, reduced unit consumption of electricity resulting from the optimised milling process, and reduction in diesel consumption due to shorter haulage distances from upper levels of the mine, as well as lower medical expenses. These benefits were offset by an estimated cost inflation of 5.4%.
Cash cost per gold ounce increased to US$37.7. Margin per ounce was US$1,363.6, whilst expressed as a percentage of gold prices the margin was 97.3%.
Social and sustainability highlightsHealthDue to the mine’s geographical location, we have an agreement with the Mexican Social Security Institute (IMSS) to assume general healthcare services for the community. Through the Healthy Kids Programme, we tracked the height and weight of children, conducted blood tests to detect anaemia, and gave talks to encourage healthy diets and detect eating disorders. In the Mexican Mining Chamber’s National Competition, our San Ramón rescue team placed third in first aid and in haemorrhage assistance.
EnvironmentOperational excellence in the mineral processing facility helped minimise water losses, thereby reducing demand for fresh water. We optimised electricity consumption to reduce usage during periods of peak demand on the national grid. We continued to maintain and support the 900-hectare conservation forest growing on reclaimed land around the mine.
Community relationsWe sponsored a local festival and continued our permanent campaign of garbage collections.
Capex US$
59.3 m–27.6%
Adjusted revenue US$
250.7 m–21.7%
Primary crushing at Ciénega
Adjusted revenueUS$
250.7 million
Gold 58.7%Silver 34.4%Lead 3.3% Zinc 3.6%
Adjusted production costsUS$
88.0 million
Contractor 41.2%Operating materials 18.8%Personnel 13.6% Electricity 9.6%Diesel 1.1%Maintenance 8.1%Others 7.6%

64 Fresnillo plc | Annual report 2013 www.fresnilloplc.com
What we said we would do in 2013Increase the resource base through extensive exploration
Continue exploration at Centauro Deep to increase the project’s resource base
Evaluate a future expansion of the Mega Centauro pit
Obtain OHSAS 18001 certification
Cost cutting/efficiency initiatives
What we did in 2013Despite intensive exploration, the resource base decreased due to a more conservative pit design and the mine’s sensitivity to lower prices and higher cut-off grades
Increased resources at Centauro Deep
Conducted additional exploration and evaluation of Mega Centauro, positioning for approval in 2014
Continued to work towards OHSAS 18001 certification
Suspension of explosives permits disrupted operations and limited any efficiency measures
What we plan to do in 2014Conclude evaluation for expansion of the Mega Centauro pit; pending approval, initiate stripping activities
Increase the resource base at the Centauro Deep project
Increase the overall resource base through extensive exploration
Conclude OHSAS 18001 certification process
Herradura is Mexico’s largest open pit gold mine. It faced unusual operating conditions in 2013, detailed on page 65, which affected production and how we are reporting performance for the mine this year.
We continue to design and evaluate a potential expansion of the Mega Centauro pit and are conducting on-going exploration at the Centauro Deep project (below the main pit of Herradura, which has the potential to be developed as an underground mine), as well as at the mine’s areas of influence and across the district.
Herradura
Our Mines in Operation 1 Operate: Maximise the Potential of Existing Operations
1234
Ownership: Minera Penmont JV (56% Fresnillo plc, 44% Newmont USA Limited)
In operation since: 1997
Facilities: Open pit mine, heap leach and Merrill-Crowe plant
Workforce: 1,027 employees, 337 contractors
Location: Sonora
Mine life (years): 4.1 (2012: 6.6)
2013 2012 % change
Financial highlights
Adjusted revenue (US$ m) 379.4 528.6 (28.2)
Segment profit (US$m) 180.5 372.9 (51.6)
Capital expenditure (US$m) 129.7 114.7 13.1
Exploration (US$) 25.4 13.5 88.1
2013 2012 % change
Mine production
Ore deposited (kt) 14,363 24,641 (41.7)
Silver (koz) 167 136 22.8
Gold (oz) 148,155 176,146 (15.9)
Reserves
Total reserves
Silver (moz) 1.91 2.95 (35.3)
Gold (oz) 1.52 2.17 (30.0)
Avg ore grade in reserves
Silver (g/t) 1 1 –
Gold (g/t) 0.80 0.73 9.6
Cut-off grade (gpt Au Eq) 0.30 0.30 –
Resources
Total resources
Silver (moz) 4.08 4.87 (16.2)
Gold (moz) 2.88 3.58 (19.6)
Average ore grade in resources
Silver (gpt) 1 1 –
Gold (gpt) 0.71 0.73 (2.7)
Cut-off grade (gpt Au Eq) 0.30 0.30 –

65www.fresnilloplc.com Fresnillo plc | Annual report 2013
Fresnillo Today
Strategic Report
Corporate Governance
Financial Statements
Strategy
Performance
Key developments in 2013The suspension of the explosives permits in the Herradura district in 2H 2013 had several implications on performance, most notably annual attributable gold production, which decreased by 15.9%. This was due to the lower ore deposited, which was somewhat mitigated by the recovery of material already in inventory. In addition, the mine absorbed personnel and equipment that were relocated from Soledad-Dipolos, as well as their corresponding costs. These additional resources were dedicated to advancing development at the mine without the use of explosives, largely pre-drilling holes for eventual blasting, and hauling very fine materials, which resulted in an increase of 12.7% of tonnes of waste material moved in the year.
During the period of 2013 that the mine was operating under normal conditions, average gold ore grade increased by 7.0% to 0.61 g/t. This is expected to increase to a range of 0.65 g/t to 0.80 g/t in 2014 as the pit continues to deepen and the dynamic leaching plant gives us flexibility to process higher grade gold ore. Full year production at Herradura is expected to be 200,000 attributable gold ounces, reflecting the gradual increase of production to normal levels at the Herradura pit and the contribution of the new dynamic leaching plant.
Exploration activities continued at the Centauro Deep project, with 57,383 metres of diamond drilling conducted in 2013. The reduction in resources and reserves at this mine reflected the impact of lower gold prices and the use of more conservative parameters for the open pit mine, which was designed to leave resources for underground mining; these parameters will be reviewed and revised for the new expanded pit design.
Capital expendituresInvestments increased 13.1% to US$129.7 million in 2013, with funds allocated to completion of construction of the dynamic leaching plant, underground mine exploration works at Centauro Deep, construction of leaching pads and preparation of new waste dumps. It should be noted that construction of the tenth leaching pad, which will ensure operational continuity, continued only until August of 2013 until activities were disrupted.
Exploration expenses increased significantly to intensify drilling activities at the Centauro pit and its surrounding areas in order to provide more information to better assess the viability of these projects.
Financial performanceAdjusted revenue decreased to US$379.4 million, a 28.2% decrease as a result of lower gold volumes sold at lower prices.
Adjusted production costs declined in absolute terms reflecting the fewer months in operation. While certain unproductive costs were recorded in the income statement, these are not reflected in the cost per tonne.
Productivity indicators were affected by the unionised personnel from the Soledad-Dipolos mine who were transferred and absorbed at Herradura for training and to carry out development.
Cost per tonne for the full year of US$8.4 was distorted as a result of the halted operations. In 1H 2013 it was affected by longer haulage distances and the deeper pit, which affected all cost components, particularly labour and energy; as well
as the increase in the number of contractors and unionised workers hired; and higher consumption of sodium cyanide and lime to improve recovery rates. However, in 2H 2013 this indicator was further impacted by the lower volumes deposited on the leaching pads and the costs from the beneficiation plant applied to this reduced volume.
Cash cost per gold ounce was US$651.2, an increase of 38.4%. Margin per ounce was US$750.1, or 53.5% if expressed as a percentage of gold prices.
Social and sustainability highlights (Penmont)Our peopleThis business unit employs the highest percentage of woman in the Group, at 10%.
HealthWe operate a permanent programme to detect osteoporosis among vulnerable members of the community; the business unit’s rescue team finished second in first aid and third in traumatic fractures at the Mexican Mining Chamber National Competition; the risk premium paid to the Mexican Social Security Institute declined 1%.
SafetyThe Herradura mine has the best safety track record of the Group with a Total Recordable Injury Frequency (TRIF) of 1.01 and a Lost Time Injury Frequency Rate (LTIFR) of 0.16.
EnvironmentThere was a 13.6% increase in the amount of water reused in our processes in the effort to cap water withdrawal. We conducted engineering studies for a desalination plant that would allow growth while capping consumption of fresh water. Fleet optimisation (transport and loading) reduced diesel consumption 5% (2010 as baseline year). The use of additives has further reduced diesel usage and its corresponding GHG emissions. Biodiversity efforts include the permanent cooperation with local authorities for the protection of the Sonoran Pronghorn, an endangered antelope species.
Community relationsWe completed a new healthcare facility in the community, sponsored sport events and local teams, and continued our permanent campaign of site visits to address any of our stakeholders’ environmental concerns with respect to open pit mining.
Capex US$
129.7 m+13.1%
Adjusted revenue US$
379.4 m–28.2%
Adjusted revenueUS$
379.4 million
Gold 98.1%Silver 1.9%
Adjusted production costsUS$
120.4 million
Contractor 35.3%Operating materials 28.8%Diesel 15.2% Electricity 1.7%Maintenance 14.4%Personnel and others 4.6%
66 Fresnillo plc | Annual report 2013 www.fresnilloplc.com
What we said we would do in 2013Accelerate gold recovery at the pads, including an expansion of processing capacity at the plant from 750 to 1,250 m3 per hour
Complete OHSAS 18001 certification process and obtain International Cyanide Management Code certification
Cost cutting/efficiency initiatives
What we did in 2013As this mine operated only six months of the year, we did not meet our objectives
What we plan to do in 2014Evaluate the economic viability of the Soledad pit and/or of relocating the beneficiation plant, which was dismantled
Located 8 km northwest of the Herradura mine, Soledad-Dipolos faced a court-ordered stoppage in 2H 2013 stemming from the Ejido El Bajío legal proceedings (see page 11).
Following the cessation of operations, most of this mine’s personnel and equipment were relocated to the Herradura and Noche Buena mines.
Soledad-Dipolos
Our Mines in Operation 1 Operate: Maximise the Potential of Existing Operations
1234
Ownership: Minera Penmont JV (56% Fresnillo plc, 44% Newmont USA Limited)
In operation since: 2010
Facilities: Open pit mine, heap leach and Merrill-Crowe plant (except smelting, which was done at Herradura)
Workforce: 405 employees, 388 contractors (average for 1H 2012)
Location: Sonora
Mine life (years): N/A (2012: 3.2)
2013 2012 % change
Financial highlights
Adjusted revenue (US$ m) 68.8 178.5 (61.5)
Segment profit (US$m) 30.0 112.2 (73.3)
Capital expenditure (US$m) 1.7 8.7 (80.5)
Exploration (US$) 4.9 10.6 (53.8)
2013 2012 % change
Mine production
Ore deposited (kt) 6,702 15,318 56.2
Silver (koz) 17 29 (41.4)
Gold (oz) 26,480 60,104 (55.9)
Reserves
Total reserves
Silver (moz) 0.68 0.89 (23.6)
Gold (oz) 436,000 549,000 (20.5)
Avg ore grade in reserves
Silver (g/t) 1 1 –
Gold (g/t) 0.64 0.62 3.2
Cut-off grade (gpt Au Eq) 0.30 0.30 –
Resources
Total resources
Silver (moz) 0.78 0.89 (12.4)
Gold (oz) 488,141 549,621 (11.2)
Average ore grade in resources
Silver (g/t) 1 1 –
Gold (g/t) 0.62 0.62 –
Cut-off grade (gpt Au Eq) 0.30 0.30 –

67www.fresnilloplc.com Fresnillo plc | Annual report 2013
Fresnillo Today
Strategic Report
Corporate Governance
Financial Statements
Strategy
Performance
Key developments in 2013Attributable gold production decreased 55.9% to 26,480 ounces in 2013 due to the suspension of operations in July. During the months the mine was operational, average ore grade was 0.54 g/t. We are currently analysing the best option for the Soledad pit and the recovery of any remaining gold inventories from the leaching pads.
No additional resources were found at this mine following limited exploration activities in the year and depletion from production in 1H 2013. Of total attributable resources, 80% are estimated to be within the Dipolos pit, which has been vacated as a result of the Ejido El Bajío proceedings.
Capital expendituresInvestments were limited to the early months of the year and totalled US$1.7 million. These funds were allocated to development, construction of leaching pads and improved safety procedures in anticipation of International Cyanide Management Code certification.
Financial performanceAdjusted revenue decreased by 61.5% to US$68.8 million reflecting the lower volumes of gold produced and sold, at lower average prices, after operations were suspended in 2H 2013.
Adjusted production costs reflect only 6.5 months of operation.
Productivity indicators were affected by the limited operations in the year. Cost per tonne calculations were affected completely by factors from the first half of the year when the mine was operational, and rose to US$9.90/tonne from US$6.32/tonne in 2012. As a result of the increase in the stripping ratio from 3.0 in 2012 to 5.2 in 2013, all cost components rose: additional contractors hired to haul increased volumes of waste material; inefficient scale resulting from the decrease in volumes of ore deposited at the leaching pads; increased maintenance costs due to more intensive use of equipment; higher diesel consumption per tonne as a result of longer distances; and higher consumption of sodium cyanide to accelerate recovery at the leaching pads.
In 2013, cash cost per gold ounce was US$820.28, an increase of 32.6% over 2012. Margin per ounce decreased 44.9% to US$581.04, and margin expressed as a percentage of gold price declined to 41.5% (2012: 63.0%).
Social and sustainability highlightsPerformance for this mine is included in reporting for the entire Penmont business unit. See Herradura highlights on page 65.
Adjusted revenue US$
68.8 m–61.5%
Personnel and equipment from Soledad-Dipolos were transferred to Herradura and Noche Buena in 2H 13
Adjusted production costsUS$
66.4 million
Contractors 46.0%Operating materials 19.9%Diesel 10.6%Electricity 1.5%Maintenance & repairs 15.6%Personnel 5.9%Others 0.3%
Adjusted revenueUS$
68.8 million
Gold 98.9%Silver 1.1%

68 Fresnillo plc | Annual report 2013 www.fresnilloplc.com
What we said we would do in 2013Expand processing capacity at the plant from 750 to 1,600 m3 per hour
Expand capacity and increase average annual gold production to 75,000 attributable ounces in the 2013-2018 period
Advance the International Cyanide Management Code certification process for receipt in 2014
Initiate and advance the OHSAS 18001 certification process
Cost cutting/efficiency initiatives
What we did in 2013We advanced 70% in the expansion of the plant from 750 m3 to 1,600 m3 per hour
Despite several stoppages due to the suspension of the explosives permit, gold production increased by 66% to 60,888 ounces
We initiated the process to obtain Cyanide Code and OHSAS 18001 certifications
Achieved economies of scale in mine operations
Constructed two new leaching pads with capacity of 16 million tonnes and capex of US$13.5 million
What we plan to do in 2014Continue to increase average annual gold production to the target of 75,000 attributable ounces
Complete the construction of the 1,600 m3/hour processing plant
Initiate the process to obtain the International Cyanide Management Code and OHSAS 18001 certifications
Continue infill exploration drilling programme
Noche Buena commenced operations as an open pit gold mine in 2012. Located in the Herradura district 23 km from the Herradura mine, the mine was acquired in 2008 from Seabridge as part of the Group’s district consolidation strategy.
As gold production continues to ramp-up to an average of 75,000 attributable gold ounces per year, we also seek to convert resources into reserves and expand the resource base through an on-going exploration programme.
Noche Buena
Our Mines in Operation 1 Operate: Maximise the Potential of Existing Operations
1234
Ownership: Minera Penmont JV (56% Fresnillo plc, 44% Newmont USA Limited)
In operation since: 2012
Facilities: Open pit mine, heap leach and Merrill-Crowe plant
Workforce: 417 employees, 375 contractors
Location: Sonora
Mine life (years): 2.9 (2012: 4.1)
2013 2012 % change
Financial highlights
Adjusted revenue (US$ m) 148.4 108.5 36.8
Segment profit (US$m) 45.1 68.9 (34.5)
Capital expenditure (US$m) 52.2 43.7 19.5
Exploration (US$) 21.5 22.2 (3.2)
2013 2012 % change
Mine production
Ore deposited (kt) 12,284 8,447 45.4
Silver (koz) 28 8 250.0
Gold (oz) 60,888 36,690 66.0
Reserves
Total reserves
Silver (moz) 1.15 1.14 0.9
Gold (oz) 625,000 629,000 (0.6)
Avg ore grade in reserves
Silver (g/t) 1 1 –
Gold (g/t) 0.54 0.55 (1.8)
Cut-off grade (gpt Au Eq) 0.30 0.30 –
Resources
Total resources
Silver (moz) 1.87 1.64 14.0
Gold (oz) 980,000 890,000 10.5
Average ore grade in resources
Silver (gpt) 1 1 –
Gold (gpt) 0.52 0.54 (3.7)
Cut-off grade (gpt Au Eq) 0.30 0.30 –

69www.fresnilloplc.com Fresnillo plc | Annual report 2013
Fresnillo Today
Strategic Report
Corporate Governance
Financial Statements
Strategy
Performance
Key developments in 2013In its first full year of operations, attributable gold production at Noche Buena continued to ramp-up, reaching 60,888 ounces. In the second half of the year, the mine absorbed personnel and equipment that were relocated from Soledad-Dipolos, as well as their corresponding costs. However, these additional resources were dedicated to advancing development at the mine, which resulted in an increase of 77.8% of tonnes of waste material moved in the year.
Average gold ore grade was 0.54 g/t, an increase of 5.9% over 2012. In 2014, ore grades are expected to remain steady whilst attributable gold production should continue to ramp-up to the target average of 75,000 attributable ounces per year.
Exploration at the mine resulted in positive gold grades obtained in step-out drilling around the pit limits. The resource base was expanded at this mine despite the lower prices used in estimations. Gold contained in resources increased while those in reserves slightly decreased.
Capital expendituresInvestments of US$52.2 million were allocated to construction of leaching pads, development activities and expansion of processing capacity at the beneficiation plant.
Financial performanceAdjusted revenues at Noche Buena were US$148.4 million due to higher sales volumes that partially mitigated lower gold prices in 2013.
Productivity indicators for 2013 differ from the partial year figures of 2012, when ore from development activities and from upper parts of the pit was deposited at the leaching pads. Similarly, cost per tonne at this mine was US$7.84/tonne, a 18.1% increase due to the inefficiencies caused by stopping and initiating operations several times when the explosives permits were suspended, an increase in the stripping ratio from 3.5 to 3.9 and the fact that an important part of the ore processed in 2012 was sourced from material stockpiled during construction of the mine.
In 2013, cash cost per gold ounce was US$928.03, an increase of 61.6% over 2012. Margin per ounce was US$473.3, and margin expressed as a percentage of gold price declined to 33.8%.
Social and sustainability highlightsPerformance for this mine is included in reporting for the entire Penmont business unit. See Herradura highlights on page 65.
Capex US$
52.2 m+19.5%
Adjusted revenue US$
148.4 m+36.8%
Gold production at Noche Buena continued to ramp-up in 2013
Adjusted production costsUS$
96.3 million
Contractors 35.3%Operating materials 28.8%Diesel 15.2%Electricity 1.7%Maintenance & repairs 14.4%Personnel & others 4.6%
Adjusted revenueUS$
148.4 million
Gold 99.3%Silver 0.7%
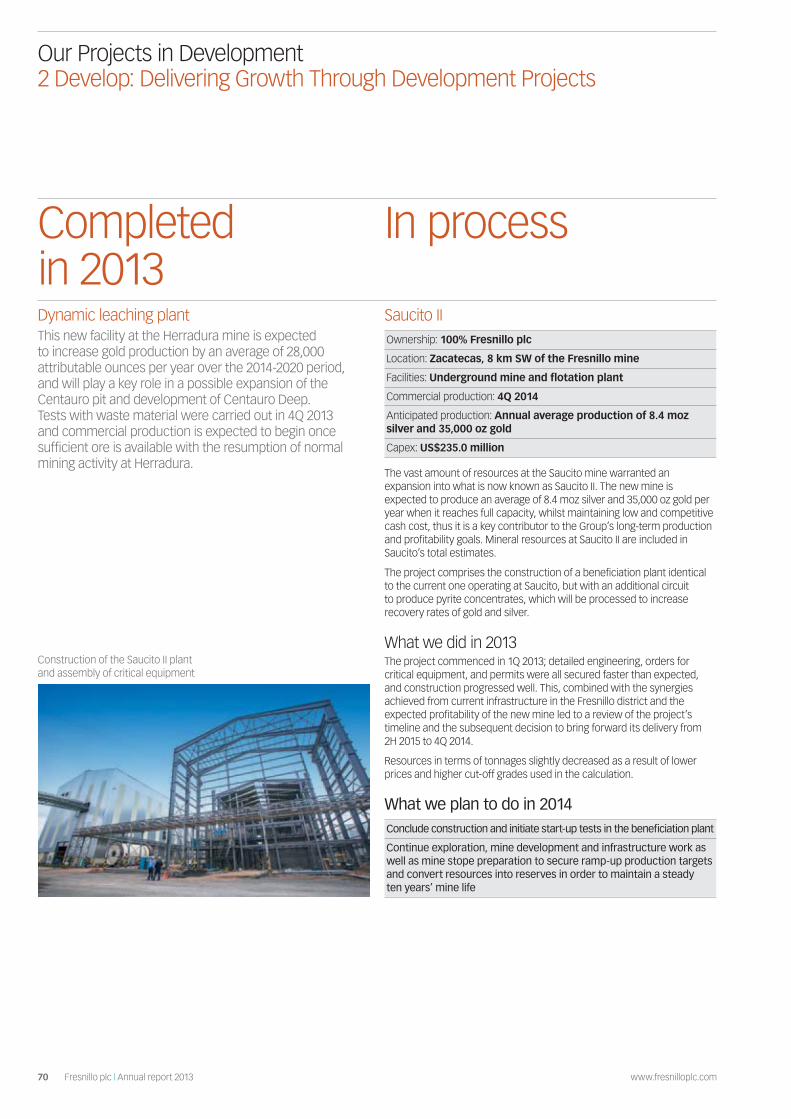
70 Fresnillo plc | Annual report 2013 www.fresnilloplc.com
Our Projects in Development 2 Develop: Delivering Growth Through Development Projects
Dynamic leaching plantThis new facility at the Herradura mine is expected to increase gold production by an average of 28,000 attributable ounces per year over the 2014-2020 period, and will play a key role in a possible expansion of the Centauro pit and development of Centauro Deep. Tests with waste material were carried out in 4Q 2013 and commercial production is expected to begin once sufficient ore is available with the resumption of normal mining activity at Herradura.
Saucito IIOwnership: 100% Fresnillo plc
Location: Zacatecas, 8 km SW of the Fresnillo mine
Facilities: Underground mine and flotation plant
Commercial production: 4Q 2014
Anticipated production: Annual average production of 8.4 moz silver and 35,000 oz gold
Capex: US$235.0 million
The vast amount of resources at the Saucito mine warranted an expansion into what is now known as Saucito II. The new mine is expected to produce an average of 8.4 moz silver and 35,000 oz gold per year when it reaches full capacity, whilst maintaining low and competitive cash cost, thus it is a key contributor to the Group’s long-term production and profitability goals. Mineral resources at Saucito II are included in Saucito’s total estimates.
The project comprises the construction of a beneficiation plant identical to the current one operating at Saucito, but with an additional circuit to produce pyrite concentrates, which will be processed to increase recovery rates of gold and silver.
What we did in 2013 The project commenced in 1Q 2013; detailed engineering, orders for critical equipment, and permits were all secured faster than expected, and construction progressed well. This, combined with the synergies achieved from current infrastructure in the Fresnillo district and the expected profitability of the new mine led to a review of the project’s timeline and the subsequent decision to bring forward its delivery from 2H 2015 to 4Q 2014.
Resources in terms of tonnages slightly decreased as a result of lower prices and higher cut-off grades used in the calculation.
What we plan to do in 2014 Conclude construction and initiate start-up tests in the beneficiation plant
Continue exploration, mine development and infrastructure work as well as mine stope preparation to secure ramp-up production targets and convert resources into reserves in order to maintain a steady ten years’ mine life
Completed in 2013
In process
Construction of the Saucito II plant and assembly of critical equipment

71www.fresnilloplc.com Fresnillo plc | Annual report 2013
Fresnillo Today
Strategic Report
Corporate Governance
Financial Statements
Strategy
Performance
1234
Pending approval in 2014
San JuliánOwnership: 100% Fresnillo plc
Location: Chihuahua/Durango border
Facilities: Underground mine, flotation plant and a dynamic leaching plant
Commercial production: 2H 2015
Anticipated production: Annual average production of 10.3 moz silver and 44,000 oz gold
Indicated & inferred resources: 200.8 moz silver and 893 koz gold
Capex: US$515.0 million
The San Julián silver-gold project is vital to advancing the Company’s production goals, and management believes there is sufficient geological potential in the region to establish a new mining district in the future.
The project includes construction of two plants: i) a flotation plant with 6,000 tpd capacity to process ore from the disseminated body; and ii) a dynamic leaching plant to treat 3,000 tpd of ore from the veins. Once at full capacity, average commercial production is estimated at 10.3 moz silver and 44,000 oz gold per year, with cash costs in the lowest quartile of the international cash cost curve.
What we did in 2013 As with any greenfield project, unforeseen developments can influence scope and timelines. In the case of San Julián, we identified the need to construct a water reservoir to complement underground water resources; encountered delays, now resolved, in obtaining environmental and construction permits; and faced heightened security requirements for our people and assets. Project delivery has been deferred from 4Q 2014 to 2H 2015 and capex increased slightly to US$515.0 million.
The original mining plan considered starting with the extraction of the disseminated ore body first, followed by production from the veins; as such, development at the ore body had already progressed. However, the plan has now been revised and reversed to reflect that a source of water for the dynamic leaching plant has already been secured, while reservoir construction must take place to support the flotation plant.
Detailed engineering advanced in 2013, orders were placed for critical components and environmental and construction permits were ultimately secured. Construction of the landing strip to facilitate the fly-in/fly-out requirement of the mine was concluded in 2013 and construction of the workers’ encampment started. Core drilling in the year significantly increased total resources due to detailed underground information and the use of lower cut-off grades using realistic mining costs.
The 42,819 metres of drilling carried out in the year included strategically oriented holes to confirm the geological models. Development drifts on both the disseminated and vein ore bodies have delivered higher than expected grades of silver and gold. Additional resources were discovered on the Mireya and Calera veins. Development work continues at an accelerated pace; mine workings and ventilation raises advanced 13,094 metres and 891 metres in 2013, respectively, totalling 40,095 metres and 10,300 metres in the project.
What we plan to do in 2014 Continue mining works at the veins
Initiate construction of the dynamic leaching plant, tailings dam and water reservoir
Fresnillo pyrites treatment plantOwnership: 100% Fresnillo plc
Location: Zacatecas, Saucito mine (between the two beneficiation plants)
Facilities: Leaching plant
Commercial production: 2H 2016
Anticipated production: Annual average production of 4 moz silver and 18,000 oz gold
Capex: US$105.0 million
This facility is expected to increase silver and gold recovery rates by processing tailings from the Fresnillo and Saucito mines. The plant will froth float pyrite concentrates that will be leached in a 2,000 tpd dynamic leaching plant and Merrill-Crowe plant to produce precipitates. Production is expected to total 4 moz silver and 18,000 oz gold per year, and advances our objective to maximise production in the Fresnillo district.
What we did in 2013We continued engineering works and added flotation cells to produce the iron concentrate for the pyrites treatment process in the layout of Saucito II’s beneficiation plant.
What we plan to do in 2014 Conclude detailed engineering
Submit the project for Board approval and subject to that approval, initiate construction

72 Fresnillo plc | Annual report 2013 www.fresnilloplc.com
Our Exploration Programme 3 Explore: Extend the Growth Pipeline
What we did in 2013 An extensive exploration programme was completed in 2013, including 376,317 metres of core and 168,141 metres of reverse circulation drilling on 25 properties, following geological mapping and geochemical/geophysical surveys.
We have identified numerous new targets in the mining districts where we operate, which are under systematic exploration. This approach has proven to deliver cost-effective discoveries as infrastructure is already in place. We have also explored in other selected districts where initial drilling has been successful in identifying potential. This prioritisation has resulted in side-lining certain prospects and accelerating others. We are particularly excited about the results at Guanajuato, Orisyvo in Chihuahua, and Rodeo in Durango.
It should be noted that we utilise the Australasian Code for Reporting of Exploration Results, Mineral Resources and Ore Reserves – commonly known as the JORC Code, to report our audited resource estimate, as is standard among our peer group. A new edition of the JORC Code came into effect on 1 December 2013, known as the 2012 Edition of the JORC Code, and while only Australian Securities Exchange (ASX)-listed companies are mandated to use it, we believe it reflects current best practice and have ensured that our auditors utilise the new code’s methodology. A summary of changes between the 2004 and 2012 Editions of the JORC Code can be found at www.jorc.org (but for PDF website purposes keep the hyperlink to where it is currently pointed).
Reserves and resources in 2013 were calculated at a gold price of US$1,250 per oz and silver at US$19.50 per oz (US$1,400 and US$27.00 in 2012). Notwithstanding this more conservative basis for calculation, there was an increase in audited resources: gold by 5.2% to 28.4 moz and silver by 5.0% to 2,134.5 moz. Of particular note were the results obtained at Centauro Deep, Lucerito, San Julián, Candameña, and Ciénega–San Ramón. In addition 2.9 moz gold and 131.5 moz silver were upgraded from inferred to indicated resources.
Gold reserves fell by 14.5% to 4.7 moz, due mainly to the revised calculation criteria, whilst silver reserves declined 4.3% to 477.2 moz, related both to the change in price as well as to development delays at Fresnillo that were only partially mitigated by increased reserves at Saucito.
Community engagement programmes remained a critical part of the exploration group’s activities in 2013. Local efforts near our sites included awareness campaigns and celebrations around events such as World Water Day, World Environment Day, Arbour Day, Literacy Day, Health Day, Women’s Day and Children’s Day. In addition, we helped build a new river embankment in one community, contributed construction materials to several local projects, and donated saplings to a number of schools.
Our safety performance improved in 2013, due to strengthened procedures at all of our exploration sites, with no fatalities reported. With respect to environmental standards, we operate under our ISO 14001:2004 certification, and continue to improve our procedures, including close monitoring of all environmental indicators related to drilling and camp operations.
Exploration is one of top priorities for Fresnillo plc. We have built an experienced exploration team, composed of 82 geologists working alongside 75 technicians and administrative staff, and employ 385 local community members at our project sites. We are focused on the discovery and potential acquisition of large, low-cost silver and gold ore bodies in Latin America, in regions with the greatest geological potential and mining tradition such as Mexico and Peru.
Exploration 1234
Core analysis helps prioritise targets in our mining districts

73www.fresnilloplc.com Fresnillo plc | Annual report 2013
Fresnillo Today
Strategic Report
Corporate Governance
Financial Statements
Strategy
Performance
Fresnillo districtMinera JuanicipioOwnership: 56% Fresnillo plc, 44% MAG Silver
Location: Zacatecas, 8 km SW of the Fresnillo mine
Indicated & inferred resources (attributable): 115.2 moz silver and 452,600 oz gold
42,236 metres were drilled mostly as infill within the known ore-shoot in order to improve confidence in the indicated resources. Some drilling was devoted to pursue other targets in the property, without increasing the resources.
Other sites in the Fresnillo corridorFour targets were drill tested in the Fresnillo district with 13,704 metres of core, to follow up geochemical and geophysical anomalies in alluvium covered areas. Interesting silver values were obtained in two of these, related to quartz stringers and silicification. Additional drilling is planned.
Herradura districtCentauro DeepOwnership: Minera Penmont (56% Fresnillo plc, 44% Newmont USA Limited)
Location: Sonora, below the Centauro main pit at Herradura
Indicated & inferred resources (attributable): 2.17 moz gold
37,607 metres core drilling; good gold grades continued to be found in the vein system below the final Herradura pit. 3,254 metres of underground mine workings were completed in 2013, totalling 12,482 metres in the project area. Mineralisation now extends for at least 800 metres along strike showing good grade continuity.
Ciénega districtOwnership: Minera La Ciénega, S.A. de C.V. (100% Fresnillo plc)
Location: Durango
Las Casas-RosarioA significant resource of 445.0 koz gold and 40.6 moz silver (indicated and inferred) has been incorporated into the mine operation. Drifting along the veins is proving grade continuity and this new mine area is under preparation for stoping.
San Ramón satellite mine36,607 metres of core drilling were completed, resulting in the identification of extensions at depth at Porvenir-Bandera and Republicana veins, and in the discovery of the San Gregorio and El Campo vein systems, currently under evaluation. Total resources stand at 206 koz gold and 40.2 moz silver.
Cebollitas clusterPositive results have been returned from drilling along the Taspana and Tajos veins; total resources amount to 225 koz gold and 29.0 moz silver at good grades over mineable widths. Exploration will continue in 2014.
Ciénega SurInitial drilling (3,615 metres) did not encounter economic mineralisation at the San José vein, however, two additional targets remain to be tested in 2014.
Key exploration projects and prospects
1234
Exploration activities at the Herradura district

74 Fresnillo plc | Annual report 2013 www.fresnilloplc.com
OrisyvoOwnership: Minera Fresnillo, S.A. de C.V. (100% Fresnillo plc)
Location: Chihuahua
Indicated & inferred resources: 9.9 moz gold and 13.5 moz silver
We conducted 8,633 metres of core drilling from surface and 3,380 metres of core drilling from underground, which resulted in an increase to indicated resources. Detailed metallurgical investigation in the sulphide zone is underway to define the most cost-effective process for gold recovery. Exploration mine workings advanced 1,773 metres in the upper oxide zone along the Chuyaivo adit, where we plan to collect bulk samples for additional metallurgical test work and build drill pads for underground infill drilling.
LuceritoOwnership: 55% Minera Mexicana La Ciénega, S.A. de C.V., 45% Minera Saucito, S.A de C.V.
Location: Durango
Indicated & inferred resources: 2.0 moz gold and 143.9 moz silver
Following 25,397 metres of infill drilling, there was a significant increase in both gold and silver resources. Additional metallurgical test work will be completed in 2014.
GuachichilOwnership: Minera Saucito, S.A. de C.V. (100% Fresnillo plc)
Location: Zacatecas
Indicated & inferred resources: 0.97 moz gold and 14.8 moz silver
The 2013 drill campaign consisted of 20,834 metres of core, stepping out from the known ore body, and covering ore showings in the northeast zone. Several geophysical targets also remain to be tested.
CandameñaOwnership: Minera Fresnillo, S.A. de C.V. (100% Fresnillo plc)
Location: Chihuahua
Indicated & inferred resources: 1.1 moz gold and 40.5 moz silver
A revised resource estimate incorporating a high-resolution digital terrain model and surface channel samples resulted in additional 13.8 moz silver and 27% of total resources in the indicated category. Metallurgical tests will be carried out in 2014.
GuanajuatoOwnership: Minera Saucito, S.A. de C.V. (100% Fresnillo plc)
Location: Guanajuato
Indicated & inferred resources: 184 koz gold and 12.3 moz silver
32,210 metres of core drilling reported interesting gold and silver values on the Gigante, Karina, San José, and Nevada veins. Good grades have also been found in the La Joya and Chorro target areas.
Other prospects in Mexico
Our Exploration Programme 3 Explore: Extend the Growth Pipeline
1234
75www.fresnilloplc.com Fresnillo plc | Annual report 2013
Fresnillo Today
Strategic Report
Corporate Governance
Financial Statements
Strategy
Performance
Ownership: 100% Fresnillo plc
Rodeo (Durango) 10,168 metres of initial core drilling intersected gold values in oxide material that will be followed up in 2014.
Tajitos (Sonora)3,017 metres of core and 23,600 metres of reverse circulation drilling defining a small, open-pittable oxide resource (200 koz gold). Potential is still open in adjacent alluvium covered areas.
El Dátil (Sonora)Initial drilling of 3,399 metres core and 6,134 metres reverse circulation returned significant gold and silver grades in a vein system, follow-up is warranted to advance this prospect to the resource estimation stage.
Coneto (Durango), an association with Orex Minerals 4,395 metres of drilling were completed, returning ore-grade widespread intercepts in the Santo Niño, La Bufa, Loma Verde and Descubridora veins. The 2014 programme is designed to evaluate the extent of the mineralised sections of these veins.
Cebadillas – La Yesca (Nayarit)Small resource areas were delineated at these vein systems following 7,948 metres of core drilling; additional exploration work is under evaluation.
El Cairo (Durango) 4,765 metres of core drilling were completed in the periphery of Argonaut Gold’s El Castillo open pit gold mine. Open-pittable oxide mineralisation has been identified, which potentially could exceed 300 koz of gold.
Guazpares (Chihuahua)Drilling started at this gold-silver district by year end, and will continue through 2014. This project adjoins Paramount Gold’s San Miguel project.
PilaricaOwnership: 100% Fresnillo plc
Location: Ayacucho, Perú
Indicated & inferred resources: 38.5 moz silver
Environmental permit was granted by year end, which will allow us to complete infill and step-out drilling.
La Pampa (Lambayeque)Mapping and sampling has defined drill targets. Social and environmental permits in process.
Cautivas2,576 metres of drilling, negative results. In closure.
Exploraciones Minera Parreña
Peru 1234
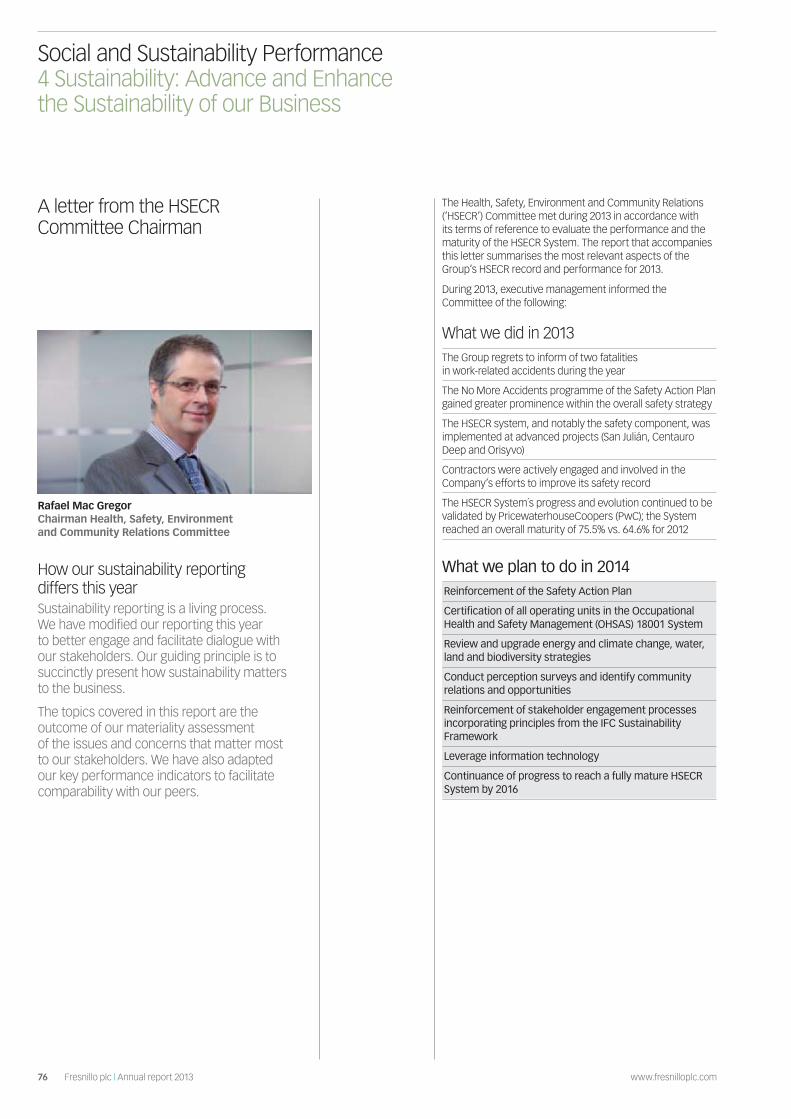
76 Fresnillo plc | Annual report 2013 www.fresnilloplc.com
A letter from the HSECR Committee Chairman
Rafael Mac Gregor Chairman Health, Safety, Environment and Community Relations Committee
The Health, Safety, Environment and Community Relations (‘HSECR’) Committee met during 2013 in accordance with its terms of reference to evaluate the performance and the maturity of the HSECR System. The report that accompanies this letter summarises the most relevant aspects of the Group’s HSECR record and performance for 2013.
During 2013, executive management informed the Committee of the following:
What we did in 2013The Group regrets to inform of two fatalities in work-related accidents during the year
The No More Accidents programme of the Safety Action Plan gained greater prominence within the overall safety strategy
The HSECR system, and notably the safety component, was implemented at advanced projects (San Julián, Centauro Deep and Orisyvo)
Contractors were actively engaged and involved in the Company’s efforts to improve its safety record
The HSECR System´s progress and evolution continued to be validated by PricewaterhouseCoopers (PwC); the System reached an overall maturity of 75.5% vs. 64.6% for 2012
What we plan to do in 2014Reinforcement of the Safety Action Plan
Certification of all operating units in the Occupational Health and Safety Management (OHSAS) 18001 System
Review and upgrade energy and climate change, water, land and biodiversity strategies
Conduct perception surveys and identify community relations and opportunities
Reinforcement of stakeholder engagement processes incorporating principles from the IFC Sustainability Framework
Leverage information technology
Continuance of progress to reach a fully mature HSECR System by 2016
How our sustainability reporting differs this year Sustainability reporting is a living process. We have modified our reporting this year to better engage and facilitate dialogue with our stakeholders. Our guiding principle is to succinctly present how sustainability matters to the business.
The topics covered in this report are the outcome of our materiality assessment of the issues and concerns that matter most to our stakeholders. We have also adapted our key performance indicators to facilitate comparability with our peers.
Social and Sustainability Performance 4 Sustainability: Advance and Enhance the Sustainability of our Business
77www.fresnilloplc.com Fresnillo plc | Annual report 2013
Fresnillo Today
Strategic Report
Corporate Governance
Financial Statements
Strategy
Performance
HealthFresnillo plc is fully committed to the overall health and wellbeing of employees and contractors. A preventive approach to health has been emphasised.
– Combination of the Health and Safety working groups in 2012 has been supported in 2013 by the integration of processes to comply with OHSAS 18001
– A rigorous approach to manage occupational health allowed prevention of new cases of occupational diseases
– Improvement of occupational health performance at the Penmont and Fresnillo mines resulted in reduced risk premiums payable to the Mexican Social Security Institute
– Emergency preparedness has been benchmarked at national competitions with good results
– Continuation of the campaign ‘Promoting life’ which seeks to promote healthy lifestyles
– The AlertOn programme continued with the purpose of identifying workers who are unfit to enter the work site thereby preventing potential risk situations
– Continued incorporation by significant contractors of medical services for their personnel
SafetyAlthough mining is considered a high-risk activity, any injuries incurred by Fresnillo s employees or contractors are unacceptable. Safety remains the Group’s number one priority.
– After reviewing a root-cause analysis regarding each fatality, the Committee requested the Group to reinforce safety procedures
– Total Recordable Injury Rate and the Lost Time Injury Frequency Rate registered improvements year to year (31% and 64%, respectively)
– Safety leadership and commitment were prioritised
– The Group maintained its commitment to work alongside local contractors in their efforts to obtain the ‘Self-Management’ certification from the Mexican Labour Ministry
– Safety indicators were re-aligned to facilitate comparison against international mining sector
EnvironmentThe Group monitors and measures environmental progress with certifications such as ISO 14001, International Cyanide Management Code and the Clean Industry award by the Mexican Environment Protection Agency. Recognising risks associated with climate change and water availability, management also closely monitors the performance by the Group.
– Public reporting to (i) the Climate Change and Water Programmes of the Carbon Disclosure Project (CDP) as well as (ii) the Mexican Greenhouse Gases disclosure project ‘GEI Mexico’
– Benchmarking the Group’s environmental performance (in water and GHG emissions) against other mining companies in order to identify opportunities
– Introduction of a more comprehensive set of environmental performance indicators
Community RelationsThe Group strives to adopt international best practices for community relations at all locations where it operates.
– Overall community relations strategy was reviewed
– Guidelines were revisited to offer a common framework for the operation and exploration business units
– Reinforcement of corporate programmes such as A Leer (‘To Read’), promoting reading in the communities and inquiry and hands-on science to develop science education where we operate, as well as ‘Pro-Empleo’ (‘Business Skills Courses for Local Contractors’) and Sustainability Agenda
– Accounting guidelines were introduced in order to better trace social investment
The Committee will continue to emphasise to the Group the importance of achieving excellence on HSECR matters, with safety at the forefront of the Group’s priorities and with a view of achieving full maturity of the HSECR System by 2016.
In the accompanying report, shareholders will be able to obtain a fuller view of the overall HSECR efforts that the Company conducted for 2013.
Very truly yours,
Rafael Mac Gregor Chairman, Health, Safety, Environment and Community Relations Committee
Read more: Health Page 79
Read more: Safety Page 81
Read more: Environment Page 84
Read more: Community Relations Page 88
78 Fresnillo plc | Annual report 2013 www.fresnilloplc.com
OverviewMining and processing precious metals are essential activities in our global economy, and carry social acceptability and environmental challenges that must be effectively addressed. Finding solutions to these challenges requires exceptional commitment, operational excellence and innovation.
GovernanceThe Group’s Health, Safety, Environment and Community Relations (HSECR) Committee provides assurance to the Board on the effectiveness of action plans, policies and management systems. The responsibilities of the Committee, whose members comprise a subset of the Board of Directors, include monitoring the Group’s social and sustainability performance and the quality of its external reporting. The Committee analyses the outcomes of independent audits on the maturity of the HSECR system to provide recommendations to management and the Board. Recognising the importance of aligning incentives with sustainability performance, the Remuneration Committee takes into consideration sustainability criteria among the strategic objectives that determine the annual bonus of the CEO and other members of the Executive Committee.
Maturity of the HSECR system Supporting our sustainability performance with sound management systems remains a priority. To monitor the maturity of the system, an independent audit is conducted annually by PWC. The audit assesses the progress made in the strategy, structure, processes, people and technology. The system reached a maturity level of 75.5 % (2012: 64.6%) against our 2011-2016 action plan objectives. We are firmly committed to achieving a fully integrated HSECR system by 2016.
Culture and ethicsOur Code of Conduct is a set of rules and principles that guide our behaviours and actions. The cornerstone of this Code is our values: Trust, Responsibility, Integrity and Loyalty. The Code was enhanced in 2013 to provide further guidance on complying with the UK Bribery Act 2010. Training our people to make better decisions has been a crucial element of our anti-bribery and anti-corruption strategy. Our online training programme and evaluation covered 96% of our target audience throughout the year and has been recognised internally as a success for its innovative approach. In 2014, the coverage of our online training will be extended to money laundering and fraud.
As part of our efforts to implement best practices in business ethics, we launched a project with the guidance of PWC London aimed at further embedding ethics and integrity in our culture. Valuable outcomes of this project include the definition of our aspirational statement, the identification of winning behaviours and the design of a decision-making framework. The project will continue in 2014, with a training programme covering the entire organisation and the review of HR policies and practices to better support ethics and integrity.
AwardsIn 2013, Fresnillo plc was recognised by the Mexican Confederation of Industrial Chambers (CONCAMIN) with their prestigious ‘Ethics and Values in Industry’ award. We were also recognised with the ‘Socially Responsible Company’ award granted by the Mexican Centre for Philanthropy (CEMEFI). The Group has been recognised with other awards and certifications in 2013, as detailed herein under their relevant categories.
Other reportsWe participate in the climate change and water programmes of the Carbon Disclosure Project (CDP) and the Mexican GHG disclosure programme ‘GEI México’.
Social and Sustainability Performance 4 Sustainability: Advance and Enhance the Sustainability of our Business
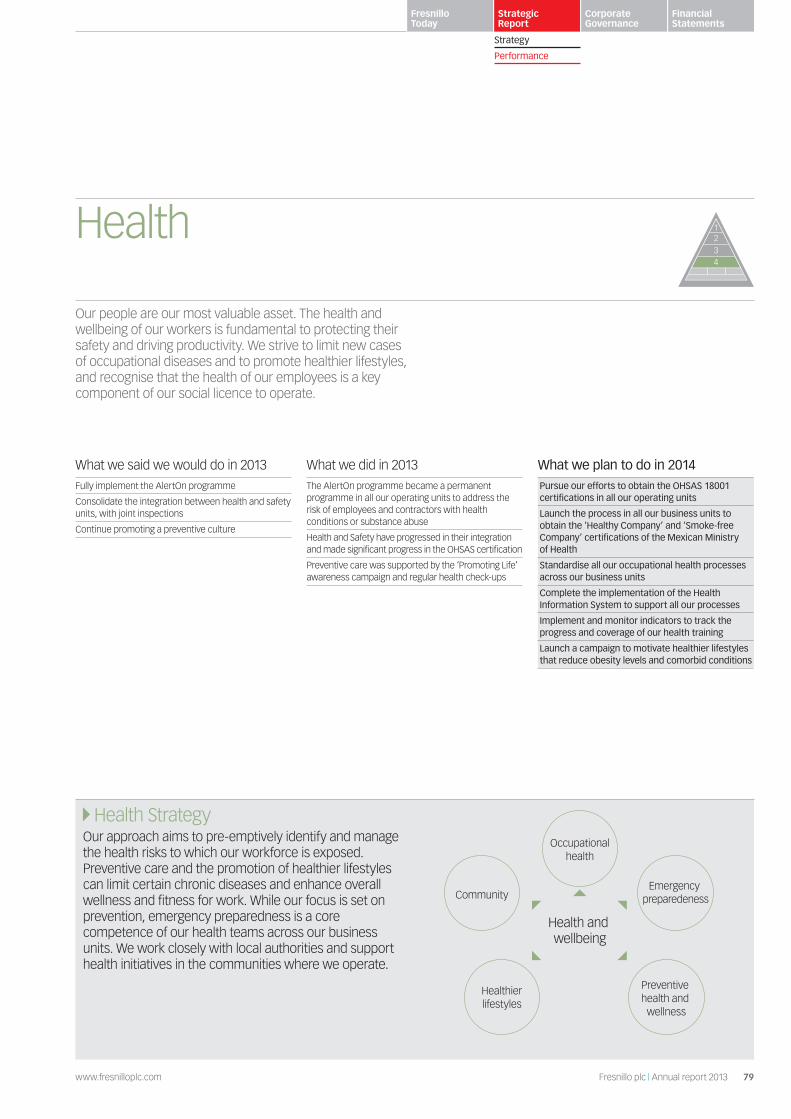
79www.fresnilloplc.com Fresnillo plc | Annual report 2013
Fresnillo Today
Strategic Report
Corporate Governance
Financial Statements
Strategy
Performance
Health StrategyOur approach aims to pre-emptively identify and manage the health risks to which our workforce is exposed. Preventive care and the promotion of healthier lifestyles can limit certain chronic diseases and enhance overall wellness and fitness for work. While our focus is set on prevention, emergency preparedness is a core competence of our health teams across our business units. We work closely with local authorities and support health initiatives in the communities where we operate.
Our people are our most valuable asset. The health and wellbeing of our workers is fundamental to protecting their safety and driving productivity. We strive to limit new cases of occupational diseases and to promote healthier lifestyles, and recognise that the health of our employees is a key component of our social licence to operate.
Health 1234
What we said we would do in 2013Fully implement the AlertOn programme
Consolidate the integration between health and safety units, with joint inspections
Continue promoting a preventive culture
What we did in 2013The AlertOn programme became a permanent programme in all our operating units to address the risk of employees and contractors with health conditions or substance abuse
Health and Safety have progressed in their integration and made significant progress in the OHSAS certification
Preventive care was supported by the ‘Promoting Life’ awareness campaign and regular health check-ups
What we plan to do in 2014Pursue our efforts to obtain the OHSAS 18001 certifications in all our operating units
Launch the process in all our business units to obtain the ‘Healthy Company’ and ‘Smoke-free Company’ certifications of the Mexican Ministry of Health
Standardise all our occupational health processes across our business units
Complete the implementation of the Health Information System to support all our processes
Implement and monitor indicators to track the progress and coverage of our health training
Launch a campaign to motivate healthier lifestyles that reduce obesity levels and comorbid conditions
Health and wellbeing
Occupationalhealth
Emergency preparedeness
Preventive health and
wellness
Community
Healthierlifestyles
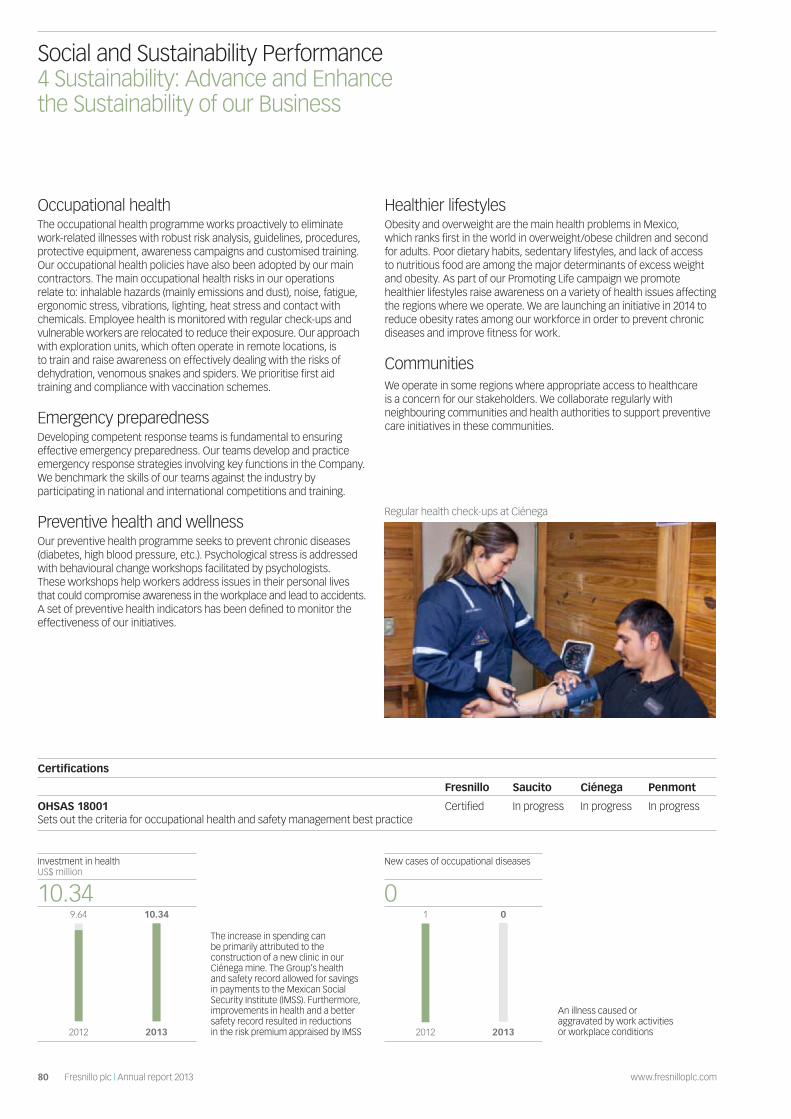
80 Fresnillo plc | Annual report 2013 www.fresnilloplc.com
Occupational healthThe occupational health programme works proactively to eliminate work-related illnesses with robust risk analysis, guidelines, procedures, protective equipment, awareness campaigns and customised training. Our occupational health policies have also been adopted by our main contractors. The main occupational health risks in our operations relate to: inhalable hazards (mainly emissions and dust), noise, fatigue, ergonomic stress, vibrations, lighting, heat stress and contact with chemicals. Employee health is monitored with regular check-ups and vulnerable workers are relocated to reduce their exposure. Our approach with exploration units, which often operate in remote locations, is to train and raise awareness on effectively dealing with the risks of dehydration, venomous snakes and spiders. We prioritise first aid training and compliance with vaccination schemes.
Emergency preparednessDeveloping competent response teams is fundamental to ensuring effective emergency preparedness. Our teams develop and practice emergency response strategies involving key functions in the Company. We benchmark the skills of our teams against the industry by participating in national and international competitions and training.
Preventive health and wellnessOur preventive health programme seeks to prevent chronic diseases (diabetes, high blood pressure, etc.). Psychological stress is addressed with behavioural change workshops facilitated by psychologists. These workshops help workers address issues in their personal lives that could compromise awareness in the workplace and lead to accidents. A set of preventive health indicators has been defined to monitor the effectiveness of our initiatives.
Healthier lifestylesObesity and overweight are the main health problems in Mexico, which ranks first in the world in overweight/obese children and second for adults. Poor dietary habits, sedentary lifestyles, and lack of access to nutritious food are among the major determinants of excess weight and obesity. As part of our Promoting Life campaign we promote healthier lifestyles raise awareness on a variety of health issues affecting the regions where we operate. We are launching an initiative in 2014 to reduce obesity rates among our workforce in order to prevent chronic diseases and improve fitness for work.
CommunitiesWe operate in some regions where appropriate access to healthcare is a concern for our stakeholders. We collaborate regularly with neighbouring communities and health authorities to support preventive care initiatives in these communities.
Certifications
Fresnillo Saucito Ciénega Penmont
OHSAS 18001 Sets out the criteria for occupational health and safety management best practice
Certified In progress In progress In progress
The increase in spending can be primarily attributed to the construction of a new clinic in our Ciénega mine. The Group’s health and safety record allowed for savings in payments to the Mexican Social Security Institute (IMSS). Furthermore, improvements in health and a better safety record resulted in reductions in the risk premium appraised by IMSS
An illness caused or aggravated by work activities or workplace conditions
Regular health check-ups at Ciénega
20132012
Investment in health US$ million
9.64
10.3410.34
20132012
New cases of occupational diseases
1
00
Social and Sustainability Performance 4 Sustainability: Advance and Enhance the Sustainability of our Business
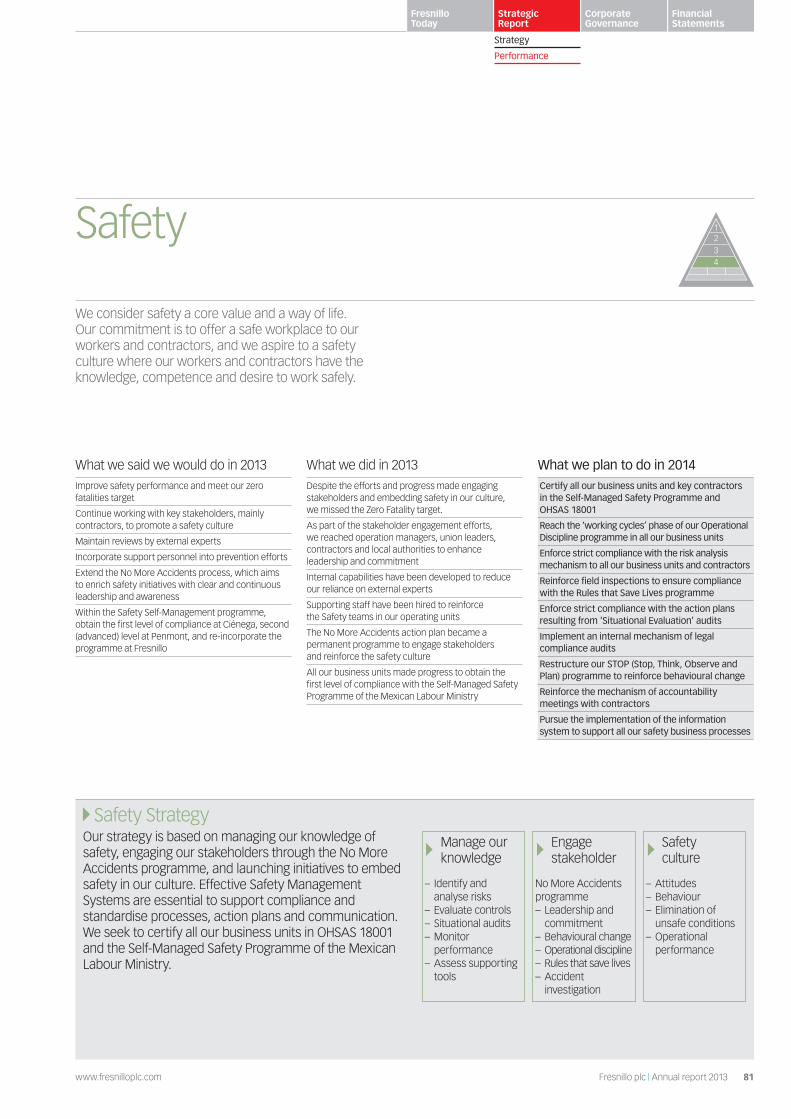
81www.fresnilloplc.com Fresnillo plc | Annual report 2013
Fresnillo Today
Strategic Report
Corporate Governance
Financial Statements
Strategy
Performance
We consider safety a core value and a way of life. Our commitment is to offer a safe workplace to our workers and contractors, and we aspire to a safety culture where our workers and contractors have the knowledge, competence and desire to work safely.
Safety
What we said we would do in 2013Improve safety performance and meet our zero fatalities target
Continue working with key stakeholders, mainly contractors, to promote a safety culture
Maintain reviews by external experts
Incorporate support personnel into prevention efforts
Extend the No More Accidents process, which aims to enrich safety initiatives with clear and continuous leadership and awareness
Within the Safety Self-Management programme, obtain the first level of compliance at Ciénega, second (advanced) level at Penmont, and re-incorporate the programme at Fresnillo
What we did in 2013Despite the efforts and progress made engaging stakeholders and embedding safety in our culture, we missed the Zero Fatality target.
As part of the stakeholder engagement efforts, we reached operation managers, union leaders, contractors and local authorities to enhance leadership and commitment
Internal capabilities have been developed to reduce our reliance on external experts
Supporting staff have been hired to reinforce the Safety teams in our operating units
The No More Accidents action plan became a permanent programme to engage stakeholders and reinforce the safety culture
All our business units made progress to obtain the first level of compliance with the Self-Managed Safety Programme of the Mexican Labour Ministry
What we plan to do in 2014Certify all our business units and key contractors in the Self-Managed Safety Programme and OHSAS 18001
Reach the ‘working cycles’ phase of our Operational Discipline programme in all our business units
Enforce strict compliance with the risk analysis mechanism to all our business units and contractors
Reinforce field inspections to ensure compliance with the Rules that Save Lives programme
Enforce strict compliance with the action plans resulting from ‘Situational Evaluation’ audits
Implement an internal mechanism of legal compliance audits
Restructure our STOP (Stop, Think, Observe and Plan) programme to reinforce behavioural change
Reinforce the mechanism of accountability meetings with contractors
Pursue the implementation of the information system to support all our safety business processes
1234
Safety StrategyOur strategy is based on managing our knowledge of safety, engaging our stakeholders through the No More Accidents programme, and launching initiatives to embed safety in our culture. Effective Safety Management Systems are essential to support compliance and standardise processes, action plans and communication. We seek to certify all our business units in OHSAS 18001 and the Self-Managed Safety Programme of the Mexican Labour Ministry.
Manage our knowledge
Engage stakeholder
Safety culture
– Identify and analyse risks– Evaluate controls– Situational audits– Monitor performance– Assess supporting tools
No More Accidents programme– Leadership and commitment– Behavioural change– Operational discipline– Rules that save lives– Accident investigation
– Attitudes– Behaviour– Elimination of unsafe conditions– Operational performance

82 Fresnillo plc | Annual report 2013 www.fresnilloplc.com
Manage our knowledgeOur approach aims at pre-emptively identifying and managing the safety risks to which our workforce is exposed. Our training programme takes into consideration the risk exposure of our workers and contractors in order to develop their knowledge and competence to work safely. In order to identify and correct systemic nonconformities, the corporate safety team implements ‘situational assessments’ in all our business units that lead to specific action plans with clear deadlines and accountabilities. Additionally, our controls and supporting tools are regularly assessed to ensure they remain effective. Performance is closely monitored by the management team and the HSECR Committee, and an information system was implemented to support our business processes.
Engage our stakeholders: No More Accidents programmeThe No More Accidents initiative became a permanent programme to engage our stakeholders in order to reinforce a safety culture. Components include:
Leadership and CommitmentWe actively engage our operations managers, union leaders and their local chapters, contractors and government authorities with specific action plans to raise awareness of the role of leaders and their contribution to safety as role models. The Leaders for Safety programme organised jointly with the unions, aims at positioning safety as core value and a way of life. Leadership accountability of our operations managers is monitored through situational assessments that evaluate their level of engagement and responsibility and lead to specific action plans.
Behavioural ChangeThe behavioural change process aims at persuading our people to work safely. The Behavioural Change workshop, facilitated by psychologists, provides guidance and counsel on how to handle personal issues that reduce mental awareness in the workplace and may lead to accidents. Our behavioural change objective is also supported by the STOP (Stop, Think, Observe and Plan) programme, paying special attention to supervisors in an effort to engage them and develop better attitudes and behaviours.
Operational DisciplineOperational Discipline in safety aims at doing the right thing all the time. Operational Discipline relies on the availability of procedures, their quality, the training on the procedures, the evaluation of work cycles and continuous improvement. Our business units are reaching the fourth element of Operational Discipline, ‘evaluation of work cycles’.
Rules that Save LivesThe Rules that Save Lives are rules deemed safety-critical and for which there is zero tolerance for deviations. These set of behaviours are well known by workers, some of which are now strongly embedded in our safety culture. There is a process in place to review these rules and propose the inclusion of more rules.
Comprehensive accident investigationThe Root Cause Analysis has been applied in a consistent and disciplined manner, and has delivered valuable outcomes and relevant information to prevent similar accidents. We have started the implementation of an information system to formalise and support a robust business process for root cause analysis in accident investigations.
Safety cultureSafety culture is routinely monitored to assess the attitudes, behaviours and disciplined elimination of unsafe conditions.
Safety continued 1234
Anchoring at the Fresnillo mine helps improve safety conditions
Social and Sustainability Performance 4 Sustainability: Advance and Enhance the Sustainability of our Business

83www.fresnilloplc.com Fresnillo plc | Annual report 2013
Fresnillo Today
Strategic Report
Corporate Governance
Financial Statements
Strategy
Performance
20132012
Investment in safety US$ million
4.57
5.955.95
20132012
Total Recordable Injury Frequency (TRIF) The number of fatalities + lost-timecases + restricted work cases +medical treatment cases per 200,000hours worked
4.66
3.223.22
20132012
Lost Time Injury Frequency Rate (LTIFR) The number of lost-time injuries +fatalities per 200,000 hours worked
1.19
0.430.43
2013201220112010
Accident RateThe number of accidents divided by the total number of employees and contractors
1.73 1.422.21
0.690.69
2013201220112010
Lost Workday RateThe number of days lost to accidentsdivided by the total number ofemployees and contractors
3.11 1.481.64
0.580.58
2013201220112010
Fatal injuries To employees or contractors
2 11 6
22
20132012
Fatal Injury Frequency Rate (FIFR) per 200,000 hours worked
0.07
0.020.02
Soledad-DiplosHerraduraNoche BuenaCienagaSaucitoFresnillo
Total Recordable Injury Frequency (TRIF)
5.382 6.022 3.875 7.454 5.980 1.744 1.276 1.842 1.010 1.599 1.3194.638
2012 2013
Soledad-DiplosHerraduraNoche BuenaCienagaSaucitoFresnillo
Lost Time Injury Frequency Rate (LTIFR)
0.53 2.83 0.67 1.10 0.44 0.64 0.21 0.29 0.16 0.20 1.130.85
2012 2013

84 Fresnillo plc | Annual report 2013 www.fresnilloplc.com
Environment StrategyOur Environmental Management System ensures effective compliance with regulations and supports initiatives that reduce our environmental footprint. Operational excellence, innovation and continuous improvement are recognised by our Value Creation programme. This programme rewards teams for improving processes, many of which actually achieved valuable environmental footprint reductions.
What we said we would do in 2013Maintain zero environmental incidents
Continue promoting environmental practices within our value chain
Obtain Clean Industry certification at Saucito and Cyanide Code at Ciénega
What we did in 2013We met the zero environmental incidents target
Some of key contractors obtained the Environmental Quality certification and implemented ISO14001 as part of our efforts to promote environmental practices in our value chain
Saucito made considerable progress in its application for the Clean Industry certification. Ciénega also advanced in their application process for the International Cyanide Management Code
What we plan to do in 2014Obtain Clean Industry certification at Saucito and Cyanide Code at Ciénega
Review and upgrade our energy and climate change, water, land and biodiversity strategies
Support our business processes, documents and indicators with information systems
Mining and processing precious metals, while essential to the global economy, consume water, disturb land and produce waste and greenhouse gases in the ordinary course of business. Minimising the impact of our activities, and being accountable and transparent regarding our environmental footprint are crucial to gaining and maintaining our social license to operate.
Environment 1234
Social and Sustainability Performance 4 Sustainability: Advance and Enhance the Sustainability of our Business
Environmental stewardship
Management systems and certification
Waste
Climate change and energy
Water
Communities
Land and biodiversity
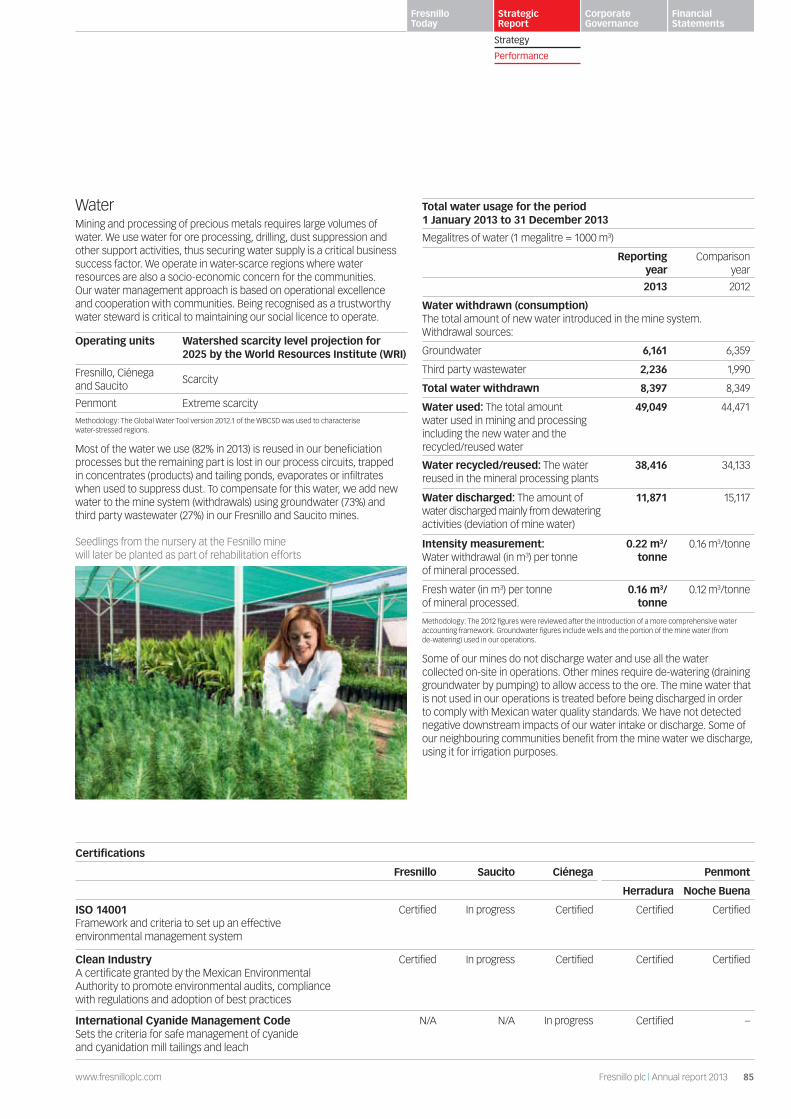
85www.fresnilloplc.com Fresnillo plc | Annual report 2013
Fresnillo Today
Strategic Report
Corporate Governance
Financial Statements
Strategy
Performance
WaterMining and processing of precious metals requires large volumes of water. We use water for ore processing, drilling, dust suppression and other support activities, thus securing water supply is a critical business success factor. We operate in water-scarce regions where water resources are also a socio-economic concern for the communities. Our water management approach is based on operational excellence and cooperation with communities. Being recognised as a trustworthy water steward is critical to maintaining our social licence to operate.
Operating units Watershed scarcity level projection for 2025 by the World Resources Institute (WRI)
Fresnillo, Ciénega and Saucito
Scarcity
Penmont Extreme scarcity
Methodology: The Global Water Tool version 2012.1 of the WBCSD was used to characterise water-stressed regions.
Most of the water we use (82% in 2013) is reused in our beneficiation processes but the remaining part is lost in our process circuits, trapped in concentrates (products) and tailing ponds, evaporates or infiltrates when used to suppress dust. To compensate for this water, we add new water to the mine system (withdrawals) using groundwater (73%) and third party wastewater (27%) in our Fresnillo and Saucito mines.
Total water usage for the period 1 January 2013 to 31 December 2013
Megalitres of water (1 megalitre = 1000 m3)
Reporting year
Comparison year
2013 2012
Water withdrawn (consumption) The total amount of new water introduced in the mine system. Withdrawal sources:
Groundwater 6,161 6,359
Third party wastewater 2,236 1,990
Total water withdrawn 8,397 8,349
Water used: The total amount water used in mining and processing including the new water and the recycled/reused water
49,049 44,471
Water recycled/reused: The water reused in the mineral processing plants
38,416 34,133
Water discharged: The amount of water discharged mainly from dewatering activities (deviation of mine water)
11,871 15,117
Intensity measurement: Water withdrawal (in m3) per tonne of mineral processed.
0.22 m3/tonne
0.16 m3/tonne
Fresh water (in m3) per tonne of mineral processed.
0.16 m3/tonne
0.12 m3/tonne
Methodology: The 2012 figures were reviewed after the introduction of a more comprehensive water accounting framework. Groundwater figures include wells and the portion of the mine water (from de-watering) used in our operations.
Some of our mines do not discharge water and use all the water collected on-site in operations. Other mines require de-watering (draining groundwater by pumping) to allow access to the ore. The mine water that is not used in our operations is treated before being discharged in order to comply with Mexican water quality standards. We have not detected negative downstream impacts of our water intake or discharge. Some of our neighbouring communities benefit from the mine water we discharge, using it for irrigation purposes.
Certifications
Fresnillo Saucito Ciénega Penmont
Herradura Noche Buena
ISO 14001 Framework and criteria to set up an effective environmental management system
Certified In progress Certified Certified Certified
Clean Industry A certificate granted by the Mexican Environmental Authority to promote environmental audits, compliance with regulations and adoption of best practices
Certified In progress Certified Certified Certified
International Cyanide Management Code Sets the criteria for safe management of cyanide and cyanidation mill tailings and leach
N/A N/A In progress Certified –
Seedlings from the nursery at the Fesnillo mine will later be planted as part of rehabilitation efforts
86 Fresnillo plc | Annual report 2013 www.fresnilloplc.com
Despite the increase in water demand, withdrawal of groundwater (freshwater) decreased 3%, while third party wastewater and reuse in our processing plants both increased by 12%. The reduced tonnage of material processed at Penmont explains the increase in our water intensity measures.
Climate change and energyClimate change is both an environmental and a business challenge. Expected changes in physical parameters (higher temperatures and lower annual rainfall) may result in adverse impacts to our operations and the communities where we operate such. There are also business implications of actual and potential economic regulations in a carbon constrained economy. In 2012, Mexico enacted its General Law on Climate Change formalising its commitment to reduce GHG emissions by 30% by 2020 and 50% by 2050, and also recently introduced a carbon price embedded in energy prices of fossil fuels. Our climate change and energy management approach is based on operational excellence, transparency and cooperation with authorities.
Our footprint is driven by the combustion of fossil fuels in mining operations (52%) mainly in inbound logistics, and the use of electricity (48%) notably at our mineral processing plants. In the current reporting year, the emissions under our operational control (Scope 1) decreased 2% while the emissions from our contractors for inbound logistics (Scope 3) were 8% higher. The demand for electricity increased 3%, raising Scope 2 (indirect) emissions by 4%.
WasteOur operations generate mineral and non-mineral waste, with mineral residue our most material waste-related risk. Mineral waste is produced in large volumes and stored in three types of mineral storage facilities: tailings, waste rock and heap leach. Our approach aims to reduce mineral waste through operational efficiency and effective handling and storage in order to prevent legacy issues. Operational efficiency is crucial to maximise the recovery of metals, reducing production costs and mineral waste. To ensure effective handling and storage, our facilities are regularly monitored and audited. Re-mining of waste facilities in our Fresnillo unit would increase production while reusing mineral waste. We believe that progressive rehabilitation is the best path for responsible mining. Rehabilitation of stockpiles and tailing ponds at our Ciénega and Fresnillo business units are success stories that help us to address the concerns of our stakeholders with respect to mineral waste management.
Unit 2013 2012
Tailings Tonne 4,972,893 4,594,923
Waste rock Tonne 185,008,043 159,518,677
Heap leach Tonne 33,531,602 48,406,214
Non-mineral hazardous waste management is subject to strict regulation from the Mexican authorities at storage facilities in our operations and at hazardous waste receiving facilities. Non-mineral hazardous wastes are materials used to support our mining and processing operations such as tyres, used lube oil, materials impregnated with grease and oil, cans, etc. Our continuous improvement efforts include procedures to handle and store non-mineral wastes effectively.
Unit 2013 2012
Non-mineral hazardous solid waste
Tonne 4,350 3,739
Non-mineral hazardous liquid waste (lube oil)
Litres 1,360,410 1,449,682
Land and biodiversityAccess to land is a crucial success factor for our business. We recognise expectations evolve over time with respect to land stewardship and biodiversity, trending toward greater scrutiny by communities, NGOs and regulators. We aim to responsibly manage the land and its biodiversity throughout the lifecycle of our operations, as stewardship is a key component of our social licence to operate.
Unit 2013 2012
Rehabilitated land Ha 156 145
Conservation land Ha 977 931
Our Ciénega mining operation, located in the pine-oaked forest of the Sierra Madre Occidental, has set aside an area of conservation of 977 hectares that encompasses land reclaimed from our operations as well as areas rehabilitated from the effects of deforestation resulting from activities of the community. Working in partnership with the National Institute for Forestry, Agriculture and Livestock Research (INIFAP) has strengthened Cienéga’s reforestation and rehabilitation programmes. Our Penmont operation, located in the desert region of north-western Mexico, has been partnering with the Ecology and Sustainable Development Commission of the State of Sonora (CEDES) in conservation efforts to protect the endangered Sonoran Pronghorn. Fresnillo plc is a member of WildCorp’s ‘A business commitment’, an action-oriented forum to further advance the protection of wild nature and its values for human society, led by Naturalia, the Mexican partner of the Wild Foundation.
CommunitiesWe engage neighbouring communities at our operating units and exploration projects to develop an environmentally conscious culture. Our sustainability calendar of events includes World Water Day, World Environment Day and Arbour Day. We target elementary schools, our employees and contractors with talks, contests, performances of mime artists and reforestation campaigns.
Environment continued 1234
Social and Sustainability Performance 4 Sustainability: Advance and Enhance the Sustainability of our Business
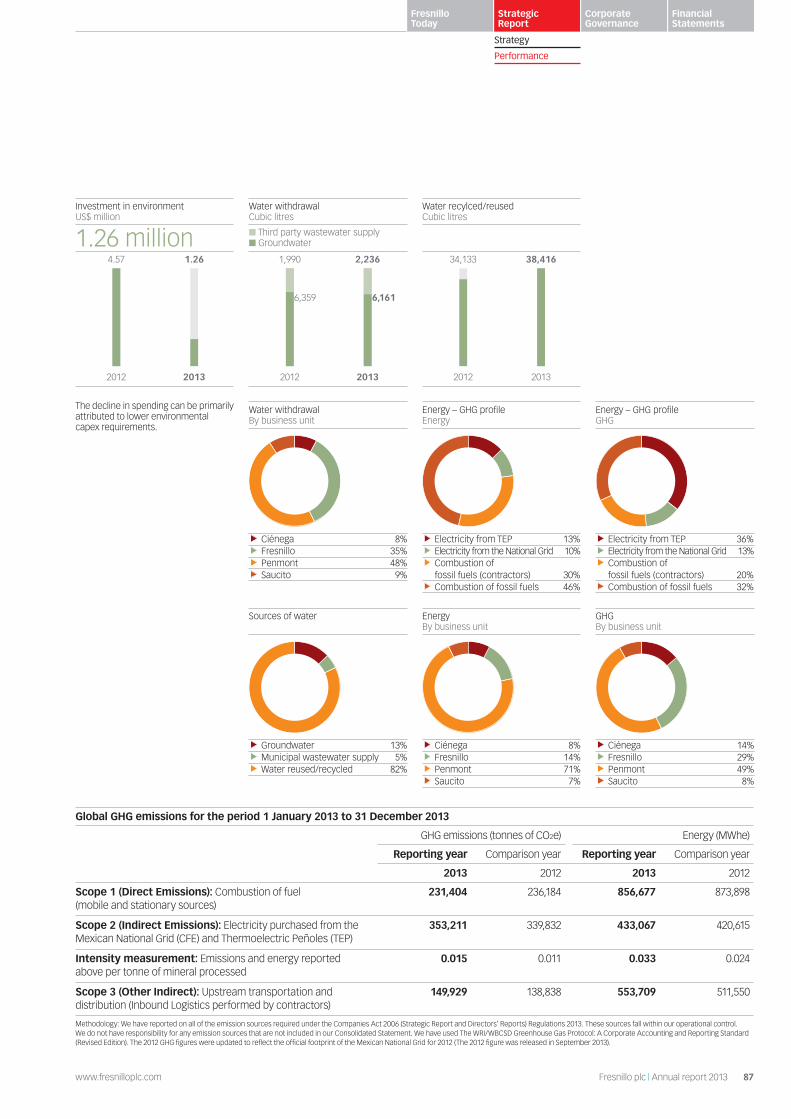
87www.fresnilloplc.com Fresnillo plc | Annual report 2013
Fresnillo Today
Strategic Report
Corporate Governance
Financial Statements
Strategy
Performance
20132012
Investment in environment US$ million
4.57
1.26 million1.26
20132012
Water withdrawal Cubic litres
1,990 2,236
6,359 6,161
Third party wastewater supply Groundwater
20132012
Water recylced/reused Cubic litres
34,133 38,416
Global GHG emissions for the period 1 January 2013 to 31 December 2013
GHG emissions (tonnes of CO2e) Energy (MWhe)
Reporting year Comparison year Reporting year Comparison year
2013 2012 2013 2012
Scope 1 (Direct Emissions): Combustion of fuel (mobile and stationary sources)
231,404 236,184 856,677 873,898
Scope 2 (Indirect Emissions): Electricity purchased from the Mexican National Grid (CFE) and Thermoelectric Peñoles (TEP)
353,211 339,832 433,067 420,615
Intensity measurement: Emissions and energy reported above per tonne of mineral processed
0.015 0.011 0.033 0.024
Scope 3 (Other Indirect): Upstream transportation and distribution (Inbound Logistics performed by contractors)
149,929 138,838 553,709 511,550
Methodology: We have reported on all of the emission sources required under the Companies Act 2006 (Strategic Report and Directors’ Reports) Regulations 2013. These sources fall within our operational control. We do not have responsibility for any emission sources that are not included in our Consolidated Statement. We have used The WRI/WBCSD Greenhouse Gas Protocol: A Corporate Accounting and Reporting Standard (Revised Edition). The 2012 GHG figures were updated to reflect the official footprint of the Mexican National Grid for 2012 (The 2012 figure was released in September 2013).
The decline in spending can be primarily attributed to lower environmental capex requirements.
Water withdrawalBy business unit
Ciénega 8%Fresnillo 35%Penmont 48%Saucito 9%
Energy – GHG profileEnergy
Electricity from TEP 13%Electricity from the National Grid 10%Combustion offossil fuels (contractors) 30%Combustion of fossil fuels 46%
Energy – GHG profileGHG
Electricity from TEP 36%Electricity from the National Grid 13%Combustion offossil fuels (contractors) 20%Combustion of fossil fuels 32%
Sources of water
Groundwater 13%Municipal wastewater supply 5%Water reused/recycled 82%
EnergyBy business unit
Ciénega 8%Fresnillo 14%Penmont 71%Saucito 7%
GHGBy business unit
Ciénega 14%Fresnillo 29%Penmont 49%Saucito 8%

88 Fresnillo plc | Annual report 2013 www.fresnilloplc.com
Community Relations StrategyBuilding good community relations relies on a solid understanding of the community and a respect for its customs and traditions. We aim to understand the socioeconomic challenges of our communities as well as their competencies, the potential or realised impacts of our operations, and their perception of our Group. Advancing our knowledge of the community is fundamental in guiding our engagement efforts and setting favourable conditions to develop with the communities.
What we said we would do in 2013Consolidate institutional projects in surrounding communities
What we did in 2013Institutional projects and community activities have been implemented throughout our business units following our Sustainability Agenda
What we plan to do in 2014Increase our knowledge of the communities with a perception survey and a re-assessment of community capabilities and opportunities
Reinforce our stakeholder engagement processes incorporating best practices in the extractive industry
Review and upgrade our community investment strategy and policies
Reinforce the training and competencies in community relations agents and external affairs
Unify criteria between, explorations, projects and operating units
We strongly believe our communities are strategic partners. Having their trust requires engaging them effectively and being accountable for our impacts. We recognise that building trust is the only way to obtain and preserve our social licence to operate.
Community Relations 1234
20132012
Community Investment US$ million
3.14
2.142.14
Social and Sustainability Performance 4 Sustainability: Advance and Enhance the Sustainability of our Business
Advance our knowledge
Engage effectively
Develop with the community
– Identify and analyse stakeholders– Social baseline surveys– Evaluation of associations with NGOs– Perception surveys– Media monitoring
– Consultation– Grievance mechanism– Meetings– Registry of commitments
– Programme of activities– Community investment
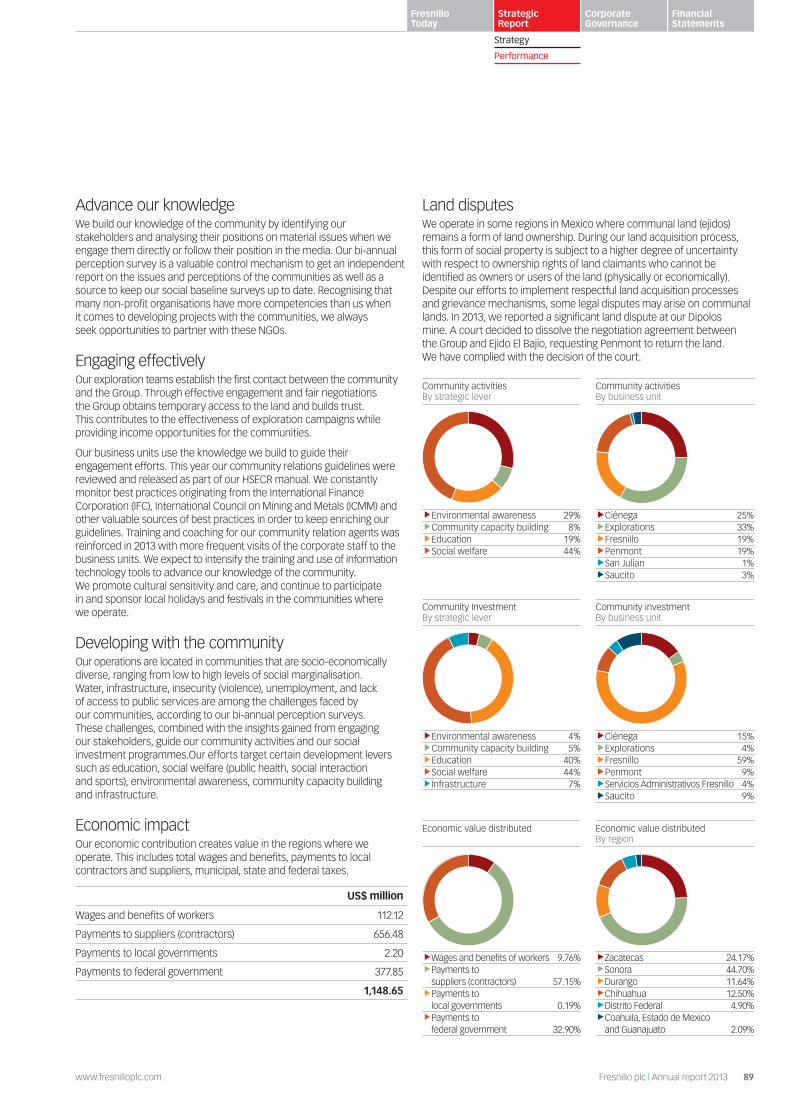
89www.fresnilloplc.com Fresnillo plc | Annual report 2013
Fresnillo Today
Strategic Report
Corporate Governance
Financial Statements
Strategy
Performance
Advance our knowledgeWe build our knowledge of the community by identifying our stakeholders and analysing their positions on material issues when we engage them directly or follow their position in the media. Our bi-annual perception survey is a valuable control mechanism to get an independent report on the issues and perceptions of the communities as well as a source to keep our social baseline surveys up to date. Recognising that many non-profit organisations have more competencies than us when it comes to developing projects with the communities, we always seek opportunities to partner with these NGOs.
Engaging effectivelyOur exploration teams establish the first contact between the community and the Group. Through effective engagement and fair negotiations the Group obtains temporary access to the land and builds trust. This contributes to the effectiveness of exploration campaigns while providing income opportunities for the communities.
Our business units use the knowledge we build to guide their engagement efforts. This year our community relations guidelines were reviewed and released as part of our HSECR manual. We constantly monitor best practices originating from the International Finance Corporation (IFC), International Council on Mining and Metals (ICMM) and other valuable sources of best practices in order to keep enriching our guidelines. Training and coaching for our community relation agents was reinforced in 2013 with more frequent visits of the corporate staff to the business units. We expect to intensify the training and use of information technology tools to advance our knowledge of the community. We promote cultural sensitivity and care, and continue to participate in and sponsor local holidays and festivals in the communities where we operate.
Developing with the communityOur operations are located in communities that are socio-economically diverse, ranging from low to high levels of social marginalisation. Water, infrastructure, insecurity (violence), unemployment, and lack of access to public services are among the challenges faced by our communities, according to our bi-annual perception surveys. These challenges, combined with the insights gained from engaging our stakeholders, guide our community activities and our social investment programmes.Our efforts target certain development levers such as education, social welfare (public health, social interaction and sports), environmental awareness, community capacity building and infrastructure.
Economic impactOur economic contribution creates value in the regions where we operate. This includes total wages and benefits, payments to local contractors and suppliers, municipal, state and federal taxes.
US$ million
Wages and benefits of workers 112.12
Payments to suppliers (contractors) 656.48
Payments to local governments 2.20
Payments to federal government 377.85
1,148.65
Land disputesWe operate in some regions in Mexico where communal land (ejidos) remains a form of land ownership. During our land acquisition process, this form of social property is subject to a higher degree of uncertainty with respect to ownership rights of land claimants who cannot be identified as owners or users of the land (physically or economically). Despite our efforts to implement respectful land acquisition processes and grievance mechanisms, some legal disputes may arise on communal lands. In 2013, we reported a significant land dispute at our Dipolos mine. A court decided to dissolve the negotiation agreement between the Group and Ejido El Bajío, requesting Penmont to return the land. We have complied with the decision of the court.
Community activities By strategic lever
Environmental awareness 29%Community capacity building 8%Education 19%Social welfare 44%
Community Investment By strategic lever
Environmental awareness 4%Community capacity building 5%Education 40%Social welfare 44%Infrastructure 7%
Economic value distributed
Wages and benefits of workers 9.76%Payments to suppliers (contractors) 57.15%Payments to local governments 0.19%Payments to federal government 32.90%
Community activities By business unit
Ciénega 25%Explorations 33%Fresnillo 19%Penmont 19%San Julian 1%Saucito 3%
Community investmentBy business unit
Ciénega 15%Explorations 4%Fresnillo 59%Penmont 9%Servicios Administrativos Fresnillo 4%Saucito 9%
Economic value distributedBy region
Zacatecas 24.17%Sonora 44.70%Durango 11.64%Chihuahua 12.50%Distrito Federal 4.90%Coahuila, Estado de Mexico and Guanajuato 2.09%

90 Fresnillo plc | Annual report 2013 www.fresnilloplc.com
Our People StrategyWe seek to strengthen the talent pipeline with people who possess the right skills and capabilities to satisfy our present and future needs. Talent management is a key element of our strategy to develop and engage our workforce. Building trust is a high priority in order to engage employees and build constructive relationships with unions.
What we said we would do in 2013Enhance our recruitment, training and performance evaluation programmes
What we did in 2013Recruitment and training efforts were intensified. Performance evaluations were applied across the organisation serving as mechanisms to obtain greater engagement of our people and a better alignment of individual objectives and the business strategy
What we plan to do in 2014Promote earth science careers in the regions where we operate
Launch initiatives and review our policies to improve gender diversity
Strengthen our workplace satisfaction survey and the action plans resulting from the survey
Review our HR policies and procedures to reinforce ethics
Launch an initiative to strengthen Trust in our organisational culture
Analyse alternatives to introduce more flexibility to our work schedule (fly in-fly out)
Start formalising career plans, prioritising critical success
Our people are our most important asset. Engaging and developing our people for the long term is our firm objective. We are, therefore, strongly committed to attracting, selecting, developing and retaining the best people to successfully support our business strategy. We aspire to an organisational culture based on ‘Trust’. We recognise Trust is the single most important characteristic of great places to work.
Our People 1234
Secure thetalent pipeline
Talent management
Cultureof trust
Strengthen our business with peoplewho possess the rightskills and capabilities.
Talent management is a key to developand engage our workforce.
Building trust is a high priority in order to engage employeesand build good relationships withunions.
Assessing our workplace
Conducted every two years. Though not previously mentioned in our reporting, we utilise the Great Place to Work Survey to assess our employees’ satisfaction. We erroneously reported the 2012 figure at 66%, when it was in fact 63%. The average score of the best 19 companies in Mexico was 77%. Our next workplace survey will be conducted in 2014.
Social and Sustainability Performance 4 Sustainability: Advance and Enhance the Sustainability of our Business
Employee satisfaction survey (GPTW)
Conducted every two years. Though not previously mentioned in our reporting, we utilise the Great Place to Work Survey to assess our employees’ satisfaction. We erroneously reported the 2012 figure at 66%, when it was in fact 63%. The average score of the best 19 companies in Mexico was 77%.

91www.fresnilloplc.com Fresnillo plc | Annual report 2013
Fresnillo Today
Strategic Report
Corporate Governance
Financial Statements
Strategy
Performance
Secure the talent pipelineTo secure our talent pipeline we collaborate with leading educational institutions such as the National Autonomous University of Mexico (UNAM), the National Polytechnic Institute (IPN), the University of Guanajuato and the University of Zacatecas to offer internships. Our approach is to detect talent by closely monitoring the performance of our interns throughout their internships as we give priority to recruit from our pool of interns. Effective training is offered to our new recruits according to their needs and always considering health and safety as non-negotiable elements of their training.
Fresnillo plc’s Centre for Technical Studies (CETEF) was created to train high-quality mining technicians for our specific needs. Candidates to join the CETEF are chosen from the communities surrounding our operations in order to favour local employment while securing the talent pipeline. Our training approach is based on a model that favours hands-on experience (dual system), spending 20% studying theory and 80% practicing with modern equipment. Furthermore, we also have an agreement with Peñoles to send our candidates to their Centre for Technical Studies of Laguna del Rey (CETLAR). The CETLAR follows a similar logic to the CETEF but focuses on training maintenance technicians.
Increasing the participation of women in mining is fundamental to secure the talent pipeline. In Mexico, the proportion of women participating in metal mining is 7.2%. Although we are slightly above the national average, we must maintain our effort to seize this opportunity.
Talent managementDeveloping and retaining talent is fundamental to meeting the human capital requirements of our business strategy and consistent with our vision to engage our people for the long term. Planning of human capital requirements is carefully aligned to our operations and explorations with frequent feedback to monitor progress. Nurturing and developing talent has allowed us to fill 78% of our open positions this year with internal candidates.
Our approach to evaluating performance was re-engineered to achieve a better alignment between individual objectives of our people and the business strategy. Monitoring the performance with respect to the objectives and behaviours also allows for detecting leadership potential, training needs and the expectations of our people. We aim at reinforcing feedback and openness and embedding them in our culture.
Leadership skills are developed through our Leaders with Vision programme that selects candidates with high leadership potential and takes them through a series of seminars to develop their skills. Our senior executives deliver these seminars throughout the year as a mechanism to raise engagement and foster relationships. Our senior executives themselves participate in a training programme organised by one of the leading
business schools in Mexico, the Mexico Autonomous Institute of Technology (ITAM). Recognising innovative contributions from people and nurturing entrepreneurship has been the objective of our Value Creation Projects.
Culture of trustOur vision is to nurture an avant-garde and honest culture founded on trust. Our working climate survey provided insightful information on the perception of our people with respect to our organisational culture and our areas of opportunity. To reinforce our culture, we targeted business ethics as a lever of influence. As part of the project, our HR policies were analysed and opportunities were detected to incorporate in the upcoming year’s best practices in our HR lifecycle (hiring, training, evaluating performance, promotions, etc.).
Responsible labour policies and human rightsAs signatories to the UN Global Compact, we are strongly committed to respecting and protecting freedom of association and collective bargaining. Our collective agreements with unions guarantee competitive wages and benefits for the 80% of our workforce that is unionised. We are also committed to respecting the fair labour practices and labour rights of our non-unionised workers. Transparent and respectful relations with unions led to zero labour disputes or strikes in 2013. Good relations with unions have also facilitated their buy-in of our efforts to embed safety in our culture.
Child labour or compulsory work are banned from our operations and are regularly monitored by Mexican authorities. In our Code of Conduct, we make clear to our employees and contractors that we do not tolerate any form of harassment, intimidation or discrimination. As a signatory to the UN Global compact, we are strongly committed to supporting and respecting the protection of internationally proclaimed human rights and ensuring that we are not complicit in human rights abuses.
The Group’s whistleblowing line received one case of abuse of trust and another case related to working conditions during the reporting year. These cases were investigated and processed by the Honour Commission, resulting in disciplinary measures for both.
3.9
2012 2013
Voluntary labour turnover (%)
6.7 4.7 8.2
Voluntary labour turnover Total turnover
2.4
2012 2013
Gender diversity (%)
8.5 4.55 8.83
Gender diversity (managers) Gender diversity
3,300
2012 2013
Employees and contractors
3,245 3,262 3,150
Employees Contractors
94
2012 2013
Average workforce training hours
85 50
2012 2013
Average HSECRtraining hours
55 1.78
2012 2013
Investment in training programmes US$ millions
1.69
693
2012 2013
Unionised workers
2,607 652 2,610
Non-unionised workers Unionised workers

92 Fresnillo plc | Annual report 2013 www.fresnilloplc.com
Financial Review
The Consolidated Financial Statements of Fresnillo plc are prepared in accordance with International Financial Reporting Standards (IFRS). This Financial Review is intended to convey the main factors affecting performance and to provide a detailed analysis of the financial results in order to enhance understanding of the Group’s financial statements. All comparisons refer to 2013 figures compared to 2012, unless otherwise noted. The financial information is presented in US dollars, except where indicated. The full Financial Statements and their accompanying notes can be found on page 149-206.
Commentary on financial performanceFinancial performance in 2013 reflects the challenges that arose in the precious metals market during the year and the disrupted operations at Minera Penmont in 2H 2013 (see pages 11 and 64-69). Gross profit, EBITDA and profit from continuing operations before net finance costs and income tax decreased by 43.8%, 44.5% and 54.0%, respectively.
Adjusted revenues decreased by 23.0% to US$1,761.9 million. The US$525.3 million decline reflected the adverse effect of lower gold and silver prices and reduced sales volumes of gold from Minera Penmont. These factors were partially mitigated by increased volumes of silver sold, mainly from Saucito.
The main factors that impacted adjusted production costs were: the increase in volume of ore processed at Saucito, Ciénega and Noche Buena; the Group’s cost inflation in US dollars, estimated at 7.3%; and the 3.0% revaluation of the Mexican peso/US dollar exchange rate. These adverse effects were offset by a decrease in adjusted production costs resulting from efficiencies achieved at our operating mines through optimisation and cost-reduction initiatives, as well as lower variable production costs at Minera Penmont due to stoppages.
Despite the slight decrease in adjusted production costs, cost of sales increased by 6.9% due to the unproductive costs recorded at Minera Penmont (US$26.1 million); and the fact that in 2013 there was no significant variation in change in work in process (US$1.3 million), whilst there was an increase in 2012 (US$74.3 million). These adverse factors were mitigated by the lower depreciation and profit sharing, as well as favourable results from MXP/USD hedging.
As a result, gross profit decreased from US$1,364.6 million to US$767.4 million.
Exploration expenses recorded in the income statement of US$207.8 million decreased by 11.0% compared to 2012. Total risk capital invested in exploration was US$233.3 million, a decrease of 26.8% compared to 2012 and below the revised budgeted figure of US$242.8 million. This decrease reflected our continued commitment to investing through cycles albeit with a more conservative approach.
The Silverstream contract was another factor that negatively affected the Group’s profit levels, with a US$54.0 million non-cash loss registered during the period (comprised of a non-cash loss of US$65.7 million related to the revaluation of the Silverstream and an US$11.7 million gain resulting from amortisation effects during the period); this compares to a US$117.7 million gain recorded in 2012.
We engage in some hedging activities to mitigate the impact of risks related to variables that are beyond our control such as prices, exchange rates and interest rates. These include hedging of a portion of lead and zinc production as these are the Group’s by-products; Mexican peso-US dollar exchange rates, which affect our cost of sales; and other currencies, such as euros and Swedish krona related to the purchase of equipment. In addition, we entered into a rate lock agreement in November 2013 in connection with the debt issuance due to the extreme volatility and the upward trend of interest rates at that time. Detailed information about hedging activities and derivative positions is explained going forward in each component of the income statement it affects.
All the above factors resulted in a 69.5% decrease in profit for the year and a 67.6% decline in profit attributable to equity shareholders of the Group, to US$240.4 million.
The Group ended the year with a cash position of US$1,251.7 million. This resulted mainly from: net cash from operating activities of US$446.0 million, the issuance of US$789.0 million Senior Notes, net of transaction costs, the US$346.1 million placement of new shares and US$63.8 million proceeds from the Silverstream.
93www.fresnilloplc.com Fresnillo plc | Annual report 2013
Fresnillo Today
Strategic Report
Corporate Governance
Financial Statements
Strategy
Performance
A portion of these funds, US$572.1 million, was allocated to the purchase of property, plant and equipment, which was higher than the US$527.3 million spent in 2012. Capex for 2014 is estimated at US$642.0 million, a 12.2% increase reflecting the on-going investments in Saucito II and San Julián and the construction of other lesser projects scheduled to begin this year subject to Board approval.
In accordance with our efforts to balance growth with returns to shareholders, we paid US$505.2 million in dividends, which included anticipated dividends from 2014.
Taking into consideration the current financial position of the Company, the quality of the Group’s mines and projects and our commitment to operate in a profitable and sustainable way, management remains confident that Fresnillo plc will continue to generate positive returns throughout the cycles.
Income statementFinancial results are, to a great extent, dependent on the Group’s operational performance, asset quality, skilled personnel and management execution towards our strategic goals. Notwithstanding, there are certain macroeconomic variables affecting the financial results, which are beyond our control. A description of these variables is provided in the table below.
Precious metal pricesIn 2013, gold and silver markets were affected by the announcement made by the US Federal Reserve with regards to the reduction of the monetary stimulus programme in light of more positive macro-economic data. A selling trend took hold among central banks and investors, including ETFs, which affected precious metals prices. The average realised gold price decreased by 16.3% to US$1,401.3 per ounce, and
the average realised silver price decreased by 27.3% to $22.8 per ounce. Furthermore, the average zinc price decreased by 3.0%, whilst the average lead price increased slightly by 2.1% over 2012.
The Group remains fully exposed to volatility in precious metal prices in accordance with its policy of not hedging silver and gold production. However, in 2013 the Group entered into derivative contracts to mitigate the risks associated with the sale of by-product lead, hedging 2,450 metric tonnes of lead through collar structures with floor and cap prices of US$2,205 per tonne (US$100.02 cents/lb) and US$2,670 per tonne (121.11 cents/lb) respectively, resulting in a US$0.3 million gain recorded in the income statement. The total outstanding position as of 31 December, was 1,800 metric tonnes with monthly settlements until December 2014, with floor and cap prices of US$2,100 per tonne (US$95.25 cents/lb) and US$2,450 per tonne (US$111.13 cents/lb) respectively.
Additionally, Fresnillo plc entered into a zinc derivative contract and as of 31 December 2013, the total outstanding position totalled 1,920 metric tonnes with floor and cap prices of US$1,900 per tonne (US$86.18 cents/lb) and US$2,200 per tonne (US$99.79 cents/lb) respectively, with monthly settlements from January to December 2014.
Foreign exchange ratesThe average spot Mexican peso/US dollar exchange rate revalued by 3.0%, from $13.17 per US dollar in 2012 to $12.77 per US dollar in 2013. This resulted in an adverse effect estimated at US$7.6 million on the Group’s production costs, as costs denominated in Mexican pesos (approximately 2/3 of total costs) were higher when converted to US dollars.
The Group did enter into certain derivative contracts in the year to hedge foreign exchange exposure, as outlined in the Cost of Sales description below.
Key line items 2013 US$ million
2012 US$ million
Change
Amount US$ %
Adjusted revenue1 1,761.9 2,287.2 (525.3) (23.0)
Lead hedging 0.3 0.0 0.3 N/A
Treatment and refining charges (147.0) (129.8) (17.2) 13.2
Total revenues 1,615.2 2,157.4 (542.2) (25.1)
Cost of sales (847.7) (792.8) (54.9) 6.9
Gross profit 767.4 1,364.6 (597.2) (43.8)
Exploration expenses 207.8 233.5 (25.8) (11.0)
EBITDA2 729.8 1,315.3 (585.5) (44.5)
Profit before income tax 418.7 1,177.6 (758.9) (64.4)
Mining right 36.2 0.0 36.2 100.0
Income tax expense 121.5 322.6 (201.0) (62.3)
Profit for the year 261.0 855.0 (594.0) (69.5)
Profit for the year, excluding post-tax Silverstream effects 298.8 771.0 (472.2) (61.2)
Attributable profit 240.4 741.2 (500.8) (67.6)
Attributable profit, excluding post-tax Silverstream effects 278.2 657.2 (379.0) (57.7)
Basic and diluted Earnings per share (US$/share)3 0.329 1.034 (0.705) (68.2)
Basic and diluted Earnings per share, excluding post-tax Silverstream effects (US$/share) 0.381 0.916 (0.535) (58.4)1 Adjusted revenue is revenue as disclosed in the income statement adjusted to exclude treatment and refining charges and lead and zinc hedging.
2 Earnings before interest, taxes, depreciation and amortisation (EBITDA) is calculated as gross profit plus depreciation less administrative, selling and exploration expenses.
3 The weighted average number of Ordinary Shares was 730,244,000 for 2013 and 717,160,159 for 2012. See note 11 in the Consolidated Financial Statements.
94 Fresnillo plc | Annual report 2013 www.fresnilloplc.com
Financial Review continued
Cost InflationTo calculate cost inflation for the year, we considered all components of adjusted production costs: labour, energy, operating materials, contractors, maintenance, freights, insurance and other costs, then estimated the unit price increase for each and calculated the weighted average. The resulting cost inflation estimate for 2013 was 7.3%, which included the 3.0% revaluation of the Mexican peso against the US dollar. All figures and year-on-year variations are provided in US dollar terms unless otherwise noted. We conduct the same exercise for each individual mine operation, whose basket components may carry different weightings.
LabourEmployees received a 6.0% increase in wages in Mexican pesos and administrative employees at the mines received a 5.0% increase; when converted to US dollars the inflation factor was 9.1%.
EnergyThe Group uses mainly two sources of energy, electricity and diesel.
ElectricityThe Group’s weighted average cost of electricity increased by 7.8% to US$11.0 cents per kw, compared to US$10.2 in 2012. Electricity rates are set by the Comisión Federal de Electricidad (CFE), the national utility, based on their average generating cost, which correlates to fuel oil and coal prices.
DieselThe weighted average cost of diesel in US dollars increased by 19.5% to US$78.5 cents per litre in 2013. Diesel prices are controlled by Petróleos Mexicanos (PEMEX), the national oil company, which is aiming to gradually align fuel and diesel prices over the medium term with prevailing international prices.
In 2013, unit prices of key operating materials in US dollars began to stabilise as a result of lower demand for some inputs in a challenged mining industry. The net weighted average increase in unit prices of operating materials was estimated at 1.5%. This reflects the combined effect of price inflation and the weighting of each component in the total cost of operating materials.
Contractors Agreements are signed individually with each contractor and have specific terms and conditions that cover operating materials, equipment and labour, amongst others. Contractor costs are an important component of the Company’s total costs denominated Mexican pesos. Not all contracts were due for review during the year. Increases in dollar terms ranged from 4.8% to 40.3%, resulting in a weighted average of 8.6%.
MaintenanceUnit prices of spare parts to provide maintenance increased by an estimated 4.0% in US dollars.
Others Other cost components include freight, of which the unit cost increased by an estimated 10.7%, and the insurance premium per unit rose by 16.2%; the remaining components had an average inflation of 3.8% over 2012.
Treatment and Refining chargesTreatment and refining charges1, which are deducted from adjusted revenue for the purposes of revenues as disclosed in the income statement, are reviewed annually in accordance with international benchmarks. Treatment charge per tonne of lead concentrate decreased by 10.4%. However, treatment charge per tonne of zinc concentrate, including the escalator, increased by 10.3% and silver refining charges continued to increase by 9.1% year-on-year due to limited refining capacity for lead concentrates such as ours that have high silver content. These increases, together with greater volumes of lead concentrates shipped mainly from Saucito to Met-Mex, resulted in a 13.2% aggregate increase in treatment charges.
The effects of the above external factors, combined with the Group’s internal variables, are further described below through the main line items of the income statement.
RevenuesAdjusted revenues decreased by 23.0% to US$1,761.9 million in 2013, mainly as a result of the lower gold and silver prices and the decrease in sales volumes of gold, due mainly to stoppages at Minera Penmont in 2H 2013.
In 2013, we entered into derivative contracts to hedge 2,450 metric tonnes of lead through collar structures, resulting in a US$0.3 million gain recorded in the income statement.
The total metal price effect (lower prices of gold, silver and zinc mitigated by an increase in lead price), resulted in an adverse impact on revenues of US$479.3 million. The total volume effect (31.1% decrease in ore deposited at open pit mines, affecting sales volumes of gold; mitigated by a 7.8% increase in ore milled at underground mines, which resulted in higher volumes of silver sold), resulted in an unfavourable impact of US$46.0 million.
The Group’s silver-gold profile reverted to silver as the main contributor to adjusted revenues. This was the result of: i) the 7.0% increase in volumes of silver sold mainly from Saucito and Ciénega; ii) the lower volumes of gold sold primarily at the Herradura district; and iii) the decrease in silver and gold prices, although in different magnitudes.
In terms of adjusted revenues by mine, Fresnillo contributed a lesser share of adjusted revenues, however, remained the main contributor. Saucito and Noche Buena increased their contributions as a result of their successful ramp-up of production. In contrast, the disrupted operations at Herradura and Soledad-Dipolos adversely affected their respective shares of consolidated adjusted revenues.
1 Treatment and refining charges include the cost of treatment and refining as well as the margin charged by the customer.

95www.fresnilloplc.com Fresnillo plc | Annual report 2013
Fresnillo Today
Strategic Report
Corporate Governance
Financial Statements
Strategy
Performance
Operating materials Year over year change in USD %
Sodium cyanide 2.7
Tyres 3.7
Explosives 0.7
Steel for drilling 1.4
Lubricants 4.1
Steel balls for milling (2.5)
Weighted average of all operating materials 1.5
Consolidated revenues 2013 US$ million
2012 US$ million
Change
Amount US$ %
Adjusted revenue1 1,761.9 2,287.2 (525.3) (23.0)
Lead and zinc hedging 0.3 0.0 0.3 N/A
Treatment and refining charges (147.0) (129.8) (17.2) 13.2
Total revenues 1,615.2 2,157.4 (542.2) (25.1)
Adjusted revenues1 by metal 2013 2012Volume
variancePrice
varianceTotalUS$ %US$ million % US$ million %
Silver 842.9 48 1,084.3 47 65.5 (306.9) (241.4) (22.3)
Gold 831.7 47 1,118.6 49 (114.8) (172.1) (286.9) (25.6)
Lead 47.6 3 43.5 2 3.2 0.9 4.1 9.4
Zinc 39.7 2 40.8 2 0.2 (1.2) (1.1) (2.7)
Total adjusted revenues 1,761.9 100 2,287.2 100 (46.0) (479.3) (525.3) (23.0)
Adjusted revenues by mine 2013 2012
Fresnillo 588.3 865.7
Saucito 326.3 286.0
Ciénega 250.7 320.1
Herradura 379.4 528.6
Noche Buena 148.4 108.5
Soledad-Dipolos 68.8 178.5
Total 1,761.9 2,287.2
1 Adjusted revenue is revenue as disclosed in the income statement adjusted to exclude treatment and refining charges and lead and zinc hedging.
96 Fresnillo plc | Annual report 2013 www.fresnilloplc.com
Financial Review continued
Volumes of metal sold 2013 2012 Change %
Silver (koz)
Fresnillo 21,709 24,536 (11.5)
Saucito 11,073 6,659 66.3
Ciénega 3,760 3,003 25.2
Herradura 295 238 23.9
Noche Buena 47 14 231.6
Soledad-Dipolos 30 49 (38.5)
Total silver (koz) 36,914 34,499 7.0
Gold (koz)
Fresnillo 29 24 18.9
Saucito 42 41 1.1
Ciénega 107 121 (11.4)
Herradura 262 311 (15.8)
Noche Buena 107 65 64.9
Soledad-Dipolos 47 106 (55.9)
Total gold (koz) 594 668 (11.1)
Lead (mt)
Fresnillo 13,821 13,875 (0.4)
Saucito 4,835 2,220 117.8
Ciénega 3,934 4,978 (21.0)
Total lead (mt) 22,591 21,073 7.2
Zinc (mt)
Fresnillo 12,385 12,290 0.8
Saucito 3,772 1,406 168.3
Ciénega 4,694 7,071 (33.6)
Total zinc (mt) 20,851 20,767 0.4
Cost of sales 2013 US$ million
2012US$ million
Change
Amount US$ %
Adjusted production costs1 567.7 569.1 (1.4) (0.2)
Depreciation 239.3 243.8 (4.4) (1.8)
Change in work in progress (1.3) (70.9) 69.6 (98.1)
Profit sharing 20.2 48.8 (28.6) (58.6)
Hedging (4.3) 2.1 (6.4) N/A
Unproductive costs 26.1 0.0 26.1 N/A
Cost of sales 847.7 792.8 54.9 6.9
1 Adjusted production costs are calculated as total production costs less depreciation, profit sharing and the effects of exchange rate hedging.

97www.fresnilloplc.com Fresnillo plc | Annual report 2013
Fresnillo Today
Strategic Report
Corporate Governance
Financial Statements
Strategy
Performance
Cost of sales totalled US$847.7 million, an increase of 6.9% over 2012. The US$54.9 million increase is mainly explained by the variation in change in work in progress (+US$69.6 million). In 2013, this item reflected the consumption of inventories at Herradura, offset by the increase in ore inventories at Noche Buena; whereas in 2012, change in work in progress resulted from the increase in inventories at Noche Buena related to the construction of pads.
A key factor affecting cost of sales was the unproductive costs recorded in 2H 2013 at Minera Penmont, primarily in labour costs for workers we maintained on payroll under the assumption that the suspension of the explosives permit would be short-lived and operations would resume to normal. The share of those costs that would have been related to the mining process – blasting, haulage and ore deposit at the pads – was registered as a separate line within the costs of sales rather than in adjusted production costs as there was no direct production linked to them.
The above adverse effects were partially mitigated by decreases in:
– Profit sharing (-US$28.6 million): Lower profit sharing as a result of the decline in precious metals prices and lower profits at all the mines, except for Saucito, which exclusively employs contractors who are not entitled to profit sharing.
– Adjusted production costs (-US$1.4 million): The decrease was mainly driven by the lower variable costs recorded as a result of the stoppage of operations at Penmont mines, which were estimated at US$47.6 million; and unproductive costs of US$26.1 million reclassified to a separate line within cost of sales. In addition, efficiencies achieved at the operating mines, estimated at US$27.4 million, further contributed to the decline in adjusted production costs. These included: i) increased ore throughput at Saucito and Ciénega; ii) optimised shotcreting as a result of the increased use of wire mesh and improved control in production areas; iii) reduced consumption of balls for mills and spare parts at Fresnillo by enhancing operating controls; iv) lower maintenance costs related to mechanical and electric repairs at Ciénega; and v) optimised consumption of reagents at the beneficiation process with the use of expert systems. The above favourable effects were partially offset by higher production costs related to the two additional months of operation at Noche Buena and increased volumes of ore processed at Ciénega, Saucito and Noche Buena, which combined were estimated at US$55.9 million. In addition, each production cost component had the following cost inflation and underlying operational pressures:
– Contractor costs increased by US$14.3 million as a result of: i) increase in the unit fees charged by contractors; ii) greater number of contractors to carry out scaling activities mainly at the Fresnillo mine; iii) increased volumes of ore and waste material hauled over longer distances mainly at Saucito and Ciénega; and iv) increased development at Saucito, Noche Buena and Herradura.
– The cost of energy rose by US$9.9 million, mainly due to higher unit prices of diesel (+19.5%) and electricity (+7.2%).
– Personnel costs, excluding profit sharing, increased by US$3.5 million, mainly due to: i) a 6.0% increase in wages in Mexican pesos as a result of the annual review; ii) additional personnel hired for the dynamic leaching plant at Herradura; and iii) increase in training to reinforce behavioural change and improve safety indices at the mines.
– Cost of maintenance increased by US$2.7 million as a result of the increase in the unit costs of spare parts
– Cost of operating materials rose by US$1.2 million due to the slight weighted average increase in unit prices of operating materials and higher consumption of explosives and anchors to reinforce safety conditions at Fresnillo.
– The 3.0% revaluation of the average Mexican peso/US dollar spot exchange rate, which resulted in an estimated US$7.6 million unfavourable effect when converting peso-denominated costs to US dollars.
– Depreciation (-US$4.4 million): The decrease was explained by the lower depletion factors at Saucito due to the increased reserve base. The lower depreciation registered at Soledad-Dipolos in 2H 2013 further minimised the Group’s depreciation. This was mitigated by higher depreciation at Ciénega as a result of higher production volumes, which increased the depletion factor.
– Hedging (-US$6.4): The Group enters into certain exchange rate derivative instruments as part of a programme to manage its exposure to foreign exchange risk associated with costs incurred in Mexican pesos. In 2013, forward dollar sales for US$1.5 million at an average rate of $12.54 matured, resulting in a narrow loss (US$36,878) recognised in the income statement. As of 31 December, the total outstanding volume was US$8.0 million with settlement in 15 January 2014.
Additionally, the Group entered into a combination of put and call options structured at zero cost (collars). In 2012, these derivatives were used to hedge US$182.0 million of costs denominated in Mexican pesos with average floor and cap exchange rates of $12.91 and $14.14 per US dollar respectively, resulting in a US$4.3 million gain recorded in the income statement. The total outstanding position using collar structures as of 31 December 2013, was US$228.5 million with maturity dates throughout 2014. These instruments guarantee a minimum exchange rate should the market fall below the floor exchange rate. Between the floor and cap exchange rates, the Group sells US dollars at the market rate, and when the Mexican peso per US dollar exchange rate goes above the cap rate, the Company is obliged to sell US dollars at the contract rate.
98 Fresnillo plc | Annual report 2013 www.fresnilloplc.com
Financial Review continued
Cost per tonne, cash cost per ounce and all-in sustaining costCost per tonne, calculated as total production costs less depreciation, profit sharing and exchange rate hedging effects, divided by total tonnage milled or deposited, is a key indicator to measure the effects of mining inflation and cost control performance at each mine and the Group as a whole. In 2013, this indicator was distorted at the Minera Penmont mines as a result of the stoppage of production at Soledad-Dipolos and the limited operations at Herradura. For more information on cost per tonne by mine please see pages 58-69.
Cash costsThe particular variations in cash cost for each mine are explained as follows:
Fresnillo: US$5.87/oz (2013) vs US$5.59/oz (2012) (+US$0.28/oz; + 5.0%) The increase in cash cost per ounce is mainly a result of the lower volumes of silver sold, reflecting the decline in ore grade during the period (+US$0.58/oz). To a lesser extent, higher silver refining charges (+US$0.39/oz) and an increase in cost per tonne also contributed (+US$0.09/oz). This was partially mitigated by: i) higher by-product credits per silver ounce as a result of the combined effect of lower silver ounces sold and the increase in gold production (-US$0.41/oz); and ii) lower profit sharing resulting from the decrease in silver price (-US$0.37/oz).
Saucito: US$3.61/oz (2013) vs US$0.49/oz (2012) (+US$3.12/oz; +636.7%) Despite the higher ore grades, which lowered cash cost (-US$1.82/oz), this indicator increased mainly due to lower by-product credits per ounce of silver, which resulted from the combined effect of lower gold and zinc prices divided by an increased volume of silver ounces (+US$4.74/oz). Higher treatment and refining charges also contributed (+US$0.2/oz). Despite all the above, Saucito continues to be one of the lowest cash cost silver mines in the world.
Ciénega: US$37.68/oz (2013) vs -US$84.84/oz (2012) (+US$122.52/oz; +144.4%) The difference in cash cost reflects the adverse effects of the expected lower gold ore grade during the period (+US$168.60/oz), higher treatment charges of zinc concentrates and silver refining charges (+US$27.11/oz), and a decrease in by-product credits per ounce of gold due to lower silver and zinc prices (+US$9.35/oz). These increases were mitigated by the decrease in cost per tonne (-US$65.76/oz) and lower profit sharing (-US$16.78/oz). Due to the polymetallic nature of this mine (58.7% gold, 34.4% silver and 6.9% base metals), we also calculated cash cost in a gold equivalent basis (US$590.98/oz in 2013 vs US$564.10/oz in 2012; +4.8%).
Herradura: US$651.23/oz (2013) vs US$481.31/oz (2012) (+US$169.92/oz; +35.3%) The higher cash cost per ounce resulted mainly from the increase in cost per tonne, including the effects from the variations in the changes in work in progress (+US$180.75/oz); and the unproductive costs due to stoppage (+US$64.06/oz). These negative effects were partially compensated by higher ore grades (-US$44.53/oz); lower profit sharing (-US$27.18/oz); and others (-US$3.18/oz).
Noche Buena: US$928.03/oz (2013) vs US$574.16/oz (2012) (+US$353.87/oz; +61.6%) The increase in cash cost per ounce primarily reflected the increase in cost per tonne, including the effects from the variations in the changes in work in progress (+US$313.6/oz); unproductive costs due to stoppage (+US$63.7/oz); and others (+US$8.4/oz). These negative effects were partially mitigated by higher ore grades (-US$22.9/oz) and lower profit sharing (-US$8.9/oz).
Soledad-Dipolos: US$820.28/oz (2013) vs US$618.76/oz (2012) (+US$201.52/oz; +32.6%) Higher cash cost per ounce due to the increase in cost per tonne including effects from variations in the changes in work in progress (+US$268.01/oz); unproductive costs due to stoppage (+US$49.11/oz) and others (+US$0.16/oz). Higher ore grade (-US$77.63/oz) and lower profit sharing (-US38.13/oz) partially compensated for these adverse effects.
In addition to the traditional cash cost described above, the Group is reporting all-in sustaining costs (AISC), in accordance with the guidelines issued by the World Gold Council.
This cost metric is calculated as traditional cash cost plus on-site general, corporate and administrative costs, community costs related to current operations, capitalised stripping & underground mine development, sustaining capital expenditures and remediation expenses.
Management considers all-in sustaining costs a reasonable measure to monitor current production costs and sustaining costs as it includes stripping costs incurred to prepare the mine for future production.
FresnilloDespite the 5.0% increase in cash cost, all-in sustaining cost decreased due to lower sustaining capex incurred in 2013 as a result of fewer replacements of in-mine equipment.
SaucitoDespite the increase in cash cost, all-in sustaining cost declined as a result of: i) lower sustaining capex due to reduced purchases of equipment for contractors and water pumps; ii) a decrease in capitalised mining works and iii) lower corporate expenses.
CiénegaIncrease in cash cost, partially offset by a decrease in sustaining capex resulting from reduced purchase of equipment for contractors and a decrease in mining works; at Ciénega and San Ramón compared to 2012.
HerraduraHigher cash cost and increased stripping carried out as a result of the additional personnel and equipment transferred from Soledad-Dipolos.
Noche BuenaHigher cash cost in 2013 compared to 2012, the first year of operations; mitigated by a decrease in sustaining capex per ounce, the lower amortisation of the ecological reserve for mine closure and lower administrative expenses related to engineering and construction.
Soledad-DipolosMainly due to higher cash cost, as explained previously.
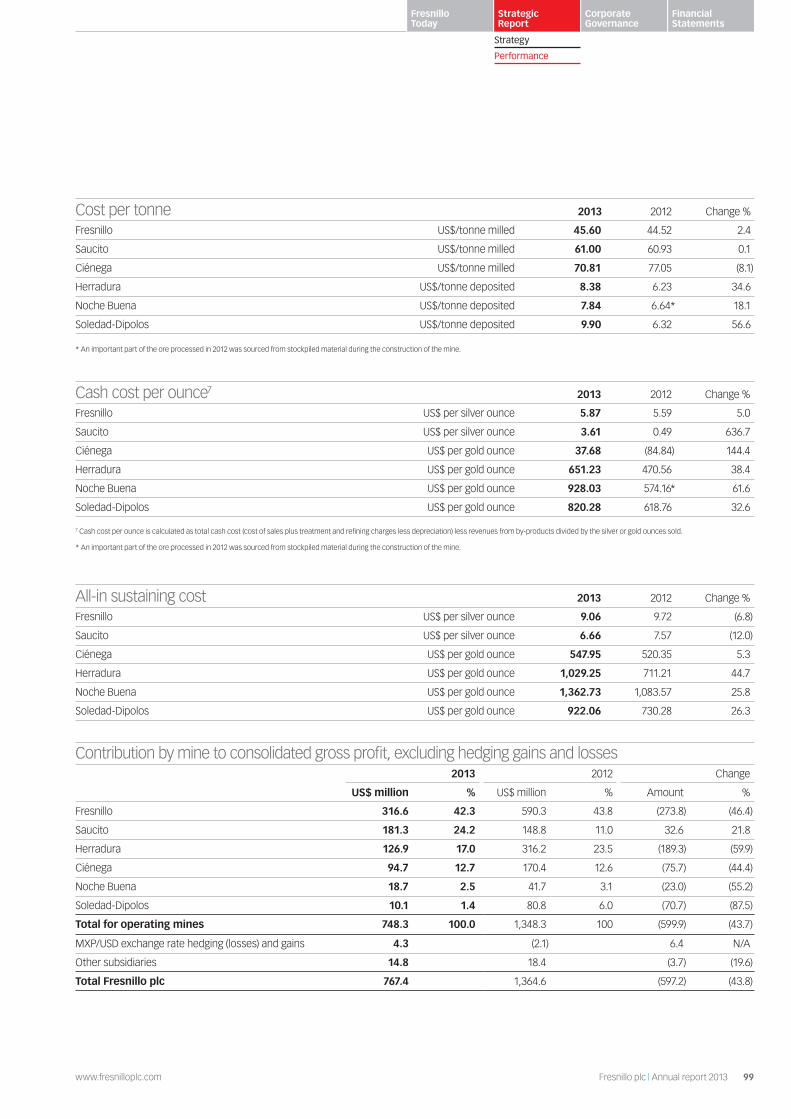
99www.fresnilloplc.com Fresnillo plc | Annual report 2013
Fresnillo Today
Strategic Report
Corporate Governance
Financial Statements
Strategy
Performance
Cost per tonne 2013 2012 Change %
Fresnillo US$/tonne milled 45.60 44.52 2.4
Saucito US$/tonne milled 61.00 60.93 0.1
Ciénega US$/tonne milled 70.81 77.05 (8.1)
Herradura US$/tonne deposited 8.38 6.23 34.6
Noche Buena US$/tonne deposited 7.84 6.64* 18.1
Soledad-Dipolos US$/tonne deposited 9.90 6.32 56.6
* An important part of the ore processed in 2012 was sourced from stockpiled material during the construction of the mine.
Cash cost per ounce7 2013 2012 Change %
Fresnillo US$ per silver ounce 5.87 5.59 5.0
Saucito US$ per silver ounce 3.61 0.49 636.7
Ciénega US$ per gold ounce 37.68 (84.84) 144.4
Herradura US$ per gold ounce 651.23 470.56 38.4
Noche Buena US$ per gold ounce 928.03 574.16* 61.6
Soledad-Dipolos US$ per gold ounce 820.28 618.76 32.6
7 Cash cost per ounce is calculated as total cash cost (cost of sales plus treatment and refining charges less depreciation) less revenues from by-products divided by the silver or gold ounces sold.
* An important part of the ore processed in 2012 was sourced from stockpiled material during the construction of the mine.
All-in sustaining cost 2013 2012 Change %
Fresnillo US$ per silver ounce 9.06 9.72 (6.8)
Saucito US$ per silver ounce 6.66 7.57 (12.0)
Ciénega US$ per gold ounce 547.95 520.35 5.3
Herradura US$ per gold ounce 1,029.25 711.21 44.7
Noche Buena US$ per gold ounce 1,362.73 1,083.57 25.8
Soledad-Dipolos US$ per gold ounce 922.06 730.28 26.3
Contribution by mine to consolidated gross profit, excluding hedging gains and losses2013 2012 Change
US$ million % US$ million % Amount %
Fresnillo 316.6 42.3 590.3 43.8 (273.8) (46.4)
Saucito 181.3 24.2 148.8 11.0 32.6 21.8
Herradura 126.9 17.0 316.2 23.5 (189.3) (59.9)
Ciénega 94.7 12.7 170.4 12.6 (75.7) (44.4)
Noche Buena 18.7 2.5 41.7 3.1 (23.0) (55.2)
Soledad-Dipolos 10.1 1.4 80.8 6.0 (70.7) (87.5)
Total for operating mines 748.3 100.0 1,348.3 100 (599.9) (43.7)
MXP/USD exchange rate hedging (losses) and gains 4.3 (2.1) 6.4 N/A
Other subsidiaries 14.8 18.4 (3.7) (19.6)
Total Fresnillo plc 767.4 1,364.6 (597.2) (43.8)
100 Fresnillo plc | Annual report 2013 www.fresnilloplc.com
Financial Review continued
Gross profitGross profit, excluding hedging gains and losses, is a key financial indicator of profitability at each business unit and the Fresnillo Group as a whole.
Total gross profit, excluding hedging gains and losses, decreased by 43.8% to US$767.4 million in 2013.
The main factors contributing to the US$597.2 million decline in gross profit were: i) the adverse effect of the lower silver, gold and zinc prices estimated at -US$477.2 million; ii) profit not incurred at the Penmont mines net of changes in inventory movements (-US$215.1 million); iii) a 13.7% decrease in silver production at the Fresnillo mine due to lower ore grade (-US$69.6 million); iv) the lower ore grade at Ciénega (-US$37.1 million); v) the 7.3% cost inflation (-US$31.6 million); and vi) the 3.0% revaluation of the Mexican peso/US dollar exchange rate (-US$7.6 million) and others (-US$13.9 million).
These factors were partially offset by: i) increased ore volumes processed at Saucito, Ciénega and Noche Buena (+US$161.7 million); ii) higher ore grades at Herradura and Soledad-Dipolos in 1H 2013 (+US$35.2 million); iii) the favourable effect of the efficiencies achieved at the operating mines (+US$27.4 million); iv) lower profit sharing (+US$28.8 million); and v) others (+US$1.8 million).
Saucito’s contribution to the Group’s gross profit, excluding hedging effects, increased from 11.1% in 2012 to 24.2% in 2013, reflecting the ramp-up of silver production to full capacity at this mine. Gross profit at the Fresnillo mine decreased by 46.4% to US$316.6 million in 2013, but remained as the main contributor to the Group’s consolidated gross profit with 42.3%. The Herradura and Soledad-Dipolos mines decreased their contributions considerably as a result of the disrupted operations in 2H 2013. Gross profit at Noche Buena decreased reflecting the lower gold prices and the more representative cost performance in the first full year of operations. Finally, gross profit at Ciénega decreased by 44.4% to US$94.7 million due to the decrease in precious metal prices and lower gold ore grade; however, its contribution to the consolidated gross profit remained unchanged year-over-year at 12.7%.
Administrative expensesAdministrative expenses of US$62.2 million increased by 16.9% over 2012, due mainly to increased non-recurring engineering and construction services provided by Servicios Industriales Peñoles, S.A.B. de C.V. On-going administrative expenses remained relatively stable and were only affected by the 5.1% increase in salaries granted to employees and the additional administrative personnel hired to service the new mines and projects.
Exploration expensesExploration expenses in 2013 totalled US$207.8 million, an 11.0% decrease compared to 2012, which reflects our commitment to balancing investment throughout the cycle with our commitment to stakeholder returns. As anticipated, we continued to explore in the areas surrounding our operating mining districts and in advanced exploration projects, but reduced drilling costs in several early stage projects. An additional US$25.6 million was capitalised associated with Centauro Deep, Juanicipio and Orisyvo projects. As a result, total investment in exploration of US$233.3 million in 2013 decreased by 26.8% compared to 2012 and was just below the revised budgeted figure of US$242.8 million.
EBITDAEBITDA is another key indicator of the Group’s financial performance, which is calculated as gross profit plus depreciation, less administrative, selling and exploration expenses. EBITDA decreased by 44.5% in 2013 to US$729.8 million, mainly due to the adverse effect of lower gross profit. EBITDA margin declined accordingly, from 61.0% in 2012 to 45.2% in 2013.
Silverstream effectsThe Silverstream contract is accounted for as a derivative financial instrument carried at fair value. The revaluation of the Silverstream contract generated a US$65.7 million non-cash loss as a result of updating the assumptions utilised to value the Silverstream Contract, most significantly the lower forward price of silver. In addition, a US$11.7 million non-cash gain was generated by: i) the unwinding of the discount rate; and ii) the difference between payments actually received in 2013 and payments estimated in the valuation model as at 31 December 2012. The net effect recorded in the 2013 income statement was US$54.0 million.
Since the IPO, cumulative cash received totalled US$363.8 million, while total non-cash revaluation gains of US$434.8 million have been taken to income. However, it was anticipated that the Group would expect further unrealised gains or losses taken to the income statement in accordance with the cyclical behaviour of the silver price or changes in the variables considered in valuing this contract. Further information related to the Silverstream contract is provided in the Balance Sheet section below and in notes 14 and 30 to the Consolidated Financial Statements.
Finance expense Finance expense in the year totalled US$8.9 million, compared with the US$7.6 million finance income recorded in 2012. The main differential was the accrued interest payable of US$6.1 million registered in the income statement as a result of the issuance of US$800 million principal amount of 5.500% Senior Notes.
Following the US$800 million debt issuance on 7 November, Fresnillo plc entered into a rate lock agreement hedging US$340 million at rate of 2.6272% fixing the base rate of the 5.50% coupon. As a result, the Group incurred a narrow loss of US$701,314 that will be recorded in the income statement throughout the life of the issuance.
Foreign exchange A foreign exchange loss of US$6.5 million was recorded in 2013, mainly as a result of realised exchange losses during the year of US$5.0 million related to accounts receivables denominated in pesos. This loss positively compared to the US$8.4 million loss recognised in 2012.
To hedge the purchase of equipment in currencies other than the US dollar, the Group carried out derivative transactions in euros and Swedish krona. In 2013, we purchased EUR 7.23 million at an average forward rate of US$1.3181/EUR with a result of US$0.05 million recognised in the income statement. The total purchased volume in Swedish krona was SEK 143.66 million at an average forward rate of 6.5065 SEK/USD generating a US$0.05 million gain recognised in the income statement. As of 31 December 2013, the outstanding position in euros was EUR 3.24 million and no position in Swedish krona.

101www.fresnilloplc.com Fresnillo plc | Annual report 2013
Fresnillo Today
Strategic Report
Corporate Governance
Financial Statements
Strategy
Performance
Exploration expenses: Business unit/project Exploration expenses
2013
Exploration expenses
2012
Capitalised expenses
2013
Capitalised expenses
2012
Ciénega 14.6 15.4
Fresnillo 10.7 9.4
Herradura 25.4 13.5
Soledad-Dipolos 4.9 10.6
Saucito 4.2 3.7
Noche Buena 21.5 22.2
San Ramón 10.0 10.8
San Julián 7.5 22.7 62.3
Orisyvo 15.5 19.5 3.6 1.2
New Herradura Corridor 4.2 5.8
Centauro Deep 37.4 33.1 7.7 8.1
San Juan 1.5 3.7
Lucerito 4.8 5.5
Candameña 2.5 4.6
Guachichil 4.3 7.4
Guanajuato 5.1 5.9
Peru 3.9 3.8
Manzanillas 0.1 2.8
Juanicipio 0.0 0.0 10.6 5.7
Others 29.6 33.1 3.6 8.0
Total 207.7 233.5 25.6 85.3
EBITDA 2013US$ million
2012US$ million
Change
Amount %
Gross profit 767.4 1,364.6 (597.2) (43.8)
+ Depreciation 239.3 243.8 (4.4) (1.8)
– Administrative expenses (62.2) (53.2) (9.0) 16.9
– Exploration expenses (207.8) (233.5) 25.8 (11.0)
– Selling expenses (7.0) (6.3) (0.6) 10.3
EBITDA 729.8 1,315.3 (585.5) (44.5)
EBITDA margin 45.2 61.0

102 Fresnillo plc | Annual report 2013 www.fresnilloplc.com
Financial Review continued
TaxationThe corporate income tax expense decreased by 62.3% to US$121.5 million as a result of the lower profits earned in 2013. However, the Group’s effective tax rate, excluding mining rights, was 29.0%, which is slightly below the statutory 30% tax rate. Deferred special mining rights of US$36.2 million were recorded in 2013, reflecting the fact that depreciation of assets cannot be deducted from earnings subject to t hese new duties.
Profit for the yearProfit for the year decreased by 69.5% to US$261.0 million due to the factors discussed above. Profits due to non-controlling interests of US$20.6 million decreased by 81.9% compared to 2012, due to the lower profits generated at Minera Penmont, where Newmont owns 44% of the outstanding shares. Accordingly, profit attributable to equity shareholders of the Group declined by 67.6% from US$741.2 million to US$240.4 million in 2013.
Excluding the adverse effects of the Silverstream Contract, profit for the year decreased by 61.2% from US$771.0 million to US$298.8 million. Similarly, profit attributable to equity shareholders of the Group, excluding the Silverstream effects, declined by 57.7% to US$278.2 million.
Cash flowA summary of the key items from the cash flow is set out below:
Cash generated by operations before changes in working capital decreased by 44.7% to US$750.2 million, mainly as a result of the lower profits generated at our mines, except for Saucito. Working capital decreased by US$34.5 million mainly due to a US$66.6 million decrease in trade and other receivables reflecting the lower precious metals prices and volumes of gold sold to Met-Mex. This was mitigated by: i) a US$13.5 million increase in inventories resulting mainly from operating materials and spare parts; ii) an increase in accounts payable mainly to suppliers of US$13.6 million; and iii) others, mainly insurance premium prepayments of US$4.9 million.
Taxes and employee profit sharing paid decreased by 34.0% over 2012 to US$338.6 million, as a result of the lower profits generated.
As a result of the above factors, net cash from operating activities of US$446.0 million decreased by 40.0% when compared to 2012.
In addition to cash generated by operations, the Group received proceeds totalling US$1,268.0 million, of which the most significant were: i) the issuance of US$800.0 million Senior Notes (US$789 million net of transaction costs); ii) the placement of 19,733,430 new Ordinary Shares equivalent to US$346.1 million to comply with the Listing Rules and remain in the FTSE 100; iii) the proceeds from the Silverstream Contract of US$63.8 million; and iv) loans totalling US$40.9 million granted by Newmont to Minera Penmont to cover fixed costs and compensate for cash not being generated by the operations whilst production was disrupted.
The Group purchased property, plant and equipment for a total of US$572.1 million, which represented an 8.5% increase over 2012. Capital expenditures for 2013 are further described on page 103.
Dividends paid to shareholders of the Group in 2013 totalled US$505.2 million, a 27.1% increase from 2012, mainly due to the early payment of a portion of the dividends anticipated to be payable in 2014. The total dividend payment in 2013 was as follows: i) the final 2012 dividend of US$304.1 million; ii) interim dividend of 2013 of US$36.1 million; and iii) the extraordinary dividend of US$165.0 million in anticipation of a portion of 2014 dividends.
The sources and uses of funds described above resulted in a net increase of US$637.0 million in cash and cash equivalents, which combined with the US$613.8 million balance at the beginning of the year and the US$0.9 million favourable effect of the exchange rate resulted in a cash position of US$1,251.7 million at the end of 2013.
Balance sheetFresnillo plc continued to maintain a solid financial position and gained a more balanced capital structure following the bond issuance completed in November 2013.
Cash and cash equivalents as of 31 December 2013 of US$1,251.7 million doubled compared to the cash position at year end 2012.
The change in the value of the Silverstream derivative from US$487.8 million at the beginning of the year to US$372.8 million as of 31 December 2013, reflects proceeds of US$60.9 million corresponding to 2013, (US$52.8 million in cash and US$8.1 million receivable) and the Silverstream effect in the income statement of US$54.0 million.
The net book value of property, plant and equipment was US$1,838.1 million at 31 December 2013, representing a 22.7% increase over 2012. The US$340.4 million increase was mainly explained by the purchase of additional in-mine equipment, the construction of the dynamic leaching plant, intensified stripping at the Herradura and Noche Buena mines and development works at the underground mines and at the San Julián project.
On November 2013, the Group completed the offering of US$800 million aggregate principal amount of 5.500% Senior Notes due 2023, which were recorded as long-term liability in the balance sheet.
The Group’s total equity was US$2,672.0 million as of 31 December 2013, a 2.3% increase compared to 2012 as a result of the placement of new shares, which was offset by the lower retained earnings.
DividendsFurther to the Company's announcement of 24 October 2013, Fresnillo paid an extraordinary dividend of US$165.0 million, equivalent to 22.39 US cents per share on 11 November 2013, which included dividend payments that shareholders may otherwise have expected to receive from dividends payable in 2014. In addition to this, Fresnillo paid an interim dividend of US$36.1 million, equivalent to 4.90 US cents per share on 10 September 2013. Fresnillo is pleased to recommend a special and one-off dividend of US$50.1 million, equivalent to 6.8 US cents per share.
This has been recommended by the Board of Fresnillo, reflecting their confidence in the strength of the balance sheet and in the Company’s capital expenditure plans for its development and exploration projects. As a consequence, the Board believes that it is appropriate to make a one-off distribution.
This distribution is incremental to Fresnillo’s existing dividend policy which remains in place, and takes into account the profitability of the business and underlying growth in earnings of the Fresnillo Group, as well as its capital requirements and cash flows.

103www.fresnilloplc.com Fresnillo plc | Annual report 2013
Fresnillo Today
Strategic Report
Corporate Governance
Financial Statements
Strategy
Performance
Cash flow summary – Key line items 2013US$ million
2012US$ million
Change
Amount US$ %
Cash generated by operations before changes in working capital 750.2 1,356.7 (606.6) (44.7)
(Increase)/decrease in working capital 34.5 (99.8) 134.3 N/A
Taxes and Employee Profit Sharing paid (338.6) (513.3) 174.6 (34.0)
Net cash from operating activities 446.0 743.7 (297.6) (40.0)
Senior notes, net of transaction costs 789.0 0.0 789.0 100.0
Placement of new Ordinary Shares (net of costs) 346.1 0.0 346.1 100.0
Silverstream contract 63.8 110.6 (46.8) (42.3)
Loans from partners 40.9 0.0 40.9 100.0
Capital contribution 4.9 3.7 1.2 33.5
Purchase of property, plant and equipment (572.1) (527.3) (44.9) 8.5
Dividends paid to shareholders of the Company (505.2) (397.6) 107.6 27.1
Dividends paid to non-controlling interest 0.0 (26.2) (26.2) N/A
Net increase/(decrease) in cash during the period before foreign exchange differences
637.0 (72.3) 709.3 N/A
Cash at 31 December 1,251.7 613.8 637.9 103.9
Purchase of property, plant and equipment 2013US$ million
Herradura mine Construction of dynamic leaching plant and leaching pads and stripping activities 129.7
Fresnillo mine Mine development and acquisition and replacement of in-mine equipment 61.3
Ciénega mine Development, replacement of in-mine equipment and purchase of equipment to optimise the milling process
59.3
Noche Buena Construction of leaching pads, stripping and improvements to the maintenance workshop 52.2
Saucito mine Development, mine work, construction of ramps and the Jarillas shaft and purchase of additional equipment
71.2
Soledad-Dipolos mine Construction of leaching pads, purchase of equipment and development activities 1.7
Bermejal Acquisition of equipment to lease to Herradura US$24.4 million, Soledad-Dipolos US$6.9 million and Noche Buena US$30.8 million; other US$0.4 million
83.8
San Julián Construction of ramps and mine work, purchase of equipment and acquisition of land 98.4
Juanicipio project Exploration expenses 9.5
Other Exploraciones Mineras Parreña and SAFSA 5.0
Total purchase of property, plant and equipment
572.1

104 Fresnillo plc | Annual report 2013 www.fresnilloplc.com
Chairman’s Letter of Governance 105
Corporate Governance Overview 106
– Board of Directors and Executive Committee 108
Corporate Governance Report 112
– Audit Committee Report 120
– Nominations Committee Report 130
Directors’ Remuneration Report 132
– Chairman’s Annual Statement 132
– Remuneration Policy 133
– Annual Report on Remuneration 139
Directors’ Report 144
Statement of Directors’ Responsibilities 147
The Centauro pit, one of the Group’s projects with attractive potential
Corporate Governance

105www.fresnilloplc.com Fresnillo plc | Annual report 2013
Fresnillo Today
Strategic Report
Corporate Governance
Financial Statements
Chairman’s Letter of Governance
“ …the commitment to our strategy and principles remains firm because we believe in their enduring capacity to create value whatever the circumstances.”
Dear Shareholder,In my Chairman’s Statement, I have already highlighted that the past 12 months have presented the Board with some new challenges. The environment in which Fresnillo plc operates has become a more difficult place for a variety of macro-economic and local reasons. Nevertheless, the commitment to our strategy and principles remains firm because we believe in their enduring capacity to create value whatever the circumstances.
Last year, I explained how I saw the evolution of the Company’s approach to corporate governance during the five years since Fresnillo plc listed on the London Stock Exchange. We have continued to make steady progress over the past 12 months, in line with our long-term perspective.
In the first half of the year, we fulfilled our commitment to bring the Company’s free float up to 25% via the placing of the requisite number of shares with an independent institutional shareholder. Having secured our status in the FTSE Index and in the Premium segment of the Main Market, we continue to assess the corporate governance expectations that come with that. As the London Stock Exchange develops its rules in 2014 for controlled companies such as ours, our current Relationship Agreement and approach to the appointment and re-election of independent Directors may need to be modified accordingly.
Following the appointment of Octavio Alvídrez as Chief Executive Officer in 2012, the Board has continued to support his approach to managing the business and taking it forward. The Executive Committee has been brought up to full strength with the appointment of Roberto Díaz as Chief Operating Officer. The HSECR Committee has been monitoring the maturity of the Group’s health and safety systems, which continue to improve. The fatalities in 2013 are evidence of further work to be done, but the trend is improving. The HSECR Committee has also increased its focus on community relations in light of the issues that arose in 2013; while isolated in their occurrence, these were material in terms of their impact on operations. Notwithstanding, this should not overshadow the effective partnerships we have forged across dozens of communities in Mexico and Peru, and the significant economic and social benefits they have delivered to date.
Continuing our theme of looking beyond the cycle, the Remuneration Committee has given much thought to our approach to executive remuneration in response to the new requirements on reporting. Our policy has been proven over many years and, as we have shown in our report this year, has the overwhelming support of our independent shareholders. Lord Cairns explains the rationale for our Remuneration Policy in his introductory letter to the Directors’ Remuneration Report. I fully support this policy and believe it is the most appropriate way to incentivise the Executive Committee and senior management to create and sustain value over the long term.
The Audit Committee has sought to ensure that our financial reporting continues to be based on sound policies and judgements. Their work in evaluating both external and internal auditors, using external assistance as part of that task, has been a useful validation of our approaches in these areas. The Audit Committee has also overseen the continued development of our risk management and anti-bribery and corruption programmes. In addition, they continue to develop their approach to overseeing the Company’s policies and procedures for managing related party transactions which will, I am sure, provide further reassurance that Fresnillo plc’s activities are being conducted in the interests of all shareholders.
Last year, we reported on the steps taken since our first external evaluation of the Fresnillo Board in 2011. We have continued to monitor progress against the plan then agreed by the Board and I am pleased that the 2013 evaluation exercise, facilitated by our Company Secretary, concluded that that plan has now been fully and satisfactorily implemented. We will build on that platform in 2014, when we intend to conduct our second externally facilitated Board evaluation exercise.
The Nominations Committee will continue to monitor the composition of the Board, mindful of the expectations of shareholders in regard to diversity matters. The overriding consideration will remain that the Board should be comprised of the Directors who individually and together provide the best leadership and oversight to the Company as it faces new challenges and opportunities. In keeping with our long-term perspective, the development of the Board will be evolutionary rather than revolutionary while always seeking to ensure that our governance is appropriate at every stage in the cycle and beyond.
Yours faithfully
Mr Alberto Baillères Chairman of the Board
Read more: Chairman’s Statement Page 8
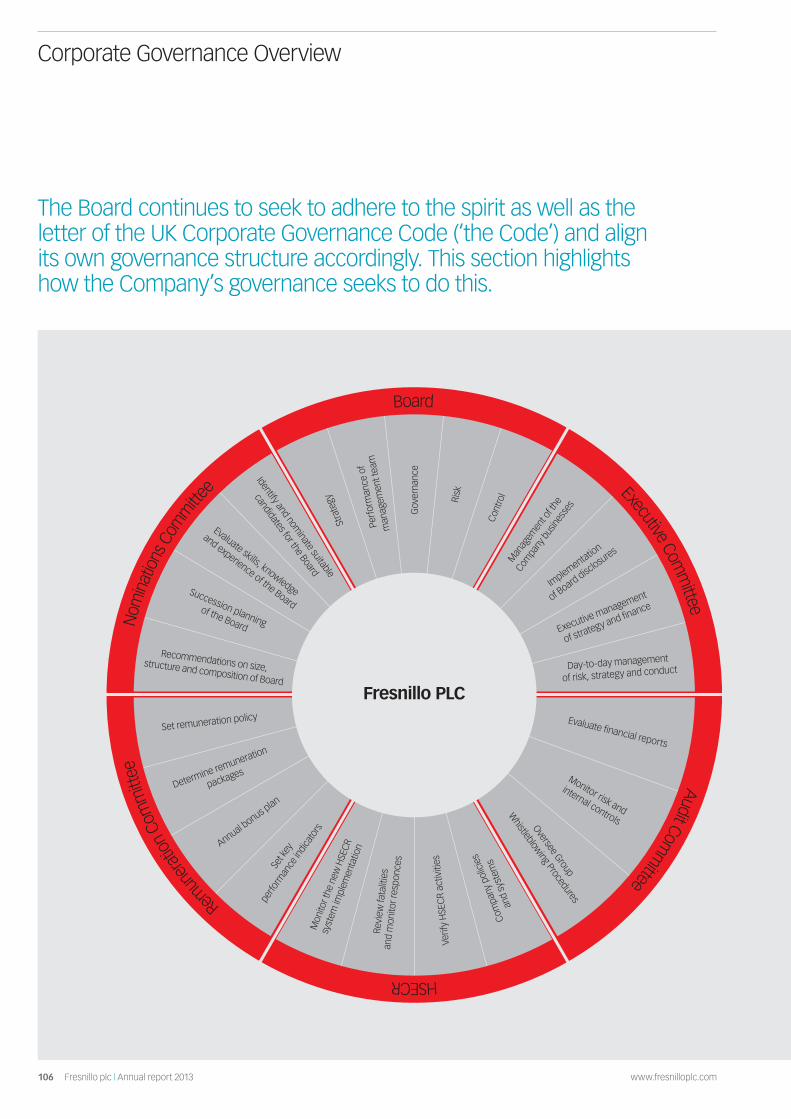
106 Fresnillo plc | Annual report 2013 www.fresnilloplc.com
Stra
tegy
Perf
orm
ance
of
man
agem
ent t
eam
Gov
erna
nce
Risk
Cont
rol
Man
agem
ent o
f the
Com
pany
bus
iness
es
Implementatio
n
of Board disc
losures
Executive management
of strategy and finance
Day-to-day management
of risk, strategy and conduct
Set k
ey
perfo
rman
ce in
dica
tors
Annual bonus p
lan
Determine remuneration
packages
Set remuneration policy
Recommendations on size, structure and composition of Board
Succession planning
of the Board
Evaluate skills, knowledge
and experience of the Board
Identify and nominate suitable
candidates for the Board
Com
pany
pol
icie
s
and
syst
ems
Verif
y H
SEC
R ac
tiviti
es
Revi
ew fa
talit
ies
and
mon
itor r
espo
nces
Mon
itor t
he n
ew H
SECR
syst
em im
plem
enta
tion
Evaluate financial reports
Monitor risk and
internal controlsOversee Group
Whistleblow
ing Procedures
Nom
inat
ions
Com
mitte
e
Remun
erat
ion C
omm
ittee
HSECR
Audit Comm
itteeExecutive Com
mittee
Board
Fresnillo PLC
Corporate Governance Overview
The Board continues to seek to adhere to the spirit as well as the letter of the UK Corporate Governance Code (‘the Code’) and align its own governance structure accordingly. This section highlights how the Company’s governance seeks to do this.

107www.fresnilloplc.com Fresnillo plc | Annual report 2013
Fresnillo Today
Strategic Report
Corporate Governance
Financial Statements
Board Executive Committee Audit CommitteeThe structure and business of the Board is designed to ensure that the Board focuses its time and energy on strategy, monitoring the performance of the management team, governance, risk and control issues. Certain aspects of the Board’s responsibilities have been delegated to appropriate committees to ensure compliance with the UK Companies Act, FCA Listing Rules and the UK Corporate Governance Code.
The principal business decisions required of the Board are set out in the Schedule of Matters reserved to the Board.
A Relationship Agreement determines those matters which require the approval of the independent Non-executive Directors.
The Executive Committee is responsible for the management of the Company’s businesses including the implementation of decisions agreed in principle by the Board and all executive management of the operations of the Group within the strategy and budget approved by the Board.
It has certain powers to approve smaller transactions on behalf of the Board. Key recent areas of focus have been risk management, safety performance and business conduct.
The Audit Committee is responsible for evaluating the Group’s financial reporting and making recommendations to the Board in respect of the approval of reports prior to release. It also monitors, on behalf of the Board, the Group’s risk management and internal control systems, as well as the activity of the Honour Commission in overseeing the Group’s Whistleblowing Procedures.
Internal Audit report on their programme and activity at each meeting of the Audit Committee. It also monitors the role of the external auditor, including any non-audit service that it provides.
Related party transactions are regularly reviewed by the Audit Committee.
Board biographies Pages 109-110 Executive Committee Page 111 biographies
The Audit Page 120 Committee Report
HSECR Committee Remuneration Committee Nominations CommitteeThe Health, Safety, Environment, Community Relations Committee evaluates the effectiveness of the Company’s policies and systems for identifying and managing HSECR matters within the Company’s operations.
The HSECR Committee reviews reports on all fatal accidents and monitors management responses. The HSECR Committee is currently monitoring progress on a project, in conjunction with PricewaterhouseCoopers to attain 100% maturity of the HSECR system by 2016.
The Remuneration Committee sets the Group’s remuneration policy for Executive Committee members, and determines the remuneration packages for senior management. The Remuneration Committee oversees the annual bonus plan for senior executives including setting Key Performance Indicators.
The Nominations Committee is responsible for making recommendations to the Board on the structure, size and composition of the Board and its committees and succession planning for the Directors and other senior executives. Before making appointments of new Directors, the Committee is responsible for evaluating the balance of skills, knowledge and experience on the Board and identifying and nominating suitable candidates.
The HSECR Committee Page 76 Chairman’s Report
The Remuneration Report Page 132 The Nominations Page 130 Committee Report
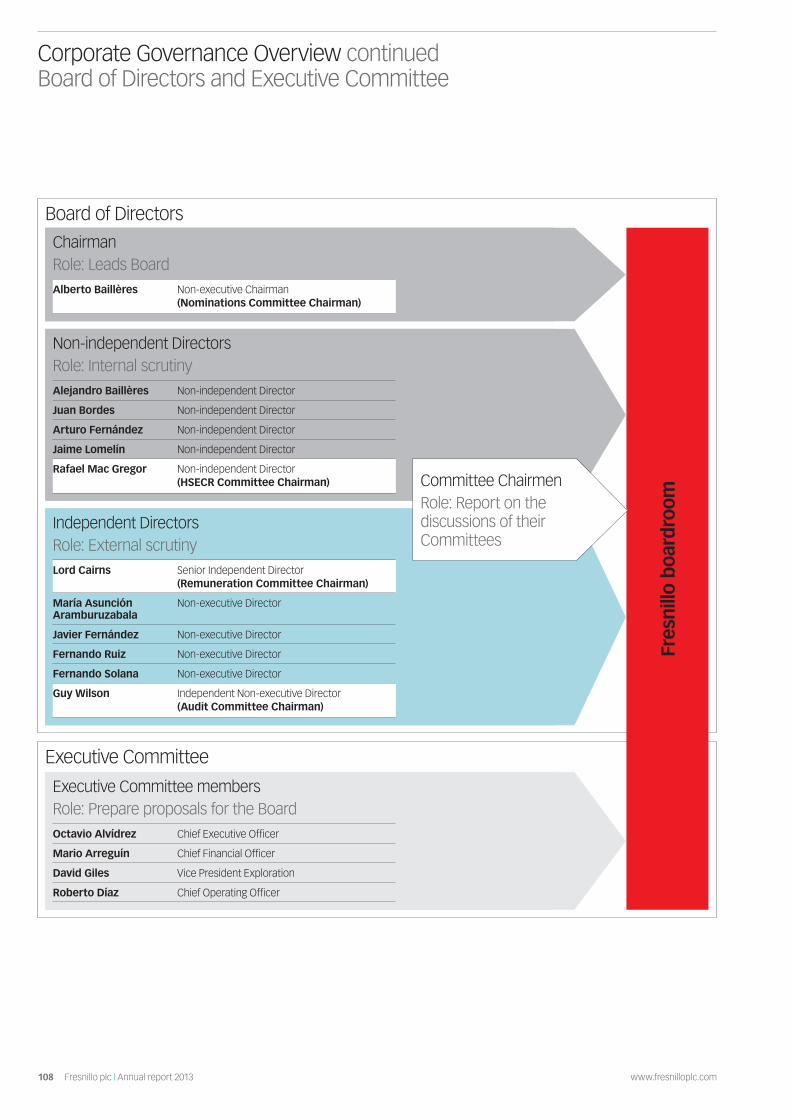
108 Fresnillo plc | Annual report 2013 www.fresnilloplc.com
Corporate Governance Overview continued Board of Directors and Executive Committee
Board of Directors
Non-independent DirectorsRole: Internal scrutinyAlejandro Baillères Non-independent Director
Juan Bordes Non-independent Director
Arturo Fernández Non-independent Director
Jaime Lomelín Non-independent Director
Rafael Mac Gregor Non-independent Director (HSECR Committee Chairman)
ChairmanRole: Leads BoardAlberto Baillères Non-executive Chairman
(Nominations Committee Chairman)
Independent DirectorsRole: External scrutinyLord Cairns Senior Independent Director
(Remuneration Committee Chairman)
María Asunción Aramburuzabala
Non-executive Director
Javier Fernández Non-executive Director
Fernando Ruiz Non-executive Director
Fernando Solana Non-executive Director
Guy Wilson Independent Non-executive Director(Audit Committee Chairman)
Executive Committee
Executive Committee membersRole: Prepare proposals for the BoardOctavio Alvídrez Chief Executive Officer
Mario Arreguín Chief Financial Officer
David Giles Vice President Exploration
Roberto Díaz Chief Operating Officer
Fres
nillo
boa
rdro
om
Committee ChairmenRole: Report on the discussions of their Committees
109www.fresnilloplc.com Fresnillo plc | Annual report 2013
Fresnillo Today
Strategic Report
Corporate Governance
Financial Statements
Alberto Baillères Lord Cairns María Asunción Aramburuzabala
Javier Fernández
Non-executive Chairman Senior independent Non-executive Director
Independent non-executive Director
Independent non-executive Director
Date of appointment: Date of appointment: Date of appointment: Date of appointment:15 April 2008 15 April 2008 16 April 2012 15 April 2008
Committee: Committee: Committee: – Nominations Committee
(Chairman) – Remuneration Committee
– Remuneration Committee (Chairman)
– Nominations Committee
– HSECR Committee
Experience and key strengths: Experience and key strengths: Experience and key strengths: Experience and key strengths:Mr Baillères has extensive experience and knowledge of both the Group and the Mexican markets in which it operates and has overseen the development of both the Fresnillo Group, and its associated companies that provide essential services to the Group, from both the investor and the supervisory perspectives.
Lord Cairns brings a macro-economic perspective to the Board’s discussions, which is supplemented by his career as an investment banker in London. He is able to provide an informed view of institutional investor attitudes and issues. His wide international experience and connections enable him to contribute a supra-governmental view to the Board’s discussions.
Ms Aramburuzabala brings experience of a broad range of Mexican and international business to her role.
Through his wide-ranging commercial experience, both at a Mexican and international level and across a variety of industrial and services sectors, Mr Fernández contributes a deep and independent business perspective to the Board’s discussions.
Fernando Ruiz Fernando Solana Guy WilsonIndependent non-executive Director
Independent non-executive Director
Independent non-executive Director
Date of appointment: Date of appointment: Date of appointment:15 April 2008 19 February 2009 1 July 2008
Committee: Committee: Committee: – Audit Committee – Nominations Committee – Remuneration Committee
– Audit Committee – Audit Committee (Chairman)
Experience and key strengths: Experience and key strengths: Experience and key strengths:Mr Ruiz contributes to the Board and Audit Committee proceedings through experience of international audit and accounting frameworks and a specialist knowledge of Mexican tax.
Mr Solana’s extensive experience and connections within the political, banking and diplomatic arenas enables him to contribute to these aspects of strategic analysis at Board level. He is able to provide insight into the domestic political and regulatory framework within Mexico.
Mr Wilson’s distinguished career within a global audit firm and his experience of capital transactions and corporate actions provide the Board with an important international audit and accountancy perspective.
Chairman and independent Directors
110 Fresnillo plc | Annual report 2013 www.fresnilloplc.com
Corporate Governance Overview continued Board of Directors and Executive Committee Non-independent Directors
Alejandro Baillères Juan Bordes Arturo FernándezNon-executive Director Non-executive Director Non-executive Director
Date of appointment: Date of appointment: Date of appointment:16 April 2012 15 April 2008 15 April 2008
Experience and key strengths: Experience and key strengths: Experience and key strengths:Mr Baillères brings experience of a broad range of Mexican and international business to his role.
Mr Bordes brings to the Board practical and extensive cross-sector business experience, including within financial services.
Mr Fernández’ economics background, as well as his experience and connections within the Mexican public policy arena provide the Board with commercial input and the macro-economic perspective.
Rafael Mac Gregor Jaime LomelínNon-executive Director Non-executive Director
Date of appointment: Date of appointment:15 April 2008 15 April 2008
Committee: Committee: – HSECR Committee (Chairman) – HSECR Committee
Experience and key strengths: Experience and key strengths:Mr Mac Gregor has wide-ranging commercial experience across a number of sectors, including institutional financial services and the Mexican Stock Exchange.
Mr Lomelín brings to the Board an invaluable wealth of senior operational experience in the fields of mining and engineering.

111www.fresnilloplc.com Fresnillo plc | Annual report 2013
Fresnillo Today
Strategic Report
Corporate Governance
Financial Statements
Octavio Alvídrez Mario Arreguín David Giles Roberto DíazChief Executive Officer Chief Financial Officer Vice President, Exploration Chief Operating Officer
Date of appointment: Date of appointment: Date of appointment: Date of appointment:15 August 2012 15 April 2008 15 April 2008 1 November 2013
Experience and key strengths: Experience and key strengths: Experience and key strengths: Experience and key strengths:Mr Alvídrez has extensive experience within the mining industry and prior to being appointed Chief Executive Officer of Fresnillo plc was General Manager of the Madero mine, one of Mexico’s largest mines operated by Peñoles. Mr Alvídrez joined the Peñoles Group in August 1988. Since then he has held a number of senior operational and financial positions across Peñoles and Fresnillo, including that of Treasurer, Head of Investor Relations in London and Head of Procurement. He is a graduate of the Universidad de Guanajuato (Mexico), where he gained a degree in Mining Engineering, and holds an MBA from The Wharton School (US).
Mr Alvídrez is invited to attend Board, HSECR Committee and Remuneration Committee meetings.
Mr Arreguín joined Fresnillo plc from Industrias Peñoles, where he was Chief Financial Officer for 11 years and Group Treasurer for the six years prior. Before joining Peñoles, Mr Arreguín worked in investment banking at Valores Finamex and Project Management at Dupont México. Mr Arreguín holds a bachelor of chemical engineering degree with honours and received his MBA from the University of Chicago. He also completed the Stanford Executive Program at Stanford University.
Mr Arreguín is invited to attend Board and Audit Committee meetings.
Mr Giles was previously employed by Peñoles where he worked for 30 years and had undertaken a number of senior management positions including Vice President of Exploration. Before joining Peñoles, he worked for AMAX, Corona Gold and Tormex. Mr Giles has a bachelor of applied science and engineering degree in geology from the University of Toronto, and holds an MBA from ITESM University in Mexico. He is an officer of the Society of Economic Geologists and the Mexican Association of Mining, Metallurgical and Geological Engineers.
Mr Giles is invited to attend Board meetings.
Following a long career in the mining industry. Mr Díaz first joined Peñoles in 1977 and, following roles with other groups, rejoined Peñoles in 2007. He has previously served as Fresnillo’s Vice President of Operations and Vice President of Project Development. He holds degrees in mining engineering from the University of Guanajuato and the Colorado School of Mines, as well as MBAs from ITAM (Mexico City), and Tulane University (USA).
Mr Díaz is invited to attend Board meetings.
Executive Committee

112 Fresnillo plc | Annual report 2013 www.fresnilloplc.com
Corporate Governance Report
Fresnillo plc Board
Audit Committee
– Financial assurance – Risk/Controls assurance
Nominations Committee
– Board appointments – Succession planning
Executive Committee
– Operational expenditure – Approval of smaller transactions
– Implementation of strategy
– Operational and financial management
– Day-to-day management of risk
Honour Commission
– Whistleblowing cases – Implementation of anti-bribery and corruption policies and procedures
HSECR Committee
– Monitoring HSECR activity
– Sustainability monitoring
Remuneration Committee
– Directors’ remuneration – Incentivisation and retention
– Strategy and oversight – Strategic investments
– Financial reporting – Related party activity (only independent Directors)
– Corporate governance – Key policies and ethics
Fresnillo governance structure and key responsibilities
113www.fresnilloplc.com Fresnillo plc | Annual report 2013
Fresnillo Today
Strategic Report
Corporate Governance
Financial Statements
UK Corporate Governance Code Compliance StatementAs a company with a Premium Listing on the London Stock Exchange, Fresnillo is required under the FCA Listing Rules to comply with the Provisions of the 2012 UK Corporate Governance Code (a copy of which may be found on the website of the Financial Reporting Council www.frc.org.uk) or explain its reasons for non-compliance, in respect of the year ended 31 December 2013. The following statement is therefore made in compliance with such requirement, and the sections thereafter explain how the principles in the Code were applied and provide cross-references to other sections where more detailed description is available.
The Code establishes 18 main principles of good governance in five areas: Leadership, Effectiveness, Accountability, Remuneration and Relations with Shareholders. The remainder of this report; the section on Risk Management (which can be found on pages 42-53); the Sustainability Report (which can be found on pages 76-91) and the Directors’ Remuneration Report (which can be found on pages 132-143) provides further detail on how the Company applies good governance in these five areas.
For the financial year ended 31 December 2013, the Company has complied with the provisions of the Code in all these areas, save in respect of D.2.1, which provides that the Board should establish a remuneration committee of at least three independent Non-executive Directors. The composition of the Fresnillo Remuneration Committee is made up of three members including two independent Non-executive Directors one of whom, Lord Cairns, is the Chairman of the Committee. The Chairman of the Company, Mr Baillères, who was not independent at the time of his appointment, is also a member. The Board believes that Mr Baillères’ experience and knowledge of the Group and the Mexican market and his considerable contribution to the Remuneration Committee’s deliberations justifies his membership of the Remuneration Committee. Mr Baillères is not involved in matters concerning his own remuneration.
Fresnillo governance structure The Board structureThe structure and business of the Board is designed to ensure that the Board focuses its time and energy on strategy, monitoring the performance of the management team, governance, risk and control issues. Certain aspects of the Board’s responsibilities have been delegated to appropriate committees to ensure compliance with the UK Companies Act, FCA Listing Rules and the Code.
The Board has delegated certain authorities to the following committees to facilitate the routine business of the Company:
– Audit Committee
– Executive Committee
– Health, Safety, Environment and Community Relations (HSECR) Committee
– Nominations Committee
– Remuneration Committee
The terms of reference for each of the Audit, Remuneration, Nominations and Health, Safety, Environment and Community Relations Committees are available on the Company’s website (www.fresnilloplc.com).
Detailed reports on the activities of the Audit Committee and the Nominations Committee are set out in this Report on pages 120 and 130 respectively.
The Executive Committee is led by the Chief Executive Officer and consists of the most senior executives within the Fresnillo Group. It is responsible for the management of the Company’s businesses including the implementation of decisions agreed in principle by the Board and all executive management of the operations of the Group within the strategy and budget approved by the Board. It has certain powers to approve smaller transactions on behalf of the Board (such transactions are reported and explained to the Board at its next scheduled meeting). Over the past few years, the role of the Executive Committee has evolved in three main areas:
– Risk: It is also responsible for the identification, prioritisation and management of risk within a framework monitored regularly by the Board
– Business conduct: Members of the Executive Committee also serve on the Honour Commission which has, over the past three years, taken on a key role in maintaining ethical business standards within the Fresnillo Group. The terms of reference and membership of the Honour Commission are set by the Executive Committee
– Safety performance: Whilst the HSECR Committee oversees health and safety issues on behalf of the Board, the Executive Committee is responsible for the day-to-day management of safety. Whilst the Group’s fatality record has improved, the Executive Committee continues to focus its attention on this issue
114 Fresnillo plc | Annual report 2013 www.fresnilloplc.com
Corporate Governance Report continued
The HSECR Committee evaluates the effectiveness of the Company’s policies and systems for identifying and managing HSECR matters within the Company’s operations. As such, management reports to the HSECR Committee on such matters. The members of the HSECR Committee are Rafael Mac Gregor (Chairman of the Committee), Javier Fernández and Jaime Lomelín. Meetings are also attended by various operational and unit managers. The letter from the Chairman of the HSECR Committee on page 76 sets out the activities of the HSECR Committee during the year.
The Report of the Remuneration Committee (the Directors’ Remuneration Report) sets out the responsibilities and activities of the Remuneration Committee during the year and can be found on pages 132-143.
Board composition and independenceBoard membership As at 31 December 2013, the Board consisted of 12 Directors – the non-executive Chairman, Alberto Baillères, six independent Non-executive Directors and five non-independent Non-executive Directors. Details about the current Directors of the Company and summaries of the experience and perspective that they bring to the Board are set out on pages 109 and 110.
Board balance and rolesThe composition of the Board has been structured to ensure that no one individual can dominate the decision-making processes of the Board. The Chairman, Mr Baillères, is beneficially interested in more than 50% of the share capital of the Company through his interest in Industrias Peñoles S.A.B de C.V (‘Peñoles’), the Company’s controlling shareholder. Mr Baillères is also the Chairman of Peñoles and other companies within the BAL Group.
Peñoles has entered into a relationship agreement with the Company which ensures that decisions in relation to transactions with Peñoles must be taken by the independent Non-executive Directors of the Company. The key provisions of the Relationship Agreement are summarised later in this section.
The Chairman is responsible for the leadership of the Board and ensuring its effectiveness as to all aspects of its role.
The separate roles of Chairman and of the Chief Executive Officer are recognised and the requirements for these roles have been specified in writing and agreed by the Board in the Statement of Responsibilities. Octavio Alvídrez, the Chief Executive Officer, is not currently a member of the Board.
The Senior Independent Director, Lord Cairns, is available to shareholders if they have concerns that have not been resolved through the normal channels of Chairman, Chief Executive Officer, Chief Financial Officer or Head of Investor Relations.
Board IndependenceThe Board consists of 12 Non-executive Directors. Six are considered to be non-independent and six are considered to be independent; as follows:
Non-independent Independent
Alberto Baillères (Chairman and Chairman of Nominations Committee)
Lord Cairns (Senior Independent Director and Chair of Remuneration Committee)
Alejandro Baillères María Asunción Aramburuzabala
Juan Bordes Javier Fernández
Arturo Fernández Fernando Ruiz
Rafael Mac Gregor (Chair of HSECR Committee)
Fernando Solana
Jaime Lomelín Guy Wilson (Chair of Audit Committee)
The Board considers María Asunción Aramburuzabala, Lord Cairns, Javier Fernández, Fernando Ruiz, Fernando Solana, and Guy Wilson to be independent in character and judgement. For each of these Directors, their circumstances are assessed by reference to Provision B.1.1. of the Code and the Board remains satisfied that they are each independent when the scenarios set out in Code Provision B.1.1 are taken into account.
The non-independent Directors listed above have been appointed to the Board by Peñoles pursuant to the Relationship Agreement. Thus, the Chairman was not independent at the time of his appointment. However, Mr Baillères has been responsible for overseeing the successful development of the Fresnillo Group over many years and, therefore, the Board considers that his continued involvement as its non-executive Chairman is very important to the Company.
The Relationship Agreement continues to provide a transparent governance system, which ensures that the Company benefits from Mr Baillères’ leadership and experience whilst being able to demonstrate to other shareholders that the Fresnillo Group is capable of carrying on its business independently. In particular, the Relationship Agreement ensures that transactions and relationships between the Fresnillo Group and its major shareholder are at arm’s length and on competitive commercial terms. Since that time, the Board has sought to build on that system. Thus the duties of the Audit Committee have since been expanded to ensure that financial aspects of related party transactions are reviewed by that committee.
Fernando Ruiz has, since 2008, been a retired partner and consultant in the firm Chevez, Ruiz, Zamarripa y Cia., S.C., a firm providing professional services to the Company. Guy Wilson retired as a partner of Ernst & Young LLP, the Company’s auditors, in 2008. Mr Wilson was not involved in the provision of audit or any other services to the Company by Ernst & Young LLP prior to his retirement.

115www.fresnilloplc.com Fresnillo plc | Annual report 2013
Fresnillo Today
Strategic Report
Corporate Governance
Financial Statements
Related party governance in practiceThere are a number of checks and balances which will ensure that there is full transparency in the way that related party transactions are dealt with by the Board.
Relationship AgreementThe Company continues to have a relationship agreement in place between Peñoles and the Company to regulate the ongoing relationship between them. The principal purpose of the Relationship Agreement is to ensure that the Fresnillo Group is capable of carrying on its business independently of the Peñoles Group, and that transactions and relationships with the Peñoles Group are at arm’s length and on normal commercial terms.
Peñoles has also undertaken not to exercise its voting rights to amend the Memorandum and Articles of Association in a way which would be inconsistent with the provisions of the agreement. It has also agreed to abstain from voting on any resolution to approve a ‘related party transaction’ (as defined in paragraph 11.1.5 R of the Listing Rules) involving any member of the Peñoles Group.
The process by which the Relationship Agreement has been implemented has been developed as specific issues have been addressed by the Board and the independent Directors under the terms of the Relationship Agreement; the current arrangements are summarised below.
The following diagram summarises the approach taken to identify and manage related party transactions:
Ongoing monitoring of Directors’ interests provides the information to determine if a related party approval is required for a proposed transaction
Proposed transaction
Contract negotiation and verification
The Executive Committee will seek to ensure that the best possible terms are achieved for a proposed transaction and that they are verified by industry benchmarking reports or independent valuation/assessment
Fresnillo management and Executive Committee
Monitoring of Directors’ interests
If a Director is interested in a company which could potentially enter into transactions with a Fresnillo plc Group company, the Board will normally consider that interest under its arrangements for authorising conflicts of interest under s175 of Companies Act
Directors
Financial scrutiny
The Audit Committee reviews the key terms of major transactions which are verified as to price and quality with external consultants where possible. For example, a proposal for Peñoles to undertake supplier due diligence work as an additional service under the Shared Services Agreement was also approved in 2013
Audit Committee Review
Independent Director approval
Under the Relationship Agreement, the independent Directors must approve any transaction without the non-independent Directors voting. For example, the renewal of the Met-Mex contract was approved by the independent Directors in 2013
Independent Directors
Process
Process
How this is managed
How this is managed
Responsibility
Responsibility
Managing a related party transaction
Identifying Director’s interests

116 Fresnillo plc | Annual report 2013 www.fresnilloplc.com
Corporate Governance Report continued
Conflicts of interests The duties to avoid potential conflicts and to disclose such situations for authorisation by the Board are the personal responsibility of each Director. Each Director ensures that he/she keeps these duties under review and informs the Company Secretary on an ongoing basis of any change in their respective positions, such as new directorships taken on.
Each Director has completed a ‘Directors List’ which sets out details of situations where each Director’s interests may conflict with those of the Company (‘situational conflicts’). The Directors Lists have been resubmitted by each Director as at 31 December 2013 and the Board has considered and authorised any new situational conflicts identified in these re-submitted lists. In addition, Directors are reminded at the beginning of each Board meeting to notify the Board of any further conflicts of interest in accordance with sections 175, 177 and 182 of the Companies Act 2006.
Board process The primary objective of the Board is to take responsibility for the Group’s long-term objectives and commercial strategy and to monitor the management of the Group’s activities. The Board also provides leadership to the Fresnillo Group in establishing the values by which it will conduct its business. During the year more time has been allocated to presenting and discussing aspects of strategy as part of the normal agenda for each Board meeting. There is a formal schedule of matters reserved for the Board’s decision which includes approvals of major expenditure and investments and key policies. This schedule was last revised in April 2011.
A table of attendance of members of the Board and Board committees at meetings during the financial year ended 31 December 2013 is set out below. All meetings of the Board are held in Mexico.
The Company Secretary is responsible for preparing a draft agenda for each Board meeting in conjunction with the Chief Executive Officer and the Chief Financial Officer. The Chairman approves the final version of the agenda. Papers are usually circulated about five days before the Board meeting concerned to give the Board sufficient time to consider the papers prior to the meeting.
Members of the Executive Committee are responsible for preparing papers in respect of strategic planning, policies and investment proposals for each Board meeting. All proposals presented to the Board for its consideration under the Schedule of Reserved Matters are first considered and approved by the Executive Committee. In so doing, the Executive Committee aims to ensure that any such proposals take into consideration those factors set out in section 172 of the Companies Act 2006. Matters that purely require Executive Committee approval are reported to the Board.
Led by the Chief Executive Officer, members of the Executive Committee attend all of the Board meetings and present all of the papers on operational and financial matters. The only discussions which members of the Executive Committee are not present for are discussions about management succession and the annual Board evaluation report discussion.
The Directors may raise concerns at meetings of the Board and, if necessary, ask for such concerns to be recorded in the Board minutes. Directors also have access to the advice and services of the Company Secretary (whose appointment and removal is a matter reserved for the Board). A procedure has been established to enable Directors to obtain independent professional advice at the Company’s expense in relevant circumstances.
Board programme in 2013The Board meets at least four times a year and has an established programme of meetings. A key feature of the Board’s evaluation discussions since the Company was formed has been a desire to focus more time on strategy during the Board discussions. Thus, as well as the functions that it is required to perform as part of its annual cycle of activity, the Board now allocates time at each of its scheduled meetings to strategic issues and discussion. As a consequence, the key business of the Board at each of its main scheduled meetings this year was:
Meeting/ Key activity
Regular activity and approvals
Strategy presentation
March Approval of 2012 Results and Annual Report
Precious Metals Market
April Board Lunch and Strategy Discussion Free Float and Placing
Growth Strategy
July Approval of Interim Results, Exploration Budget and Forward Programme
Sustainable Development and People Strategies
October Approval of 2014 Business Plan and Budget Extraordinary Dividend, Senior Notes Offering, Group Restructuring
Financial Strategy, People Strategies and Organisational Culture Work Plan
The Board has received regular updates at its meetings regarding the litigation pertaining to the Ejido El Bajio agrarian community, where one of Minera Penmont’s mining operations is located and management will continue to report to the Board on this issue until its conclusion. The Board has commenced reviewing the Company’s risks in relation to all its land rights (as a result of the Ejido El Bajio litigation), mining regulations, tax reform and security.
Between Board meetings Directors are provided with information on important developments and issues e.g. reports on fatalities.
117www.fresnilloplc.com Fresnillo plc | Annual report 2013
Fresnillo Today
Strategic Report
Corporate Governance
Financial Statements
Board development Following recommendations made during the 2013 Board Evaluation exercise (‘the 2013 Board Evaluation’), a number of initiatives have been further developed to give the Non-executive Directors more information about the broader context to the Company’s activities. These included:
– Case study presentations by senior managers; and
– Regular distribution of industry briefings on technical, market and sector issues
Directors are encouraged to visit the Company’s mines to familiarise themselves with the Fresnillo Group’s operations.
All Directors have received briefings from the Company’s advisers, including presentations to familiarise them with their duties and responsibilities as Directors of a UK listed company. The Chairman ensures that the induction and training processes for new Directors continues to be developed.
Board performance evaluationThe Board recognises that sound governance has a role to play in securing strategic success and strong performance as well as in protecting the interests of its shareholders. Given the Company’s particular ownership structure, the Board has, during the Company’s short history as a UK listed company, sought to use its annual Board evaluation exercise to develop and improve its effectiveness. The Board is determined to make sure that it is working effectively to the long-term benefit of all shareholders and recognises the role the Directors collectively have to play in maintaining this focus.
In 2011, the Board appointed Independent Audit Limited (‘IAL’) to undertake the first externally facilitated independent review of Board effectiveness. Following the presentation of the recommendations that IAL made as a result of that process (the ‘IAL Recommendations’), the Chairman consulted with Directors and management and presented a proposed action plan (the ‘2012 Action Plan’) in response to those recommendations which was endorsed by the Board.
The Board agreed in July 2013 that its Board Evaluation exercise in 2013 would ensure that Board members were satisfied that the 2012 Action Plan remained appropriate and continued to be properly implemented. Thus, the 2013 Board Evaluation was conducted using an in-house questionnaire-based approach and was facilitated by the Company Secretary. This exercise demonstrated that there was a strong endorsement of the on going effectiveness of the 2012 Action Plan and that the benefits of its implementation continued to be seen. It was also highlighted that a number of points arising from the 2011 exercise which were not fully implemented at the time of the 2012 review had now been fully implemented. The key elements of the subsequent actions taken during 2013 are set out below.
The following table summarises the key findings of the 2013 Board Evaluation reviews.
The arrangements for expanding the learning culture of the Board through industry updates and examples from other companies
Information on precious metals mining industry trends are now regularly circulated to Directors by senior management. Presentations on mining trends was presented at the March 2013 meeting and case studies from other listed mining companies were presented at the April 2013 meeting.
Report to the full Board the detailed results of investigations into fatalities
The Chief Executive Officer has circulated such reports for all of the fatalities and serious accidents in 2012 and 2013. An in-depth discussion of the two fatalities in 2013 was undertaken at the July 2013 Board meeting.
Reporting on risk The risk governance project has been embedded in the Board’s programme. Key Risk Indicators have been developed. Risk governance is now a standard agenda item for every Board meeting and the Board reviews the status of the Principal Risks and Uncertainties as part of that process.
A full externally facilitated Board evaluation exercise will be undertaken in 2014.
Committee evaluation reviewsIn 2013, each of the Board Committees reviewed its own performance and the adequacy of its terms of reference as they do annually. The committees concluded that their current terms of reference did not require amending. The number of meetings held, the adequacy of agenda materials presented and the scope of the individual committees in terms of any changes to legislation were all considered as part of these reviews.
Individual performance reviewsThe Chairman meets with the Non-executive Directors informally from time to time without the executives present. These meetings provide an opportunity for the Chairman to ensure that the Non-executive Directors’ training and development needs are being satisfied. The independent Non-executive Directors met to evaluate the performance of the Chairman in October 2013 following which the Senior Independent Director discussed the views of the independent Directors with the Chairman.

118 Fresnillo plc | Annual report 2013 www.fresnilloplc.com
Corporate Governance Report continued
Board and Committee meeting attendance
BoardAudit
CommitteeHSECR
CommitteeNominations
CommitteeRemuneration
Committee Comments
No. of meetings in year 4 5 2 2 4
Alberto Baillères 4/4 – – 2/2 4/4
María Asunción Aramburuzabala
3/4 – – – – María Asunción Aramburuzabala was unable to attend a meeting due to other business commitments
Alejandro Baillères 4/4 – – – –
Juan Bordes 4/4 – – – –
Lord Cairns 4/4 – – – 4/4
Arturo Fernández 4/4 – – – –
Javier Fernández 3/4 – 2/2 2/2 – Javier Fernández was unable to attend a meeting due to other business commitments
Jaime Lomelín 4/4 – 2/2 – –
Rafael Mac Gregor 4/4 – 2/2 – –
Fernando Ruiz 3/4 4/5 _ 1/2 3/4 Fernando Ruiz was unable to attend meetings due to holiday
Fernando Solana 4/4 5/5 – – –
Guy Wilson 4/4 5/5 – – –
The Executive Committee is an integral part of the Fresnillo boardroom and members are required to attend Board meetings. As such, the attendance of the Executive Committee members is listed below:
Executive Committee Board meeting attendanceOctavio Alvidrez 4/4
Mario Arreguin 4/4
David Giles 4/4
Roberto Díaz* 1/1
*Roberto Díaz was only eligible to attend one meeting

119www.fresnilloplc.com Fresnillo plc | Annual report 2013
Fresnillo Today
Strategic Report
Corporate Governance
Financial Statements
Relations with shareholders The Board seeks to ensure that the interests of minority shareholders in the Company are properly respected and aligned with those of major shareholders. As described on page 115, the Board maintains procedures for dealing with transactions with Related Parties as well as Directors’ conflicts of interest.
The Company has an office in London where the Head of Investor Relations is based. The Group has implemented a strong communications and investor relations programme and aims to meet major shareholders and analysts at least twice a year to discuss the results of the Group and to respond to any queries the shareholders may have. The Head of Investor Relations in London maintains ongoing relations with analysts and major shareholders through telephone calls and meetings. The Company also uses a full programme of mining conferences to meet with current and prospective investors. Contact with investors in Mexico is maintained through the Investor Relations Office in Mexico City. The Chief Executive Officer and Chief Financial Officer participate in the major roadshows to meet with analysts and shareholders. They are joined by other members of the Executive Committee for some of these visits. The Head of Investor Relations, supported by the Chief Executive Officer, gives a report at each Board meeting on communications and shareholder activity.
The principal investor relations and communications activities during 2013 are shown below.
The Company continues to recognise the value of being a member of the FTSE 100 Index and therefore on 3 May 2013, 19,733,430 new ordinary shares of US$0.50 each were admitted for trading on the London Stock Exchange to ensure that the Company was and remains compliant with the UK Listing Rules requiring constituents to maintain a minimum free float of 25%.
The Company’s sixth annual general meeting will be held on Friday 16 May 2014 at 12.00 noon. The business of the Annual General Meeting (‘AGM’) will be conducted in accordance with the provisions B.7.1, B.7.2, E.2.1 and E.2.2 of the Code. The Chairman of the Board and the chairmen of each of the Board committees will be available to answer questions put forward to them by shareholders of the Company. The Annual Report and Accounts and the Notice of the Annual General Meeting will be sent to shareholders at least 20 working days prior to the date of the meeting.
In planning the business of each AGM, the Board takes account of institutional shareholder guidelines on pre-emption rights, share buy-backs and shareholder rights in relation to general meetings when drafting the usual resolutions dealing with those matters. In each case, resolutions are presented to the AGM to give the Board flexibility to respond to market developments.
2013
January
February
March
April
May
June
July
August
September
October
November
December
Investor Relations
Conference calls following the Production Results announcement
Roadshows following the Preliminary Announcement in the UK, USA and Canada
Conference calls following the Production Report
Site visits
Interim Results roadshows in the UK
Conference calls following the Production Results announcement
Major Industry Conference and Briefings
BAML Global Metals & Mining Conference
Denver Gold Forum, Credit Suisse Global Steel and Mining Conference
LME Week
UBS Reverse Roadshow
RBC Annual Silver ConferenceExploration day
Investor relation programme

120 Fresnillo plc | Annual report 2013 www.fresnilloplc.com
Corporate Governance Report continued Audit Committee Report
Guy Wilson Chairman of the Audit Committee
Read more: The risk management framework Page 42
“ Last year, I outlined five priorities for your Audit Committee in 2013. I now report on our progress so far.”
Dear Shareholder,Our primary task is the oversight of the financial accounting and reporting of your company.
With respect to the financial statements, the Financial Reporting Council (‘FRC’) reviewed our 2012 Annual Report under their duty to review periodically those of all UK listed companies. I am pleased to tell you that the FRC informed us that it had no significant findings but had only minor comments on two areas where it considered the accounting policy wording could be more transparent. We have addressed these two areas in this Annual Report. For 2013, we have held discussions with management and Ernst & Young and reviewed several drafts of the Annual Report. Based on this process, inter alia, we have advised the Board that, in our opinion, the 2013 Annual Report is fair, balanced and understandable.
Last year, I outlined five priorities for your Audit Committee in 2013 in addition to our primary task of the oversight of financial accounting and reporting together with internal controls, concentrating on the financial judgements in the financial statements. I now report on our progress so far.
The risk management framework has evolved further this year through the development of relevant key risk indicators (‘KRIs’) against our identified risks, mitigating actions and controls. Most of the data required to assist the evaluation of KRIs for regular reporting is in place but some data requires further refinement. Where the reporting of KRIs can be determined now, they are proving an important management tool in the pursuit of operational control of risk, albeit further work is required to enhance the predictive qualities of certain indicators.
Following the constructive independent evaluation of Internal Audit in 2012, there has been a realignment of their focus onto controls surrounding the major operating risks across the operating divisions which has greatly improved the quality of comparative observations between the different mining operations. We continue to monitor the embedding of robust third party contractor processes which is now well advanced and is described in detail later in this report. During 2013, the Committee assessed the effectiveness of the Internal Audit function through both its regular dialogue and discussion of reports as well as a review of progress against action plans following the previous year’s review. An independent check on progress is planned for 2014.
In 2013, we obtained an independent external evaluation of Ernst & Young, who have been our external auditors since the IPO in 2008. We are pleased to report that the overall findings were positive and the auditors are in the process of working with management to evaluate a number of suggestions for enhancement. Following the favourable results of the evaluation, we do not envisage tendering the external audit until after the 2016 AGM.
With a major shareholder, we must ensure that all related party transactions are at arm’s length and on commercial terms that are reasonable for all our shareholders. The three major such arrangements, namely the shared services agreement, the Silverstream contract and the sales arrangement with Met-Mex, a subsidiary of Peñoles, are discussed in the following report. This year we have extended our review process to ensure that all other related party transactions of significant size, whether individually or in aggregate, are benchmarked against alternative external suppliers.
For 2014, we assess our priorities as follows:
– Continuing to monitor the development of the data required to produce accurate KRIs on a timely basis and encourage management to establish KRIs that are more relevant in assessing risk mitigation options
– Encouraging management to ensure that all our employees recognise that reporting inappropriate behaviour or actions is completely anonymous and that management will support all such reports
– Corporate restructuring. At the December 2013 Committee meeting, the Committee discussed the implications of a proposal from management for a corporate reorganisation of a number of subsidiary undertakings which encompassed asset valuations, related party agreements, PTU and taxation. In 2014, we will continue to monitor the implementation, obtaining independent opinions where appropriate
– Continuing to oversee management’s review of land titles to ensure that our legal titles remain valid whilst monitoring the progress of the situation at Soledad-Dipolos; together with our annual reviews of compliance with the conditions of the Group’s mining licences
– Reviewing management’s progress in refining the IT strategy so that it underpins the corporate strategy
Yours faithfully
Guy Wilson Chairman of the Audit Committee
121www.fresnilloplc.com Fresnillo plc | Annual report 2013
Fresnillo Today
Strategic Report
Corporate Governance
Financial Statements
Audit CommitteeMembershipThe members of the Audit Committee at 31 December 2013 were Guy Wilson (Chairman of the Committee), Fernando Ruiz and Fernando Solana. Guy Wilson was previously a partner at Ernst & Young bringing an international audit and accountancy perspective as well as extensive experience of capital transactions and corporate actions and is therefore considered to have recent and relevant financial, auditing and accounting experience. Further to the individual biographies on page 109, Fernando Solana and Fernando Ruiz have great experience of the economy and the business environment in Mexico. In addition, Fernando Solana brings international insight and Fernando Ruiz, many years’ knowledge of the legal and tax environment, so together the Committee members contribute a broad perspective to the issues they need to address.
The CFO and representatives from external and internal audit attend all meetings, with the CEO and other members of the Executive Committee and management attending where appropriate and also external advisors if relevant for specific matters.
RoleThe role of the Audit Committee is set out in its terms of reference, a copy of which can be found on the Company’s website. The terms of reference set out the duties of the Audit Committee under the following headings:
– Financial Reporting
– Risk Management and Internal Controls
– Whistleblowing Procedures
– Internal Audit
– External Audit
– Related Party Matters
In order to assist the Committee to fulfil their duties whilst implementing good corporate governance, the Committee has developed an Audit Committee Policy Manual which codifies the policies within the scope of the Audit Committee’s responsibilities. This document will be reviewed by the Committee on an annual basis.
The Audit Committee uses regular evaluation processes as a means of ensuring that the governance over the controls environment is appropriate. Following the external independent evaluation of the Committee in 2011, in 2012 the Company Secretary facilitated the evaluation of the Audit Committee following up on the responses to the comments raised in the external evaluation in 2011 through a facilitated informal discussion among the members of the Committee. As a result of that discussion, minor amendments to the terms of reference of the Committee were proposed to and approved by the Board in March 2013.
The Company Secretary has also facilitated a brief review by the Committee of its performance during 2013 and, specifically reviewed whether the Committee’s revised terms of reference required any updating. The Committee concluded that the terms of reference remained appropriate and that it received appropriate information to enable it to fulfil its responsibilities thereunder. An independent review of the Committee’s effectiveness is planned for 2014.
Activity during 2013The Audit Committee met five times in the year. The activities of the Audit Committee during 2013 are summarised in the following sections by reference to its duties, as set out above.
Financial reportingThe primary role of the Committee in relation to financial reporting is to review with both management and the external auditor the appropriateness of the financial statements concentrating on, amongst other matters:
– Monitoring the risks and associated controls over the financial reporting processes, including the process by which the Group’s financial statements are prepared for publication
– The quality and acceptability of accounting policies and practices
– The clarity of the disclosures and compliance with financial reporting standards and relevant financial and governance reporting requirements
– Material areas in which significant judgements have been applied or there has been discussion with the external auditor
– Whether the Annual Report and Accounts, taken as a whole, is fair, balanced and understandable and provides the information necessary for shareholders to assess the Company’s performance, business model and strategy
– Any correspondence from regulators in relation to our financial reporting
In reviewing the 2013 half-yearly report and the 2013 Annual Report prior to recommending them to the Board for approval, the Committee, with the assistance of management and Ernst & Young, identified a number of areas of particular focus being key areas of financial statement risk and judgement for the Company. These are outlined in the following table along with how we have addressed them:

122 Fresnillo plc | Annual report 2013 www.fresnilloplc.com
Corporate Governance Report continued Audit Committee Report
Description of focus area Audit Committee action
Mineral reserves and resourcesThe determination of mineral reserves and resources requires significant estimate with regard to future characteristics of mineral ore. Changes in the economic environment and future outlook may change the economic status of the reserves. Metal price assumptions determine the cut-off grade for identifying economically viable ore bodies. Moreover, this year management had to take account of new guidelines concerning the categorisation of reserves and resources.
Reserves and resources, although not valued directly in our financial statements, are a primary driver of Fresnillo’s market valuation, impact investors’ decisions and play a significant part in the calculations of the depreciation of mining assets, the mine restoration model and related provisions and underpin the calculations used to assess whether there is any impairment of mining assets. As a result, inaccuracies in the estimation of reserves and resources would lead to broad implications across the Annual Report and Accounts.
We also discussed with Mr Giles, head of exploration, and SRK, the composition of the reserves and resources with a particular emphasis on understanding the changes in the guidelines for determining them. We also obtained a deeper understanding of the integration of the reserves and resources within the financial statements.
This is an area of key audit focus for Ernst & Young and we discussed with them the results of their procedures:
– On the expertise and objectivity of SRK, who audit the reserves and resources of the Group
– On the comparison of metal price assumptions used by management in the determination of reserves and resources compared with prices assumptions in various accounting models used in preparing numbers in the financial statements
The Audit Committee challenged the determination of mineral reserves and resources performed by management, which has been independently reviewed by SRK, and was satisfied with its accuracy.
SilverstreamThe Silverstream contract is a derivative financial instrument and is required to be reflected at fair value at each balance sheet date.
The fair value can be impacted by any of the valuation inputs, but is most sensitive to the timing and volume of forecast production derived from the reserves and resources and production profile of the Sabinas mine, the estimated future silver price and the discount rate.
The Silverstream contract represents not only a large asset on our balance sheet but, with such recently volatile precious metal prices, also the potential for change in its valuation can result in large, albeit non-cash, amounts in our income statement.
We challenged management’s judgement that the recognition of a fair value loss of US$53.98 million was within the range of acceptable valuation outcomes.
We, as part of our review of the Annual Report and Accounts, reviewed the disclosures relating to the Silverstream contract including the sensitivity analysis.
This is another key area of audit focus for Ernst & Young and we discussed with them their procedures in auditing the accuracy of the model used in the valuation and the key assumptions therein. We were satisfied with the conclusions from the procedures performed.
The Audit Committee was satisfied with the accounting treatment and disclosure of the Silverstream in the financial statements.
Related party transactions including revenue recognitionTransactions with related parties in the normal course of business may carry no higher risk than transactions with unrelated parties; however, Fresnillo has a large controlling shareholder and as a result has very strong ties both to Peñoles and the broader BAL group.
There is a risk that related party relationships could be taken advantage of to manipulate earnings or otherwise distort our financial position.
Furthermore related party transaction disclosure requirements are onerous and there is a risk that disclosures in our financial statements could be inaccurate or incomplete.
We always scrutinise all major related party transactions that require independent Director approval to ensure that they are entered into transparently and conducted at arm’s length and thus treat all shareholders fairly. This year we extended our review to cover other related party transactions which individually or in aggregate amount to a significant size. This is discussed in more detail in the section of this report headed ‘Transactions with Related Parties’.
We also discuss Ernst & Young’s procedures to ensure revenue is recognised accurately. Finally we review the relevant disclosures in the Annual Report and compare them with the related party transaction analysis that we have requested that management produce for us throughout the year.
The Audit Committee was satisfied with the accounting treatment and disclosure of Related Party Transactions in the financial statements.

123www.fresnilloplc.com Fresnillo plc | Annual report 2013
Fresnillo Today
Strategic Report
Corporate Governance
Financial Statements
Description of focus area Audit Committee action
ImpairmentAdverse metals’ price volatility, reductions in reserves and resources, or operational issues potentially impact the recoverable value of mining assets (in the consolidated financial statements of the Group) and investments in subsidiaries (in the standalone Parent Company Financial Statements).
With the current level of precious metal prices and their future progression uncertain, the risk of the book value of mining assets and investment in subsidiaries becoming impaired has increased.
The judgements in relation to impairment testing relate to the assumptions underlying the calculation of the Value In Use of the mine being tested.
We challenged management’s consistent use of assumptions used within the impairment review.
This is a key area of focus for Ernst & Young and we have discussed with them the results of their procedures on the adequacy of the impairment models used by management and on the assumptions therein. We then discuss with management and Ernst & Young the headroom for each of the mining assets and investments in subsidiaries.
As for the El Bajio situation at Soledad-Dipolos, we have challenged management over the Value In Use of our mining assets, and discussed with Ernst & Young their opinion of the accounting judgements applicable and the appropriateness of disclosures.
The Audit Committee supported management’s judgement not to record any impairment in mining assets but to record the impairment of investments in the Minera Mexicana a Ciénega, SA de CV and Exploraciones Parreña SA de CV subsidiaries.
PTU and taxationThere is a risk that deductions taken when calculating tax and PTU charges may be challenged, and that any resulting exposures to payable taxation and PTU may not have been provided for appropriately.
Whereas we do not consider that there is a risk of material misstatement of these numbers in the financial statements, in the current climate it is important for us to ensure that our shareholders have adequate information to conclude that the stated charges for PTU and taxation are fair and reasonable.
Our reviews of PTU and taxation have similar characteristics.
We review all the significant accounting and legal adjustments to the relevant operating profit subject to PTU or taxation for each subsidiary which are clearly set out in papers prepared by management. This is also an area of focus for Ernst & Young, who report to the Committee on their work in these areas.
We challenge management’s and Ernst & Young’s views and ascertain the degree to which such adjustments are supported by internal and/or external subject matter experts to ensure that all are appropriate and properly evidenced.
The Audit Committee was satisfied that the stated charges for PTU and taxation are fair and reasonable and adequately reflected the effects of the new Mexican tax reform.
Going concernThe Directors must satisfy themselves as to the Group’s ability to continue as a going concern for a minimum of 12 months from the approval of the financial statements, which involves assessing whether, in adverse circumstances, we have adequate liquid resources to fulfil our stated strategy.
A misstatement in going concern arises either (i) when the conclusion on whether going concern is appropriate is incorrect or (ii) when the financial statements do not appropriately represent the conclusion. If the financial statements do not appropriately reflect the conclusions on going concern, the effect is pervasive as it affects a significant number of accounts.
With our production profiles at each mine being relatively predictable and with budgeted expenditure for capital investment and exploration being necessary to achieve our strategy, our fundamental risk lies in metal prices and foreign exchange, as PTU, tax and dividend policies are a mathematical calculation from reported operating results.
The increase in risk arising from falling metal prices was, however, offset this year as a result of the bond issue of US$800 million in November 2013.
We read management’s schedules supporting and explaining the inputs and process underpinning the going concern assessment.
We challenged the sensitivities and stress testing that management performed on the going concern forecast.
We considered Ernst & Young’s report on the adequacy of the cash flow models underlying this assessment and on the reasonableness of assumptions therein, including their consistency with assumptions and estimates used elsewhere in the preparation of the financial statements.
We reviewed and evaluated the conclusions of the Board’s assessment of going concern and the proposed disclosures in the financial statements.
As a result of the procedures performed, we satisfied ourselves that the financial statements appropriately reflect the conclusions on going concern.

124 Fresnillo plc | Annual report 2013 www.fresnilloplc.com
Corporate Governance Report continued Audit Committee Report
Description of focus area Audit Committee action
Licences and land titleLand titles underpin all our mining activities as, without good title, we would not be able to conduct our operations. We consider that we had a robust process to ensure that all required legal documentation is completed correctly on acquisition of land titles and this methodology has been in place for many years.
As a result of the current litigation at Soledad-Dipolos, however, management are undertaking a review of all our title documentation.
– Litigation and claims can give rise to uncertainty around the Group’s ability to freely realise the benefits of its assets and may give rise to asset impairment
– The assessment of the appropriate level of legal provisions and narrative disclosures in the accounts requires assumptions on the legal outcome of claims and estimates of costs
– The recent activities of the ejidarios may lead to not only Dipolos but also Soledad assets and operations being affected
The review is a substantial task as there is a large volume of titles and potential complexities surrounding land ownership in Mexico arising from the various layers of legislation from State, agrarian to local government.
We have oversight over the progress of the review and throughout the year have received verbal and written reports from the lawyers involved in the process.
The review has concentrated first on our existing mining areas and will extend to all titles over the coming months, and save for the areas subject to the El Bajio litigation, nothing significant has emerged so far.
We are satisfied that there is no impairment in the mining assets at Soledad-Dipolos and relevant disclosures throughout the Annual Report are appropriate.
125www.fresnilloplc.com Fresnillo plc | Annual report 2013
Fresnillo Today
Strategic Report
Corporate Governance
Financial Statements
Since 2008 the Audit Committee has refined its processes and methods to ensure that it is satisfied with the appropriateness of financial reporting. Each year and half-year, the importance of these areas of focus is re-assessed with management and Ernst & Young to ensure that they remain valid areas of focus and that there are no other financial risk areas to consider. In undertaking their review of the 2013 half-yearly report, the Audit Committee sought to ensure that issues discussed during the review process for the 2012 full-year financial statements had been progressed and that there was consistency between the policies and judgements used in preparing the full-year and half-year financial statements.
In February 2014, the Audit Committee reviewed the Annual Report and the financial statements for the year ended 31 December 2013 prior to recommending them to the Board for approval. As part of that review process, the members of the Committee were provided with a draft of the full Annual Report some weeks prior to a formal review by the Audit Committee at the February meeting enabling them to ensure that the numbers therein are consistent with those in the financial statements or are sourced from appropriate data. More importantly, they can assess whether the words used are consistent with their understanding of the Company’s business obtained through Board and Audit Committee meetings; and other interaction that they have with management; using their experience to assess whether the Annual Report taken as a whole is fair, balanced and understandable. This additional review by Audit Committee members, supplemented by advice received from external advisors during the drafting process assists the Board in determining that the report is fair, balanced and understandable at the time that it is approved.
Risk management and internal controlsThe role of the Audit Committee is to assist the Board not to replace it in matters of risk and risk management.
The Board’s role is primarily to consider whether a level of risk or a specific risk is acceptable within the Company’s strategy and risk appetite. Whilst the Board has overall responsibility for making sure that internal control and risk management are effective, the detailed work is delegated to the Executive Committee. The primary role of the Audit Committee in relation to risk management and internal controls is to review the effectiveness of risk management systems and related internal controls to ensure that issues that have arisen are properly dealt with, and that going forward the systems are fit for purpose.
The Audit Committee discharges its obligations primarily through:
– Reassessing the adequacy of the top risks identified by management and procedures put in place to assess, quantify and mitigate these risks
– Reviewing the reports from the Internal Audit department on any issues identified in the course of their work
– Reviewing annually the Group’s system of internal control, including the development of the Group’s IT strategy
– Reviewing the effectiveness of the Internal Audit function
– Reviewing reports from the external auditors on any issues identified in the course of their work, including an internal control report on control weaknesses
The development of the risk governance system over the past two years now provides a robust framework enabling the Audit Committee and the Board to evaluate continuously the risk profile of the Group and adapt its focus in response to changes to the risk profile. The Audit Committee and Board formally reviewed the Principal Risks and Uncertainties of the Group prior to the publication of both the full year and interim financial statements. In 2013, this process resulted in the Board re-ordering the risks to reflect their view of the relative significance of each risk in the current environment in which the Fresnillo Group operates. Further details of the Risk Management System are set out on pages 42-53.
The Group has in place internal controls and risk management systems in relation to the Group’s financial reporting process and the Group’s process for preparing consolidated accounts. These systems include policies and procedures to ensure that adequate accounting records are maintained and transactions are recorded accurately and fairly to permit the preparation of financial statements in accordance with IFRS.
The Board has overall responsibility for the Group’s system of internal control, which includes risk management, and reviewing its effectiveness. The system of internal control is designed to identify, evaluate and manage significant risks associated with the achievement of the Group’s objectives. Because of the limitations inherent in any system of internal control, the Group’s system is designed to meet its particular needs and the risks to which it is exposed. It is designed to manage risk rather than eliminate risk altogether. Consequently it can only provide reasonable and not absolute assurance against material misstatement or loss.
The Board has delegated to the Audit Committee its responsibility for reviewing the effectiveness of these controls. The Audit Committee reviews the system of internal control on an annual basis. The day-to-day responsibility for managing risk and the maintenance of the Group’s system of internal control is collectively assumed by the Executive Committee. The Executive Committee is supported in this task by the Internal Audit department.
The risk categories set out in the risk matrix were used as the basis for the process of reviewing the system of internal controls. The Internal Audit department obtained letters of representation from the Executive Committee and the executive management on the Group’s system of internal control.
In December 2013, the Audit Committee agreed the process by which the Board would undertake a review of the Group’s system of internal controls. The outcome of that review was presented to the Audit Committee in February 2014, prior to submission to the Board which then decided on the statement to be made about the review of the system of internal control in the 2013 Annual Report and Accounts.

126 Fresnillo plc | Annual report 2013 www.fresnilloplc.com
Corporate Governance Report continued Audit Committee Report
There are a number of components to the system of internal controls within the Company detailed below and assurance concerning the system of internal controls focuses on these components and the Audit Committee ensures that this process accords with the guidance used on external control, from time to time, by the Financial Reporting Council:
Component of the system of internal control
Basis for assurance
The Group risk matrix. Updated twice annually by the Executive Committee and Internal Audit department.
A framework of transaction and entity level controls to prevent and detect material error and loss.
Reviews undertaken by the Internal Audit department.
A documented structure of delegated authorities and approvals for transaction and investment decisions, including any with related parties.
Monitored and reviewed by the Internal Audit department.
Controls and procedures set out in the Company’s Accounting Policies and Procedures Manual.
Monitored and reviewed by the Internal Audit department.
Operating policies and procedures. Annual written representations obtained from operational and functional management.
A budget with quarterly reporting. Review process performed by the Executive Committee.
A programme of internal audit reviews conducted by the Group’s Internal Audit department.
Reports prepared by the Internal Audit department are discussed with management prior to finalisation and reviewed by the Audit Committee.
Following management’s implementation of new controls over contractors’ activities pursuant to the evaluation carried out in 2012, the Audit Committee considers that the governance of contractors has substantially improved. As a result, Internal Audit’s reports on these activities do not raise any issues of the level of seriousness of those raised in 2012.
The Board has, through the Executive Committee and the Audit Committee (at its February 2014 meeting), reviewed the effectiveness of the Group’s system of internal controls taking account of the matters noted above. On the basis of this review, the Board considers that the measures that have been implemented to create an appropriate risk management framework are appropriate to the Group’s circumstances.
The Board is committed to the continued development of its internal control regime with a view to achieving and maintaining best practice levels of risk management and internal control for international mining companies listed on the London Stock Exchange.
Whistleblowing arrangements
The Audit Committee is responsible for reviewing the adequacy of whistleblowing arrangements and ensuring that appropriate investigation of any whistleblowing incidents has been undertaken.
The Group’s arrangements for enabling employees to raise concerns about financial and non-financial improprieties have developed over the past few years, prompted in part by the requirements of the UK Bribery Act. An internal body called the Honour Commission has been established to oversee these arrangements. The terms of reference of the Honour Commission also embrace the procedures adopted in response to the Bribery Act, and money laundering. The Honour Commission, comprised of the Chief Executive, the Chief Operating Officer, the Compliance Officer (currently the Chief Financial Officer), the Director of Internal Audit, the Vice President of Exploration and the Legal Manager. The Audit Committee regularly receives reports from management concerning the discussions and decisions of the Honour Commission.
The ‘Fresnillo Plays Fair’ whistleblower hotline allows stakeholders to anonymously (via an independent third party) report violations to the Group’s Code of Conduct. The results are audited by an independent third party and classified in 25 different categories including but not limited to: high-risk conditions, violence, fraud, inappropriate use of confidential information, accounting irregularities, conflict of interest, client complaints, theft, unethical treatment of clients, unethical treatment of suppliers, discrimination, falsification of company records, improper use of assets, bribery and sexual harassment.
The Audit Committee is satisfied that the arrangements in place remain adequate. In early 2013, there were two reports of improper behaviour. Thereafter, however, there were no further reports received during the rest of the year and management therefore continued to reinforce the importance it attaches to ethical behaviour throughout the organisation. This has been implemented through presentations at all operational levels, supported by employees completing questionnaires to demonstrate the level of their understanding of these requirements. In the first two months of 2014, three reports have been recorded. The Audit Committee has requested that management evaluate whether there may be any cultural aspects that could be preventing such reporting, and if so, what action should be taken to encourage anonymous reporting of any such issues.
Internal Audit The role of the Audit Committee is to review and monitor the Internal Audit function, amongst others through:
– Ensuring that the internal auditors have a direct reporting line to the Audit Committee
– Closely monitoring the scope of services provided by Internal Audit by agreeing Internal Audit’s workplan up front and agreeing any subsequent changes to the plan
– Considering the level and quality of the resources within the department and its appropriateness to the needs of the Fresnillo Group
– Setting annual objectives and influencing the priorities of the Internal Audit function
– Ensuring adequate recognition and development of the members of the team
– Periodically commissioning an external review of the Internal Audit department

127www.fresnilloplc.com Fresnillo plc | Annual report 2013
Fresnillo Today
Strategic Report
Corporate Governance
Financial Statements
Internal Audit services are provided to the Company under a Shared Services Agreement between the Company and Industrias Peñoles S.A. de C.V. The internal audit workplan for 2014 was presented to and approved by the Audit Committee at its October 2013 meeting. We reviewed the resourcing of the internal audit function and it remains appropriate.
In the current year we have held meetings with Internal Audit and executive management to align the internal control environment with the organisational growth of the Group. This has been made easier by Internal Audit’s realignment of their focus onto the controls surrounding the major operating risks across the operating divisions that concern management.
The Internal Audit team seek to complete audits of all the operating risks across all of the Fresnillo Group’s mining assets on a regular basis. Particular focus continues to be placed on auditing the Company’s new mines to ensure that proper procedures are implemented from the beginning in those new operations. The Audit Committee receives presentations and updates from the Group Internal Audit department at each of its meetings throughout the year. At each meeting during the year, the Audit Committee has focussed on the progress made by management in dealing with ‘red flag’ items raised during internal audit visits to ensure that the management responses to remediation are appropriate and timely.
During 2012, the Audit Committee asked the Internal Audit department to undertake a pan-Group review of third party contractor arrangements; a different approach to the previous mine-based internal audit approach. The process for due diligence on suppliers has continued to be developed and contractors are regularly reviewed by the Internal Audit function. In 2013, it was decided that the financial controllers of the mining operations would now report to Group Finance rather than the mine managers. Group Finance has appointed a senior finance manager to coordinate the reporting of each mining financial controller. As a result of these new reporting lines, there is, inter alia, much more transparency about the financial arrangements with third party contractors which allows best practice to be shared amongst all locations to ensure the highest standards of control.
The Head of Internal Audit meets with the members of the Audit Committee without management present at least twice a year and is mandated to advise the Chairman of the Audit Committee if there are any issues which he considers members of the Audit Committee should be made aware of.
In 2012, the Audit Committee commissioned Independent Audit Limited to undertake an external review of the Internal Audit department. Overall, the assessment gave confidence to the Audit Committee that the internal audit function is effective. Some suggestions were made for short-term developments and questions for consideration relating to longer-term development were also highlighted. The findings of that review were discussed early in the year during a meeting between the Chairman of the Audit Committee, the Head of Internal Audit and the Internal Audit Manager. A number of short-term actions were taken immediately. In some areas further consideration was required, resulting in a draft proposal, taking account of the realignment of Internal Audit’s focus since the issues were raised, which was discussed at the Audit Committee meeting in December 2013 at which the Chief Executive Officer was present. Several aspects for the potential enhancement of the Internal Audit function are currently being evaluated by management and Internal Audit.
External auditorThe primary role of the Audit Committee is to oversee the relationship with the external auditor. This is achieved through:
– Reviewing the terms of engagement of the external auditor
– Approving audit plans and timescales prior to the year-end audit
– discussing the external auditor’s materiality assessments in relation to our financial statements
– Challenging the risk and judgement area identification
– Reviewing the reporting received from the external auditors and challenging the work done to test management’s assumptions in key areas of risk and judgement
– Approving representation letters given to the auditors by management
– Seeking feedback from management on the effectiveness of the audit process
– Periodically commissioning an external review of the external auditors
– Considering the reappointment of the external auditors and their independence, including the rotation of the audit partner
– Assessing the need for audit tendering
As part of its review of the financial statements prepared by the Company, the Audit Committee reviewed the findings of the external auditor in respect of the financial statements for the year ended 31 December 2013 and in respect of the financial statements for the six-month period ending 30 June 2013.
In 2013, in addition to its regular activities, the Audit Committee:
– Accepted the auditor’s materiality assessments, but requested that significant items below that level should be brought to our attention to cover aggregation issues or qualitative grounds for further review
– Challenged the auditor’s identification of significant risks
The Audit Committee met with representatives from Ernst & Young without management present and with management without representatives of Ernst & Young present, to ensure that there are no issues in the relationship between management and the external auditor which it should address. There were none.
During the year, the Audit Committee has monitored the increasing and evolving collaboration between Ernst & Young LLP and the Company’s Internal Audit department which it believes is improving the efficiency of both the external and internal audit processes.
During the second half of 2013, Independent Audit Limited were commissioned to undertake an external review of the external auditor. This involved extensive discussions with management and the auditors including discussions at an operating company and our financial control centre in Torreón; a review of audit plans and other papers provided to the Audit Committee; and consideration of the approach of management and auditors to certain audit judgements. A detailed report was then submitted to the Audit Committee and the findings were discussed by both the Committee Chairman and the reviewer with the Chief Financial Officer and the External Audit Partner. The final report was discussed at the Audit Committee meeting in December 2013 and a number of suggestions for enhancement, of which the audit process in Mexico was the principal area, are being evaluated by management and Ernst & Young.

128 Fresnillo plc | Annual report 2013 www.fresnilloplc.com
Corporate Governance Report continued Audit Committee Report
In February 2014, the Audit Committee considered and recommended the re-appointment of the external auditor, Ernst & Young LLP, to the Board prior to the Company’s Annual General Meeting. This review took into account the results of the auditor assessment process, the quality of the work and communication by the external auditor and the level of audit fees.
The Audit Committee is mindful of its responsibility to ensure that the external auditor maintains its independence and objectivity. It has therefore reviewed, and is satisfied with, the independence of Ernst & Young LLP as the external auditor. The Audit Committee has a policy in place in respect of the provision of non-audit services to the Fresnillo Group by the external auditor. The engagement of the external auditor to provide statutory audit, assurance, taxation and certain advisory services is pre-approved. Any engagement of the external auditor to provide permitted services above US$150,000 is subject to the specific approval of the Audit Committee. This policy was confirmed at the October 2013 meeting of the Committee.
In October 2013, the Committee approved engaging the external auditor to provide comfort on historical financial information contained in the offering memorandum in connection with the US$800m senior notes issue in November 2013. The Committee considered the proposal from Ernst & Young to undertake this work in accordance with the non-audit services policy and were satisfied that Ernst & Young were best placed to undertake this work and that the nature of the work would not compromise Ernst & Young’s objectivity in respect of future audit work.
During the year the Audit Committee has considered future plans for both audit firm and audit partner rotation, taking into account the current requirements of the UK Corporate Governance Code, associated guidance from the Financial Reporting Council, together with the recent proposals from the European Commission on audit firm rotation and tendering. Ernst & Young LLP were appointed as auditor in 2008 and the Committee envisage tendering the external audit after the 2016 AGM so that an appointment can be made in October 2016 to take effect for the year commencing 1 January 2017 unless circumstances change. The appointment would not be formally confirmed until the 2017 AGM so that the chosen firm would then be in place for the interim review in 2017 as their first audit/review activity. In terms of audit partner rotation, the incumbent will be replaced for the 2015 financial year when he will have held the position for five years.
The Committee reviewed the levels of engagement of other audit firms and advisors at its October and December meetings. Details of the fees paid to Ernst & Young LLP during the year as shown in note 28 to the financial statements were US$2.2 million, and the fees paid to other accountants and advisory firms were US$0.5 million.
The Committee also considers annually the contracts and commitments arising from such engagements to ensure that they would not restrict the Committee’s choice of potential external auditors in a tender process.
Transactions with related partiesPeñoles beneficially owns 75% of the Group’s common shares and is controlled by the Baillères family. As such, Peñoles has and will continue to have significant influence over the affairs and operations of Fresnillo. Further, Fresnillo is dependent on the Peñoles Group for certain key operational services.
Given the extensive related party relationships, the Audit Committee’s primary role is to ensure that transactions with related parties are conducted under normal market terms and conditions and shareholders’ interests are safeguarded, by:
– Benchmarking data and information for related party transactions over a certain threshold
– Assessing the type and purpose of related party transactions and ascertaining whether they are in the normal course of business
– Reviewing the financial and commercial aspects of any transaction proposed between the Fresnillo Group and the Peñoles Group prior to such matters being considered by the Independent Non-executive Directors under the terms of the Relationship Agreement or in compliance with Chapter 11 of the Listing Rules
– Critically assessing and challenging the appropriateness of any significant related party transactions and arrangements outside the normal course of business

129www.fresnilloplc.com Fresnillo plc | Annual report 2013
Fresnillo Today
Strategic Report
Corporate Governance
Financial Statements
The Shared Services Agreement is an agreement between the Company and Industrias Peñoles S.A.B. de C.V. (Peñoles) under which a range of services are provided to the Company by Peñoles. We review the shared services agreement at each renewal, using external advisors to review any revision in the legal terms, to benchmark the proposed pricing against tenders requested from numerous alternative suppliers and use management’s experience of both past performance against the KPIs agreed and any enhanced or additional services required.
The Shared Services Agreement was initially put in place in 2009 and was renewed for five years with effect from 31 December 2012. Extensive work with external advisors was undertaken at the time to ensure that the scope of services to be provided was appropriate to the needs of the Fresnillo Group; that the pricing for services provided under the Shared Services Agreement were appropriately benchmarked and that the arrangements were in the ordinary course of business, not on unusual terms and had been negotiated on an arm’s length basis. The Audit Committee presented this to independent Directors and was approved in March 2013.
Additionally this year, we reviewed and recommended the approval of the independent Non-executive Directors to a specific one-off request for additional resources under the same terms, conditions and hourly rates to assist with our due diligence exercise to evaluate all our suppliers for the requirements of our anti-bribery and corruption programme. This was approved in July 2013.
We receive and review a report from management, which analyses the pricing structure of the Met-Mex contract by comparing proposed prices to comparable prices charged by Met-Mex to independent customers and to those of other refineries taking account of ore composition and transport costs to ensure that they are reasonable in all the circumstances before recommending them for independent non-executive approval.
During the year, the Audit Committee considered the proposed charges in respect of the Met-Mex Arrangements for 2013. Based on the satisfactory outcome of that review, the Chairman of the Audit Committee recommended to the Board that the independent Directors approve the proposed charges for 2013 under the Met-Mex Arrangements, which they did in October 2013.
There are other dealings with related parties in the ordinary course of business but, although not requiring approval by independent Directors, where they, individually or in aggregate for a particular supply become of a certain size, we seek evidence that they too are conducted on an arm’s length basis. The Audit Committee requisitioned and reviewed benchmarking data for such other related party activities which include inter alia cost of insurance cover, hire of aircraft and travel arrangement costs and the Committee was satisfied that the arrangements are on a reasonable arm’s length basis.
In December 2013, the Audit Committee reviewed a schedule of all the Company’s related party transactions during the year and were satisfied that all transactions listed were in the ordinary course of business.

130 Fresnillo plc | Annual report 2013 www.fresnilloplc.com
Corporate Governance Report continued Nominations Committee Report
Mr Alberto BaillèresChairman of the Nominations Committee
“ I take great satisfaction in seeing how the Board has benefited from the shared experience of working together as one team…”
Dear Shareholder,In this year’s Annual Report, we have taken ‘Looking beyond the Cycle’ as our theme. As the global mining sector moves into a new and more challenging phase, we continue with our strategy, which takes a long-term perspective and is borne out of many years of history and experience in the mining sector. Last year, I said that the Nominations Committee will continue to ensure that the Board provides the right leadership needs for the Company as it continues with its long-term growth strategy. In addition, I also noted that taking this perspective would mean that change will not always be rushed. That said, we have continued to develop the senior executive team within the Company through the appointment of Roberto Díaz as Chief Operating Officer in October 2013. This appointment brings our senior executive team back up to full strength.
As far as the Board itself is concerned, I take great satisfaction in seeing how the Board has benefited from the shared experience of working together as one team – irrespective of whether they are independent or not – over the six years since the Company’s IPO in 2008. This shared experience builds on and enhances the individual skills, background and perspectives that each Director brings to the Board. Although we will inevitably need to ‘refresh’ the Board from time to time as we go forward, as indeed we have begun to do in 2014, I hope that we will not lose any of the benefits of this long-term shared perspective as new Directors are appointed to the Board.
During the year, we have considered our policy on Board diversity as required by the UK Corporate Governance Code. Our policy is set out in the Nominations Committee Report below. The Nominations Committee and the Board totally support the principle of appointments – whether at Board-level or elsewhere in our organisation – being made on the basis of merit. Neither gender, ethnicity or age are considered to be barriers to progress in our Company but neither are they, alone, good reasons to appoint anyone to the Board before they are ready. For this reason, we have not set any measurable targets in our diversity policy. Our broader initiatives for creating opportunities to develop a more diverse workforce are set out in the Sustainability Performance Report on page 90.
Yours faithfully
Mr Alberto Baillères Chairman of the Nominations Committee

131www.fresnilloplc.com Fresnillo plc | Annual report 2013
Fresnillo Today
Strategic Report
Corporate Governance
Financial Statements
Nominations CommitteeMembershipThe members of the Nominations Committee are Alberto Baillères (Chairman of the Committee), Javier Fernández and Fernando Ruiz. The majority of the members of the Nominations Committee are, therefore, independent Non-executive Directors.
RoleThe Nominations Committee is responsible for making recommendations to the Board on the structure, size and composition of the Board and its committees and succession planning for the Directors and other senior executives. Before making appointments of new Directors, the Committee is responsible for evaluating the balance of skills, knowledge and experience on the Board and identifying and nominating suitable candidates. The terms of reference of the Nominations Committee are available on the Company’s website at www.fresnilloplc.com.
The letters of appointment for the Non-executive Directors are made available for inspection at the Company’s registered office, during normal business hours.
Activity during 2013The Nominations Committee met twice during the year and considered the following matters:
– Approval of the 2012 Nominations Committee Report prior to publication
– A policy on Board diversity
– Succession plans for each member of the Executive Committee
– The appointment of a new Chief Operating Officer
– The current membership of the Board and Board Committees
– The time commitment required from each Director
– The proposed re-election of each of the Directors at the Annual General Meeting and the continuation of letters of appointment for the Non-executive Directors
– A self-evaluation exercise
Since the end of 2013, the Nominations Committee has been considering the membership of the Board being mindful of the requirements of Code Provision B.2.3. As a consequence, two new Directors will be recommended for election to the Board at the 2014 Annual General Meeting.
Board Appointments Policy and ProcessThe Nominations Committee and the Board are committed to the principle of appointments to the Board being made on the basis of merit. The criteria for determining the composition of the Board and future Board appointments continues to be based on:
– The Relationship Agreement requirements for appointments to the Board by Peñoles
– The Company’s leading position as a precious metals miner in Mexico
– The Company’s inclusion in the FTSE 100 Index
– The specific functions on Board committees which independent Directors will be required to fulfil
– The criteria set out in the current terms of reference of the Nominations Committee
The process for making new appointments to the Board is led by the Chairman. Potential candidates are considered on the basis of their skills and experience and their fit with the blend of skills of the rest of the Board.
The Board Appointments Policy provides a frame of reference for the process. The candidates identified by the Chairman are presented to the Nominations Committee for approval prior to being recommended to the Board for appointment.
The Nominations Committee did not use open advertising or retain any external consultants when making new appointments to the Board during the year as such assistance was considered unnecessary considering the Company’s contacts within Mexico.
Board Diversity Policy StatementThe Board consists of independent and non-independent Directors who, since the Company’s listing in 2008, have developed a collegiate approach to overseeing the development of the Fresnillo Group in the interests of all shareholders. The collective experience of the team is of equal importance to the individual experience and perspectives that different Directors bring.
All Board appointments are made on merit, in the context of the skills and experience the Board as a whole requires for it to be effective. This is the fundamental principle upon which Board appointments are and will be made. In support of this, the Board recognises and embraces the benefits of having a diverse board; particularly the value that different perspectives and experience bring to the quality of board debate and decision-making. This will be taken into account when determining the optimum composition of the Board.
In view of the Fresnillo Group’s status as the world’s leading silver mining company and Mexico’s second largest gold mining company, with shares traded on the London and Mexico Stock Exchanges, there are certain ‘diversity considerations’ which need to be incorporated into the composition of the Board and which will, if the right balance is achieved, ensure that the Board is a diverse Board. These emphases are summarised as follows:
Background and experienceAs a mining company; there needs to be sufficient experience on mining and engineering on the Board. There also needs to be experience of the markets, politics and commercial environment in Mexico and Central/Southern America. However, as a UK-listed company, there also needs to be international experience of capital markets, accounting and regulation represented on the Board.
AgeAs a Group which takes a long-term perspective, the age profile of the Board needs to recognise the value that older Directors bring through their experience and knowledge accumulated over the years; and the value that younger Directors bring through their understanding of new ideas and energy for change which encourages innovation.
GenderDespite the traditional male-dominance of the mining sector, the Board recognises the increasing profile that women are being encouraged to take within the industry. This will be reflected in the composition of the Board and in the Group’s training and development programmes.
ShareholdersThe Relationship Agreement requires that there is a balance between shareholder nominated Directors and independent Directors who are able to present the independent investor perspective in Board discussions.
The Board considers that whilst this diversity policy establishes important principles which must underpin the composition of the Board, it believes that setting targets for the number of people from a particular background is not the most effective approach to take. The Board will therefore look to follow the principles of this policy rather than specified quotas or targets.
The Corporate Governance Report has been approved by the Board of Directors of Fresnillo plc.
Signed on behalf of the Board.
Lord Cairns Senior Independent Director 3 March 2014

132 Fresnillo plc | Annual report 2013 vwww.fresnilloplc.com
Directors’ Remuneration Report Chairman’s Annual Statement
Lord Cairns Chairman of the Remuneration Committee
Read more: Remuneration Policy Page 133
Read more: Annual Report on Remuneration Page 139
“ …we intend to maintain our previous policies, even though these vary quite considerably from the line taken by many other UK quoted companies.”
Dear Shareholder,The UK Enterprise and Regulatory Reform Act of 2013 prescribes many new obligations with respect to how executive pay is determined. We shall of course comply both with these and their spirit. Inter alia, we continue to show details of the Chief Executive’s remuneration as if he was a Board member, which in the reporting period he was not. Much of the emphasis of the Act concerns the importance of obtaining shareholder approval for companies’ policy and its implementation. At our last AGM, over 99% of votes cast whether measured in total or merely from non-connected shareholders signified satisfaction with our stance. Thus we intend to maintain our previous policies, even though these vary quite considerably from the line taken by many other UK quoted companies.
The share prices in companies like Fresnillo plc are in large part determined by changes in precious metal prices over which our executives have no control. Additionally in line with the wishes of many shareholders, who wish to take any hedging decisions unilaterally, the Company does not undertake significant hedging positions. This underscores the reason why we do not use share price as a determinant of variable pay nor do we see value for the Company in entering other forms of deferred remuneration arrangements (such as long-term incentive share schemes). Additionally, we believe that the annual objectives that we set have both short-term and long-term impacts which also make separate share-based incentives for the longer term unnecessary.
Thus we set systems which decide remuneration annually against results for the year and broad longer term objectives. Our Chief Executive and his team receive a good annual salary and benefits, which we fix by reference to both international and national comparators. Fixed remuneration forms a higher proportion of the total than in many international companies although this is closer to local custom in Mexico. Members of the Executive Committee can, nevertheless, earn up to a 50% bonus set against three broad criteria. The first relates to annual production and financial results, and profits excluding the changes in relevant metal prices. The second criterion concerns successfully finding and proving economically attractive new reserves. This, we believe, is a good measure of success in creating longer term value. The third element relates to the individuals’ contributions to creating outcomes for all the stakeholders in the Company, with special emphasis at this time on health and safety issues. These may vary to take account of individuals’ areas of responsibility and with areas calling for special attention from time to time. Some aspects of these are not capable of statistical target-setting and where outcomes are determined by our Committee against broadly defined objectives.
In 2013, we reviewed the new Chief Executive Officer’s salary, taking account of his performance in post during his first year and increased it by 14%. We have also considered the Chief Executive Officer’s annual bonus for 2013 and, based on the scoring system that we use, have awarded him a bonus equivalent to two months’ salary.
We are confident that this approach is appropriate and provides our highly regarded team with a good level of both encouragement and incentive to build on the excellent position the Company has achieved to date.
Yours faithfully
Lord Cairns Chairman of the Remuneration Committee

133www.fresnilloplc.com Fresnillo plc | Annual report 2013
Fresnillo Today
Strategic Report
Corporate Governance
Financial Statements
Remuneration Policy in Summary
Strategic objective Key Performance Indicator
Timeframe Measure Weighting
Maximise the potential of existing operations
Production Short and long term Increase in equivalent ounces produced 26
Safety Short term Fatalities 5
Deliver growth through development projects
Resources Long term
Increase in total resources 10
Extend the growth pipeline
Increase in resources upgraded from inferred to indicated
20
Advance sustainable development
Stakeholders Long term Various 11
Financial Short and long term Net profit adjusted 17
All objectives Teamwork – – 11
The Group’s Remuneration Policy seeks to ensure that the Company is able to attract, retain, and motivate its executives and senior management. The retention of key management and the alignment of management incentives with the creation of shareholder value are key objectives of this policy.
Setting base salary levels for Executive Directors at an appropriate level is a key to managerial retention in Mexico. Salaries are therefore market competitive both within the Mexican context and internationally for comparable companies. Total compensation is set within a range around the median level for the Company’s peer group within Mexico and internationally; total remuneration is benchmarked biennially to ensure that the whole remuneration package is maintained at this level over the long term. Salaries are positioned within the range according to experience and length of service.
The annual bonus rewards the achievement of short- and long-term financial and strategic business targets and delivery of personal objectives. The KPIs and targets are also designed to ensure that both short-term objectives and the long-term development of the Fresnillo Group are given broadly equal priority. As a consequence, the Company does not use share-based forms of remuneration to incentivise long-term performance.
The Annual Bonus Plan aligns incentives to the short-term and long-term KPIs in the following manner.

134 Fresnillo plc | Annual report 2013 www.fresnilloplc.com134 Fresnillo plc | Annual report 2013 vwww.fresnilloplc.com
Directors’ Remuneration Report continued Remuneration Policy
The table below sets out the key elements of Executive Director pay set out in the Directors’ Remuneration Policy:
Operation Maximum Value Performance Metric Discretion
Base salaryProvides the core reward for the roleReviewed annually and fixed for 12 months starting on 1 April each year and the review is influenced by:
– Role, experience and performance
– Average workforce salary adjustments
– Mexican economic factors
– Comparison with the Company’s peer group in Mexico and internationally
Salaries are benchmarked bi-annually by reference to companies of similar size and complexity and will be positioned within a mid-range of the Company’s comparator peer group in Mexico and internationally. The next reviews will take place in April 2014 and April 2016.
The Chief Executive’s salary will be reviewed taking account of the benchmarking information received by the Remuneration Committee and the maximum value of the Chief Executive’s base salary will be positioned within the mid-range for companies in the peer group of Mexican and international resources companies.
The Remuneration Committee considers individual salaries at the appropriate meeting each year by reference to the factors noted under the ‘Operation’ heading in this table.
Details of the current remuneration of the Chief Executive Officer is provided in the Annual Report on Remuneration.
The Remuneration Committee will establish the Company’s comparator peer group in Mexico and internationally as part of the biennial review which it will consider in April 2014. The peer group will be reviewed again in April 2016 as part of the following biennial review. The Committee will report on the outcome of these reviews within the relevant Annual Report on Remuneration for the 2014 and 2016.
BenefitsHelp recruit and retain employeesAn Executive Director would be entitled to life insurance, the use of a company car, the payment of premiums for medical insurance covering limited expenses and check-ups. Benefits may be changed if Company policy on benefits changes.
The current benefits are set out in the Annual Remuneration Report.
The maximum value of benefits will be determined by Company policy that is applicable to all employees.
None. The Remuneration Committee may consider changes to the benefits made available to Executive Directors in line with any changes in the policy for benefits provided to all employees.
PensionRewards continued employment and sustained contributionThe Group operates a defined contribution scheme. Executive Directors are entitled to membership of the defined contribution scheme.
The maximum contribution for any employee may not exceed 16% of salary.
None.

135www.fresnilloplc.com Fresnillo plc | Annual report 2013
Fresnillo Today
Strategic Report
Corporate Governance
Financial Statements
Operation Maximum Value Performance Metric Discretion
Annual Bonus1
Rewards the achievement of short- and long-term financial and strategic business targets and delivery of personal objectivesTargets are renewed annually and relate to the strategic aims of the business as a whole. A scoring system is used for the plan. Each objective set for the executive at the beginning of the year is allocated a points-rating which represents a median performance target for that objective. Upper and lower point thresholds are set to allow for outstanding performance and ensure that underperformance is not rewarded. For each member of the Executive Committee (including the Chief Executive Officer), a bonus is only payable if the aggregate performance equals or exceeds 100 points. Bonus payments are paid for aggregate performance against target at or above 100 points as follows:
The maximum percentage of salary is 50% (six months’ salary) and is paid where Executive Directors achieve more than 115 points under the Annual Bonus Plan. (Target is 100 points).
The KPI targets focus on risks that are within the control and influence of management. Thus, the management of safety, security, project, human resource, exploration and environmental risks are all currently implicitly covered within the KPIs. The KPIs and targets are also designed to ensure that both short-term objectives and the long-term development of the Fresnillo Group are given equal priority.
Details of the measures, targets and performance for the year ended 31 December 2013 are provided in the Annual Report on Remuneration.
The Remuneration Committee considers that the KPIs, upon which bonuses are based, may need to evolve from year to year in line with the strategy and therefore it retains the discretion to adjust individual KPI weightings from year to year.
The Remuneration Committee retains the discretion to adjust bonus payments to take account of the following:
– Factors outside the control of Executive Directors e.g. force majeure circumstances. In deciding whether adjustment is merited, the Remuneration Committee will consider the appropriateness of the Executive Director’s response to those circumstances; in this situation an upward adjustment may be considered
– Poor executive response to adverse health, safety or environmental performance during the year, in which case a downward adjustment would be considered
Any such discretion will be fully explained in future Directors’ Remuneration Reports.
Points Variable Pay (Month’s Salary)
Variable Pay (% of salary)
100–104 Two 16.67
105–109 Four 33.33
110–114 Five 41.67
115+ Six 50.00
1 Fresnillo plc does not operate any share option or share-based long-term incentive plans.

136 Fresnillo plc | Annual report 2013 www.fresnilloplc.com136 Fresnillo plc | Annual report 2013 vwww.fresnilloplc.com
Directors’ Remuneration Report continued Remuneration Policy
IntroductionThis part of the Directors’ Remuneration Report sets out the Remuneration Policy of the Company and has been prepared in accordance with The Large and Medium-sized Companies and Groups (Accounts and Reports) (Amendment) Regulations 2013 (‘the Regulations’). The policy has been developed taking into account the principles of the UK Corporate Governance Code 2012 and the views of our major shareholders. It describes the policy to be applied for the financial year ending 31 December 2014 and beyond. The Policy Report will be put to a binding vote at the 2014 Annual General Meeting, and, subject to it receiving majority shareholder support, the Effective Date of the policy will be the date of the 2014 Annual General Meeting of the Company, 16 May 2014.
Remuneration PolicyThe Group’s Remuneration Policy seeks to ensure that the Company is able to attract, retain, and motivate its executives and senior management. The retention of key management and the alignment of management incentives with the creation of shareholder value are key objectives of this policy.
Setting base salary levels for Executive Directors at an appropriate level is a key to managerial retention in Mexico. Therefore, the Remuneration Committee seeks to ensure that salaries are market competitive both within the Mexican context and internationally for comparable companies. Total compensation is set within a range around the median level for the Company’s peer group within Mexico and internationally, total remuneration is benchmarked biennially to ensure that the whole remuneration package is maintained at this level over the long term. Salaries are positioned within the range according to experience and service.
Alignment of executive remuneration and the marketIn setting the fixed remuneration of the members of the Executive Committee, information relating to the mining company comparators is provided by various consultants. Information relating to the Mexican economic metrics and internal benchmarking is collated by management for the Remuneration Committee to consider. In 2012, information showing the three-year trends for inflation, market growth and pay increases in Mexico was considered in setting salary increases for members of the Executive Committee.
A review conducted by Towers Watson in April 2012 enabled the Remuneration Committee to validate the Company’s policy towards short-term and long-term remuneration and ensure that it was globally as well as locally competitive. The analysis evaluated the elements of base salary; short-term compensation (guaranteed payments and short-term bonus) and long-term compensation (primarily stock programmes) separately. It concluded that the level of total remuneration for all of the members of the Executive Committee was set in line with the objective of the Remuneration Policy. A further review by Towers Watson will be considered in early 2014 prior to the review of the Executive Committee members’ salaries taking effect from 1 April 2014. Following this review, the Remuneration Committee will establish the peer group of companies for the purposes of validating the remuneration of Executive Directors.
Comparison of executive and wider company remuneration When setting pay and benefits for Executive Directors and Executive Committee, the Remuneration Committee takes account of pay and conditions across the Group. It will consider the overall pay increase percentage negotiated with employee representatives as its starting point. The Remuneration Committee may agree pay increases above or below the agreed percentage in exceptional circumstances, where in its discretion it considers such variance to the norm to be justified. Other than the Towers Watson report specifically commissioned by the Remuneration Committee, the same benchmark reports are used in the evaluation of executive and employee remuneration, thus providing a common approach to both.
Below Board level, a statutory profit-sharing arrangement (PTU) is operated which in recent years has enabled employees within the operating companies to receive significant levels of bonus in line with the increased profitability of the relevant operating company. Neither the Chief Executive Officer nor any of the Non-executive Directors participate in a PTU scheme within the Fresnillo Group. The other members of the senior management group below Board level are employed by Servicios Administrativos Fresnillo SA de CV which pays annual PTU payments. However such payments are modest.
The Remuneration Committee does not consult with employees in setting Directors’ remuneration.
Policy on recruitmentThe Committee will consider the remuneration of new executive appointees to the Board by reference to the Remuneration Policy set out above. The Committee does not expect to pay sign-on payments or compensate new Directors for any variable remuneration forfeited from any employment prior to joining the Board. Salary will be set so as to be market competitive both within the Mexican context and internationally for comparable companies and taking account of the experience and seniority of the appointee coming into the new role. The Committee is likely to set base salaries below median on appointment whilst retaining discretion to award increases during the first and, possibly, subsequent years to bring salaries into the normal range expected for Executive Directors, in line with the Company’s stated policy. New Executive Directors will receive benefits and pensions in line with Company’s existing policy and will be able to participate in the annual bonus scheme on a pro-rated basis for the portion of the financial year for which they are in post. Whilst there is no expectation of changing this approach, the Remuneration Committee will bring any variation to this approach to shareholders for approval prior to implementation.
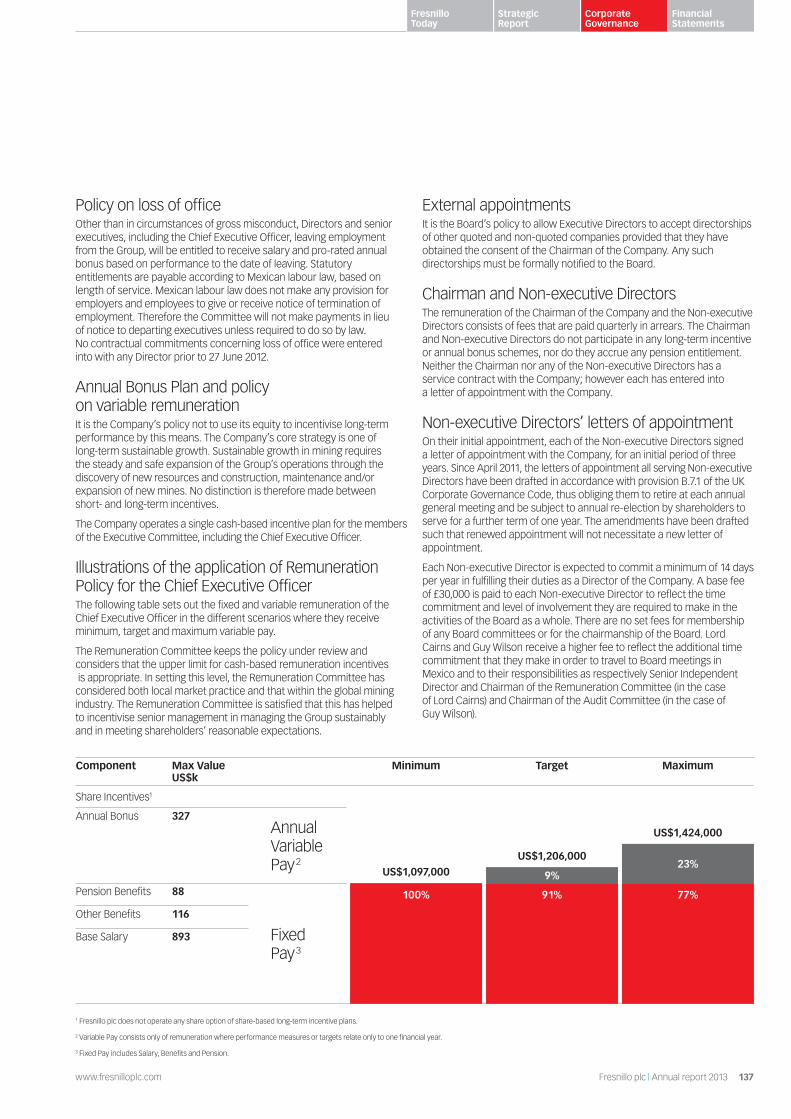
137www.fresnilloplc.com Fresnillo plc | Annual report 2013
Fresnillo Today
Strategic Report
Corporate Governance
Financial Statements
Policy on loss of officeOther than in circumstances of gross misconduct, Directors and senior executives, including the Chief Executive Officer, leaving employment from the Group, will be entitled to receive salary and pro-rated annual bonus based on performance to the date of leaving. Statutory entitlements are payable according to Mexican labour law, based on length of service. Mexican labour law does not make any provision for employers and employees to give or receive notice of termination of employment. Therefore the Committee will not make payments in lieu of notice to departing executives unless required to do so by law. No contractual commitments concerning loss of office were entered into with any Director prior to 27 June 2012.
Annual Bonus Plan and policy on variable remunerationIt is the Company’s policy not to use its equity to incentivise long-term performance by this means. The Company’s core strategy is one of long-term sustainable growth. Sustainable growth in mining requires the steady and safe expansion of the Group’s operations through the discovery of new resources and construction, maintenance and/or expansion of new mines. No distinction is therefore made between short- and long-term incentives.
The Company operates a single cash-based incentive plan for the members of the Executive Committee, including the Chief Executive Officer.
Illustrations of the application of Remuneration Policy for the Chief Executive OfficerThe following table sets out the fixed and variable remuneration of the Chief Executive Officer in the different scenarios where they receive minimum, target and maximum variable pay.
The Remuneration Committee keeps the policy under review and considers that the upper limit for cash-based remuneration incentives is appropriate. In setting this level, the Remuneration Committee has considered both local market practice and that within the global mining industry. The Remuneration Committee is satisfied that this has helped to incentivise senior management in managing the Group sustainably and in meeting shareholders’ reasonable expectations.
External appointmentsIt is the Board’s policy to allow Executive Directors to accept directorships of other quoted and non-quoted companies provided that they have obtained the consent of the Chairman of the Company. Any such directorships must be formally notified to the Board.
Chairman and Non-executive DirectorsThe remuneration of the Chairman of the Company and the Non-executive Directors consists of fees that are paid quarterly in arrears. The Chairman and Non-executive Directors do not participate in any long-term incentive or annual bonus schemes, nor do they accrue any pension entitlement. Neither the Chairman nor any of the Non-executive Directors has a service contract with the Company; however each has entered into a letter of appointment with the Company.
Non-executive Directors’ letters of appointmentOn their initial appointment, each of the Non-executive Directors signed a letter of appointment with the Company, for an initial period of three years. Since April 2011, the letters of appointment all serving Non-executive Directors have been drafted in accordance with provision B.7.1 of the UK Corporate Governance Code, thus obliging them to retire at each annual general meeting and be subject to annual re-election by shareholders to serve for a further term of one year. The amendments have been drafted such that renewed appointment will not necessitate a new letter of appointment.
Each Non-executive Director is expected to commit a minimum of 14 days per year in fulfilling their duties as a Director of the Company. A base fee of £30,000 is paid to each Non-executive Director to reflect the time commitment and level of involvement they are required to make in the activities of the Board as a whole. There are no set fees for membership of any Board committees or for the chairmanship of the Board. Lord Cairns and Guy Wilson receive a higher fee to reflect the additional time commitment that they make in order to travel to Board meetings in Mexico and to their responsibilities as respectively Senior Independent Director and Chairman of the Remuneration Committee (in the case of Lord Cairns) and Chairman of the Audit Committee (in the case of Guy Wilson).
1 Fresnillo plc does not operate any share option of share-based long-term incentive plans.
2 Variable Pay consists only of remuneration where performance measures or targets relate only to one financial year.
3 Fixed Pay includes Salary, Benefits and Pension.
Component Max Value US$k
Minimum Target Maximum
Share Incentives1
US$1,097,000US$1,206,000
US$1,424,000
Annual Bonus 327Annual Variable Pay2 23%
9%Pension Benefits 88
Fixed Pay3
100% 91% 77%
Other Benefits 116
Base Salary 893
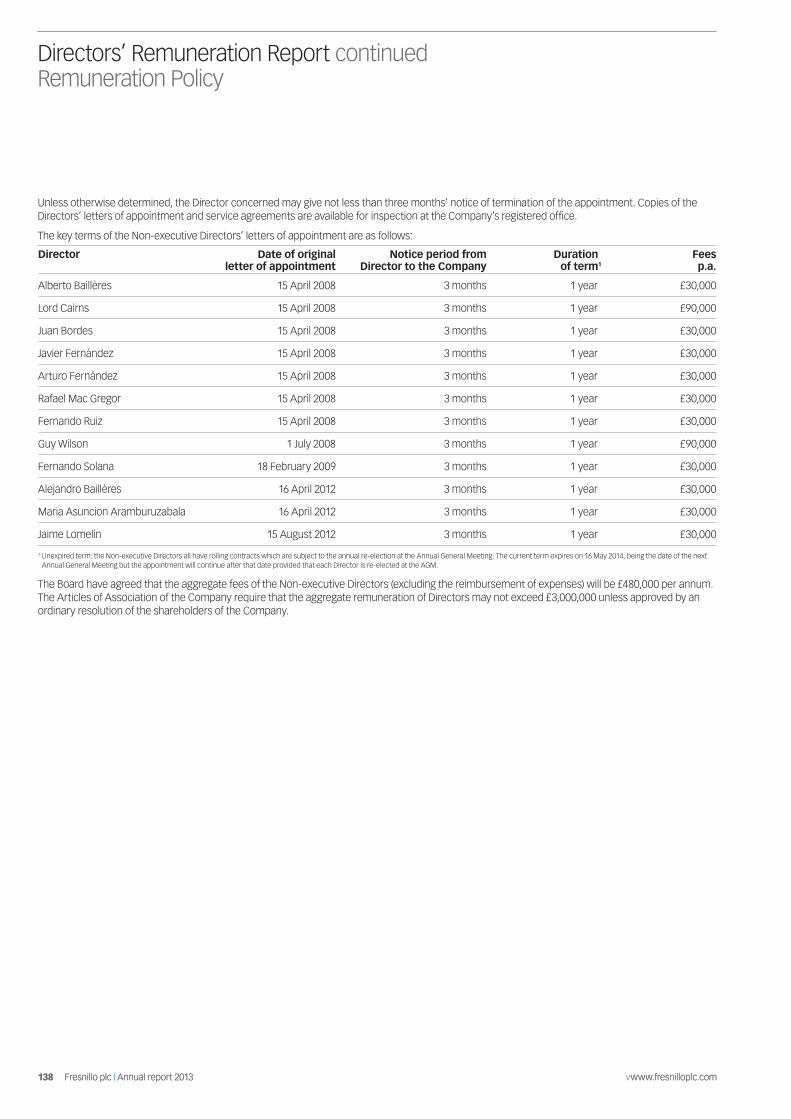
138 Fresnillo plc | Annual report 2013 www.fresnilloplc.com138 Fresnillo plc | Annual report 2013 vwww.fresnilloplc.com
Directors’ Remuneration Report continued Remuneration Policy
Unless otherwise determined, the Director concerned may give not less than three months’ notice of termination of the appointment. Copies of the Directors’ letters of appointment and service agreements are available for inspection at the Company’s registered office.
The key terms of the Non-executive Directors’ letters of appointment are as follows:
Director Date of original letter of appointment
Notice period from Director to the Company
Duration of term1
Fees p.a.
Alberto Baillères 15 April 2008 3 months 1 year £30,000
Lord Cairns 15 April 2008 3 months 1 year £90,000
Juan Bordes 15 April 2008 3 months 1 year £30,000
Javier Fernández 15 April 2008 3 months 1 year £30,000
Arturo Fernández 15 April 2008 3 months 1 year £30,000
Rafael Mac Gregor 15 April 2008 3 months 1 year £30,000
Fernando Ruiz 15 April 2008 3 months 1 year £30,000
Guy Wilson 1 July 2008 3 months 1 year £90,000
Fernando Solana 18 February 2009 3 months 1 year £30,000
Alejandro Baillères 16 April 2012 3 months 1 year £30,000
Maria Asuncion Aramburuzabala 16 April 2012 3 months 1 year £30,000
Jaime Lomelín 15 August 2012 3 months 1 year £30,000
1 Unexpired term: the Non-executive Directors all have rolling contracts which are subject to the annual re-election at the Annual General Meeting. The current term expires on 16 May 2014, being the date of the next Annual General Meeting but the appointment will continue after that date provided that each Director is re-elected at the AGM.
The Board have agreed that the aggregate fees of the Non-executive Directors (excluding the reimbursement of expenses) will be £480,000 per annum. The Articles of Association of the Company require that the aggregate remuneration of Directors may not exceed £3,000,000 unless approved by an ordinary resolution of the shareholders of the Company.

139www.fresnilloplc.com Fresnillo plc | Annual report 2013
Fresnillo Today
Strategic Report
Corporate Governance
Financial Statements
IntroductionThis report sets out information about the remuneration of the Directors and senior management of the Company for the year ended 31 December 2013. In accordance with the Regulations, the information provided in the section entitled ‘Directors’ Remuneration – 1 January 2013 to 31 December 2013’ and accompanying notes has been audited by Ernst & Young LLP.
Audited information – Directors’ Remuneration – 1 January 2013 to 31 December 2013
Single Total Figure of RemunerationThe detailed emoluments received by the Executive and Non-executive Directors for the year ended 31 December 2013 are detailed below:
US$’000 Salary/Fees 2013
Benefits 2013
Annual Bonus
2013
Pension 2013
Total 2013
Salary/Fees 2012
Benefits 2012
Annual Bonus
2012
Pension 2012
Total 2012
Chairman
Alberto Baillères 47 0 0 0 47 (48) (0) (0) (0) (48)
Non-executive Directors
Juan Bordes 47 0 0 0 47 (48) (0) (0) (0) (48)
Rafael Mac Gregor 47 0 0 0 47 (48) (0) (0) (0) (48)
Lord Cairns 141 0 0 0 141 (145) (0) (0) (0) (145)
Arturo Fernández 47 0 0 0 47 (48) (0) (0) (0) (48)
Javier Fernández 47 0 0 0 47 (48) (0) (0) (0) (48)
Jaime Lomelín1 47 0 0 0 47 (1,069) (64) (214) (0) (1,347)
Fernando Ruiz 47 0 0 0 47 (48) (0) (0) (0) (48)
Guy Wilson 141 0 0 0 141 (145) (0) (0) (0) (145)
Fernando Solana 47 0 0 0 47 (48) (0) (0) (0) (48)
Alejandro Baillères 47 0 0 0 47 (34) (0) (0) (0) (34)
Maria Asuncion Aramburuzabala 47 0 0 0 47 (34) (0) (0) (0) (34)
Total 752 0 0 0 752 (1,763) (64) (214) (0) (2,041)
Executive Director (not on Board during the year)
Octavio Alvidrez1 852 116 109 88 1,165 (377) (15)2 (73)3 (38)4 (503)
Grand Total 1,604 116 109 88 1,917 (2,140) (79) (287) (38) (2,544)
1 Mr Lomelín’s total remuneration in 2012 included salary, benefits and annual bonus relating to his position as Chief Executive Officer (until August 2012) and fees paid for services as a Non-executive Director during the remainder of that year. Mr Alvidrez’ remuneration in 2012 relates to the period from his appointment as Chief Executive Officer (12 August 2012) until the end of that year.
2 Benefits provided to Mr Alvidrez include the cost of life insurance premiums 2013: US$12,678 (2012: US$0), club memberships 2013: US$44,074 (2012: US$0), subsistence and other meal benefits 2013: US$11,813 (2012: US$1,463), premiums for medical insurance covering limited expenses and check-ups 2013: US$1,628 (2012: US$1,234), chauffeur 2013: US$29,295 (2012: US$8,709), car 2013: US$14,773 (2012: US$4,040), and social security costs 2013: US$1,263 (2012: US$0). Benefits provided to Mr Lomelín in 2012 included subsistence and other meal benefits US$9,383, premiums for medical insurance covering limited expenses and check-ups US$1,302, personal security US$26,378, chauffeur US$23,185; and car 2013: US$3,629.
3 The basis of calculation for Mr Alvidrez’ annual bonus for 2013 is set out in the table below.
4 The Group operates two pension schemes: (i) a defined benefit scheme which was closed to new members on 1 July 2007 with benefits frozen at this date for existing members, subject to indexation with reference to the Mexican National Consumer Price Index; and (ii) a defined contribution scheme (which was introduced on 1 July 2007). On behalf of members earning a salary of no more than 25 times the minimum wage in force from time to time the employing company may make contributions of 5% to the scheme. The employing company may also make additional contributions between 5% and 8% of salary to this plan. Members may elect to match contribution percentages between 5% and 8% of salary. Mr Alvidrez is a member of the Company’s defined benefit scheme in respect of service before 30 June 2007 and of the defined contribution scheme in respect of service since 1 July 2007.
5 The Company does not operate a long-term incentive plan or any share-based incentives.
Annual Report on Remuneration

140 Fresnillo plc | Annual report 2013 www.fresnilloplc.com140 Fresnillo plc | Annual report 2013 vwww.fresnilloplc.com
Directors’ Remuneration Report continued Annual Report on Remuneration
The objectives, as applied to Mr Alvidrez’ incentive payment, the measures associated with each objective, and the relative weighting between objectives, are detailed below:
Objective Measure Weighting Points1
2013 Target
2013 Result
2013 Points
Award
Production Increase in equivalent ounces produced2 26 70.9 million equivalent ounces of silver 72.6 26.6
Exploration/growth Increase in total resources2 10 Maintain prior year total resources 7% 10.7
Increase in resources upgraded from inferred to indicated2
20 Maintain prior year total indicated 15% 23.0
Financial Net profit adjusted3 17 US$761 million US$636 million 14.2
Stakeholder Maintenance of environmental licences, avoidance of environmental incidents, achievement of planned community initiatives, relationship with communities and unions4
11 The target is made up of a series of licence, event or project deadline achievement measures. Discretion is used when assessing community and labour relations
13 13
Teamwork No measure4 11 Unmeasured (Outstanding = 7 points: Satisfactory (target) = 5 points; Underperformance = 0 points)
7 15.4
Safety Fatal accidents5, 6 5 Zero 2 0
Total 100 102.9
Adjustments – (1.0)
Total 100 101.9
1 The Points Weighting is considered by the Remuneration Committee each year to ensure that it reflects an appropriate balance of priorities for management. Where a change of emphasis is considered to be necessary, the Weighting will be amended in future years.
2 Any decrease in equivalent ounces produced and/or in reserves and resources will result in points being deducted from the total points scored.
3 Net profit is adjusted to exclude currency fluctuation, the effect of year-on-year changes in metals prices and any revaluation of the Silverstream contract.
4 The points awarded for the Stakeholder and Teamwork objectives are subject to some discretion. The following points are awarded depending on the Remuneration Committee’s assessment of the Teamwork effort: Outstanding = 7 points; Satisfactory = 5 points; Underperformance = 0 points.
5 In the event of a single fatality, zero points will be awarded for Safety. For the purposes of calculating fatalities; all fatalities are included, irrespective of whether they are employees or contractors. Conversely, in the event of zero fatalities during the year, the number of points awarded would be increased to 10 points.
6 In addition, to the penalty for a single fatality (see note 5), the number of points awarded will be further reduced by 1% if there are two fatalities, or by 2% if there are three fatalities, or by 3% if there are four fatalities etc.
Pension entitlementThe pension entitlement of the Chief Executive Officer is as follows:
Defined Contribution Scheme (DCS) Defined Benefit Scheme (DBS)
Rights as at 31 December 2013 US$223,587 US$382,623
Additional benefit in the event that the Chief Executive Officer retires early
In the event of early retirement, Mr Alvidrez is entitled to receive his accumulated contributions (both member and Company) to the DCS
Mr Alvidrez is not currently entitled to any additional benefit on early retirement in the DBS
US$‘000 Accumulated accrued benefits
Increase in accrued benefits during the year
Increase, before inflation, in accrued benefits during the year
At 31 Dec 2013 At 31 Dec 2012 2013 2012 2013 2012
Octavio Alvidrez 606 469 88 38 88 38
Mr Alvidrez is expected to retire at his Normal Retirement Age of 60 years old.
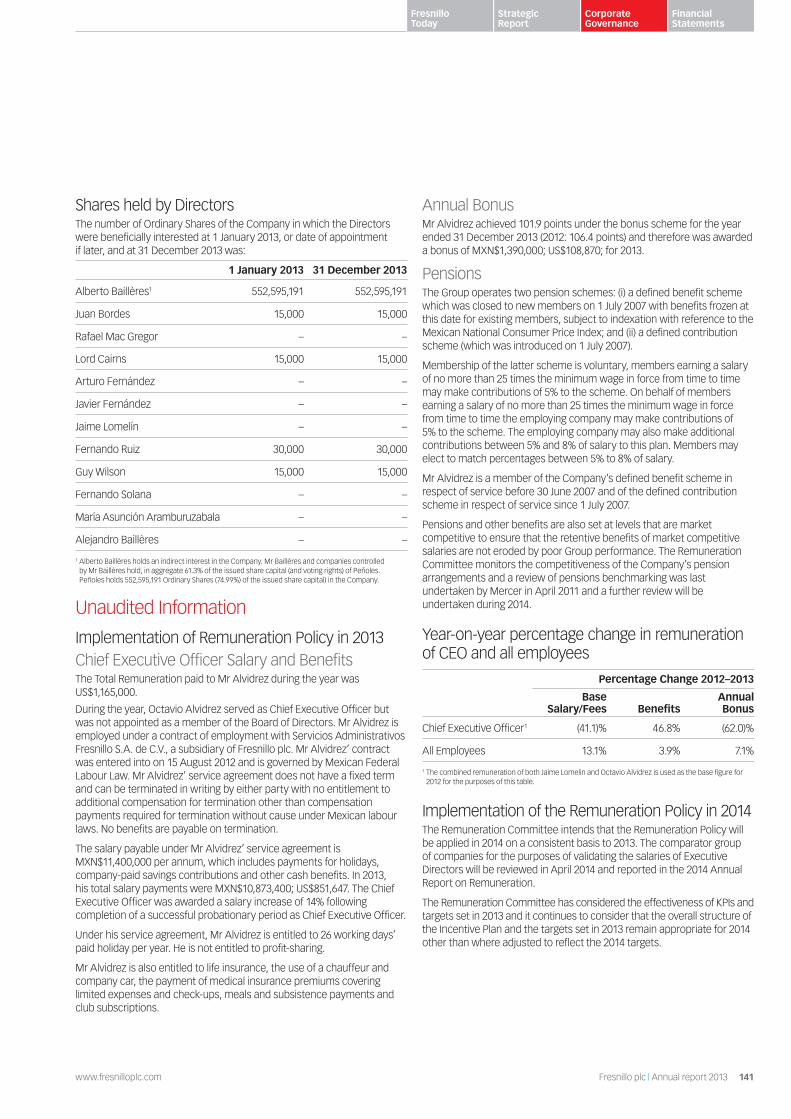
141www.fresnilloplc.com Fresnillo plc | Annual report 2013
Fresnillo Today
Strategic Report
Corporate Governance
Financial Statements
Shares held by DirectorsThe number of Ordinary Shares of the Company in which the Directors were beneficially interested at 1 January 2013, or date of appointment if later, and at 31 December 2013 was:
1 January 2013 31 December 2013
Alberto Baillères1 552,595,191 552,595,191
Juan Bordes 15,000 15,000
Rafael Mac Gregor – –
Lord Cairns 15,000 15,000
Arturo Fernández – –
Javier Fernández – –
Jaime Lomelín – –
Fernando Ruiz 30,000 30,000
Guy Wilson 15,000 15,000
Fernando Solana – –
María Asunción Aramburuzabala – –
Alejandro Baillères – –
1 Alberto Baillères holds an indirect interest in the Company. Mr Baillères and companies controlled by Mr Baillères hold, in aggregate 61.3% of the issued share capital (and voting rights) of Peñoles. Peñoles holds 552,595,191 Ordinary Shares (74.99%) of the issued share capital) in the Company.
Unaudited Information
Implementation of Remuneration Policy in 2013Chief Executive Officer Salary and BenefitsThe Total Remuneration paid to Mr Alvidrez during the year was US$1,165,000.
During the year, Octavio Alvidrez served as Chief Executive Officer but was not appointed as a member of the Board of Directors. Mr Alvidrez is employed under a contract of employment with Servicios Administrativos Fresnillo S.A. de C.V., a subsidiary of Fresnillo plc. Mr Alvidrez’ contract was entered into on 15 August 2012 and is governed by Mexican Federal Labour Law. Mr Alvidrez’ service agreement does not have a fixed term and can be terminated in writing by either party with no entitlement to additional compensation for termination other than compensation payments required for termination without cause under Mexican labour laws. No benefits are payable on termination.
The salary payable under Mr Alvidrez’ service agreement is MXN$11,400,000 per annum, which includes payments for holidays, company-paid savings contributions and other cash benefits. In 2013, his total salary payments were MXN$10,873,400; US$851,647. The Chief Executive Officer was awarded a salary increase of 14% following completion of a successful probationary period as Chief Executive Officer.
Under his service agreement, Mr Alvidrez is entitled to 26 working days’ paid holiday per year. He is not entitled to profit-sharing.
Mr Alvidrez is also entitled to life insurance, the use of a chauffeur and company car, the payment of medical insurance premiums covering limited expenses and check-ups, meals and subsistence payments and club subscriptions.
Annual BonusMr Alvidrez achieved 101.9 points under the bonus scheme for the year ended 31 December 2013 (2012: 106.4 points) and therefore was awarded a bonus of MXN$1,390,000; US$108,870; for 2013.
PensionsThe Group operates two pension schemes: (i) a defined benefit scheme which was closed to new members on 1 July 2007 with benefits frozen at this date for existing members, subject to indexation with reference to the Mexican National Consumer Price Index; and (ii) a defined contribution scheme (which was introduced on 1 July 2007).
Membership of the latter scheme is voluntary, members earning a salary of no more than 25 times the minimum wage in force from time to time may make contributions of 5% to the scheme. On behalf of members earning a salary of no more than 25 times the minimum wage in force from time to time the employing company may make contributions of 5% to the scheme. The employing company may also make additional contributions between 5% and 8% of salary to this plan. Members may elect to match percentages between 5% to 8% of salary.
Mr Alvidrez is a member of the Company’s defined benefit scheme in respect of service before 30 June 2007 and of the defined contribution scheme in respect of service since 1 July 2007.
Pensions and other benefits are also set at levels that are market competitive to ensure that the retentive benefits of market competitive salaries are not eroded by poor Group performance. The Remuneration Committee monitors the competitiveness of the Company’s pension arrangements and a review of pensions benchmarking was last undertaken by Mercer in April 2011 and a further review will be undertaken during 2014.
Year-on-year percentage change in remuneration of CEO and all employees
Percentage Change 2012–2013
Base Salary/Fees Benefits
Annual Bonus
Chief Executive Officer1 (41.1)% 46.8% (62.0)%
All Employees 13.1% 3.9% 7.1%
1 The combined remuneration of both Jaime Lomelin and Octavio Alvidrez is used as the base figure for 2012 for the purposes of this table.
Implementation of the Remuneration Policy in 2014The Remuneration Committee intends that the Remuneration Policy will be applied in 2014 on a consistent basis to 2013. The comparator group of companies for the purposes of validating the salaries of Executive Directors will be reviewed in April 2014 and reported in the 2014 Annual Report on Remuneration.
The Remuneration Committee has considered the effectiveness of KPIs and targets set in 2013 and it continues to consider that the overall structure of the Incentive Plan and the targets set in 2013 remain appropriate for 2014 other than where adjusted to reflect the 2014 targets.
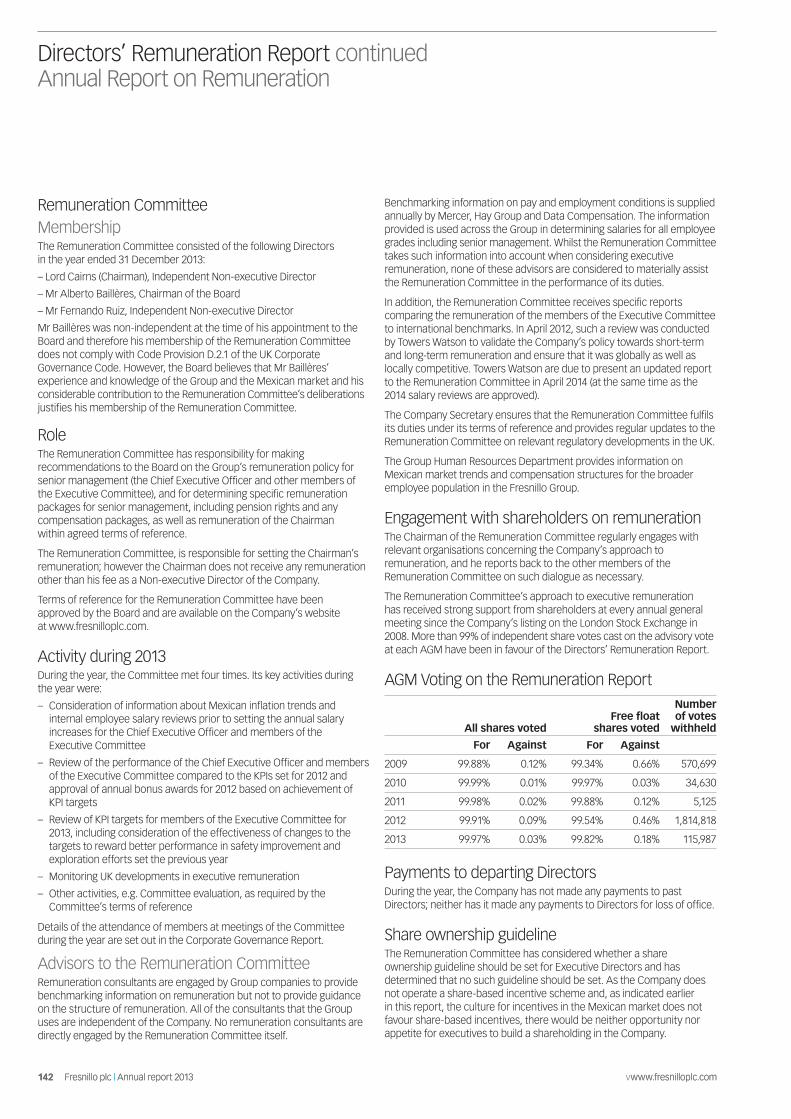
142 Fresnillo plc | Annual report 2013 www.fresnilloplc.com142 Fresnillo plc | Annual report 2013 vwww.fresnilloplc.com
Directors’ Remuneration Report continued Annual Report on Remuneration
Remuneration CommitteeMembershipThe Remuneration Committee consisted of the following Directors in the year ended 31 December 2013:
– Lord Cairns (Chairman), Independent Non-executive Director
– Mr Alberto Baillères, Chairman of the Board
– Mr Fernando Ruiz, Independent Non-executive Director
Mr Baillères was non-independent at the time of his appointment to the Board and therefore his membership of the Remuneration Committee does not comply with Code Provision D.2.1 of the UK Corporate Governance Code. However, the Board believes that Mr Baillères’ experience and knowledge of the Group and the Mexican market and his considerable contribution to the Remuneration Committee’s deliberations justifies his membership of the Remuneration Committee.
RoleThe Remuneration Committee has responsibility for making recommendations to the Board on the Group’s remuneration policy for senior management (the Chief Executive Officer and other members of the Executive Committee), and for determining specific remuneration packages for senior management, including pension rights and any compensation packages, as well as remuneration of the Chairman within agreed terms of reference.
The Remuneration Committee, is responsible for setting the Chairman’s remuneration; however the Chairman does not receive any remuneration other than his fee as a Non-executive Director of the Company.
Terms of reference for the Remuneration Committee have been approved by the Board and are available on the Company’s website at www.fresnilloplc.com.
Activity during 2013During the year, the Committee met four times. Its key activities during the year were:
– Consideration of information about Mexican inflation trends and internal employee salary reviews prior to setting the annual salary increases for the Chief Executive Officer and members of the Executive Committee
– Review of the performance of the Chief Executive Officer and members of the Executive Committee compared to the KPIs set for 2012 and approval of annual bonus awards for 2012 based on achievement of KPI targets
– Review of KPI targets for members of the Executive Committee for 2013, including consideration of the effectiveness of changes to the targets to reward better performance in safety improvement and exploration efforts set the previous year
– Monitoring UK developments in executive remuneration
– Other activities, e.g. Committee evaluation, as required by the Committee’s terms of reference
Details of the attendance of members at meetings of the Committee during the year are set out in the Corporate Governance Report.
Advisors to the Remuneration CommitteeRemuneration consultants are engaged by Group companies to provide benchmarking information on remuneration but not to provide guidance on the structure of remuneration. All of the consultants that the Group uses are independent of the Company. No remuneration consultants are directly engaged by the Remuneration Committee itself.
Benchmarking information on pay and employment conditions is supplied annually by Mercer, Hay Group and Data Compensation. The information provided is used across the Group in determining salaries for all employee grades including senior management. Whilst the Remuneration Committee takes such information into account when considering executive remuneration, none of these advisors are considered to materially assist the Remuneration Committee in the performance of its duties.
In addition, the Remuneration Committee receives specific reports comparing the remuneration of the members of the Executive Committee to international benchmarks. In April 2012, such a review was conducted by Towers Watson to validate the Company’s policy towards short-term and long-term remuneration and ensure that it was globally as well as locally competitive. Towers Watson are due to present an updated report to the Remuneration Committee in April 2014 (at the same time as the 2014 salary reviews are approved).
The Company Secretary ensures that the Remuneration Committee fulfils its duties under its terms of reference and provides regular updates to the Remuneration Committee on relevant regulatory developments in the UK.
The Group Human Resources Department provides information on Mexican market trends and compensation structures for the broader employee population in the Fresnillo Group.
Engagement with shareholders on remunerationThe Chairman of the Remuneration Committee regularly engages with relevant organisations concerning the Company’s approach to remuneration, and he reports back to the other members of the Remuneration Committee on such dialogue as necessary.
The Remuneration Committee’s approach to executive remuneration has received strong support from shareholders at every annual general meeting since the Company’s listing on the London Stock Exchange in 2008. More than 99% of independent share votes cast on the advisory vote at each AGM have been in favour of the Directors’ Remuneration Report.
AGM Voting on the Remuneration Report
All shares votedFree float
shares voted
Number of votes
withheld
For Against For Against
2009 99.88% 0.12% 99.34% 0.66% 570,699
2010 99.99% 0.01% 99.97% 0.03% 34,630
2011 99.98% 0.02% 99.88% 0.12% 5,125
2012 99.91% 0.09% 99.54% 0.46% 1,814,818
2013 99.97% 0.03% 99.82% 0.18% 115,987
Payments to departing DirectorsDuring the year, the Company has not made any payments to past Directors; neither has it made any payments to Directors for loss of office.
Share ownership guidelineThe Remuneration Committee has considered whether a share ownership guideline should be set for Executive Directors and has determined that no such guideline should be set. As the Company does not operate a share-based incentive scheme and, as indicated earlier in this report, the culture for incentives in the Mexican market does not favour share-based incentives, there would be neither opportunity nor appetite for executives to build a shareholding in the Company.

143www.fresnilloplc.com Fresnillo plc | Annual report 2013
Fresnillo Today
Strategic Report
Corporate Governance
Financial Statements
Performance reviewsAs required by the Regulations, the following graph sets out the performance of the Company’s share price since its listing compared to the FTSE 100 Index. This is deemed to be the most appropriate indices for comparative purposes.
The total remuneration of the Chief Executive Officer for the past five years, in US dollars, has been as follows:
Year ending 31 December 2009 2010 2011 2012 2013
Chief Executive Officer Jaime Lomelin Octavio Alvidrez
Total Remuneration US$’000s
– Jaime Lomelin 1,704 1,911 1,698 1,3291 –
– Octavio Alvidrez – – – 580 1,165
Total 1,704 1,911 1,698 1,909 1,165
Percentage change on previous year (1.5%) 12.1% (11.1%) 12.4% (39.0%)
Proportion of maximum bonus paid to CEO in year
Jaime Lomelin 100.00% 100.00% 33.33% 66.66% –
Octavio Alvidrez – – – 66.66% 33.33%
1 This figure only relates to remuneration paid to Jamie Lomelin in his capacity as Chief Executive Officer in 2012.
Relative importance of the spend on pay
2013 2012 % Change
Staff Costs (US$’000s)1 82,977 76,370 8.6%
Distributions to shareholders (US$’000’s) 505,174 398,024 26.9%
1 Staff costs are taken without PTU in order to make a like-for-like comparison with the Chief Executive Officer who does not receive PTU.
This Report has been approved by the Board of Directors of Fresnillo plc.
Signed on behalf of the Board.
Lord Cairns Chairman of the Remuneration Committee 3 March 2014
18/0
6/08
18/0
9/08
18/0
3/09
18/0
6/09
18/0
9/09
18/1
2/09
18/0
3/10
18/0
6/10
17/0
9/10
17/1
2/10
18/0
3/11
17/0
6/11
19/0
9/11
19/1
2/11
19/0
3/12
18/0
6/12
18/0
9/12
18/1
2/12
18/0
3/13
18/0
6/13
18/0
9/13
18/1
2/13
03/0
3/14
18/1
2/08
0
50
100
150
200
250
300
350
400Fresnillo – Total return index
FTSE 100 – Total return index
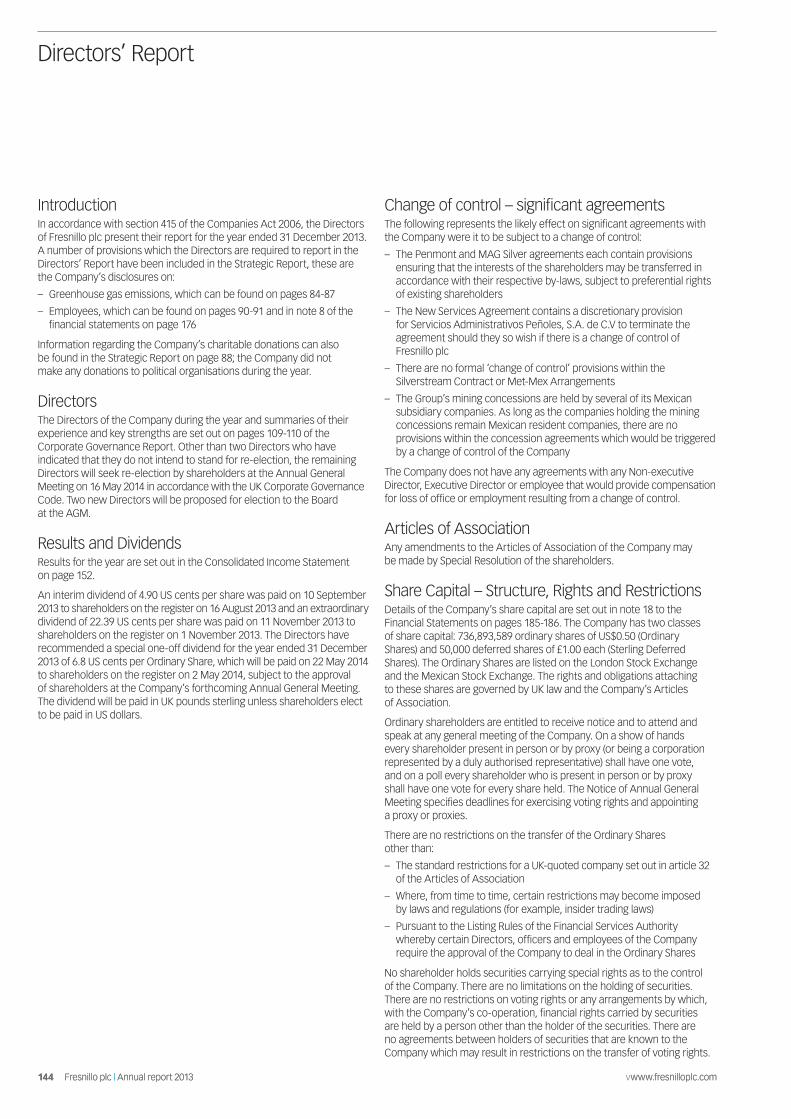
144 Fresnillo plc | Annual report 2013 www.fresnilloplc.com144 Fresnillo plc | Annual report 2013 vwww.fresnilloplc.com
Directors’ Report
Introduction In accordance with section 415 of the Companies Act 2006, the Directors of Fresnillo plc present their report for the year ended 31 December 2013. A number of provisions which the Directors are required to report in the Directors’ Report have been included in the Strategic Report, these are the Company’s disclosures on:
– Greenhouse gas emissions, which can be found on pages 84-87
– Employees, which can be found on pages 90-91 and in note 8 of the financial statements on page 176
Information regarding the Company’s charitable donations can also be found in the Strategic Report on page 88; the Company did not make any donations to political organisations during the year.
DirectorsThe Directors of the Company during the year and summaries of their experience and key strengths are set out on pages 109-110 of the Corporate Governance Report. Other than two Directors who have indicated that they do not intend to stand for re-election, the remaining Directors will seek re-election by shareholders at the Annual General Meeting on 16 May 2014 in accordance with the UK Corporate Governance Code. Two new Directors will be proposed for election to the Board at the AGM.
Results and DividendsResults for the year are set out in the Consolidated Income Statement on page 152.
An interim dividend of 4.90 US cents per share was paid on 10 September 2013 to shareholders on the register on 16 August 2013 and an extraordinary dividend of 22.39 US cents per share was paid on 11 November 2013 to shareholders on the register on 1 November 2013. The Directors have recommended a special one-off dividend for the year ended 31 December 2013 of 6.8 US cents per Ordinary Share, which will be paid on 22 May 2014 to shareholders on the register on 2 May 2014, subject to the approval of shareholders at the Company’s forthcoming Annual General Meeting. The dividend will be paid in UK pounds sterling unless shareholders elect to be paid in US dollars.
Change of control – significant agreementsThe following represents the likely effect on significant agreements with the Company were it to be subject to a change of control:
– The Penmont and MAG Silver agreements each contain provisions ensuring that the interests of the shareholders may be transferred in accordance with their respective by-laws, subject to preferential rights of existing shareholders
– The New Services Agreement contains a discretionary provision for Servicios Administrativos Peñoles, S.A. de C.V to terminate the agreement should they so wish if there is a change of control of Fresnillo plc
– There are no formal ‘change of control’ provisions within the Silverstream Contract or Met-Mex Arrangements
– The Group’s mining concessions are held by several of its Mexican subsidiary companies. As long as the companies holding the mining concessions remain Mexican resident companies, there are no provisions within the concession agreements which would be triggered by a change of control of the Company
The Company does not have any agreements with any Non-executive Director, Executive Director or employee that would provide compensation for loss of office or employment resulting from a change of control.
Articles of AssociationAny amendments to the Articles of Association of the Company may be made by Special Resolution of the shareholders.
Share Capital – Structure, Rights and RestrictionsDetails of the Company’s share capital are set out in note 18 to the Financial Statements on pages 185-186. The Company has two classes of share capital: 736,893,589 ordinary shares of US$0.50 (Ordinary Shares) and 50,000 deferred shares of £1.00 each (Sterling Deferred Shares). The Ordinary Shares are listed on the London Stock Exchange and the Mexican Stock Exchange. The rights and obligations attaching to these shares are governed by UK law and the Company’s Articles of Association.
Ordinary shareholders are entitled to receive notice and to attend and speak at any general meeting of the Company. On a show of hands every shareholder present in person or by proxy (or being a corporation represented by a duly authorised representative) shall have one vote, and on a poll every shareholder who is present in person or by proxy shall have one vote for every share held. The Notice of Annual General Meeting specifies deadlines for exercising voting rights and appointing a proxy or proxies.
There are no restrictions on the transfer of the Ordinary Shares other than:
– The standard restrictions for a UK-quoted company set out in article 32 of the Articles of Association
– Where, from time to time, certain restrictions may become imposed by laws and regulations (for example, insider trading laws)
– Pursuant to the Listing Rules of the Financial Services Authority whereby certain Directors, officers and employees of the Company require the approval of the Company to deal in the Ordinary Shares
No shareholder holds securities carrying special rights as to the control of the Company. There are no limitations on the holding of securities. There are no restrictions on voting rights or any arrangements by which, with the Company’s co-operation, financial rights carried by securities are held by a person other than the holder of the securities. There are no agreements between holders of securities that are known to the Company which may result in restrictions on the transfer of voting rights.
145www.fresnilloplc.com Fresnillo plc | Annual report 2013
Fresnillo Today
Strategic Report
Corporate Governance
Financial Statements
The Sterling Deferred Shares only entitle the shareholder to payment of the amount paid up after repayment to Ordinary Shareholders on winding up or on a return of capital. The Sterling Deferred Shares do not entitle the holder to payment of any dividend, or to receive notice or to attend and speak at any general meeting of the Company. The Company may also at its option redeem the Sterling Deferred Shares at a price of £1.00 or, as custodian, purchase or cancel the Sterling Deferred Shares or require the holder to transfer the Sterling Deferred Shares. Except at the option of the Company, the Sterling Deferred Shares are not transferable.
Authority to purchase own shares The Company was authorised by a shareholders’ resolution passed at the Annual General Meeting held in May 2013 to purchase up to 10% of its issued Ordinary Share capital. Any shares which have been bought back may be held as treasury shares or, if not so held, must be cancelled immediately upon completion of the purchase, thereby reducing the amount of the Company’s issued and authorised share capital. This authority will expire at the forthcoming Annual General Meeting and a resolution to renew the authority for a further year will be proposed. No shares were purchased by the Company during the year.
Directors’ interestsThe number of Ordinary Shares of the Company in which the Directors were beneficially interested at 1 January 2013, or date of appointment if later, and at 31 December 2013 is set out in the Directors’ Remuneration Report on page 141.
No Director had any dealings in the shares of the Company between 31 December 2013 and 3 March 2014.
Directors’ indemnitiesThe Company has deeds of indemnity in place with the Directors in respect of a liability arising against them in connection with the Company’s (and any associated company’s) activities and (if relevant) where Directors act as pension trustees. These deeds are in place at the date of this report and operate subject to the conditions set out in the Companies Act 2006.
Directors’ and Officers’ Liability InsuranceDirectors’ and Officers’ Liability Insurance cover is in place at the date of this report. A review of the cover was carried out in July 2013. The Board remains satisfied that an appropriate level of cover is in place and a review of cover will take place on an annual basis.
Major interests in sharesAs at 3 March 2014, the Company had been advised, of the following notifiable interests (whether directly or indirectly held) in its voting rights:
Notification received from:
Number of voting rights
%
Peñoles 552,595,191 74.99
BlackRock, Inc1 43,719,310 5.94
1 Includes interests held by BlackRock Global Funds.
Financial risk managementThe Company’s objectives and policies on financial risk management including information on the Company’s exposures to Market risk, including foreign currency, commodity price, interest rate, inflation rate and equity price risks; Credit risk and Liquidity risk can be found in note 31 to the financial statements.
Going concernThe Group’s business activities, together with the factors likely to affect its future development, performance and position are set out in the Strategic Review on pages 12-53. The financial position of the Group, its cash flows and liquidity position are described in the Financial Review on pages 92-103. In addition, note 31 to the financial statements includes the Group’s objectives, policies and processes for managing its capital; its financial risk management objectives; details of its financial instruments and hedging activities; and its exposures to credit risk and liquidity risk.
After making enquiries, the Directors have a reasonable expectation that the Company has adequate resources to continue in operational existence for the foreseeable future. In making this assessment they have considered the Company and Group budgets, and cash flow forecasts for the period to December 2015, including the exploration and capital expenditure plans and sensitivities around those plans and the assumptions underlying the future trend on operating costs. They have also considered the sensitivities of the cash flow forecasts to movements in metal prices. The Company has considerable financial resources, which were enhanced by the US$800 million Senior Note bond issue in November 2013 and is operating within a sector that is experiencing relatively stable demand for its products, albeit at much reduced prices compared to the prior year. The Directors therefore have a reasonable expectation that the Company and the Group have adequate resources to continue in operational existence for the foreseeable future. Thus they continue to adopt the going concern basis of accounting in preparing the annual financial statements.
Audit informationEach of the Directors at the date of the approval of this report confirms that:
– So far as he or she is aware, there is no relevant audit information of which the Company’s auditors are unaware
– He/she has taken all the reasonable steps that he/she ought to have taken as a Director to make himself/herself aware of any relevant audit information and to establish that the Company’s auditors are aware of the information
The confirmation is given and should be interpreted in accordance with the provisions of section 418 of the Companies Act 2006.
AuditorsThe Auditors, Ernst & Young LLP have indicated their willingness to continue in office and a resolution seeking to reappoint them will be proposed at the Annual General Meeting.
Post balance sheet eventsNo material post balance sheet events have occurred as at the date of this report.
146 Fresnillo plc | Annual report 2013 www.fresnilloplc.com146 Fresnillo plc | Annual report 2013 vwww.fresnilloplc.com
Directors’ Report continued
Annual General MeetingThe Company’s Annual General Meeting will be held at Linklaters, One Silk Street, London, EC2Y 8HQ on Friday 16 May 2014 at 12.00 noon. Details of the meeting venue and the resolutions to be proposed are set out in a separate Notice of Meeting which accompanies the Annual Report.
The Directors’ Report has been approved by the Board of Directors of Fresnillo plc.
Signed on behalf of the Board.
Lord Cairns Senior Independent Director 3 March 2014
Fresnillo plc Registered Office: 28 Grosvenor Street London W1K 4QR United Kingdom Company No: 6344120

147www.fresnilloplc.com Fresnillo plc | Annual report 2013
Fresnillo Today
Strategic Report
Corporate Governance
Financial Statements
The Directors are responsible for preparing the Annual Report and the Group and Parent Company financial statements in accordance with applicable United Kingdom law and those International Financial Reporting Standards (IFRS) adopted by the European Union.
The Directors are required to prepare financial statements for each financial year which present a true and fair view of the financial position of the Company and of the Group and the financial performance and cash flows of the Company and of the Group for that period. In preparing those financial statements, the Directors are required to:
– Select suitable accounting policies in accordance with IAS 8: ‘Accounting Policies, Changes in Accounting Estimates and Errors’ and then apply them consistently
– Present information, including accounting policies, in a manner that provides relevant, reliable, comparable and understandable information
– Provide additional disclosures when compliance with the specific requirements in IFRS is insufficient to enable users to understand the impact of particular transactions, other events and conditions on the Company and of the Group’s financial position and financial performance
– State that the Company and the Group has complied with IFRS, subject to any material departures disclosed and explained in the financial statements
– Prepare the accounts on a going concern basis unless, having assessed the ability of the Company and the Group to continue as a going concern, management either intends to liquidate the entity or to cease trading, or have no realistic alternative but to do so
The Directors are responsible for keeping proper accounting records which disclose with reasonable accuracy at any time the financial position of the Company and of the Group and enable them to ensure that the financial statements comply with the Companies Acts 2006 and Article 4 of the IAS Regulation. They are also responsible for safeguarding the assets of the Company and the Group and hence for taking reasonable steps for the prevention and detection of fraud and other irregularities.
Under applicable UK law and regulations the Directors are responsible for the preparation of a Directors’ Report, Directors’ Remuneration Report and Corporate Governance Report that comply with that law and regulations. In addition the Directors are responsible for the maintenance and integrity of the corporate and financial information included on the Company’s website. Legislation in the UK governing the preparation and dissemination of financial statements may differ from legislation in other jurisdictions.
Neither the Company nor the Directors accept any liability to any person in relation to the annual financial report except to the extent that such liability could arise under English law. Accordingly, any liability to a person who has demonstrated reliance on any untrue or misleading statement or omission shall be determined in accordance with section 90A and schedule 10A of the Financial Services and Markets Act 2000.
In accordance with Provision C.1.1 of the UK Corporate Governance Code, the Directors consider that the Annual Report and Accounts, taken as a whole, is fair, balanced and understandable and provides information to enable shareholders to assess the Company’s performance, business model and strategy.
Responsibility Statement of the Directors in Respect of the Annual Report and AccountsI confirm on behalf of the Board that to the best of its knowledge:
a) the financial statements, prepared in accordance with International Financial Reporting Standards as adopted by the European Commission, give a true and fair view of the assets, liabilities, financial position and profit and loss of the Company and the undertakings included in the consolidation taken as a whole; and
b) the management report (encompassed within the Overview, ‘Strategic Report’, ‘Performance’ and ‘Governance’ sections) includes a fair review of the development and performance of the business, and the position of the Company and the undertakings included in the consolidation taken as a whole, together with a description of the principal risks and uncertainties that they face.
For and on behalf of the Board
Lord Cairns Senior Independent Director 3 March 2014
Statement of Directors’ Responsibilities in Relation to Group and Parent Company Financial Statements

148 Fresnillo plc | Annual report 2013 www.fresnilloplc.com
Modern beneficiation facilities at Saucito
Independent Auditor’s Report 149
Consolidated Financial Statements 152
Notes to the Consolidated Financial Statements 158
Parent Company Financial Statements 208
Notes to the Parent Company Financial Statements 211
Additional Information 232
Reserves and Resources Tables 232
Operating Statistics 236
Glossary 238
Shareholder Information 240
Financial Statements
Independent Auditor’s Report to the members of Fresnillo plc
We have audited the financial statements of Fresnillo plc for the year ended 31 December 2013 which comprise the consolidated income statement, the consolidated and parent Company statement of comprehensive income, the consolidated and parent Company balance sheets, the consolidated and parent Company cash flow statements, the consolidated and parent Company statements of changes in equity and the related notes. The financial reporting framework that has been applied in their preparation is applicable law and International Financial Reporting Standards (IFRSs) as adopted by the European Union and, as regards the Parent Company financial statements, as applied in accordance with the provisions of the Companies Act 2006.
This report is made solely to the Company’s members, as a body, in accordance with Chapter 3 of Part 16 of the Companies Act 2006. Our audit work has been undertaken so that we might state to the Company’s members those matters we are required to state to them in an auditor’s report and for no other purpose. To the fullest extent permitted by law, we do not accept or assume responsibility to anyone other than the Company and the Company’s members as a body, for our audit work, for this report, or for the opinions we have formed.
Respective responsibilities of Directors and auditor As explained more fully in the Statement of Directors’ Responsibilities set out on page 147, the Directors are responsible for the preparation of the financial statements and for being satisfied that they give a true and fair view. Our responsibility is to audit and express an opinion on the financial statements in accordance with applicable law and International Standards on Auditing (UK and Ireland). Those standards require us to comply with the Auditing Practices Board’s Ethical Standards for Auditors.
Scope of the audit of the financial statements An audit involves obtaining evidence about the amounts and disclosures in the financial statements sufficient to give reasonable assurance that the financial statements are free from material misstatement, whether caused by fraud or error. This includes an assessment of: whether the accounting policies are appropriate to the Group’s and the parent Company’s circumstances and have been consistently applied and adequately disclosed; the reasonableness of significant accounting estimates made by the Directors; and the overall presentation of the financial statements. In addition, we read all the financial and non-financial information in the 2013 Annual Report to identify material inconsistencies with the audited financial statements and to identify any information that is apparently materially incorrect based on, or materially inconsistent with, the knowledge acquired by us in the course of performing the audit. If we become aware of any apparent material misstatements or inconsistencies, we consider the implications for our report.
Opinion on financial statements In our opinion:
– The financial statements give a true and fair view of the state of the Group’s and of the parent Company’s affairs as at 31 December 2013 and of the Group’s profit for the year then ended;
– The Group financial statements have been properly prepared in accordance with IFRSs as adopted by the European Union;
– The Parent Company financial statements have been properly prepared in accordance with IFRSs as adopted by the European Union and as applied in accordance with the provisions of the Companies Act 2006; and
– The financial statements have been prepared in accordance with the requirements of the Companies Act 2006 and, as regards the Group financial statements, Article 4 of the IAS Regulation.
Our assessment of risk of material misstatement We identified the following risks that have had the greatest effect on the overall audit strategy; the allocation of resources in the audit; and directing the efforts of the engagement team:
– Inaccuracies in the recognition of related party transactions, including inappropriate revenue recognition
– Inappropriate valuation of the Silverstream contract
– Inappropriate mineral reserves and resources estimation
– Inaccuracies in the disclosures, provisions and asset values arising from litigation and land disputes
– Inappropriate assessment of impairment of mining assets
149www.fresnilloplc.com Fresnillo plc | Annual report 2013
Fresnillo Today
Strategic Report
Corporate Governance
Financial Statements

Independent Auditor’s Report continued to the members of Fresnillo plc
Our application of materiality We apply the concept of materiality both in planning and performing our audit, and in evaluating the effect of misstatements on our audit and on the financial statements. For the purposes of determining whether the financial statements are free from material misstatement we define materiality as the magnitude of misstatement that makes it probable that the economic decisions of a reasonably knowledgeable person, relying on the financial statements, would be changed or influenced.
When establishing our overall audit strategy, we determined a magnitude of uncorrected misstatements that we judged would be material for the financial statements as a whole. This materiality is a significant driver of our scoping of the audit. We calculated materiality at the planning stage of our audit and updated it based on actual full-year results which reflected the continued decline in precious metals prices and the disrupted operations at Minera Penmont as explained in the financial review. Our final determination of materiality was US$23.6 million, which is 5% of profit before tax and before the effects of the Silverstream revaluation.
On the basis of our risk assessments, together with our assessment of the Group’s overall control environment, our judgement is that overall performance materiality for the Group should be 75% of final materiality, namely US$17.7 million. Our objective in adopting this approach was to reduce to an appropriately low level the probability that the aggregate of uncorrected and undetected misstatements exceeds materiality.
We agreed with the Audit Committee that we would report to the Committee all audit differences in excess of US$1.2 million, as well as differences below that threshold that in our view warranted reporting on qualitative grounds.
An overview of the scope of our audit Our assessment of audit risk and our evaluation of materiality determined our audit strategy and scope. The factors that we considered in our assessment included the following: financial significance, specific risks, effectiveness of the control environment and monitoring activities, including entity-level controls and recent internal audit findings.
Following our assessment of the risk of material misstatement to the Group financial statements, we selected eight components which represent the principal business units within the Group and account for 87% of the Group’s profit before tax and 96% of the Group’s net assets. Five of these were subject to a full audit, whilst the remaining three were subject to a partial audit where the extent of audit work was based on our assessment of the risks of material misstatement and of the materiality of the Group’s business operations at that component. They were also selected to provide an appropriate basis for undertaking audit work to address the risks of material misstatement identified above. For the remaining components, we performed other procedures to confirm that there was no residual risk of material misstatement in the Group financial statements.
The Group’s significant operations are in Mexico. All of the components are audited by one local team under our direct supervision. We visited the local team during all stages of the audit, participated in discussions on fraud and error and reviewed key working papers including but not limited to the risk areas described above. The audit work at the eight components was executed at levels of materiality applicable to each individual component, which were lower than Group materiality.
Our response to the risks identified above was as follows: – We assessed management’s process for identifying and recording related party transactions. We read contracts and agreements with related
parties to understand the nature of the transactions. Throughout the performance of our audit procedures, we remained alert for any related party transactions outside the normal course of business. We compared actual results against detailed expectations of income statement line items impacted by related party transactions to corroborate that these have not been manipulated through related party relationships. We performed revenue cut-off testing and evaluated the appropriateness of the application of provisional pricing at year end. We ensured that related party disclosures in the financial statements are consistent with the knowledge we gained through the performance of our audit procedures.
– With the support from our valuation specialists, we evaluated the valuation model used by the Company to determine the fair value of the Silverstream contract. We challenged management’s estimations and judgement with regard to inputs and key assumptions to the model through a comparison to market data and an analysis of the consistency in use of assumptions within other areas of the business.
– We assessed the professional competence, objectivity, and capabilities of the experts engaged by the Company to audit reserves and resources estimates. We ensured that the scope of the work undertaken by the experts was appropriate. We read the report of the external experts and gained an understanding of the changes in reserves and resources estimates in the year. We assessed the reasonableness of the estimation method applied by management to arrive at the price at which the ore cut-off grade is determined. We ensured that this price was not inconsistent with price assumptions applied in other areas of the business. We ensured that the reserves and resources estimates have been correctly applied to the relevant areas of the Group’s financial statements including depreciation, depletion and amortisation, impairment and going concern.
– We evaluated management’s assessment of the litigation and claims and considered the requirement for any provision and related disclosures. We challenged management’s assessment of the likelihood that further economic benefits will flow from the use of the assets impacted by land disputes and of indicators of impairment in respect of those assets. Our procedures included obtaining independent legal confirmation letters from the Group’s external lawyers handling these issues, holding discussions with management and the Group’s internal lawyers, examining underlying discounted cash flow models and analysing pertinent correspondence between the involved parties.
– We have examined the valuation models that underpin management’s assessment of impairment in respect of the Group’s mining assets. We ensured that the methodology used within the models was compliant with IFRS requirements. We challenged the inputs and key assumptions in the models through a comparison with external sources of market data and to other areas within the Group financial statements.
150 Fresnillo plc | Annual report 2013 www.fresnilloplc.com
Opinion on other matters prescribed by the Companies Act 2006 In our opinion:
– The part of the Directors’ remuneration report to be audited has been properly prepared in accordance with the Companies Act 2006; and
– The information given in the strategic report and the Directors’ report for the financial year for which the financial statements are prepared is consistent with the financial statements.
Matters on which we are required to report by exception We have nothing to report in respect of the following:
Under the ISAs (UK and Ireland), we are required to report to you if, in our opinion, information in the Annual Report is:
– Materially inconsistent with the information in the audited financial statements
– Apparently materially incorrect based on, or materially inconsistent with, our knowledge of the Group acquired in the course of performing our audit is otherwise misleading.
In particular, we are required to consider whether we have identified any inconsistencies between our knowledge acquired during the audit and the Directors’ statement that they consider the Annual Report is fair, balanced and understandable and whether the Annual Report appropriately discloses those matters that we communicated to the Audit Committee which we consider should have been disclosed.
Under the Companies Act 2006, we are required to report to you if, in our opinion:
– Adequate accounting records have not been kept by the parent Company, or returns adequate for our audit have not been received from branches not visited by us
– The parent Company financial statements and the part of the Directors’ remuneration report to be audited are not in agreement with the accounting records and returns
– Certain disclosures of Directors’ remuneration specified by law are not made
– We have not received all the information and explanations we require for our audit.
Under the Listing Rules we are required to review:
– The directors’ statement, on page 147, in relation to going concern
– The part of the corporate governance report relating to the Company’s compliance with the nine provisions of the UK Corporate Governance Code specified for our review.
Nick Gomer (Senior statutory auditor) for and on behalf of Ernst & Young LLP, Statutory Auditor London
3 March 2014
151www.fresnilloplc.com Fresnillo plc | Annual report 2013
Fresnillo Today
Strategic Report
Corporate Governance
Financial Statements
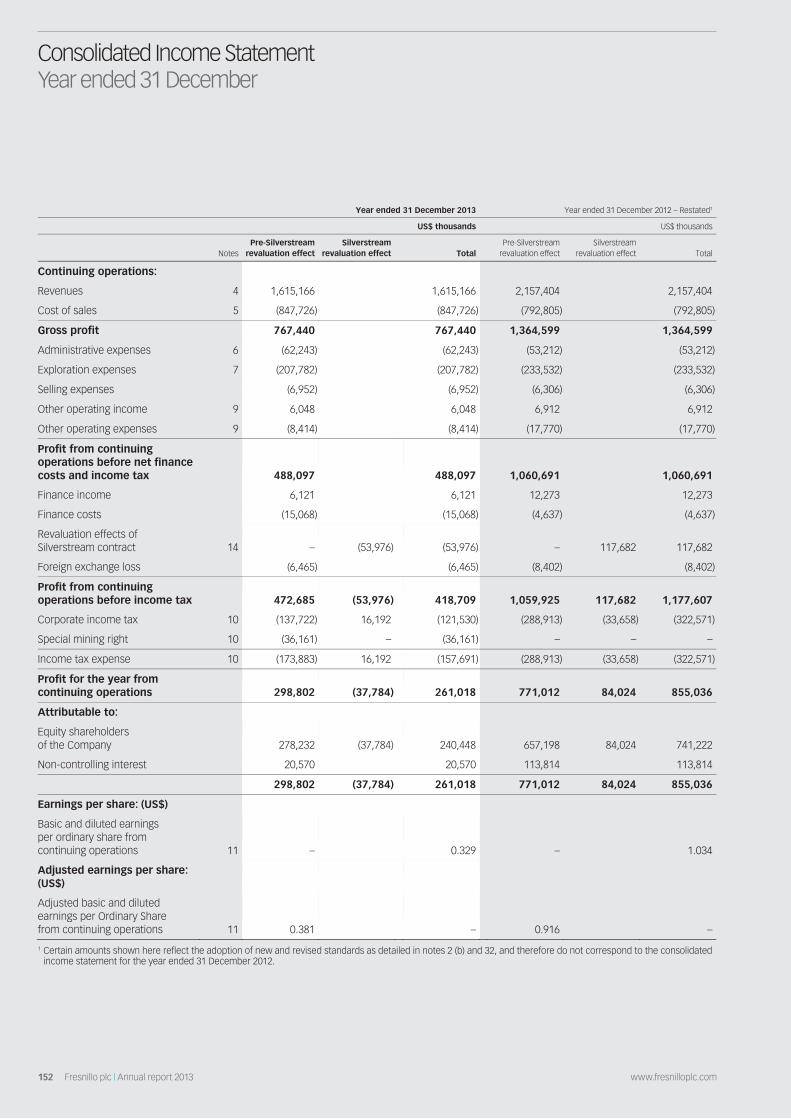
Consolidated Income Statement Year ended 31 December
Year ended 31 December 2013 Year ended 31 December 2012 – Restated1
US$ thousands US$ thousands
NotesPre-Silverstream
revaluation effect Silverstream
revaluation effect TotalPre-Silverstream
revaluation effect Silverstream
revaluation effect Total
Continuing operations:
Revenues 4 1,615,166 1,615,166 2,157,404 2,157,404
Cost of sales 5 (847,726) (847,726) (792,805) (792,805)
Gross profit 767,440 767,440 1,364,599 1,364,599
Administrative expenses 6 (62,243) (62,243) (53,212) (53,212)
Exploration expenses 7 (207,782) (207,782) (233,532) (233,532)
Selling expenses (6,952) (6,952) (6,306) (6,306)
Other operating income 9 6,048 6,048 6,912 6,912
Other operating expenses 9 (8,414) (8,414) (17,770) (17,770)
Profit from continuing operations before net finance costs and income tax 488,097 488,097 1,060,691 1,060,691
Finance income 6,121 6,121 12,273 12,273
Finance costs (15,068) (15,068) (4,637) (4,637)
Revaluation effects of Silverstream contract 14 – (53,976) (53,976) – 117,682 117,682
Foreign exchange loss (6,465) (6,465) (8,402) (8,402)
Profit from continuing operations before income tax 472,685 (53,976) 418,709 1,059,925 117,682 1,177,607
Corporate income tax 10 (137,722) 16,192 (121,530) (288,913) (33,658) (322,571)
Special mining right 10 (36,161) – (36,161) – – –
Income tax expense 10 (173,883) 16,192 (157,691) (288,913) (33,658) (322,571)
Profit for the year from continuing operations 298,802 (37,784) 261,018 771,012 84,024 855,036
Attributable to:
Equity shareholders of the Company 278,232 (37,784) 240,448 657,198 84,024 741,222
Non-controlling interest 20,570 20,570 113,814 113,814
298,802 (37,784) 261,018 771,012 84,024 855,036
Earnings per share: (US$)
Basic and diluted earnings per ordinary share from continuing operations 11 – 0.329 – 1.034
Adjusted earnings per share: (US$)
Adjusted basic and diluted earnings per Ordinary Share from continuing operations 11 0.381 – 0.916 –
1 Certain amounts shown here reflect the adoption of new and revised standards as detailed in notes 2 (b) and 32, and therefore do not correspond to the consolidated income statement for the year ended 31 December 2012.
152 Fresnillo plc | Annual report 2013 www.fresnilloplc.com

Consolidated Statement of Comprehensive Income Year ended 31 December
Year ended 31 December
Notes 2013
US$ thousands2012 – Restated1
US$ thousands
Profit for the year 261,018 855,036
Other comprehensive (expense)/income
Items to be reclassified to profit or loss in subsequent periods:
Net (losses)/gains on cash flow hedges recycled to income statement (3,959) 2,488
Income tax effect 10 1,188 (746)
Net unrealised gains on cash flow hedges 3,792 5,924
Income tax effect 10 (1,138) (1,777)
Net effect of cash flow hedges (117) 5,889
Fair value (losses)/gains on available-for-sale financial assets 13 (64,197) 29,556
Income tax effect 10 17,975 (8,276)
Impairment of available-for-sale financial assets 2,053 –
Income tax effect 10 (559) –
Net effect of available-for-sale financial assets (44,728) 21,280
Foreign currency translation 179 (60)
Net other comprehensive (expense)/income to be reclassified to profit or loss in subsequent periods (44,666) 27,109
Items not to be reclassified to profit or loss in subsequent periods:
Gains on cash flow hedges reclassified to the value of other assets 219 965
Income tax effect 10 (65) (289)
Remeasurement (losses)/gains on defined benefit plans 22 (1,725) 826
Income tax effect 10 109 (248)
Net other comprehensive (expense)/income not to be reclassified to profit or loss in subsequent periods (1,462) 1,254
Other comprehensive (expense)/income, net of tax (46,128) 28,363
Total comprehensive income for the year, net of tax 214,890 883,399
Attributable to:
Equity shareholders of the Company 194,368 769,360
Non-controlling interest 20,522 114,039
214,890 883,399
1 Certain amounts shown here reflect the adoption of new and revised standards as detailed in notes 2 (b) and 32, and therefore do not correspond to the consolidated statement of comprehensive income for the year ended 31 December 2012.
153www.fresnilloplc.com Fresnillo plc | Annual report 2013
Fresnillo Today
Strategic Report
Corporate Governance
Financial Statements

Consolidated Balance Sheet As at 31 December
As at 31 December
Notes 2013
US$ thousands 2012 – Restated1
US$ thousands
ASSETS
Non-current assets
Property, plant and equipment 12 1,838,124 1,497,684
Available-for-sale financial assets 13 63,245 127,442
Silverstream contract 14 334,083 419,489
Deferred tax asset 10 56,209 70,815
Other receivables 16 14,910 21,003
Other assets 4,031 2,171
2,310,602 2,138,604
Current assets
Inventories 15 208,141 194,614
Trade and other receivables 16 188,057 263,644
Income tax recoverable 79,410 –
Prepayments 5,330 3,103
Derivative financial instruments 30 2,057 2,842
Silverstream contract 14 38,763 68,290
Cash and cash equivalents 17 1,251,694 613,773
1,773,452 1,146,266
Total assets 4,084,054 3,284,870
EQUITY AND LIABILITIES
Capital and reserves attributable to shareholders of the Company
Share capital 18 368,546 358,680
Share premium 18 1,153,817 818,597
Capital reserve 18 (526,910) (526,910)
Net unrealised gains on cash flow hedges 18 721 684
Net unrealised gains on available-for-sale financial assets 18 7,845 52,573
Foreign currency translation reserve 18 (363) (542)
Retained earnings 18 1,269,781 1,536,075
2,273,437 2,239,157
Non-controlling interest 398,534 373,082
Total equity 2,671,971 2,612,239
Non-current liabilities
Interest-bearing loans 20 795,306 –
Provision for mine closure cost 21 127,008 104,712
Provision for pensions and other post-employment benefit plans 22 11,475 10,723
Deferred tax liability 10 334,181 379,961
1,267,970 495,396
1 Certain amounts shown here reflect the adoption of new and revised standards as detailed in notes 2 (b) and 32, and therefore do not correspond to the consolidated balance sheet as at 31 December 2012.
154 Fresnillo plc | Annual report 2013 www.fresnilloplc.com

Consolidated Balance Sheet continued Year ended 31 December
As at 31 December
Notes 2013
US$ thousands2012 – Restated1
US$ thousands
Current liabilities
Trade and other payables 23 81,905 95,287
Loans from related party 27 40,920 –
Derivative financial instruments 30 848 1,128
Income tax 10 – 28,994
Employee profit sharing 20,440 51,826
144,113 177,235
Total liabilities 1,412,083 672,631
Total equity and liabilities 4,084,054 3,284,870
1 Certain amounts shown here reflect the adoption of new and revised standards as detailed in notes 2 (b) and 32, and therefore do not correspond to the consolidated balance sheet as at 31 December 2012.
These financial statements were approved by the Board of Directors on 3 March 2014 and signed on its behalf by:
Mr Juan Bordes Non-executive Director
3 March 2014
155www.fresnilloplc.com Fresnillo plc | Annual report 2013
Fresnillo Today
Strategic Report
Corporate Governance
Financial Statements

Consolidated Statement of Cash Flow Year ended 31 December
Year ended 31 December
Notes 2013
US$ thousands 2012 – Restated1
US$ thousands
Net cash from operating activities 29 446,029 743,655
Cash flows from investing activities
Purchase of property, plant and equipment (572,140) (527,277)
Proceeds from the sale of property, plant and equipment and other assets 12,164 13,807
Purchase of available-for-sale financial assets – (3,025)
Loans granted to contractors (3,000) (6,428)
Repayments of loans granted to contractors 8,282 10,125
Silverstream contract 14 63,811 110,621
Interest received 6,215 6,365
Net cash used in investing activities (484,668) (395,812)
Cash flows from financing activities
Dividends paid to shareholders of the Company 19 (505,237) (397,610)
Dividends paid to non-controlling interest – (26,213)
Issue of share capital 18 346,397 –
Transaction cost associated with the issue of share capital 18 (272) –
Interest-bearing loans 20 793,936 –
Transaction cost associated with interest-bearing loans 20 (4,904) –
Capital contribution 4,930 3,694
Loans from a related party 27 40,920 –
Interest paid (133) (1)
Net cash used in financing activities 675,637 (420,130)
Net increase in cash and cash equivalents during the year 636,998 (72,287)
Effect of exchange rate on cash and cash equivalents 923 1,138
Cash and cash equivalents at 1 January 613,773 684,922
Cash and cash equivalents at 31 December 17 1,251,694 613,773
1 Certain amounts shown here reflect the adoption of new and revised standards as detailed in notes 2 (b) and 32, and therefore do not correspond to the consolidated cash flow statement for the year ended 31 December 2012.
156 Fresnillo plc | Annual report 2013 www.fresnilloplc.com
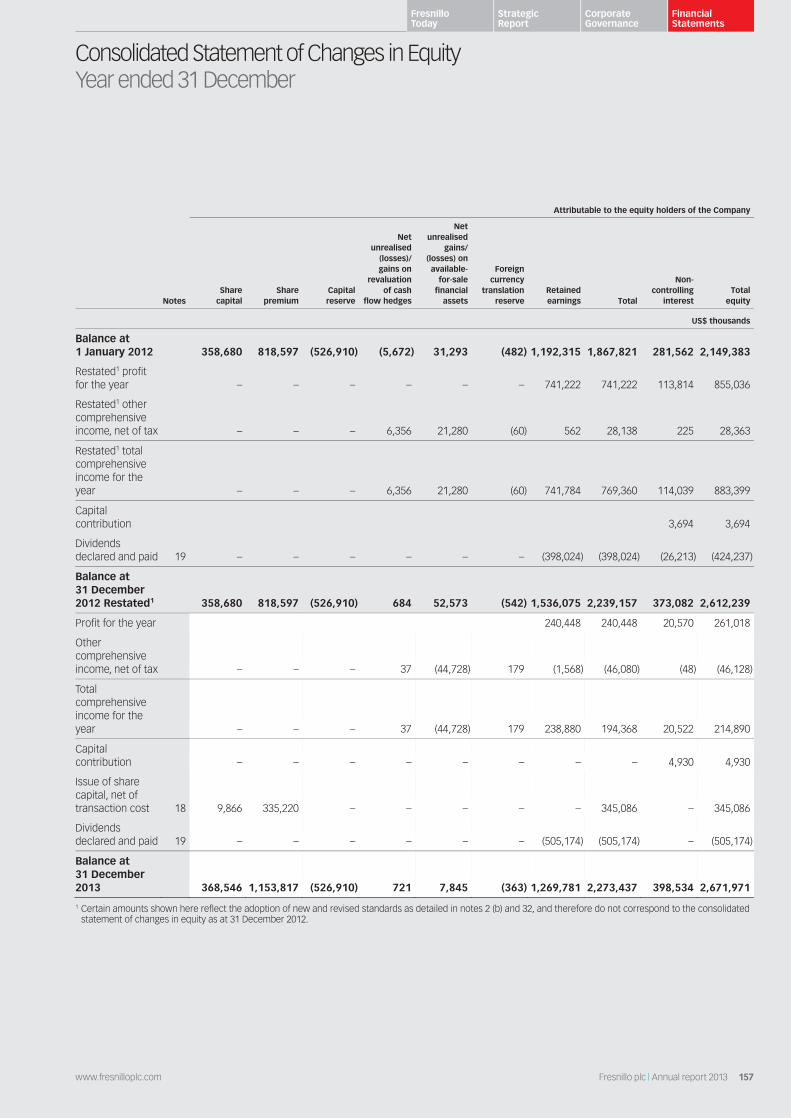
Consolidated Statement of Changes in Equity Year ended 31 December
Attributable to the equity holders of the Company
Notes Share
capitalShare
premium Capital reserve
Net unrealised
(losses)/gains on
revaluation of cash
flow hedges
Net unrealised
gains/(losses) on available-
for-sale financial
assets
Foreign currency
translation reserve
Retained earnings Total
Non-controlling
interestTotal
equity
US$ thousands
Balance at 1 January 2012 358,680 818,597 (526,910) (5,672) 31,293 (482) 1,192,315 1,867,821 281,562 2,149,383
Restated1 profit for the year – – – – – – 741,222 741,222 113,814 855,036
Restated1 other comprehensive income, net of tax – – – 6,356 21,280 (60) 562 28,138 225 28,363
Restated1 total comprehensive income for the year – – – 6,356 21,280 (60) 741,784 769,360 114,039 883,399
Capital contribution 3,694 3,694
Dividends declared and paid 19 – – – – – – (398,024) (398,024) (26,213) (424,237)
Balance at 31 December 2012 Restated1 358,680 818,597 (526,910) 684 52,573 (542) 1,536,075 2,239,157 373,082 2,612,239
Profit for the year 240,448 240,448 20,570 261,018
Other comprehensive income, net of tax – – – 37 (44,728) 179 (1,568) (46,080) (48) (46,128)
Total comprehensive income for the year – – – 37 (44,728) 179 238,880 194,368 20,522 214,890
Capital contribution – – – – – – – – 4,930 4,930
Issue of share capital, net of transaction cost 18 9,866 335,220 – – – – – 345,086 – 345,086
Dividends declared and paid 19 – – – – – – (505,174) (505,174) – (505,174)
Balance at 31 December 2013 368,546 1,153,817 (526,910) 721 7,845 (363) 1,269,781 2,273,437 398,534 2,671,971
1 Certain amounts shown here reflect the adoption of new and revised standards as detailed in notes 2 (b) and 32, and therefore do not correspond to the consolidated statement of changes in equity as at 31 December 2012.
157www.fresnilloplc.com Fresnillo plc | Annual report 2013
Fresnillo Today
Strategic Report
Corporate Governance
Financial Statements
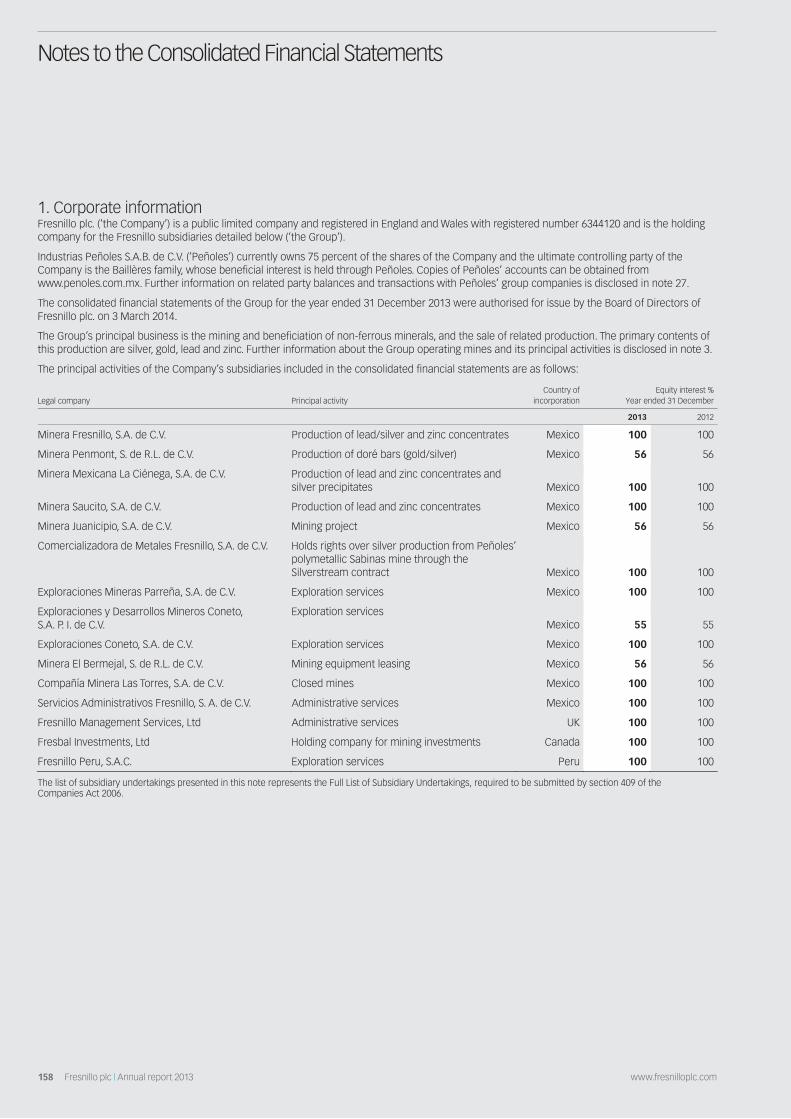
Notes to the Consolidated Financial Statements
1. Corporate information Fresnillo plc. (‘the Company’) is a public limited company and registered in England and Wales with registered number 6344120 and is the holding company for the Fresnillo subsidiaries detailed below (‘the Group’).
Industrias Peñoles S.A.B. de C.V. (‘Peñoles’) currently owns 75 percent of the shares of the Company and the ultimate controlling party of the Company is the Baillères family, whose beneficial interest is held through Peñoles. Copies of Peñoles’ accounts can be obtained from www.penoles.com.mx. Further information on related party balances and transactions with Peñoles’ group companies is disclosed in note 27.
The consolidated financial statements of the Group for the year ended 31 December 2013 were authorised for issue by the Board of Directors of Fresnillo plc. on 3 March 2014.
The Group’s principal business is the mining and beneficiation of non-ferrous minerals, and the sale of related production. The primary contents of this production are silver, gold, lead and zinc. Further information about the Group operating mines and its principal activities is disclosed in note 3.
The principal activities of the Company’s subsidiaries included in the consolidated financial statements are as follows:
Legal company Principal activity Country of
incorporation Equity interest %
Year ended 31 December
2013 2012
Minera Fresnillo, S.A. de C.V. Production of lead/silver and zinc concentrates Mexico 100 100
Minera Penmont, S. de R.L. de C.V. Production of doré bars (gold/silver) Mexico 56 56
Minera Mexicana La Ciénega, S.A. de C.V. Production of lead and zinc concentrates and silver precipitates Mexico 100 100
Minera Saucito, S.A. de C.V. Production of lead and zinc concentrates Mexico 100 100
Minera Juanicipio, S.A. de C.V. Mining project Mexico 56 56
Comercializadora de Metales Fresnillo, S.A. de C.V. Holds rights over silver production from Peñoles’polymetallic Sabinas mine through the Silverstream contract Mexico 100 100
Exploraciones Mineras Parreña, S.A. de C.V. Exploration services Mexico 100 100
Exploraciones y Desarrollos Mineros Coneto, S.A. P. I. de C.V.
Exploration services Mexico 55 55
Exploraciones Coneto, S.A. de C.V. Exploration services Mexico 100 100
Minera El Bermejal, S. de R.L. de C.V. Mining equipment leasing Mexico 56 56
Compañía Minera Las Torres, S.A. de C.V. Closed mines Mexico 100 100
Servicios Administrativos Fresnillo, S. A. de C.V. Administrative services Mexico 100 100
Fresnillo Management Services, Ltd Administrative services UK 100 100
Fresbal Investments, Ltd Holding company for mining investments Canada 100 100
Fresnillo Peru, S.A.C. Exploration services Peru 100 100
The list of subsidiary undertakings presented in this note represents the Full List of Subsidiary Undertakings, required to be submitted by section 409 of the Companies Act 2006.
158 Fresnillo plc | Annual report 2013 www.fresnilloplc.com

2. Significant accounting policies
(a) Basis of preparation and consolidation, and statement of compliance Basis of preparation and statement of compliance The Group’s consolidated financial statements have been prepared in accordance with International Financial Reporting Standards (IFRS) as adopted by the European Union as they apply to the financial statements of the Group for the years ended 31 December 2013 and 2012, and in accordance with the provisions of the Companies Act 2006.
The consolidated financial statements have been prepared on a historical cost basis, except for derivative financial instruments, available-for-sale financial instruments and defined benefit pension scheme assets which have been measured at fair value.
The consolidated financial statements are presented in dollars of the United States of America (US dollars or US$) and all values are rounded to the nearest thousand ($000) except when otherwise indicated.
The comparative information for the year ended 31 December 2012 has been restated due to the retrospective application of certain accounting policies; refer to notes 2 (b) and 32.
Basis of consolidation The consolidated financial statements set out the Group’s financial position as of 31 December 2013 and 2012, and the results of operations and cash flows for the years then ended.
Entities that constitute the Group are those enterprises controlled by the Group regardless of the number of shares owned by the Group. Control exists when the Group has the power, directly or indirectly, to govern the financial and operating policies of an entity so as to obtain benefits from its activities. Entities are consolidated from the date on which control is transferred to the Group and cease to be consolidated from the date on which control is transferred out of the Group. The purchase method of accounting is used to account for the acquisition of subsidiaries by the Group.
All intra-group balances, transactions, income and expenses and profits and losses, including unrealised profits arising from intra-group transactions, have been eliminated on consolidation. Unrealised losses are eliminated in the same way as unrealised gains except that they are only eliminated to the extent that there is no evidence of impairment.
Non-controlling interests in the net assets of consolidated subsidiaries are identified separately from the Group’s equity therein. These interests primarily represent the interests in Minera Penmont, S. de R.L. de C.V., Minera El Bermejal, S. de R.L. de C.V., Minera Juanicipio, S.A. de C.V. and Exploraciones y Desarrollos Mineros Coneto, S.A. P. I. de C.V. not held by the Group. The interest of non-controlling shareholders may be initially measured either at fair value or at the non-controlling interest’s proportionate share of the acquiree’s identifiable net assets. The choice of measurement basis is made on an acquisition-by-acquisition basis. Subsequent to acquisition, non-controlling interests consist of the amount attributed to such interests at initial recognition and the non-controlling interest’s share of changes in equity since the date of the combination. Any losses of a subsidiary are attributed to the non-controlling interests even if that results in a deficit balance.
(b) Changes in accounting policies and disclosures The accounting policies applied are consistent with those applied in the preparation of the consolidated financial statements for the year ended 31 December 2012 except for the adoption of new standards and interpretations effective as of 1 January 2013.
New standards, interpretations and amendments adopted by the Group The Group has applied, for the first time, certain standards, interpretations and amendments that require restatement of previous financial statements. These include amendments to IAS 1 Presentation of Financial Statements and to IAS 19 Employee Benefits, and the new IFRIC 20 Stripping cost during the production phase of a surface mine. In addition, the adoption of the IFRS 13 Fair Value Measurement resulted in additional disclosures. The nature and the effect of these changes are disclosed below.
– IAS 1 Presentation of Items of Other Comprehensive Income (OCI) – Amendments to IAS 1: The amendments to IAS 1 introduce a grouping of items presented in OCI. Items that could be reclassified or recycled to profit or loss at a future point in time are presented separately from items that will never be reclassified. The amendment affected presentation only and had no impact on the Group’s financial position or performance.
– IAS 19 Employee Benefits (Revised 2011) (IAS 19R): IAS 19R includes a number of amendments to the accounting for defined benefit plans, including actuarial gains and losses that are now recognised in OCI and permanently excluded from profit and loss; expected returns on plan assets that are no longer recognised in profit or loss, instead, there is a requirement to recognise interest on the net defined benefit liability (asset) in profit or loss, calculated using the discount rate used to measure the defined benefit obligation, and; unvested past service costs are now recognised in profit or loss at the earlier of when the amendment occurs or when the related restructuring or termination costs are recognised. Other amendments include new disclosures, such as, quantitative sensitivity disclosures. Refer to note 32 for details of the financial effect of adopting this interpretation.
– IFRS 13 Fair Value Measurement: IFRS 13 establishes a single source of guidance under IFRS for all fair value measurements. IFRS 13 does not change when an entity is required to use fair value, but rather provides guidance on how to measure fair value under IFRS when fair value is required or permitted as well as a requirement for enhanced disclosures.
Application of IFRS 13 has not impacted the fair value measurements of the Group. Additional disclosures where required, are provided in the individual notes relating to the assets and liabilities whose fair values were determined. Fair value hierarchy is provided in note 30.
– IFRIC 20 Stripping Costs in the Production Phase of a Surface Mine (New interpretation): IFRIC 20 now clarifies when an entity should recognise production phase waste removal (stripping) costs (production stripping costs) incurred in relation to a surface mining operation as an asset. Such an asset will be referred to as a stripping activity asset. The Group has adopted this new interpretation at 1 January 2013 with restatement of the comparative period of 2012. Refer to note 32 for details of the financial effect of adopting this interpretation.
159www.fresnilloplc.com Fresnillo plc | Annual report 2013
Fresnillo Today
Strategic Report
Corporate Governance
Financial Statements

Notes to the Consolidated Financial Statements continued
Standards, interpretations and amendments issued but not yet effective The standards and interpretations that are issued, but not yet effective, up to the date of issuance of the Group’s financial statements are disclosed below. The Group intends to adopt these standards, if applicable, when they become effective.
IFRS 9 Financial Instruments: – Classification and Measurement: IFRS 9, as issued, reflects the first phase of the IASB’s work on the replacement of IAS 39 and applies to
classification and measurement of financial assets and financial liabilities as defined in IAS 39. The standard was initially effective for annual periods beginning on or after 1 January 2013, but Amendments to IFRS 9 Mandatory Effective Date of IFRS 9 and Transition Disclosures, issued in December 2011, moved the mandatory effective date to 1 January 2015. In November 2013, the Board amended the standard to remove the mandatory effective date.
– Hedge accounting: In November 2013, the IASB completed amendments to hedge accounting, which bring into effect a substantial overhaul of hedge accounting that will allow entities to better reflect their risk management activities in the financial statements; allow the changes to address the so-called ‘own credit’ issue that were already included in IFRS 9 Financial Instruments to be applied in isolation without the need to change any other accounting for financial instruments; and remove the 1 January 2015 mandatory effective date of IFRS 9, to provide sufficient time for preparers of financial statements to make the transition to the new requirements.
– IFRS 10 Consolidated Financial Statements: The standard replaces the portion of IAS 27 Consolidated and Separate Financial Statements that addresses the accounting for consolidated financial statements. It also includes the issues raised in SIC-12 Consolidation – Special Purpose Entities. IFRS 10 establishes a single control model that applies to all entities including special purpose entities. The changes introduced by IFRS 10 require management to exercise significant judgement to determine which entities are controlled, and therefore, are required to be consolidated by a parent, compared with the requirements that were in IAS 27. This standard becomes effective for annual periods beginning on or after 1 January 2014, as adopted by the European Union. The Group does not expect this standard to have a significant impact on its financial position and performance.
– IFRS 12 Disclosure of Involvement with Other Entities: IFRS 12 includes all of the disclosures that were previously in IAS 27 related to consolidated financial statements, as well as all of the disclosures that were previously included in IAS 31 and IAS 28. These disclosures relate to an entity’s interests in subsidiaries, joint arrangements, associates and structured entities. A number of new disclosures will also be required. This standard will become effective for annual periods beginning on or after 1 January 2014 with the adoption of IFRS 10, IFRS 11, IAS 27 (2012) and IAS 28 (2012). The Group will include the relevant disclosures required by IFRS 12 upon adoption.
The IASB and IFRIC have issued other amendments resulting from improvements to IFRSs that management considers do not have any impact on the accounting policies, financial position or performance of the Group.
The Group has not early adopted any standard, interpretation or amendment that was issued but is not yet effective.
(c) Significant accounting judgements, estimates and assumptions The preparation of the Group’s consolidated financial statements in conformity with IFRS requires management to make judgements, estimates and assumptions that affect the reported amounts of assets, liabilities and contingent liabilities at the date of the consolidated financial statements and reported amounts of revenues and expenses during the reporting period. These judgements and estimates are based on management’s best knowledge of the relevant facts and circumstances, with regard to prior experience, but actual results may differ from the amounts included in the consolidated financial statements. Information about such judgements and estimates is contained in the accounting policies and/or the notes to the consolidated financial statements.
Judgements Areas of judgement, apart from those involving estimations, that have the most significant effect on the amounts recognised in the consolidated financial statements are:
– Determination of functional currencies note 2(d):
The determination of functional currency requires management judgement, particularly where there may be several currencies in which transactions are undertaken and which impact the economic environment in which the entity operates.
– Evaluation of projects status note 2(e):
The evaluation of project status impacts the accounting for costs incurred and requires management judgement. This includes the assessment of whether there is sufficient evidence of the probability of the existence of economically recoverable minerals to justify the commencement of capitalisation of costs; the timing of the end of the exploration phase and the start of the development phase and the commencement of the production phase. These judgements directly impact the treatment of costs incurred and proceeds from the sale of metals from ore produced.
– Stripping costs 2(e)
The Group incurs waste removal costs (stripping costs) during the development and production phases of its surface mining operations. During the production phase, stripping costs (production stripping costs) can be incurred both in relation to the production of inventory in that period and the creation of improved access and mining flexibility in relation to ore to be mined in the future. The former are included as part of the costs of inventory, while the latter are capitalised as a stripping activity asset, where certain criteria are met. Significant judgement is required to distinguish between development stripping and production stripping and to distinguish between the production stripping that relates to the extraction of inventory and what relates to the creation of a stripping activity asset.
160 Fresnillo plc | Annual report 2013 www.fresnilloplc.com
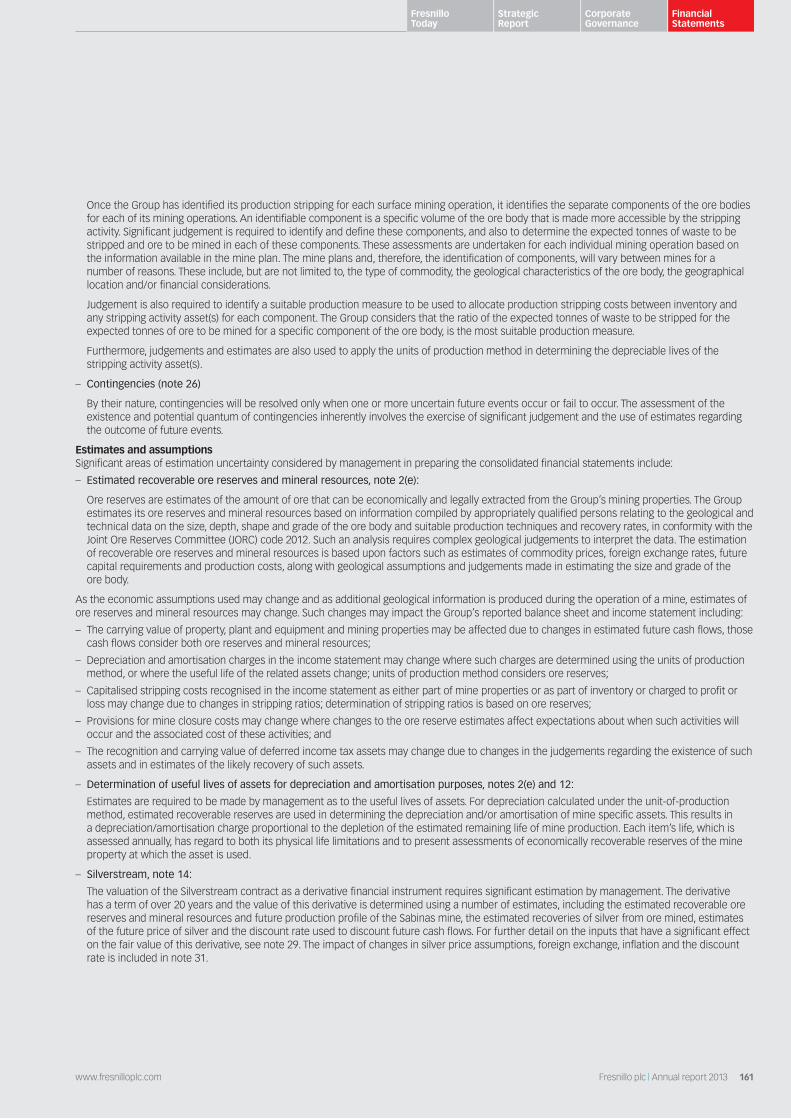
Once the Group has identified its production stripping for each surface mining operation, it identifies the separate components of the ore bodies for each of its mining operations. An identifiable component is a specific volume of the ore body that is made more accessible by the stripping activity. Significant judgement is required to identify and define these components, and also to determine the expected tonnes of waste to be stripped and ore to be mined in each of these components. These assessments are undertaken for each individual mining operation based on the information available in the mine plan. The mine plans and, therefore, the identification of components, will vary between mines for a number of reasons. These include, but are not limited to, the type of commodity, the geological characteristics of the ore body, the geographical location and/or financial considerations.
Judgement is also required to identify a suitable production measure to be used to allocate production stripping costs between inventory and any stripping activity asset(s) for each component. The Group considers that the ratio of the expected tonnes of waste to be stripped for the expected tonnes of ore to be mined for a specific component of the ore body, is the most suitable production measure.
Furthermore, judgements and estimates are also used to apply the units of production method in determining the depreciable lives of the stripping activity asset(s).
– Contingencies (note 26)
By their nature, contingencies will be resolved only when one or more uncertain future events occur or fail to occur. The assessment of the existence and potential quantum of contingencies inherently involves the exercise of significant judgement and the use of estimates regarding the outcome of future events.
Estimates and assumptions Significant areas of estimation uncertainty considered by management in preparing the consolidated financial statements include:
– Estimated recoverable ore reserves and mineral resources, note 2(e):
Ore reserves are estimates of the amount of ore that can be economically and legally extracted from the Group’s mining properties. The Group estimates its ore reserves and mineral resources based on information compiled by appropriately qualified persons relating to the geological and technical data on the size, depth, shape and grade of the ore body and suitable production techniques and recovery rates, in conformity with the Joint Ore Reserves Committee (JORC) code 2012. Such an analysis requires complex geological judgements to interpret the data. The estimation of recoverable ore reserves and mineral resources is based upon factors such as estimates of commodity prices, foreign exchange rates, future capital requirements and production costs, along with geological assumptions and judgements made in estimating the size and grade of the ore body.
As the economic assumptions used may change and as additional geological information is produced during the operation of a mine, estimates of ore reserves and mineral resources may change. Such changes may impact the Group’s reported balance sheet and income statement including:
– The carrying value of property, plant and equipment and mining properties may be affected due to changes in estimated future cash flows, those cash flows consider both ore reserves and mineral resources;
– Depreciation and amortisation charges in the income statement may change where such charges are determined using the units of production method, or where the useful life of the related assets change; units of production method considers ore reserves;
– Capitalised stripping costs recognised in the income statement as either part of mine properties or as part of inventory or charged to profit or loss may change due to changes in stripping ratios; determination of stripping ratios is based on ore reserves;
– Provisions for mine closure costs may change where changes to the ore reserve estimates affect expectations about when such activities will occur and the associated cost of these activities; and
– The recognition and carrying value of deferred income tax assets may change due to changes in the judgements regarding the existence of such assets and in estimates of the likely recovery of such assets.
– Determination of useful lives of assets for depreciation and amortisation purposes, notes 2(e) and 12:
Estimates are required to be made by management as to the useful lives of assets. For depreciation calculated under the unit-of-production method, estimated recoverable reserves are used in determining the depreciation and/or amortisation of mine specific assets. This results in a depreciation/amortisation charge proportional to the depletion of the estimated remaining life of mine production. Each item’s life, which is assessed annually, has regard to both its physical life limitations and to present assessments of economically recoverable reserves of the mine property at which the asset is used.
– Silverstream, note 14:
The valuation of the Silverstream contract as a derivative financial instrument requires significant estimation by management. The derivative has a term of over 20 years and the value of this derivative is determined using a number of estimates, including the estimated recoverable ore reserves and mineral resources and future production profile of the Sabinas mine, the estimated recoveries of silver from ore mined, estimates of the future price of silver and the discount rate used to discount future cash flows. For further detail on the inputs that have a significant effect on the fair value of this derivative, see note 29. The impact of changes in silver price assumptions, foreign exchange, inflation and the discount rate is included in note 31.
161www.fresnilloplc.com Fresnillo plc | Annual report 2013
Fresnillo Today
Strategic Report
Corporate Governance
Financial Statements
Notes to the Consolidated Financial Statements continued
– Estimation of the mine closure costs, notes 2(k) and 21:
Significant estimates and assumptions are made in determining the provision for mine closure cost as there are numerous factors that will affect the ultimate liability payable. These factors include estimates of the extent and costs of rehabilitation activities, technological changes, regulatory changes, cost increases, mine life and changes in discount rates. Those uncertainties may result in future actual expenditure differing from the amounts currently provided. The provision at the balance sheet date represents management’s best estimate of the present value of the future closure costs required.
– Income tax, notes 2(q) and 10:
Judgement is required in determining whether deferred tax assets are recognised on the balance sheet. Deferred tax assets, including those arising from un-utilised tax losses require management to assess the likelihood that the Group will generate taxable earnings in future periods, in order to utilise recognised deferred tax assets. Estimates of future taxable income are based on forecast cash flows from operations and the application of existing tax laws in each jurisdiction. To the extent that future cash flows and taxable income differ significantly from estimates, the ability of the Group to realise the net deferred tax assets recorded at the balance sheet date could be impacted.
(d) Foreign currency translation The Group’s consolidated financial statements are presented in US dollars, which is the parent Company’s functional currency. The functional currency for each entity in the Group is determined by the currency of the primary economic environment in which it operates. For all operating entities, this is US dollars.
Transactions denominated in currencies other than the functional currency of the entity are translated at the exchange rate ruling at the date of the transaction. Monetary assets and liabilities denominated in foreign currencies are re-translated at the rate of exchange ruling at the balance sheet date. All differences that arise are recorded in the income statement. Non-monetary items that are measured in terms of historical cost in a foreign currency are translated using the exchange rates as at the dates of the initial transactions. Non-monetary items measured at fair value in a foreign currency are translated into US dollars using the exchange rate at the date when the fair value is determined.
For entities with functional currencies other than US dollars, as at the reporting date, assets and liabilities are translated into the reporting currency of the Group by applying the exchange rate at the balance sheet date and the income statement is translated at the average exchange rate for the year. The resulting difference on exchange is included as a cumulative translation adjustment in other comprehensive income. On disposal of an entity, the deferred cumulative amount recognised in other comprehensive income relating to that operation is recognised in the income statement.
(e) Property, plant and equipment Property, plant and equipment are stated at cost less accumulated depreciation and impairment in value, if any. Cost comprises the purchase price and any costs directly attributable to bringing the asset into working condition for its intended use. The cost of self-constructed assets includes the cost of materials, direct labour and an appropriate proportion of production overheads.
The cost less the residual value of each item of property, plant and equipment is depreciated over its useful life. Each item’s estimated useful life has been assessed with regard to both its own physical life limitations and the present assessment of economically recoverable reserves of the mine property at which the item is located. Estimates of remaining useful lives are made on a regular basis for all mine buildings, machinery and equipment, with annual reassessments for major items. Depreciation is charged to cost of sales on a unit-of-production (UOP) basis for mine buildings and installations, plant and equipment used in the mine production process or on a straight line basis over the estimated useful life of the individual asset when not related to the mine production process. Changes in estimates, which mainly affect unit of production calculations, are accounted for prospectively. Depreciation commences when assets are available for use. Land is not depreciated.
The expected useful lives are as follows:
Years
Buildings 6
Plant and equipment 4
Mining properties and development costs 16
Other assets 3
An item of property, plant and equipment is de-recognised upon disposal or when no future economic benefits are expected from its use or disposal. Any gain or loss arising at de-recognition of the asset (calculated as the difference between the net disposal proceeds and the carrying amount of the asset) is included in the income statement in the year that the asset is de-recognised.
Non-current assets or disposal groups are classified as held for sale when it is expected that the carrying amount of the asset will be recovered principally through sale rather than through continuing use. Assets are not depreciated when classified as held for sale.
162 Fresnillo plc | Annual report 2013 www.fresnilloplc.com
Disposal of assets Gains or losses from the disposal of assets are recognised in the income statement when all significant risks and rewards of ownership are transferred to the customer, usually when title has been passed.
Mining properties and development costs Payments for mining concessions are expensed during the exploration phase of a prospect and capitalised during the development of the project when incurred.
Purchased rights to ore reserves and mineral resources are recognised as assets at their cost of acquisition or at fair value if purchased as part of a business combination.
Mining concessions, when capitalised, are amortised on a straight line basis over the period of time in which benefits are expected to be obtained from that specific concession.
Mine development costs are capitalised as part of property, plant and equipment. Mine development activities commence once a feasibility study has been performed for the specific project. When an exploration prospect has entered into the advanced exploration phase and sufficient evidence of the probability of the existence of economically recoverable minerals has been obtained pre-operative expenses relating to mine preparation works are also capitalised as a mine development cost.
The initial cost of a mining property comprises its construction cost, any costs directly attributable to bringing the mining property into operation, the initial estimate of the provision for mine closure cost, and, for qualifying assets, borrowing costs.
Revenues from metals recovered from ore mined in the mine development phase, prior to commercial production, are credited to mining properties and development costs. Upon commencement of production, capitalised expenditure is depreciated using the unit of production method based on the estimated economically proven and probable reserves to which they relate.
Mining properties and mine development are stated at cost, less accumulated depreciation and impairment in value, if any.
Construction in progress Assets in the course of construction are capitalised as a separate component of property, plant and equipment. On completion, the cost of construction is transferred to the appropriate category of property, plant and equipment. The cost of construction in progress is not depreciated.
Subsequent expenditures All subsequent expenditure on property, plant and equipment is capitalised if it meets the recognition criteria, and the carrying amount of those parts that are replaced, is de-recognised. All other expenditure including repairs and maintenance expenditure is recognised in the income statement as incurred.
Stripping costs In a surface mine operation, it is necessary to remove overburden and other waste material in order to gain access to the ore bodies (stripping activity). During development and pre-production phases, the stripping activity costs are capitalised as part of the initial cost of development and construction of the mine (the stripping activity asset) and charged as depreciation or depletion to cost of sales, in the income statement, based on the mine’s units of production once commercial operations begin.
Removal of waste material normally continues throughout the life of a surface mine. This activity is referred to as production stripping and commences at the time that saleable material begins to be extracted from the surface mine.
The removal of waste may occur following initial extraction of saleable material and during the production phase. This stripping cost is capitalised only if the following criteria is met:
– It is probable that the future economic benefits (improved access to an ore body) associated with the stripping activity will flow to the Group
– The Group can identify the component of an ore body for which access has been improved
– The costs relating to the improved access to that component can be measured reliably
Stripping activity costs associated with such development activities are capitalised into existing mining development assets, as mining properties and development cost, within property, plant and equipment, using a measure that considers the volume of waste extracted compared with expected volume, for a given volume of ore production. This measure is known as ‘component stripping ratio’, which is revised annually in accordance with the mine plan. The amount capitalised is subsequently depreciated over the expected useful life of the identified component of the ore body related to the stripping activity asset, by using the units of production method. The identification of components and the expected useful lives of those components are evaluated annually. Depreciation is recognised as cost of sales in the income statement.
The capitalised stripping activity asset is carried at cost less accumulated depletion/depreciation, less impairment in value, if any. Cost includes the accumulation of costs directly incurred to perform the stripping activity that improves access to the identified component of ore, plus an allocation of directly attributable overhead costs. The costs associated with incidental operations are excluded from the cost of the stripping activity asset.
If not all of the criteria are met, the production stripping costs are charged to the income statement as operating costs as they are incurred.
In identifying components of the ore body, the Group works closely with the mining operations personnel for each mining operation to analyse each of the mine plans. Generally, a component will be a subset of the total ore body and a mine may have several components that are identified based on the mine plan. The mine plans and therefore the identification of components can vary between mines for a number of reasons including but not limited to, the type of commodity, the geological characteristics of the ore body, the geographical location and/or financial considerations.
163www.fresnilloplc.com Fresnillo plc | Annual report 2013
Fresnillo Today
Strategic Report
Corporate Governance
Financial Statements

Notes to the Consolidated Financial Statements continued
(f) Impairment of non-financial assets The carrying amounts of assets are reviewed for impairment if events or changes in circumstances indicate that the carrying value may not be recoverable. At each reporting date, an assessment is made to determine whether there are any indications of impairment. If there are indicators of impairment, an exercise is undertaken to determine whether carrying values are in excess of their recoverable amount. Such reviews are undertaken on an asset by asset basis, except where such assets do not generate cash flows independent of those from other assets or groups of assets, and then the review is undertaken at the cash generating unit level.
If the carrying amount of an asset or its cash generating unit exceeds the recoverable amount, a provision is recorded to reflect the asset at the recoverable amount in the balance sheet. Impairment losses are recognised in the income statement.
The recoverable amount of an asset The recoverable amount of an asset is the greater of its value in use and fair value less costs to sell. Fair value is based on an estimate of the amount that the Group may obtain in a sale transaction in an orderly sale transaction between market participants. In assessing value in use, estimated future cash flows are discounted to their present value using a pre-tax discount rate that reflects current market assessments of the time value of money and the risks specific to the asset. For an asset that does not generate cash inflows largely independently of those from other assets, or groups of assets, the recoverable amount is determined for the cash generating unit to which the asset belongs. The Group’s cash generating units are the smallest identifiable groups of assets that generate cash inflows that are largely independent of the cash inflows from other assets or groups of assets.
Reversal of impairment An assessment is made each reporting date as to whether there is any indication that previously recognised impairment losses may no longer exist or may have decreased. If such an indication exists, the Group makes an estimate of the recoverable amount. A previously recognised impairment loss is reversed only if there has been a change in estimates used to determine the asset’s recoverable amount since the impairment loss was recognised. If that is the case, the carrying amount of the asset is increased to the recoverable amount. That increased amount cannot exceed the carrying amount that would have been determined, net of depreciation, had no impairment loss been recognised in previous years. Such impairment loss reversal is recognised in the income statement.
(g) Financial assets and liabilities Financial assets are recognised when the Group becomes party to contracts that give rise to them and are classified as financial assets at fair value through profit or loss; held to maturity investments; available-for-sale financial assets; or loans and receivables or derivatives designated as hedging instruments, as appropriate. The Group determines the classification of its financial assets at initial recognition and re-evaluates this designation at each balance sheet date. When financial assets are recognised initially, they are measured at fair value, plus, in the case of financial assets not at fair value through profit or loss, directly attributable transaction costs.
The Group recognises financial liabilities on its balance sheet when, and only when, it becomes a party to the contractual provisions of the instrument. Financial liabilities are classified at fair value through profit or loss, loans and borrowings, payables, or as derivatives designated as hedging instruments in an effective hedge, as appropriate. All financial liabilities are initially recognised at the fair value of the consideration received, including any transaction costs incurred.
Financial assets are offset with financial liabilities and the net amount is reported in the balance sheet when there is a legally enforceable right to set off the recognised amounts and there is an intention to settle on a net basis, or realise the asset and settle the liability simultaneously.
Financial assets and liabilities at fair value through profit or loss Financial assets and liabilities classified as held-for-trading and other assets or liabilities designated as fair value through profit or loss at inception are included in this category. Financial assets or liabilities are classified as held-for-trading if they are acquired or incurred for the purpose of selling or repurchasing in the short term. Derivatives, including separated embedded derivatives are also classified as held-for-trading unless they are designated as effective hedging instruments as defined by IAS 39. Financial assets or liabilities at fair value through profit or loss are carried in the balance sheet at fair value with gains or losses arising from changes in fair value, presented as finance costs or finance income in the income statement.
Loans and receivables Loans and receivables are non-derivative financial assets with fixed or determinable payments that are not quoted in an active market, do not qualify as trading assets and have not been designated as either fair value through profit and loss or available-for-sale.
After initial measurement such assets are subsequently carried at amortised cost using the effective interest method less any allowance for impairment. Gains or losses are recognised in income when the loans and receivables are de-recognised or impaired, as well as through the amortisation process.
Current trade receivables are carried at the original invoice amount less provision made for impairment of these receivables. Non-current receivables are stated at amortised cost. Loans and receivables from contractors are carried at amortised cost.
164 Fresnillo plc | Annual report 2013 www.fresnilloplc.com
Loans and borrowings After initial recognition at fair value, net of directly attributable transaction costs, interest-bearing loans are subsequently measured at amortised cost using the effective interest rate (EIR) method. The EIR amortisation is included as finance costs in the income statement. Gains and losses are recognised in profit or loss, in the income statement, when the liabilities are de-recognised as well as through the EIR amortisation process.
The Group shall adjust the carrying amount of the financial liability to reflect actual and revised estimated cash flows. The carrying amount is recalculated by computing the present value of estimated future cash flows at the financial instrument’s original effective interest rate or, when applicable, the revised effective interest rate. Any adjustment is recognised in profit or loss as income or expense.
This category generally applies to interest-bearing loans and borrowings. For more information refer to note 20.
Available-for-sale financial assets Available-for-sale financial assets are those non-derivative financial assets that are designated as such or are not classified in any of the preceding categories and are not held to maturity investments.
Available-for-sale financial assets represent equity investments that have a quoted market price in an active market; therefore a fair value can be reliably measured. After initial measurement, available-for-sale financial assets are measured at fair value with mark-to-market unrealised gains or losses recognised as other comprehensive income in the available-for-sale reserve until the financial asset is de-recognised.
Financial assets classified as available-for-sale are de-recognised when they are sold, and all the risks and rewards of ownership have been transferred. When financial assets are sold, the accumulated fair value adjustments recognised in other comprehensive income are included in the income statement within other operating income or expense.
De-recognition of financial assets and liabilities A financial asset or liability is generally de-recognised when the contract that gives rise to it is settled, sold, cancelled or expires.
Where an existing financial liability is replaced by another from the same lender on substantially different terms, or the terms of an existing liability are substantially modified, such an exchange or modification is treated as a de-recognition of the original liability and the recognition of a new liability, such that the difference in the respective carrying amounts together with any costs or fees incurred are recognised in profit or loss.
The difference between the carrying amount of a financial liability (or part of a financial liability) extinguished or transferred to another party and the consideration paid, including any non-cash assets transferred or liabilities assumed, is recognised in the income statement.
(h) Impairment of financial assets The Group assesses at each balance sheet date whether there is objective evidence that a financial asset or group of financial assets is impaired.
Assets carried at amortised cost If there is objective evidence that an impairment loss on loans and receivables carried at amortised cost has been incurred, the amount of the loss is measured as the difference between the asset’s carrying amount and the present value of estimated future cash flows (excluding future expected credit losses that have not been incurred) discounted at the financial asset’s original effective interest rate (i.e., the effective interest rate computed at initial recognition). The carrying amount of the asset is reduced through use of an allowance account. The amount of the loss is recognised in profit or loss.
The Group first assesses whether objective evidence of impairment exists individually for financial assets that are individually significant, and individually or collectively for financial assets that are not individually significant. If it is determined that no objective evidence of impairment exists for an individually assessed financial asset, whether significant or not, the asset is included in a group of financial assets with similar credit risk characteristics and that group of financial assets is collectively assessed for impairment. Assets that are individually assessed for impairment and for which an impairment loss is or continues to be recognised are not included in a collective assessment of impairment.
If, in a subsequent period, the amount of the impairment loss decreases and the decrease can be related objectively to an event occurring after the impairment was recognised, the previously recognised impairment loss is reversed. Any subsequent reversal of an impairment loss is recognised in the income statement, to the extent that the carrying value of the asset does not exceed its amortised cost at the reversal date.
In relation to trade receivables, a provision for impairment is made when there is objective evidence (such as the probability of insolvency or significant financial difficulties of the debtor) that the Group will not be able to collect all of the amounts due under the original terms of the invoice. The carrying amount of the receivable is reduced through use of an allowance account. Impaired receivables are de-recognised when they are assessed as uncollectible.
Available-for-sale financial investments If an available-for-sale asset is impaired, an amount comprising the difference between its cost (net of any principal payment and amortisation) and its current fair value, less any impairment loss previously recognised in the income statement, is transferred from equity to the income statement. In assessing whether there is an impairment, the Group considers whether a decline in fair value is either significant or prolonged, by considering the size of the decline in this value, the historic volatility in changes in fair value and the duration of the sustained decline. Reversals in respect of equity instruments classified as available-for-sale are not recognised in the income statement.
165www.fresnilloplc.com Fresnillo plc | Annual report 2013
Fresnillo Today
Strategic Report
Corporate Governance
Financial Statements

Notes to the Consolidated Financial Statements continued
(i) Inventories Finished goods and work-in-progress inventories are measured at the lower of cost and net realisable value. Cost is determined using the weighted average cost method based on cost of production which excludes borrowing costs.
For this purpose, the costs of production include:
– Personnel expenses, which include employee profit sharing, materials and contractor expenses which are directly attributable to the extraction and processing of ore
– The depreciation of property, plant and equipment used in the extraction and processing of ore
– Related production overheads (based on normal operating capacity).
Operating materials and spare parts are valued at the lower of cost or net realisable value. An allowance for obsolete and slow-moving inventories is determined by reference to specific items of stock. A regular review is undertaken by management to determine the extent of such an allowance.
Net realisable value is the estimated selling price in the ordinary course of business less any further costs expected to be incurred to completion and disposal.
(j) Cash and cash equivalents For the purposes of the balance sheet, cash and cash equivalents comprise cash at bank, cash on hand and short-term deposits held with banks that are readily convertible into known amounts of cash and which are subject to insignificant risk of changes in value. Short-term deposits earn interest at the respective short-term deposit rates between one day and three months.
For the purposes of the cash flow statement, cash and cash equivalents as defined above are shown net of outstanding bank overdrafts.
(k) Provisions Mine closure cost A provision for mine closure cost is made in respect of the estimated future costs of closure, restoration and for environmental rehabilitation costs (which include the dismantling and demolition of infrastructure, removal of residual materials and remediation of disturbed areas) based on a mine closure plan, in the accounting period when the related environmental disturbance occurs. The provision is discounted and the unwinding of the discount is included within finance costs. At the time of establishing the provision, a corresponding asset is capitalised where it gives rise to a future economic benefit and is depreciated over future production from the mine to which it relates. The provision is reviewed on an annual basis by the Group for changes in cost estimates, discount rates or life of operations. Changes to estimated future costs are recognised in the balance sheet by adjusting the mine closure cost liability and the related asset originally recognised. If, for mature mines, the revised mine assets net of mine closure cost provisions exceed the recoverable value, the portion of the increase is charged directly as an expense. For closed sites, changes to estimated costs are recognised immediately in profit or loss.
(l) Employee benefits The Group operates the following plans:
Defined benefit pension plan This funded plan is based on each employee’s earnings and years of service. This plan was open to all employees in Mexico until it was closed to new entrants on 1 July 2007. The plan is denominated in Mexican pesos. For members as at 30 June 2007, benefits were frozen at that date subject to indexation with reference to the Mexican National Consumer Price Index (NCPI).
The cost of providing benefits under the defined benefit plan is determined using the projected unit credit actuarial valuation method and prepared by an independent actuarial firm as at each year-end balance sheet date. The discount rate is the yield on mxAAA (Standard & Poor’s) and AAA-mex (Fitch Ibca) credit-rated bonds that have maturity dates approximating the terms of the Group’s obligations and that are denominated in the same currency in which the benefits are expected to be paid. Actuarial gains or losses are recognised in OCI and permanently excluded from profit or loss.
Past service costs are recognised as an expense on a straight line basis over the average period until the benefits become vested. If the benefits have already vested following the introduction of, or changes to, a pension plan, the past service cost is recognised immediately.
The defined benefit asset or liability comprises the present value of the defined benefit obligation less the fair value of plan assets out of which the obligations are to be settled directly. The value of any asset is restricted to the present value of any economic benefits available in the form of refunds from the plan or reductions in the future contributions to the plan.
Net interest cost is recognised in finance cost and return on plan assets (other than amounts reflected in net interest cost) is recognised in OCI and permanently excluded from profit or loss.
166 Fresnillo plc | Annual report 2013 www.fresnilloplc.com

Defined contribution pension plan A defined contribution plan is a post-employment benefit plan under which the Group pays fixed contributions into a separate entity and has no legal or constructive obligation to pay further amounts. Obligations for contributions to defined contribution pension plans are recognised as an employee benefit expense in profit or loss when they are due. The contributions are based on the employee’s salary.
This plan started on 1 July 2007 and it is voluntary for all employees to join this scheme.
Seniority premium for voluntary separation This unfunded plan corresponds to an additional payment over the legal seniority premium equivalent to approximately 12 days of salary per year for those unionised workers who have more than 15 years of service. Non-unionised employees with more than 15 years of service have the right to a payment equivalent to 12 days for each year of service. For both cases, the payment is based on the legal current minimum salary.
The cost of providing benefits for the seniority premium for voluntary separation is determined using the projected unit credit actuarial valuation method and prepared by an independent actuarial firm as at each year-end balance sheet date. Actuarial gains or losses are recognised as income or expense in the period in which they occur.
Other Benefits for death and disability are covered through insurance policies.
Termination payments for involuntary retirement (dismissals) are charged to the income statement, when incurred.
(m) Employee profit sharing In accordance with the Mexican legislation, companies in Mexico are subject to pay for employee profit sharing (‘PTU’) equivalent to 10% of the taxable income of each fiscal year.
PTU is accounted for as employee benefits and is calculated based on the services rendered by employees during the year, considering their most recent salaries. The liability is recognised as it accrues and is charged to the income statement. PTU, paid in each fiscal year, is considered deductible for income tax purposes.
(n) Leases The determination of whether an arrangement is, or contains, a lease is based on the substance of the arrangement at inception date including whether the fulfilment of the arrangement is dependent on the use of a specific asset or assets or the arrangement conveys a right to use the asset. A reassessment is made after inception of the lease only if one of the following applies:
a) There is a change in contractual terms, other than a renewal or extension of the arrangement;
b) A renewal option is exercised or extension granted, unless the term of the renewal or extension was initially included in the lease term;
c) There is a change in the determination of whether fulfilment is dependent on a specified asset; or
d) There is a substantial change to the asset.
Group as a lessee Finance leases which transfer to the Group substantially all the risks and benefits incidental to ownership of the leased item, are capitalised at the inception of the lease at the fair value of the leased asset, or if lower, at the present value of the minimum lease payments. Lease payments are apportioned between the finance charges and reduction of the lease liability so as to achieve a constant rate of interest on the remaining balance of the liability. Finance charges are reflected in the income statement.
Capitalised leased assets are depreciated over the shorter of the estimated useful life of the asset and the lease term, if there is no reasonable certainty that the Group will obtain ownership by the end of the lease term.
Operating lease payments are recognised as an expense in the income statement on a straight line basis over the lease term.
Group as a lessor Leases where the Group does not transfer substantially all the risks and benefits of ownership of the asset are classified as operating leases. Initial direct costs incurred in negotiating an operating lease are added to the carrying amount of the leased asset and recognised over the lease term on the same basis as rental income. Contingent rents are recognised as revenue in the period in which they are earned.
Where a reassessment is made, lease accounting commences or ceases from the date when the change in circumstances gave rise to the reassessment for scenarios a), c) or d) and at the date of renewal or extension period for scenario b) above.
For arrangements entered into prior to 1 January 2005, the date of inception is deemed to be 1 January 2007, in accordance with the transitional requirements of IFRIC 4.
167www.fresnilloplc.com Fresnillo plc | Annual report 2013
Fresnillo Today
Strategic Report
Corporate Governance
Financial Statements

Notes to the Consolidated Financial Statements continued
(o) Revenue recognition Revenue is recognised to the extent that it is probable that economic benefits will flow to the Group and the revenue can be reliably measured. Revenue is measured at the fair value of consideration received excluding discounts, rebates, and other sales taxes.
Sale of goods Revenue is recognised in the income statement when all significant risks and rewards of ownership are transferred to the customer, usually when title has been passed. Revenue excludes any applicable sales taxes.
The Group recognises revenue on a provisional basis at the time concentrates, precipitates and doré bars are delivered to the customer’s smelter or refinery, using the Group’s best estimate of contained metal. Revenue is subject to adjustment once the analysis of the product samples is completed, contract conditions have been fulfilled and final settlement terms are agreed. Any subsequent adjustments to the initial estimate of metal content are recorded in revenue once they have been determined.
In addition, sales of concentrates and precipitates throughout each calendar month, as well as doré bars that are delivered after the 20th day of each month, are ‘provisionally priced’ subject to a final adjustment based on the average price for the month following the delivery to the customer, based on the market price at the relevant quotation point stipulated in the contract. Doré bars that are delivered in the first 20 days of each month are finally priced in the month of delivery.
For sales of goods that are subject to provisional pricing, revenue is initially recognised when the conditions set out above have been met using the provisional price. The price exposure is considered to be an embedded derivative and hence separated from the sales contract. At each reporting date the provisionally priced metal is revalued based on the forward selling price for the quotational period stipulated in the contract until the quotation period ends. The selling price of the metals can be reliably measured as these are actively traded on international exchanges. The revaluing of provisionally priced contracts is recorded as an adjustment to revenue.
The customer deducts treatment and refining charges before settlement. Therefore, the fair value of consideration received for the sale of goods is net of those charges.
Other income Other income is recognised in the income statement when all significant risks and rewards of ownership are transferred to the customer, usually when title has been passed.
(p) Exploration expenses Exploration activity involves the search for mineral resources, the determination of technical feasibility and the assessment of commercial viability of an identified resource.
Exploration expenses are charged to the income statement as incurred and are recorded in the following captions:
– Cost of sales: costs relating to in-mine exploration, that ensure continuous extraction quality and extend mine life
– Exploration expenses:
– Costs incurred in geographical proximity to existing mines in order to replenish or increase reserves
– Costs incurred in regional exploration with the objective of locating new ore deposits in Mexico and Latin America and which are identified by project. Costs incurred are charged to the income statement until there is sufficient probability of the existence of economically recoverable minerals and a feasibility study has been performed for the specific project
168 Fresnillo plc | Annual report 2013 www.fresnilloplc.com

(q) Taxation Current income tax Current income tax assets and liabilities for the current and prior periods are measured at the amount expected to be recovered from or paid to the taxation authorities. The tax rates and tax laws used to compute the amount are those that are enacted or substantively enacted, at the reporting date in the country the Group operates.
Deferred income tax Deferred income tax is provided using the liability method on temporary differences at the balance sheet date between the tax bases of assets and liabilities and their carrying amounts for financial reporting purposes.
Deferred income tax liabilities are recognised for all taxable temporary differences, except:
– Where the deferred income tax liability arises from the initial recognition of goodwill or of an asset or liability in a transaction that is not a business combination and, at the time of transaction, affects neither the accounting profit nor taxable profit loss
– In respect of taxable temporary differences associated with investments in subsidiaries, associates and interests in joint ventures, where the timing of the reversal of the temporary differences can be controlled and it is probable that the temporary differences will not reverse in the foreseeable future.
Deferred income tax assets are recognised for all deductible temporary differences, carry forward of unused tax credits and unused tax losses, to the extent that it is probable that taxable profit will be available against which the deductible temporary differences, and the carry forward of unused tax credits and unused tax losses can be utilised, except:
– Where the deferred income tax asset relating to deductible temporary differences arise from the initial recognition of an asset or liability in a transaction that is not a business combination and, at the time of the transaction, affects neither the accounting profit nor taxable profit or loss
– In respect of deductible temporary differences associated with investments in subsidiaries, associates and interests in joint ventures, deferred income tax assets are recognised only to the extent that it is probable that the temporary differences will reverse in the foreseeable future and taxable profit will be available against which the temporary differences can be utilised.
The carrying amount of deferred income tax assets is reviewed at each balance sheet date and reduced to the extent that it is no longer probable that sufficient taxable profit will be available to allow all or part of the deferred income tax asset to be utilised.
Unrecognised deferred income tax assets are reassessed at each balance sheet date and are recognised to the extent that it has become probable that future taxable profit will allow the deferred tax asset to be recovered.
Deferred income tax assets and liabilities are measured at the tax rates that are expected to apply to the year when the asset is realised or the liability is settled, based on tax rates (and tax laws) that have been enacted or substantively enacted at the balance sheet date.
Deferred income tax relating to items recognised directly in other comprehensive income is recognised in equity and not in the income statement.
Deferred income tax assets and deferred income tax liabilities are offset, if a legally enforceable right exists to set off current tax assets against current income tax liabilities and the deferred income taxes relate to the same taxable entity and the same taxation authority.
Mining Rights The Special Mining Right is considered an income tax recognised in the income statement of the year. The Group recognises deferred tax assets and liabilities on temporary differences arising in the determination of the Special Mining Right that will be effective as from 1 January 2014. (Note 10)
Sales tax Expenses and assets are recognised net of the amount of sales tax, except:
– When the sales tax incurred on a purchase of assets or services is not recoverable from the taxation authority, in which case, the sales tax is recognised as part of the cost of acquisition of the asset or as part of the expense item, as applicable; and
– When receivables and payables are stated with the amount of sales tax included.
The net amount of sales tax recoverable from, or payable to, the taxation authority is included as part of receivables or payables in the balance sheet.
169www.fresnilloplc.com Fresnillo plc | Annual report 2013
Fresnillo Today
Strategic Report
Corporate Governance
Financial Statements
Notes to the Consolidated Financial Statements continued
(r) Derivative financial instruments and hedging The Group uses derivatives to reduce certain market risks derived from changes in foreign exchange which impact its financial and business transactions. Hedges are designed to protect the value of expected production against the dynamic market conditions. Such derivative financial instruments are initially recognised at fair value on the date on which a derivative contract is entered into and are subsequently remeasured at fair value. Derivatives are carried as assets when the fair value is positive and as liabilities when the fair value is negative.
Any gains or losses arising from changes in fair value on derivatives during the year that do not qualify for hedge accounting are taken directly to the income statement.
Derivatives are valued using valuation approaches and methodologies (such as Black Scholes and Net Present Value) applicable to the specific type of derivative instrument. The fair value of forward currency and commodity contracts is calculated by reference to current forward exchange rates for contracts with similar maturity profiles, European foreign exchange options are valued using the Garmar-Kohlhagen formula. The Silverstream contract is valued using a Net Present Value valuation approach.
At the inception of a hedge relationship, the Group formally designates and documents the hedge relationship to which the Group wishes to apply hedge accounting and the risk management objective and strategy for the undertaken hedge. The documentation includes identification of the hedging instrument, the hedged item or transaction, the nature of the risk being hedged and how the entity will assess the hedging instrument’s effectiveness in offsetting the exposure to changes in the hedged item’s fair value or cash flows attributable to the hedged risk. Such hedges are expected to be highly effective in achieving offsetting changes in fair value or cash flows and are assessed on an ongoing basis to determine that they actually have been highly effective throughout the financial reporting periods for which they were designated.
Hedges which meet the strict criteria for hedge accounting are accounted for as follows:
Cash flow hedges For derivatives that are designated and qualify as cash flow hedges, the effective portion of changes in the fair value of derivative instruments are recorded as in other comprehensive income and are transferred to the income statement when the hedged transaction affects profit or loss, such as when a forecast sale or purchase occurs. For gains or losses related to the hedging of foreign exchange risk these are included, in the line item in which the hedged costs are reflected. Where the hedged item is the cost of a non-financial asset or liability, the amounts recognised in other comprehensive income are transferred to the initial carrying amount of the non-financial asset or liability. The ineffective portion of changes in the fair value of cash flow hedges is recognised directly as finance costs, in the income statement of the related period.
If the hedging instrument expires or is sold, terminated or exercised without replacement or rollover, or if its designation as a hedge is revoked, any cumulative gain or loss recognised directly in other comprehensive income from the period that the hedge was effective remains separately in other comprehensive income until the forecast transaction occurs, when it is recognised in the income statement. When a forecast transaction is no longer expected to occur, the cumulative gain or loss that was reported in other comprehensive income is immediately transferred to the income statement.
When hedging with options, the Group designates only the intrinsic value movement of the hedging option within the hedge relationship. The time value of the option contracts is therefore excluded from the hedge designation. Changes in fair value of time value is recognised in the income statement in finance costs.
Embedded derivatives Contracts are assessed for the existence of embedded derivatives at the date that the Group first becomes party to the contract, with reassessment only if there is a change to the contract that significantly modifies the cash flows. Embedded derivatives which are not clearly and closely related to the underlying asset, liability or transaction are separated and accounted for as stand-alone derivatives.
(s) Borrowing costs Borrowing costs directly attributable to the acquisition, construction or production of an asset that necessarily takes a substantial period of time to get ready for its intended use or sale (a qualifying asset) are capitalised as part of the cost of the respective asset. Borrowing costs consist of interest and other costs that an entity incurs in connection with the borrowing of funds.
Where funds are borrowed specifically to finance a project, the amount capitalised represents the actual borrowing costs incurred. Where surplus funds are available for a short term from funds borrowed specifically to finance a project, the income generated from the temporary investment of such amounts is also capitalised and deducted from the total capitalised borrowing cost. Where the funds used to finance a project form part of general borrowings, the amount capitalised is calculated using a weighted average of rates applicable to relevant general borrowings of the Group during the period.
All other borrowing costs are recognised in the income statement in the period in which they are incurred.
170 Fresnillo plc | Annual report 2013 www.fresnilloplc.com

(t) Fair value measurement The Group measures financial instruments at fair value at each balance sheet date. Fair values of financial instruments measured at amortised cost are disclosed in notes 31 and 32.
Fair value is the price that would be received to sell an asset or paid to transfer a liability in an orderly transaction between market participants at the measurement date. The fair value measurement is based on the presumption that the transaction to sell the asset or transfer the liability takes place either:
– In the principal market for the asset or liability
– In the absence of a principal market, in the most advantageous market for the asset or liability
The principal or the most advantageous market must be accessible to the Group.
The fair value of an asset or a liability is measured using the assumptions that market participants would use when pricing the asset or liability, assuming that market participants act in their economic best interest.
A fair value measurement of a non-financial asset takes into account a market participant’s ability to generate economic benefits by using the asset in its highest and best use or by selling it to another market participant that would use the asset in its highest and best use.
The Group uses valuation techniques that are appropriate in the circumstances and for which sufficient data are available to measure fair value, maximising the use of relevant observable inputs and minimising the use of unobservable inputs.
All assets and liabilities for which fair value is measured or disclosed in the financial statements are categorised within the fair value hierarchy, described as follows, based on the lowest level input that is significant to the fair value measurement as a whole:
Level 1 – Quoted (unadjusted) market prices in active markets for identical assets or liabilities
Level 2 – Valuation techniques for which the lowest level input that is significant to the fair value measurement is directly or indirectly observable
Level 3 – Valuation techniques for which the lowest level input that is significant to the fair value measurement is unobservable
For assets and liabilities that are recognised in the financial statements on a recurring basis, the Group determines whether transfers have occurred between levels in the hierarchy by reassessing categorisation (based on the lowest level input that is significant to the fair value measurement as a whole) at the end of each reporting period.
For the purpose of fair value disclosures, the Group has determined classes of assets and liabilities on the basis of the nature, characteristics and risks of the asset or liability and the level of the fair value hierarchy as explained above. Further information on fair values is described in note 31.
(u) Dividend distribution Dividends payable to the Company’s shareholders are recognised as a liability when these are approved by the Company’s shareholders or Board as appropriate. Dividends payable to minority shareholders are recognised as a liability when these are approved by the Company’s subsidiaries.
3. Segment reporting For management purposes the Group is organised into operating segments based on producing mines.
At 31 December 2013 the Group has six reportable operating segments following the successful conclusion of the development of the Noche Buena mine in February 2012 and commercial production starting in March 2012. The following segments represent the Group’s six producing mines as follows:
– The Fresnillo mine, located in the State of Zacatecas, the world’s largest primary silver mine
– The Saucito mine, located in the State of Zacatecas, an underground silver mine
– The Ciénega mine, located in the State of Durango, an underground gold mine; including the San Ramon satellite mine
– The Herradura mine, located in the State of Sonora, a surface gold mine
– The Soledad-Dipolos mine, located in the State of Sonora, a surface gold mine
– The Noche Buena mine, located in State of Sonora, a surface gold mine
The operating performance and financial results for each of these mines are reviewed by management. As the Group´s chief operating decision-maker does not review segment assets and liabilities, the Group has not disclosed this information.
171www.fresnilloplc.com Fresnillo plc | Annual report 2013
Fresnillo Today
Strategic Report
Corporate Governance
Financial Statements
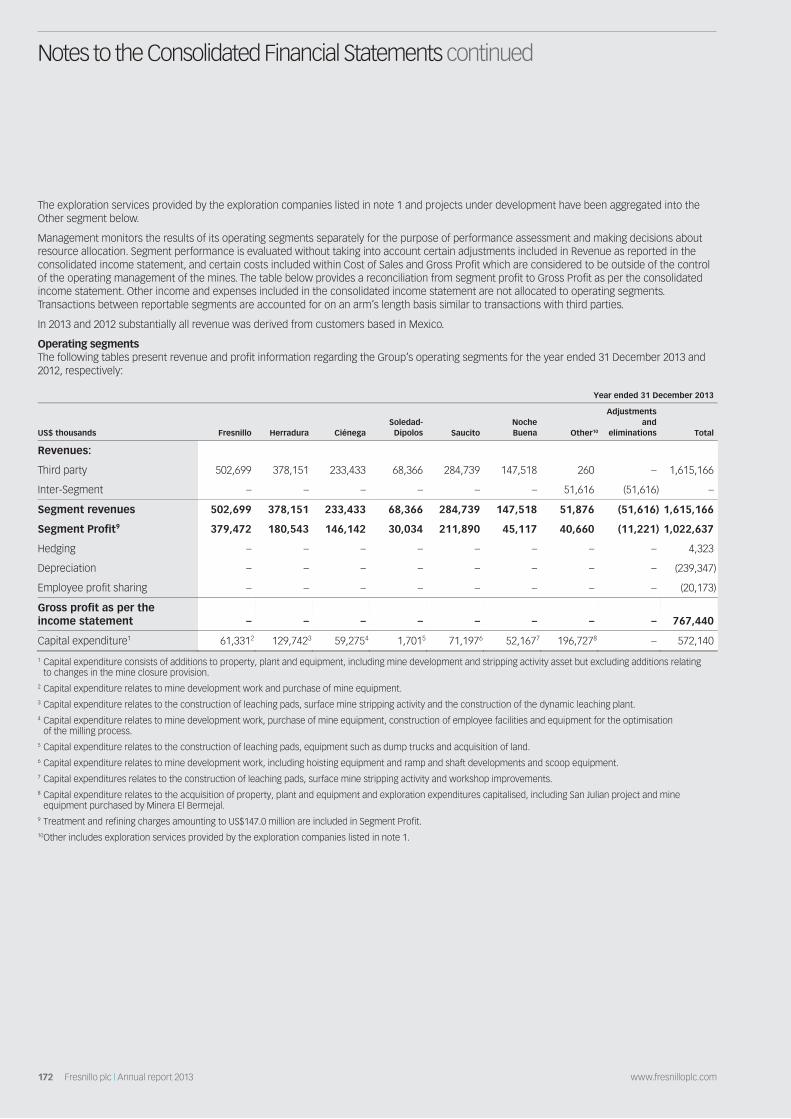
Notes to the Consolidated Financial Statements continued
The exploration services provided by the exploration companies listed in note 1 and projects under development have been aggregated into the Other segment below.
Management monitors the results of its operating segments separately for the purpose of performance assessment and making decisions about resource allocation. Segment performance is evaluated without taking into account certain adjustments included in Revenue as reported in the consolidated income statement, and certain costs included within Cost of Sales and Gross Profit which are considered to be outside of the control of the operating management of the mines. The table below provides a reconciliation from segment profit to Gross Profit as per the consolidated income statement. Other income and expenses included in the consolidated income statement are not allocated to operating segments. Transactions between reportable segments are accounted for on an arm’s length basis similar to transactions with third parties.
In 2013 and 2012 substantially all revenue was derived from customers based in Mexico.
Operating segments The following tables present revenue and profit information regarding the Group’s operating segments for the year ended 31 December 2013 and 2012, respectively:
Year ended 31 December 2013
US$ thousands Fresnillo Herradura Ciénega Soledad-Dipolos Saucito
NocheBuena Other10
Adjustments and
eliminations Total
Revenues:
Third party 502,699 378,151 233,433 68,366 284,739 147,518 260 – 1,615,166
Inter-Segment – – – – – – 51,616 (51,616) –
Segment revenues 502,699 378,151 233,433 68,366 284,739 147,518 51,876 (51,616) 1,615,166
Segment Profit9 379,472 180,543 146,142 30,034 211,890 45,117 40,660 (11,221) 1,022,637
Hedging – – – – – – – – 4,323
Depreciation – – – – – – – – (239,347)
Employee profit sharing – – – – – – – – (20,173)
Gross profit as per the income statement – – – – – – – – 767,440
Capital expenditure1 61,3312 129,7423 59,2754 1,7015 71,1976 52,1677 196,7278 – 572,140
1 Capital expenditure consists of additions to property, plant and equipment, including mine development and stripping activity asset but excluding additions relating to changes in the mine closure provision.
2 Capital expenditure relates to mine development work and purchase of mine equipment. 3 Capital expenditure relates to the construction of leaching pads, surface mine stripping activity and the construction of the dynamic leaching plant. 4 Capital expenditure relates to mine development work, purchase of mine equipment, construction of employee facilities and equipment for the optimisation
of the milling process. 5 Capital expenditure relates to the construction of leaching pads, equipment such as dump trucks and acquisition of land. 6 Capital expenditure relates to mine development work, including hoisting equipment and ramp and shaft developments and scoop equipment. 7 Capital expenditures relates to the construction of leaching pads, surface mine stripping activity and workshop improvements. 8 Capital expenditure relates to the acquisition of property, plant and equipment and exploration expenditures capitalised, including San Julian project and mine
equipment purchased by Minera El Bermejal. 9 Treatment and refining charges amounting to US$147.0 million are included in Segment Profit. 10 Other includes exploration services provided by the exploration companies listed in note 1.
172 Fresnillo plc | Annual report 2013 www.fresnilloplc.com

Year ended 31 December 2012 – Restated
US$ thousands Fresnillo Herradura Ciénega Soledad-
Dipolos SaucitoNoche Buena Other10
Adjustments and
eliminations Total
Revenues:
Third party 817,731 526,921 303,863 177,553 223,226 108,110 – – 2,157,404
Inter-Segment – – – – 39,062 – 80,180 (119,242) –
Segment revenues 817,731 526,921 303,863 117,553 262,288 108,110 80,180 (119,242) 2,157,404
Segment Profit9 656,050 372,891 217,719 112,226 206,356 68,880 75,569 (50,439) 1,659,232
Hedging – – – – – – – – (2,111)
Depreciation – – – – – – – – (243,766)
Employee profit sharing – – – – – – – – (48,776)
Gross profit as per the income statement – – – – – – – – 1,364,599
Capital expenditure1 85,5292 114,7353 81,8754 8,6745 54,3876 43,7117 138,3668 – 527,277
1 Capital expenditure consists of additions to property, plant and equipment, including mine development and stripping activity asset but excluding additions relating to changes in the mine closure provision.
2 Capital expenditure relates to mine development work, scoop and raise boring equipment and land. 3 Capital expenditure relates to the construction of leaching pads, equipment such as rotary drill rig tractors and dump trucks, construction of an electrical station and
surface mine stripping activity. 4 Capital expenditure relates to mine development work, scoop and raise boring equipment and land. 5 Capital expenditure relates to the construction of leaching pads, equipment such as dump trucks and tractors and a rotary drill rig and surface mine stripping activity. 6 Capital expenditure relates to mine development work, including hoisting equipment and ramp and shaft developments and scoop equipment. 7 Capital expenditure relates to the construction of leaching pads, equipment such as dump trucks and tractors and a rotary drill rig and surface mine stripping activity. 8 Capital expenditure relates to the acquisition of property, plant and equipment and exploration expenditures capitalised, including San Julian project and mine
equipment purchased by Minera El Bermejal. 9 Treatment and refining charges amounting to US$129.8 million are included in Segment Profit. 10 Other includes exploration services provided by the exploration companies listed in note 1.
4. Revenues Revenues reflect the sale of goods, being concentrates doré, slag, and precipitates of which the primary contents are silver, gold, lead and zinc1.
(a) Revenues by product sold Year ended 31 December
2013
US$ thousands2012
US$ thousands
Lead concentrates (containing silver, gold, lead and by-products) 885,083 1,168,888
Doré and slag (containing gold, silver and by-products) 594,036 812,584
Zinc concentrates (containing zinc, silver and by-products) 62,962 75,601
Precipitates (containing gold and silver) 73,085 100,331
1,615,166 2,157,404
Substantially all lead concentrates, precipitates, doré and slag, were sold to Peñoles’ metallurgical complex, Met-Mex, for smelting and refining. 1 Included in the value of lead and zinc concentrates, precipitates and doré are provisional price adjustments which represent changes in the fair value of embedded
derivatives. In 2013 the Group has recognised a gain of US$5 million (2012: gain of US$8.3 million). For further detail refer to note 2(o).
173www.fresnilloplc.com Fresnillo plc | Annual report 2013
Fresnillo Today
Strategic Report
Corporate Governance
Financial Statements

Notes to the Consolidated Financial Statements continued
(b) Value of metal content in products sold For products other than refined silver and gold, invoiced revenues are derived from the value of metal content adjusted by treatment and refining charges incurred by the metallurgical complex of the customer. The value of the metal content of the products sold, before treatment and refining charges is as follows:
Year ended 31 December
2013
US$ thousands 2012
US$ thousands
Silver 842,932 1,084,329
Gold 831,653 1,118,587
Zinc 39,749 40,823
Lead 47,870 43,501
Value of metal content in products sold 1,762,204 2,287,240
Adjustment for treatment and refining charges (147,038) (129,836)
Total revenues1 1,615,166 2,157,404
1 Included in the value of lead and zinc concentrates, precipitates and doré are provisional price adjustments which represent changes in the fair value of embedded derivatives. In 2013 the Group has recognised a gain of US$5 million (2012: gain of US$8.3 million). For further detail refer to note 2(o).
The average realised prices for the gold and silver content of products sold, prior to the deduction of treatment and refining charges, were:
Year ended 31 December
2013
US$ per ounce 2012
US$ per ounce
Gold 1,401.3 1,674.1
Silver 22.8 31.4
5. Cost of sales Year ended 31 December
2013
US$ thousands 2012 – Restated US$ thousands
Depreciation (notes 2 (b), 12 and 32) 239,347 243,766
Personnel expenses (note 8) 86,697 109,647
Maintenance and repairs 78,540 75,973
Operating materials 118,394 115,890
Energy 100,222 91,464
Contractors 190,063 188,982
Freight 9,856 8,771
Insurance 5,376 6,000
Mining rights and contributions 6,997 7,485
Other 17,876 13,631
Cost of production 853,368 861,609
(Gain)/loss on foreign currency hedges (4,323) 2,111
Change in work-in-progress and finished goods (ore inventories) (1,319) (70,915)
Cost of sales (notes 2 (b) and 32) 847,726 792,805
174 Fresnillo plc | Annual report 2013 www.fresnilloplc.com

6. Administrative expenses Year ended 31 December
2013
US$ thousands2012
US$ thousands
Administrative expenses charged by Peñoles Group:
Administrative services1 32,726 23,912
32,726 23,912
Personnel expenses (note 8) 13,177 12,943
Other administrative expenses 16,340 16,357
62,243 53,212
1 Effective 1 January 2013, a new Service Agreement with Servicios Administrativos Peñoles, S.A. de C.V., (‘SAPSA’), a wholly owned Peñoles subsidiary, was signed. This Service Agreement comprises administrative and non-administrative services from 1 January 2013 through 31 December 2018, for an annual fee of US$7.4 million and MX$362.8 million. From 1 November 2009 through 31 December 2012, this Service Agreement comprised administrative and non-administrative services for an annual fee of US$6.1 million and MX$277.5 million.
During the year ended 31 December 2013, the Company incurred expenses of US$40.7 million under the above mentioned agreement (US$31.3 million for the year ended 31 December 2012). Expenses include administrative expenses of US$32.7 million (2012: US$23.9 million), exploration expenses of US$0.6 million (2012: US$0.4 million) and US$7.4 million relating to engineering costs that were capitalised (2012: US$7.0 million).
7. Exploration expenses Year ended 31 December
2013
US$ thousands2012
US$ thousands
Contractors 158,970 192,914
Administrative services 12,791 10,996
Mining rights and contributions 16,423 9,710
Personnel expenses (note 8) 4,013 3,636
Assays 6,566 8,686
Maintenance and repairs 801 549
Operating materials 2,989 2,867
Rentals 2,369 2,497
Energy 1,777 550
Other 1,083 1,127
207,782 233,532
These exploration expenses were mainly incurred in areas of the Fresnillo, Herradura, Noche Buena, La Ciénega and Saucito mines, the San Ramon satellite mine and the San Julian, Orysivo and Deep Centauro projects. Minor exploration expenses of US$3.4million (2012: US$5.7 million) were incurred in the year in projects located in Peru.
The following table sets forth liabilities (generally payables) incurred in the exploration activities of the Group companies engaged only in exploration, principally Exploraciones Mineras Parreña, S.A. de C.V. Liabilities related to exploration activities incurred by the Group operating companies are not included since it is not possible to separate the liabilities related to exploration activities of these companies from their operating liabilities.
Year ended 31 December
2013
US$ thousands2012
US$ thousands
Liabilities related to exploration activities 222 2,674
Cash flows relating to exploration activities are as follows:
Year ended 31 December
2013
US$ thousands2012
US$ thousands
Operating cash out flows 210,234 237,426
175www.fresnilloplc.com Fresnillo plc | Annual report 2013
Fresnillo Today
Strategic Report
Corporate Governance
Financial Statements

Notes to the Consolidated Financial Statements continued
8. Personnel expenses Year ended 31 December
2013
US$ thousands 2012 – Restated US$ thousands
Employees’ profit sharing 20,910 49,856
Salaries and wages 32,843 29,037
Bonuses 10,365 9,677
Legal contributions 12,196 10,970
Other benefits 7,757 7,154
Vacations and vacations bonus 2,325 2,641
Social security 4,503 4,654
Post-employment benefits (note 22) 3,489 2,855
Other 9,499 9,382
103,887 126,226
(a) Personnel expenses are distributed in the following line items: Year ended 31 December
2013
US$ thousands 2012 – Restated US$ thousands
Cost of sales (note 5) 86,697 109,647
Administrative expenses (note 6) 13,177 12,943
Exploration expenses (note 7) 4,013 3,636
103,887 126,226
(b) The monthly average number of employees during the year was as follows: Year ended 31 December
2013
No. 2012
No.
Mining 1,481 1,394
Plant concentration 448 429
Exploration 286 262
Maintenance 662 606
Administration and other 510 437
Total 3,387 3,128
176 Fresnillo plc | Annual report 2013 www.fresnilloplc.com

9. Other income and other expenses Year ended 31 December
2013
US$ thousands2012
US$ thousands
Other income:
Rentals 477 830
Net insurance recovery 768 –
Royalties 1,359 1,118
Other 3,444 4,964
6,048 6,912
Year ended 31 December
2013
US$ thousands2012
US$ thousands
Other expenses:
Maintenance1 527 1,285
Donations 532 654
Loss on sale of property, plant and equipment 1,491 1,042
Write-off of accounts receivable – 131
Flood costs relating to Saucito mine – 11,729
Impairment on available-for-sale financial assets 2,053 –
Other 3,811 2,929
8,414 17,770
1 Relates to maintenance of closed mines owned by Compañía Minera las Torres, S.A. de C.V.
10. Income tax expense
a) Major components of income tax expense: Year ended 31 December
2013
US$ thousands2012 – Restated US$ thousands
Consolidated income statement:
Current income tax:
Current income tax charge 168,867 345,634
Amounts underprovided/(overprovided) in previous years 1,756 (4,079)
170,623 341,555
Deferred income tax related to corporate income tax:
Origination and reversal of temporary differences (47,446) (52,642)
Effect of changes in future income tax rates 14,545 –
Revaluation effects of Silverstream contract (16,192) 33,658
(49,093) (18,984)
Corporate income tax 121,530 322,571
Deferred income tax related to special mining right:
Origination of temporary differences 36,161 –
Income tax expense reported in the income statement 157,691 322,571
177www.fresnilloplc.com Fresnillo plc | Annual report 2013
Fresnillo Today
Strategic Report
Corporate Governance
Financial Statements

Notes to the Consolidated Financial Statements continued
Year ended 31 December
2013
US$ thousands 2012
US$ thousands
Consolidated statement of comprehensive income:
Deferred income tax effect related to items charged or credited directly to other comprehensive income:
Net credit/(charge) arising on (losses)/gains on cash flow hedges recycled to income statement 1,188 (746)
Net charge arising on unrealised gains arising on valuation of cash flow hedges (1,138) (1,777)
Net credit/(charge) arising on unrealised (losses)/gains on available-for-sale financial assets 17,416 (8,276)
Net charge arising on cash flow gains reclassified to value of other assets (65) (289)
Net credit/(charge) arising on remeasurement (losses)/gains on defined benefit plans 109 (248)
Income tax effect reported in other comprehensive income/(expense) 17,510 (11,336)
(b) Reconciliation of the income tax expense at the Group’s statutory income rate to income tax expense at the Group’s effective income tax rate: Year ended 31 December
2013
US$ thousands 2012 – Restated US$ thousands
Accounting profit before income tax 418,709 1,177,607
Tax at the Group’s statutory income tax rate 30.0% 125,612 353,282
Expenses not deductible for tax purposes 1,537 169
Inflationary uplift of the tax base of assets and liabilities (17,553) (12,330)
Current income tax overprovided in previous years 1,756 (4,079)
Exchange rate effect on tax value of assets and liabilities 1,131 (17,773)
Non-deductible/non-taxable foreign exchange gains or losses 3,958 (8,108)
Inflationary uplift of tax losses (1,854) (714)
Deferred tax asset not recognised 2,022 3,652
Changes to future income tax rates 14,545 –
Deferred special mining right deductible for corporate income tax (10,848) –
Other 1,224 8,472
Corporate income tax at the effective tax rate of 29.0% (2012: 27.4%) 121,530 322,571
Deferred special mining right 36,161 –
Tax at the effective income tax rate of 37.7% (2012: 27.4%) 157,691 322,571
178 Fresnillo plc | Annual report 2013 www.fresnilloplc.com
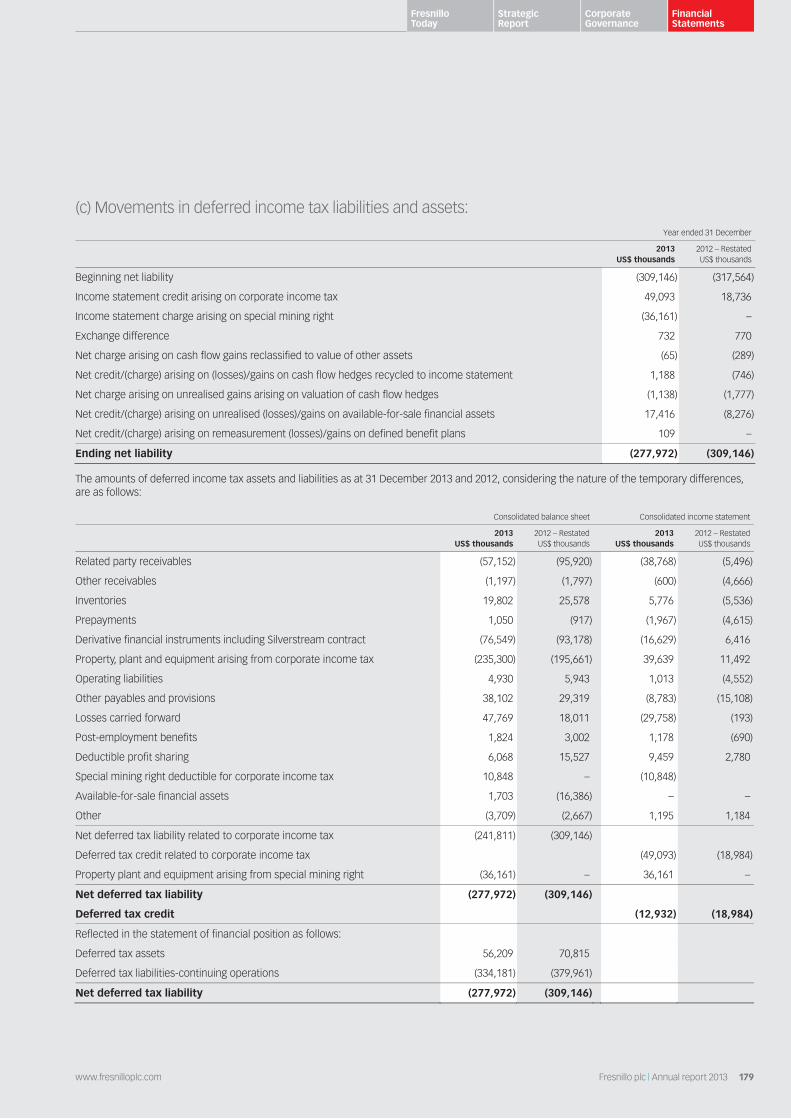
(c) Movements in deferred income tax liabilities and assets: Year ended 31 December
2013
US$ thousands2012 – Restated US$ thousands
Beginning net liability (309,146) (317,564)
Income statement credit arising on corporate income tax 49,093 18,736
Income statement charge arising on special mining right (36,161) –
Exchange difference 732 770
Net charge arising on cash flow gains reclassified to value of other assets (65) (289)
Net credit/(charge) arising on (losses)/gains on cash flow hedges recycled to income statement 1,188 (746)
Net charge arising on unrealised gains arising on valuation of cash flow hedges (1,138) (1,777)
Net credit/(charge) arising on unrealised (losses)/gains on available-for-sale financial assets 17,416 (8,276)
Net credit/(charge) arising on remeasurement (losses)/gains on defined benefit plans 109 –
Ending net liability (277,972) (309,146)
The amounts of deferred income tax assets and liabilities as at 31 December 2013 and 2012, considering the nature of the temporary differences, are as follows:
Consolidated balance sheet Consolidated income statement
2013
US$ thousands2012 – Restated US$ thousands
2013 US$ thousands
2012 – Restated US$ thousands
Related party receivables (57,152) (95,920) (38,768) (5,496)
Other receivables (1,197) (1,797) (600) (4,666)
Inventories 19,802 25,578 5,776 (5,536)
Prepayments 1,050 (917) (1,967) (4,615)
Derivative financial instruments including Silverstream contract (76,549) (93,178) (16,629) 6,416
Property, plant and equipment arising from corporate income tax (235,300) (195,661) 39,639 11,492
Operating liabilities 4,930 5,943 1,013 (4,552)
Other payables and provisions 38,102 29,319 (8,783) (15,108)
Losses carried forward 47,769 18,011 (29,758) (193)
Post-employment benefits 1,824 3,002 1,178 (690)
Deductible profit sharing 6,068 15,527 9,459 2,780
Special mining right deductible for corporate income tax 10,848 – (10,848)
Available-for-sale financial assets 1,703 (16,386) – –
Other (3,709) (2,667) 1,195 1,184
Net deferred tax liability related to corporate income tax (241,811) (309,146)
Deferred tax credit related to corporate income tax (49,093) (18,984)
Property plant and equipment arising from special mining right (36,161) – 36,161 –
Net deferred tax liability (277,972) (309,146)
Deferred tax credit (12,932) (18,984)
Reflected in the statement of financial position as follows:
Deferred tax assets 56,209 70,815
Deferred tax liabilities-continuing operations (334,181) (379,961)
Net deferred tax liability (277,972) (309,146)
179www.fresnilloplc.com Fresnillo plc | Annual report 2013
Fresnillo Today
Strategic Report
Corporate Governance
Financial Statements
Notes to the Consolidated Financial Statements continued
Deferred income tax assets and liabilities are offset when there is a legally enforceable right to offset current tax assets against current tax liabilities and when the deferred income tax assets and liabilities relate to the same fiscal authority.
A deferred tax asset has been recognised in respect of tax losses amounting to US$159.2 million (2012: US$67.9 million).
The Group has further tax losses and other similar attributes carried forward of US$5.6 million (2012: US$3.6 million) on which no deferred tax is recognised due to insufficient certainty regarding the availability of appropriate future taxable profits.
(d) Unrecognised deferred tax on investments in subsidiaries The Group has not recognised all of the deferred tax liability in respect of distributable reserves of its subsidiaries because it controls them and only part of the temporary differences are expected to reverse in the foreseeable future. The temporary differences for which a deferred tax liability has not been recognised aggregate to US$1,271 million (2012: US$1,256 million).
Corporate Income Tax (‘Impuesto Sobre la Renta’ or ‘ISR’), Special Mining Right (‘SMR’) and Business Flat Tax (‘Impuesto Empresarial a Tasa Unica’ or ‘IETU’)
The Group’s principal operating subsidiaries are Mexican residents for taxation purposes. In December 2013, a new Tax Reform was enacted, effective as from 1 January 2014. As a result of such Tax Reform, a new Income Tax Law (ISR) was enacted and the IETU Law was abolished.
The new ISR includes:
– new criteria and limits for certain tax deductions, that among others are; payroll-related expenses, including contributions to pension funds that are considered exempt income for employees will be considered non-deductible;
– certain payments to related parties, that do not comply with specific legal requirements would be considered as non-deductible;
– the requirement to calculate the mandatory profit sharing (PTU) that is paid to Mexican employees on the same base as the income tax, before deduction for profit sharing and before the use of net operating losses. Differences between the profit sharing and income tax base historically relate to inflation accounting, which is not included in profit sharing, the recognition of exchange gains and losses, and the recognition of income for dividends; and
– a dividend withholding tax of 10% tax on distributions of dividends paid to Mexican individuals as well as foreign residents. Dividends between Mexican resident entities are not subject to tax at the shareholder level.
The corporate income tax rate for 2013, under the new ISR, will remain at 30%. Previously enacted reductions of the tax rate over the next two years to 28% have been repealed. Deferred tax assets and liabilities have been remeasured to reflect these changes, the remeasurement increased income tax expense by US$14.5 million.
As part of the new Tax Reform, the Federal Rights Law was amended on certain mining matters with the new SMR added as from 1 January 2014. The SMR is considered as income tax under IFRS, and states that the owners of mining titles and concessions will be subject to pay an annual mining right of 7.5% of the profit derived from the extractive activities. The 7.5% tax will apply to a base of income before interest, annual inflation adjustment, taxes paid on the regular activity, depreciation and amortisation, as defined by the new ISR. This SMR can be credited against the corporate income tax of the same fiscal year and its payment must be remitted no later than the last business day of March of the following year. Depreciation expense relating to property, plant and equipment will not be deductible for this SMR, consequently, the Group has recognised at 31 December 2013, a deferred tax liability of US$36.1 million in the income statement for the year.
IETU was an alternative minimum corporate income tax, effective from 1 January 2008 through 31 December 2013. Companies were required to pay the greater of their mainstream corporate income tax liability for the year or their liability to IETU which was calculated at the rate of 17.5% and applied to the sale of goods, rendering of independent services and temporary use or enjoyment of goods. In calculating the charge to IETU, deductions were allowed for certain expenses incurred in generating income.
Other mining rights In addition to the SMR, the following new mining rights were added to the Federal Right Law, as part of the Tax Reform, which will be effective 1 January 2014. These rights are not considered as an income tax.
– Additional Mining Right which consists of a 50% increase in the duties per hectare for concessions not explored nor exploited during two continuous years during the first 11 years of obtaining the concession. Furthermore, there is a 100% increase in the right per hectare for concessions not being explored or exploited during a continuous two-year period starting on year 12 of the concession. This right is payable semi-annually in January and July of each year.
– Extraordinary Mining Right consists of a 0.5% rate, applicable to the owners of mining titles, over its sales of gold, silver or platinum obtained during a fiscal year. The payment must be calculated over the total sales of all mining concessions. It is explicitly required that the taxpayers must maintain separate accounting to identify the specific sales of gold, silver and platinum. The compliance with this Extraordinary Mining Duty is independent from other mining rights. The payment of this mining right must be remitted no later than the last business day of March of the following year and can be credited against corporate income tax.
180 Fresnillo plc | Annual report 2013 www.fresnilloplc.com

11. Earnings per share Earnings per share (‘EPS’) is calculated by dividing profit for the year attributable to equity shareholders of the Company by the weighted average number of Ordinary Shares in issue during the period.
The Company has no dilutive potential Ordinary Shares.
As of 31 December 2013 and 2012, earnings per share have been calculated as follows:
Year ended 31 December
2013
US$ thousands2012 – Restated US$ thousands
Earnings:
Profit from continuing operations attributable to equity holders of the Company (in thousands of US dollars) 240,448 741,222
Adjusted profit from continuing operations attributable to equity holders of the Company (in thousands of US dollars) 278,232 657,198
Adjusted profit is profit as disclosed in the consolidated income statement adjusted to exclude revaluation effects of the Silverstream contract of US$54.0 million loss (US$37.8 million net of tax) (2012: US$117.7 million gain (US$84.0 million net of tax)).
Adjusted earnings per share have been provided in order to provide a measure of the underlying performance of the Group, prior to the revaluation effects of the Silverstream contract, a derivative financial instrument.
2013
thousands2012
thousands
Number of shares:
Weighted average number of Ordinary Shares in issue 730,244 717,160
2013 US$
2012 – Restated US$
Earnings per share:
Basic and diluted earnings per share 0.329 1.034
Adjusted basic and diluted earnings per Ordinary Share from continuing operations 0.381 0.916
12. Property, plant and equipment Year ended 31 December 2012 – Restated
Land and buildings
Plant and equipment
Mining properties and development
costs Other assets Construction in
progress Total
US$ thousands
Cost
At 1 January 2012 97,603 624,513 606,134 83,883 289,412 1,701,545
Additions – Restated 3,940 66,709 57,839 52,298 397,996 578,782
Disposals (4,308) (18,993) (7,072) (1,314) (25,254) (56,941)
Transfers and other movements 34,091 199,457 104,629 14,367 (352,544) –
At 31 December 2012 – Restated 131,326 871,686 761,530 149,234 309,610 2,223,386
Accumulated depreciation
At 1 January 2012 (28,382) (157,193) (297,603) (23,922) – (507,100)
Depreciation for the year1 – Restated (12,379) (130,036) (81,942) (19,409) – (243,766)
Disposals 17 17,107 7,024 1,016 – 25,164
At 31 December 2012 – Restated (40,744) (270,122) (372,521) (42,315) – (725,702)
Net Book amount at 31 December 2012 – Restated 90,582 601,564 389,009 106,919 309,610 1,497,684
1 Depreciation for the year includes US$239.3 million (2012: US$243.8 million) recognised as an expense in the cost of sales in the income statement, and US$7.7 million (2012: Nil), capitalised as part of construction in progress.
181www.fresnilloplc.com Fresnillo plc | Annual report 2013
Fresnillo Today
Strategic Report
Corporate Governance
Financial Statements
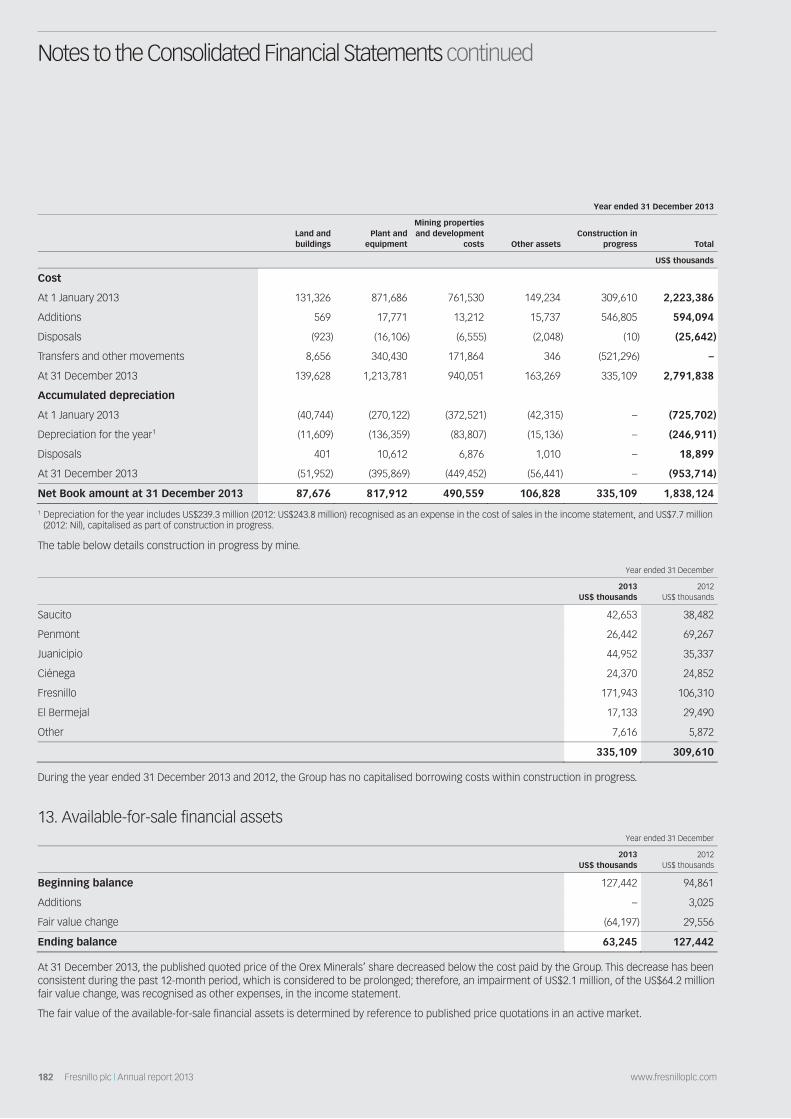
Notes to the Consolidated Financial Statements continued
Year ended 31 December 2013
Land and buildings
Plant and equipment
Mining properties and development
costs Other assets Construction in
progress Total
US$ thousands
Cost
At 1 January 2013 131,326 871,686 761,530 149,234 309,610 2,223,386
Additions 569 17,771 13,212 15,737 546,805 594,094
Disposals (923) (16,106) (6,555) (2,048) (10) (25,642)
Transfers and other movements 8,656 340,430 171,864 346 (521,296) –
At 31 December 2013 139,628 1,213,781 940,051 163,269 335,109 2,791,838
Accumulated depreciation
At 1 January 2013 (40,744) (270,122) (372,521) (42,315) – (725,702)
Depreciation for the year1 (11,609) (136,359) (83,807) (15,136) – (246,911)
Disposals 401 10,612 6,876 1,010 – 18,899
At 31 December 2013 (51,952) (395,869) (449,452) (56,441) – (953,714)
Net Book amount at 31 December 2013 87,676 817,912 490,559 106,828 335,109 1,838,124
1 Depreciation for the year includes US$239.3 million (2012: US$243.8 million) recognised as an expense in the cost of sales in the income statement, and US$7.7 million (2012: Nil), capitalised as part of construction in progress.
The table below details construction in progress by mine.
Year ended 31 December
2013
US$ thousands 2012
US$ thousands
Saucito 42,653 38,482
Penmont 26,442 69,267
Juanicipio 44,952 35,337
Ciénega 24,370 24,852
Fresnillo 171,943 106,310
El Bermejal 17,133 29,490
Other 7,616 5,872
335,109 309,610
During the year ended 31 December 2013 and 2012, the Group has no capitalised borrowing costs within construction in progress.
13. Available-for-sale financial assets Year ended 31 December
2013
US$ thousands 2012
US$ thousands
Beginning balance 127,442 94,861
Additions – 3,025
Fair value change (64,197) 29,556
Ending balance 63,245 127,442
At 31 December 2013, the published quoted price of the Orex Minerals’ share decreased below the cost paid by the Group. This decrease has been consistent during the past 12-month period, which is considered to be prolonged; therefore, an impairment of US$2.1 million, of the US$64.2 million fair value change, was recognised as other expenses, in the income statement.
The fair value of the available-for-sale financial assets is determined by reference to published price quotations in an active market.
182 Fresnillo plc | Annual report 2013 www.fresnilloplc.com

14. Silverstream contract On 31 December 2007, the Group entered into an agreement with Peñoles through which it is entitled to receive the proceeds received by the Peñoles Group in respect of the refined silver sold from the Sabinas Mine (‘Sabinas’), a base metals mine owned and operated by the Peñoles Group, for an upfront payment of US$350 million. In addition, a per ounce cash payment of $2.00 in years one to five and $5.00 thereafter (subject to an inflationary adjustment commencing on 31 December 2013) is payable to Peñoles. Under the contract, the Group has the option to receive a net cash settlement from Peñoles attributable to the silver produced and sold from Sabinas, to take delivery of an equivalent amount of refined silver or to receive settlement in the form of both cash and silver. If, by 31 December 2032, the amount of silver produced by Sabinas is less than 60 million ounces, a further payment is due from Peñoles of US$1 per ounce of shortfall.
The Silverstream contract represents a derivative financial instrument which has been recorded at fair value and classified within non-current and current assets as appropriate. Changes in the contract’s fair value, other than those represented by the realisation of the asset through the receipt of either cash or refined silver, are charged or credited to the income statement. In the year ended 31 December 2013 total proceeds received in cash were US$63.8 million (2012: US$110.6 million) of which, US$11.0 million was in respect of proceeds receivable as at 31 December 2012 (2012: US$13.6 million). Cash received in respect of the year of US$52.8 million (2012: US$97.0 million) corresponds to 3.5 million ounces of payable silver (2012: 3.8 million ounces). As at 31 December 2013, a further US$8.1 million (2012: US$11 million) of cash corresponding to 560,465 ounces of silver is due (2012: 378,345 ounces).
The most significant drivers of the US$54.0 million unrealised loss taken to income statement (2012: US$117.7 million gain) were the updating of assumptions utilised to value the Silverstream contract, most significantly the forward price of silver which was lower than expected given the cyclical nature of prices, the increase of the reference discount rate (LIBOR) and the difference between payments already received in 2013 and payments estimated in the valuation model as at 31 December 2012. These were partially offset by an increase in the Sabinas mine reserves and resources.
A reconciliation of the beginning balance to the ending balance is shown below:
2013
US$ thousands2012
US$ thousands
Balance at 1 January: 487,779 478,083
Cash received in respect of the year (52,830) (97,005)
Cash receivable (8,127) (10,981)
Remeasurement (losses)/gains recognised in profit and loss (53,976) 117,682
Balance at 31 December 372,846 487,779
Less – Current portion 38,763 68,290
Non-current portion 334,083 419,489
See note 30 for further information on the inputs that have a significant effect on the fair value of this derivative, see note 31 for further information relating to market and credit risks associated with the Silverstream asset, and note 2(c) for the estimates and assumptions.
15. Inventories As at 31 December
2013
US$ thousands2012 – Restated US$ thousands
Finished goods1 2,180 1,966
Work-in-progress2 130,451 129,346
Operating materials and spare parts 77,854 65,512
210,485 196,824
Allowance for obsolete and slow-moving inventories (2,344) (2,210)
Total inventories at the lower of cost and net realisable value 208,141 194,614
1 Finished goods include metals contained in concentrates and doré bars, and concentrates on hand or in transit to a smelter or refinery. 2 Work-in-progress includes metals contained in ores in leaching pads.
Concentrates are a product containing sulphides with variable content of precious and base metals and are sold to smelters and/or refineries. Doré is an alloy containing a variable mixture of gold and silver that is delivered in bar form to refineries. This content once processed by the smelter and refinery is sold to customers in the form of refined products.
The amount of inventories recognised as an expense in the year was US$777.8 million (2012: US$822.2 million). The amount of write down of inventories recognised as an expense was US$0.9 million (2012: US$0.6 million).
183www.fresnilloplc.com Fresnillo plc | Annual report 2013
Fresnillo Today
Strategic Report
Corporate Governance
Financial Statements

Notes to the Consolidated Financial Statements continued
16. Trade and other receivables Year ended 31 December
2013
US$ thousands 2012
US$ thousands
Trade receivables from related parties (note 27)1 96,641 192,273
Value Added Tax receivable 47,377 18,860
Advances to suppliers and contractors 7,885 6,778
Other receivables from related parties (note 27) 8,152 11,000
Loans granted to contractors 2,639 7,019
Other receivables arising on the sale of fixed assets 10,163 13,924
Other receivables 15,862 14,454
188,719 264,308
Provision for impairment of ‘other receivables’ (662) (664)
Trade and other receivables classified as current assets 188,057 263,644
Other receivables classified as non-current assets:
Loans granted to contractors 7,012 7,914
Other receivables arising on the sale of fixed assets 7,898 13,089
14,910 21,003
202,967 284,647
1 ‘Trade receivables from related parties’ includes the fair value of embedded derivatives arising due to provisional pricing in sales contracts of US$(1.1) million as at 31 December 2013 (2012: US$(6.1) million).
Trade receivables are shown net of any corresponding advances, are non-interest bearing and generally have payment terms of 46 to 60 days.
Loans granted to contractors bear interest of between LIBOR plus 1.5% to LIBOR plus 3% and have a maturity of two to six years.
The total receivables denominated in US dollars were US$146.7 million (2012: US$256.9 million), and in pesos US$56.3 million (2012: US$27.7 million).
As of 31 December for each year presented, with the exception of ‘other receivables’ in the table below, all trade and other receivables were neither past due nor impaired.
Year ended 31 December
Total
US$ thousandsImpaired
US$ thousands
Neither past due nor impaired
US$ thousands
Past due but not impaired
<30 days US$ thousands
30–60 days US$ thousands
2013
Trade receivables from related parties 96,641 – 96,641 – –
Other receivables from related parties 8,152 – 8,152 – –
Loans granted to contractors 9,651 – 9,651 – –
Other receivables arising on the sale of fixed assets 18,061 – 18,061 – –
Other receivables 15,862 (662) 15,200 – –
Total 148,367 (662) 147,705 – –
2012
Trade receivables from related parties 192,273 – 192,273 – –
Other receivables from related parties 11,000 – 11,000 – –
Loans granted to contractors 14,933 – 14,933 – –
Other receivables arising on the sale of fixed assets 27,013 – 27,013 – –
Other receivables 14,454 (664) 13,790 – –
Total 259,673 (664) 259,009 – –
In determining the recoverability of receivables, the Group performs a risk analysis considering the type and age of the outstanding receivable and the credit worthiness of the counterparty.
184 Fresnillo plc | Annual report 2013 www.fresnilloplc.com

17. Cash and cash equivalents As at 31 December
2013
US$ thousands2012
US$ thousands
Cash at bank and on hand 1,054 5,121
Short-term deposits 1,250,640 608,652
Cash and cash equivalents 1,251,694 613,773
Cash at bank earns interest at floating rates based on daily bank deposits. Short-term deposits are made for varying periods of between one to 30 days, depending on the immediate cash requirements of the Group, and earn interest at the respective short-term deposit rates.
18. Equity
Share capital and share premium Authorised share capital of the Company is as follows:
As at 31 December
2013 2012
Class of share Number Amount Number Amount
Ordinary Shares each of US$0.50 1,000,000,000 $500,000,000 1,000,000,000 $500,000,000
Sterling Deferred Ordinary Shares each of £1.00 50,000 £50,000 50,000 £50,000
Issued share capital of the Company is as follows:
Ordinary Shares Sterling Deferred Ordinary Shares
Number US$ Number £
At 1 January 2012 717,160,159 $358,580,080 50,000 £50,000
At 31 December 2012 717,160,159 $358,580,080 50,000 £50,000
Issued on 3 May 2013 19,733,430 $9,866,715 – –
At 31 December 2013 736,893,589 $368,446,795 50,000 £50,000
Pursuant to the placing of shares announced on 29 April 2013, the Group issued on 3 May 2013, 19,733,430 new Ordinary Shares at £11.30 (US$17.60) per share for gross proceeds of £222.9 million (US$346.4 million). Share issue cost paid amounted to US$0.3 million. The placing of shares ensured that Fresnillo plc is compliant with changes to the Ground Rules of the FTSE UK Index Series that require constituents to maintain a minimum free float of 25%. The proceeds of the placing were used for general corporate purposes and the Company’s working capital needs.
As a result, the Company’s issued Ordinary Share capital now consists of 736,893,589 (2012: 717,160,159) Ordinary Shares of US$0.50 each with voting rights. The Company does not hold any Ordinary Shares in treasury. Therefore, the total number of voting rights in the Company is 736,893,589.
At 31 December 2013 and 2012, all issued shares with a par value of US$0.50 each are fully paid. The rights and obligations attached to these shares are governed by law and the Company’s Articles of Association. Ordinary shareholders are entitled to receive notice and to attend and speak at any general meeting of the Company. There are no restrictions on the transfer of the Ordinary Shares.
The Sterling Deferred Ordinary Shares only entitle the shareholder on winding up or on a return of capital to payment of the amount paid up after repayment to Ordinary Shareholders. The Sterling Deferred Ordinary Shares do not entitle the holder to payment of any dividend, or to receive notice or to attend and speak at any general meeting of the Company. The Company may also at its option redeem the Sterling Deferred Ordinary Shares at a price of £1.00 or, as custodian, purchase or cancel the Sterling Deferred Ordinary Shares or require the holder to transfer the Sterling Deferred Ordinary Shares. Except at the option of the Company the Sterling Deferred Ordinary Shares are not transferable.
Reserves Share premium This reserve records the consideration premium for shares issued at a value that exceeds their nominal value.
During 2013, share premium increased by US$335.2 million as a result of the issue of new Ordinary Shares on 3 May 2013.
Capital reserve The capital reserve arose as a consequence of the Pre-IPO Reorganisation as a result of using the pooling of interest method.
185www.fresnilloplc.com Fresnillo plc | Annual report 2013
Fresnillo Today
Strategic Report
Corporate Governance
Financial Statements
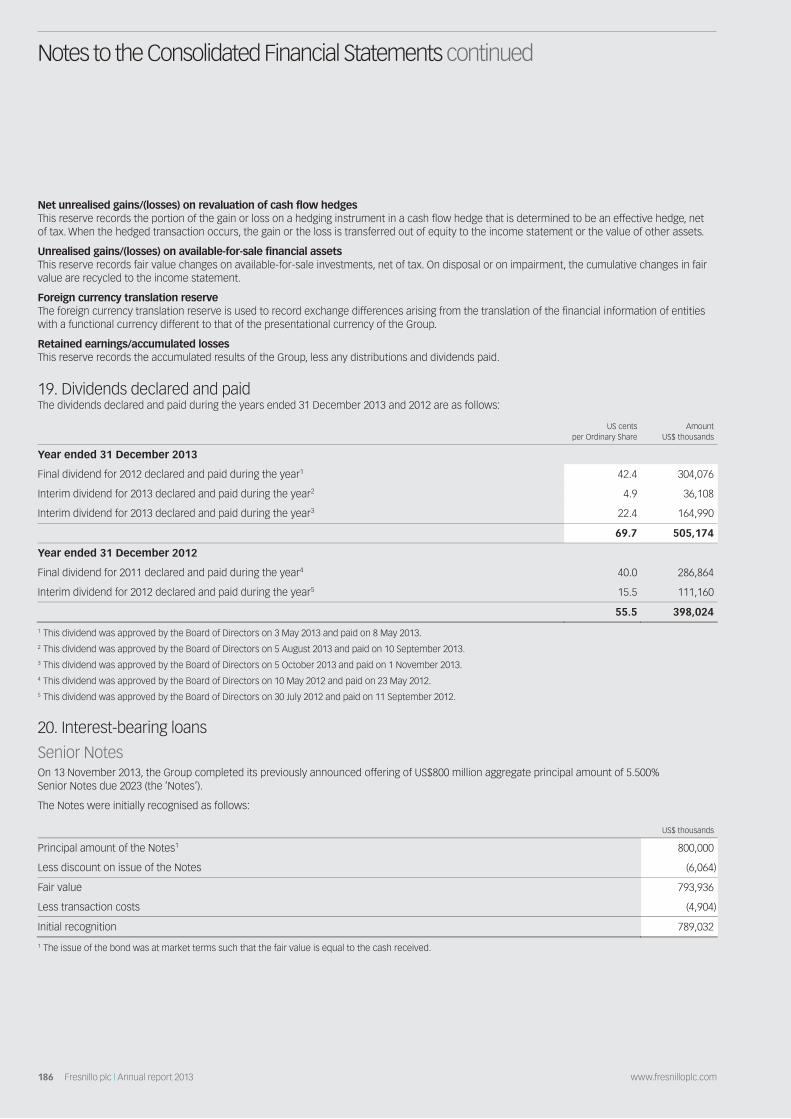
Notes to the Consolidated Financial Statements continued
Net unrealised gains/(losses) on revaluation of cash flow hedges This reserve records the portion of the gain or loss on a hedging instrument in a cash flow hedge that is determined to be an effective hedge, net of tax. When the hedged transaction occurs, the gain or the loss is transferred out of equity to the income statement or the value of other assets.
Unrealised gains/(losses) on available-for-sale financial assets This reserve records fair value changes on available-for-sale investments, net of tax. On disposal or on impairment, the cumulative changes in fair value are recycled to the income statement.
Foreign currency translation reserve The foreign currency translation reserve is used to record exchange differences arising from the translation of the financial information of entities with a functional currency different to that of the presentational currency of the Group.
Retained earnings/accumulated losses This reserve records the accumulated results of the Group, less any distributions and dividends paid.
19. Dividends declared and paid The dividends declared and paid during the years ended 31 December 2013 and 2012 are as follows:
US cents
per Ordinary Share Amount
US$ thousands
Year ended 31 December 2013
Final dividend for 2012 declared and paid during the year1 42.4 304,076
Interim dividend for 2013 declared and paid during the year2 4.9 36,108
Interim dividend for 2013 declared and paid during the year3 22.4 164,990
69.7 505,174
Year ended 31 December 2012
Final dividend for 2011 declared and paid during the year4 40.0 286,864
Interim dividend for 2012 declared and paid during the year5 15.5 111,160
55.5 398,024
1 This dividend was approved by the Board of Directors on 3 May 2013 and paid on 8 May 2013. 2 This dividend was approved by the Board of Directors on 5 August 2013 and paid on 10 September 2013. 3 This dividend was approved by the Board of Directors on 5 October 2013 and paid on 1 November 2013. 4 This dividend was approved by the Board of Directors on 10 May 2012 and paid on 23 May 2012. 5 This dividend was approved by the Board of Directors on 30 July 2012 and paid on 11 September 2012.
20. Interest-bearing loans
Senior Notes On 13 November 2013, the Group completed its previously announced offering of US$800 million aggregate principal amount of 5.500% Senior Notes due 2023 (the ‘Notes’).
The Notes were initially recognised as follows:
US$ thousands
Principal amount of the Notes1 800,000
Less discount on issue of the Notes (6,064)
Fair value 793,936
Less transaction costs (4,904)
Initial recognition 789,032
1 The issue of the bond was at market terms such that the fair value is equal to the cash received.
186 Fresnillo plc | Annual report 2013 www.fresnilloplc.com

An analysis of the debt as at 31 December 2013 is as follows:
US$ thousands
Initial recognition 789,032
Accrued interest1 6,135
Amortisation of discount and transaction costs 139
Total 795,306
1 Accrued interest is payable semi-annually on 13 May and 13 November.
21. Provision for mine closure cost The provision represents the discounted values of the estimated cost to decommission and rehabilitate the mines at the estimated date of depletion of mine deposits. The present value of the provision at 31 December 2013 has been calculated using an annual real discount rate of 4.5% (2012: 4.5%). The unwinding of discount charge in 2013 has been calculated using a nominal discount rate of 7.00% (2012: 7.00%). Uncertainties in estimating these costs include potential changes in regulatory requirements, decommissioning, dismantling, and reclamation alternatives and timing, the levels of discount foreign exchange and inflation rates.
Mexican regulations regarding the decommissioning and rehabilitation of mines are limited and less developed in comparison to regulations in many other jurisdictions. It is the Group’s intention to rehabilitate the mines beyond the requirements of Mexican law, and estimated costs reflect this level of expense. The Group intends to fully rehabilitate the affected areas at the end of the life of the mines.
The provision is expected to become payable at the end of the production life of each mine, based on the reserves and resources, which ranges from three to 30 years from 31 December 2013 (three to 38 years from 31 December 2012).
As at 31 December
2013
US$ thousands2012
US$ thousands
Beginning balance 104,712 50,754
Increase to existing provision 15,341 46,222
Unwinding of discount 7,507 3,912
Foreign exchange (552) 3,824
Ending balance 127,008 104,712
22. Pensions and other post-employment benefit plans The Group adopted revisions to IAS19 Employee Benefits (‘IAS 19R’) retrospectively in accordance with the transitional provisions set out in IAS 19R and IAS 8 Accounting Policies, Changes in Accounting Estimates and Errors. IAS 19R introduces changes to the recognition, measurement, presentation and disclosure of post-employment benefits. Refer to note 32 ‘Effect of changes in accounting policies’ for more information.
The Group has a defined benefit plan and a defined contribution plan. The defined benefit plan provides pension benefits based on each worker’s earnings and years of services provided by personnel hired through 30 June 2007 as well as statutory seniority premiums for both unionised and non-unionised workers. Pensions benefits accrued as at 1 July 2007, are restated based on the National Consumer Price Index (NCPI) until the retirement date of each worker.
The overall investment policy and strategy for the Group’s defined benefit plan is guided by the objective of achieving an investment return which, together with contributions, ensures that there will be sufficient assets to pay pension benefits and statutory seniority premiums for non-unionised workers as they fall due while also mitigating the various risks of the plan. However, the portion of the plan related to statutory seniority premiums for unionised workers is not funded. The investment strategies for the plan are generally managed under local laws and regulations. The actual asset allocation is determined by current and expected economic and market conditions and in consideration of specific asset class risk in the risk profile. Within this framework, the Group ensures that the trustees consider how the asset investment strategy correlates with the maturity profile of the plan liabilities and the respective potential impact on the funded status of the plan, including potential short-term liquidity requirements.
The defined benefit contribution plan was established as from 1 July 2007 and consists of periodic contributions made by each non-unionised worker and contributions made by the Group to the fund matching workers’ contributions, capped at 8% of the employee’s annual salary.
Death and disability benefits are covered through insurance policies.
187www.fresnilloplc.com Fresnillo plc | Annual report 2013
Fresnillo Today
Strategic Report
Corporate Governance
Financial Statements
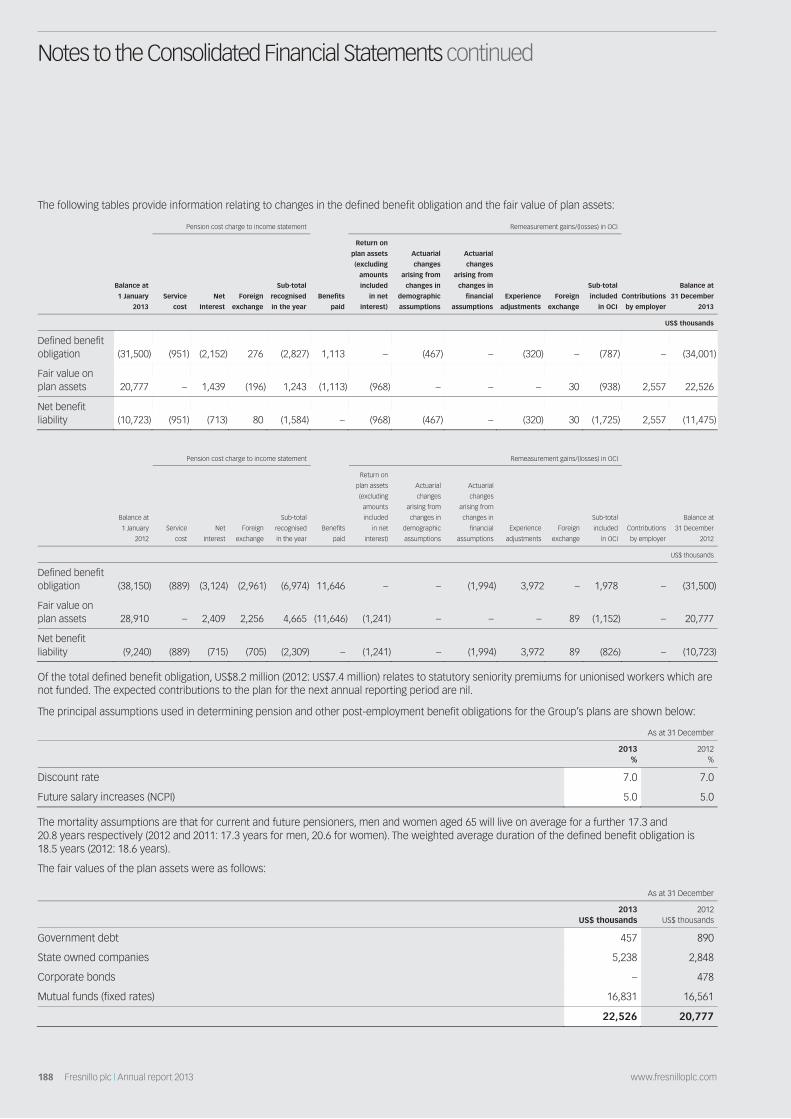
Notes to the Consolidated Financial Statements continued
The following tables provide information relating to changes in the defined benefit obligation and the fair value of plan assets:
Pension cost charge to income statement Remeasurement gains/(losses) in OCI
Balance at
1 January
2013
Service
cost
Net
Interest
Foreign
exchange
Sub-total
recognised
in the year
Benefits
paid
Return on
plan assets
(excluding
amounts
included
in net
interest)
Actuarial
changes
arising from
changes in
demographic
assumptions
Actuarial
changes
arising from
changes in
financial
assumptions
Experience
adjustments
Foreign
exchange
Sub-total
included
in OCI
Contributions
by employer
Balance at
31 December
2013
US$ thousands
Defined benefit obligation (31,500) (951) (2,152) 276 (2,827) 1,113 – (467) – (320) – (787) – (34,001)
Fair value on plan assets 20,777 – 1,439 (196) 1,243 (1,113) (968) – – – 30 (938) 2,557 22,526
Net benefit liability (10,723) (951) (713) 80 (1,584) – (968) (467) – (320) 30 (1,725) 2,557 (11,475)
Pension cost charge to income statement Remeasurement gains/(losses) in OCI
Balance at
1 January
2012
Service
cost
Net
Interest
Foreign
exchange
Sub-total
recognised
in the year
Benefits
paid
Return on
plan assets
(excluding
amounts
included
in net
interest)
Actuarial
changes
arising from
changes in
demographic
assumptions
Actuarial
changes
arising from
changes in
financial
assumptions
Experience
adjustments
Foreign
exchange
Sub-total
included
in OCI
Contributions
by employer
Balance at
31 December
2012
US$ thousands
Defined benefit obligation (38,150) (889) (3,124) (2,961) (6,974) 11,646 – – (1,994) 3,972 – 1,978 – (31,500)
Fair value on plan assets 28,910 – 2,409 2,256 4,665 (11,646) (1,241) – – – 89 (1,152) – 20,777
Net benefit liability (9,240) (889) (715) (705) (2,309) – (1,241) – (1,994) 3,972 89 (826) – (10,723)
Of the total defined benefit obligation, US$8.2 million (2012: US$7.4 million) relates to statutory seniority premiums for unionised workers which are not funded. The expected contributions to the plan for the next annual reporting period are nil.
The principal assumptions used in determining pension and other post-employment benefit obligations for the Group’s plans are shown below:
As at 31 December
2013
% 2012
%
Discount rate 7.0 7.0
Future salary increases (NCPI) 5.0 5.0
The mortality assumptions are that for current and future pensioners, men and women aged 65 will live on average for a further 17.3 and 20.8 years respectively (2012 and 2011: 17.3 years for men, 20.6 for women). The weighted average duration of the defined benefit obligation is 18.5 years (2012: 18.6 years).
The fair values of the plan assets were as follows:
As at 31 December
2013
US$ thousands 2012
US$ thousands
Government debt 457 890
State owned companies 5,238 2,848
Corporate bonds – 478
Mutual funds (fixed rates) 16,831 16,561
22,526 20,777
188 Fresnillo plc | Annual report 2013 www.fresnilloplc.com

The pension plan has not invested in any of the Group’s own financial instruments nor in properties or assets used by the Group.
A quantitative sensitivity analysis for significant assumption as at 31 December 2013 is as shown below:
Assumptions Discount rate
Future salary increases
(NCPI) Life expectancy of
pensioners
Sensitivity Level 0.5% increase 0.5% decrease 0.5% increase 0.5% decrease + 1 increase
Increase/(decrease) to the net defined benefit obligation (US$ thousands) (2,069) 2,069 1,885 (1,695) 504
The sensitivity analyses above have been determined based on a method that extrapolates the impact on net defined benefit obligation as a result of reasonable changes in key assumptions occurring at the end of the reporting period. The pension plan is not sensitive to future changes on salaries.
23. Trade and other payables As at 31 December
2013
US$ thousands2012
US$ thousands
Trade payables 50,347 59,928
Other payables to related parties (note 27) 2,542 1,660
Accrued expenses 25,567 30,259
Other taxes and contributions 3,449 3,440
81,905 95,287
Trade payables are mainly for the acquisition of materials, supplies and contractor services. These payables do not accrue interest and no guarantees have been granted. The fair value of trade and other payables approximate their book values.
The Group’s exposure to currency and liquidity risk related to trade and other payables is disclosed in note 31.
24. Commitments A summary of capital expenditure commitments is as follows:
As at 31 December
2013
US$ thousands2012
US$ thousands
Minera Saucito, S.A. de C.V. 56,597 15,883
Minera Penmont, S. de R.L. de C:V. 16,944 55,594
Minera Mexicana La Ciénega, S.A. de C.V. 4,192 9,145
Minera Fresnillo, S. A. de C.V. 84,604 102,149
Minera El Bermejal, S. de R.L. de C.V. and other 1,804 81,162
164,141 263,933
25. Operating leases
(a) Operating leases as lessor Future minimum rentals receivable under non-cancellable operating leases are as follows:
As at 31 December
2013
US$ thousands2012
US$ thousands
Within one year 4,267 2,514
After one year but not more than five years 4,413 3,768
8,680 6,282
189www.fresnilloplc.com Fresnillo plc | Annual report 2013
Fresnillo Today
Strategic Report
Corporate Governance
Financial Statements

Notes to the Consolidated Financial Statements continued
(b) Operating leases as lessee The Group has financial commitments in respect of non-cancellable operating leases for land, offices and equipment. These leases have renewal terms at the option of the lessee at lease payments based on market prices at the time of renewal. There are no restrictions placed upon the Group by entering into these leases.
The Group has put in place several arrangements to finance mine equipment through loans and the sale of mine equipment to contractors. In both cases, contractors are obligated to use these assets in rendering services to the Group as part of the mining work contract, during the term of financing or credit, which ranges from two to six years. The Group considers that the related mining work contracts contain embedded operating leases.
The future minimum rental commitments under these leases are as follows:
As at 31 December
2013
US$ thousands 2012
US$ thousands
Within one year 11,742 10,425
After one year but not more than five years 4,161 9,624
15,903 20,049
As at 31 December
2013
US$ thousands 2012
US$ thousands
Minimum lease payments expensed in the year 9,765 8,157
26. Contingencies As of 31 December 2013, the Group has the following contingencies:
– The Group is subject to various laws and regulations which, if not observed, could give rise to penalties.
– Tax periods remain open to review by the Mexican tax authorities in respect of income taxes for five years following the date of the filing of corporate income tax returns, during which time the authorities have the right to raise additional tax assessments including penalties and interest. Under certain circumstances the reviews may cover longer periods.
– In addition, because a number of tax periods remain open to review by the tax authorities, there is a risk that transactions, and in particular related party transactions, that have not been challenged in the past by the authorities, may be challenged by them in the future, and this may result in the raising of additional tax assessments plus penalties and interest. It is not practical to determine the amount of any such potential claims or the likelihood of any unfavourable outcome. However, management believes that its interpretation of the relevant legislation is appropriate and that the Group has complied with all regulations and paid or accrued all taxes and withholdings that are applicable.
– On 8 May 2008, the Company and Peñoles entered into the Separation Agreement (the ‘Separation Agreement’). This agreement relates to the separation of the Group and the Peñoles Group and governs certain aspects of the relationship between the Fresnillo Group and the Peñoles Group following the initial public offering in May 2008 (‘Admission’). The Separation Agreement provides for cross-indemnities between the Company and Peñoles so that, in the case of Peñoles, it is held harmless against losses, claims and liabilities (including tax liabilities) properly attributable to the precious metals business of the Group and, in the case of the Company, it is held harmless by Peñoles against losses, claims and liabilities which are not properly attributable to the precious metals business. Save for any liability arising in connection with tax, the aggregate liability of either party under the indemnities shall not exceed US$250 million in aggregate.
– Peñoles has agreed to indemnify the Fresnillo Group in relation to (i) any tax charge, subject to certain exceptions, the Company may incur as a result of the Pre-IPO Reorganisation (including as a result of a transaction following Admission of a member of the Fresnillo Group, provided that Peñoles has confirmed that the proposed transaction will not give rise to a tax charge, or as a result of a transaction of a member of the Peñoles Group on or after Admission), the Global Offer or Admission and (ii) certain tax aspects of certain other pre-Admission transactions. Peñoles’ liability under these indemnities and in respect of general tax liabilities arising pre-Admission which are not properly attributable to the precious metals business of the Fresnillo Group shall not exceed US$500 million. If a member of the Fresnillo Group forming part of Peñoles’ tax consolidation pays an intra-group dividend in excess of its net income tax account (‘Cuenta de Utilidad Fiscal Neta’ or ‘CUFIN’) account after Admission and is relieved of tax as a result of the consolidation, it is required to pay Peñoles an amount in respect of that tax.
190 Fresnillo plc | Annual report 2013 www.fresnilloplc.com

– On 30 November 2012, the Mexican government enacted a new federal labour law. Management is currently evaluating the new labour law for any potential impacts on the operations and financial position of the Group, however management does not expect any significant effect on the Group’s financial statements as at 31 December 2013 and going forward.
In 2009 five members of the El Bajio agrarian community in the state of Sonora, who claimed rights over certain surface land in the proximity of the operations of Minera Penmont (‘Penmont’), submitted a legal claim with the Unitarian Agrarian Court (Tribunal Unitario Agrario) of Hermosillo Sonora, to have Penmont vacate an area of this surface land. The land in dispute encompassed a portion of surface area where part of the operations of Soledad-Dipolos is located. Minera Penmont’s mining concessions are held by way of separate title to that relating to the surface land. The litigation resulted in a definitive court order pursuant to which the Magistrate of the Unitarian Agrarian Court of Hermosillo, Sonora, ordered Penmont to vacate 1,824 hectares of land in July 2013, resulting in the suspension of operations at Soledad-Dipolos.
To date the disputed land has been returned by Penmont, with remediation activities pending in approximately 300 hectares. The Magistrate has noted that remediation activities are necessary to comply with relevant regulatory requirements and requested the guidance of the Federal Environmental Agency (SEMARNAT) regarding the same.
The execution of the court ruling also resulted in the temporary suspension by the Mexican Ministry of Defense (Secretaría de la Defensa Nacional or MOD) of the single explosives permit which covered the Dipolos pit as well as its adjacent Soledad pit and Herradura. The Soledad pit and Herradura are outside of the area affected by the court ruling, which was confirmed by a court-appointed topographer. The Company filed a request to lift the explosives suspension at the Soledad pit and Herradura. In connection with the foregoing matter, the El Bajio agrarian community entered cease and desist proceedings before a Federal district court in Sonora, requesting relief against the potential lifting of the suspension on the use of explosives and originally obtained a temporary stay order, which was subsequently not upheld by the district court.
Following a hearing on 24 January, the district court denied the request by the Ejido El Bajío to prevent the lifting of the explosives permit covering Herradura and Soledad. The Company received no indication that the Ejido has filed an ultimate appeal regarding the foregoing and the time frame for filing such an appeal has expired.
On 24 February 2014 the MOD granted a new explosives permit for the Herradura mining unit, thereby allowing the use of explosives at this mine.
In connection with the foregoing matters, members of the El Bajío agrarian community have also presented additional claims, including a separate legal suit before the Unitarian Agrarian Court of Hermosillo, Sonora, claiming US$65 million for damages alleging that the Group improperly used the land affected by the court ruling, as well as cancellation of Penmont’s mining concessions and environmental permits within the El Bajío lands. Such concessions and permits are held by way of separate title to that relating to the surface land. The members have not yet presented substantial evidence to support their claim and the Group believes that these claims are without merit. Any initial ruling in this case would be subject to the appeals process in Mexico before judicial authorities other than the Unitarian Agrarian Court of Hermosillo, Sonora. Given the lack of evidence in support of the damages claim, the Company believes that an adverse and definitive ruling for the Group in respect of this law suit is not probable. Various claims and counterclaims have been made between the relevant parties. There is significant uncertainty relating to the finalisation and ultimate result relating to these legal proceedings.
27. Related party balances and transactions The Group had the following related party transactions during the years ended 31 December 2013 and 2012 and balances as at 31 December 2013 and 2012.
Related parties are those entities owned or controlled by the ultimate controlling party, as well as those who have a minority participation in Group companies and key management personnel of the Group.
(a) Related party balances Accounts receivable Accounts payable Loans
As at 31 December As at 31 December As at 31 December
2013
US$ thousands2012
US$ thousands2013
US$ thousands2012
US$ thousands 2013
US$ thousands2012
US$ thousands
Trade:
Met-Mex Peñoles, S.A. de C.V. 96,641 192,273 – – – –
Loans:
Newmont Mining Corporation1 – – – – 40,920 –
Other:
Industrias Peñoles, S.A.B. de C.V. 8,127 10,981 – – – –
Other 25 19 2,542 1,660 – –
Sub-total 104,793 203,273 2,542 1,660 40,920 –
Less-current portion 104,793 203,273 2,542 1,660 40,920 –
Non-current portion – – – – – –
1 Loan received from Newmont bears interest at a fixed rate of 2.58% and has a maturity of one year.
191www.fresnilloplc.com Fresnillo plc | Annual report 2013
Fresnillo Today
Strategic Report
Corporate Governance
Financial Statements

Notes to the Consolidated Financial Statements continued
Related party accounts receivable and payable will be settled in cash.
Other balances with related parties:
Year ended 31 December
2013
US$ thousands 2012
US$ thousands
Silverstream contract:
Industrias Peñoles, S.A.B. de C.V. 372,846 487,779
The Silverstream contract can be settled in either silver or cash. Details of the Silverstream contract are provided in note 14.
(b) Principal transactions with affiliates, including Industrias Peñoles S.A.B de C.V., the Company’s parent, are as follows:
Year ended 31 December
2013
US$ thousands 2012
US$ thousands
Income:
Sales:1
Met-Mex Peñoles, S.A. de C.V. 1,614,906 2,152,002
Insurance receipts:
Grupo Nacional Provincial, S.A.B. de C.V. 768 922
Other income 2,453 485
Total income 1,618,127 2,153,409
1 Figures do not include hedging losses.
Year ended 31 December
2013
US$ thousands 2012
US$ thousands
Expenses:
Administrative services:
Servicios Administrativos Peñoles, S.A. de C.V.2 (note 6) 40,705 31,255
Servicios de Exploración, S.A. de C.V. 4,884 4,077
45,589 35,332
Energy:
Termoelectrica Peñoles, S. de R.L. de C.V. 30,678 29,079
Operating materials and spare parts:
Wideco Inc 5,753 5,427
Met-Mex Peñoles, S.A. de C.V. 4,056 2,870
9,809 8,297
Equipment repair and administrative services:
Serviminas, S.A. de C.V. 4,096 3,189
Insurance premiums:
Grupo Nacional Provincial, S.A. B. de C.V. 9,484 9,230
Other expenses: 8.098 7,168
Total expenses 107,754 92,295
2 Includes US$7.4 million and US$7.0 million relating to engineering costs that was capitalised in 2013 and 2012, respectively.
192 Fresnillo plc | Annual report 2013 www.fresnilloplc.com

(c) Compensation of key management personnel of the Group Key management personnel include the members of the Board of Directors and the Executive Committee who receive remuneration.
Year ended 31 December
2013
US$ thousands2012
US$ thousands
Salaries and bonuses 2,965 3,695
Termination benefits – 10,821
Post-employment benefits 138 88
Other benefits 687 696
Total compensation paid in respect of key management personnel 3,790 15,300
Year ended 31 December
2013
US$ thousands2012
US$ thousands
Accumulated accrued defined pension entitlement 4,849 4,189
This compensation includes amounts paid to Directors disclosed in the Directors’ remuneration report.
The accumulated accrued defined pension entitlement represents benefits accrued at the time the benefits were frozen. There are no further benefits accruing under the defined benefit scheme in respect of current services.
28. Auditor’s remuneration Fees due by the Group to its auditor during the year ended 31 December 2013 and the year ended 31 December 2012 are as follows:
Year ended 31 December
Class of services 2013
US$ thousands2012
US$ thousands
Fees payable to the Group’s auditor for the audit of the Group’s annual accounts 1,176 1,201
Fees payable to the Group’s auditor and its associates for other services:
The audit of the Company’s subsidiaries pursuant to legislation 312 252
Audit-related assurance services 317 385
Tax compliance services 39 15
Tax advisory services 13 8
Other assurance services 330 –
Total 2,187 1,861
193www.fresnilloplc.com Fresnillo plc | Annual report 2013
Fresnillo Today
Strategic Report
Corporate Governance
Financial Statements

Notes to the Consolidated Financial Statements continued
29. Notes to the consolidated cash flow statement
Notes 2013
US$ thousands 2012 – Restated US$ thousands
Reconciliation of profit for the year to net cash generated from operating activities
Profit for the year 261,018 855,036
Adjustments to reconcile profit for the period to net cash inflows from operating activities:
Depreciation 5 239,347 243,766
Employee profit sharing 8 20,910 49,856
Deferred income tax 10 (12,931) (18,984)
Current income tax expense 10 170,623 341,555
Loss on the sale of property, plant and equipment and other assets 9 1,491 1,042
Other losses/(gains) 801 (3,026)
Impairment of available for sale financial assets 9 2,053 –
Net finance costs 8,389 (1,751)
Foreign exchange loss 5,557 11,213
Difference between pension contributions paid and amounts recognised in the income statement (1,607) 1,604
Non-cash movement on derivatives 558 (5,885)
Changes in fair value of Silverstream 14 53,976 (117,682)
Working capital adjustments
Decrease/(increase) in trade and other receivables 66,593 (8,531)
Increase in prepayments and other assets (4,933) (1,127)
Increase in inventories (13,527) (94,875)
(Increase) decrease in trade and other payables (13,649) 4,709
Cash generated from operations 784,669 1,256,920
Income tax paid (283,269) (449,080)
Employee profit sharing paid (55,371) (64,185)
Net cash from operating activities 446,029 743,655
194 Fresnillo plc | Annual report 2013 www.fresnilloplc.com
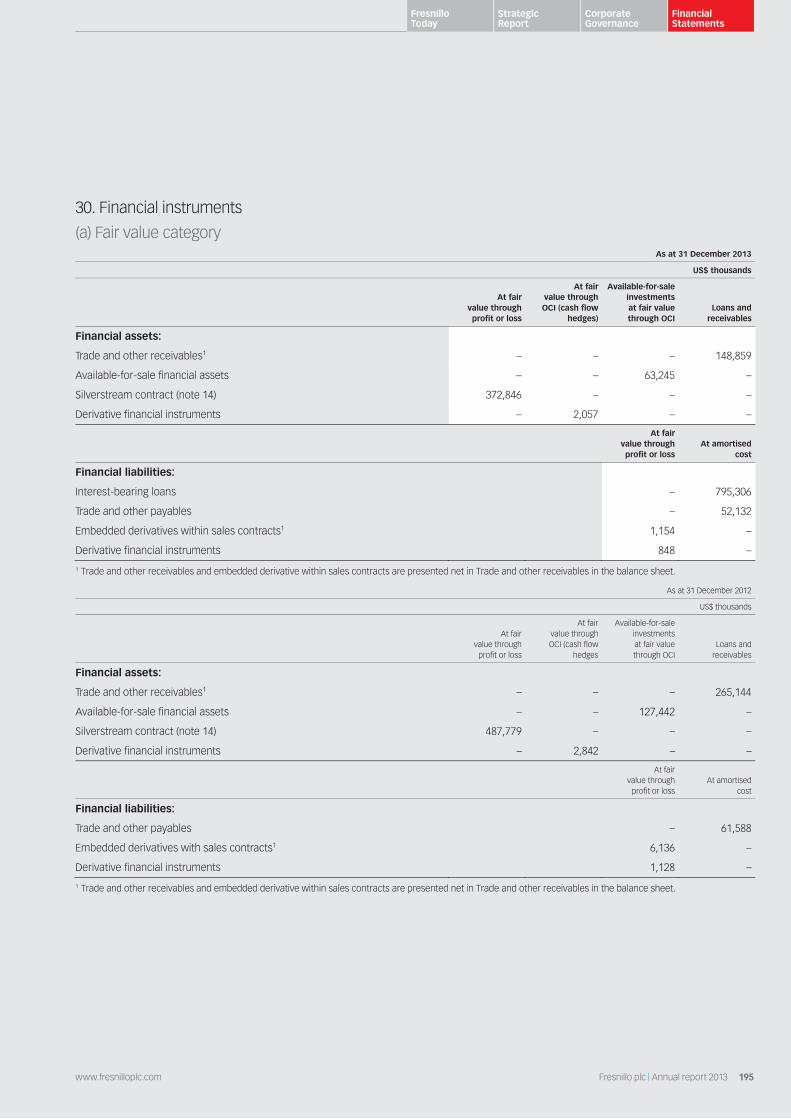
30. Financial instruments
(a) Fair value category As at 31 December 2013
US$ thousands
At fair value through profit or loss
At fair value through OCI (cash flow
hedges)
Available-for-sale investments at fair value through OCI
Loans and receivables
Financial assets:
Trade and other receivables1 – – – 148,859
Available-for-sale financial assets – – 63,245 –
Silverstream contract (note 14) 372,846 – – –
Derivative financial instruments – 2,057 – –
At fair value through profit or loss
At amortised cost
Financial liabilities:
Interest-bearing loans – 795,306
Trade and other payables – 52,132
Embedded derivatives within sales contracts1 1,154 –
Derivative financial instruments 848 –
1 Trade and other receivables and embedded derivative within sales contracts are presented net in Trade and other receivables in the balance sheet.
As at 31 December 2012
US$ thousands
At fair value through
profit or loss
At fair value through OCI (cash flow
hedges
Available-for-sale investments at fair value through OCI
Loans and receivables
Financial assets:
Trade and other receivables1 – – – 265,144
Available-for-sale financial assets – – 127,442 –
Silverstream contract (note 14) 487,779 – – –
Derivative financial instruments – 2,842 – –
At fair value through
profit or lossAt amortised
cost
Financial liabilities:
Trade and other payables – 61,588
Embedded derivatives with sales contracts1 6,136 –
Derivative financial instruments 1,128 –
1 Trade and other receivables and embedded derivative within sales contracts are presented net in Trade and other receivables in the balance sheet.
195www.fresnilloplc.com Fresnillo plc | Annual report 2013
Fresnillo Today
Strategic Report
Corporate Governance
Financial Statements

Notes to the Consolidated Financial Statements continued
(b) Fair value measurement The fair value of financial assets and liabilities, together with the carrying amounts shown in the balance sheet, other than those with carrying amounts that are a reasonable approximation of their fair values, are as follows:
As at 31 December
Carrying amount Fair value
2013 US$ thousands
2012 US$ thousands
2013 US$ thousands
2012 US$ thousands
Financial assets:
Available-for-sale financial assets 63,245 127,442 63,245 127,442
Silverstream contract (note 14) 372,846 487,779 372,846 487,779
Derivative financial instruments 2,057 2,842 2,057 2,842
Financial liabilities:
Interest-bearing loans (note 20) 795,306 – 780,9201 –
Loans from related party 40,920 – 40,9202 –
Embedded derivatives within sales contracts 1,154 6,136 1,154 6,136
Derivative financial instruments 848 1,128 848 1,128
1 Interest-bearing loans are categorised in Level 1 of the fair value hierarchy. 2 Loans from related party are categorised in Level 3 of the fair value hierarchy.
The financial assets and liabilities measured at fair value are categorised into the fair value hierarchy as at 31 December as follows:
As of 31 December 2013
Fair value measure using
Quoted prices in active markets
Level 1 US$ thousands
Significant observable
Level 2 US$ thousands
Significant unobservable
Level 3 US$ thousands
Total US$ thousands
Financial assets:
Derivative financial instruments:
Option and forward foreign exchange contracts – 2,057 – 2,057
Silverstream contract – – 372,846 372,846
– 2,057 372,846 374,903
Financial investments available-for-sale:
Quoted investments 63,245 – – 63,245
63,245 2,057 339,784 405,086
Financial liabilities:
Derivative financial instruments:
Embedded derivatives within sales contracts – – (1,154) (1,154)
Options and forward foreign exchange contracts – (848) – (848)
– (848) (1,154) 2,002
196 Fresnillo plc | Annual report 2013 www.fresnilloplc.com

As of 31 December 2012
Fair value measure using
Quoted prices in active markets
Level 1 US$ thousands
Significant observable
Level 2 US$ thousands
Significant unobservable
Level 3 US$ thousands
Total US$ thousands
Financial assets:
Derivative financial instruments:
Option and forward foreign exchange contracts – 2,842 – 2,842
Silverstream contract – – 487,779 487,779
– 2,842 487,779 490,621
Financial investments available-for-sale:
Quoted investments 127,442 – – 127,442
127,442 2,842 487,779 618,063
Financial liabilities:
Derivative financial instruments:
Embedded derivatives within sales contracts – – (6,136) (6,136)
Options and forward foreign exchange contracts – (1,128) – (1,128)
– (1,128) (6,136) (7,264)
There have been no significant transfers between Level 1 and Level 2 of the fair value hierarchy, and no transfers into and out of Level 3 fair value measurements.
A reconciliation of the beginning balance to the ending balance for Level 3 financial instruments other than Silverstream (which is disclosed in note 14) is shown below:
2013
US$ thousands2012
US$ thousands
Balance at 1 January: (6,136) (14,479)
Changes in fair value (16,882) 4,262
Realised embedded derivatives during the year 21,864 4,081
Balance at 31 December (1,154) (6,136)
The fair value of the financial assets and liabilities is included at the amount at which the instrument could be exchanged in a current transaction between willing parties, other than in a forced or liquidation sale.
The following valuation techniques were used to estimate the fair values:
Option and forward foreign exchange contracts: The Group enters into derivative financial instruments with various counterparties, principally financial institutions with investment grade credit ratings. The foreign currency forward (Level 2) contracts are measured based on observable spot exchange rates, the yield curves of the respective currencies as well as the currency basis spreads between the respective currencies. The foreign currency option contracts are valued using the Garmam-Kohlhagen formula, the significant inputs to which include observable spot exchange rates, interest rates and the volatility of the currency.
Silverstream contract: The fair value of the Silverstream contract is determined using a valuation model (for further information relating to the Silverstream contract see note 14). This derivative has a term of over 20 years and the valuation model utilises a number of inputs that are not based on observable market data due to the nature of these inputs and/or the duration of the contract. Inputs that have a significant effect on the recorded fair value are the volume of silver that will be produced and sold from the Sabinas mine over the contract life, the future price of silver, future foreign exchange rates between the Mexican peso and US dollar, future inflation and the discount rate used to discount future cash flows.
The estimate of the volume of silver that will be produced and sold from the Sabinas mine requires estimates of the recoverable silver reserves and resources, the related production profile based on the Sabinas mine plan and the expected recovery of silver from ore mined. The estimation of these inputs is subject to a range of operating assumptions and may change over time. Estimates of reserves and resources are updated annually by Peñoles, the operator and sole interest holder in the Sabinas mine and provided to the Company. The production profile and estimated payable silver that will be recovered from ore mined is based on the latest plan and estimates, also provided to the Company by Peñoles. The inputs assume no interruption in production over the life of the Silverstream contract and production levels which are consistent with those achieved in recent years.
197www.fresnilloplc.com Fresnillo plc | Annual report 2013
Fresnillo Today
Strategic Report
Corporate Governance
Financial Statements
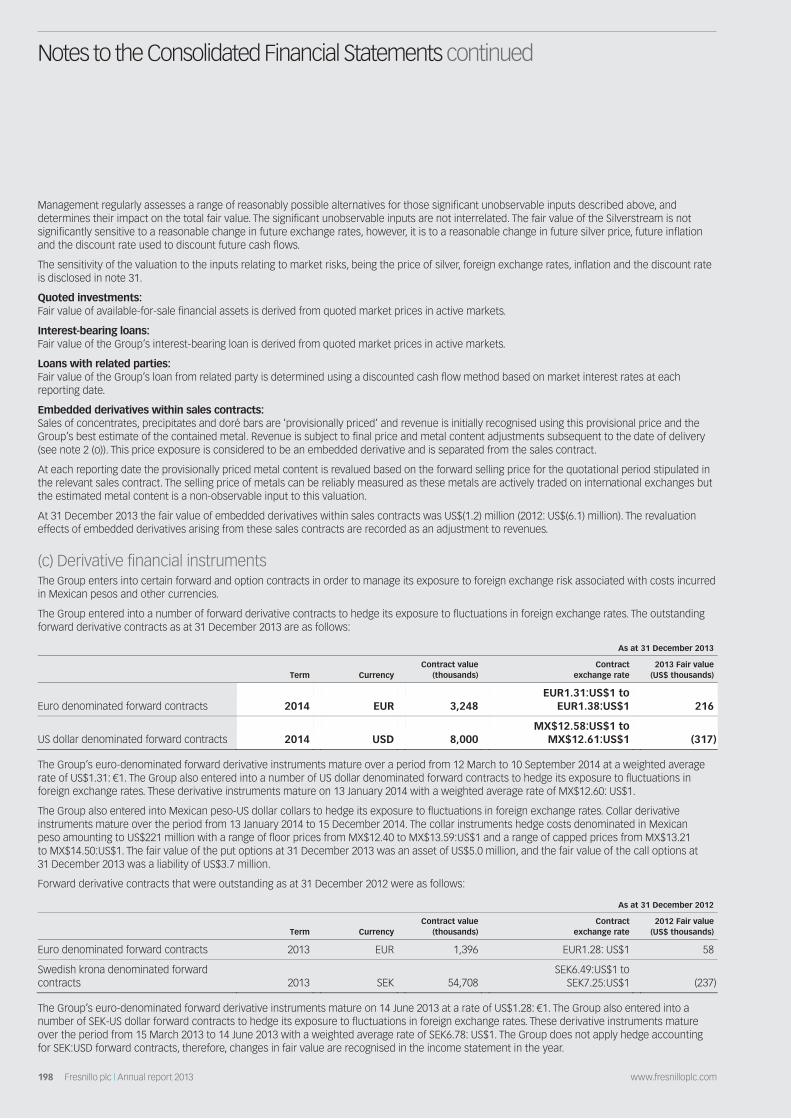
Notes to the Consolidated Financial Statements continued
Management regularly assesses a range of reasonably possible alternatives for those significant unobservable inputs described above, and determines their impact on the total fair value. The significant unobservable inputs are not interrelated. The fair value of the Silverstream is not significantly sensitive to a reasonable change in future exchange rates, however, it is to a reasonable change in future silver price, future inflation and the discount rate used to discount future cash flows.
The sensitivity of the valuation to the inputs relating to market risks, being the price of silver, foreign exchange rates, inflation and the discount rate is disclosed in note 31.
Quoted investments: Fair value of available-for-sale financial assets is derived from quoted market prices in active markets.
Interest-bearing loans: Fair value of the Group’s interest-bearing loan is derived from quoted market prices in active markets.
Loans with related parties: Fair value of the Group’s loan from related party is determined using a discounted cash flow method based on market interest rates at each reporting date.
Embedded derivatives within sales contracts: Sales of concentrates, precipitates and doré bars are ‘provisionally priced’ and revenue is initially recognised using this provisional price and the Group’s best estimate of the contained metal. Revenue is subject to final price and metal content adjustments subsequent to the date of delivery (see note 2 (o)). This price exposure is considered to be an embedded derivative and is separated from the sales contract.
At each reporting date the provisionally priced metal content is revalued based on the forward selling price for the quotational period stipulated in the relevant sales contract. The selling price of metals can be reliably measured as these metals are actively traded on international exchanges but the estimated metal content is a non-observable input to this valuation.
At 31 December 2013 the fair value of embedded derivatives within sales contracts was US$(1.2) million (2012: US$(6.1) million). The revaluation effects of embedded derivatives arising from these sales contracts are recorded as an adjustment to revenues.
(c) Derivative financial instruments The Group enters into certain forward and option contracts in order to manage its exposure to foreign exchange risk associated with costs incurred in Mexican pesos and other currencies.
The Group entered into a number of forward derivative contracts to hedge its exposure to fluctuations in foreign exchange rates. The outstanding forward derivative contracts as at 31 December 2013 are as follows:
As at 31 December 2013
Term CurrencyContract value
(thousands)Contract
exchange rate 2013 Fair value
(US$ thousands)
Euro denominated forward contracts 2014 EUR 3,248EUR1.31:US$1 to
EUR1.38:US$1 216
US dollar denominated forward contracts 2014 USD 8,000MX$12.58:US$1 to
MX$12.61:US$1 (317)
The Group’s euro-denominated forward derivative instruments mature over a period from 12 March to 10 September 2014 at a weighted average rate of US$1.31: €1. The Group also entered into a number of US dollar denominated forward contracts to hedge its exposure to fluctuations in foreign exchange rates. These derivative instruments mature on 13 January 2014 with a weighted average rate of MX$12.60: US$1.
The Group also entered into Mexican peso-US dollar collars to hedge its exposure to fluctuations in foreign exchange rates. Collar derivative instruments mature over the period from 13 January 2014 to 15 December 2014. The collar instruments hedge costs denominated in Mexican peso amounting to US$221 million with a range of floor prices from MX$12.40 to MX$13.59:US$1 and a range of capped prices from MX$13.21 to MX$14.50:US$1. The fair value of the put options at 31 December 2013 was an asset of US$5.0 million, and the fair value of the call options at 31 December 2013 was a liability of US$3.7 million.
Forward derivative contracts that were outstanding as at 31 December 2012 were as follows:
As at 31 December 2012
Term CurrencyContract value
(thousands)Contract
exchange rate 2012 Fair value
(US$ thousands)
Euro denominated forward contracts 2013 EUR 1,396 EUR1.28: US$1 58
Swedish krona denominated forward contracts 2013 SEK 54,708
SEK6.49:US$1 to SEK7.25:US$1 (237)
The Group’s euro-denominated forward derivative instruments mature on 14 June 2013 at a rate of US$1.28: €1. The Group also entered into a number of SEK-US dollar forward contracts to hedge its exposure to fluctuations in foreign exchange rates. These derivative instruments mature over the period from 15 March 2013 to 14 June 2013 with a weighted average rate of SEK6.78: US$1. The Group does not apply hedge accounting for SEK:USD forward contracts, therefore, changes in fair value are recognised in the income statement in the year.
198 Fresnillo plc | Annual report 2013 www.fresnilloplc.com
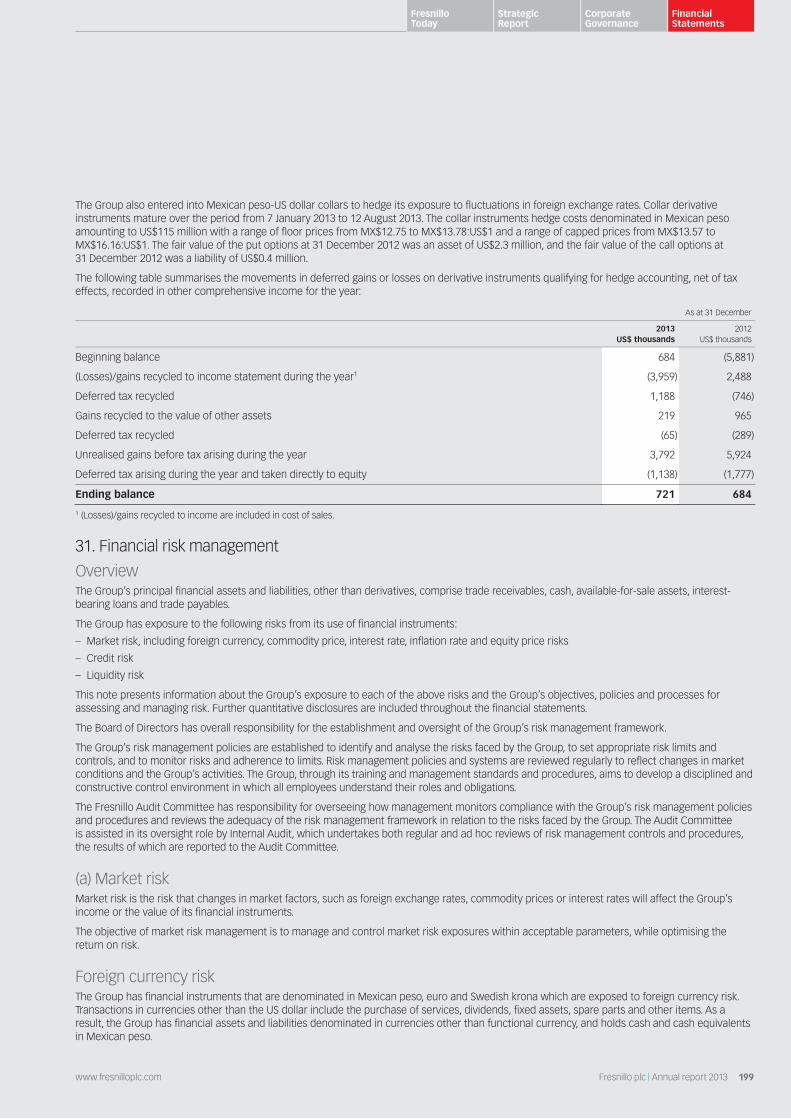
The Group also entered into Mexican peso-US dollar collars to hedge its exposure to fluctuations in foreign exchange rates. Collar derivative instruments mature over the period from 7 January 2013 to 12 August 2013. The collar instruments hedge costs denominated in Mexican peso amounting to US$115 million with a range of floor prices from MX$12.75 to MX$13.78:US$1 and a range of capped prices from MX$13.57 to MX$16.16:US$1. The fair value of the put options at 31 December 2012 was an asset of US$2.3 million, and the fair value of the call options at 31 December 2012 was a liability of US$0.4 million.
The following table summarises the movements in deferred gains or losses on derivative instruments qualifying for hedge accounting, net of tax effects, recorded in other comprehensive income for the year:
As at 31 December
2013
US$ thousands2012
US$ thousands
Beginning balance 684 (5,881)
(Losses)/gains recycled to income statement during the year1 (3,959) 2,488
Deferred tax recycled 1,188 (746)
Gains recycled to the value of other assets 219 965
Deferred tax recycled (65) (289)
Unrealised gains before tax arising during the year 3,792 5,924
Deferred tax arising during the year and taken directly to equity (1,138) (1,777)
Ending balance 721 684
1 (Losses)/gains recycled to income are included in cost of sales.
31. Financial risk management
Overview The Group’s principal financial assets and liabilities, other than derivatives, comprise trade receivables, cash, available-for-sale assets, interest-bearing loans and trade payables.
The Group has exposure to the following risks from its use of financial instruments:
– Market risk, including foreign currency, commodity price, interest rate, inflation rate and equity price risks
– Credit risk
– Liquidity risk
This note presents information about the Group’s exposure to each of the above risks and the Group’s objectives, policies and processes for assessing and managing risk. Further quantitative disclosures are included throughout the financial statements.
The Board of Directors has overall responsibility for the establishment and oversight of the Group’s risk management framework.
The Group’s risk management policies are established to identify and analyse the risks faced by the Group, to set appropriate risk limits and controls, and to monitor risks and adherence to limits. Risk management policies and systems are reviewed regularly to reflect changes in market conditions and the Group’s activities. The Group, through its training and management standards and procedures, aims to develop a disciplined and constructive control environment in which all employees understand their roles and obligations.
The Fresnillo Audit Committee has responsibility for overseeing how management monitors compliance with the Group’s risk management policies and procedures and reviews the adequacy of the risk management framework in relation to the risks faced by the Group. The Audit Committee is assisted in its oversight role by Internal Audit, which undertakes both regular and ad hoc reviews of risk management controls and procedures, the results of which are reported to the Audit Committee.
(a) Market risk Market risk is the risk that changes in market factors, such as foreign exchange rates, commodity prices or interest rates will affect the Group’s income or the value of its financial instruments.
The objective of market risk management is to manage and control market risk exposures within acceptable parameters, while optimising the return on risk.
Foreign currency risk The Group has financial instruments that are denominated in Mexican peso, euro and Swedish krona which are exposed to foreign currency risk. Transactions in currencies other than the US dollar include the purchase of services, dividends, fixed assets, spare parts and other items. As a result, the Group has financial assets and liabilities denominated in currencies other than functional currency, and holds cash and cash equivalents in Mexican peso.
199www.fresnilloplc.com Fresnillo plc | Annual report 2013
Fresnillo Today
Strategic Report
Corporate Governance
Financial Statements

Notes to the Consolidated Financial Statements continued
In order to manage the Group’s exposure to foreign currency risk on expenditure denominated in currencies other than the US dollar, the Group has entered into certain forward and option derivative contracts with maturity dates from 2013 (see note 30 for additional details).
The following table demonstrates the sensitivity of financial assets and financial liabilities (excluding Silverstream) to a reasonably possible change in the US dollar exchange rate compared to the Mexican peso, reflecting the impact on the Group’s profit before tax and equity, with all other variables held constant. It is assumed that the same percentage change in exchange rates is applied to all applicable periods for the purposes of calculating the sensitivity with relation to derivative financial instruments.
Year ended 31 December
Strengthening/ (weakening) of US dollar
Effect on profit before tax:
increase/ (decrease)
US$ thousands
Effect on equity: increase/(decrease)
US$ thousands
2013 5% (8,416) (280)
(10%) (1,445) 22,505
2012 10% (6,226) 366
(5%) (891) 5,785
The following table demonstrates the sensitivity of financial assets and financial liabilities to a reasonably possible change in the US dollar exchange rate compared to the Swedish krona on the Group’s profit before tax and equity, with all other variables held constant. It is assumed that the same percentage change in exchange rates is applied to all applicable periods. There is no impact on the Group’s equity, other than the equivalent change in retained earnings.
Year ended 31 December
Strengthening/ (weakening) of
US dollar
Effect on profit before tax:
increase/(decrease)
US$ thousands
2013 5% –
(5%) –
2012 10% (665)
(10%) 433
The following table demonstrates the sensitivity of financial assets and financial liabilities to a reasonably possible change in the US dollar exchange rate compared to the euro on the Group’s profit before tax and equity, with all other variables held constant. It is assumed that the same percentage change in exchange rates is applied to all applicable periods.
Year ended 31 December
Strengthening/ (weakening) of
US dollar
Effect on profit before tax:
increase/ (decrease)
US$ thousands
Effect on equity: increase/
(decrease) US$ thousands
2013 5% 224 –
(5%) (224) –
2012 10% 184 –
(10%) (92) –
Foreign currency risk – Silverstream Future foreign exchange rates are one of the inputs to the Silverstream valuation model. The following table demonstrates the sensitivity of the Silverstream contract valuation to a reasonably possible change in the Mexican peso as compared to the US dollar, with all other inputs to the Silverstream valuation model held constant. It is assumed that the same percentage change in exchange rates is applied to all applicable periods in the valuation model. There is no impact on the Group’s equity, other than the equivalent change in retained earnings.
Year ended 31 December
Strengthening/ (weakening) of
US dollar
Effect on profit before tax:
increase/(decrease)
US$ thousands
2013 15% (4,644)
(15%) 6,284
2012 15% (5,073)
(15%) 6,864
200 Fresnillo plc | Annual report 2013 www.fresnilloplc.com
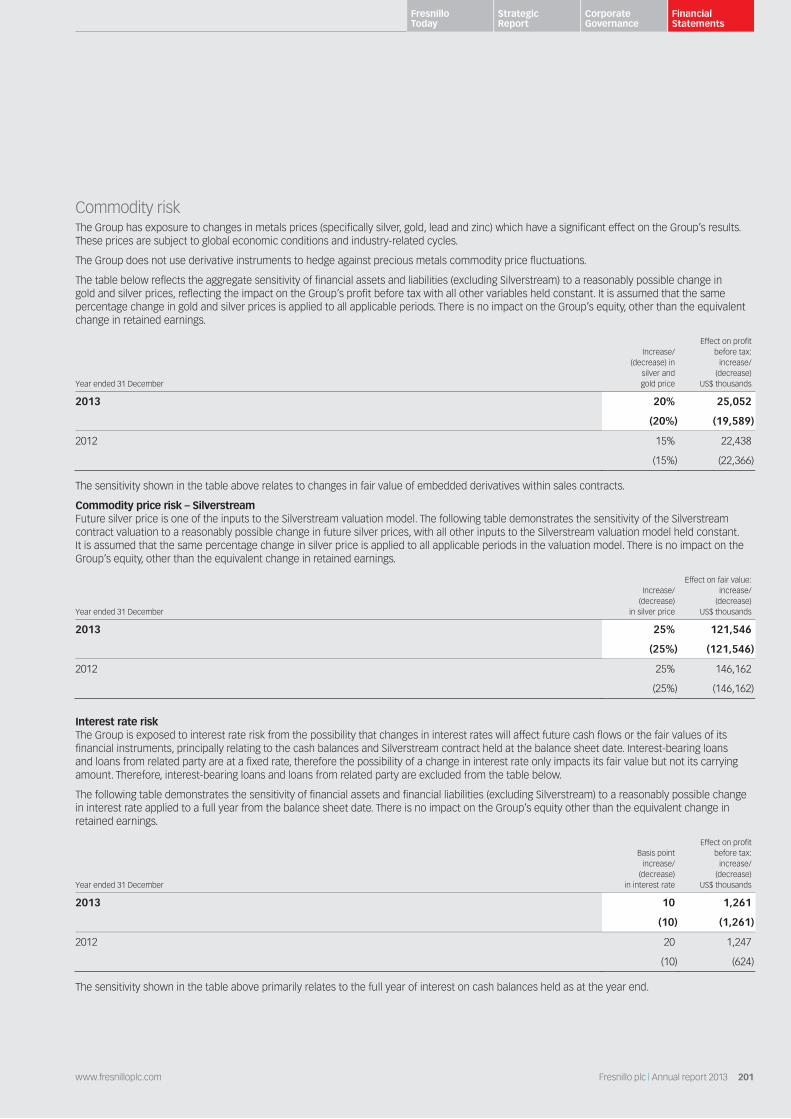
Commodity risk The Group has exposure to changes in metals prices (specifically silver, gold, lead and zinc) which have a significant effect on the Group’s results. These prices are subject to global economic conditions and industry-related cycles.
The Group does not use derivative instruments to hedge against precious metals commodity price fluctuations.
The table below reflects the aggregate sensitivity of financial assets and liabilities (excluding Silverstream) to a reasonably possible change in gold and silver prices, reflecting the impact on the Group’s profit before tax with all other variables held constant. It is assumed that the same percentage change in gold and silver prices is applied to all applicable periods. There is no impact on the Group’s equity, other than the equivalent change in retained earnings.
Year ended 31 December
Increase/(decrease) in
silver and gold price
Effect on profit before tax:
increase/(decrease)
US$ thousands
2013 20% 25,052
(20%) (19,589)
2012 15% 22,438
(15%) (22,366)
The sensitivity shown in the table above relates to changes in fair value of embedded derivatives within sales contracts.
Commodity price risk – Silverstream Future silver price is one of the inputs to the Silverstream valuation model. The following table demonstrates the sensitivity of the Silverstream contract valuation to a reasonably possible change in future silver prices, with all other inputs to the Silverstream valuation model held constant. It is assumed that the same percentage change in silver price is applied to all applicable periods in the valuation model. There is no impact on the Group’s equity, other than the equivalent change in retained earnings.
Year ended 31 December
Increase/(decrease)
in silver price
Effect on fair value: increase/
(decrease) US$ thousands
2013 25% 121,546
(25%) (121,546)
2012 25% 146,162
(25%) (146,162)
Interest rate risk The Group is exposed to interest rate risk from the possibility that changes in interest rates will affect future cash flows or the fair values of its financial instruments, principally relating to the cash balances and Silverstream contract held at the balance sheet date. Interest-bearing loans and loans from related party are at a fixed rate, therefore the possibility of a change in interest rate only impacts its fair value but not its carrying amount. Therefore, interest-bearing loans and loans from related party are excluded from the table below.
The following table demonstrates the sensitivity of financial assets and financial liabilities (excluding Silverstream) to a reasonably possible change in interest rate applied to a full year from the balance sheet date. There is no impact on the Group’s equity other than the equivalent change in retained earnings.
Year ended 31 December
Basis point increase/
(decrease) in interest rate
Effect on profit before tax:
increase/(decrease)
US$ thousands
2013 10 1,261
(10) (1,261)
2012 20 1,247
(10) (624)
The sensitivity shown in the table above primarily relates to the full year of interest on cash balances held as at the year end.
201www.fresnilloplc.com Fresnillo plc | Annual report 2013
Fresnillo Today
Strategic Report
Corporate Governance
Financial Statements

Notes to the Consolidated Financial Statements continued
Interest rate risk – Silverstream Future interest rates are one of the inputs to the Silverstream valuation model. The following table demonstrates the sensitivity of the Silverstream contract valuation to a reasonably possible change in interest rates, with all other inputs to the Silverstream valuation model held constant. It is assumed that the same change in interest rate is applied to all applicable periods in the valuation model. There is no impact on the Group’s equity, other than the equivalent change in retained earnings.
Year ended 31 December
Basis point increase/
(decrease) in interest rate
Effect on fair value: increase/
(decrease) US$ thousands
2013 100 (24,144)
(100) 27,140
2012 100 (23,881)
(100) 26,340
Inflation rate risk Inflation rate risk – Silverstream Future inflation rates are one of the inputs to the Silverstream valuation model. The following table demonstrates the sensitivity of the Silverstream contract to a reasonably possible change in the inflation rate, with all other inputs to the Silverstream valuation model held constant. It is assumed that the same change in inflation is applied to all applicable periods in the valuation model. There is no impact on the Group’s equity, other than the equivalent change in retained earnings.
Year ended 31 December
Basis point increase/
(decrease) in inflation rate
Effect on fair value: increase/
(decrease) US$ thousands
2013 100 1,069
(100) (1,037)
2012 100 1,336
(100) (1,305)
Equity price risk The Group has exposure to changes in the price of equity instruments that it holds as available-for-sale assets.
The following table demonstrates the sensitivity of available-for-sale assets to a reasonably possible change in market price of these equity instruments, reflecting the effect on the Group’s profit before tax and equity:
Year ended 31 December
Increase/ (decrease)
in equity price
Effect on profit before tax:
increase/ (decrease)
(US$ thousands)
Effect on equity: increase/
(decrease) US$ thousands
2013 70% – 45,368
(40%) (1,790) (68,945)
2012 30% – 38,233
(30%) – (38,233)
(b) Credit risk Exposure to credit risk arises as a result of transactions in the Group’s ordinary course of business and is applicable to all financial assets and derivative financial instruments. The financial assets are trade and other receivables, cash and cash equivalents, the Silverstream contract and available-for-sale financial assets.
The Group’s policies are aimed at minimising losses as a result of counterparties’ failure to honour their obligations. Individual exposures are monitored with customers subject to credit limits to ensure that the Group’s exposure to bad debts is not significant. The Group’s exposure to credit risk is influenced mainly by the individual characteristics of each counterparty. The Group’s financial assets are with counterparties with what the Group considers to have an appropriate credit rating. As disclosed in note 27, the counterparties to a significant proportion of these financial assets are related parties. At each balance sheet date, the Group’s financial assets were neither impaired nor past due, other than ‘Other receivables’ as disclosed in note 16. The Group’s policies are aimed at minimising losses from foreign currency hedging contracts. The Company’s foreign currency hedging contracts are entered into with large financial institutions with strong credit ratings.
202 Fresnillo plc | Annual report 2013 www.fresnilloplc.com

The Group has a high concentration of trade receivables with one counterparty Met-Mex Peñoles, the Group’s primary customer throughout 2013 and 2012. A further concentration of credit risk arises from the Silverstream contract. Both Met-Mex and the counterparty to the Silverstream contract are subsidiaries in the Peñoles group which currently owns 75% of the shares of the Company and is considered by management to be of appropriate credit rating.
The Group’s surplus funds are managed by Servicios Administrativos Fresnillo, S.A. de C.V., which manages cash and cash equivalents investing in a number of financial institutions. Accordingly on an ongoing basis the Group deposits cash and cash equivalents on a short-term basis with a range of financial institutions, depending on market conditions. In order to minimise exposure to credit risk, the Group only deposits cash and cash equivalents with financial institutions with a credit rating of P-1 (Moody´s) and mxA-1+ (Standard and Poor’s) and above, and only for periods of less than 30 days. As at 31 December 2013 the Group had concentrations of credit risk as 53% of cash and cash equivalents was deposited with one financial institution and 46% was held in short-term Mexican government paper.
The maximum credit exposure at the reporting date of each category of financial asset above is the carrying value as detailed in the relevant notes. See note 13 for the maximum credit exposure to available-for-sale financial assets, note 17 for cash and cash equivalents and note 27 for related party balances with Met-Mex. The maximum credit exposure with relation to the Silverstream contract is the value of the derivative as at 31 December 2013, being US$339.8 million (2012:US$487.8 million).
(c) Liquidity risk Liquidity risk is the risk that the Group will not be able to meet its financial obligations as they fall due.
The Group monitors its risk of a shortage of funds using projected cash flows from operations and by monitoring the maturity of both its financial assets and liabilities.
The table below summarises the maturity profile of the Group’s financial liabilities based on contractual undiscounted payments.
US$ thousands
Within 1 year 2–3 years 3-5 years > 5 years Total
As at 31 December 2013
Interest-bearing loans (note 20) 46,270 92,530 92,530 1,031,340 1,262,670
Loan from related party 41,977 – – – 41,977
Trade and other payables 52,132 – – – 52,132
Derivative financial instruments – liabilities 22,290 – – – 22,290
Embedded derivatives within sales contracts – liability 1,154 – – – 1,154
US$ thousands
Within 1 year 2–3 years 3-5 years > 5 years Total
As at 31 December 2012
Trade and other payables 61,588 – – – 61,588
Derivative financial instruments – liabilities 142,445 – – – 142,445
Embedded derivatives within sales contracts – liability 6,136 – – – 6,136
The payments disclosed for financial derivative instruments in the above table are the gross undiscounted cash flows. However those amounts may be settled gross or net. The following table shows the corresponding estimated inflows based on the contractual terms:
US$ thousands
Within 1 year 2–3 years 3-5 years > 5 years Total
As at 31 December 2013
Inflows 21,995 – – – 21,995
Outflows (22,290) – – – (22,290)
Net (295) – – – (295)
203www.fresnilloplc.com Fresnillo plc | Annual report 2013
Fresnillo Today
Strategic Report
Corporate Governance
Financial Statements

Notes to the Consolidated Financial Statements continued
US$ thousands
Within 1 year 2–3 years 3-5 years > 5 years Total
As at 31 December 2012
Inflows 154,375 – – – 154,375
Outflows (142,445) – – – (142,445)
Net 11,930 – – – 11,930
The above liquidity tables include expected inflows and outflows from currency option contracts which the Group expects to be exercised during 2014 as at 31 December 2013 and in 2013 as at 31 December 2012, either by the Group or counterparty.
Management considers that the Group has adequate current assets and forecast cash from operations to manage liquidity risks arising from current liabilities and non-current liabilities.
Capital management The primary objective of the Group’s capital management is to ensure that it maintains a strong credit rating and healthy capital ratios that support its business and maximise shareholder value. Management considers capital to consist of equity and certain interest-bearing loans, including loans from related parties, as disclosed in the balance sheet, excluding net unrealised gains or losses on revaluation of cash flow hedges and available-for-sale financial assets. In order to ensure an appropriate return for shareholders’ capital invested in the Group management thoroughly evaluates all material projects and potential acquisitions and approves them at its Executive Committee before submission to the Board for ultimate approval, where applicable. The Group’s dividend policy is based on the profitability of the business and underlying growth in earnings of the Group, as well as its capital requirements and cash flows, including cash flows from the Silverstream.
32. Effect of changes in accounting policies
a) Amendments to IAS 19R In the case of the Group, the transition to IAS 19R had an impact on the recognition of the actuarial gains and losses that are now recognised in OCI and permanently excluded from profit and loss. Such a change did not have an impact on the pension liability balance. Upon adoption of this amendment the Group reclassified actuarial gains and losses from cost of sales to OCI and net interest cost related to the pension liability of from cost of sales to finance cost, for the year ended 31 December 2012. The amendment did not have an impact on retained earnings. See details in table below.
b) IFRIC 20 ‘Stripping cost in the production phase of a surface mine’ The IFRS Interpretations Committee issued IFRIC 20 Stripping Costs in the Production Phase of a Surface Mine (IFRIC 20), effective 1 January 2013. Prior to the issuance of IFRIC 20, the accounting for production stripping costs had been based on general IFRS principles and the Framework, as IFRS had no specific guidance.
Previously, the Group deferred production stripping costs for those operations where this was considered to be the most appropriate basis for matching the cost against the related economic benefits and the effect was material. This was generally the case where there were fluctuations in stripping ratios over the life of the mine. The amount of stripping costs deferred was based on the life of mine average strip ratio that was obtained by dividing the total tonnage of waste expected to be mined over the life of the mine by the quantity (e.g., tonnes) of economically recoverable reserves expected to be mined across the life of the mine expected to be contained in the economically recoverable reserves. Production stripping costs incurred in the period were deferred to the extent that the current period actual strip ratio exceeded the life of the mine average strip ratio. The amount capitalised was subsequently depreciated over the expected useful life of the identified component of the ore body related to the stripping activity, by using the units of production method. The life of mine ratio was based on economically recoverable reserves of the mine.
IFRIC 20 now provides specific guidance on how to account for production stripping costs. It requires such costs to be capitalised where the recognition criteria set out in IFRIC 20 are met. IFRIC 20 differs from the life of mine average strip ratio approach in a number of ways – these include:
– The level at which production stripping costs are to be assessed i.e., at a component level rather than a life of mine level; and
– The way in which any stripping activity assets are to be depreciated.
In addition, specific transitional rules are provided to deal with any opening deferred stripping balances an entity may have recognised under its previous accounting policy.
Identification of stripping activity assets The first difference in the new guidance is the requirement to identify the components of each ore body. This will determine whether any stripping activity assets should be recognised and if so, the level at which such assets is initially recognised. IFRIC 20 defines a component as a specific volume of the ore body that is made more accessible by the stripping activity. An identified component of the ore body is considered to typically be a subset (‘phases of production’) of the total ore body of the mine. This suggests a lower unit of account than the entire life of mine, which is used in the current life of mine average strip ratio approach. It is considered that a mine may have several components, which are to be identified based on the mine plan. As well as providing a basis for measuring the costs reliably at recognition stage, the identification of components is necessary for the subsequent depreciation or amortisation of the stripping activity asset(s), which will take place as each identified component is mined.
204 Fresnillo plc | Annual report 2013 www.fresnilloplc.com

Depreciation of the stripping activity asset(s) The second difference in the new guidance relates to the way in which the stripping activity asset(s) are depreciated. Under the life of mine average strip ratio approach, the deferred stripping balance was released to profit or loss (or effectively depreciated) when the actual ratio fell below the average expected ratio. Under IFRIC 20, any stripping activity asset(s) will be depreciated or amortised over the expected useful life of the identified component of the ore body that is made more accessible by the activity, on a basis that best reflects the consumption of economic benefits. IFRIC 20 requires the units of production method to be applied unless another method is more appropriate. Refer to note 2 (e) for further information on the depreciation method applied by the Group.
In accordance with the transitional provisions of IFRIC 20, this new policy has been applied prospectively from the start of the comparative period, being 1 January 2012.
As a result of the adoption of the IAS 19R and IFRIC 20, the adjustments outlined below were made to the financial statements.
Adjustments to the consolidated income statement: For the year ended 31 December 2012
Previously presented
Adjustments for changes in accounting policies Restated
IAS 19 IFRIC 20
US$ thousands
Cost of production 878,897 111 (17,399) 861,609
Loss on foreign currency hedges 2,111 – – 2,111
Change in work in progress and finished goods (ore inventories) (74,308) – 3,393 (70,915)
Cost of sales 806,700 111 (14,006) 792,805
Profit from continuing operations before net finance cost and income tax 1,046,796 (111) 14,006 1,060,691
Finance cost (3,922) (715) – (4,637)
Profit from continuing operations before income tax 1,164,427 (826) 14,006 1,177,607
Income tax expense (318,982) 248 (3,837) (322,571)
Increase in profit for the period from continuing operations (578) 10,169
Attributable to:
Equity shareholders of the Company 736,089 (562) 5,695 741,222
Non-controlling interest 109,356 (17) 4,474 113,813
Adjustments to earnings per share: For the year ended 31 December 2012
Previously presented
Adjustments for changes in accounting policies Restated
IAS 19 IFRIC 20
US$ thousands
Earnings:
Profit from continuing operations attributable to equity holders of the Company 736,089 (562) 5,695 741,222
Adjusted profit from continuing operations attributable to equity holders of the Company 652,065 (562) 5,695 657,198
Earnings per share:
Basic and diluted earnings per ordinary share from continuing operations (US$) 1.026 (0.001) 0.008 1.034
Adjusted basic and diluted earnings per ordinary share from continuing operations (US$) 0.909 (0.001) 0.008 0.916
205www.fresnilloplc.com Fresnillo plc | Annual report 2013
Fresnillo Today
Strategic Report
Corporate Governance
Financial Statements
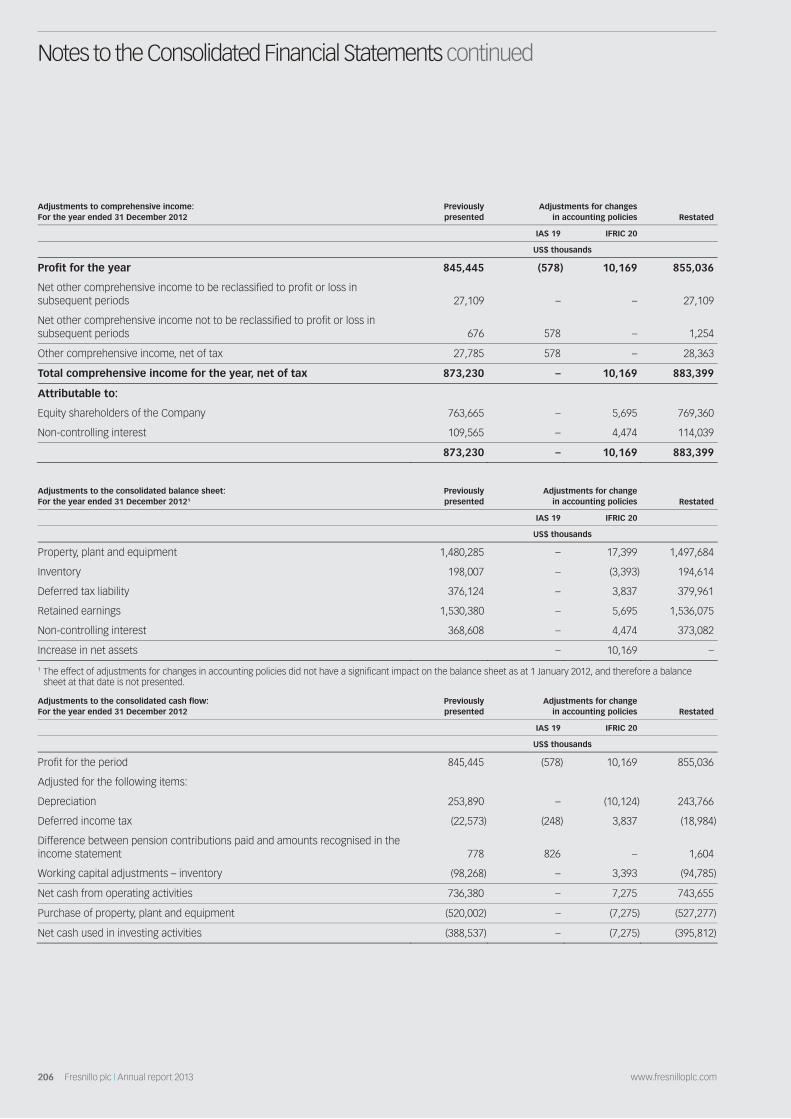
Notes to the Consolidated Financial Statements continued
Adjustments to comprehensive income: For the year ended 31 December 2012
Previously presented
Adjustments for changes in accounting policies Restated
IAS 19 IFRIC 20
US$ thousands
Profit for the year 845,445 (578) 10,169 855,036
Net other comprehensive income to be reclassified to profit or loss in subsequent periods 27,109 – – 27,109
Net other comprehensive income not to be reclassified to profit or loss in subsequent periods 676 578 – 1,254
Other comprehensive income, net of tax 27,785 578 – 28,363
Total comprehensive income for the year, net of tax 873,230 – 10,169 883,399
Attributable to:
Equity shareholders of the Company 763,665 – 5,695 769,360
Non-controlling interest 109,565 – 4,474 114,039
873,230 – 10,169 883,399
Adjustments to the consolidated balance sheet: For the year ended 31 December 20121
Previously presented
Adjustments for change in accounting policies Restated
IAS 19 IFRIC 20
US$ thousands
Property, plant and equipment 1,480,285 – 17,399 1,497,684
Inventory 198,007 – (3,393) 194,614
Deferred tax liability 376,124 – 3,837 379,961
Retained earnings 1,530,380 – 5,695 1,536,075
Non-controlling interest 368,608 – 4,474 373,082
Increase in net assets – 10,169 –
1 The effect of adjustments for changes in accounting policies did not have a significant impact on the balance sheet as at 1 January 2012, and therefore a balance sheet at that date is not presented.
Adjustments to the consolidated cash flow: For the year ended 31 December 2012
Previously presented
Adjustments for change in accounting policies Restated
IAS 19 IFRIC 20
US$ thousands
Profit for the period 845,445 (578) 10,169 855,036
Adjusted for the following items:
Depreciation 253,890 – (10,124) 243,766
Deferred income tax (22,573) (248) 3,837 (18,984)
Difference between pension contributions paid and amounts recognised in the income statement 778 826 – 1,604
Working capital adjustments – inventory (98,268) – 3,393 (94,785)
Net cash from operating activities 736,380 – 7,275 743,655
Purchase of property, plant and equipment (520,002) – (7,275) (527,277)
Net cash used in investing activities (388,537) – (7,275) (395,812)
206 Fresnillo plc | Annual report 2013 www.fresnilloplc.com
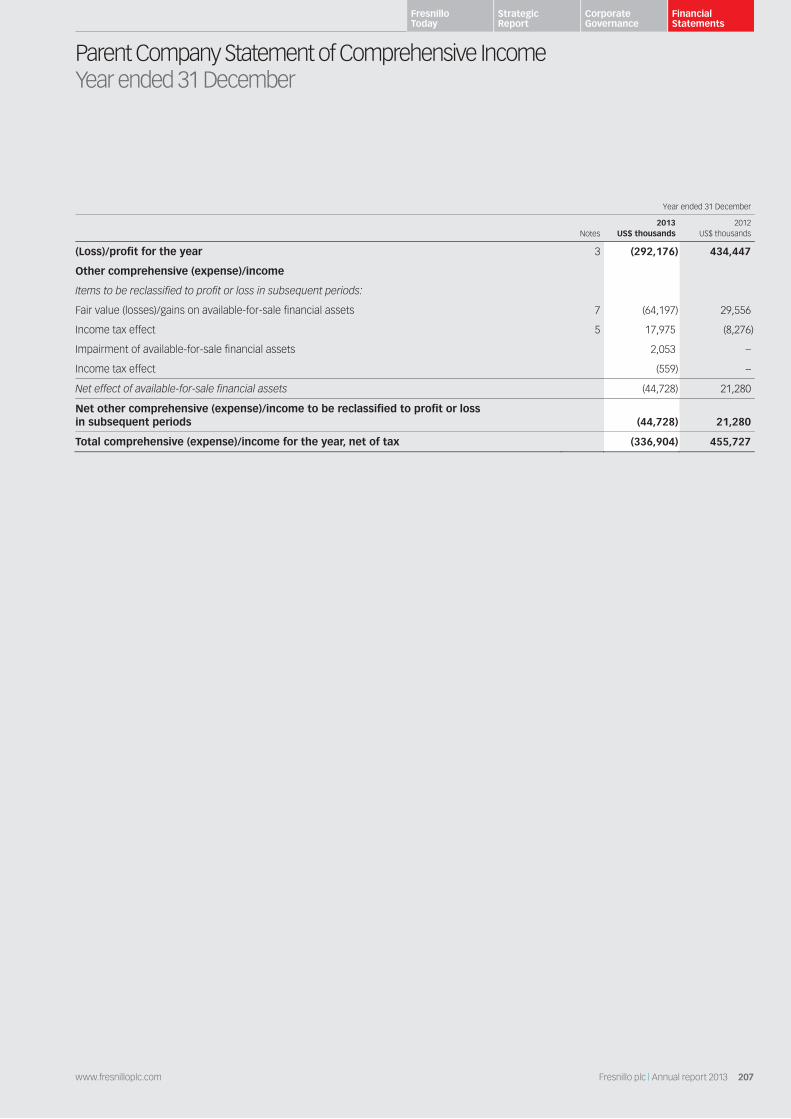
Parent Company Statement of Comprehensive Income Year ended 31 December
Year ended 31 December
Notes 2013
US$ thousands2012
US$ thousands
(Loss)/profit for the year 3 (292,176) 434,447
Other comprehensive (expense)/income
Items to be reclassified to profit or loss in subsequent periods:
Fair value (losses)/gains on available-for-sale financial assets 7 (64,197) 29,556
Income tax effect 5 17,975 (8,276)
Impairment of available-for-sale financial assets 2,053 –
Income tax effect (559) –
Net effect of available-for-sale financial assets (44,728) 21,280
Net other comprehensive (expense)/income to be reclassified to profit or loss in subsequent periods (44,728) 21,280
Total comprehensive (expense)/income for the year, net of tax (336,904) 455,727
207www.fresnilloplc.com Fresnillo plc | Annual report 2013
Fresnillo Today
Strategic Report
Corporate Governance
Financial Statements

Parent Company Balance Sheet As at 31 December
As at 31 December
Notes 2013
US$ thousands 2012
US$ thousands
ASSETS
Non-current assets
Investments in subsidiaries 6 6,792,011 7,384,262
Available-for-sale financial assets 7 63,245 127,442
6,855,256 7,511,704
Current assets
Loans to related parties 15 364,118 165,614
Income tax recoverable 35,823 –
Trade and other receivables 8 6,122 1,270
Derivative financial instruments 18 2,039 2,842
Cash and cash equivalents 9 735,717 8,195
1,143,819 177,921
Total assets 7,999,075 7,689,625
EQUITY AND LIABILITIES
Capital and reserves attributable to shareholders of the Company
Share capital 10 368,546 358,680
Share premium 10 1,153,817 818,597
Merger reserve 10 5,184,973 5,789,600
Net unrealised gains on available-for-sale financial assets 10 962 45,690
Retained earnings 10 140,920 333,643
Total equity 6,849,218 7,346,210
Non-current liabilities
Interest-bearing loans 12 795,306 –
Deferred tax liability 5 2,245 13,127
797,551 13,127
Current liabilities
Trade and other payables 13 28,049 10,686
Derivative financial instruments 18 848 1,128
Income tax 5 – 7,218
Loans from related parties 15 323,409 311,256
352,306 330,288
Total liabilities 1,149,857 343,415
Total equity and liabilities 7,999,075 7,689,625
These financial statements were approved by the Board of Directors on 3 March 2014 and signed on its behalf by:
Mr Juan Bordes Non-executive Director
3 March 2014
208 Fresnillo plc | Annual report 2013 www.fresnilloplc.com
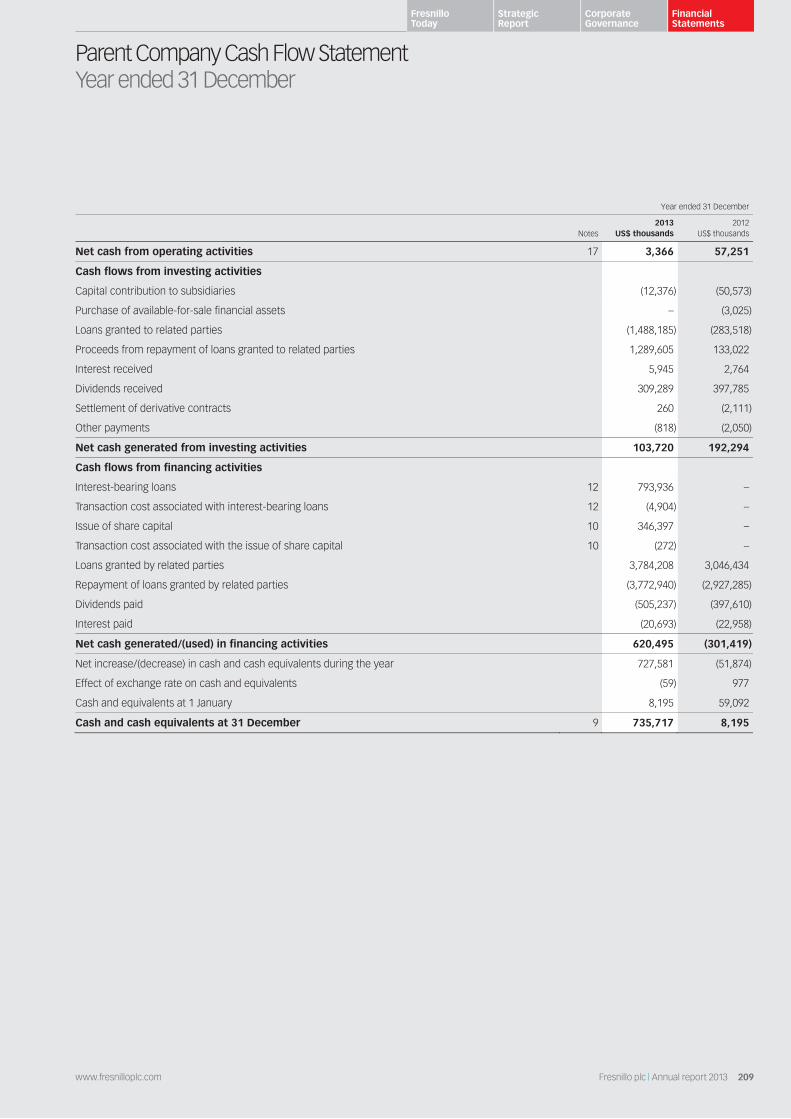
Parent Company Cash Flow Statement Year ended 31 December
Year ended 31 December
Notes 2013
US$ thousands2012
US$ thousands
Net cash from operating activities 17 3,366 57,251
Cash flows from investing activities
Capital contribution to subsidiaries (12,376) (50,573)
Purchase of available-for-sale financial assets – (3,025)
Loans granted to related parties (1,488,185) (283,518)
Proceeds from repayment of loans granted to related parties 1,289,605 133,022
Interest received 5,945 2,764
Dividends received 309,289 397,785
Settlement of derivative contracts 260 (2,111)
Other payments (818) (2,050)
Net cash generated from investing activities 103,720 192,294
Cash flows from financing activities
Interest-bearing loans 12 793,936 –
Transaction cost associated with interest-bearing loans 12 (4,904) –
Issue of share capital 10 346,397 –
Transaction cost associated with the issue of share capital 10 (272) –
Loans granted by related parties 3,784,208 3,046,434
Repayment of loans granted by related parties (3,772,940) (2,927,285)
Dividends paid (505,237) (397,610)
Interest paid (20,693) (22,958)
Net cash generated/(used) in financing activities 620,495 (301,419)
Net increase/(decrease) in cash and cash equivalents during the year 727,581 (51,874)
Effect of exchange rate on cash and equivalents (59) 977
Cash and equivalents at 1 January 8,195 59,092
Cash and cash equivalents at 31 December 9 735,717 8,195
209www.fresnilloplc.com Fresnillo plc | Annual report 2013
Fresnillo Today
Strategic Report
Corporate Governance
Financial Statements

Parent Company Statement of Changes in Equity Year ended 31 December
US$ thousands
Notes Share
capitalShare
premiumMerger reserve
Net unrealised gains/(losses) on available-for-sale
financial assets Retained earnings
Totalequity
Balance at 1 January 2012 358,680 818,597 5,789,600 24,410 297,220 7,288,507
Profit for the year – – – – 434,447 434,447
Other comprehensive income, net of tax – – – 21,280 – 21,280
Total comprehensive income for the year – – – 21,280 434,447 455,727
Dividends declared and paid 11 – – – – (398,024) (398,024)
Balance at 31 December 2012 358,680 818,597 5,789,600 45,690 333,643 7,346,210
Loss for the year – – – – (292,176) (292,176)
Other comprehensive expense net of tax – – – (44,728) – (44,728)
Total comprehensive expense for the year – – – (44,728) (292,176) (336,904)
Issue of share capital 10 9,866 335,220 – – – 345,086
Transfer of reserves – – (604,627) – 604,627 –
Dividends declared and paid 11 – – – – (505,174) (505,174)
Balance at 31 December 2013 368,546 1,153,817 5,184,973 962 140,920 6,849,218
210 Fresnillo plc | Annual report 2013 www.fresnilloplc.com

Notes to the Parent Company Financial Statements
1. Corporate information Fresnillo plc (‘the Company’) is a public limited company and registered in England and Wales with registered number 6344120 and is the holding company for the Fresnillo subsidiaries detailed in note 6. The Company is a Mexican resident for taxation purposes with tax residency in Mexico City. For further information see note 5.
Industrias Peñoles S.A.B. de C.V. (‘Peñoles’) currently owns 75% of the shares of the Company and the ultimate controlling party of the Company is the Baillères family, whose beneficial interest is held through Peñoles. The country of incorporation of Peñoles is Mexico. Copies of Peñoles’ accounts can be obtained from www.penoles.com.mx.
The primary activity of the Company is as holding company for the Fresnillo Group of companies.
The financial statements of the Company for the year ended 31 December 2013 were authorised for issue by the Board of Directors of Fresnillo plc on 3 March 2014.
2. Significant accounting policies
(a) Basis of preparation and statement of compliance The financial statements of the Company have been prepared in accordance with International Financial Reporting Standards (IFRSs) as adopted by the European Union as they apply to the financial statements of the Company for the years ended 31 December 2013 and 2012, and in accordance with the provisions of the Companies Act 2006. The Company’s financial statements are also consistent with IFRS as issued by the International Accounting Standards Board.
These financial statements have been prepared on a going concern basis which considers the realisation of assets and satisfaction of liabilities in the normal course of business. As at 31 December 2013, the Company is in a net current liability position due to an increase in the intercompany loan. The Company’s Directors confirm that Fresnillo plc’s subsidiaries have funds and distributable earnings available for distribution sufficient to repay the intercompany loan and to fund other forecast liabilities of the Company to be incurred in the next 12 months. Further, given that the loan counterparty is a 100% owned subsidiary of the Company, the Directors have a reasonable expectation that it will not request a repayment of the loan until such time as the Company has sufficient cash balances to make the repayment. As such the going concern basis of accounting in preparing the annual financial statements of the Company is deemed appropriate.
The financial statements of the Company have been prepared on a historical cost basis, except for certain derivative financial instruments and available-for-sale financial instruments which have been measured at fair value.
The financial statements are presented in dollars of the United States of America (US dollars or US$) and all monetary amounts are rounded to the nearest thousand (US$000) except when otherwise indicated.
The basis of preparation and accounting policies used in preparing the financial statements are set out below. These accounting policies have been consistently applied to all the periods presented unless otherwise stated.
(b) Changes in accounting policies The accounting policies applied are consistent with those applied in the preparation of the consolidated financial statements for the year ended 31 December 2012 except for the adoption of new standards and interpretations effective as of 1 January 2013.
New standards, interpretations and amendments adopted by the Group The Group has applied, for the first time, certain standards, interpretations and amendments that require restatement of previous financial statements, such as amendments to IAS 1 Presentation of Financial Statements. In addition, the adoption of the IFRS 13 Fair Value Measurement resulted in additional disclosures. The nature and the effect of these changes are disclosed below.
– IAS 1 Presentation of Items of Other Comprehensive Income (OCI) – Amendments to IAS 1: The amendments to IAS 1 introduce a grouping of items presented in OCI. Items that could be reclassified or recycled to profit or loss at a future point in time are presented separately from items that will never be reclassified. The amendment affected presentation only and had no impact on the Company s financial position or performance.
– IFRS 13 Fair Value Measurement: IFRS 13 establishes a single source of guidance under IFRS for all fair value measurements. IFRS 13 does not change when an entity is required to use fair value, but rather provides guidance on how to measure fair value under IFRS when fair value is required or permitted as well as a requirement for enhanced disclosures.
Application of IFRS 13 has not impacted the fair value measurements of the Group. Additional disclosures where required, are provided in the individual notes relating to the assets and liabilities whose fair values were determined. Fair value hierarchy is provided in note 18.
Standards, interpretations and amendments issued but not yet effective The standards and interpretations that are issued, but not yet effective, up to the date of issuance of the Company’s financial statements are disclosed below. The Company intends to adopt these standards, if applicable, when they become effective.
211www.fresnilloplc.com Fresnillo plc | Annual report 2013
Fresnillo Today
Strategic Report
Corporate Governance
Financial Statements

Notes to the Parent Company Financial Statements continued
– IFRS 9 Financial Instruments:
– Classification and Measurement: IFRS 9, as issued, reflects the first phase of the IASB’s work on the replacement of IAS 39 and applies to classification and measurement of financial assets and financial liabilities as defined in IAS 39. The standard was initially effective for annual periods beginning on or after 1 January 2013, but Amendments to IFRS 9 Mandatory Effective Date of IFRS 9 and Transition Disclosures, issued in December 2011, moved the mandatory effective date to 1 January 2015. In November 2013, the Board amended the standard to remove the mandatory effective date.
– Hedge accounting: In November 2013, the IASB completed amendments to hedge accounting, which bring into effect a substantial overhaul of hedge accounting that will allow entities to better reflect their risk management activities in the financial statements; allow the changes to address the so-called ‘own credit’ issue that were already included in IFRS 9 Financial Instruments to be applied in isolation without the need to change any other accounting for financial instruments; and remove the 1 January 2015 mandatory effective date of IFRS 9, to provide sufficient time for preparers of financial statements to make the transition to the new requirements.
– IAS 27 Separate Financial Statements (as revised in 2012): As a consequence of the new IFRS 10 and IFRS 12, what remains of IAS 27 does not change the recognition and presentation requirements as it relates to accounting for subsidiaries, jointly controlled entities, and associates in separate financial statements (cost method or fair value) and as a result the adoption of this revised standard is not expected to impact the parent Company financial statements. The amendment becomes effective for annual periods beginning on or after 1 January 2014, with early adoption permitted.
– IFRS 10 Consolidated Financial Statements: The standard replaces the portion of IAS 27 Consolidated and Separate Financial Statements that addresses the accounting for consolidated financial statements. It also includes the issues raised in SIC-12 Consolidation – Special Purpose Entities. IFRS 10 establishes a single control model that applies to all entities including special purpose entities. The changes introduced by IFRS 10 require management to exercise significant judgement to determine which entities are controlled, and therefore, are required to be consolidated by a parent, compared with the requirements that were in IAS 27. This standard becomes effective for annual periods beginning on or after 1 January 2014, as adopted by the European Union. The Company does not expect this standard to have a significant impact on its the financial position and performance.
– IFRS 12 Disclosure of Involvement with Other Entities: IFRS 12 includes all of the disclosures that were previously in IAS 27 related to consolidated financial statements, as well as all of the disclosures that were previously included in IAS 31 and IAS 28. These disclosures relate to an entity’s interests in subsidiaries, joint arrangements, associates and structured entities. A number of new disclosures will also be required. This standard will become effective for annual periods beginning on or after 1 January 2014 with the adoption of IFRS 10, IFRS 11, IAS 27 (2012) and IAS 28 (2012). The Company will include the relevant disclosures required by IFRS 12 upon adoption.
The IASB and IFRIC have issued other amendments resulting from Improvements to IFRSs that management considers do not have any impact on the accounting policies, financial position or performance of the Group.
The Group has not early adopted any standard, interpretation or amendment that was issued but is not yet effective.
(c) Significant accounting judgements, estimates and assumptions The preparation of the Company’s financial statements in conformity with IFRS requires management to make judgements, estimations and assumptions that affect the reported amounts of assets, liabilities and contingent liabilities at the date of the financial statements. These judgements and estimates are based on management’s knowledge of the relevant facts and circumstances, with regard to prior experience, but actual results may differ from the amounts included in the financial statements. Information about such judgements and estimation is in the accounting policies and/or the notes to the financial statements.
Judgements Areas of judgement, apart from those involving estimations, that have the most significant effect on the amounts recognised in the financial statements are:
– Determination of functional currency note 2(d):
The determination of functional currency requires management judgement, particularly where there may be several currencies in which transactions are undertaken and which impact the economic environment in which the entity operates.
Estimates and assumptions Significant areas of estimation uncertainty made by management in preparing the consolidated financial information include:
– Impairment of available-for-sale financial assets note 2(g) and 7:
The Company classifies certain financial asset as available-for-sale and recognises movements in their fair value in equity. When the fair value declines, management makes assumptions about the decline in value to determine whether it is an impairment that should be recognised in profit or loss. At 31 December 2013 impairment loss of US$2.1 million has been recognised relating to available-for-sale assets (2012: US$nil).
– Impairment and subsequent reversal of impairment of investments in subsidiaries notes 2(e) and 6:
The Company assesses the investments in subsidiaries annually to determine whether any indication of impairment exists. Where an indicator of impairment exists, a formal estimate of the recoverable amount is made, which is considered to be the higher of the fair value less costs to sell and the value in use. A value in use assessment requires the use of estimates and assumptions such as long-term commodity prices, discount rates, future capital requirements, exploration potential and operating performance. Fair value is determined as the amount that would be obtained from the sale of the asset in an arm’s length transaction between knowledgeable and willing parties. Where an impairment charge has previously been recognised, the Company assesses at the end of each reporting period whether there is any indication that the impairment loss may no longer exist or may have decreased. If any such indication exists, the Company estimates the recoverable amount of that investment, requiring similar estimates and assumptions as those for determining an impairment charge. At 31 December 2013, impairment losses of US$628.0 million have been recognised relating to the subsidiaries (2012: US$nil).
212 Fresnillo plc | Annual report 2013 www.fresnilloplc.com

– Contingencies (note 26)
By their nature, contingencies will be resolved only when one or more uncertain future events occur or fail to occur. The assessment of the existence and potential quantum of contingencies inherently involves the exercise of significant judgement and the use of estimates regarding the outcome of future events.
(d) Foreign currency translation The Company’s financial statements are presented in US dollars, which is the functional currency of the Company. The functional currency for the Company is determined by the currency of the primary economic environment in which it operates.
Transactions denominated in currencies other than the functional currency of the Company are translated at the exchange rate ruling at the date of the transaction. Monetary assets and liabilities denominated in foreign currencies are re-translated at the rate of exchange ruling at the balance sheet date. All differences that arise are recorded in the income statement. Non-monetary items that are measured in terms of historical cost in a foreign currency are translated using the exchange rates as at the dates of the initial transactions. Non-monetary items measured at fair value in a foreign currency are translated into US dollars using the exchange rate at the date when the fair valued is determined.
(e) Investments in subsidiaries Subsidiaries are entities over which the Company controls operating and financial policies, generally by owning more than 50% of voting rights. Investments in subsidiaries are recognised at acquisition cost less any provision for impairment.
When the Company incurs increases in or return of share capital, to/from its subsidiaries, such movements are recognised as an addition or return of capital to the original cost recognised in investment in subsidiaries.
At each reporting date, an assessment is made to determine whether there are any indicators of impairment. Where an indicator of impairment exists, a formal estimate of the recoverable amount of the investment in subsidiary is made, which is considered to be the higher of the fair value less costs to sell and the value in use. Fair value is determined as the amount that would be obtained from the sale of the investment in an arm’s length transaction between knowledgeable and willing parties. When this information is not available the fair value is determined based on the net present value of the future cash flows related to its subsidiaries, using a discount rate that reflects current market assessments of the time value of money and the risks specific to the asset. If the carrying amount of an investment exceeds the recoverable amount, a provision is recorded in the income statement to reflect the investment at the recoverable amount.
Where an impairment charge has previously been recognised, an assessment is made at the end of each reporting period whether there is any indication that the impairment loss may no longer exist or may have decreased. If any such indication exists, an estimate of the recoverable amount is made. An impairment loss is reversed to profit or loss to the extent that the increased carrying value of the investment in subsidiary does not exceed that that would have been determined had no impairment loss been recognised for the asset in prior years.
(f) Financial assets and liabilities Financial assets are recognised when the Company becomes party to contracts that give rise to them and are classified as financial assets at fair value through profit or loss; loans and receivables; held to maturity investments; or available-for-sale financial assets, as appropriate. The Company determines the classification of its financial assets at initial recognition and re-evaluates this designation at each balance sheet date. When financial assets are recognised initially, they are measured at fair value, plus, in the case of financial assets not at fair value through profit or loss, directly attributable transaction costs.
The Company recognises financial liabilities on its balance sheet when, and only when, it becomes a party to the contractual provisions of the instrument. Financial liabilities are classified at fair value through profit or loss, loans and borrowings, payables, or as derivatives designated as hedging instruments in an effective hedge, as appropriate. All financial liabilities are initially recognised at the fair value of the consideration received, including any transaction costs incurred.
Financial assets are offset with liabilities and the net amount is reported in the balance sheet when there is a legally enforceable right to set off the recognised amounts and there is an intention to settle on a net basis, or realise the asset and settle the liability simultaneously.
Financial assets and liabilities at fair value through profit or loss Financial assets and liabilities classified as held-for-trading and other assets or liabilities designated as fair value transactions through profit and loss at inception are included in this category. Financial assets or liabilities are classified as held-for-trading if they are acquired or incurred for the purpose of selling in the short term. Derivatives are also classified as held-for-trading unless they are designated as hedging instruments, as defined by IAS 39. Financial assets and liabilities at fair value through profit or loss are carried in the balance sheet at fair value with gains or losses recognised in the income statement.
Loans and receivables Loans and receivables are non-derivative financial assets with fixed or determinable payments that are not quoted in an active market, do not qualify as trading assets and have not been designated as either fair value through profit and loss or available-for-sale.
After initial measurement such assets are subsequently carried at amortised cost using the effective interest method less any allowance for impairment. Gains and losses are recognised in income when the loans and receivables are derecognised or impaired, as well as through the amortisation process.
Current trade receivables are carried at the original invoice amount less provision made for impairment of these receivables. Non-current receivables are stated at amortised cost.
213www.fresnilloplc.com Fresnillo plc | Annual report 2013
Fresnillo Today
Strategic Report
Corporate Governance
Financial Statements
Notes to the Parent Company Financial Statements continued
Loans and borrowings After initial recognition, net of directly attributable transaction costs, interest-bearing loans are subsequently measured at amortised cost using the effective interest rate (EIR) method. The EIR amortisation is included as finance costs in the income statement. Gains and losses are recognised in profit or loss, in the income statement, when the liabilities are derecognised as well as through the EIR amortisation process.
The Company shall adjust the carrying amount of the financial liability to reflect actual and revised estimated cash flows. The carrying amount is recalculated by computing the present value of estimated future cash flows at the financial instrument’s original effective interest rate or, when applicable, the revised effective interest rate. Any adjustment is recognised in profit or loss as income or expense.
This category generally applies to interest-bearing loans. For more information refer note 12.
Available-for-sale financial assets Available-for-sale financial assets are those non-derivative financial assets that are designated as such or are not classified in any of the preceding categories and are not held-to-maturity investments.
Available-for-sale financial assets represent equity investments that have a quoted market price in an active market; therefore a fair value can be reliably measured. After initial measurement, available-for-sale financial assets are measured at fair value with mark-to-market unrealised gains or losses being recognised as other comprehensive income in the available-for-sale reserve until the financial asset is de-recognised.
Financial assets classified as available-for-sale are de-recognised when they are sold, and all the risks and rewards of ownership have been transferred. When financial assets are sold, the accumulated fair value adjustments recognised in equity are included in the income statement within other operating income or expense.
De-recognition of financial assets and liabilities A financial asset or liability is generally de-recognised when the contract that gives rise to it is settled, sold, cancelled or expires.
Where an existing financial liability is replaced by another from the same lender on substantially different terms, or the terms of an existing liability are substantially modified, such an exchange or modification is treated as a de-recognition of the original liability and the recognition of a new liability, such that the difference in the respective carrying amounts together with any costs or fees incurred are recognised in profit or loss.
The difference between the carrying amount of a financial liability (or part of a financial liability) extinguished or transferred to another party and the consideration paid, including any non-cash assets transferred or liabilities assumed, is recognised in the income statement.
(g) Impairment of financial assets The Company assesses at each balance sheet date whether there is objective evidence that a financial asset or group of financial assets is impaired.
Assets carried at amortised cost If there is objective evidence that an impairment loss on loans and receivables carried at amortised cost has been incurred, the amount of the loss is measured as the difference between the asset’s carrying amount and the present value of estimated future cash flows (excluding future expected credit losses that have not been incurred) discounted at the financial asset’s original effective interest rate (i.e. the effective interest rate computed at initial recognition). The carrying amount of the asset is reduced through use of an allowance account. The amount of the loss is recognised in profit or loss.
The Company first assesses whether objective evidence of impairment exists individually for financial assets that are individually significant, and individually or collectively for financial assets that are not individually significant. If it is determined that no objective evidence of impairment exists for an individually assessed financial asset, whether significant or not, the asset is included in a group of financial assets with similar credit risk characteristics and that group of financial assets is collectively assessed for impairment. Assets that are individually assessed for impairment and for which an impairment loss is or continues to be recognised are not included in a collective assessment of impairment.
If, in a subsequent period, the amount of the impairment loss decreases and the decrease can be related objectively to an event occurring after the impairment was recognised, the previously recognised impairment loss is reversed. Any subsequent reversal of an impairment loss is recognised in the income statement, to the extent that the carrying value of the asset does not exceed its amortised cost at the reversal date.
In relation to trade receivables, a provision for impairment is made when there is objective evidence (such as the probability of insolvency or significant financial difficulties of the debtor) that the Company will not be able to collect all of the amounts due under the original terms of the invoice. The carrying amount of the receivable is reduced through use of an allowance account. Impaired receivables are de-recognised when they are assessed as uncollectible.
Available-for-sale financial investments If an available-for-sale asset is impaired, an amount comprising the difference between its cost (net of any principal payment and amortisation) and its current fair value, less any impairment loss previously recognised in the income statement, is transferred from equity to the income statement. In assessing whether there is an impairment, the Company considers whether a decline in fair value is either significant or prolonged by considering the size of the decline in this value, the historic volatility in changes in fair value and the duration of the sustained decline. Reversals in respect of equity instruments classified as available-for-sale are not recognised in the income statement.
(h) Cash and cash equivalents For the purposes of the balance sheet, cash and cash equivalents comprise cash at bank, cash on hand and short-term deposits held with banks that are readily convertible into known amounts of cash and which are subject to insignificant risk of changes in value. Short-term deposits earn interest at the respective short-term deposit rates between one day and three months.
214 Fresnillo plc | Annual report 2013 www.fresnilloplc.com

For the purposes of the cash flow statement, cash and cash equivalents as defined above are shown net of outstanding bank overdrafts.
(i) Share capital Ordinary Shares issued by the Company are recorded at the net proceeds received, which is the fair value of the consideration received less costs that are incurred in connection with the share issue. The nominal par value of the shares issued is taken to the share capital account and any excess is recorded in the share premium account, including the costs that were incurred with the share issue.
(j) Revenue recognition Revenue is recognised to the extent that it is probable that economic benefits will flow to the Company and the revenue can be reliably measured. Revenue is measured at the fair value of consideration received excluding discounts, rebates, and other sales taxes.
Trademark royalties Trademark royalty income is recognised only at the time when it is probable that the amounts related to certain rights will be received.
Interest income Interest income is recognised as interest accrues (using the effective interest method; i.e. the rate that exactly discounts estimated future cash receipts through the expected life of the financial instrument to the net carrying amount of the financial asset).
Dividend income Dividend income is recognised when the Company’s right to receive the payment is established.
(k) Income tax Current income tax Current income tax assets and liabilities for the current and prior periods are measured at the amount expected to be recovered from or paid to the taxation authorities. The tax rates and tax laws used to compute the amount are those that are enacted or substantively enacted by the balance sheet date.
Deferred income tax Deferred income tax is provided using the liability method on temporary differences at the balance sheet date between the tax bases of assets and liabilities and their carrying amounts for financial reporting purposes.
Deferred income tax liabilities are recognised for all taxable temporary differences, except:
– Where the deferred income tax liability arises from the initial recognition of goodwill or of an asset or liability in a transaction that is not a business combination and, at the time of transaction, affects neither the accounting profit nor taxable profit loss
– In respect of taxable temporary differences associated with investments in subsidiaries, associates and interests in joint ventures, where the timing of the reversal of the temporary differences can be controlled and it is probable that the temporary differences will not reverse in the foreseeable future.
Deferred income tax assets are recognised for all deductible temporary differences, carry forward of unused tax credits and unused tax losses, to the extent that it is probable that taxable profit will be available against which the deductible temporary differences, and the carry forward of unused tax credits and unused tax losses can be utilised except:
– Where the deferred income tax asset relating to deductible temporary differences arise from the initial recognition of an asset or liability in a transaction that is not a business combination and, at the time of the transaction, affects neither the accounting profit nor taxable profit or loss
– In respect of deductible temporary differences associated with investments in subsidiaries, associates and interests in joint ventures, deferred income tax assets are recognised only to the extent that it is probable that the temporary differences will reverse in the foreseeable future and taxable profit will be available against which the temporary differences can be utilised.
The carrying amount of deferred income tax assets is reviewed at each balance sheet date and reduced to the extent that it is no longer probable that sufficient taxable profit will be available to allow all or part of the deferred income tax asset to be utilised.
Unrecognised deferred income tax assets are reassessed at each balance sheet date and are recognised to the extent that it has become probable that future taxable profit will allow the deferred tax asset to be recovered.
Deferred income tax assets and liabilities are measured at the tax rates that are expected to apply to the year when the asset is realised or the liability is settled, based on tax rates (and tax laws) that have been enacted or substantively enacted at the balance sheet date.
Deferred income tax relating to items recognised directly in equity is recognised in equity and not in the income statement.
Deferred income tax assets and deferred income tax liabilities are offset, if a legally enforceable right exists to set off current tax assets against current income tax liabilities and the deferred income taxes relate to the same taxable entity and the same taxation authority.
(l) Derivative financial instruments and hedging The Company enters into derivative contracts in order to manage certain market risks derived from changes in foreign exchange which impact the financial and business transactions of its subsidiaries. Such derivative financial instruments are initially recognised at fair value on the date on which a derivative contract is entered into and are subsequently re-measured at fair value. Derivatives are carried as assets when the fair value is positive and as liabilities when the fair value is negative.
215www.fresnilloplc.com Fresnillo plc | Annual report 2013
Fresnillo Today
Strategic Report
Corporate Governance
Financial Statements

Notes to the Parent Company Financial Statements continued
In the Group’s consolidated financial statements these derivative instruments are designated as cash flow hedges but for the purposes of the Company’s stand-alone financial statements the related hedged items are not held by the Company, so do not qualify as cash flow hedges.
Any gains and losses arising from changes in fair value on derivatives during the year that do not qualify for hedge accounting are taken directly to the income statement.
Derivatives are valued using valuation approaches and methodologies (such as Black Scholes and Net Present Value) applicable to the specific type of derivative instrument. The fair value of forward currency contracts is calculated by reference to current forward exchange rates for contracts with similar maturity profiles.
Embedded derivatives Contracts are assessed for the existence of embedded derivatives at the date that the Company first becomes party to the contract, with reassessment only if there is a change to the contract that significantly modifies the cash flows. Embedded derivatives which are not clearly and closely related to the underlying asset, liability or transaction are separated and accounted for as stand-alone derivatives.
(m) Fair value measurement The Company measures financial instruments at fair value at each balance sheet date. Fair values of financial instruments measured at amortised cost are disclosed in notes 18 and 19.
Fair value is the price that would be received to sell an asset or paid to transfer a liability in an orderly transaction between market participants at the measurement date. The fair value measurement is based on the presumption that the transaction to sell the asset or transfer the liability takes place either:
– In the principal market for the asset or liability
– In the absence of a principal market, in the most advantageous market for the asset or liability.
The principal or the most advantageous market must be accessible to the Group.
The fair value of an asset or a liability is measured using the assumptions that market participants would use when pricing the asset or liability, assuming that market participants act in their economic best interest.
A fair value measurement of a non-financial asset takes into account a market participant’s ability to generate economic benefits by using the asset in its highest and best use or by selling it to another market participant that would use the asset in its highest and best use.
The Company uses valuation techniques that are appropriate in the circumstances and for which sufficient data are available to measure fair value, maximising the use of relevant observable inputs and minimising the use of unobservable inputs.
All assets and liabilities for which fair value is measured or disclosed in the financial statements are categorised within the fair value hierarchy, described as follows, based on the lowest level input that is significant to the fair value measurement as a whole:
Level 1 – Quoted (unadjusted) market prices in active markets for identical assets or liabilities
Level 2 – Valuation techniques for which the lowest level input that is significant to the fair value measurement is directly or indirectly observable
Level 3 – Valuation techniques for which the lowest level input that is significant to the fair value measurement is unobservable
For assets and liabilities that are recognised in the financial statements on a recurring basis, the Company determines whether transfers have occurred between levels in the hierarchy by re-assessing categorisation (based on the lowest level input that is significant to the fair value measurement as a whole) at the end of each reporting period.
For the purpose of fair value disclosures, the Group has determined classes of assets and liabilities on the basis of the nature, characteristics and risks of the asset or liability and the level of the fair value hierarchy as explained above. Further information on fair values is described in note 18.
(n) Dividend distribution Dividends payable to the Company’s shareholders are recognised as a liability in the financial statements in the period in which the dividends are approved by the Company’s shareholders.
3. Profit or loss attributable to the parent Company The loss for the Company is US$(292.2) million for the year ended 31 December 2013 (2012: profit of US$434.4 million). In accordance with the exemption granted under section 408 of the Companies Act 2006 a separate income statement for the Company has not been presented.
4. Segment reporting Segmental information is not presented in the Company’s stand-alone financial statements as this is presented in the Company’s consolidated financial statements.
216 Fresnillo plc | Annual report 2013 www.fresnilloplc.com
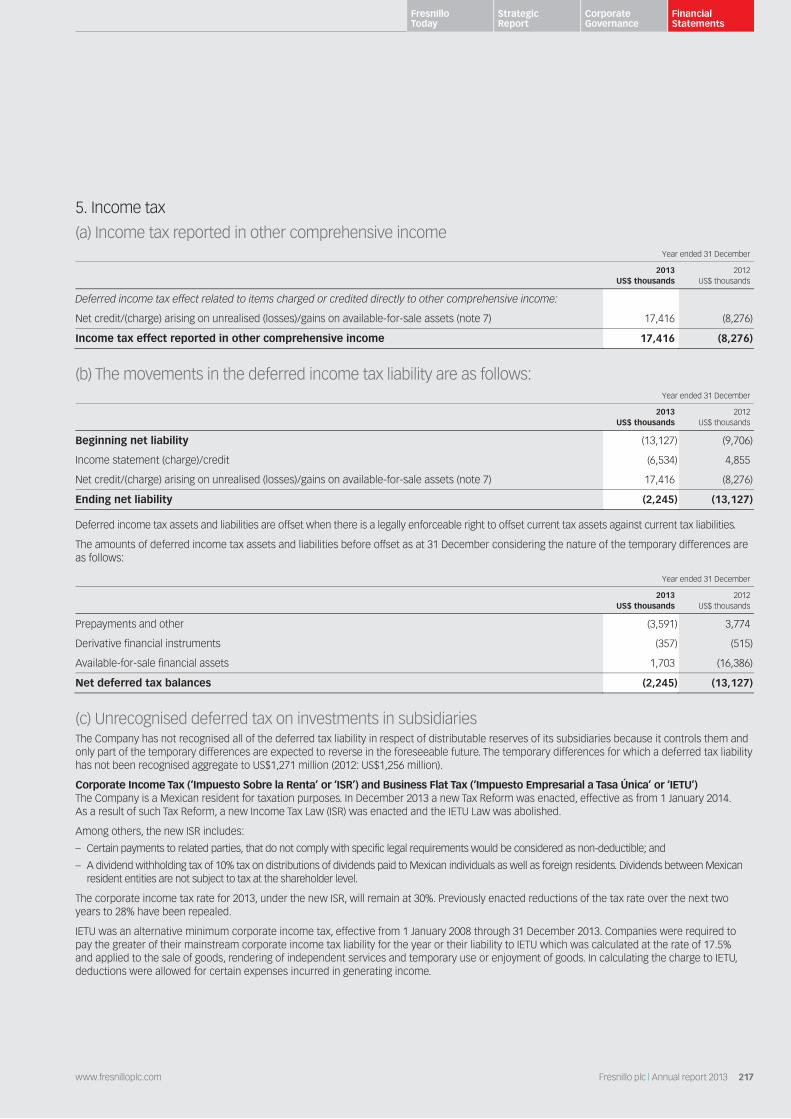
5. Income tax
(a) Income tax reported in other comprehensive income Year ended 31 December
2013
US$ thousands2012
US$ thousands
Deferred income tax effect related to items charged or credited directly to other comprehensive income:
Net credit/(charge) arising on unrealised (losses)/gains on available-for-sale assets (note 7) 17,416 (8,276)
Income tax effect reported in other comprehensive income 17,416 (8,276)
(b) The movements in the deferred income tax liability are as follows: Year ended 31 December
2013
US$ thousands2012
US$ thousands
Beginning net liability (13,127) (9,706)
Income statement (charge)/credit (6,534) 4,855
Net credit/(charge) arising on unrealised (losses)/gains on available-for-sale assets (note 7) 17,416 (8,276)
Ending net liability (2,245) (13,127)
Deferred income tax assets and liabilities are offset when there is a legally enforceable right to offset current tax assets against current tax liabilities.
The amounts of deferred income tax assets and liabilities before offset as at 31 December considering the nature of the temporary differences are as follows:
Year ended 31 December
2013
US$ thousands2012
US$ thousands
Prepayments and other (3,591) 3,774
Derivative financial instruments (357) (515)
Available-for-sale financial assets 1,703 (16,386)
Net deferred tax balances (2,245) (13,127)
(c) Unrecognised deferred tax on investments in subsidiaries The Company has not recognised all of the deferred tax liability in respect of distributable reserves of its subsidiaries because it controls them and only part of the temporary differences are expected to reverse in the foreseeable future. The temporary differences for which a deferred tax liability has not been recognised aggregate to US$1,271 million (2012: US$1,256 million).
Corporate Income Tax (‘Impuesto Sobre la Renta’ or ‘ISR’) and Business Flat Tax (‘Impuesto Empresarial a Tasa Única’ or ‘IETU’) The Company is a Mexican resident for taxation purposes. In December 2013 a new Tax Reform was enacted, effective as from 1 January 2014. As a result of such Tax Reform, a new Income Tax Law (ISR) was enacted and the IETU Law was abolished.
Among others, the new ISR includes:
– Certain payments to related parties, that do not comply with specific legal requirements would be considered as non-deductible; and
– A dividend withholding tax of 10% tax on distributions of dividends paid to Mexican individuals as well as foreign residents. Dividends between Mexican resident entities are not subject to tax at the shareholder level.
The corporate income tax rate for 2013, under the new ISR, will remain at 30%. Previously enacted reductions of the tax rate over the next two years to 28% have been repealed.
IETU was an alternative minimum corporate income tax, effective from 1 January 2008 through 31 December 2013. Companies were required to pay the greater of their mainstream corporate income tax liability for the year or their liability to IETU which was calculated at the rate of 17.5% and applied to the sale of goods, rendering of independent services and temporary use or enjoyment of goods. In calculating the charge to IETU, deductions were allowed for certain expenses incurred in generating income.
217www.fresnilloplc.com Fresnillo plc | Annual report 2013
Fresnillo Today
Strategic Report
Corporate Governance
Financial Statements
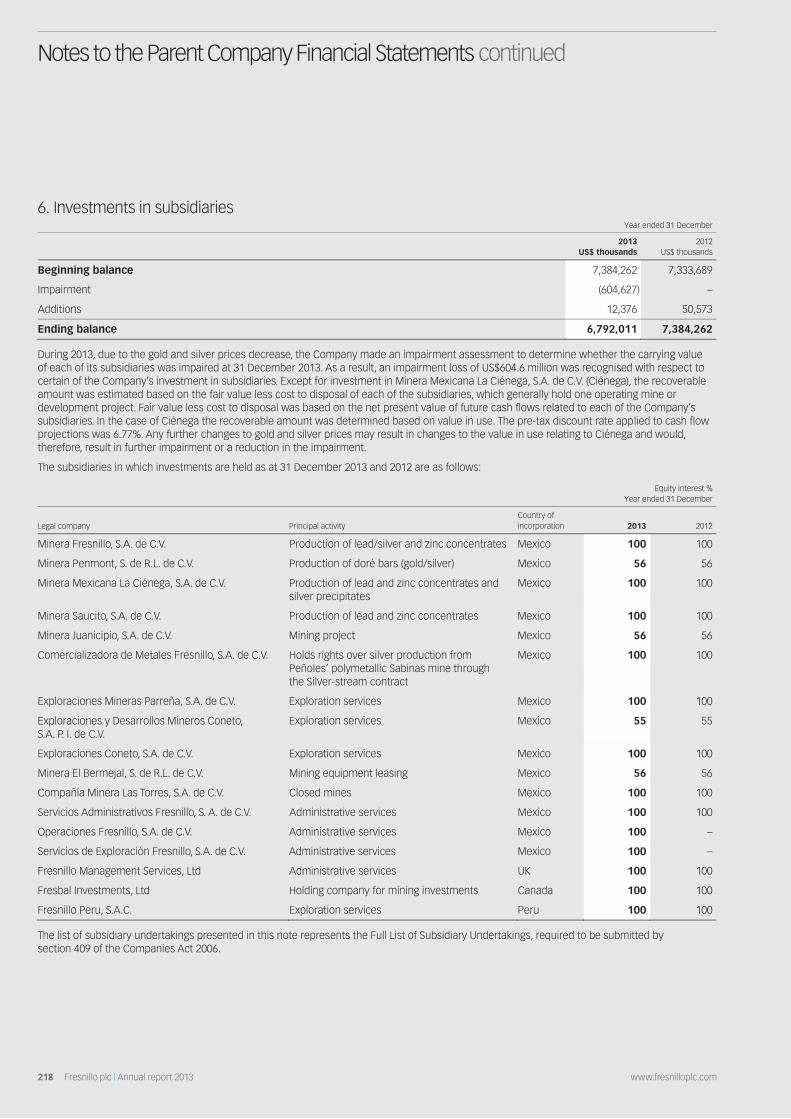
Notes to the Parent Company Financial Statements continued
6. Investments in subsidiaries Year ended 31 December
2013
US$ thousands 2012
US$ thousands
Beginning balance 7,384,262 7,333,689
Impairment (604,627) –
Additions 12,376 50,573
Ending balance 6,792,011 7,384,262
During 2013, due to the gold and silver prices decrease, the Company made an impairment assessment to determine whether the carrying value of each of its subsidiaries was impaired at 31 December 2013. As a result, an impairment loss of US$604.6 million was recognised with respect to certain of the Company’s investment in subsidiaries. Except for investment in Minera Mexicana La Ciénega, S.A. de C.V. (Ciénega), the recoverable amount was estimated based on the fair value less cost to disposal of each of the subsidiaries, which generally hold one operating mine or development project. Fair value less cost to disposal was based on the net present value of future cash flows related to each of the Company’s subsidiaries. In the case of Ciénega the recoverable amount was determined based on value in use. The pre-tax discount rate applied to cash flow projections was 6.77%. Any further changes to gold and silver prices may result in changes to the value in use relating to Ciénega and would, therefore, result in further impairment or a reduction in the impairment.
The subsidiaries in which investments are held as at 31 December 2013 and 2012 are as follows:
Equity interest %
Year ended 31 December
Legal company Principal activity Country of incorporation 2013 2012
Minera Fresnillo, S.A. de C.V. Production of lead/silver and zinc concentrates Mexico 100 100
Minera Penmont, S. de R.L. de C.V. Production of doré bars (gold/silver) Mexico 56 56
Minera Mexicana La Ciénega, S.A. de C.V. Production of lead and zinc concentrates and silver precipitates
Mexico 100 100
Minera Saucito, S.A. de C.V. Production of lead and zinc concentrates Mexico 100 100
Minera Juanicipio, S.A. de C.V. Mining project Mexico 56 56
Comercializadora de Metales Fresnillo, S.A. de C.V. Holds rights over silver production from Peñoles’ polymetallic Sabinas mine through the Silver-stream contract
Mexico 100 100
Exploraciones Mineras Parreña, S.A. de C.V. Exploration services Mexico 100 100
Exploraciones y Desarrollos Mineros Coneto, S.A. P. I. de C.V.
Exploration services Mexico 55 55
Exploraciones Coneto, S.A. de C.V. Exploration services Mexico 100 100
Minera El Bermejal, S. de R.L. de C.V. Mining equipment leasing Mexico 56 56
Compañía Minera Las Torres, S.A. de C.V. Closed mines Mexico 100 100
Servicios Administrativos Fresnillo, S. A. de C.V. Administrative services Mexico 100 100
Operaciones Fresnillo, S.A. de C.V. Administrative services Mexico 100 –
Servicios de Exploración Fresnillo, S.A. de C.V. Administrative services Mexico 100 –
Fresnillo Management Services, Ltd Administrative services UK 100 100
Fresbal Investments, Ltd Holding company for mining investments Canada 100 100
Fresnillo Peru, S.A.C. Exploration services Peru 100 100
The list of subsidiary undertakings presented in this note represents the Full List of Subsidiary Undertakings, required to be submitted by section 409 of the Companies Act 2006.
218 Fresnillo plc | Annual report 2013 www.fresnilloplc.com

7. Available-for-sale financial assets Year ended 31 December
2013
US$ thousands2012
US$ thousands
Beginning balance 127,442 94,861
Additions – 3,025
Fair value change (64,197) 29,556
Ending balance 63,245 127,442
At 31 December 2013, the published quoted price of the Orex Minerals’ share decreased below the cost paid by the Company. This decrease has been consistent during the past 12-month period, which is considered to be prolonged; therefore, an impairment of US$2.1 million was recognised as other expenses, in the income statement, decreasing the carrying value of the financial asset at 31 December 2013.
The fair value of the available-for-sale financial assets is determined by reference to published price quotations in an active market.
8. Trade and other receivables Year ended 31 December
2013
US$ thousands2012
US$ thousands
Other receivables from related parties (note 15) 737 216
Prepayments 211 214
Other taxes and contributions 5,148 840
Other 26 –
6,122 1,270
As of 31 December for each year presented, other receivables from related parties were neither past due nor impaired. In determining the recoverability of a receivable, the Company performs a risk analysis considering the type and age of the outstanding receivable and the credit worthiness of the counterparty.
9. Cash and cash equivalents Year ended 31 December
2013
US$ thousands2012
US$ thousands
Cash at bank and on hand 1 38
Short-term deposits 735,716 8,157
Cash and cash equivalents 735,717 8,195
Cash at bank earns interest at floating rates based on daily bank deposits. Short-term deposits are made for varying periods of between 1 to 30 days, depending on the immediate cash requirements of the Company, and earn interest at the respective short-term deposit rates.
219www.fresnilloplc.com Fresnillo plc | Annual report 2013
Fresnillo Today
Strategic Report
Corporate Governance
Financial Statements

Notes to the Parent Company Financial Statements continued
10. Equity
Share capital and share premium As at 31 December
2013 2012
Class of share Number Amount Number Amount
Ordinary Shares each of US$0.50 1,000,000,000 $500,000,000 1,000,000,000 $500,000,000
Sterling Deferred Ordinary Shares each of £1.00 50,000 £50,000 50,000 £50,000
Issued share capital of the Company is as follows:
Ordinary Shares Sterling Deferred Ordinary Shares
Number US$ Number £
At 1 January 2012 717,160,159 $358,580,080 50,000 £50,000
At 31 December 2012 717,160,159 $358,580,080 50,000 £50,000
Issued on 3 May 2013 19,733,430 $9,866,715 – –
At 31 December 2013 736,893,589 $368,446,795 50,000 £50,000
Pursuant to the placing of shares announced on 29 April 2013, the Group issued on 3 May 2013, 19,733,430 new Ordinary Shares at £11.30 (US$17.60) per share for gross proceeds of £222.9 million (US$346.4 million). Share issue cost paid amounted to US$0.3 million. The placing of shares ensured that Fresnillo plc is compliant with changes to the Ground Rules of the FTSE UK Index Series that require constituents to maintain a minimum free float of 25%. The proceeds of the placing were used for general corporate purposes and the Company’s working capital needs.
As a result, the Company’s issued Ordinary Share capital now consists of 736,893,589 (2012: 717,160,159) Ordinary Shares of US$0.50 each with voting rights. The Company does not hold any Ordinary Shares in treasury. Therefore, the total number of voting rights in the Company is 736,893,589. At 31 December 2013, all issued shares with a par value of $0.50 each are fully paid. The rights and obligations attaching to these shares are governed by law and the Company’s Articles of Association. Ordinary shareholders are entitled to receive notice and to attend and speak at any general meeting of the Company. There are no restrictions on the transfer of the Ordinary Shares.
The Sterling Deferred Ordinary Shares only entitle the shareholder on winding up or on a return of capital to payment of the amount paid up after repayment to Ordinary Shareholders. The Sterling Deferred Ordinary Shares do not entitle the holder to payment of any dividend, or to receive notice or to attend and speak at any general meeting of the Company. The Company may also at its option redeem the Sterling Deferred Ordinary Shares at a price of £1.00 or, as custodian, purchase or cancel the Sterling Deferred Ordinary Shares or require the holder to transfer the Sterling Deferred Ordinary Shares. Except at the option of the Company the Sterling Deferred Ordinary Shares are not transferrable.
Reserves Share premium This reserve records the consideration premium for shares issued at a value that exceeds their nominal value. During 2013, share premium increased by US$335.4 million as a result of the issue of new Ordinary Shares on 3 May 2013.
Merger reserve The merger reserve represents the difference between the value of the net assets acquired as part of the Pre-IPO reorganisation and the nominal value of the shares issued pursuant to the Merger Agreement. Movements in this reserve during 2013 represent the impairment of the carrying value of Fresnillo’s investments in subsidiaries transferred from retained earnings.
Unrealised gains/(losses) on available-for-sale financial assets This reserve records fair value changes on available-for-sale investments, net of tax. On disposal or on impairment, the cumulative changes in fair value are recycled to the income statement.
Retained earnings This reserve records the accumulated results of the Company, less any distributions and dividends paid.
220 Fresnillo plc | Annual report 2013 www.fresnilloplc.com
11. Dividends declared and paid The dividends declared and paid during the years ended 31 December 2013 and 2012 are as follows:
US cents per
Ordinary ShareAmount
US$ thousands
Year ended 31 December 2013
Final dividend for 2012 declared and paid during the year1 42.4 304,076
Interim dividend for 2013 declared and paid during the year2 4.9 36,108
Interim dividend for 2013 declared and paid during the year3 22.4 165,990
69.7 506,174
Year ended 31 December 2012
Final dividend for 2011 declared and paid during the year4 40.0 286,864
Interim dividend for 2012 declared and paid during the year5 15.5 111,160
55.5 398,024
1 This dividend was approved by the Board of Directors on 3 May 2013 and paid on 8 May 2013. 2 This dividend was approved by the Board of Directors on 5 August 2013 and paid on 10 September 2013. 3 This dividend was approved by the Board of Directors on 5 October 2013 and paid on 1 November 2013. 4 This dividend was approved by the Board of Directors on 10 May 2012 and paid on 23 May 2012. 5 This dividend was approved by the Board of Directors on 30 July 2012 and paid on 11 September 2012.
12. Interest-bearing loans
Senior Notes On 13 November 2013, the Group completed its previously announced offering of US$800 million aggregate principal amount of 5.500% Senior Notes due 2023 (the ‘Notes’).
The Notes were initially recognised as follows:
US$ thousands
Principal amount of the Notes1 800,000
Less discount on issue of the Notes (6,064)
Fair value 793,936
Less transaction costs (4,904)
Initial recognition 789,032
1 The issue of the bond was at market terms such that the fair value is equal to the cash received.
An analysis of the debt as at 31 December 2013 is as follows:
US$ thousands
Initial recognition 789,032
Accrued interest1 6,135
Amortisation of discount and transaction costs 139
Total 795,306
1 Accrued interest is payable semi-annually on 13 May and 13 November.
13. Trade and other payables Year ended 31 December
2013
US$ thousands2012
US$ thousands
Other payables to related parties (note 15) 27,522 9,995
Accrued expenses 527 691
28,049 10,686
The fair value of trade and other payables approximates their book values. The Company’s exposure to currency and liquidity risk related to trade and other payables is disclosed in note 19.
221www.fresnilloplc.com Fresnillo plc | Annual report 2013
Fresnillo Today
Strategic Report
Corporate Governance
Financial Statements
Notes to the Parent Company Financial Statements continued
14. Contingencies As of 31 December 2013 the Company has the following contingencies:
– The Company is subject to various laws and regulations which, if not observed, could give rise to penalties.
– Tax periods remain open to review by the Mexican tax authorities in respect of income taxes for five years following the date of the filing of the corporate income tax return, during which time the authorities have the right to raise additional tax assessments including penalties and interest. Under certain circumstances the reviews may cover longer periods.
In addition, because a number of tax periods remain open to review by the tax authorities, there is a risk that transactions, and in particular related party transactions that have not been challenged in the past by the authorities, may be challenged by them in the future, and this may result in the raising of additional tax assessments plus penalties and interest. It is not practical to determine the amount of any such potential claims or the likelihood of any unfavourable outcome. However, management believes that its interpretation of the relevant legislation is appropriate and that the Company has complied with all regulations and paid or accrued all taxes and withholdings that are applicable.
– On 8 May 2008, the Company and Peñoles entered into the Separation Agreement (the ‘Separation Agreement’). This agreement relates to the separation of the Fresnillo Group (‘the Group’) and the Peñoles Group and governs certain aspects of the relationship between the Fresnillo Group and the Peñoles Group following the initial public offering in May 2008 (‘Admission’). The Separation Agreement provides for cross-indemnities between the Company and Peñoles so that, in the case of Peñoles, it is held harmless against losses, claims and liabilities (including tax liabilities) properly attributable to the precious metals business of the Group and, in the case of the Company, it is held harmless by Peñoles against losses, claims and liabilities which are not properly attributable to the precious metals business. Save for any liability arising in connection with tax, the aggregate liability of either party under the indemnities shall not exceed US$250 million in aggregate.
– Peñoles has agreed to indemnify the Fresnillo Group in relation to (i) any tax charge, subject to certain exceptions, the Company may incur as a result of the Pre-IPO Reorganisation (including as a result of a transaction following Admission of a member of the Fresnillo Group, provided that Peñoles has confirmed that the proposed transaction will not give rise to a tax charge, or as a result of a transaction of a member of the Peñoles Group on or after Admission), the Global Offer or Admission and (ii) certain tax aspects of certain other pre-Admission transactions. Peñoles’ liability under these indemnities and in respect of general tax liabilities arising pre-Admission which are not properly attributable to the precious metals business of the Fresnillo Group shall not exceed US$500 million. If a member of the Fresnillo Group forming part of Peñoles’ tax consolidation pays an intra-group dividend in excess of its net income tax account (‘Cuenta de Utilidad Fiscal Neta’ or ‘CUFIN’) account after Admission and is relieved of tax as a result of the consolidation, it is required to pay Peñoles an amount in respect of that tax.
– On 30 November 2013, the Mexican government enacted a new federal labour law. Management is currently evaluating the new labour law for any potential impacts on the operations and financial position of the Group, however management does not expect any significant effect on the Company’s financial statements as at 31 December 2013 and going forward.
– In 2009 five members of the El Bajío agrarian community in the state of Sonora, who claimed rights over certain surface land in the proximity of the operations of Minera Penmont (‘Penmont’), submitted a legal claim with the Unitarian Agrarian Court (Tribunal Unitario Agrario) of Hermosillo Sonora, to have Penmont vacate an area of this surface land. The land in dispute encompassed a portion of surface area where part of the operations of Soledad-Dipolos is located. Minera Penmont’s mining concessions are held by way of separate title to that relating to the surface land. The litigation resulted in a definitive court order pursuant to which the Magistrate of the Unitarian Agrarian Court of Hermosillo, Sonora, ordered Penmont to vacate 1,824 hectares of land in July 2013, resulting in the suspension of operations at Soledad-Dipolos.
To date the disputed land has been returned by Penmont, with remediation activities pending in approximately 300 hectares. The Magistrate has noted that remediation activities are necessary to comply with relevant regulatory requirements and requested the guidance of the Federal Environmental Agency (SEMARNAT) regarding the same.
The execution of the court ruling also resulted in the temporary suspension by the Mexican Ministry of Defense (Secretaría de la Defensa Nacional or MOD) of the single explosives permit which covered the Dipolos pit as well as its adjacent Soledad pit and Herradura. The Soledad pit and Herradura are outside of the area affected by the court ruling, which was confirmed by a court-appointed topographer. The Company filed a request to lift the explosives suspension at the Soledad pit and Herradura. In connection with the foregoing matter, the El Bajio agrarian community entered cease and desist proceedings before a Federal district court in Sonora, requesting relief against the potential lifting of the suspension on the use of explosives and originally obtained a temporary stay order, which was subsequently not upheld by the district court.
Following a hearing on 24 January, the district court denied the request by the Ejido El Bajío to prevent the lifting of the explosives permit covering Herradura and Soledad. The Company received no indication that the Ejido has filed an ultimate appeal regarding the foregoing and the time frame for filing such an appeal has expired.
On 24 February 2014 the MOD granted a new explosives permit for the Herradura mining unit, thereby allowing the use of explosives at this mine.
In connection with the foregoing matters, members of the El Bajio agrarian community have also presented additional claims, including a separate legal suit before the Unitarian Agrarian Court of Hermosillo, Sonora, claiming US$65 million for damages alleging that the Group improperly used the land affected by the court ruling, as well as cancellation of Penmont’s mining concessions and environmental permits within the El Bajío lands. Such concessions and permits are held by way of separate title to that relating to the surface land. The members have not yet presented substantial evidence to support their claim and the Group believes that these claims are without merit. Any initial ruling in this case would be subject to the appeals process in Mexico before judicial authorities other than the Unitarian Agrarian Court of Hermosillo, Sonora. Given the lack of evidence in support of the damages claim, the Company believes that an adverse and definitive ruling for the Group in respect of this law suit is not probable. Various claims and counterclaims have been made between the relevant parties. There is significant uncertainty relating to the finalisation and ultimate result relating to these legal proceedings.
222 Fresnillo plc | Annual report 2013 www.fresnilloplc.com
15. Related party balances and transactions Related parties are those entities owned or controlled by the ultimate controlling party and include the Company’s subsidiaries disclosed in note 6, as well as those entities who have a minority participation in Fresnillo Group companies. Related party balances will be settled in cash.
(a) Related party accounts receivable and payable Accounts receivable
US$ thousands Accounts payable
US$ thousands
31 December 2013
31 December 2012
31 December 2013
31 December 2012
Loans with related parties 364,118 165,614 323,409 311,256
Administrative services 73 216 669 508
Trademark royalty 664 – 26,859 9,487
Sub-total 364,855 165,830 350,937 321,251
Less-current portion 364,855 165,830 350,937 321,251
Non-current portion – – – –
Effective interest rates on loans granted to and received from related parties are as follows:
Accounts receivable Accounts payable
31 December 2013
31 December 2012
31 December 2013
31 December 2012
Comercializadora de Metales Fresnillo, S.A. de C.V.:
– In Mexican pesos – – 6.28% 9.25%
Minera Mexicana La Ciénega, S.A. de C.V.:
– In US dollars 3.77% 5.29% – –
– In Mexican pesos – 9.42% – –
Minera Fresnillo, S.A. de C.V. in US dollars
– In US dollars 2.92% 5.29% – –
– In Mexican pesos – 9.34% – –
Minera Penmont S. de R.L. de C.V. in US dollars 2.25% 4.77% – –
Minera Saucito, S.A. de C.V. US dollars 2.24% – – –
Servicios Administrativos Fresnillo S.A. de C.V. US dollars 2.24% – – –
Exploraciones Mineras Parreña, S.A. de C.V. in US dollars – – – –
(b) Principal transactions with affiliates (apart from dividends, additional investments and returns of capital) are as follows:
Year ended 31 December
2013
US$ thousands2012
US$ thousands
Income:
Trademark royalties 60,714 100,540
Interest on loans to related parties 4,207 1,738
Other 129 –
Total income 65,050 102,278
223www.fresnilloplc.com Fresnillo plc | Annual report 2013
Fresnillo Today
Strategic Report
Corporate Governance
Financial Statements
Notes to the Parent Company Financial Statements continued
Year ended 31 December
2013
US$ thousands 2012
US$ thousands
Expenses:
Administrative services 24,200 3,042
Interest on loans from related parties 20,597 22,957
Other 362 907
Total expenses 45,160 26,906
(c) Compensation of key management personnel of the Company Key management personnel comprise Non-executive Directors. In 2013, their compensation was US$0.8 million (2012: US$0.7 million). This compensation paid is disclosed in the directors’ remuneration report.
16. Auditor’s remuneration The auditor’s remuneration for the Company was US$1.0. million (2012: US$0.9 million) in respect of the audit of its financial statements together with a proportion of the fees in relation to Fresnillo Group audit.
Fees paid to Ernst & Young LLP and its associates for non-audit services to the Company itself are not disclosed in the stand-alone financial statements because Group financial statements are prepared which include these fees on a consolidated basis.
17. Notes to the cash flow statement Year ended 31 December
2013
US$ thousands 2012
US$ thousands
Reconciliation of profit for the year to net cash generated from operating activities
(Loss)/profit for the period (292,176) 434,447
Adjustments to reconcile profit for the period to net cash inflows from operating activities:
Impairment charge 604,627 –
Income tax expense 8,507 28,707
Other income (308,315) (396,409)
Impairment of available-for-sale financial assets 2,053 –
Net finance loss 21,644 11,296
Foreign exchange loss 986 13,191
Working capital adjustments
(Decrease)/increase in trade and other receivables (5,023) 1
(Decrease)/increase in prepayments and other assets (299) 74
Decrease in trade and other payables 17,548 2,940
Cash generated from operations 49,552 94,247
Income tax paid (46,186) (36,996)
Net cash from operating activities 3,366 57,251
224 Fresnillo plc | Annual report 2013 www.fresnilloplc.com

18. Financial instruments
(a) Fair value category As at 31 December 2013
US$ thousands
Financial assets:
At fair value through profit
or loss
At fair value through OCI
(cash flow hedge)
Available-for-sale investments at
fair valuethrough OCI
Loans and
receivables
Trade and other receivables – – – 737
Loans to related parties – – – 364,118
Available-for-sale financial assets – – 63,245 –
Derivative financial instruments 2,039 – – –
Financial liabilities:
At fair value through profit
or loss
At fair value through OCI
(cash flow hedge)
Available-for-sale investments at
fair valuethrough OCI
At amortised cost
Interest-bearing loans – – – 795,306
Loans from related parties – – – 323,409
Trade and other payables – – – 27,528
Derivative financial instruments 848 – – –
As at 31 December 2012
US$ thousands
Financial assets:
At fair valuethrough profit
or loss
At fair value through OCI
(including derivatives)
Available-for-sale investments at
fair value through OCI
Loansand
receivables
Trade and other receivables – – – 216
Loans to related parties – – – 165,614
Available-for-sale financial assets – – 127,442 –
Derivative financial instruments 2,842 – – –
Financial liabilities:
At fair valuethrough profit
or loss
At fair value through OCI
(including derivatives)
Available-for-sale investments at
fair value through OCI
At amortisedcost
Trade and other payables – – – 9,995
Loans from related parties – – – 311,256
Derivative financial instruments – 1,128 – –
225www.fresnilloplc.com Fresnillo plc | Annual report 2013
Fresnillo Today
Strategic Report
Corporate Governance
Financial Statements

Notes to the Parent Company Financial Statements continued
(b) Fair values The fair value of financial assets and liabilities, together with the carrying amounts shown in the balance sheet, other than those with carrying amounts that are a reasonable approximation of their fair values are as follows:
As at 31 December
Carrying Amount Fair Value
2013 US$ thousands
2012 US$ thousands
2013 US$ thousands
2012 US$ thousands
Financial assets:
Derivative financial instruments 2,039 2,842 2,039 2,842
Loans to related parties 364,118 165,614 364,1182 165,614
Available-for-sale financial assets 63,245 127,442 63,245 127,442
Financial liabilities:
Interest-bearing loans 795,306 – 780,9201 –
Loans from related parties 323,409 311,256 323,4092 311,256
Derivative financial instruments 848 1,128 848 1,128
1 Interest-bearing loans are categorised in Level 1 of the fair value hierarchy. 2 Loans with related party are categorised in Level 3 of the fair value hierarchy.
226 Fresnillo plc | Annual report 2013 www.fresnilloplc.com
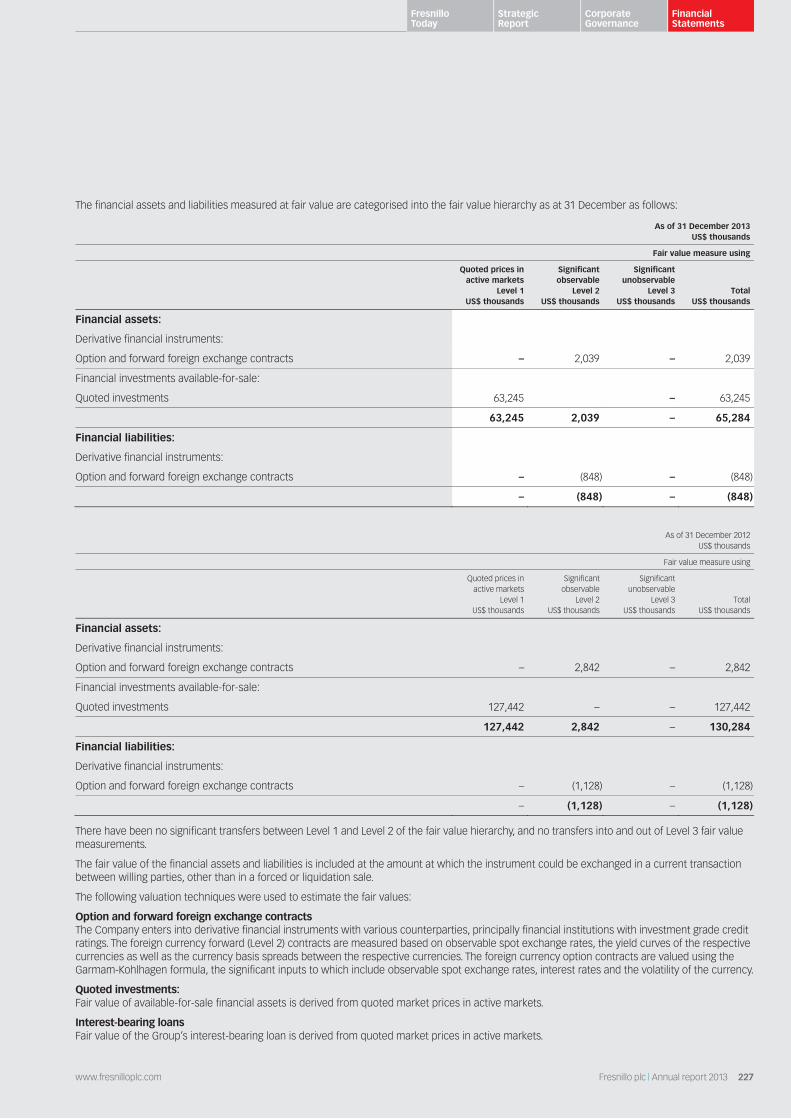
The financial assets and liabilities measured at fair value are categorised into the fair value hierarchy as at 31 December as follows:
As of 31 December 2013 US$ thousands
Fair value measure using
Quoted prices in active markets
Level 1US$ thousands
Significant observable
Level 2 US$ thousands
Significant unobservable
Level 3US$ thousands
TotalUS$ thousands
Financial assets:
Derivative financial instruments:
Option and forward foreign exchange contracts – 2,039 – 2,039
Financial investments available-for-sale:
Quoted investments 63,245 – 63,245
63,245 2,039 – 65,284
Financial liabilities:
Derivative financial instruments:
Option and forward foreign exchange contracts – (848) – (848)
– (848) – (848)
As of 31 December 2012 US$ thousands
Fair value measure using
Quoted prices in active markets
Level 1US$ thousands
Significant observable
Level 2 US$ thousands
Significant unobservable
Level 3US$ thousands
TotalUS$ thousands
Financial assets:
Derivative financial instruments:
Option and forward foreign exchange contracts – 2,842 – 2,842
Financial investments available-for-sale:
Quoted investments 127,442 – – 127,442
127,442 2,842 – 130,284
Financial liabilities:
Derivative financial instruments:
Option and forward foreign exchange contracts – (1,128) – (1,128)
– (1,128) – (1,128)
There have been no significant transfers between Level 1 and Level 2 of the fair value hierarchy, and no transfers into and out of Level 3 fair value measurements.
The fair value of the financial assets and liabilities is included at the amount at which the instrument could be exchanged in a current transaction between willing parties, other than in a forced or liquidation sale.
The following valuation techniques were used to estimate the fair values:
Option and forward foreign exchange contracts The Company enters into derivative financial instruments with various counterparties, principally financial institutions with investment grade credit ratings. The foreign currency forward (Level 2) contracts are measured based on observable spot exchange rates, the yield curves of the respective currencies as well as the currency basis spreads between the respective currencies. The foreign currency option contracts are valued using the Garmam-Kohlhagen formula, the significant inputs to which include observable spot exchange rates, interest rates and the volatility of the currency.
Quoted investments: Fair value of available-for-sale financial assets is derived from quoted market prices in active markets.
Interest-bearing loans Fair value of the Group’s interest-bearing loan is derived from quoted market prices in active markets.
227www.fresnilloplc.com Fresnillo plc | Annual report 2013
Fresnillo Today
Strategic Report
Corporate Governance
Financial Statements
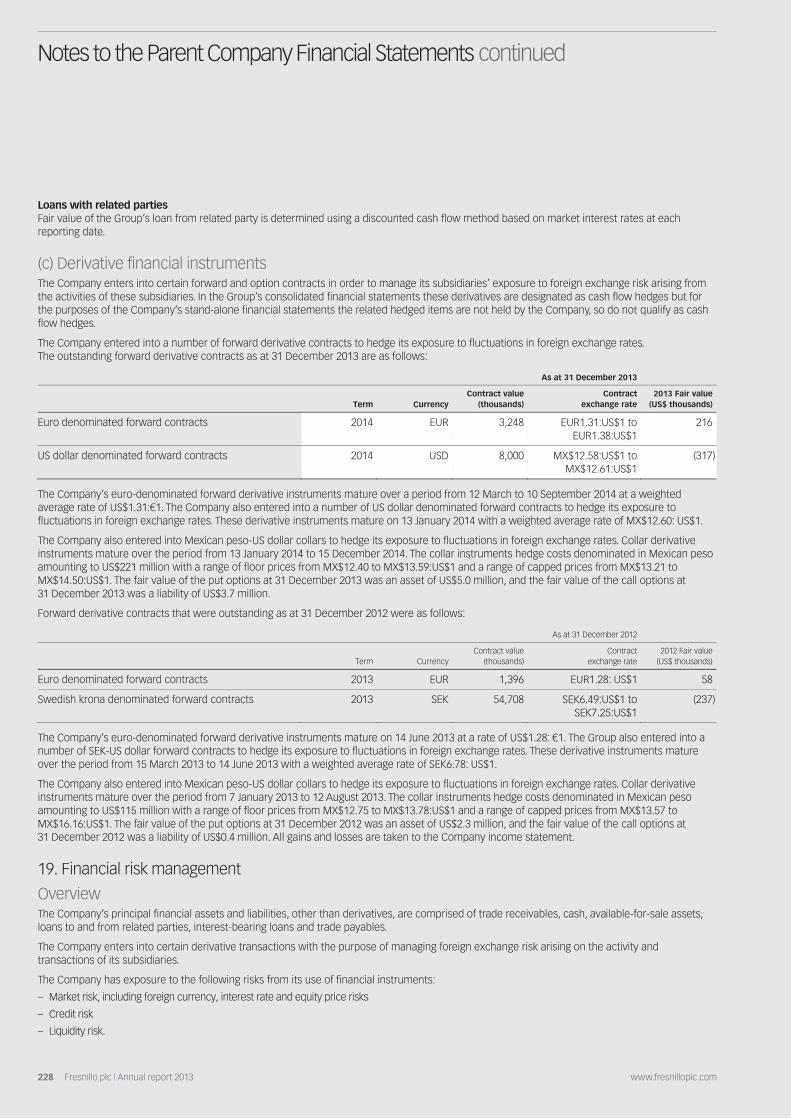
Notes to the Parent Company Financial Statements continued
Loans with related parties Fair value of the Group’s loan from related party is determined using a discounted cash flow method based on market interest rates at each reporting date.
(c) Derivative financial instruments The Company enters into certain forward and option contracts in order to manage its subsidiaries’ exposure to foreign exchange risk arising from the activities of these subsidiaries. In the Group’s consolidated financial statements these derivatives are designated as cash flow hedges but for the purposes of the Company’s stand-alone financial statements the related hedged items are not held by the Company, so do not qualify as cash flow hedges.
The Company entered into a number of forward derivative contracts to hedge its exposure to fluctuations in foreign exchange rates. The outstanding forward derivative contracts as at 31 December 2013 are as follows:
As at 31 December 2013
Term CurrencyContract value
(thousands)Contract
exchange rate 2013 Fair value
(US$ thousands)
Euro denominated forward contracts 2014 EUR 3,248 EUR1.31:US$1 to EUR1.38:US$1
216
US dollar denominated forward contracts 2014 USD 8,000 MX$12.58:US$1 to MX$12.61:US$1
(317)
The Company’s euro-denominated forward derivative instruments mature over a period from 12 March to 10 September 2014 at a weighted average rate of US$1.31:€1. The Company also entered into a number of US dollar denominated forward contracts to hedge its exposure to fluctuations in foreign exchange rates. These derivative instruments mature on 13 January 2014 with a weighted average rate of MX$12.60: US$1.
The Company also entered into Mexican peso-US dollar collars to hedge its exposure to fluctuations in foreign exchange rates. Collar derivative instruments mature over the period from 13 January 2014 to 15 December 2014. The collar instruments hedge costs denominated in Mexican peso amounting to US$221 million with a range of floor prices from MX$12.40 to MX$13.59:US$1 and a range of capped prices from MX$13.21 to MX$14.50:US$1. The fair value of the put options at 31 December 2013 was an asset of US$5.0 million, and the fair value of the call options at 31 December 2013 was a liability of US$3.7 million.
Forward derivative contracts that were outstanding as at 31 December 2012 were as follows:
As at 31 December 2012
Term CurrencyContract value
(thousands)Contract
exchange rate 2012 Fair value
(US$ thousands)
Euro denominated forward contracts 2013 EUR 1,396 EUR1.28: US$1 58
Swedish krona denominated forward contracts 2013 SEK 54,708 SEK6.49:US$1 to SEK7.25:US$1
(237)
The Company’s euro-denominated forward derivative instruments mature on 14 June 2013 at a rate of US$1.28: €1. The Group also entered into a number of SEK-US dollar forward contracts to hedge its exposure to fluctuations in foreign exchange rates. These derivative instruments mature over the period from 15 March 2013 to 14 June 2013 with a weighted average rate of SEK6.78: US$1.
The Company also entered into Mexican peso-US dollar collars to hedge its exposure to fluctuations in foreign exchange rates. Collar derivative instruments mature over the period from 7 January 2013 to 12 August 2013. The collar instruments hedge costs denominated in Mexican peso amounting to US$115 million with a range of floor prices from MX$12.75 to MX$13.78:US$1 and a range of capped prices from MX$13.57 to MX$16.16:US$1. The fair value of the put options at 31 December 2012 was an asset of US$2.3 million, and the fair value of the call options at 31 December 2012 was a liability of US$0.4 million. All gains and losses are taken to the Company income statement.
19. Financial risk management
Overview The Company’s principal financial assets and liabilities, other than derivatives, are comprised of trade receivables, cash, available-for-sale assets, loans to and from related parties, interest-bearing loans and trade payables.
The Company enters into certain derivative transactions with the purpose of managing foreign exchange risk arising on the activity and transactions of its subsidiaries.
The Company has exposure to the following risks from its use of financial instruments:
– Market risk, including foreign currency, interest rate and equity price risks
– Credit risk
– Liquidity risk.
228 Fresnillo plc | Annual report 2013 www.fresnilloplc.com
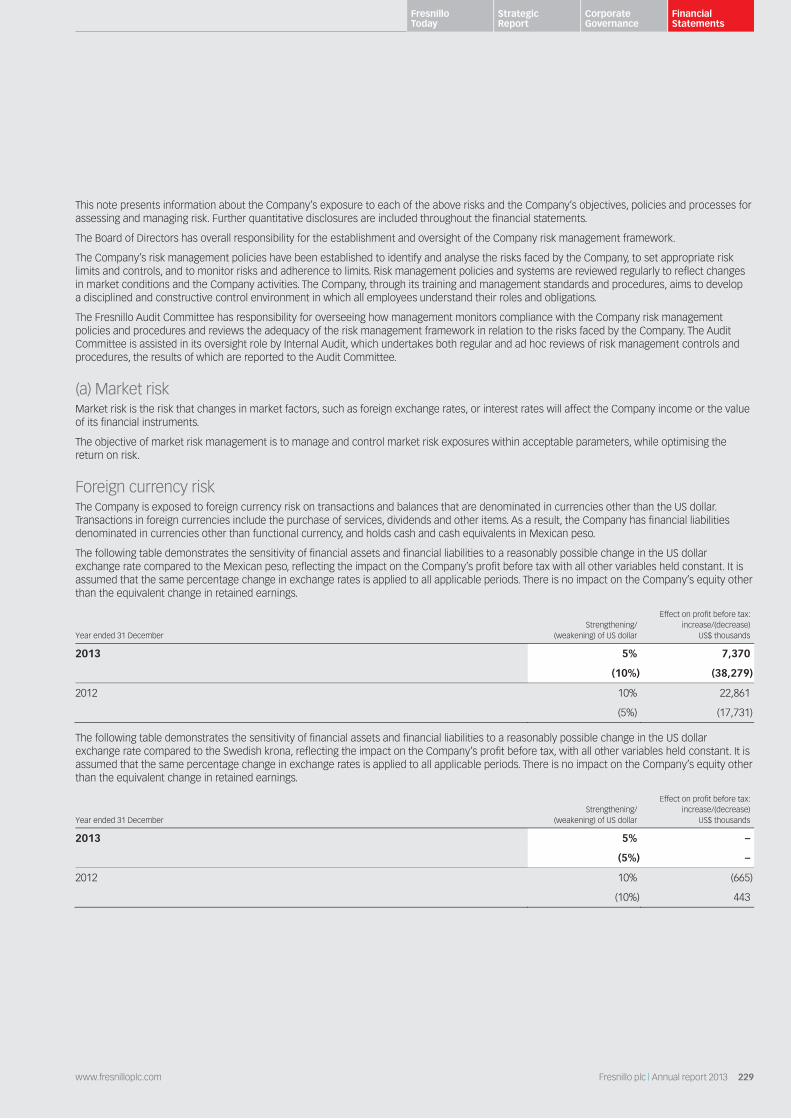
This note presents information about the Company’s exposure to each of the above risks and the Company’s objectives, policies and processes for assessing and managing risk. Further quantitative disclosures are included throughout the financial statements.
The Board of Directors has overall responsibility for the establishment and oversight of the Company risk management framework.
The Company’s risk management policies have been established to identify and analyse the risks faced by the Company, to set appropriate risk limits and controls, and to monitor risks and adherence to limits. Risk management policies and systems are reviewed regularly to reflect changes in market conditions and the Company activities. The Company, through its training and management standards and procedures, aims to develop a disciplined and constructive control environment in which all employees understand their roles and obligations.
The Fresnillo Audit Committee has responsibility for overseeing how management monitors compliance with the Company risk management policies and procedures and reviews the adequacy of the risk management framework in relation to the risks faced by the Company. The Audit Committee is assisted in its oversight role by Internal Audit, which undertakes both regular and ad hoc reviews of risk management controls and procedures, the results of which are reported to the Audit Committee.
(a) Market risk Market risk is the risk that changes in market factors, such as foreign exchange rates, or interest rates will affect the Company income or the value of its financial instruments.
The objective of market risk management is to manage and control market risk exposures within acceptable parameters, while optimising the return on risk.
Foreign currency risk The Company is exposed to foreign currency risk on transactions and balances that are denominated in currencies other than the US dollar. Transactions in foreign currencies include the purchase of services, dividends and other items. As a result, the Company has financial liabilities denominated in currencies other than functional currency, and holds cash and cash equivalents in Mexican peso.
The following table demonstrates the sensitivity of financial assets and financial liabilities to a reasonably possible change in the US dollar exchange rate compared to the Mexican peso, reflecting the impact on the Company’s profit before tax with all other variables held constant. It is assumed that the same percentage change in exchange rates is applied to all applicable periods. There is no impact on the Company’s equity other than the equivalent change in retained earnings.
Year ended 31 December Strengthening/
(weakening) of US dollar
Effect on profit before tax: increase/(decrease)
US$ thousands
2013 5% 7,370
(10%) (38,279)
2012 10% 22,861
(5%) (17,731)
The following table demonstrates the sensitivity of financial assets and financial liabilities to a reasonably possible change in the US dollar exchange rate compared to the Swedish krona, reflecting the impact on the Company’s profit before tax, with all other variables held constant. It is assumed that the same percentage change in exchange rates is applied to all applicable periods. There is no impact on the Company’s equity other than the equivalent change in retained earnings.
Year ended 31 December Strengthening/
(weakening) of US dollar
Effect on profit before tax: increase/(decrease)
US$ thousands
2013 5% –
(5%) –
2012 10% (665)
(10%) 443
229www.fresnilloplc.com Fresnillo plc | Annual report 2013
Fresnillo Today
Strategic Report
Corporate Governance
Financial Statements
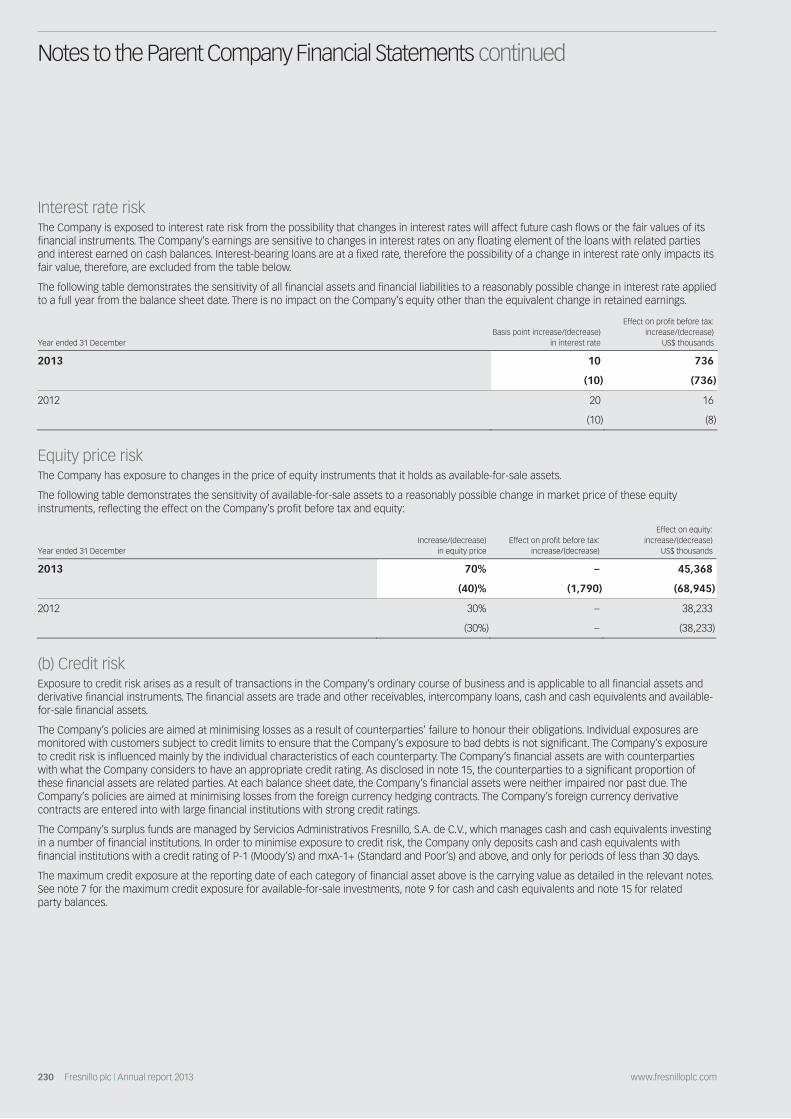
Notes to the Parent Company Financial Statements continued
Interest rate risk The Company is exposed to interest rate risk from the possibility that changes in interest rates will affect future cash flows or the fair values of its financial instruments. The Company’s earnings are sensitive to changes in interest rates on any floating element of the loans with related parties and interest earned on cash balances. Interest-bearing loans are at a fixed rate, therefore the possibility of a change in interest rate only impacts its fair value, therefore, are excluded from the table below.
The following table demonstrates the sensitivity of all financial assets and financial liabilities to a reasonably possible change in interest rate applied to a full year from the balance sheet date. There is no impact on the Company’s equity other than the equivalent change in retained earnings.
Year ended 31 December Basis point increase/(decrease)
in interest rate
Effect on profit before tax: increase/(decrease)
US$ thousands
2013 10 736
(10) (736)
2012 20 16
(10) (8)
Equity price risk The Company has exposure to changes in the price of equity instruments that it holds as available-for-sale assets.
The following table demonstrates the sensitivity of available-for-sale assets to a reasonably possible change in market price of these equity instruments, reflecting the effect on the Company’s profit before tax and equity:
Year ended 31 December Increase/(decrease)
in equity priceEffect on profit before tax:
increase/(decrease)
Effect on equity: increase/(decrease)
US$ thousands
2013 70% – 45,368
(40)% (1,790) (68,945)
2012 30% – 38,233
(30%) – (38,233)
(b) Credit risk Exposure to credit risk arises as a result of transactions in the Company’s ordinary course of business and is applicable to all financial assets and derivative financial instruments. The financial assets are trade and other receivables, intercompany loans, cash and cash equivalents and available-for-sale financial assets.
The Company’s policies are aimed at minimising losses as a result of counterparties’ failure to honour their obligations. Individual exposures are monitored with customers subject to credit limits to ensure that the Company’s exposure to bad debts is not significant. The Company’s exposure to credit risk is influenced mainly by the individual characteristics of each counterparty. The Company’s financial assets are with counterparties with what the Company considers to have an appropriate credit rating. As disclosed in note 15, the counterparties to a significant proportion of these financial assets are related parties. At each balance sheet date, the Company’s financial assets were neither impaired nor past due. The Company’s policies are aimed at minimising losses from the foreign currency hedging contracts. The Company’s foreign currency derivative contracts are entered into with large financial institutions with strong credit ratings.
The Company’s surplus funds are managed by Servicios Administrativos Fresnillo, S.A. de C.V., which manages cash and cash equivalents investing in a number of financial institutions. In order to minimise exposure to credit risk, the Company only deposits cash and cash equivalents with financial institutions with a credit rating of P-1 (Moody’s) and mxA-1+ (Standard and Poor’s) and above, and only for periods of less than 30 days.
The maximum credit exposure at the reporting date of each category of financial asset above is the carrying value as detailed in the relevant notes. See note 7 for the maximum credit exposure for available-for-sale investments, note 9 for cash and cash equivalents and note 15 for related party balances.
230 Fresnillo plc | Annual report 2013 www.fresnilloplc.com
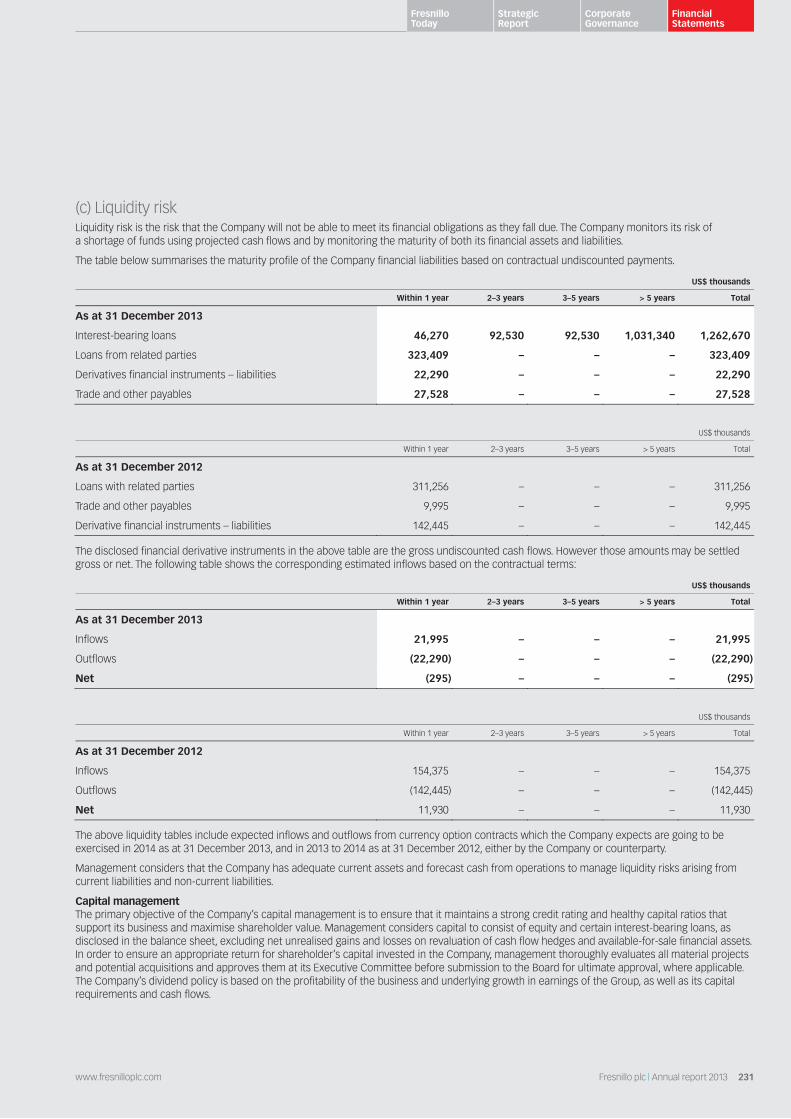
(c) Liquidity risk Liquidity risk is the risk that the Company will not be able to meet its financial obligations as they fall due. The Company monitors its risk of a shortage of funds using projected cash flows and by monitoring the maturity of both its financial assets and liabilities.
The table below summarises the maturity profile of the Company financial liabilities based on contractual undiscounted payments.
US$ thousands
Within 1 year 2–3 years 3–5 years > 5 years Total
As at 31 December 2013
Interest-bearing loans 46,270 92,530 92,530 1,031,340 1,262,670
Loans from related parties 323,409 – – – 323,409
Derivatives financial instruments – liabilities 22,290 – – – 22,290
Trade and other payables 27,528 – – – 27,528
US$ thousands
Within 1 year 2–3 years 3–5 years > 5 years Total
As at 31 December 2012
Loans with related parties 311,256 – – – 311,256
Trade and other payables 9,995 – – – 9,995
Derivative financial instruments – liabilities 142,445 – – – 142,445
The disclosed financial derivative instruments in the above table are the gross undiscounted cash flows. However those amounts may be settled gross or net. The following table shows the corresponding estimated inflows based on the contractual terms:
US$ thousands
Within 1 year 2–3 years 3–5 years > 5 years Total
As at 31 December 2013
Inflows 21,995 – – – 21,995
Outflows (22,290) – – – (22,290)
Net (295) – – – (295)
US$ thousands
Within 1 year 2–3 years 3–5 years > 5 years Total
As at 31 December 2012
Inflows 154,375 – – – 154,375
Outflows (142,445) – – – (142,445)
Net 11,930 – – – 11,930
The above liquidity tables include expected inflows and outflows from currency option contracts which the Company expects are going to be exercised in 2014 as at 31 December 2013, and in 2013 to 2014 as at 31 December 2012, either by the Company or counterparty.
Management considers that the Company has adequate current assets and forecast cash from operations to manage liquidity risks arising from current liabilities and non-current liabilities.
Capital management The primary objective of the Company’s capital management is to ensure that it maintains a strong credit rating and healthy capital ratios that support its business and maximise shareholder value. Management considers capital to consist of equity and certain interest-bearing loans, as disclosed in the balance sheet, excluding net unrealised gains and losses on revaluation of cash flow hedges and available-for-sale financial assets. In order to ensure an appropriate return for shareholder’s capital invested in the Company, management thoroughly evaluates all material projects and potential acquisitions and approves them at its Executive Committee before submission to the Board for ultimate approval, where applicable. The Company’s dividend policy is based on the profitability of the business and underlying growth in earnings of the Group, as well as its capital requirements and cash flows.
231www.fresnilloplc.com Fresnillo plc | Annual report 2013
Fresnillo Today
Strategic Report
Corporate Governance
Financial Statements
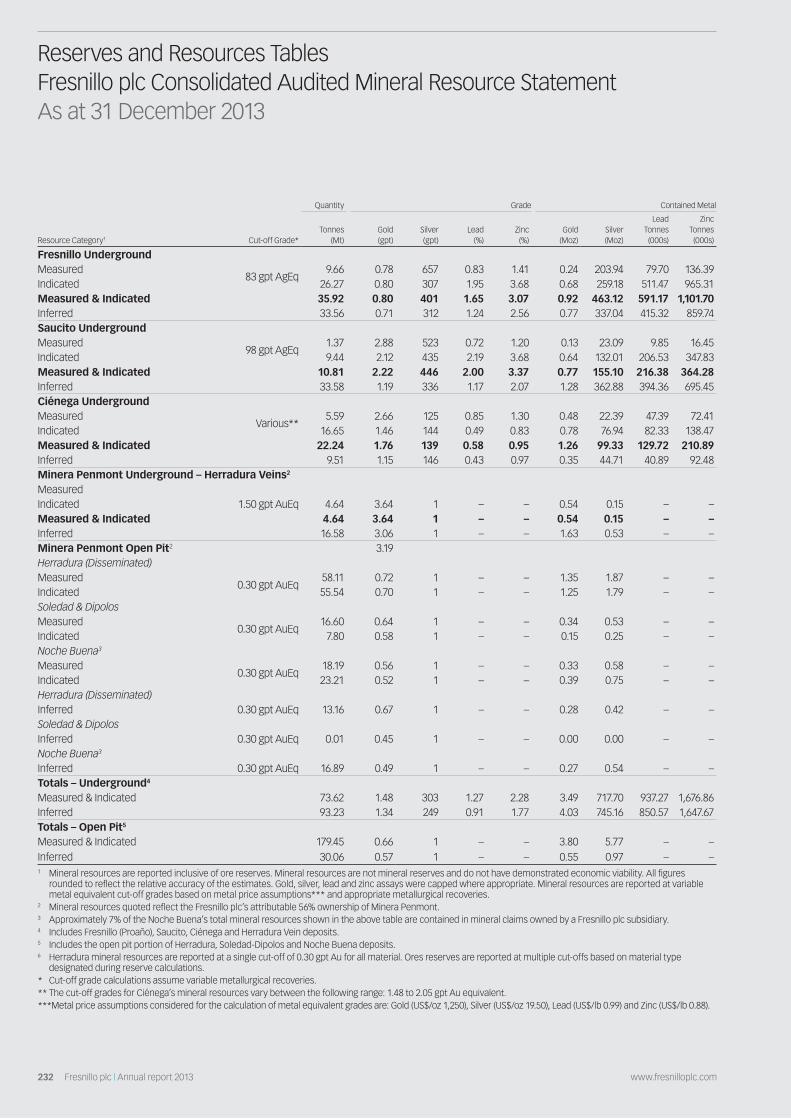
232 Fresnillo plc | Annual report 2013 www.fresnilloplc.com
Reserves and Resources Tables Fresnillo plc Consolidated Audited Mineral Resource StatementAs at 31 December 2013
Quantity Grade Contained Metal
Resource Category1 Cut-off Grade*Tonnes
(Mt)Gold(gpt)
Silver(gpt)
Lead(%)
Zinc(%)
Gold(Moz)
Silver(Moz)
LeadTonnes(000s)
ZincTonnes(000s)
Fresnillo UndergroundMeasured
83 gpt AgEq9.66 0.78 657 0.83 1.41 0.24 203.94 79.70 136.39
Indicated 26.27 0.80 307 1.95 3.68 0.68 259.18 511.47 965.31Measured & Indicated 35.92 0.80 401 1.65 3.07 0.92 463.12 591.17 1,101.70Inferred 33.56 0.71 312 1.24 2.56 0.77 337.04 415.32 859.74Saucito UndergroundMeasured
98 gpt AgEq1.37 2.88 523 0.72 1.20 0.13 23.09 9.85 16.45
Indicated 9.44 2.12 435 2.19 3.68 0.64 132.01 206.53 347.83Measured & Indicated 10.81 2.22 446 2.00 3.37 0.77 155.10 216.38 364.28Inferred 33.58 1.19 336 1.17 2.07 1.28 362.88 394.36 695.45Ciénega UndergroundMeasured
Various**5.59 2.66 125 0.85 1.30 0.48 22.39 47.39 72.41
Indicated 16.65 1.46 144 0.49 0.83 0.78 76.94 82.33 138.47Measured & Indicated 22.24 1.76 139 0.58 0.95 1.26 99.33 129.72 210.89Inferred 9.51 1.15 146 0.43 0.97 0.35 44.71 40.89 92.48Minera Penmont Underground – Herradura Veins2
MeasuredIndicated 1.50 gpt AuEq 4.64 3.64 1 – – 0.54 0.15 – –Measured & Indicated 4.64 3.64 1 – – 0.54 0.15 – –Inferred 16.58 3.06 1 – – 1.63 0.53 – –Minera Penmont Open Pit2 3.19Herradura (Disseminated)Measured
0.30 gpt AuEq58.11 0.72 1 – – 1.35 1.87 – –
Indicated 55.54 0.70 1 – – 1.25 1.79 – –Soledad & DipolosMeasured
0.30 gpt AuEq16.60 0.64 1 – – 0.34 0.53 – –
Indicated 7.80 0.58 1 – – 0.15 0.25 – –Noche Buena3
Measured0.30 gpt AuEq
18.19 0.56 1 – – 0.33 0.58 – –Indicated 23.21 0.52 1 – – 0.39 0.75 – –Herradura (Disseminated)Inferred 0.30 gpt AuEq 13.16 0.67 1 – – 0.28 0.42 – –Soledad & DipolosInferred 0.30 gpt AuEq 0.01 0.45 1 – – 0.00 0.00 – –Noche Buena3
Inferred 0.30 gpt AuEq 16.89 0.49 1 – – 0.27 0.54 – –Totals – Underground4
Measured & Indicated 73.62 1.48 303 1.27 2.28 3.49 717.70 937.27 1,676.86Inferred 93.23 1.34 249 0.91 1.77 4.03 745.16 850.57 1,647.67Totals – Open Pit5
Measured & Indicated 179.45 0.66 1 – – 3.80 5.77 – –Inferred 30.06 0.57 1 – – 0.55 0.97 – –1 Mineral resources are reported inclusive of ore reserves. Mineral resources are not mineral reserves and do not have demonstrated economic viability. All figures
rounded to reflect the relative accuracy of the estimates. Gold, silver, lead and zinc assays were capped where appropriate. Mineral resources are reported at variable metal equivalent cut-off grades based on metal price assumptions*** and appropriate metallurgical recoveries.
2 Mineral resources quoted reflect the Fresnillo plc’s attributable 56% ownership of Minera Penmont.3 Approximately 7% of the Noche Buena’s total mineral resources shown in the above table are contained in mineral claims owned by a Fresnillo plc subsidiary.4 Includes Fresnillo (Proaño), Saucito, Ciénega and Herradura Vein deposits.5 Includes the open pit portion of Herradura, Soledad-Dipolos and Noche Buena deposits.6 Herradura mineral resources are reported at a single cut-off of 0.30 gpt Au for all material. Ores reserves are reported at multiple cut-offs based on material type
designated during reserve calculations.* Cut-off grade calculations assume variable metallurgical recoveries. ** The cut-off grades for Ciénega’s mineral resources vary between the following range: 1.48 to 2.05 gpt Au equivalent.*** Metal price assumptions considered for the calculation of metal equivalent grades are: Gold (US$/oz 1,250), Silver (US$/oz 19.50), Lead (US$/lb 0.99) and Zinc (US$/lb 0.88).
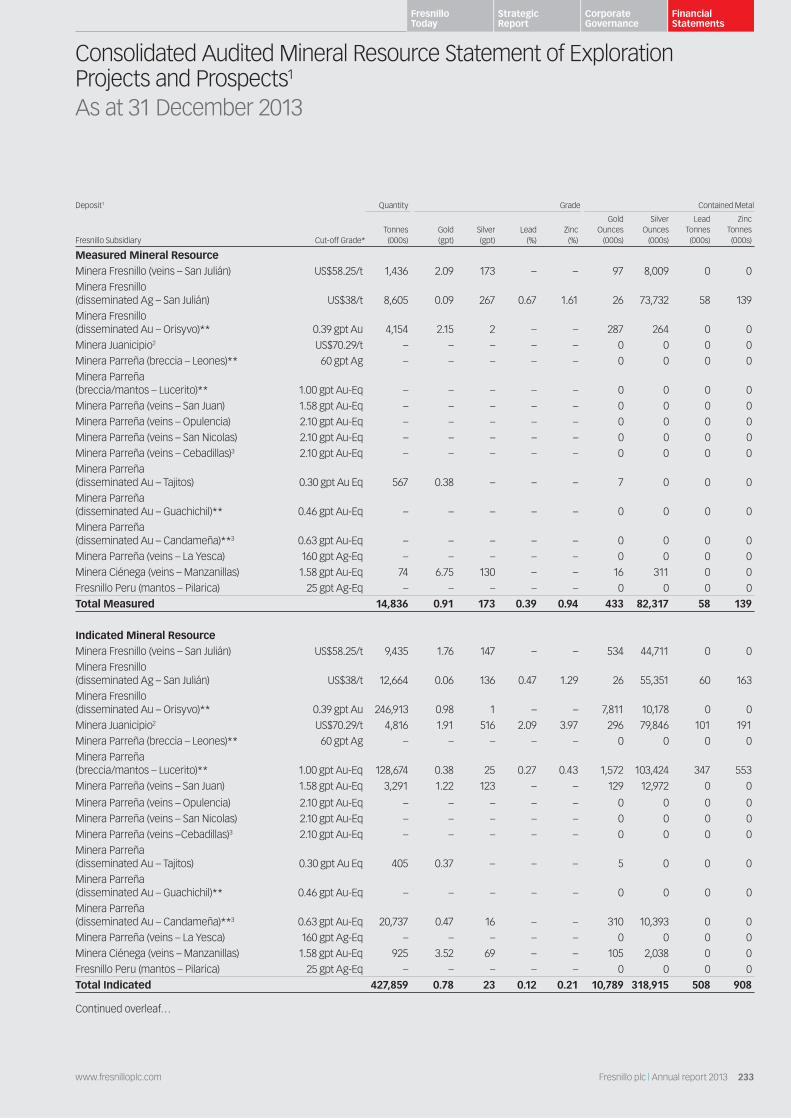
233www.fresnilloplc.com Fresnillo plc | Annual report 2013
Fresnillo Today
Strategic Report
Corporate Governance
Financial Statements
Consolidated Audited Mineral Resource Statement of Exploration Projects and Prospects1
As at 31 December 2013
Deposit1 Quantity Grade Contained Metal
Fresnillo Subsidiary Cut-off Grade*Tonnes(000s)
Gold(gpt)
Silver(gpt)
Lead(%)
Zinc(%)
GoldOunces
(000s)
SilverOunces
(000s)
Lead Tonnes(000s)
Zinc Tonnes(000s)
Measured Mineral ResourceMinera Fresnillo (veins – San Julián) US$58.25/t 1,436 2.09 173 – – 97 8,009 0 0
Minera Fresnillo (disseminated Ag – San Julián) US$38/t 8,605 0.09 267 0.67 1.61 26 73,732 58 139
Minera Fresnillo (disseminated Au – Orisyvo)** 0.39 gpt Au 4,154 2.15 2 – – 287 264 0 0
Minera Juanicipio2 US$70.29/t – – – – – 0 0 0 0
Minera Parreña (breccia – Leones)** 60 gpt Ag – – – – – 0 0 0 0
Minera Parreña (breccia/mantos – Lucerito)** 1.00 gpt Au-Eq – – – – – 0 0 0 0
Minera Parreña (veins – San Juan) 1.58 gpt Au-Eq – – – – – 0 0 0 0
Minera Parreña (veins – Opulencia) 2.10 gpt Au-Eq – – – – – 0 0 0 0
Minera Parreña (veins – San Nicolas) 2.10 gpt Au-Eq – – – – – 0 0 0 0
Minera Parreña (veins – Cebadillas)3 2.10 gpt Au-Eq – – – – – 0 0 0 0
Minera Parreña (disseminated Au – Tajitos) 0.30 gpt Au Eq 567 0.38 – – – 7 0 0 0
Minera Parreña (disseminated Au – Guachichil)** 0.46 gpt Au-Eq – – – – – 0 0 0 0
Minera Parreña (disseminated Au – Candameña)**3 0.63 gpt Au-Eq – – – – – 0 0 0 0
Minera Parreña (veins – La Yesca) 160 gpt Ag-Eq – – – – – 0 0 0 0
Minera Ciénega (veins – Manzanillas) 1.58 gpt Au-Eq 74 6.75 130 – – 16 311 0 0
Fresnillo Peru (mantos – Pilarica) 25 gpt Ag-Eq – – – – – 0 0 0 0
Total Measured 14,836 0.91 173 0.39 0.94 433 82,317 58 139
Indicated Mineral Resource Minera Fresnillo (veins – San Julián) US$58.25/t 9,435 1.76 147 – – 534 44,711 0 0
Minera Fresnillo (disseminated Ag – San Julián) US$38/t 12,664 0.06 136 0.47 1.29 26 55,351 60 163
Minera Fresnillo (disseminated Au – Orisyvo)** 0.39 gpt Au 246,913 0.98 1 – – 7,811 10,178 0 0
Minera Juanicipio2 US$70.29/t 4,816 1.91 516 2.09 3.97 296 79,846 101 191
Minera Parreña (breccia – Leones)** 60 gpt Ag – – – – – 0 0 0 0
Minera Parreña (breccia/mantos – Lucerito)** 1.00 gpt Au-Eq 128,674 0.38 25 0.27 0.43 1,572 103,424 347 553
Minera Parreña (veins – San Juan) 1.58 gpt Au-Eq 3,291 1.22 123 – – 129 12,972 0 0
Minera Parreña (veins – Opulencia) 2.10 gpt Au-Eq – – – – – 0 0 0 0
Minera Parreña (veins – San Nicolas) 2.10 gpt Au-Eq – – – – – 0 0 0 0
Minera Parreña (veins –Cebadillas)3 2.10 gpt Au-Eq – – – – – 0 0 0 0
Minera Parreña (disseminated Au – Tajitos) 0.30 gpt Au Eq 405 0.37 – – – 5 0 0 0
Minera Parreña (disseminated Au – Guachichil)** 0.46 gpt Au-Eq – – – – – 0 0 0 0
Minera Parreña (disseminated Au – Candameña)**3 0.63 gpt Au-Eq 20,737 0.47 16 – – 310 10,393 0 0
Minera Parreña (veins – La Yesca) 160 gpt Ag-Eq – – – – – 0 0 0 0
Minera Ciénega (veins – Manzanillas) 1.58 gpt Au-Eq 925 3.52 69 – – 105 2,038 0 0
Fresnillo Peru (mantos – Pilarica) 25 gpt Ag-Eq – – – – – 0 0 0 0
Total Indicated 427,859 0.78 23 0.12 0.21 10,789 318,915 508 908
Continued overleaf…

234 Fresnillo plc | Annual report 2013 www.fresnilloplc.com
Consolidated Audited Mineral Resource Statement of Exploration Projects and Prospects1 continued
Deposit1 Quantity Grade Contained Metal
Cut-off Grade*Tonnes(000s)
Gold(gpt)
Silver(gpt)
Lead(%)
Zinc(%)
GoldOunces
(000s)
SilverOunces
(000s)
Lead Tonnes(000s)
Zink Tonnes(000s)
Inferred Mineral Resource 70,405 0.79 1 – –
Minera Fresnillo (veins – San Julián) US$58.25/t 4,239 1.54 139 – – 210 18,979 0 0
Minera Fresnillo (disseminated Ag – San Julián) US$38/t 30 0.05 46 0.09 2.10 0 44 0 1
Minera Fresnillo (disseminated Au – Orisyvo)** 0.39 gpt Au 70,405 0.79 1 – – 1,794 3,017 0 0
Minera Juanicipio2 US$70.29/t 3,205 1.52 343 1.66 2.76 156 35,371 53 89
Minera Parreña (breccia – Leones) ** 60 gpt Ag 7,049 0.01 113 1.46 1.27 1 25,509 103 90
Minera Parreña (breccia/mantos – Lucerito)** 1.00 gpt Au-Eq 34,042 0.43 37 0.21 0.35 471 40,496 71 119
Minera Parreña (veins – San Juan) 1.58 gpt Au-Eq 5,988 1.44 104 – – 278 20,067 0 0
Minera Parreña (veins – Opulencia) 2.10 gpt Au-Eq 2,419 2.37 159 – – 184 12,333 0 0
Minera Parreña (veins – San Nicolas) 2.10 gpt Au-Eq 2,039 1.61 229 – – 106 15,044 0 0
Minera Parreña (veins – Cebadillas)3 2.10 gpt Au-Eq 2,054 2.55 64 – – 168 4,253 0 0
Minera Parreña (disseminated Au – Tajitos) 0.30 gpt Au Eq 13,298 0.44 – – – 188 0 0 0
Minera Parreña (disseminated Au – Guachichil)** 0.46 gpt Au-Eq 44,250 0.68 10 0.11 0.17 967 14,749 49 75
Minera Parreña (disseminated Au – Candameña)**3 0.63 gpt Au-Eq 42,765 0.55 22 – – 756 30,091 0 0
Minera Parreña (veins – La Yesca) 160 gpt Ag-Eq 1,004 0.78 145 – – 25 4,678
Minera Ciénega (veins – Manzanillas) 1.58 gpt Au-Eq 326 2.01 46 – – 21 483 0 0
Fresnillo Peru (mantos – Pilarica) 25 gpt Ag-Eq 10,828 111 0.31 0.50 0 38,530 34 54
Total Inferred 243,942 0.68 34 0.13 0.17 5,325 263,643 310 4271 Mineral resources are not mineral reserves and do not have demonstrated economic viability. All figures rounded to reflect the relative accuracy of the estimates.
Metal assays were capped where appropriate. Mineral resources are reported at variable metal, metal equivalent, or NRS cut-off grades assuming reasonable metal recovery. Orisyvo, Lucerito, Candameña and Guachichil mineral resources are reported inside a conceptual pit shell based on appropriate mining and processing costs and metal recoveries for oxide and sulphide material. Equivalent metal grades are based on US$1,250 per ounce of gold, US$19.50 per ounce of silver, US$0.88 per pound of zinc and US$ 0.99 per pound of lead.
2 Portions of the Valdecañas deposit within the Minera Juanicipio property where Fresnillo plc holds a 56% interest. Mineral resources quoted reflect Fresnillo plc’s attributable 56% ownership.
3 Minera Parreña is carrying out exploration activities in these projects under option agreements with third parties. Minera Parreña has the right to purchase 100% of these projects.
* Cut-off grade calculations assume variable metallurgical recoveries.** Mineral resources statement prepared independently by SRK CA.

235www.fresnilloplc.com Fresnillo plc | Annual report 2013
Fresnillo Today
Strategic Report
Corporate Governance
Financial Statements
Consolidated Audited Ore Reserve Statement1
As at 31 December 2013
Quantity Grade Contained Metal
Deposit Cut-off Grade*Tonnes(000s)
Gold(gpt)
Silver(gpt)
Lead(%)
Zinc(%)
GoldOunces
(000s)
SilverOunces
(000s)Lead Tonnes
(000s)Zink Tonnes
(000s)
FresnilloProven 125 gpt AgEq. 6.30 0.46 340 0.48 0.80 0.09 68.75 30.23 50.38
Probable 25.53 0.70 254 1.71 3.23 0.57 208.81 436.58 824.65
Proven and Probable 31.83 0.65 271 1.47 2.75 0.67 277.55 466.81 875.03
SaucitoProven 145 gpt AgEq 1.43 1.63 312 0.40 0.68 0.07 14.36 5.72 9.73
Probable 8.99 1.83 395 1.96 3.27 0.53 114.17 176.16 293.91
Proven and Probable 10.42 1.80 384 1.75 2.91 0.60 128.53 181.89 303.64
CiénegaProved – Total Ciénega Multiple** 3.94 2.10 126 0.64 0.98 0.27 15.91 25.26 38.66
Probable – Total Ciénega 10.77 1.57 149 0.52 0.84 0.54 51.46 55.51 90.40
Proven and Probable – Total Ciénega 14.71 1.71 142 0.55 0.88 0.81 67.38 80.77 129.05
Minera Penmont2
Herradura (Disseminated)Proven Multiple** 32.24 0.80 1 – – 0.83 1.04 – –
Probable 27.06 0.79 1 – – 0.69 0.87 – –
Soledad & DipolosProven 0.30 gpt AuEq 13.93 0.67 1 – – 0.30 0.45 – –
Probable 7.20 0.59 1 – – 0.14 0.23 – –
Noche Buena3
Proven 0.30 gpt AuEq 16.10 0.56 1 – – 0.29 0.52 – –
Probable 19.70 0.53 1 – – 0.34 0.63 – –
Total Proven and Probable for Minera Penmonth Open Pit 116.23 0.69 1 – – 2.58 3.74 – –
Totals – Underground4
Proven various 11.67 1.16 264 0.52 0.85 0.43 99.02 61.21 98.76
Probable 45.29 1.13 257 1.48 2.67 1.65 374.44 668.25 1,208.95
Proven and Probable 56.96 1.14 259 1.28 2.30 2.08 473.45 729.46 1,307.72
Totals – Open Pit5
Proven various 62.27 0.71 1 – – 1.42 2.00 – –
Probable 53.96 0.67 1 – – 1.16 1.73 – –
Proven and Probable 116.23 0.69 1 – – 2.58 3.74 – –1 All figures rounded to reflect the relative accuracy of the estimates. Ore reserves are reported at variable metal equivalent cut-off grades based on metal price
assumptions*** and appropriate metallurgical recoveries. For the Minera Penmont ore reserves, silver grades and contained metal are based on metallurgical production data and have not been estimated.
2 Ore reserves quoted reflect the Fresnillo plc’s attributable 56% ownership of Minera Penmont.3 Approximately 4.6% of the Noche Buena’s reserve shown in the above table are contained in mineral claims owned by a wholly owned Fresnillo plc subsidiary.4 Includes Fresnillo (Proaño), Saucito, Ciénega and Herradura Vein deposits.5 Includes the open pit portion of Herradura, Soledad-Dipolos and Noche Buena deposits.* Cut-off grade calculations assume variable metallurgical recoveries.** The cut-off grades for Ciénega’s reserve vary between the following range: 2.12 to 2.94 gpt Au equivalent. The cut-off grades for Herradura are: 0.3 gpt AuEq for oxides
and 0.56 gpt AuEq for transitional and fresh ore.***Metal price assumptions considered for the calculation of metal equivalent grades are: Gold (US$/oz 1,250), Silver (US$/oz 19.50), Lead (US$/lb 0.99) and Zinc (US$/lb 0.88).

236 Fresnillo plc | Annual report 2013 www.fresnilloplc.com
Operating Statistics
Ore Processed(tonnes)
Silver(grams/tonne)
2008 2009 2010 2011 2012 2013 2008 2009 2010 2011 2012 2013
Fresnillo 2,324,575 2,471,657 2,553,991 2,584,163 2,738,307 2,703,395 494.0 486.6 474.4 395.9 327.6 285.3
Ciénega 751,143 780,881 860,513 966,812 1,112,850 1,242,168 46.2 74.5 49.4 53.3 105.2 121.6
Herradura 13,609,318 15,617,014 16,616,247 21,020,356 24,641,053 14,363,315 0.6 0.8 1.3 1.1 1.2 1.1
Saucito 0 71,170 145,148 823,339 905,027 1,181,737 0 367.2 306.0 249.9 264.9 329.6
Soledad-Dipolos 0 0 9,647,939 12,264,860 15,317,860 6,701,841 0 0 0.6 0.7 0.5 0.4
Noche Buena 0 0 0 0 8,447,301 12,283,709 0 0 0 0 0.4 0.2
Zinc Concentrate(tonnes)
Silver(grams/tonne)
2008 2009 2010 2011 2012 2013 2008 2009 2010 2011 2012 2013
Fresnillo 21,922 22,317 23,719 24,544 29,212 29,325 2,212 2,516 2,444 2,363 1,641 1,356
Ciénega 21,806 15,150 18,950 17,657 16,103 11,625 162 344 186 266 540 1,266
Herradura 0 0 0 0 0 0 0 0 0 0 0 0
Saucito 0 165 302 3,064 3,706 8,758 0 2,811 2,473 1,917 1,760 1,087
Soledad-Dipolos 0 0 0 0 0 0 0 0 0 0 0 0
Noche Buena 0 0 0 0 0 0 0 0 0 0 0 0
Lead Concentrate(tonnes)
Silver(grams/tonne)
2008 2009 2010 2011 2012 2013 2008 2009 2010 2011 2012 2013
Fresnillo 39,608 51,699 60,526 61,050 65,045 63,256 25,064 19,972 17,276 14,337 11,780 10,469
Ciénega 21,795 16,092 17,436 17,877 15,487 13,380 1,123 2,567 1,734 2,084 5,622 7,974
Herradura 0 0 0 0 0 0 0 0 0 0 0 0
Saucito 0 1,250 2,869 14,419 15,539 26,055 0 17,937 12,994 12,329 13,699 13,460
Soledad-Dipolos 0 0 0 0 0 0 0 0 0 0 0 0
Noche Buena 0 0 0 0 0 0 0 0 0 0 0 0
Doré and Other Products Product(tonnes)
Silver(grams/tonne)
2008 2009 2010 2011 2012 2013 2008 2009 2010 2011 2012 2013
Ciénega precipitates 18.8 24.6 25.1 36.5 52.2 55.7 80,665 113,635 122,745 101,662 148,731 187,928
Ciénega Gravimetric Concentrator 0 36.5 197.1 88.5 – – 0 3,192 2,150 2,069 – –
Herradura doré 13.1 17.2 21.2 24.2 18.1 18.2 419,249 469,606 502,980 474,514 374,787 474,052
Herradura slag 420.6 492.6 588.1 542.7 929.9 711.3 3,255 2,939 2,234 2,036 817 930
Soledad-Dipolos doré 0 0 5.0 7.5 4.8 2.3 0 0 174,199 208,897 226,272 292,473
Soledad-Dipolos slag 0 0 496.1 590.1 583.2 301.5 0 0 1,490 2,024 857 972
Fresnillo Concentrates from Tailings Dam 2,610.3 2,914.7 3,247.1 2,658.7 2,311.7 1,990.0 3,571.8 4,451.2 4,048.0 3,387.5 2,787.1 3,031.9
Noche Buena doré 0 0 0 0 3.3 4.8 0 0 0 0 121,837.5 261,005.1
Noche Buena slag 0 0 0 0 206.3 548.6 0 0 0 0 288.6 495.0
Metal Produced – Attributable1 Silver(ounces)
Gold(ounces)
2008 2009 2010 2011 2012 2013 2008 2009 2010 2011 2012 2013
Fresnillo 33,775,660 35,419,848 35,905,701 30,295,121 26,382,793 22,764,018 24,008 24,684 24,979 26,237 29,573 33,079
Ciénega 949,574 1,588,994 1,197,792 1,473,927 3,328,574 4,240,245 116,903 103,510 113,351 116,841 125,275 112,053
Herradura 123,656 171,303 215,686 226,626 135,802 167,431 122,730 145,510 162,984 183,528 176,146 148,155
Saucito 0 735,744 1,222,473 5,904,176 7,053,780 11,581,014 0 2,881 6,323 33,493 45,246 45,177
Soledad-Dipolos 0 0 29,086 49,777 28,513 17,429 0 0 61,358 88,767 60,104 26,480
Noche Buena 0 0 0 0 8,262 27,561 0 0 0 0 36,690 60,888
Fresnillo Total 34,848,889 37,915,889 38,570,738 37,949,626 36,937,723 38,797,698 263,640 276,584 368,995 448,866 473,035 425,831 1 Including Production from Fresnillo’s Tailings Dam.

237www.fresnilloplc.com Fresnillo plc | Annual report 2013
Fresnillo Today
Strategic Report
Corporate Governance
Financial Statements
Gold(grams/tonne)
Zinc(%)
Lead(%)
2008 2009 2010 2011 2012 2013 2008 2009 2010 2011 2012 2013 2008 2009 2010 2011 2012 2013
0.47 0.41 0.41 0.42 0.46 0.50 0.76 0.79 0.85 0.87 0.96 0.94 0.42 0.50 0.54 0.58 0.66 0.63
5.14 4.33 4.27 3.89 3.62 2.90 2.32 1.64 1.77 1.45 1.12 0.75 1.46 1.00 0.95 0.82 0.68 0.56
0.72 0.68 0.70 0.65 0.57 0.61 0 0 0 0 0 0 0 0 0 0 0 0
0 1.53 1.67 1.43 1.75 1.41 0 0.30 0.37 0.42 0.54 0.87 0 0.15 0.22 0.23 0.35 0.55
0 0 0.61 0.57 0.51 0.54 0 0 0 0 0 0 0 0 0 0 0 0
0 0 0 0 0.51 0.54 0 0 0 0 0 0 0 0 0 0 0 0
Gold(grams/tonne)
Zinc(%)
Lead(%)
2008 2009 2010 2011 2012 2013 2008 2009 2010 2011 2012 2013 2008 2009 2010 2011 2012 2013
2.9 2.7 2.5 2.7 2.6 2.7 51.5 51.6 51.5 51.4 51.2 50.9 0 0 0 0 0 0
7.9 7.1 4.7 6.2 6.5 13.6 51.5 52.5 53.4 52.8 50.7 47.0 0 0 0 0 0 0
0 0 0 0 0 0 0 0 0 0 0 0 0 0 0 0 0 0
0 7.3 12.4 14.0 12.8 5.4 0 39.7 48.8 38.2 48.3 51.5 0 0 0 0 0 0
0 0 0 0 0 0 0 0 0 0 0 0 0 0 0 0 0 0
0 0 0 0 0 0 0 0 0 0 0 0 0 0 0 0 0 0
Gold(grams/tonne)
Zinc(%)
Lead(%)
2008 2009 2010 2011 2012 2013 2008 2009 2010 2011 2012 2013 2008 2009 2010 2011 2012 2013
16.9 13.3 11.5 12.0 12.8 14.7 0 0 0 0 0 0 21.9 21.4 20.2 21.9 24.9 24.6
134.2 149.3 117.4 111.5 130.7 138.4 0 0 0 0 0 0 41.8 38.0 37.1 35.3 36.7 36.0
0 0 0 0 0 0 0 0 0 0 0 0 0 0 0 0 0 0
0 70.7 67.3 69.3 87.5 52.1 0 0 0 0 0 0 0 7.0 9.5 12.1 17.8 21.5
0 0 0 0 0 0 0 0 0 0 0 0 0 0 0 0 0 0
0 0 0 0 0 0 0 0 0 0 0 0 0 0 0 0 0 0
Gold(grams/tonne)
2008 2009 2010 2011 2012 2013
28,564 20,944 24,936 32,663 33,846 26,459
0 5,343 3,874 3,822 – –
418,800 395,547 379,778 379,755 473,042 411,210
3,147 2,613 1,699 1,851 1,314 1,035
0 0 512,231 502,909 539,249 507,822
0 0 1,676 1,949 1,295 991
5.4 6.4 6.5 6.0 6.8 9.1
0 0 0 0 542,429 516,359
0 0 0 0 1,260 1,623
Zinc(tonne)
Lead(tonne)
2008 2009 2010 2011 2012 2013 2008 2009 2010 2011 2012 2013
11,277 11,510 12,212 12,623 14,966 14,914 8,685 11,058 12,236 13,385 16,190 15,552
11,237 7,950 10,112 9,318 8,171 5,459 9,109 6,118 6,468 6,315 5,676 4,811
0 0 0 0 0 0 0 0 0 0 0 0
0 65 147 1,172 1,791 4,509 0 88 273 1,742 2,773 5,605
0 0 0 0 0 0 0 0 0 0 0 0
0 0 0 0 0 0 0 0 0 0 0 0
22,515 19,526 22,472 23,113 24,928 24,881 17,793 17,264 18,977 21,442 24,639 25,968

238 Fresnillo plc | Annual report 2013 www.fresnilloplc.com
Glossary
Adit Entrance to an underground mine which is horizontal or nearly horizontal by which the mine can be accessed, drained of water and ventilated
Backfill A mining method used to fill previously mined-out stopes (often mine waste tailings blended with cementitious binders) in order to provide regional rock support
Beneficiation plant Facility where extracted ore is reduced to particles that can be separated into mineral that is suitable for further processing or direct use
Capex Capital expenditures; expenditures not classified as operating costs
Company (see also Fresnillo plc) Fresnillo plc, a company incorporated under the UK Companies Act 1985 and registered in England and Wales with registered number 6344120
Concentrate A metal-rich product resulting from a mineral enrichment process such as gravity concentration or flotation, in which most of the desired mineral has been separated from the waste material in the ore
Diamond drilling A drilling method where the rock is cut with a diamond bit attached to hollow rods; it cuts a core of rock, recovered in cylindrical sections for geological analysis
Dilution Waste, which is unavoidably mined with ore
Disseminated deposit or ore body
A disseminated deposit is that in which the metal is evenly distributed in generally low concentrations throughout large masses of rock.
Doré An impure alloy of gold and silver, generally the final product of mining and processing; the doré bullion will be refined into high purity metal
Ejido(s) In Mexico, the communal farmland of a village, usually assigned in small parcels to villagers to be farmed under a federally supported system of communal land tenure
Exploraciones Minera Parreña, S.A. de C.V.
A wholly-owned Fresnillo plc company that controls a number of exploration prospects
Flotation A recovery process by which valuable minerals are separated from waste to produce a concentrate; selected minerals are induced to become attached to air bubbles and float
Fresnillo Group (see also Group) Fresnillo plc and its subsidiary undertakings
Fresnillo plc (see also Company) A company incorporated under the UK Companies Act 1985 and registered in England and Wales with registered number 6344120
g/t Grammes per tonne
GHG Greenhouse gases
GJ Gigajoules
Grade The measure of concentration of metal within mineralised rock
Group (see also Fresnillo Group) Fresnillo plc and its subsidiary undertakings
Haulage A horizontal underground excavation which is used to transport mined ore
Hectare A unit of area equal to 10,000 square metres, or 2.47 acres
Hoist Equipment used in underground mining to raise and lower conveyances within the mine shaft
International Cyanide Management Code
Voluntary industry and audit-based program for the gold mining industry to promote responsible management of cyanide used in gold mining
koz Thousand troy ounces
KPI Key Performance Indicator
Leaching, heap leaching or dynamic leaching
A process to extract metals from ore in which the mined ore is crushed and heaped onto an impervious pad and irrigated with a leaching agent that percolates through the heap and leaches out the metals. In dynamic leaching, the piles are continuously reclaimed after leaching has been completed and subsequently rebuilt with fresh ore
Met-Mex Met-Mex Peñoles, S.A. de C.V., the operator of a refining and smelting facility in Torréon (a 100% subsidiary of Peñoles)
Milling or milled ore A general term used to describe the process in which the ore is crushed and ground and subjected to physical or chemical treatment to extract the valuable metals to a concentrate or finished product
Minera Juanicipio, S.A. de C.V. A company jointly held by Fresnillo plc (56% interest) and MAG Silver Corporation (44% interest)
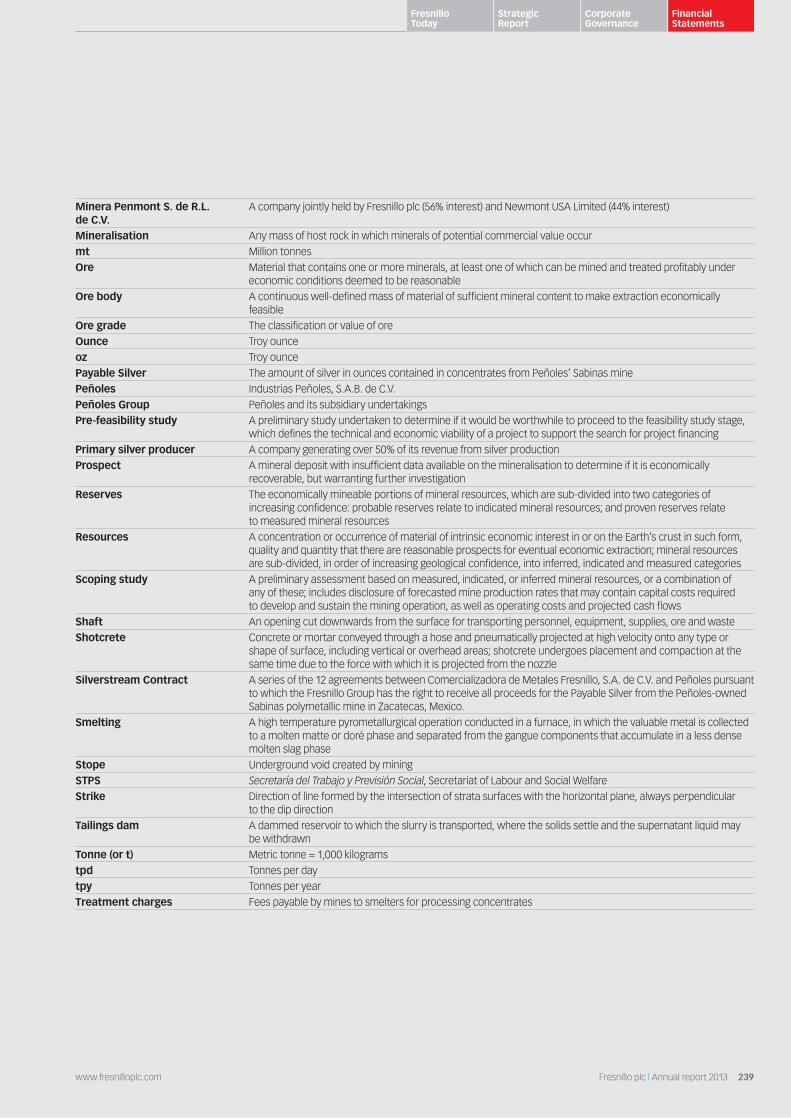
239www.fresnilloplc.com Fresnillo plc | Annual report 2013
Fresnillo Today
Strategic Report
Corporate Governance
Financial Statements
Minera Penmont S. de R.L. de C.V.
A company jointly held by Fresnillo plc (56% interest) and Newmont USA Limited (44% interest)
Mineralisation Any mass of host rock in which minerals of potential commercial value occur
mt Million tonnes
Ore Material that contains one or more minerals, at least one of which can be mined and treated profitably under economic conditions deemed to be reasonable
Ore body A continuous well-defined mass of material of sufficient mineral content to make extraction economically feasible
Ore grade The classification or value of ore
Ounce Troy ounce
oz Troy ounce
Payable Silver The amount of silver in ounces contained in concentrates from Peñoles’ Sabinas mine
Peñoles Industrias Peñoles, S.A.B. de C.V.
Peñoles Group Peñoles and its subsidiary undertakings
Pre-feasibility study A preliminary study undertaken to determine if it would be worthwhile to proceed to the feasibility study stage, which defines the technical and economic viability of a project to support the search for project financing
Primary silver producer A company generating over 50% of its revenue from silver production
Prospect A mineral deposit with insufficient data available on the mineralisation to determine if it is economically recoverable, but warranting further investigation
Reserves The economically mineable portions of mineral resources, which are sub-divided into two categories of increasing confidence: probable reserves relate to indicated mineral resources; and proven reserves relate to measured mineral resources
Resources A concentration or occurrence of material of intrinsic economic interest in or on the Earth’s crust in such form, quality and quantity that there are reasonable prospects for eventual economic extraction; mineral resources are sub-divided, in order of increasing geological confidence, into inferred, indicated and measured categories
Scoping study A preliminary assessment based on measured, indicated, or inferred mineral resources, or a combination of any of these; includes disclosure of forecasted mine production rates that may contain capital costs required to develop and sustain the mining operation, as well as operating costs and projected cash flows
Shaft An opening cut downwards from the surface for transporting personnel, equipment, supplies, ore and waste
Shotcrete Concrete or mortar conveyed through a hose and pneumatically projected at high velocity onto any type or shape of surface, including vertical or overhead areas; shotcrete undergoes placement and compaction at the same time due to the force with which it is projected from the nozzle
Silverstream Contract A series of the 12 agreements between Comercializadora de Metales Fresnillo, S.A. de C.V. and Peñoles pursuant to which the Fresnillo Group has the right to receive all proceeds for the Payable Silver from the Peñoles-owned Sabinas polymetallic mine in Zacatecas, Mexico.
Smelting A high temperature pyrometallurgical operation conducted in a furnace, in which the valuable metal is collected to a molten matte or doré phase and separated from the gangue components that accumulate in a less dense molten slag phase
Stope Underground void created by mining
STPS Secretaría del Trabajo y Previsión Social, Secretariat of Labour and Social Welfare
Strike Direction of line formed by the intersection of strata surfaces with the horizontal plane, always perpendicular to the dip direction
Tailings dam A dammed reservoir to which the slurry is transported, where the solids settle and the supernatant liquid may be withdrawn
Tonne (or t) Metric tonne = 1,000 kilograms
tpd Tonnes per day
tpy Tonnes per year
Treatment charges Fees payable by mines to smelters for processing concentrates

240 Fresnillo plc | Annual report 2013 www.fresnilloplc.com
Shareholder Information
Financial calendarPreliminary Statement 4 March 2014First Interim Management Statement 16 April 2014 Annual General Meeting 16 May 2014Interim Statement 5 August 2014Second Interim Management Statement 15 October 2014
Dividend payment schedule2013 Special Dividend Record Date 2 May 20142013 Special Dividend Payment Date 22 May 20142014 Interim Dividend Record Date 15 August 20142014 Interim Dividend Payment Date 11 September 2014
RegistrarEquiniti Ltd Aspect House, Spencer Road, Lancing West Sussex BN99 6DA United Kingdom
Registered office28 Grosvenor Street London W1K 4QR United Kingdom
Corporate headquartersMoliere No. 222 Col. Polanco 11540 Mexico, D.F. Mexico
Sponsor and Corporate BrokerJPMorgan Cazenove Limited 25 Bank Street London E14 5JP United Kingdom
Joint Corporate BrokerMerrill Lynch International 2 King Edward Street London EC1A 1HQ United Kingdom
AuditorErnst & Young LLP 1 More London Place London SE1 2AF United Kingdom
SolicitorLinklaters LLP One Silk Street London EC2Y 8HQ United Kingdom
Share fraud warningShare fraud includes scams where investors are called out of the blue and offered shares that turn out to be worthless or non-existent, or an inflated price for shares they own. These calls come from fraudsters operating in ‘boiler rooms’, mostly based abroad. While high profits are promised, those who buy or sell shares in this way usually lose their money. Most victims are experienced investors, losing on average £20,000.
Protect yourselfIf you are offered unsolicited investment advice, discounted shares, inflated prices for shares you own, or free company or research reports, take these steps before handing over any money:
1. Get the name of the person and organisation.
2. Check the Financial Services Register at www.fca.org.uk/register to ensure they are authorised.
3. Use the details on the Financial Services Register to contact the firm.
4. Call the FCA Consumer Helpline on 0800 111 6768 if there are no contact details on the Register or you are told they are out of date.
5. Search the list of unauthorised firms and individuals to avoid doing business with.
6. REMEMBER: if it sounds too good to be true, it probably is!
If you use an unauthorised firm to buy or sell shares, you will not have access to the Financial Ombudsman Service or Financial Services Compensation Scheme (FSCS) if things go wrong.
Report a scamIf you are approached about a share scam you should tell the FCA using the form at www.fca.org.uk/scams (where you can also review the latest scams) or call the Consumer Helpline on 0800 111 6768.
If you have already paid money to share fraudsters then contact Action Fraud on 0300 123 2040
For further information, please visit our website: www.fresnilloplc.com or contact:
Fresnillo plc Tel: +44(0)20 7399 2470 Gabriela Mayor, Head of Investor Relations
Forward looking statementsThis document includes statements that are, or may be deemed to be, ‘forward-looking statements’. These forward-looking statements can be identified by the use of forward-looking terminology, including the terms ‘believes’, ‘estimates’, ‘plans’, ‘projects’, ‘anticipates’, ‘expects’, ‘intends’, ‘may’, ‘will’, or ‘should’ or, in each case, their negative or other variations or comparable terminology, or by discussions of strategy, plans, objectives, goals, future events or intentions. These forward-looking statements include all matters that are not historical facts. They appear in a number of places throughout this document and include, but are not limited to, statements regarding the Group’s intentions, beliefs or current expectations concerning, among other things, the Group’s results of operations, financial position, liquidity, prospects, growth, strategies and the silver and gold industries. By their nature, forward-looking statements involve risk and uncertainty because they relate to future events and circumstances.
Forward-looking statements are not guarantees of future performance and the actual results of the Group’s operations, financial position and liquidity, and the development of the markets and the industry in which the Group operates, may differ materially from those described in, or suggested by, the forward-looking statements contained in this document. In addition, even if the results of operations, financial position and liquidity, and the development of the markets and the industry in which the Group operates are consistent with the forward-looking statements contained in this document, those results or developments may not be indicative of results or developments in subsequent periods. A number of factors could cause results and developments to differ materially from those expressed or implied by the forward-looking statements including, without limitation, general economic and business conditions, industry trends, competition, commodity prices, changes in regulation, currency fluctuations (including the US dollar and Mexican peso exchange rates), the Group’s ability to recover its reserves or develop new reserves, including its ability to convert its resources into reserves and its mineral potential into resources or reserves, changes in its business strategy, political and economic uncertainty.
Forward-looking statements may, and often do, differ materially from actual results. Any forward-looking statements in this document speak only as of the date of this document, reflect the Group’s current view with respect to future events and are subject to risks relating to future events and other risks, uncertainties and assumptions relating to the Group’s operations, results of operations, growth strategy and liquidity. Investors should specifically consider the factors identified in this document which could cause actual results to differ before making an investment decision. Subject to the requirements of the Prospectus Rules, the Disclosure and Transparency Rules and the Listing Rules or applicable law, the Group explicitly disclaims any obligation or undertaking publicly to release the result of any revisions to any forward-looking statements in this document that may occur due to any change in the Group’s expectations or to reflect events or circumstances after the date of this document.

Design and production Radley Yeldar | www.ry.com
This report has been printed on revive 100 white silk and revive 100 premium white uncoated, a paper which is certified by the Forest Stewardship Council®. The paper is made in a mill registered to EMAS, the Eco Management Audit Scheme, and with ISO14001 environmental management system accreditation.
Printed digitally by Pureprint Group without the use of film separations, plates and associated processing chemicals. 99% of all dry waste associated with this production has been recycled. Pureprint Group is certificated to ISO 14001 environmental management system, is registered to EMAS the Eco Management Audit Scheme, is a CarbonNeutral® Company and has been awarded The Queen’s Award for Enterprise: Sustainable Development.
Registered office 28 Grosvenor Street London W1K 4QR United Kingdom